Embed Size (px)
DESCRIPTION
Fracking
Citation preview
Introduction and Overview: the Role ofShale Gas in Securing Our Energy Future
PETER HARDY
ABSTRACT
The phenomenon of shale gas is both topical and controversial. Itsproponents claim that it is a clean, environmentally friendly andabundant source of cheap natural gas; its opponents believe the op-posite. In several countries it is a fast-growing industry and operationshave begun in the UK.
With conventional reserves of natural gas being quickly depleted, gasprospecting is turning to ‘‘unconventional resources’’, one examplebeing gas found in shale. Uncommon technologies, notably hydraulicfracturing and horizontal drilling, are necessary for shale extraction tobe economical.
Shale gas has faced some difficulties over concerns regarding en-vironmental pollution. In the US, Gasland, an influential film was re-leased alleging that waste fluid from hydraulic fracturing, ‘‘flowbackwater’’, was polluting groundwater. While it is possible for methane toenter groundwater through a faulty well completion, in the UK it is theresponsibility of the Environment Agency and HSE to ensure regulationis adequate to prevent risks to the environment or human health.
There have been two earthquakes in Lancashire thought to havebeen caused by shale gas operations. The results of an investigationinto these have been accepted as revealing that they were caused byhydraulic fracturing operations and new guidelines are being proposedto reduce the risk of this happening again.
1
Issues in Environmental Science and Technology, 39FrackingEdited by R.E. Hester and R.M. Harrisonr The Royal Society of Chemistry 2015Published by the Royal Society of Chemistry, www.rsc.org
Dow
nloa
ded
on 1
7/01
/201
5 22
:12:
21.
Publ
ishe
d on
19
Aug
ust 2
014
on h
ttp://
pubs
.rsc
.org
| do
i:10.
1039
/978
1782
6205
56-0
0001
With insufficient public information and sometimes animositytowards shale gas, drillers need to consider developing corporate socialresponsibility programs tailored to the needs of the communities local todrilling, with especial consideration towards environmental initiatives.
Worldwide, shale gas has had a significant and growing impact on gasproduction and looks likely to rapidly transform the energy situation.
In Europe, Poland and France have the largest reserves; Poland hasembarked on a program to exploit its shale gas reserves. France, on theother hand, has outlawed the hydraulic fracturing technology vital toshale gas on environmental grounds.
The UK’s shale gas reserves are unlikely to be large enough to be a‘‘game changer’’; however, they would contribute to gas security andthe UK’s energy mix, as well as being perceived as a lower-carbon al-ternative to coal-fired electricity generation.
There are already substantial reserves of gas available worldwide;however, the development of these unconventional gases, which areoften in more politically stable parts of the world, may provide a greatersecurity of supply to the Western World going forward.
1 Introduction
As the existing conventional gas supplies have started to decline in some partsof the western world, the search has been on for alternative secure sources ofsupply. One of the most exciting developments in the last 20 years in thenatural gas sector has been the development of unconventional gases and, inparticular, the exploration and production of shale gas. The existence of shalegas has been known for decades but technological difficulties and substantialfinancial costs associated with its extraction have up until recently made itsexploitation uneconomic. However, increased demand and lagging supplyhave resulted in the price of gas rising to the point where, along with thedevelopment of advances in drilling, shale gas has started to represent a viablealternative to conventional sources of supply. Shale gas is now being producedin large quantities in the USA as their industry has developed over the lastdecade. Exploitation of reserves is now progressing in other parts of the world,including Poland and Australia. In addition, exploration is starting in othercountries including the UK but the development of shale gas production,which often includes hydraulically fracturing of the rock (otherwise known asfracking), is not without its opponents. In America the film, Gasland, raisedissues relating to problems associated with fracking which has caused somepeople to have environmental concerns. In some countries, such as France, anembargo has been placed on fracking and even within the USA some states arenot as yet permitting it. There have been reports of ground-water contamin-ation which has resulted in illnesses, gas coming out of water taps, andearthquakes caused by fracking. However, in many parts of the world shalegas is seen as a secure source of hydrocarbon that cannot be ignored.
2 Peter Hardy
Dow
nloa
ded
on 1
7/01
/201
5 22
:12:
21.
Publ
ishe
d on
19
Aug
ust 2
014
on h
ttp://
pubs
.rsc
.org
| do
i:10.
1039
/978
1782
6205
56-0
0001
View Online
Development is seen in many countries as a way to secure energy supplies thatis independent of events in the more volatile parts of the world where most ofthe existing gas and oil reserves are located.
1.1 History
In 1821 shale gas was produced from a natural seepage in the AppalachianMountains at Fredonia, New York, USA. It was trapped and piped in hollowlogs where it was used to light homes and businesses. The profit marginswere small and small local operators exploited it as a ‘‘cottage industry’’.1
In the late 1960s and early 1970s it was clear that the political situation inthe Middle East was changing. There had been Arab–Israeli wars in 1967 and1973 and the situation led to dramatically increased prices for oil as well assupply shortages. The Organisation of the Petroleum Exporting Countries(OPEC)w also rose to international prominence during the 1970s, as itsMember Countries took control of their domestic petroleum industries andacquired a major say in the pricing of crude oil on world markets. On twooccasions, oil prices rose steeply in a volatile market, triggered by the Araboil embargo in 1973 and the outbreak of the Iranian Revolution in 1979.OPEC broadened its mandate with the first Summit of Heads of State andGovernment in Algiers in 1975, which addressed the plight of the poorernations and called for a new era of cooperation in international relations inthe interests of world economic development and stability. This led to theestablishment of the OPEC Fund for International Development in 1976.Member Countries embarked on ambitious socio-economic developmentschemes. It was against this background of volatile oil prices and trying toensure security of supply that, in 1976, the United States Department ofEnergy initiated the Eastern Shales Project at a cost of up to $200 million toevaluate the geology, geochemistry and petroleum production engineering ofnon-conventional petroleum, including shale gas. Important reports estab-lished findings from what was then the only shale gas production in theworld,2 based on the Devonian and Mississippian shales in the Appalachianbasin.3 These reports led to the establishment of the Gas Research Instituteand also stimulated research at Imperial College in the United Kingdomlooking at evaluating potential resources. The geology of the plate tectonicsof the Atlantic Ocean implied that the continuation of the Appalachian basinextended across into the UK and on into mainland Europe (see Figure 1).Imperial College focussed on the US paradigm of ‘‘cottage industry’’ andreviewed potential shale gas extraction from throughout the rock strata.4 Thestudy concluded that Pre-Cambrian and Lower Palaeozoic shales were gen-erally too metamorphosed to be potential reservoirs and most Mesozoic andyounger organic-rich shales and mudstones were deemed too immature to
wOPEC is a permanent intergovernmental organisation, created at the Baghdad Conference onSeptember 10–14, 1960, by Iran, Iraq, Kuwait, Saudi Arabia and Venezuela; membership grew to13 by 1975.
3Introduction and Overview: the Role of Shale Gas in Securing Our Energy Future
Dow
nloa
ded
on 1
7/01
/201
5 22
:12:
21.
Publ
ishe
d on
19
Aug
ust 2
014
on h
ttp://
pubs
.rsc
.org
| do
i:10.
1039
/978
1782
6205
56-0
0001
View Online
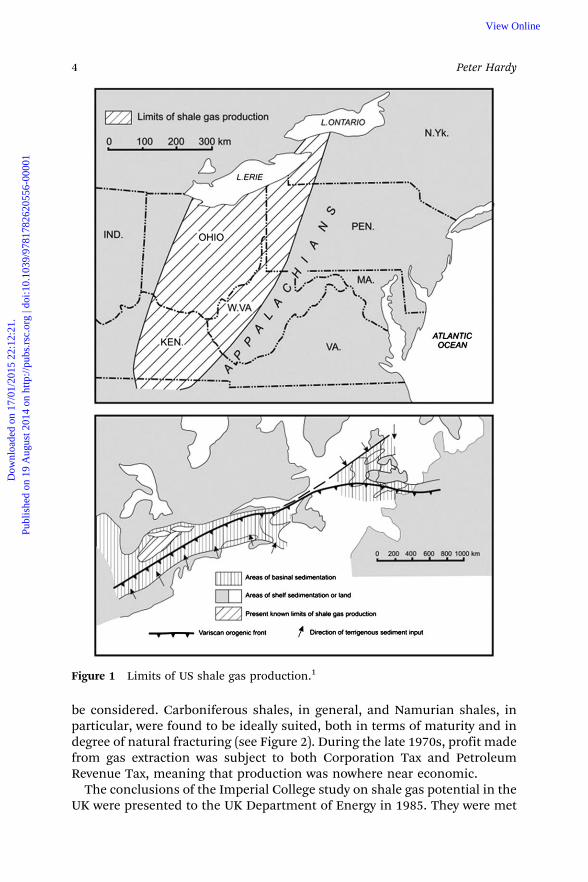
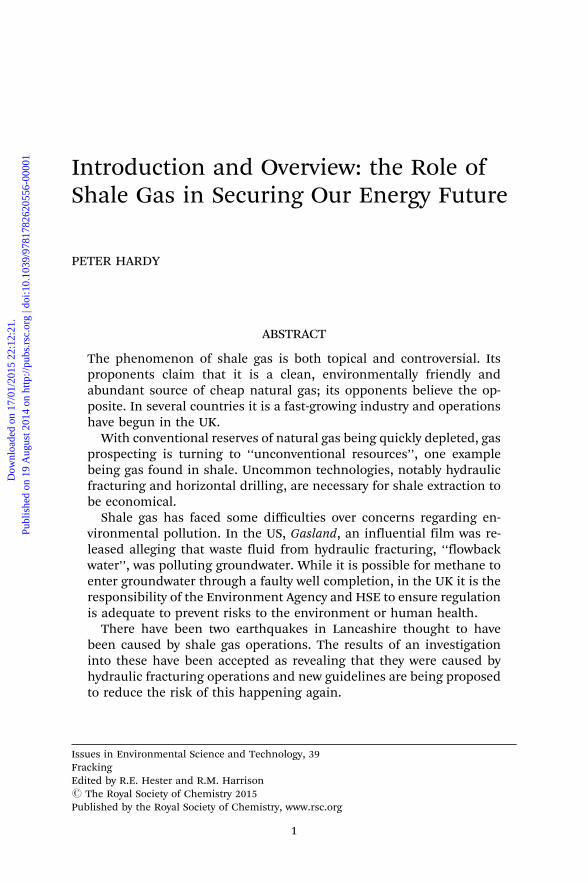
be considered. Carboniferous shales, in general, and Namurian shales, inparticular, were found to be ideally suited, both in terms of maturity and indegree of natural fracturing (see Figure 2). During the late 1970s, profit madefrom gas extraction was subject to both Corporation Tax and PetroleumRevenue Tax, meaning that production was nowhere near economic.
The conclusions of the Imperial College study on shale gas potential in theUK were presented to the UK Department of Energy in 1985. They were met
Figure 1 Limits of US shale gas production.1
4 Peter Hardy
Dow
nloa
ded
on 1
7/01
/201
5 22
:12:
21.
Publ
ishe
d on
19
Aug
ust 2
014
on h
ttp://
pubs
.rsc
.org
| do
i:10.
1039
/978
1782
6205
56-0
0001
View Online
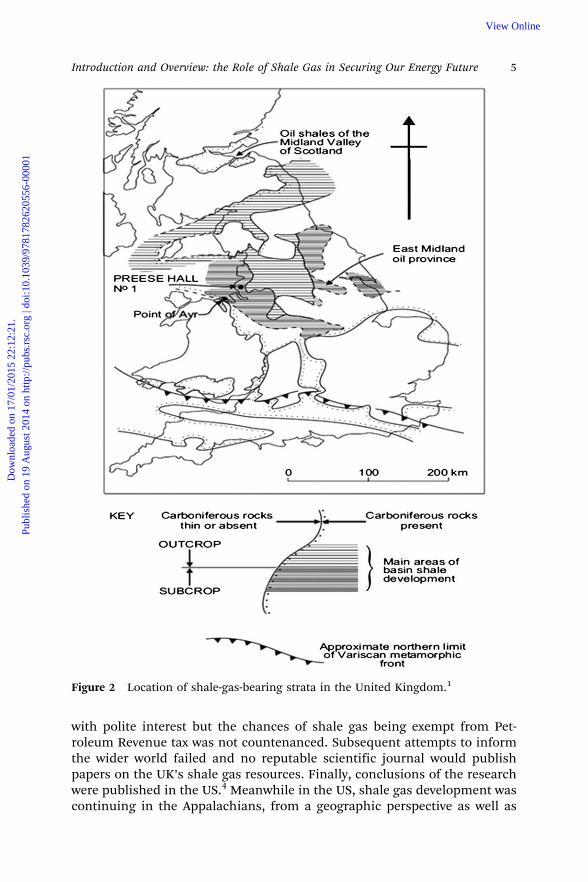
with polite interest but the chances of shale gas being exempt from Pet-roleum Revenue tax was not countenanced. Subsequent attempts to informthe wider world failed and no reputable scientific journal would publishpapers on the UK’s shale gas resources. Finally, conclusions of the researchwere published in the US.4 Meanwhile in the US, shale gas development wascontinuing in the Appalachians, from a geographic perspective as well as
Figure 2 Location of shale-gas-bearing strata in the United Kingdom.1
5Introduction and Overview: the Role of Shale Gas in Securing Our Energy Future
Dow
nloa
ded
on 1
7/01
/201
5 22
:12:
21.
Publ
ishe
d on
19
Aug
ust 2
014
on h
ttp://
pubs
.rsc
.org
| do
i:10.
1039
/978
1782
6205
56-0
0001
View Online
from the study of rock strata, especially the distribution, deposition and age ofsedimentary rocks, and various technological advances were also being lookedat. The Appalachian basin, from New York State through Ohio to Kentuckyand Illinois, was the main historic area for shale gas production, but there hadbeen other basins where the gas was produced, such as the Williston Basin.This is a large intracratonic sedimentary basin in eastern Montana, westernNorth Dakota, South Dakota and southern Saskatchewan where the BakkenShale had produced gas since 1953. Stimulated by the Department of Energyand the Gas Research Institute, shale gas areas were found in the CretaceousLewis Shale of the San Juan Basin, the Mississippian Barnett Shale of the FortWorth Basin and the Devonian Antrim Shale of the Michigan Basin.5 Geo-chemical studies revealed that the gas was not produced by microorganismsthat generate heat within organic waste (thermogenic) but was produced bybacterial anaerobic respiration (methanogenesis). The bacteria had enteredthe fractured shale from ground water percolating down from the glacial driftcover.6 This second process for gas generation opened up new areas for ex-ploration: areas where the source rock was previously deemed immature orover-mature for thermogenic gas generation.
The shale gas renaissance was also brought about by improved methods ofwell drilling and advances in completion technologies. The ability to drillmultiple wells off a single pad was both financially and environmentallyrewarding.7 The ability to drill wells horizontally as well as vertically, toge-ther with the ability to steer the drill along ‘‘sweet spots’’, enabled permeablegas-changed zones to be tapped into. This was coupled with more dramatichydraulic fracturing techniques. Seismic techniques, which could use thefracturing process as an energy source, enabled gas-charged ‘‘sweet spots’’ tobe mapped in three dimensions.1
In the US the development of shale gas expanded dramatically from the mid1990s, with the number of gas rigs in operation increasing from around 250 in1993 to over 1500 by 2007.8 This has seen production of shale gas in the USincrease from 1293 billion cubic feet in 2007 to 7994 billion cubic feet in2011.9 This has resulted in the US natural gas wellhead price falling from$8.01 per thousand cubic feet in January 2006 to $2.89 per thousand cubic feetin January 2012.9 These are similar prices to those seen in the US in the early1980s. However, the reduction in the price of natural gas seen in the US isunlikely to be repeated to the same extent in Europe. This is due to the limitedexport market that the US has for gas at the present time as it has no exportterminals for shipping the gas globally as liquefied natural gas (LNG). Thelargest exporter of LNG worldwide, Qatar, has six operational export terminals,whilst Australia, which is rapidly increasing its export of LNG, has three op-erational export terminals with another seventeen projects either under con-struction or being planned. Worldwide there are thirty-two operational exportterminals with another sixty-nine under construction or in planning.10
In the UK, shale gas as a potential industry did not develop at all until theBritish Geological Survey (BGS) noted the potential for its production in1995.11 Shale gas was not mentioned in reviews of future UK petroleum
6 Peter Hardy
Dow
nloa
ded
on 1
7/01
/201
5 22
:12:
21.
Publ
ishe
d on
19
Aug
ust 2
014
on h
ttp://
pubs
.rsc
.org
| do
i:10.
1039
/978
1782
6205
56-0
0001
View Online
resources published in 2003 by the Oil and Gas Directorate of the Depart-ment of Trade & Industry.12 The 6th Petroleum Geology Conference on theGlobal Perspectives of North West Europe was held later in the same year. Thethree-day programme concluded with a session on non-conventional pet-roleum. This included a presentation on the UK’s shale gas resources andprovided a platform to disseminate updated conclusions of the ImperialCollege research of some 15 years previously. The advances in US shale gasexploration and production technology could now be applied to the UK.13 In2008 the British Geological Survey began to review UK shale gas resourcesand delivered a presentation on their results at the 7th Petroleum Conferencein March 2009. Subsequently, the Department of Energy & Climate Changecommissioned the BGS to prepare a report on The Unconventional Hydro-carbon Resources of Britain’s Onshore Basins – Shale Gas.14
The result of this was that several companies started to look at shale gassites within the UK at the time of the announcement of the 13th onshoreround of UK licences in 2006. In 2008 Wealden Petroleum Developments Ltdwas awarded a license that covered large parts of the Weald, an area in SouthEast England situated between the parallel chalk escarpments of the Northand the South Downs, for exploration. Additionally, Cuadrilla ResourcesCorporation was awarded a licence that includes areas of the North West ofEngland.
2 Shale Gas Production and Reserves in the UK
2.1 Overview
2.1.1 Shale Gas Production Process. As noted, horizontal drilling andhydraulic fracturing are the two technologies that together have the potentialto unlock the tighter shale gas formations.
Hydraulic fracturing (also known as ‘‘fracking’’) is a well-stimulation tech-nique which consists of pumping a fluid and a propping agent (‘‘proppant’’),such as sand, down the wellbore under pressure to create fissures in thehydrocarbon-bearing rock. Propping agents are required to ‘‘prop open’’ thefracture once the pumps are shut down and the fracture begins to close. Theideal propping agent is strong, resistant to crushing, resistant to corrosion,has a low density and is readily available at low cost. The products that bestmeet these desired traits are silica sand, resin-coated sand (RCS) and ceramicproppants. The fractures start in the horizontal wellbore and can extend forseveral hundred metres while the sand holds the fissures apart, allowing thegas to flow into the wellbore. Recovery of the injected fluids is highly variable,depending on the geology, and ranges from 15 to 80%.15
Horizontal drilling allows the well to penetrate into the hydrocarbon rockseam which can be typically 90 m thick in the US, but can be up to 1000 mthick in some of the UK shale gas seams. Horizontal drilling maximises therock area that, once fractured, is in contact with the wellbore and thereforemaximises the volume of shale gas that is released.
7Introduction and Overview: the Role of Shale Gas in Securing Our Energy Future
Dow
nloa
ded
on 1
7/01
/201
5 22
:12:
21.
Publ
ishe
d on
19
Aug
ust 2
014
on h
ttp://
pubs
.rsc
.org
| do
i:10.
1039
/978
1782
6205
56-0
0001
View Online
Horizontal drilling is performed with similar equipment and technologiesto that which has been established over decades for vertical drilling and, infact, the initial drilling of the vertical bore is almost identical to a con-ventional well. However, the well development and gas extraction processesdiffer widely between conventional and unconventional gas production.Whilst some conventional wells have been stimulated by hydraulic fractur-ing in the past, horizontal drilling and hydraulic fracturing are key re-quirements to make the exploitation of shale gas deposits economicallyviable.
The requirement for horizontal drilling and hydraulic fracturing also re-sults in differences in the distribution of wells above the shale gas for-mations. The process involves locating several individual wells on a single‘‘multi-well’’ pad. Normally 6–10 horizontal wells radiate out from the centrewell pad; these then are drilled in parallel rows, typically 5–8 m apart. Eachhorizontal wellbore is typically 1–1.5 km in lateral length, although they canbe considerably longer.
As the array of wells drilled from each pad only enables access to a discretearea of the shale formation, several multi-well pads in a geographic area arerequired in order to maximise shale gas extraction. In the US they typicallylocate a maximum of nine pads per square mile. In the UK, CompositeEnergy has estimated that about three pads per square mile should be suf-ficient for the UK setting.16 However, the geological and above-groundconstraints will also impact on the location of well pads.
The differences in the production process between conventional and un-conventional gas production also results in differences in the level of effortrequired to extract shale gas. It also affects the amount of resources used andthe corresponding volume of waste products generated.
2.1.2 Well Pad Construction. As already stated previously, the pads usedfor multi-well drilling require an area of land sufficient to accommodatefluid storage and equipment associated with the hydraulic fracturingoperation. This utilises larger equipment for horizontal drilling than thatrequired for vertical drilling only. This results in between 0.4 and 1.2 ha(1–3 acres) of land being required for a multi-well pad.
2.1.3 Drilling. Vertical drilling depth will vary dramatically, dependingon the depth of the shale gas strata and their location. However, it is ex-pected that wells will be drilled through rock layers and aquifers for a dis-tance of up to 2 km, to within 150 m of the top of the shale gas rock to behydraulically fractured. A more powerful horizontal drill may then be usedfor the horizontal portion of the wellbore. This transition is known as‘‘kicking off’’ and the horizontal well is then continued for an additional1–1.5 km.
The vertical portion of the well is typically drilled using either compressedair or freshwater mud as a drilling fluid. Once the horizontal section is ready
8 Peter Hardy
Dow
nloa
ded
on 1
7/01
/201
5 22
:12:
21.
Publ
ishe
d on
19
Aug
ust 2
014
on h
ttp://
pubs
.rsc
.org
| do
i:10.
1039
/978
1782
6205
56-0
0001
View Online
to be drilled, then this normally requires drilling mud for powering andcooling the down-hole motor that is used for the directional drilling. Thedrilling mud also provides stability for the horizontal drilling and for usingthe navigational tools, which require mud to transmit the sensor readingsthat enable the bore to be accurately traced. The mud also enables the re-moval of the cut material from the drilling operation. The drilling mud is aheavier mud than the freshwater mud used in the vertical drilling due to theneed to prevent hole collapse of the horizontal wellbore where the earth’svertical stress is much greater than in the vertical bore.
Developments are being undertaken to drill the horizontal bore pneu-matically, using specialist equipment to control fluids and gases enteringthe wellbore. It will be interesting to see which method will come to dom-inate the horizontal drilling operation, although it could be the geology orwater availability that determines the approach adopted.
In terms of waste material generated from the process, if the vertical wellwas 2 km deep with a 1.2 km lateral well the volume of waste would be in theregion of 140 cubic metres, whereas a conventional well drilled to the samedepth of 2 km would generate about 85 m3 of waste material. Therefore a10-well pad would generate 1400 m3 of waste.
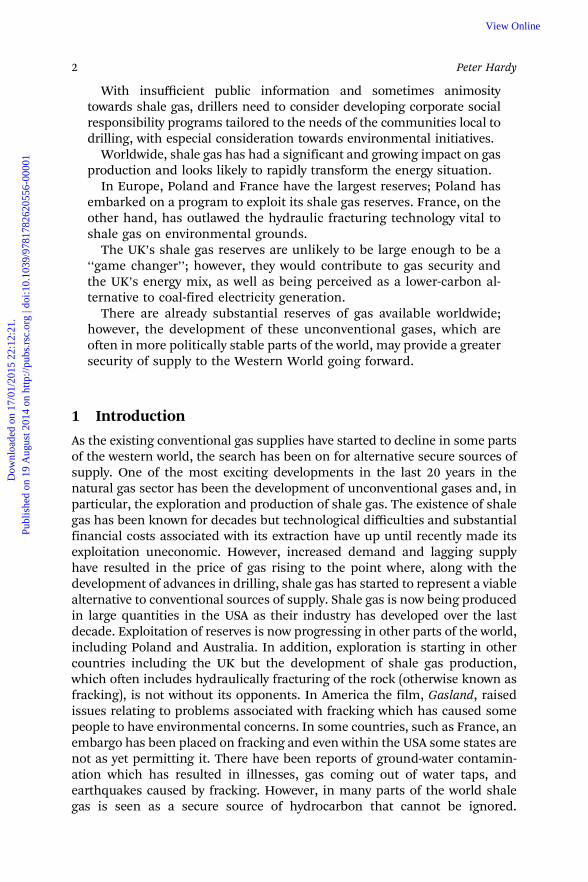
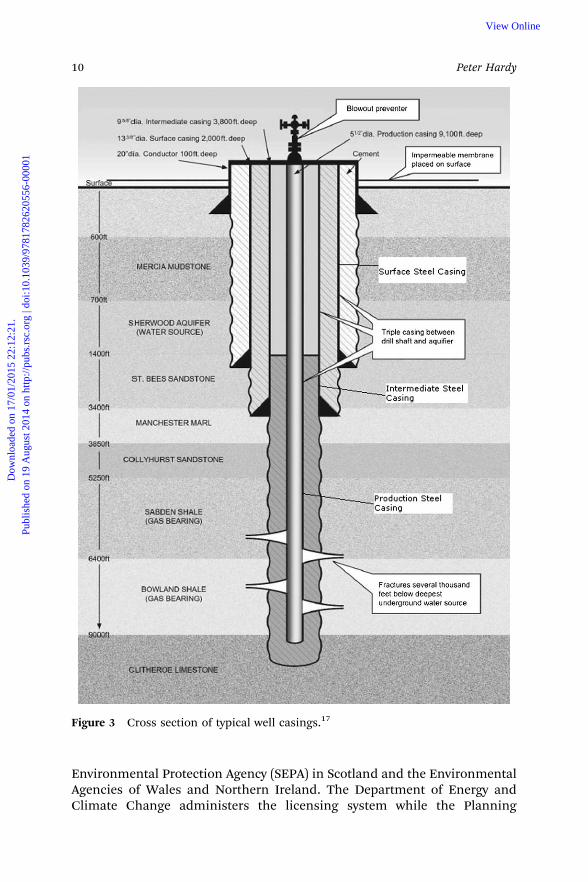
2.1.4 Well Casings. Well casings17 are installed to seal the well from thesurrounding formation and to stabilise the completed well. A number ofthese may be installed to meet a variety of circumstances and are typicallyconcentric steel pipes lining the inside of the drilled hole, with the annu-lar spaces filled with cement. There are four casing ‘‘strings’’, each in-stalled at different stages in drilling. The first is the ‘‘conductor casing’’this is installed during the first phase of drilling; it is a shallow steel con-ductor casing installed vertically to reinforce and stabilise the ground sur-face, the depth of the conductor casing is typically 40–300 ft. This isfollowed by the ‘‘surface casing’’. After the installation of the conductorcasing, drilling continues to below the bottom of the freshwater aquifers(depth requirements for groundwater protection are likely to be the sub-ject of approval from the Environment Agency in the UK), at which pointa second casing of smaller diameter (the surface casing) is installed andcemented in (see Figure 3).
Intermediate casings of still smaller diameter are sometimes installedfrom the bottom of the surface casing to a deeper depth. This is usually onlyrequired for specific reasons such as additional control of fluid flow andpressure effects or for protection of other resources such as minable coals orgas storage zones. It could, of course, form part of the requirements from theregulatory authorities in the UK.
Regulation in the UK is controlled by a variety of national and local gov-ernment departments with a variety of different responsibilities. In the UKthe environmental considerations are controlled by the following orga-nisations: The Environmental Agency (EA) in England, the Scottish
9Introduction and Overview: the Role of Shale Gas in Securing Our Energy Future
Dow
nloa
ded
on 1
7/01
/201
5 22
:12:
21.
Publ
ishe
d on
19
Aug
ust 2
014
on h
ttp://
pubs
.rsc
.org
| do
i:10.
1039
/978
1782
6205
56-0
0001
View Online
Environmental Protection Agency (SEPA) in Scotland and the EnvironmentalAgencies of Wales and Northern Ireland. The Department of Energy andClimate Change administers the licensing system while the Planning
Figure 3 Cross section of typical well casings.17
10 Peter Hardy
Dow
nloa
ded
on 1
7/01
/201
5 22
:12:
21.
Publ
ishe
d on
19
Aug
ust 2
014
on h
ttp://
pubs
.rsc
.org
| do
i:10.
1039
/978
1782
6205
56-0
0001
View Online
Authorities (generally the local authority) deal with the planning appli-cations required for each site.
After the surface casing cement is set (and intermediate casings, if re-quired) the well is drilled to the target shale gas formation and a ‘‘pro-duction casing’’ is installed, either at the top of the target formation or intoit, depending on the type of well being installed (either ‘‘open hole’’ or‘‘through-perforated casing’’, respectively). Well completions incorporatethe steps taken to transform a drilled well into a producing one. These stepsinclude casing, cementing, perforating and installing a production tree.
Open hole completions are the most basic type and are used in formationsthat are unlikely to cave in. An open hole completion consists of simplyrunning the casing directly down into the formation, leaving the end of thepiping open without any other protective filters. Very often, this type ofcompletion is used on formations that have been fractured.
Conventional through-perforated completions consist of production cas-ing being run through the formation. The sides of this casing are perforated,with small holes along the sides facing the formation, which allows for theflow of hydrocarbons into the well hole but still provides a suitable amountof support and protection for the well hole. The process of perforating thecasing involves the use of specialised equipment designed to make smallholes through the casing, cementing, and any other barrier between theformation and the open well. In the past, ‘‘bullet perforators’’ were used,which were essentially small guns lowered into the well. The guns, whenfired from the surface, sent off small bullets that penetrated the casing andcement. Today, ‘‘jet perforating’’ is preferred. This consists of small, elec-trically ignited charges that are lowered into the well. When ignited, thesecharges blast small holes through to the formation, in the same manner asbullet perforating.
In addition to the depth of the surface casing, the regulatory authorities inthe UK are likely to put requirements on the cementing-in of the surfacecasing. A method known as ‘‘circulation’’ may be used to fill the entire spacebetween the casing and the wellbore (the annulus or outer space between thewell casing and the rock through which it has been drilled) from the bottomof the surface casing to the ground surface. Here cement is pumped downthe inside of the casing forcing it up from the bottom of the casing into thespace between the outside of the casing and the wellbore. Once a sufficientvolume of cement to fill the annulus has been pumped into the casing, it isusually followed by pumping a volume of water into the casing to push thecement back up the annular space until the cement begins to appear at thesurface. Once the cement appears at the surface the pumping of water isstopped, this ensures that the top section of the annular space is fully filledwith cement and therefore there is no leakage path between the outside ofthe well casing and the rock through which it has been drilled. This methodis regarded as the highest standard of cementation compared to othermethods such as cementing of the annular space across only the deepestgroundwater zone but not all groundwater zones.
11Introduction and Overview: the Role of Shale Gas in Securing Our Energy Future
Dow
nloa
ded
on 1
7/01
/201
5 22
:12:
21.
Publ
ishe
d on
19
Aug
ust 2
014
on h
ttp://
pubs
.rsc
.org
| do
i:10.
1039
/978
1782
6205
56-0
0001
View Online
Once the surface casing is in place, the regulatory authorities may requireoperators to install blowout-prevention equipment at the surface, to preventany pressurised fluids encountered during drilling from moving through thespace between the drill pipe and the surface casing.
The operators could also be required to completely fill the annulus withcement from the bottom to the top of the production casing. However, therecould be reasons why full cementation is not always required, including thefact that in very deep wells the ‘‘circulation’’ technique of filling the annularspace with cement (see previously) is more difficult to accomplish as ce-menting must be handled in multiple stages, which can result in a poorcement job or damage to the casing.
In some instances, well tubings are inserted inside the above casings. Theyare typically of steel pipe, but they are not usually cemented into the well.
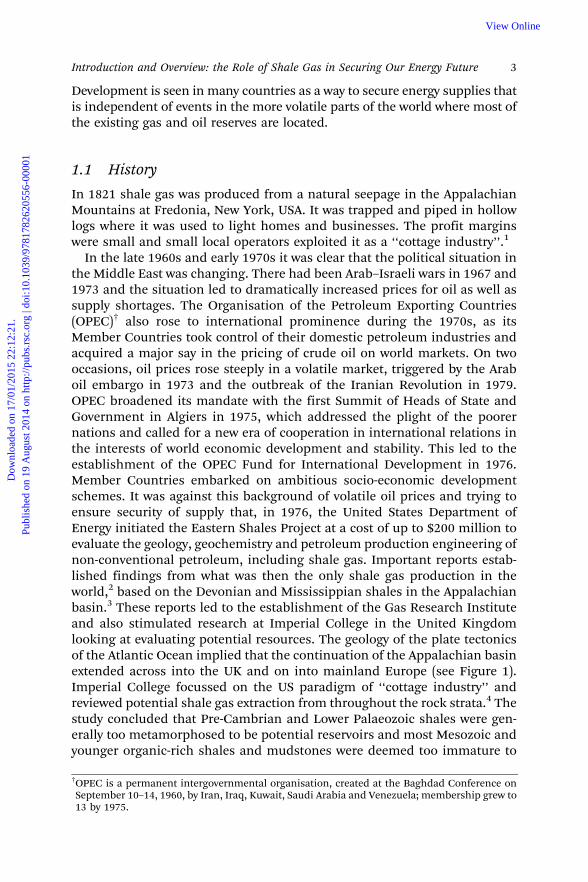
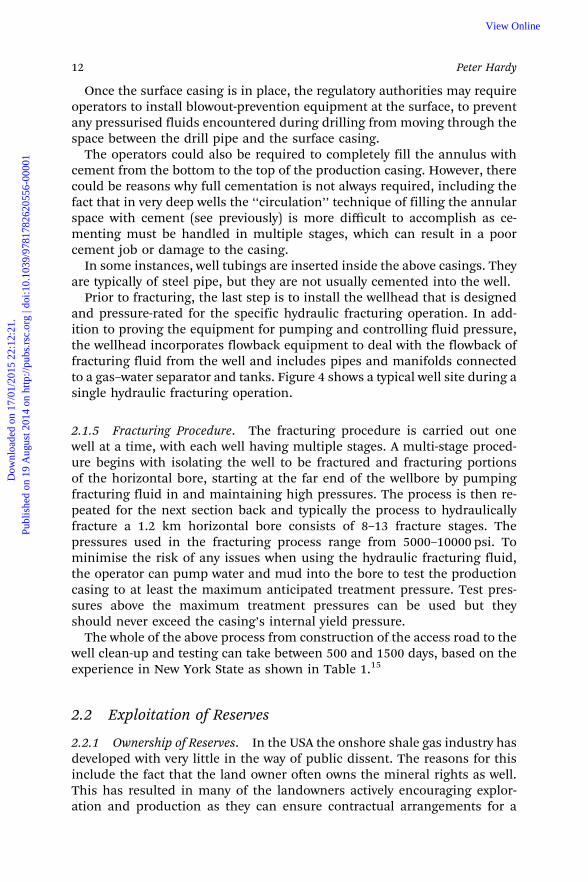
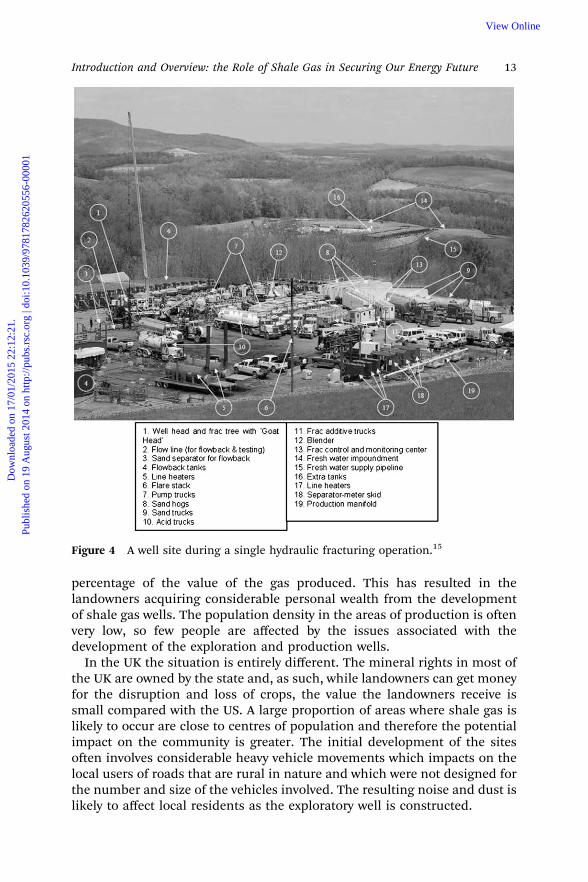
Prior to fracturing, the last step is to install the wellhead that is designedand pressure-rated for the specific hydraulic fracturing operation. In add-ition to proving the equipment for pumping and controlling fluid pressure,the wellhead incorporates flowback equipment to deal with the flowback offracturing fluid from the well and includes pipes and manifolds connectedto a gas–water separator and tanks. Figure 4 shows a typical well site during asingle hydraulic fracturing operation.
2.1.5 Fracturing Procedure. The fracturing procedure is carried out onewell at a time, with each well having multiple stages. A multi-stage proced-ure begins with isolating the well to be fractured and fracturing portionsof the horizontal bore, starting at the far end of the wellbore by pumpingfracturing fluid in and maintaining high pressures. The process is then re-peated for the next section back and typically the process to hydraulicallyfracture a 1.2 km horizontal bore consists of 8–13 fracture stages. Thepressures used in the fracturing process range from 5000–10000 psi. Tominimise the risk of any issues when using the hydraulic fracturing fluid,the operator can pump water and mud into the bore to test the productioncasing to at least the maximum anticipated treatment pressure. Test pres-sures above the maximum treatment pressures can be used but theyshould never exceed the casing’s internal yield pressure.
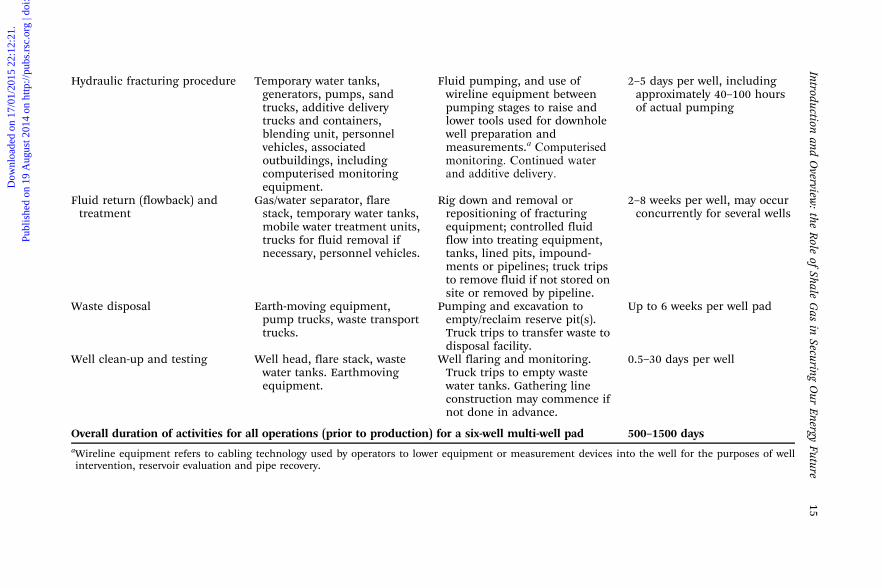
The whole of the above process from construction of the access road to thewell clean-up and testing can take between 500 and 1500 days, based on theexperience in New York State as shown in Table 1.15
2.2 Exploitation of Reserves
2.2.1 Ownership of Reserves. In the USA the onshore shale gas industry hasdeveloped with very little in the way of public dissent. The reasons for thisinclude the fact that the land owner often owns the mineral rights as well.This has resulted in many of the landowners actively encouraging explor-ation and production as they can ensure contractual arrangements for a
12 Peter Hardy
Dow
nloa
ded
on 1
7/01
/201
5 22
:12:
21.
Publ
ishe
d on
19
Aug
ust 2
014
on h
ttp://
pubs
.rsc
.org
| do
i:10.
1039
/978
1782
6205
56-0
0001
View Online
percentage of the value of the gas produced. This has resulted in thelandowners acquiring considerable personal wealth from the developmentof shale gas wells. The population density in the areas of production is oftenvery low, so few people are affected by the issues associated with thedevelopment of the exploration and production wells.
In the UK the situation is entirely different. The mineral rights in most ofthe UK are owned by the state and, as such, while landowners can get moneyfor the disruption and loss of crops, the value the landowners receive issmall compared with the US. A large proportion of areas where shale gas islikely to occur are close to centres of population and therefore the potentialimpact on the community is greater. The initial development of the sitesoften involves considerable heavy vehicle movements which impacts on thelocal users of roads that are rural in nature and which were not designed forthe number and size of the vehicles involved. The resulting noise and dust islikely to affect local residents as the exploratory well is constructed.
Figure 4 A well site during a single hydraulic fracturing operation.15
13Introduction and Overview: the Role of Shale Gas in Securing Our Energy Future
Dow
nloa
ded
on 1
7/01
/201
5 22
:12:
21.
Publ
ishe
d on
19
Aug
ust 2
014
on h
ttp://
pubs
.rsc
.org
| do
i:10.
1039
/978
1782
6205
56-0
0001
View Online
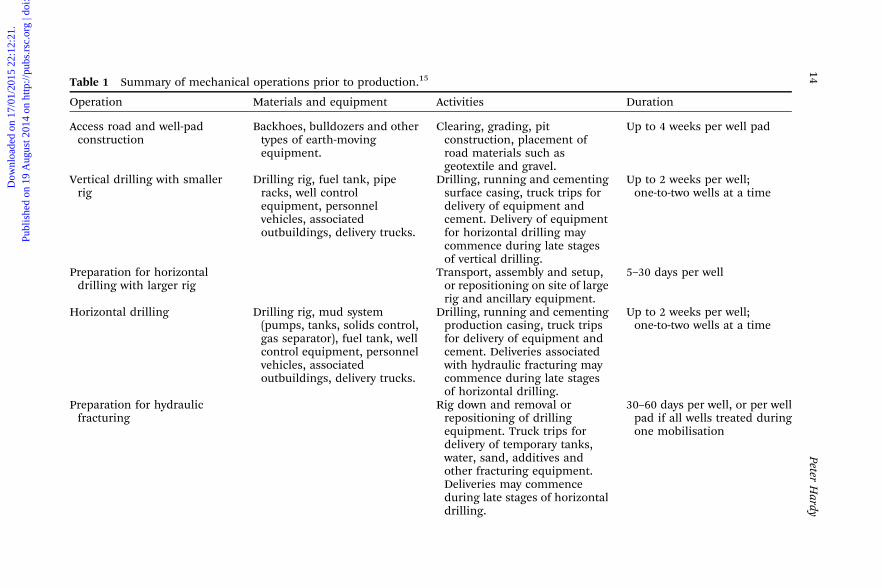
Table 1 Summary of mechanical operations prior to production.15
Operation Materials and equipment Activities Duration
Access road and well-padconstruction
Backhoes, bulldozers and othertypes of earth-movingequipment.
Clearing, grading, pitconstruction, placement ofroad materials such asgeotextile and gravel.
Up to 4 weeks per well pad
Vertical drilling with smallerrig
Drilling rig, fuel tank, piperacks, well controlequipment, personnelvehicles, associatedoutbuildings, delivery trucks.
Drilling, running and cementingsurface casing, truck trips fordelivery of equipment andcement. Delivery of equipmentfor horizontal drilling maycommence during late stagesof vertical drilling.
Up to 2 weeks per well;one-to-two wells at a time
Preparation for horizontaldrilling with larger rig
Transport, assembly and setup,or repositioning on site of largerig and ancillary equipment.
5–30 days per well
Horizontal drilling Drilling rig, mud system(pumps, tanks, solids control,gas separator), fuel tank, wellcontrol equipment, personnelvehicles, associatedoutbuildings, delivery trucks.
Drilling, running and cementingproduction casing, truck tripsfor delivery of equipment andcement. Deliveries associatedwith hydraulic fracturing maycommence during late stagesof horizontal drilling.
Up to 2 weeks per well;one-to-two wells at a time
Preparation for hydraulicfracturing
Rig down and removal orrepositioning of drillingequipment. Truck trips fordelivery of temporary tanks,water, sand, additives andother fracturing equipment.Deliveries may commenceduring late stages of horizontaldrilling.
30–60 days per well, or per wellpad if all wells treated duringone mobilisation
14Peter
Hardy
Dow
nloa
ded
on 1
7/01
/201
5 22
:12:
21.
Publ
ishe
d on
19
Aug
ust 2
014
on h
ttp://
pubs
.rsc
.org
| do
i:10.
1039
/978
1782
6205
56-0
0001
View Online
Hydraulic fracturing procedure Temporary water tanks,generators, pumps, sandtrucks, additive deliverytrucks and containers,blending unit, personnelvehicles, associatedoutbuildings, includingcomputerised monitoringequipment.
Fluid pumping, and use ofwireline equipment betweenpumping stages to raise andlower tools used for downholewell preparation andmeasurements.a Computerisedmonitoring. Continued waterand additive delivery.
2–5 days per well, includingapproximately 40–100 hoursof actual pumping
Fluid return (flowback) andtreatment
Gas/water separator, flarestack, temporary water tanks,mobile water treatment units,trucks for fluid removal ifnecessary, personnel vehicles.
Rig down and removal orrepositioning of fracturingequipment; controlled fluidflow into treating equipment,tanks, lined pits, impound-ments or pipelines; truck tripsto remove fluid if not stored onsite or removed by pipeline.
2–8 weeks per well, may occurconcurrently for several wells
Waste disposal Earth-moving equipment,pump trucks, waste transporttrucks.
Pumping and excavation toempty/reclaim reserve pit(s).Truck trips to transfer waste todisposal facility.
Up to 6 weeks per well pad
Well clean-up and testing Well head, flare stack, wastewater tanks. Earthmovingequipment.
Well flaring and monitoring.Truck trips to empty wastewater tanks. Gathering lineconstruction may commence ifnot done in advance.
0.5–30 days per well
Overall duration of activities for all operations (prior to production) for a six-well multi-well pad 500–1500 daysaWireline equipment refers to cabling technology used by operators to lower equipment or measurement devices into the well for the purposes of wellintervention, reservoir evaluation and pipe recovery.
15Introduction
andO
verview:
theR
oleof
ShaleG
asin
SecuringO
urEnergy
Future
Dow
nloa
ded
on 1
7/01
/201
5 22
:12:
21.
Publ
ishe
d on
19
Aug
ust 2
014
on h
ttp://
pubs
.rsc
.org
| do
i:10.
1039
/978
1782
6205
56-0
0001
View Online
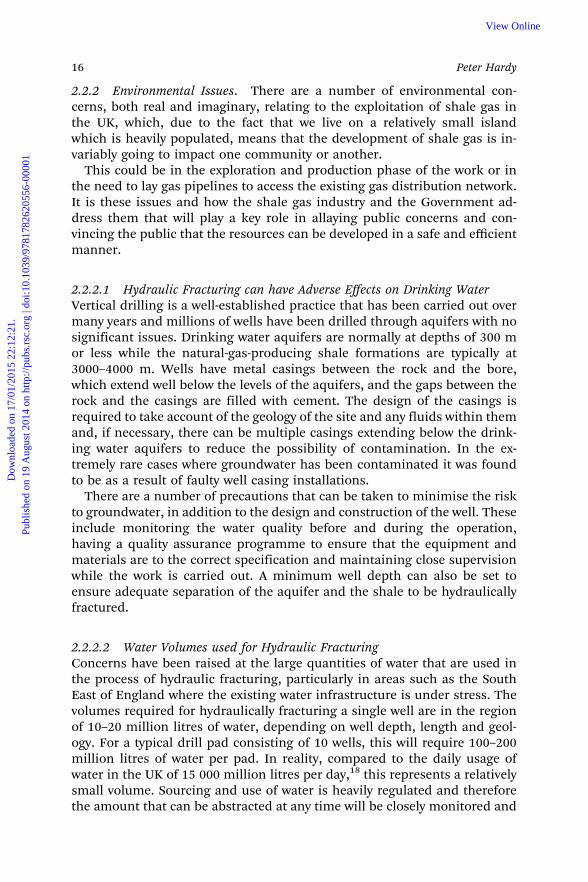
2.2.2 Environmental Issues. There are a number of environmental con-cerns, both real and imaginary, relating to the exploitation of shale gas inthe UK, which, due to the fact that we live on a relatively small islandwhich is heavily populated, means that the development of shale gas is in-variably going to impact one community or another.
This could be in the exploration and production phase of the work or inthe need to lay gas pipelines to access the existing gas distribution network.It is these issues and how the shale gas industry and the Government ad-dress them that will play a key role in allaying public concerns and con-vincing the public that the resources can be developed in a safe and efficientmanner.
2.2.2.1 Hydraulic Fracturing can have Adverse Effects on Drinking WaterVertical drilling is a well-established practice that has been carried out overmany years and millions of wells have been drilled through aquifers with nosignificant issues. Drinking water aquifers are normally at depths of 300 mor less while the natural-gas-producing shale formations are typically at3000–4000 m. Wells have metal casings between the rock and the bore,which extend well below the levels of the aquifers, and the gaps between therock and the casings are filled with cement. The design of the casings isrequired to take account of the geology of the site and any fluids within themand, if necessary, there can be multiple casings extending below the drink-ing water aquifers to reduce the possibility of contamination. In the ex-tremely rare cases where groundwater has been contaminated it was foundto be as a result of faulty well casing installations.
There are a number of precautions that can be taken to minimise the riskto groundwater, in addition to the design and construction of the well. Theseinclude monitoring the water quality before and during the operation,having a quality assurance programme to ensure that the equipment andmaterials are to the correct specification and maintaining close supervisionwhile the work is carried out. A minimum well depth can also be set toensure adequate separation of the aquifer and the shale to be hydraulicallyfractured.
2.2.2.2 Water Volumes used for Hydraulic FracturingConcerns have been raised at the large quantities of water that are used inthe process of hydraulic fracturing, particularly in areas such as the SouthEast of England where the existing water infrastructure is under stress. Thevolumes required for hydraulically fracturing a single well are in the regionof 10–20 million litres of water, depending on well depth, length and geol-ogy. For a typical drill pad consisting of 10 wells, this will require 100–200million litres of water per pad. In reality, compared to the daily usage ofwater in the UK of 15 000 million litres per day,18 this represents a relativelysmall volume. Sourcing and use of water is heavily regulated and thereforethe amount that can be abstracted at any time will be closely monitored and
16 Peter Hardy
Dow
nloa
ded
on 1
7/01
/201
5 22
:12:
21.
Publ
ishe
d on
19
Aug
ust 2
014
on h
ttp://
pubs
.rsc
.org
| do
i:10.
1039
/978
1782
6205
56-0
0001
View Online
controlled to ensure that it does not have an adverse effect on other users.It should be noted that in some of the areas where shale gas deposits arelocated, such as the North West of England, there is abundant water andtherefore the quantities of water used will have little impact on the overallwater supply situation.
The cost of water, as well as its availability, will ensure that the shale gasindustry is constantly attempting to reduce the volumes used by improvingthe hydraulic fracturing process, as well as re-using the water whereverpossible to mitigate overall water requirements.
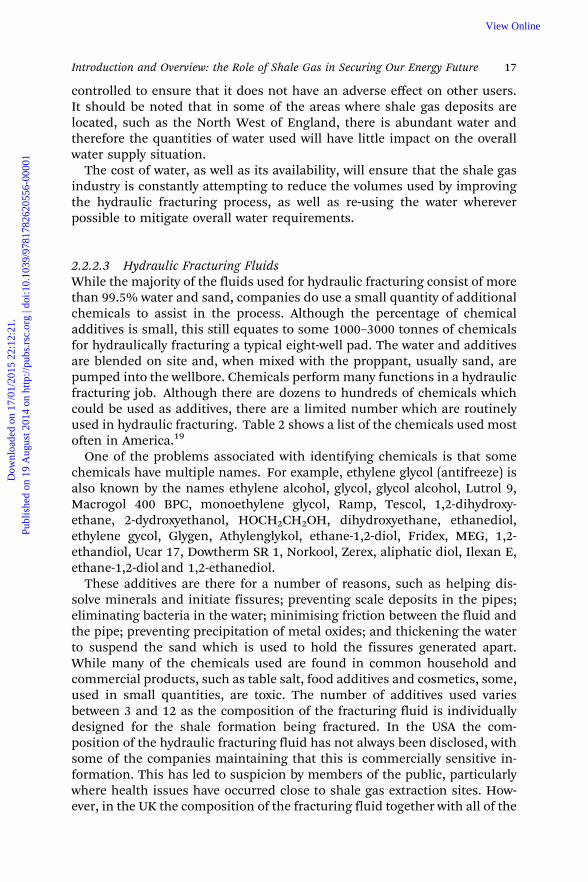
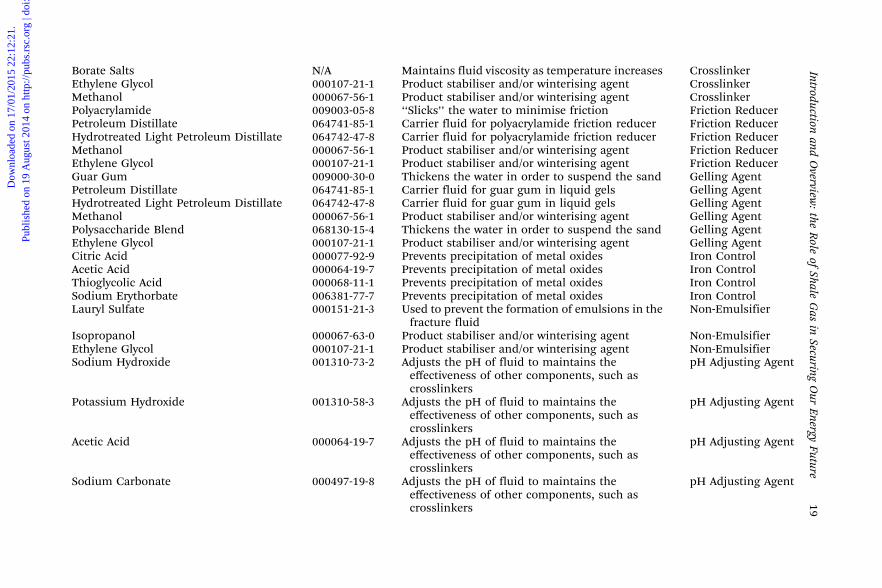
2.2.2.3 Hydraulic Fracturing FluidsWhile the majority of the fluids used for hydraulic fracturing consist of morethan 99.5% water and sand, companies do use a small quantity of additionalchemicals to assist in the process. Although the percentage of chemicaladditives is small, this still equates to some 1000–3000 tonnes of chemicalsfor hydraulically fracturing a typical eight-well pad. The water and additivesare blended on site and, when mixed with the proppant, usually sand, arepumped into the wellbore. Chemicals perform many functions in a hydraulicfracturing job. Although there are dozens to hundreds of chemicals whichcould be used as additives, there are a limited number which are routinelyused in hydraulic fracturing. Table 2 shows a list of the chemicals used mostoften in America.19
One of the problems associated with identifying chemicals is that somechemicals have multiple names. For example, ethylene glycol (antifreeze) isalso known by the names ethylene alcohol, glycol, glycol alcohol, Lutrol 9,Macrogol 400 BPC, monoethylene glycol, Ramp, Tescol, 1,2-dihydroxy-ethane, 2-dydroxyethanol, HOCH2CH2OH, dihydroxyethane, ethanediol,ethylene gycol, Glygen, Athylenglykol, ethane-1,2-diol, Fridex, MEG, 1,2-ethandiol, Ucar 17, Dowtherm SR 1, Norkool, Zerex, aliphatic diol, Ilexan E,ethane-1,2-diol and 1,2-ethanediol.
These additives are there for a number of reasons, such as helping dis-solve minerals and initiate fissures; preventing scale deposits in the pipes;eliminating bacteria in the water; minimising friction between the fluid andthe pipe; preventing precipitation of metal oxides; and thickening the waterto suspend the sand which is used to hold the fissures generated apart.While many of the chemicals used are found in common household andcommercial products, such as table salt, food additives and cosmetics, some,used in small quantities, are toxic. The number of additives used variesbetween 3 and 12 as the composition of the fracturing fluid is individuallydesigned for the shale formation being fractured. In the USA the com-position of the hydraulic fracturing fluid has not always been disclosed, withsome of the companies maintaining that this is commercially sensitive in-formation. This has led to suspicion by members of the public, particularlywhere health issues have occurred close to shale gas extraction sites. How-ever, in the UK the composition of the fracturing fluid together with all of the
17Introduction and Overview: the Role of Shale Gas in Securing Our Energy Future
Dow
nloa
ded
on 1
7/01
/201
5 22
:12:
21.
Publ
ishe
d on
19
Aug
ust 2
014
on h
ttp://
pubs
.rsc
.org
| do
i:10.
1039
/978
1782
6205
56-0
0001
View Online
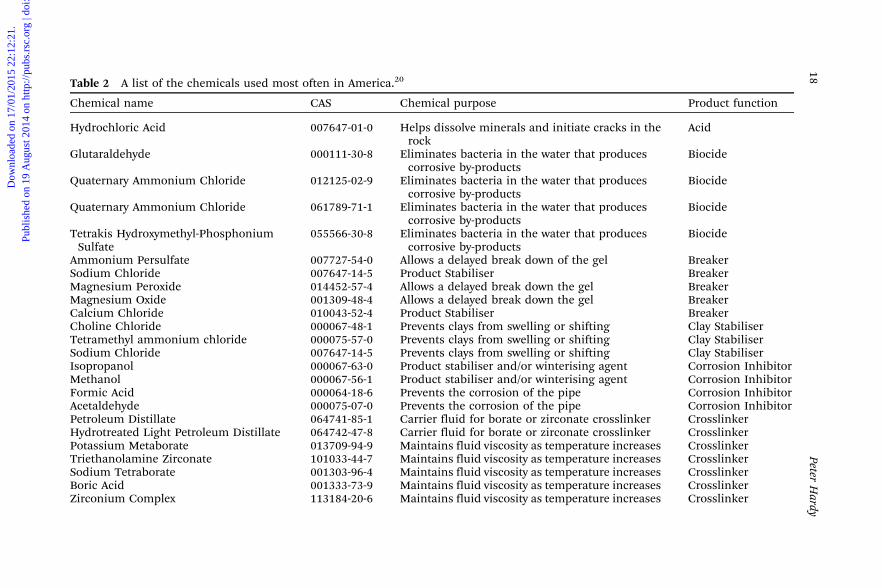
Table 2 A list of the chemicals used most often in America.20
Chemical name CAS Chemical purpose Product function
Hydrochloric Acid 007647-01-0 Helps dissolve minerals and initiate cracks in therock
Acid
Glutaraldehyde 000111-30-8 Eliminates bacteria in the water that producescorrosive by-products
Biocide
Quaternary Ammonium Chloride 012125-02-9 Eliminates bacteria in the water that producescorrosive by-products
Biocide
Quaternary Ammonium Chloride 061789-71-1 Eliminates bacteria in the water that producescorrosive by-products
Biocide
Tetrakis Hydroxymethyl-PhosphoniumSulfate
055566-30-8 Eliminates bacteria in the water that producescorrosive by-products
Biocide
Ammonium Persulfate 007727-54-0 Allows a delayed break down of the gel BreakerSodium Chloride 007647-14-5 Product Stabiliser BreakerMagnesium Peroxide 014452-57-4 Allows a delayed break down the gel BreakerMagnesium Oxide 001309-48-4 Allows a delayed break down the gel BreakerCalcium Chloride 010043-52-4 Product Stabiliser BreakerCholine Chloride 000067-48-1 Prevents clays from swelling or shifting Clay StabiliserTetramethyl ammonium chloride 000075-57-0 Prevents clays from swelling or shifting Clay StabiliserSodium Chloride 007647-14-5 Prevents clays from swelling or shifting Clay StabiliserIsopropanol 000067-63-0 Product stabiliser and/or winterising agent Corrosion InhibitorMethanol 000067-56-1 Product stabiliser and/or winterising agent Corrosion InhibitorFormic Acid 000064-18-6 Prevents the corrosion of the pipe Corrosion InhibitorAcetaldehyde 000075-07-0 Prevents the corrosion of the pipe Corrosion InhibitorPetroleum Distillate 064741-85-1 Carrier fluid for borate or zirconate crosslinker CrosslinkerHydrotreated Light Petroleum Distillate 064742-47-8 Carrier fluid for borate or zirconate crosslinker CrosslinkerPotassium Metaborate 013709-94-9 Maintains fluid viscosity as temperature increases CrosslinkerTriethanolamine Zirconate 101033-44-7 Maintains fluid viscosity as temperature increases CrosslinkerSodium Tetraborate 001303-96-4 Maintains fluid viscosity as temperature increases CrosslinkerBoric Acid 001333-73-9 Maintains fluid viscosity as temperature increases CrosslinkerZirconium Complex 113184-20-6 Maintains fluid viscosity as temperature increases Crosslinker
18Peter
Hardy
Dow
nloa
ded
on 1
7/01
/201
5 22
:12:
21.
Publ
ishe
d on
19
Aug
ust 2
014
on h
ttp://
pubs
.rsc
.org
| do
i:10.
1039
/978
1782
6205
56-0
0001
View Online
Borate Salts N/A Maintains fluid viscosity as temperature increases CrosslinkerEthylene Glycol 000107-21-1 Product stabiliser and/or winterising agent CrosslinkerMethanol 000067-56-1 Product stabiliser and/or winterising agent CrosslinkerPolyacrylamide 009003-05-8 ‘‘Slicks’’ the water to minimise friction Friction ReducerPetroleum Distillate 064741-85-1 Carrier fluid for polyacrylamide friction reducer Friction ReducerHydrotreated Light Petroleum Distillate 064742-47-8 Carrier fluid for polyacrylamide friction reducer Friction ReducerMethanol 000067-56-1 Product stabiliser and/or winterising agent Friction ReducerEthylene Glycol 000107-21-1 Product stabiliser and/or winterising agent Friction ReducerGuar Gum 009000-30-0 Thickens the water in order to suspend the sand Gelling AgentPetroleum Distillate 064741-85-1 Carrier fluid for guar gum in liquid gels Gelling AgentHydrotreated Light Petroleum Distillate 064742-47-8 Carrier fluid for guar gum in liquid gels Gelling AgentMethanol 000067-56-1 Product stabiliser and/or winterising agent Gelling AgentPolysaccharide Blend 068130-15-4 Thickens the water in order to suspend the sand Gelling AgentEthylene Glycol 000107-21-1 Product stabiliser and/or winterising agent Gelling AgentCitric Acid 000077-92-9 Prevents precipitation of metal oxides Iron ControlAcetic Acid 000064-19-7 Prevents precipitation of metal oxides Iron ControlThioglycolic Acid 000068-11-1 Prevents precipitation of metal oxides Iron ControlSodium Erythorbate 006381-77-7 Prevents precipitation of metal oxides Iron ControlLauryl Sulfate 000151-21-3 Used to prevent the formation of emulsions in the
fracture fluidNon-Emulsifier
Isopropanol 000067-63-0 Product stabiliser and/or winterising agent Non-EmulsifierEthylene Glycol 000107-21-1 Product stabiliser and/or winterising agent Non-EmulsifierSodium Hydroxide 001310-73-2 Adjusts the pH of fluid to maintains the
effectiveness of other components, such ascrosslinkers
pH Adjusting Agent
Potassium Hydroxide 001310-58-3 Adjusts the pH of fluid to maintains theeffectiveness of other components, such ascrosslinkers
pH Adjusting Agent
Acetic Acid 000064-19-7 Adjusts the pH of fluid to maintains theeffectiveness of other components, such ascrosslinkers
pH Adjusting Agent
Sodium Carbonate 000497-19-8 Adjusts the pH of fluid to maintains theeffectiveness of other components, such ascrosslinkers
pH Adjusting Agent
19Introduction
andO
verview:
theR
oleof
ShaleG
asin
SecuringO
urEnergy
Future
Dow
nloa
ded
on 1
7/01
/201
5 22
:12:
21.
Publ
ishe
d on
19
Aug
ust 2
014
on h
ttp://
pubs
.rsc
.org
| do
i:10.
1039
/978
1782
6205
56-0
0001
View Online
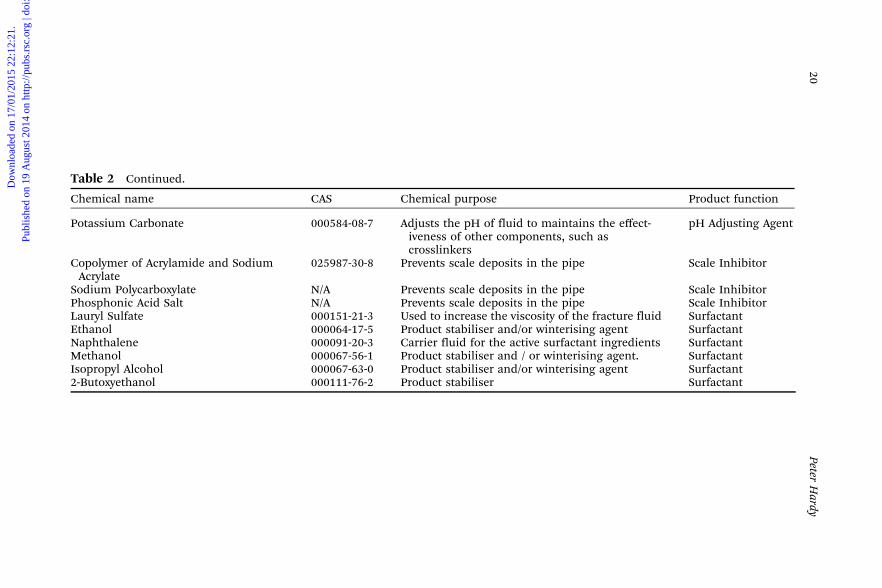
Table 2 Continued.
Chemical name CAS Chemical purpose Product function
Potassium Carbonate 000584-08-7 Adjusts the pH of fluid to maintains the effect-iveness of other components, such ascrosslinkers
pH Adjusting Agent
Copolymer of Acrylamide and SodiumAcrylate
025987-30-8 Prevents scale deposits in the pipe Scale Inhibitor
Sodium Polycarboxylate N/A Prevents scale deposits in the pipe Scale InhibitorPhosphonic Acid Salt N/A Prevents scale deposits in the pipe Scale InhibitorLauryl Sulfate 000151-21-3 Used to increase the viscosity of the fracture fluid SurfactantEthanol 000064-17-5 Product stabiliser and/or winterising agent SurfactantNaphthalene 000091-20-3 Carrier fluid for the active surfactant ingredients SurfactantMethanol 000067-56-1 Product stabiliser and / or winterising agent. SurfactantIsopropyl Alcohol 000067-63-0 Product stabiliser and/or winterising agent Surfactant2-Butoxyethanol 000111-76-2 Product stabiliser Surfactant
20Peter
Hardy
Dow
nloa
ded
on 1
7/01
/201
5 22
:12:
21.
Publ
ishe
d on
19
Aug
ust 2
014
on h
ttp://
pubs
.rsc
.org
| do
i:10.
1039
/978
1782
6205
56-0
0001
View Online
additives will be fully disclosed. As a result of this and the likelypublic concern relating to some of the additives, companies working inthe UK are likely to invest in ‘‘green’’ or non-toxic alternatives whereverpossible.
The fracturing fluid that Cuadrilla has used at the Preese Hall explorationwell site, and plans to use at future exploration well sites, is composed al-most entirely of fresh water and sand. Cuadrilla also has approval to use thefollowing additives:
� Polyacrylamide (friction reducer)� Sodium salt (for tracing fracturing fluid)� Hydrochloric acid (diluted with water)� Glutaraldehyde biocide (used to cleanse water and remove bacteria)
So far, as additives to fracturing fluid, Cuadrilla has only used poly-acrylamide friction reducer along with a miniscule amount of salt, whichacts as a tracer. Cuadrilla have not needed to use biocide as the water sup-plied by United Utilities to their Lancashire exploration well sites has alreadybeen treated to remove bacteria, nor have they used diluted hydrochloricacid in fracturing fluid. Additives proposed, in the quantities proposed, haveresulted in the fracturing fluid being classified as non-hazardous by theEnvironment Agency.
2.2.2.4 Hydraulic FracturingThe issue of hydraulic fracturing causing earthquakes came to prominencein the UK in 2011 when two tremors, one of magnitude 2.3, hit the Fyldecoast in Lancashire on the 1st April followed by a second of magnitude 1.4 onthe 27th May.
Following investigation by the British Geographical Survey, the epicentrefor each earthquake was identified as about 500 metres away from the PreeseHall 1 well at Weeton, Blackpool following hydraulic fracturing.
The geo-mechanical study of the Bowland Shale Seismicity report carriedout by independent experts said that the combination of geological factorsthat caused the quakes was rare and would be unlikely to occur togetheragain at future well sites.21
There was no damage as a result of the two earthquakes and the reportstated ‘‘If these factors were to combine again in the future, local geologylimits seismic activity events to around a magnitude 3 on the Richter scale asa worst-case scenario’’. To put this into context, an earthquake of magnitude2.5 or less is usually not felt but can be recorded by a seismograph, whileearthquakes of magnitude 2.5 to 5.4 are often felt but only cause minordamage. Dr Cliff Frohlich of the University of Texas at Austin carried out astudy of the correlation between injection wells and small earthquakes andhe commented that there is a question of what kind of damage that amagnitude 3 earthquake could do to drilling infrastructure. ‘‘It’s plausible
21Introduction and Overview: the Role of Shale Gas in Securing Our Energy Future
Dow
nloa
ded
on 1
7/01
/201
5 22
:12:
21.
Publ
ishe
d on
19
Aug
ust 2
014
on h
ttp://
pubs
.rsc
.org
| do
i:10.
1039
/978
1782
6205
56-0
0001
View Online
that the tremors could affect well integrity,’’ Frohlich says. ‘‘In my business,you never say never. That said, most of the time these earthquakes are notright near the well. But it’s possible an earthquake could hurt a well,’’though he knows of no instances where that has occurred.22
In order to minimise the risk of future seismic events the companies nowreview local geology for potential fault lines prior to drilling. In addition,they monitor the process with very sensitive instruments so that the oper-ation can be halted if there are indications that an earthquake is likely to betriggered.
2.2.2.5 Disposal of Waste FluidsOnce the hydraulic fracturing is completed, fluid returns to the surface in aprocess known as ‘‘flowback’’. The US Environmental Protection Agency(EPA) estimates that fluids recovered range from 15–80% of the volume in-jected, depending on the site conditions. Therefore, each well will generate1.5–16 million litres of flowback fluids which contain water, sand, methane,fracturing chemicals and contaminants released from the rock being frac-tured. These contaminants could include heavy metals, organic compoundsand naturally occurring radioactive materials. Approximately 60% of theflowback fluids occur within the first four days, with the remaining 40%occurring in the next ten days.
The fluids that are not recovered remain underground and concerns havebeen expressed that these could become a source of contamination tounderground aquifers in the future. Concerns have also been expressed as tothe environmental risk as a result of either waste fluids disposal or a leakfrom the waste fluids storage facilities. The waste fluid from hydraulicfracturing can be managed in a variety of ways, including re-use for furtherhydraulic fracturing, but this is more practical in multi-stage hydraulicfracturing. However, the re-use may concentrate the contaminants in thefluid, making it harder to dispose of or to remove in water treatment plants.Waste fluid can be disposed of through injection into deep undergroundwells, it can be treated at local water treatment facilities to make it accept-able for returning to the environment provided it meets the water treatmentstandards, or it can be stored in tanks or deep lined pits. The size of thesepits could be substantial: to accommodate up to 160 million litres of fluidfrom a multi-well pad would need a pit of 160 000 cubic metres per pad.
Underground injection is the primary disposal method for most shale gasprojects worldwide, but whether this will be acceptable to the United King-dom’s relevant Environmental Agencies has yet to be determined. Whereinjection is not an option, new wastewater treatment facilities are being builtin some parts of the world. The funding for building these plants varies, withsome built using local taxpayers’ money, with the gas companies paying forthe volume of wastewater treated; in other cases the gas companies arepaying for the construction of the plants while some are built under jointventures with both the taxpayers and the gas companies funding the
22 Peter Hardy
Dow
nloa
ded
on 1
7/01
/201
5 22
:12:
21.
Publ
ishe
d on
19
Aug
ust 2
014
on h
ttp://
pubs
.rsc
.org
| do
i:10.
1039
/978
1782
6205
56-0
0001
View Online
projects. The percentage of wastewater that is being recycled is increasing ascompanies become more adept at handling this waste and on-site treatmenttechnologies become more readily available.
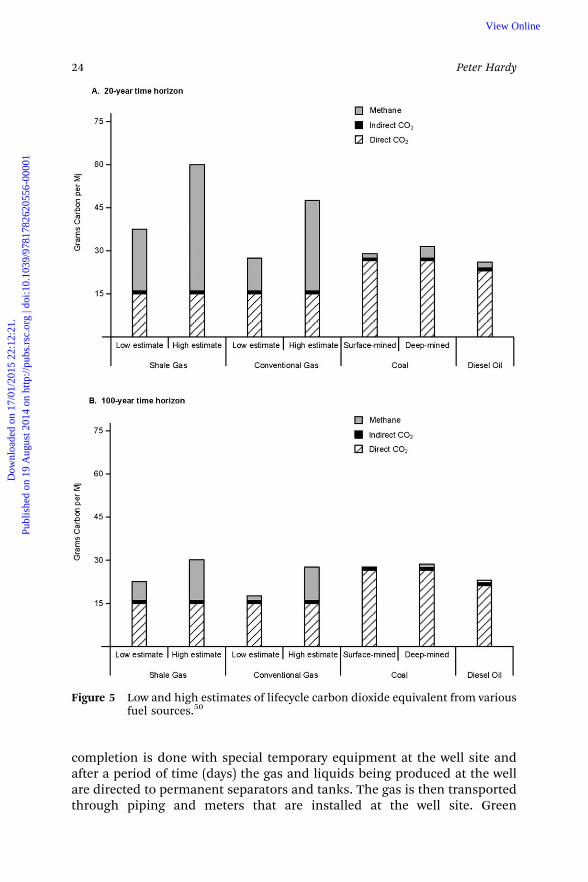
2.2.2.6 Greenhouse Gas EmissionsWhen evaluating the overall merit of any energy source many people look atthe greenhouse gas emissions relative to the energy produced, e.g. theamount of greenhouse gases produced by burning coal to produce elec-tricity. In the case of shale gas extraction, concerns have been expressed thatthere are significant fugitive emissions of methane associated with theprocess of shale gas extraction itself.
A study by Howarth et al. published in 2010 stated ‘‘Compared to coal, the(greenhouse gas) footprint of shale gas is at least 20% greater’’.23 Fugitiveemissions are losses of methane that occur between the well caps and theend user. These can be as a result of leakage around the site, leaks in dis-tribution pipelines between the well and the end user, leakage from venting,etc. Most of these sources would be the same, whether it is a conventionalgas well or a hydraulically fractured gas well. However, the fugitive emissionsfrom the hydraulic fracturing process are of greater concern, as they have notbeen fully examined in detail and could potentially be very high.
After hydraulic fracturing but before the well is capped and the gas pipedaway for use, the well will be cleaned by flushing fluid or gas into the bore toremove debris and also flushing away produced methane that is not prof-itable to store or transport. In a study based on US Environmental ProtectionAgency data, academics from Cornell University have calculated that theventing of such emissions could mean that shale gas may be actually worsefor global warming than coal (see Figure 5).22
Although coal releases more carbon dioxide per unit energy than methane,methane is a far more potent greenhouse gas – 72 times more powerful perunit mass than carbon dioxide over a 25-year period, falling to 25 times overa 100-year period. In the United Kingdom the Environment Agency believesthat good practice can mitigate such fugitive emissions and is consideringoptions to monitor air near the site to keep track of any leaks.
Venting in itself is a dangerous procedure, even if it were permitted in theUK by the Health and Safety Executive. Cuadrilla, which is one of the leadingexploration companies operating at present in the UK, plans to flare themethane that is produced during testing prior to the production phase.24
In the US there are also concerns about methane emissions and the USEPA runs a voluntary program, EPA Natural Gas STAR, for companiesadopting strategies to reduce methane emissions. These procedures areknown by a variety of terms, including ‘‘the green flowback process’’ and‘‘green completions.’’25,26 To reduce the emissions, the gases and liquidsbrought to the surface during the completion processes are collected,filtered and then placed into the production pipelines and tanks insteadof being dumped, vented or flared. The gas clean-up during a ‘‘green’’
23Introduction and Overview: the Role of Shale Gas in Securing Our Energy Future
Dow
nloa
ded
on 1
7/01
/201
5 22
:12:
21.
Publ
ishe
d on
19
Aug
ust 2
014
on h
ttp://
pubs
.rsc
.org
| do
i:10.
1039
/978
1782
6205
56-0
0001
View Online
completion is done with special temporary equipment at the well site andafter a period of time (days) the gas and liquids being produced at the wellare directed to permanent separators and tanks. The gas is then transportedthrough piping and meters that are installed at the well site. Green
Figure 5 Low and high estimates of lifecycle carbon dioxide equivalent from variousfuel sources.50
24 Peter Hardy
Dow
nloa
ded
on 1
7/01
/201
5 22
:12:
21.
Publ
ishe
d on
19
Aug
ust 2
014
on h
ttp://
pubs
.rsc
.org
| do
i:10.
1039
/978
1782
6205
56-0
0001
View Online
completions methods do not involve complex technology and can be verycost effective. If this process for minimising fugitive emissions can be car-ried out cost-effectively in the US (where the payback period if these ‘‘Re-duced Emissions Completions’’ are adopted is just a few months)25 then theprocess would make even more financial sense in the UK where gas pricesare considerably higher.
Another factor in favour of capturing methane instead of flaring is thatflaring produces carbon dioxide (a greenhouse gas) as well as carbon mon-oxide, aromatic hydrocarbons and particulate matter emissions.
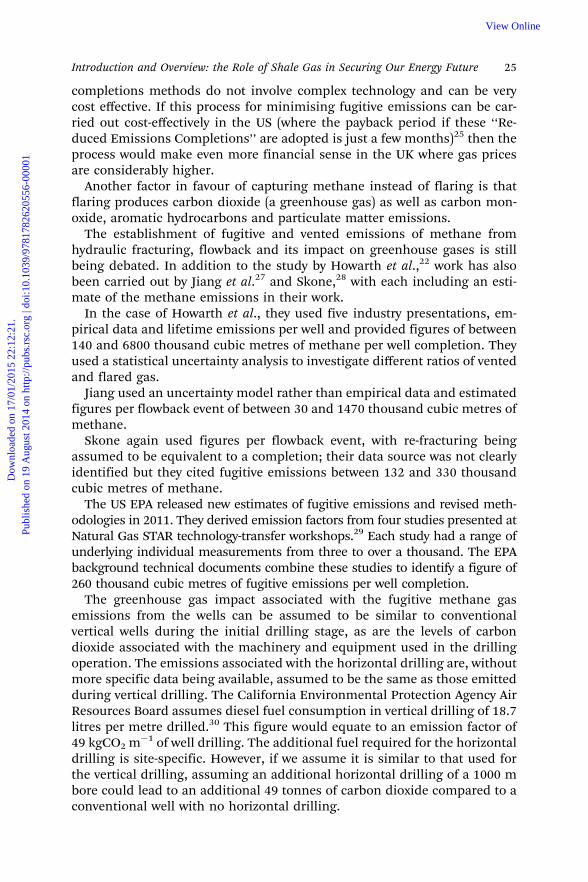
The establishment of fugitive and vented emissions of methane fromhydraulic fracturing, flowback and its impact on greenhouse gases is stillbeing debated. In addition to the study by Howarth et al.,22 work has alsobeen carried out by Jiang et al.27 and Skone,28 with each including an esti-mate of the methane emissions in their work.
In the case of Howarth et al., they used five industry presentations, em-pirical data and lifetime emissions per well and provided figures of between140 and 6800 thousand cubic metres of methane per well completion. Theyused a statistical uncertainty analysis to investigate different ratios of ventedand flared gas.
Jiang used an uncertainty model rather than empirical data and estimatedfigures per flowback event of between 30 and 1470 thousand cubic metres ofmethane.
Skone again used figures per flowback event, with re-fracturing beingassumed to be equivalent to a completion; their data source was not clearlyidentified but they cited fugitive emissions between 132 and 330 thousandcubic metres of methane.
The US EPA released new estimates of fugitive emissions and revised meth-odologies in 2011. They derived emission factors from four studies presented atNatural Gas STAR technology-transfer workshops.29 Each study had a range ofunderlying individual measurements from three to over a thousand. The EPAbackground technical documents combine these studies to identify a figure of260 thousand cubic metres of fugitive emissions per well completion.
The greenhouse gas impact associated with the fugitive methane gasemissions from the wells can be assumed to be similar to conventionalvertical wells during the initial drilling stage, as are the levels of carbondioxide associated with the machinery and equipment used in the drillingoperation. The emissions associated with the horizontal drilling are, withoutmore specific data being available, assumed to be the same as those emittedduring vertical drilling. The California Environmental Protection Agency AirResources Board assumes diesel fuel consumption in vertical drilling of 18.7litres per metre drilled.30 This figure would equate to an emission factor of49 kgCO2 m�1 of well drilling. The additional fuel required for the horizontaldrilling is site-specific. However, if we assume it is similar to that used forthe vertical drilling, assuming an additional horizontal drilling of a 1000 mbore could lead to an additional 49 tonnes of carbon dioxide compared to aconventional well with no horizontal drilling.
25Introduction and Overview: the Role of Shale Gas in Securing Our Energy Future
Dow
nloa
ded
on 1
7/01
/201
5 22
:12:
21.
Publ
ishe
d on
19
Aug
ust 2
014
on h
ttp://
pubs
.rsc
.org
| do
i:10.
1039
/978
1782
6205
56-0
0001
View Online
The emissions from the hydraulic fracturing process, which uses morefuel than a conventional well, relate to emissions from the fuel used by thehigh-pressure pumps required. New York State reports that emissions fromthese pumps, based on an average fuel use, for hydraulic fracturing of eighthorizontally drilled wells in the Marcellus Shale used a total of 110 000 litresof diesel fuel, producing 295 tonnes of carbon dioxide per well.31
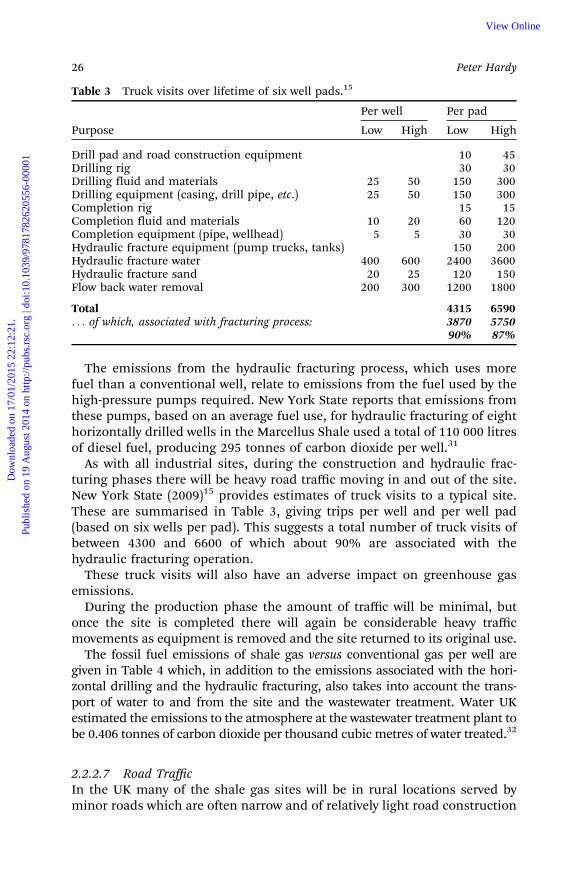
As with all industrial sites, during the construction and hydraulic frac-turing phases there will be heavy road traffic moving in and out of the site.New York State (2009)15 provides estimates of truck visits to a typical site.These are summarised in Table 3, giving trips per well and per well pad(based on six wells per pad). This suggests a total number of truck visits ofbetween 4300 and 6600 of which about 90% are associated with thehydraulic fracturing operation.
These truck visits will also have an adverse impact on greenhouse gasemissions.
During the production phase the amount of traffic will be minimal, butonce the site is completed there will again be considerable heavy trafficmovements as equipment is removed and the site returned to its original use.
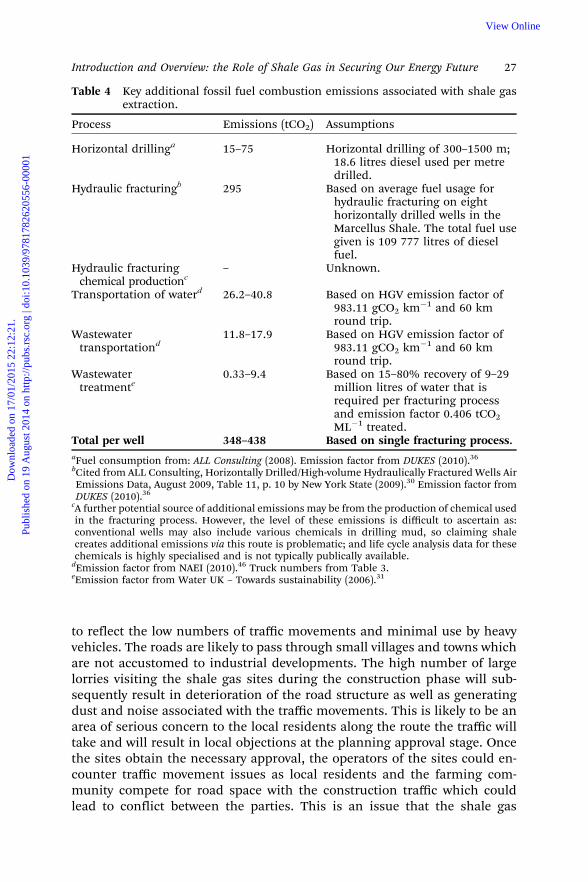
The fossil fuel emissions of shale gas versus conventional gas per well aregiven in Table 4 which, in addition to the emissions associated with the hori-zontal drilling and the hydraulic fracturing, also takes into account the trans-port of water to and from the site and the wastewater treatment. Water UKestimated the emissions to the atmosphere at the wastewater treatment plant tobe 0.406 tonnes of carbon dioxide per thousand cubic metres of water treated.32
2.2.2.7 Road TrafficIn the UK many of the shale gas sites will be in rural locations served byminor roads which are often narrow and of relatively light road construction
Table 3 Truck visits over lifetime of six well pads.15
Purpose
Per well Per pad
Low High Low High
Drill pad and road construction equipment 10 45Drilling rig 30 30Drilling fluid and materials 25 50 150 300Drilling equipment (casing, drill pipe, etc.) 25 50 150 300Completion rig 15 15Completion fluid and materials 10 20 60 120Completion equipment (pipe, wellhead) 5 5 30 30Hydraulic fracture equipment (pump trucks, tanks) 150 200Hydraulic fracture water 400 600 2400 3600Hydraulic fracture sand 20 25 120 150Flow back water removal 200 300 1200 1800
Total 4315 6590. . . of which, associated with fracturing process: 3870 5750
90% 87%
26 Peter Hardy
Dow
nloa
ded
on 1
7/01
/201
5 22
:12:
21.
Publ
ishe
d on
19
Aug
ust 2
014
on h
ttp://
pubs
.rsc
.org
| do
i:10.
1039
/978
1782
6205
56-0
0001
View Online
to reflect the low numbers of traffic movements and minimal use by heavyvehicles. The roads are likely to pass through small villages and towns whichare not accustomed to industrial developments. The high number of largelorries visiting the shale gas sites during the construction phase will sub-sequently result in deterioration of the road structure as well as generatingdust and noise associated with the traffic movements. This is likely to be anarea of serious concern to the local residents along the route the traffic willtake and will result in local objections at the planning approval stage. Oncethe sites obtain the necessary approval, the operators of the sites could en-counter traffic movement issues as local residents and the farming com-munity compete for road space with the construction traffic which couldlead to conflict between the parties. This is an issue that the shale gas
Table 4 Key additional fossil fuel combustion emissions associated with shale gasextraction.
Process Emissions (tCO2) Assumptions
Horizontal drillinga 15–75 Horizontal drilling of 300–1500 m;18.6 litres diesel used per metredrilled.
Hydraulic fracturingb 295 Based on average fuel usage forhydraulic fracturing on eighthorizontally drilled wells in theMarcellus Shale. The total fuel usegiven is 109 777 litres of dieselfuel.
Hydraulic fracturingchemical productionc
– Unknown.
Transportation of waterd 26.2–40.8 Based on HGV emission factor of983.11 gCO2 km�1 and 60 kmround trip.
Wastewatertransportationd
11.8–17.9 Based on HGV emission factor of983.11 gCO2 km�1 and 60 kmround trip.
Wastewatertreatmente
0.33–9.4 Based on 15–80% recovery of 9–29million litres of water that isrequired per fracturing processand emission factor 0.406 tCO2ML�1 treated.
Total per well 348–438 Based on single fracturing process.aFuel consumption from: ALL Consulting (2008). Emission factor from DUKES (2010).36
bCited from ALL Consulting, Horizontally Drilled/High-volume Hydraulically Fractured Wells AirEmissions Data, August 2009, Table 11, p. 10 by New York State (2009).30 Emission factor fromDUKES (2010).36
cA further potential source of additional emissions may be from the production of chemical usedin the fracturing process. However, the level of these emissions is difficult to ascertain as:conventional wells may also include various chemicals in drilling mud, so claiming shalecreates additional emissions via this route is problematic; and life cycle analysis data for thesechemicals is highly specialised and is not typically publically available.
dEmission factor from NAEI (2010).46 Truck numbers from Table 3.eEmission factor from Water UK – Towards sustainability (2006).31
27Introduction and Overview: the Role of Shale Gas in Securing Our Energy Future
Dow
nloa
ded
on 1
7/01
/201
5 22
:12:
21.
Publ
ishe
d on
19
Aug
ust 2
014
on h
ttp://
pubs
.rsc
.org
| do
i:10.
1039
/978
1782
6205
56-0
0001
View Online
companies need to address at the early planning stage to minimise dis-ruption and to work with the local community to prevent adverse publicrelation issues which could impact on future projects.
2.3 Production
The completion of drilling and hydraulic fracturing marks the start of theproduction phase of the wells. A production well head is put in place tocollect and transfer the gas for subsequent processing, either for utilising onsite for electricity production; for liquefaction and transport off site; or forpiping into the gas distribution network. Production from one well cancommence while other wells are being drilled and fractured.
In terms of production volumes, indicative figures for long-term pro-duction for a single Marcellus well in New York State are as follows:15
Year 1: Initial rate of 79 000 m3 per day, declining to 25 500 m3 per dayYears 2 to 4: 25 500 m3 per day, declining to 15 600 m3 per dayYears 5 to 10: 15 600 m3 per day, declining to 6400 m3 per dayYears 11 onwards: 6400 m3 per day, declining at a rate of 3% per annum
As can be seen, after five years the volume of gas produced drops dra-matically and it is at that point that the operator may decide to re-fracturethe well to extend its life. Re-fracturing can take place more than once. It isanticipated that wells in the UK will follow a similar pattern of productiondrop-off over time.
2.3.1 Decommissioning and Plugging Off of Wells. When the productivelife of a well is over, or if wells prove uneconomic to exploit, the correctprocedures need to be put in place to ensure that the wells are correctlyplugged and abandoned. Proper plugging is critical to protect the ground-water aquifers, surface water and soil. Well plugging involves removal ofthe well head and the removal of the downhole equipment. Uncementedcasings in critical areas must either be pulled up or perforated. Cementmust then be placed in the wellbore to seal the bore or squeezed throughthe perforations of the casings if they remain in place to seal between thecasings, the rock formations and to fill the bore. This procedure occurs atintervals dictated by the relevant regulatory authority to ensure a seal be-tween hydrocarbon- and water-bearing zones. As an example of how an in-dividual American state’s regulations have evolved in specific detail,California’s plugging regulations require cement plugs to be placed in thefollowing locations: a 200-foot plug straddling the surface casing shoe; aplug across oil- and gas-bearing strata that extends 100 feet above thestrata; a plug extending from 50 feet below to 50 feet above the base ofthe water-bearing strata; and a 50-foot plug at the surface of the well-bore.33 In the UK, the Environmental Agency in England, the ScottishEnvironmental Protection Agency or the Environmental Agencies of Wales
28 Peter Hardy
Dow
nloa
ded
on 1
7/01
/201
5 22
:12:
21.
Publ
ishe
d on
19
Aug
ust 2
014
on h
ttp://
pubs
.rsc
.org
| do
i:10.
1039
/978
1782
6205
56-0
0001
View Online
and Northern Ireland will require the operators to put in place proceduresto ensure that there is no future release or escape of shale gas or wastewater either into the environment or into groundwater-bearing strata.
3 UK Estimates of Shale Gas
In the UK, the government Department of Climate Change (DECC) definesthe estimates of gas in the following terms:
Proven: reserves which, on the evidence available, are virtually certain to betechnically and commercially producible, i.e. have a better than 90% chanceof being produced.
Probable: reserves which are not yet proven, but which are estimated tohave a better than 50% chance of being technically and commerciallyproducible.
Possible: reserves which at present cannot be regarded as probable, butwhich are estimated to have a significant but less than 50% chance of beingtechnically and commercially producible.
Terminology referring to smaller physical scales is also used. Gas InitiallyIn Place (GIIP), or Gas In Place (GIP) for the remainder if production hascommenced, refers to the total gas resource that is present in a reservoiror gas field and is a resource rather than a reserve measure. EstimatedUltimately Recoverable (EUR) refers to a given well or field over its lifetimeand accounts for its production to date and anticipated recovery. Thismeasure is closer in sense to a reserve.
The British Geographical Survey (BGS) in association with the Departmentof Energy and Climate Change (DECC) completed an estimate for theresources (gas in place) of shale gas in part of central Britain in an areabetween Wrexham and Blackpool in the west, and Nottingham andScarborough in the east.34 The estimate is in the form of a range in order toreflect geological uncertainty. The lower limit of the range is 822 trillioncubic feet (tcf) and an upper limit of 2281 tcf, but the central estimate for theresource is 1329 tcf (see Figure 6).
This shale gas estimate is a resource figure and so represents the gas thatis thought to be present, but not the gas that it might be possible to extract.
Prediction of reserves then needs to be considered against what can beeconomically recovered, which of course depends on the price of gas withinthe market it is operating in. The volumes of gas that can be actually re-covered against the predicted reserves are very difficult to determine untilexploratory wells have been drilled. While figures of between 10 and 20% ofpredicted reserves could be recoverable, in some instances the gas actuallyrecovered has been very much lower.
In terms of estimates from individual licence areas that have already beenallocated in the UK, four companies have provided estimates of reserves butto date only one company, Cuadrilla Resources, has carried out exploratorydrilling. This exploration of the commercial shale gas extraction has takenplace in the Bowland Shales in Lancashire. The company’s UK Petroleum
29Introduction and Overview: the Role of Shale Gas in Securing Our Energy Future
Dow
nloa
ded
on 1
7/01
/201
5 22
:12:
21.
Publ
ishe
d on
19
Aug
ust 2
014
on h
ttp://
pubs
.rsc
.org
| do
i:10.
1039
/978
1782
6205
56-0
0001
View Online
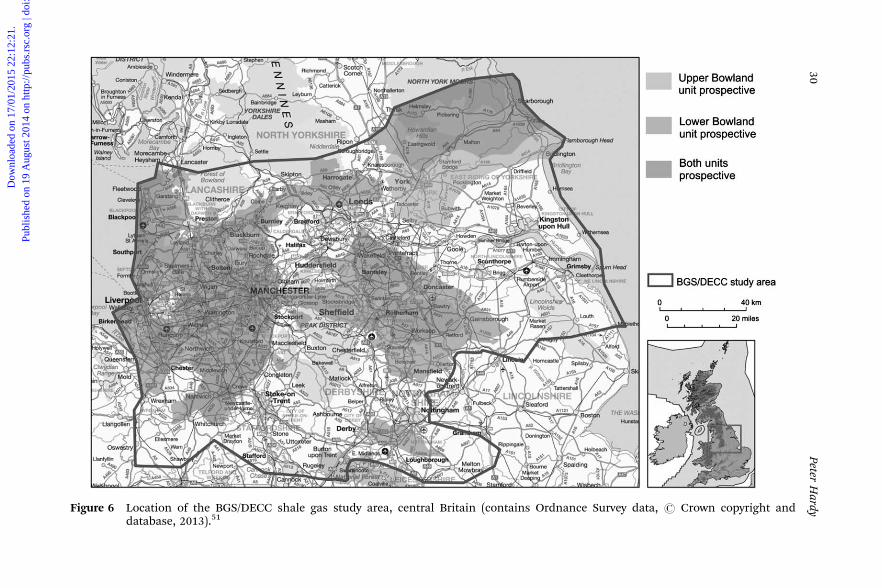
Figure 6 Location of the BGS/DECC shale gas study area, central Britain (contains Ordnance Survey data, r Crown copyright anddatabase, 2013).51
30Peter
Hardy
Dow
nloa
ded
on 1
7/01
/201
5 22
:12:
21.
Publ
ishe
d on
19
Aug
ust 2
014
on h
ttp://
pubs
.rsc
.org
| do
i:10.
1039
/978
1782
6205
56-0
0001
View Online
Exploration and Production Licence (PEDL) was granted in September 2008.(A PEDL is awarded for six years initially on the basis of the applicantdemonstrating technical and financial competence and an awareness of theenvironmental issues. The licensee is also required to demonstrate that theyhave obtained access rights from relevant landowners and complied withother statutory planning laws).
Work commenced on site, drilling the first test well in August 2010 atPreese Hall Farm followed by a second at Grange Hill Farm later that sameyear. Work on the third, near the village of Banks, commenced in August2011. Based on the initial exploration, Cuadrilla Resources announced itsfirst estimate of the volume of shale gas within its licence area on 21st
September 2011. It estimates the total gas initially in place to be 5660 billioncubic metres (bcm) of gas; if it were able to extract 20% of the gas this wouldequate to 1132 bcm of recoverable gas.
Island Gas Limited (IGL) and its subsidiary company IGas Resources PLCoperate in the North of England and North Wales and, using borehole logs,they have identified shale deposits extending over 1195 km2 with an averagedepth of 250 m. In October 2010 they gave estimates of gas initially in placeas between 2.5 bcm and 131 bcm, with a risk factor of 50% for their NorthWales licence area. No estimates of recoverable gas have been given and theyintend to conduct further exploratory work in the future to fully understandthe potential of these deposits.35
Eden Energy Ltd commissioned an independent expert report from RPSGroup plc, a multinational energy resources and environmental consultancycompany, in respect of prospective gas reserves in the 806 km2 of the sevenPEDLs in South Wales. They have estimated that the proven reserves of gasinitially in place are 968 bcm, with recoverable volume of 362 bcm.
Dart Energy, which took over Composite Energy in 2011, has indicatedshale potential in addition to coal-bed methane extraction within its licencearea of north west England and Wales with an estimate of total gas initiallyin place of 34 bcm.36
In April 2012, Dart Energy completed the acquisition of Greenpark Ener-gy’s 17 UK licences. Of these licences, PEDL159 is the furthest developed andis situated in Scotland. Eight wells were drilled in the area by GreenparkEnergy, with three of these wells being pilot production wells, which dem-onstrated good production rates of natural gas from the coal seams. Theremaining five wells were exploration wells; these delineated seam thick-ness, gas contents, gas saturations and permeability trends in the area. Sincethe acquisition, Dart Energy has been assessing the licence area from both asub-surface and surface perspective.
In total, Dart Energy now have four licences in Scotland and a further 28licences in rest of the UK.
Shale gas production in the UK is still some years off, with productionunlikely to start before 2015–2016. Estimates of production are still verydifficult to obtain, but Cuadrilla have estimated that commercial develop-ment of the resource would provide an annual average of 0.7 to 2.8 bcm of
31Introduction and Overview: the Role of Shale Gas in Securing Our Energy Future
Dow
nloa
ded
on 1
7/01
/201
5 22
:12:
21.
Publ
ishe
d on
19
Aug
ust 2
014
on h
ttp://
pubs
.rsc
.org
| do
i:10.
1039
/978
1782
6205
56-0
0001
View Online
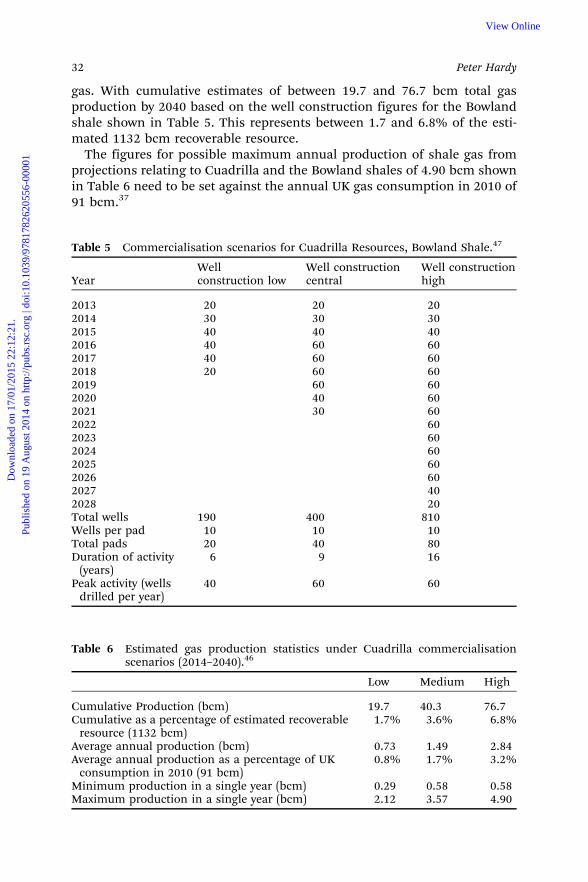
gas. With cumulative estimates of between 19.7 and 76.7 bcm total gasproduction by 2040 based on the well construction figures for the Bowlandshale shown in Table 5. This represents between 1.7 and 6.8% of the esti-mated 1132 bcm recoverable resource.
The figures for possible maximum annual production of shale gas fromprojections relating to Cuadrilla and the Bowland shales of 4.90 bcm shownin Table 6 need to be set against the annual UK gas consumption in 2010 of91 bcm.37
Table 5 Commercialisation scenarios for Cuadrilla Resources, Bowland Shale.47
YearWellconstruction low
Well constructioncentral
Well constructionhigh
2013 20 20 202014 30 30 302015 40 40 402016 40 60 602017 40 60 602018 20 60 602019 60 602020 40 602021 30 602022 602023 602024 602025 602026 602027 402028 20Total wells 190 400 810Wells per pad 10 10 10Total pads 20 40 80Duration of activity
(years)6 9 16
Peak activity (wellsdrilled per year)
40 60 60
Table 6 Estimated gas production statistics under Cuadrilla commercialisationscenarios (2014–2040).46
Low Medium High
Cumulative Production (bcm) 19.7 40.3 76.7Cumulative as a percentage of estimated recoverable
resource (1132 bcm)1.7% 3.6% 6.8%
Average annual production (bcm) 0.73 1.49 2.84Average annual production as a percentage of UK
consumption in 2010 (91 bcm)0.8% 1.7% 3.2%
Minimum production in a single year (bcm) 0.29 0.58 0.58Maximum production in a single year (bcm) 2.12 3.57 4.90
32 Peter Hardy
Dow
nloa
ded
on 1
7/01
/201
5 22
:12:
21.
Publ
ishe
d on
19
Aug
ust 2
014
on h
ttp://
pubs
.rsc
.org
| do
i:10.
1039
/978
1782
6205
56-0
0001
View Online
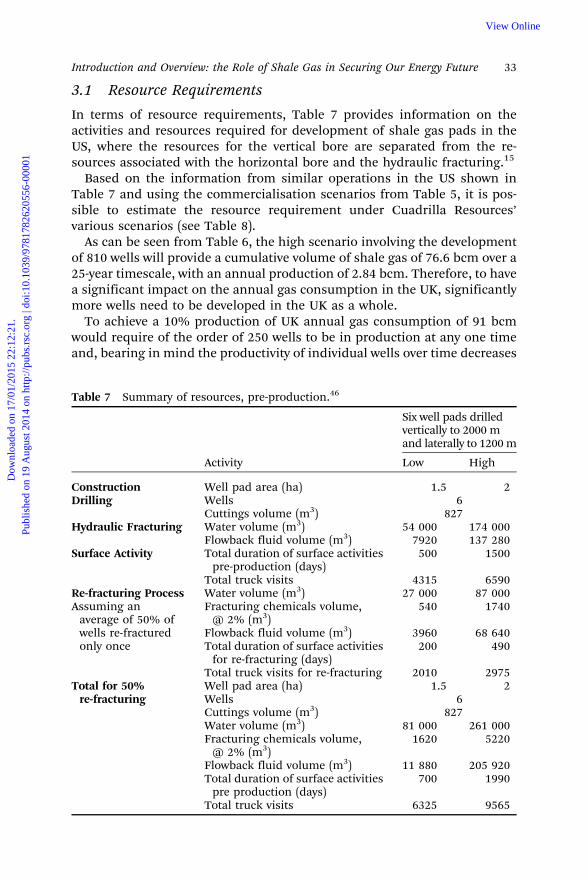
3.1 Resource Requirements
In terms of resource requirements, Table 7 provides information on theactivities and resources required for development of shale gas pads in theUS, where the resources for the vertical bore are separated from the re-sources associated with the horizontal bore and the hydraulic fracturing.15
Based on the information from similar operations in the US shown inTable 7 and using the commercialisation scenarios from Table 5, it is pos-sible to estimate the resource requirement under Cuadrilla Resources’various scenarios (see Table 8).
As can be seen from Table 6, the high scenario involving the developmentof 810 wells will provide a cumulative volume of shale gas of 76.6 bcm over a25-year timescale, with an annual production of 2.84 bcm. Therefore, to havea significant impact on the annual gas consumption in the UK, significantlymore wells need to be developed in the UK as a whole.
To achieve a 10% production of UK annual gas consumption of 91 bcmwould require of the order of 250 wells to be in production at any one timeand, bearing in mind the productivity of individual wells over time decreases
Table 7 Summary of resources, pre-production.46
Activity
Six well pads drilledvertically to 2000 mand laterally to 1200 m
Low High
Construction Well pad area (ha) 1.5 2Drilling Wells 6
Cuttings volume (m3) 827Hydraulic Fracturing Water volume (m3) 54 000 174 000
Flowback fluid volume (m3) 7920 137 280Surface Activity Total duration of surface activities
pre-production (days)500 1500
Total truck visits 4315 6590Re-fracturing ProcessAssuming an
average of 50% ofwells re-fracturedonly once
Water volume (m3) 27 000 87 000Fracturing chemicals volume,
@ 2% (m3)540 1740
Flowback fluid volume (m3) 3960 68 640Total duration of surface activities
for re-fracturing (days)200 490
Total truck visits for re-fracturing 2010 2975Total for 50%
re-fracturingWell pad area (ha) 1.5 2Wells 6Cuttings volume (m3) 827Water volume (m3) 81 000 261 000Fracturing chemicals volume,
@ 2% (m3)1620 5220
Flowback fluid volume (m3) 11 880 205 920Total duration of surface activities
pre production (days)700 1990
Total truck visits 6325 9565
33Introduction and Overview: the Role of Shale Gas in Securing Our Energy Future
Dow
nloa
ded
on 1
7/01
/201
5 22
:12:
21.
Publ
ishe
d on
19
Aug
ust 2
014
on h
ttp://
pubs
.rsc
.org
| do
i:10.
1039
/978
1782
6205
56-0
0001
View Online
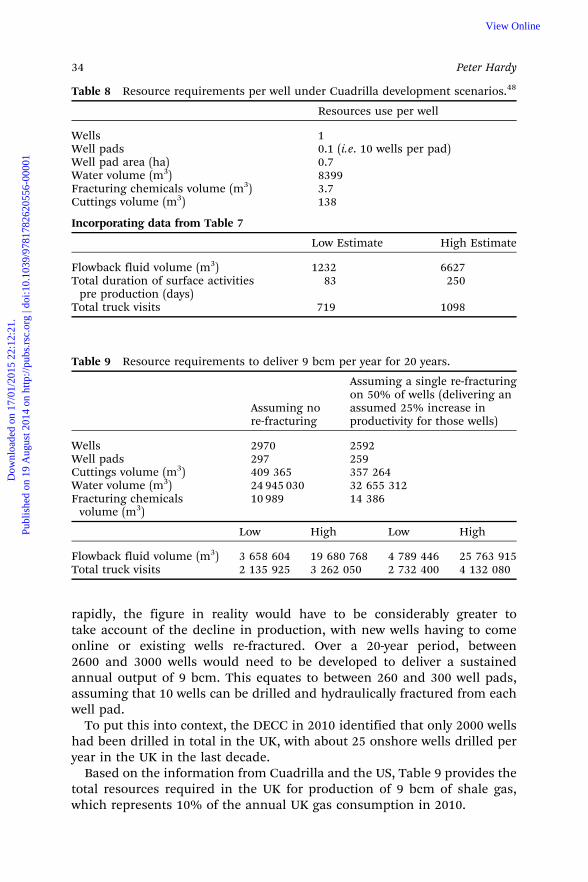
rapidly, the figure in reality would have to be considerably greater totake account of the decline in production, with new wells having to comeonline or existing wells re-fractured. Over a 20-year period, between2600 and 3000 wells would need to be developed to deliver a sustainedannual output of 9 bcm. This equates to between 260 and 300 well pads,assuming that 10 wells can be drilled and hydraulically fractured from eachwell pad.
To put this into context, the DECC in 2010 identified that only 2000 wellshad been drilled in total in the UK, with about 25 onshore wells drilled peryear in the UK in the last decade.
Based on the information from Cuadrilla and the US, Table 9 provides thetotal resources required in the UK for production of 9 bcm of shale gas,which represents 10% of the annual UK gas consumption in 2010.
Table 8 Resource requirements per well under Cuadrilla development scenarios.48
Resources use per well
Wells 1Well pads 0.1 (i.e. 10 wells per pad)Well pad area (ha) 0.7Water volume (m3) 8399Fracturing chemicals volume (m3) 3.7Cuttings volume (m3) 138
Incorporating data from Table 7
Low Estimate High Estimate
Flowback fluid volume (m3) 1232 6627Total duration of surface activities
pre production (days)83 250
Total truck visits 719 1098
Table 9 Resource requirements to deliver 9 bcm per year for 20 years.
Assuming nore-fracturing
Assuming a single re-fracturingon 50% of wells (delivering anassumed 25% increase inproductivity for those wells)
Wells 2970 2592Well pads 297 259Cuttings volume (m3) 409 365 357 264Water volume (m3) 24 945 030 32 655 312Fracturing chemicals
volume (m3)10 989 14 386
Low High Low High
Flowback fluid volume (m3) 3 658 604 19 680 768 4 789 446 25 763 915Total truck visits 2 135 925 3 262 050 2 732 400 4 132 080
34 Peter Hardy
Dow
nloa
ded
on 1
7/01
/201
5 22
:12:
21.
Publ
ishe
d on
19
Aug
ust 2
014
on h
ttp://
pubs
.rsc
.org
| do
i:10.
1039
/978
1782
6205
56-0
0001
View Online
4 Existing Natural Gas Supplies in the UK
The UK at present gets its gas from a variety of sources, including the UKContinental Shelf (UKCS) where production has been in decline since 2000,and in 2012 it was 38% (43 bcm) of the level produced in 2000 (114 bcm).Since 2000 the rate has declined on average by about 8% per annum, but thedecline varies each year depending on operational issues and the price of gason the world market, which determines the viability of marginal production.In 2012 production was 14% lower than in 2011. This was largely due tooperational issues where a leak on the Elgin platform in the North Sea inMarch 2012 reduced production for the rest of 2012.
The UK imports natural gas by pipelines from Norway, Belgium and theNetherlands, and liquefied natural gas (LNG) via ships. The UK has been anet importer of gas since 2004, with net imports in 2012 accounting for 47%of supply. In 2012 the UK imported approximately 50 bcm. In 2012 total LNGimports to the UK via the four import terminals at Dragon (Milford Haven),Isle of Grain, South Hook (Milford Haven) and Teesside GasPort were ap-proximately 13.5 bcm (see Figure 7).36
With the two interconnecting pipes to mainland Europe, the UK gas net-work is integrated with the wider continental gas network, with gas pipelinesextending into Russia, the Middle East and North Africa. These pipelinesenable gas to be moved around from various locations internationally andenable the gas producers to buy and sell gas on the international marketwithout the need to liquefy and ship it. This reduces costs and thereforeensures that the UK can not only import gas via pipelines from a widegeographical area but also allows UK producers to export UKCS gas toEurope.
It is against the background of international trade, which contrasts withthe situation in the US that any shale gas production in the United Kingdomneeds to be considered.
5 World Energy Environment: Is Shale likely to be a GameChanger?
In North America, which has very limited export markets for the shale gas itproduces, with pipelines extending into Mexico and no LNG export term-inals, any shale gas produced is used predominantly within the US. This ledto a dramatic reduction in the cost of gas within the US, with gas prices today(in 2013) at about a third of the peak energy price in 2008 (see Figure 8).
The US is now in the process of converting liquefied natural gas (LNG)import terminals into LNG export terminals. A recent deal between the BGGroup and the US energy firm Cheniere Energy Inc. may allow 3.5 milliontonnes per year of LNG to be exported from the US to Europe from 2015onwards at prices lower than Asian or European gas.38 It will be interestingto see whether the exporting of LNG from the US to the world market willimpact on the price of shale gas within the US and, more importantly for the
35Introduction and Overview: the Role of Shale Gas in Securing Our Energy Future
Dow
nloa
ded
on 1
7/01
/201
5 22
:12:
21.
Publ
ishe
d on
19
Aug
ust 2
014
on h
ttp://
pubs
.rsc
.org
| do
i:10.
1039
/978
1782
6205
56-0
0001
View Online
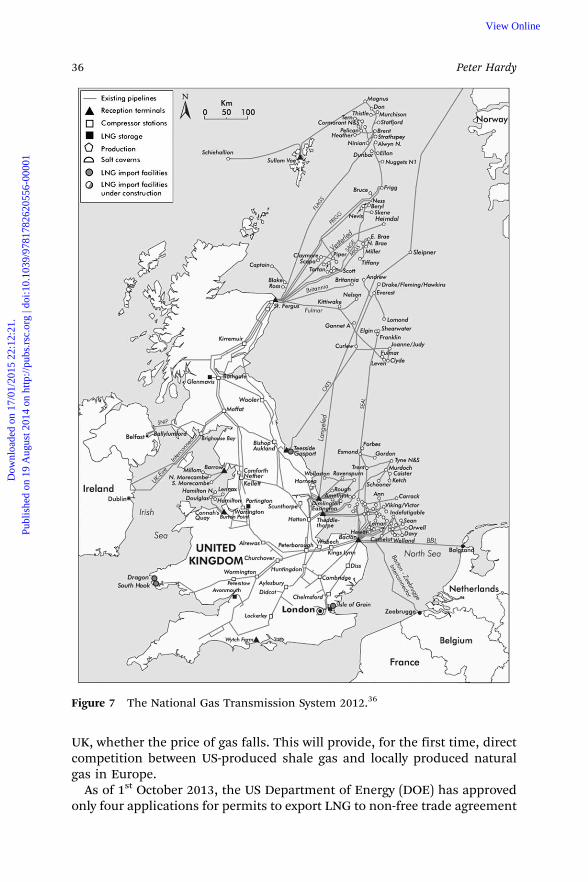
UK, whether the price of gas falls. This will provide, for the first time, directcompetition between US-produced shale gas and locally produced naturalgas in Europe.
As of 1st October 2013, the US Department of Energy (DOE) has approvedonly four applications for permits to export LNG to non-free trade agreement
Figure 7 The National Gas Transmission System 2012.36
36 Peter Hardy
Dow
nloa
ded
on 1
7/01
/201
5 22
:12:
21.
Publ
ishe
d on
19
Aug
ust 2
014
on h
ttp://
pubs
.rsc
.org
| do
i:10.
1039
/978
1782
6205
56-0
0001
View Online
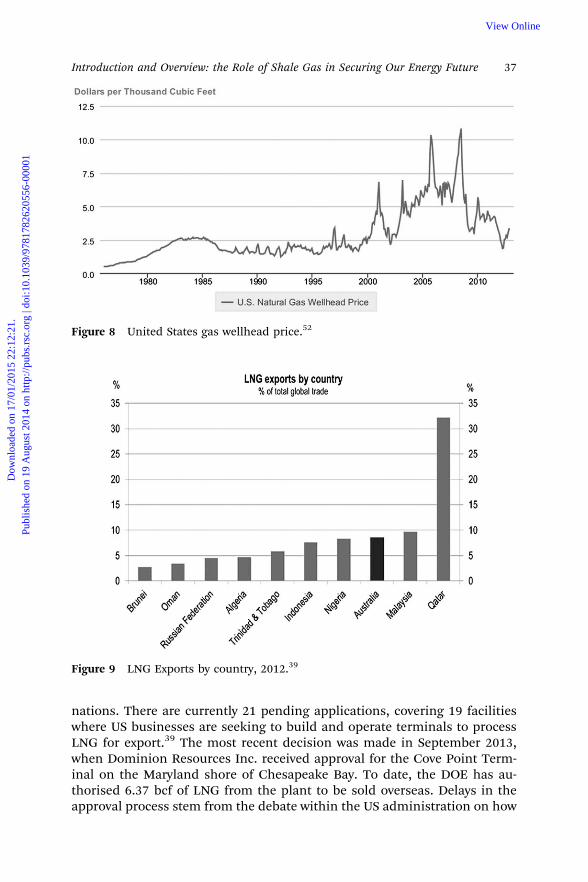
nations. There are currently 21 pending applications, covering 19 facilitieswhere US businesses are seeking to build and operate terminals to processLNG for export.39 The most recent decision was made in September 2013,when Dominion Resources Inc. received approval for the Cove Point Term-inal on the Maryland shore of Chesapeake Bay. To date, the DOE has au-thorised 6.37 bcf of LNG from the plant to be sold overseas. Delays in theapproval process stem from the debate within the US administration on how
Figure 8 United States gas wellhead price.52
Figure 9 LNG Exports by country, 2012.39
37Introduction and Overview: the Role of Shale Gas in Securing Our Energy Future
Dow
nloa
ded
on 1
7/01
/201
5 22
:12:
21.
Publ
ishe
d on
19
Aug
ust 2
014
on h
ttp://
pubs
.rsc
.org
| do
i:10.
1039
/978
1782
6205
56-0
0001
View Online
much natural gas should be exported without raising the natural gas pricesand reducing supplies in the US.
As well as supplies of shale gas from America using LNG export terminals,Australia also plans to expand in the export market for LNG. It now accountsfor 9% of the globally traded LNG and production is set to ramp upsubstantially (see Figure 9).
Investment in capacity to export LNG has been the key driver of Australia’srecent boom, with 7 of the world’s 12 largest LNG plants being built inAustralia. Investment in Australia accounts for around two thirds of all thecurrent global investment in the LNG industry.40 Exports are set to risesharply and government forecasts suggest a rise of over 300% between 2015and 2020.
Based on Australian government projections, Australia will become thesecond-largest exporter of LNG in the world by 2016. If all the majorinvestments projects under consideration were to go ahead, Australia standsto become the world’s largest exporter of LNG by 2020, overtaking Qatar.This is without the potential shale gas and other unconventional gas sourcesbeing heavily exploited. These developments are in their early stages butcould become a significant source of the country’s gas production, especiallygiven that the LNG export capacity is already being built.
This expansion in the Australian LNG market will be in direct competitionwith the expansion of the US shale gas export proposals and will be com-peting for the same markets worldwide. It will be interesting to see how theexpansion in exports of LNG affects the development of shale gas in otherareas and the impact that this has on world gas prices. Should world pricesreflect prices in the US, then it is likely that that there will be a slowing downof future exploration in countries where regulation and operating conditionsare more challenging.
If, due to increases in the world gas demand (not only from developingcountries but also as a result of a change in national policy relating to powergeneration in countries such as Japan and Germany), there is little impact onworld gas prices, then shale gas extraction in other countries will continue tobe developed. Japan and Germany are expanding their gas-fired powerstation programmes as a result of trying to reduce their nuclear generationcapacity in response to the Fukushima nuclear accident that occurred in2011.
6 Regulation
Regulation in the UK is controlled by a variety of national and localgovernment departments with a variety of different responsibilities.
In the UK, the environmental considerations are controlled by thefollowing organisations: the Environmental Agency (EA) in England, theScottish Environmental Protection Agency (SEPA) and the EnvironmentalAgencies of Wales and Northern Ireland. These agencies are responsible forthe protection of the environment and for the exploration and extraction of
38 Peter Hardy
Dow
nloa
ded
on 1
7/01
/201
5 22
:12:
21.
Publ
ishe
d on
19
Aug
ust 2
014
on h
ttp://
pubs
.rsc
.org
| do
i:10.
1039
/978
1782
6205
56-0
0001
View Online
unconventional gases for which they perform various roles. The agenciesprovide advice to central government and regulate operators to ensure thatthe environment is protected. They also advise government on the sustain-ability of these sources of natural gas and their associated extractiontechnologies. The agencies ensure that the exploration and development ofunconventional gases is regulated effectively to manage risks to surfacewater and groundwater resources. In addition, they are responsible forgranting any necessary environmental permits and have powers to servenotices, where required, to protect the local environment.41 This is done byapplying a proportionate and risk-based approach to preventing pollutionand protecting the environment. The EA is responsible for regulating waterabstraction and regulating any discharge associated with the extractionprocess and is also a statutory consultee in the planning process and willprovide advice to local authorities on individual gas extraction sites.
The Department of Energy and Climate Change (DECC) administers thelicensing system under the Petroleum Act 1998, which authorises eachparticular drilling as a development activity. DECC provides up-to-dateinformation on its website relating to the various Approved Codes of Practice,official guidance and referenced codes, standards, etc., which need to betaken into account when proposing to develop a shale gas deposit.42
The Planning Authority (generally the local authority) deals with theplanning application that is required for each site. The councillors who areresponsible for approving these planning applications are locally electedrepresentatives and as such are keenly aware of the local issues and theimpact that these decisions will have on the local electorate.
The Health and Safety Executive (HSE) regulates the safety aspects of thework, which contributes to the mitigation of the environmental risk. Inparticular, they are responsible for regulating the appropriate design,construction and continued integrity of any gas well. In addition, the rest ofthe requirements under the Health and Safety at Work Act 1974 will also needto be considered when proposing and undertaking any works.
The Institution of Gas Engineers and Managers (IGEM) has published aguidance document, IGEM/G/101 on Onshore Natural Gas Extraction andRoute to Use, which provides an overview of the requirements in the UK.43
7 Predictions are Hard, Especially about the Future
Shale gas has not yet been developed on a commercial basis in the UK, whichinevitably means that one has to make a series of assumptions about howsuccessful the shale gas industry will become and the effect of shale gas onenergy prices within the UK economic environment.
As many experts have identified, there are a number of barriers and issuesabout UK shale gas that are different from the situation applicable in theUSA. These include different geology, different regulation and a muchgreater density of population. The experience of other European countriesalso highlights that, even within Europe, opinions relating to shale gas are
39Introduction and Overview: the Role of Shale Gas in Securing Our Energy Future
Dow
nloa
ded
on 1
7/01
/201
5 22
:12:
21.
Publ
ishe
d on
19
Aug
ust 2
014
on h
ttp://
pubs
.rsc
.org
| do
i:10.
1039
/978
1782
6205
56-0
0001
View Online
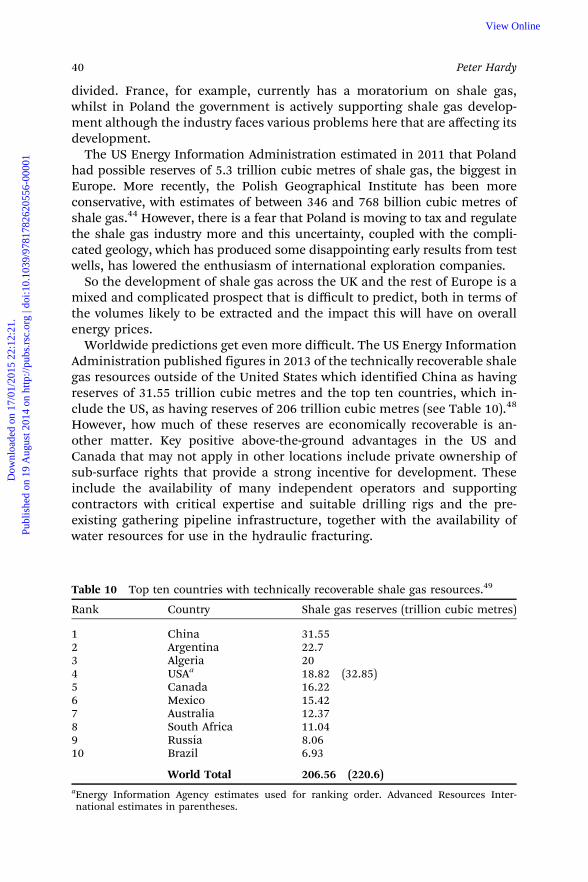
divided. France, for example, currently has a moratorium on shale gas,whilst in Poland the government is actively supporting shale gas develop-ment although the industry faces various problems here that are affecting itsdevelopment.
The US Energy Information Administration estimated in 2011 that Polandhad possible reserves of 5.3 trillion cubic metres of shale gas, the biggest inEurope. More recently, the Polish Geographical Institute has been moreconservative, with estimates of between 346 and 768 billion cubic metres ofshale gas.44 However, there is a fear that Poland is moving to tax and regulatethe shale gas industry more and this uncertainty, coupled with the compli-cated geology, which has produced some disappointing early results from testwells, has lowered the enthusiasm of international exploration companies.
So the development of shale gas across the UK and the rest of Europe is amixed and complicated prospect that is difficult to predict, both in terms ofthe volumes likely to be extracted and the impact this will have on overallenergy prices.
Worldwide predictions get even more difficult. The US Energy InformationAdministration published figures in 2013 of the technically recoverable shalegas resources outside of the United States which identified China as havingreserves of 31.55 trillion cubic metres and the top ten countries, which in-clude the US, as having reserves of 206 trillion cubic metres (see Table 10).48
However, how much of these reserves are economically recoverable is an-other matter. Key positive above-the-ground advantages in the US andCanada that may not apply in other locations include private ownership ofsub-surface rights that provide a strong incentive for development. Theseinclude the availability of many independent operators and supportingcontractors with critical expertise and suitable drilling rigs and the pre-existing gathering pipeline infrastructure, together with the availability ofwater resources for use in the hydraulic fracturing.
Table 10 Top ten countries with technically recoverable shale gas resources.49
Rank Country Shale gas reserves (trillion cubic metres)
1 China 31.552 Argentina 22.73 Algeria 204 USAa 18.82 (32.85)5 Canada 16.226 Mexico 15.427 Australia 12.378 South Africa 11.049 Russia 8.0610 Brazil 6.93
World Total 206.56 (220.6)aEnergy Information Agency estimates used for ranking order. Advanced Resources Inter-national estimates in parentheses.
40 Peter Hardy
Dow
nloa
ded
on 1
7/01
/201
5 22
:12:
21.
Publ
ishe
d on
19
Aug
ust 2
014
on h
ttp://
pubs
.rsc
.org
| do
i:10.
1039
/978
1782
6205
56-0
0001
View Online
Given the variation across the world’s shale formations in both geologyand above-ground conditions, the extent to which global technically recov-erable shale resources will prove to be economically recoverable is not yetclear.
The impact that shale gas will have on the UK gas supply situation and theprice to gas customers is impossible to determine due to the large amount ofuncertainty.
Lord Browne, one of the most powerful energy figures in the UK andChairman of Cuadrilla, the leading shale gas company in the UK, told anaudience at the Grantham Research Institute at the London School of Eco-nomics (LSE) on the 27th November 2013,
‘‘I don’t know what the contribution of shale gas will be to the energy mixof the UK. We need to drill probably 10 to 12 wells and test them and it needsto be done as quickly as possible.
‘‘We are part of a well-connected European market and unless it is a gi-gantic amount of gas, it is not going to have a material impact on price.’’45
These two sentences effectively sum up the situation within the UK at thistime (December 2013).
Disclaimer
The views expressed in this chapter are those of the author and do not ne-cessarily reflect the position or policy of the Institution of Gas Engineers andManagers.
References
1. R. C. Selley, UK shale gas: The story so far, Mar. Pet. Geol., 2012, 31(1),100–109; http://www1.gly.bris.ac.uk/bumps/secure/POTW/Selley_2012.pdf (last accessed 16/01/2014).
2. D. Donohue, N. Anstey and N. Morrill, Shale Gas in the SouthernCentral Area of New York State, US Dept, Energy, Morgantown, 1981, vol.4, 578.
3. R. E. Zielinski and R. D. Mclver, Resources and Exploration Assessmentof the Oil and Gas Potential in the Devonian Shale Gas of the Appa-lachian Basin. US Dept. of Energy, Morgantown, 1998.
4. R. C. Selley, British shale gas potential scrutinized, Oil Gas J., 1987, 15,62–64.
5. J. B. Curtis, Fractured shale-gas systems, Bull. Am. Assoc. Pet. Geol., 2002,86, 1921–1938.
6. A. M. Martini, L. M. Walter, J. M. Budai, T. C. W. Ku, C. J. Kaiser andM. Schoell, Genetic and temporal relations between formation watersand biogenic methane. Upper Devonian Antrim Shale, Michigan Basin,USA, Geochim. Cosmochem. Acta., 1998, 62(10), 1699–1720.
7. West Virginia Surface Owners’ Rights Organisation, Why multiplehorizontal wells from centralized well pads should be used for the
41Introduction and Overview: the Role of Shale Gas in Securing Our Energy Future
Dow
nloa
ded
on 1
7/01
/201
5 22
:12:
21.
Publ
ishe
d on
19
Aug
ust 2
014
on h
ttp://
pubs
.rsc
.org
| do
i:10.
1039
/978
1782
6205
56-0
0001
View Online
Marcellus Shale, 2012; http://www.wvsoro.org/resources/marcellus/horiz_drilling.html (last accessed 16/01/2014).
8. Baker Hughes. Rig Count Data, 2013; http://phx.corporate-ir.net/phoenix.zhtml?c¼ 79687&p¼ irol-rigcountsoverview (last accessed 16/01/2014).
9. U.S. Energy Information Administration. Independent Statistics and An-alysis 2013: Official Shale Gas production data from Form EIA-895, 2013;http://www.eia.gov/ (last accessed 16/01/2014).
10. The Petroleum Economist Limited in association with BG Group. WorldLNG Factbook. 2012 Edition. The Petroleum Economist Limited, London,2012.
11. N. J. P. Smith, Unconventional hydrocarbons: changing explorationstrategies, Earthwise, 1995, 7, 14–15.
12. G. Swann and J. Munns, The Hydrocarbon Prospectivity of Britain’sOnshore Basins, DTI, 2003, 17.
13. R. C. Selley, UK shale-gas resources, Pet. Geol.: North-West Europe GlobalPerspect., Proc. 6th Petroleum Geology Conference, 2005, Geological Soci-ety, London, 2005, 707–714.
14. Department for Energy and Climate Change, Oil and Gas: Onshore Ex-ploration and Production, 2013; https://www.gov.uk/oil-and-gas-onshore-exploration-and-production#resumption-of-shale-gas-exploration (lastaccessed 16/01/2014).
15. Department of Environmental Conservation, Well Permit Issuance forHorizontal Drilling and High-Volume Hydraulic Fracturing in the MarcellusShale and Other Low-Permeability Gas Reservoirs, 2011; http://www.dec.ny.gov/energy/75370.html (last accessed 16/01/2014).
16. J. Broderick, K. Anderson, R. Wood, P. Gilbert and M. Sharmina, ShaleGas: An Updated Assessment of Environmental and Climate Change Impacts,A report commissioned by The Co-operative and undertaken by re-searchers at the Tyndall Centre, University of Manchester, 2011; http://www.co-operative.coop/Corporate/Fracking/Shale%20gas%20update%20-%20full%20report.pdf (last accessed 16/01/2014).
17. UK Parliament, Shale Gas – Energy and Climate Change, 2011; http://www.publications.parliament.uk/pa/cm201012/cmselect/cmenergy/795/795we09.htm (last accessed 3rd February 2014).
18. House of Commons Committee of Public Accounts, Ofwat: Meeting theDemands for Water, 2007; [http://www.publications.parliament.uk/pa/cm200607/cmselect/cmpubacc/286/286.pdf (last accessed 16/01/2014).
19. FracFocus. What Chemicals are Used, 2014; http://fracfocus.org/chemical-use/what-chemicals-are-used (last accessed 3rd February 2014).
20. FracFocus. What Chemicals are Used, 2014; http://fracfocus.org/chemical-use/what-chemicals-are-used (last accessed 3rd February 2014).
21. C. J. De Pater and S. Baisch, Geomechanical Study of Bowland ShaleSeismicity. Synthesis Report, 2011; http://www.cuadrillaresources.com/wp-content/uploads/2012/02/Geomechanical-Study-of-Bowland-Shale-Seismicity_02-11-11.pdf (last accessed 16/01/2014).
42 Peter Hardy
Dow
nloa
ded
on 1
7/01
/201
5 22
:12:
21.
Publ
ishe
d on
19
Aug
ust 2
014
on h
ttp://
pubs
.rsc
.org
| do
i:10.
1039
/978
1782
6205
56-0
0001
View Online
22. C. Frohlich, Study Finds Correlation Between Injection Wells and SmallEarthquakes, 2012; http://www.utexas.edu/news/2012/08/06/correlation-injection-wells-small-earthquakes/ (last accessed 3rd February 2014).
23. R. Howarth, R. Santoro, A. Ingraffee, A commentary on ‘‘The green-house-gas footprint of natural gas in shale formations’’, Climate Change,2012, 113(2), 525–535; http://download.springer.com/static/pdf/112/art%253A10.1007%252Fs10584-011-0333-0.pdf?auth66¼ 1390571575_f9a31aef677463804c72b217e82e970d&ext¼ .pdf (last accessed 16/01/2014).
24. Institution of Gas Engineers and Managers, Shale Gas A UK EnergyMiracle? An IGEM Report, 2011; http://www.igem.org.uk/media/107958/igem-shale_gas-a_uk_energy_miracle-september_2011.pdf (last ac-cessed 16/01/2014).
25. R. Guerra, Green Flowback Process, Integrated Production Services, 2005;http://www.epa.gov/gasstar/documents/workshops/houston-2005/green_flowback.pdf (last accessed 16/01/2014).
26. U.S. Environmental Protection Agency, Lessons Learned from Natural GasSTAR Partners. Reduced Emissions Completions for Hydraulically FracturedNatural Gas Well, 2011; www.epa.gov/gasstar/documents/reduced_emissions_completions.pdf (last accessed 16/01/2014).
27. J. M. Jiang, W. M. Griffin, C. Hendrickson, P. Jaramillo, J. VanBriesenand A. Venkatesh, Life cycle greenhouse gas emissions of Marcellusshale gas, Environ. Res. Lett.. 2011, 6(3), 034014; http://iopscience.iop.org/1748-9326/6/3/034014/pdf/1748-9326_6_3_034014.pdf (last accessed16/01/2014).
28. T. J. Skone, Life Cycle Greenhouse Gas Inventory of Natural Gas Extraction,Delivery and Electricity Production, U.S. Department of Energy, 2011;http://www.netl.doe.gov/energy-analyses/pubs/NG-GHG-LCI.pdf (last ac-cessed 16/01/2014).
29. U.S. Environmental Protection Agency. U.S. Greenhouse Gas Emissionsand Sinks: 1990-2011, 2011; www.epa.gov/climatechange/ghgemissions/usinventoryreport.html (last accessed 16/01/2014).
30. California Department of Conservation Oil and Gas Division. MonthlyConsumption Estimates of Natural Gas for Lease Fuel according to eachOperator and Gas Field in California, 2001; www.arb.ca.gov/ei/areasrc/ccosmeth/att_l_fuel_combustion_for_petroleum_production.doc (lastaccessed 16/01/2014).
31. ALL Consulting. Evaluating the Environmental Implications of HydraulicFracturing in Shale Gas Reservoirs, 2008; http://energy.wilkes.edu/PDFFiles/Issues/EvaluatingTheEnvironmentalImplicationsOfHydraulicFracruringInShaleGasReservoirs.pdf (last accessed 16/01/2014).
32. Water UK Report. Towards Sustainability 2005–2006, Water UK, London,2006.
33. State of California. California Code of Regulations, Title 14: Natural Re-sources, Division 2: Department of Conservation, 2007, 18;: ftp://ftp.consrv.
43Introduction and Overview: the Role of Shale Gas in Securing Our Energy Future
Dow
nloa
ded
on 1
7/01
/201
5 22
:12:
21.
Publ
ishe
d on
19
Aug
ust 2
014
on h
ttp://
pubs
.rsc
.org
| do
i:10.
1039
/978
1782
6205
56-0
0001
View Online
ca.gov/pub/oil/publications/PRC04_January_11.pdf (last accessed 16/01/2014).
34. Department of Energy and Climate Change. Bowland Shale Gas Study,2013; https://www.gov.uk/government/publications/bowland-shale-gas-study (last accessed 16/01/2014).
35. IGas Energy, Unlocking Britain’s Energy Potential; http://www.igasplc.com/ (last accessed 16/01/2014).
36. Dart Energy, Portfolio of Assets; http://www.dartgas.com/ (last accessed16/01/2014).
37. Department of Energy and Climate Change. UK Government Statistics2013. Digest of United Kingdom Energy Statistics (DUKES). Natural Gas, ch.4, 2011; https://www.gov.uk/government/uploads/system/uploads/attachment_data/file/65800/DUKES_2013_Chapter_4.pdf (last accessed16/01/2014).
38. BBC News, US Shale Gas to Be Exported Globally in $8bn Deal, 2011;http://www.bbc.co.uk/news/business-15464867?utm_source-twitterfeed&utm_medium-twitter (last accessed 16/01/2014).
39. American Petroleum Institute, Report on Liquefied Natural Gas exports –America’s Opportunities and Advantages, 2013; http://www.api.org/policy-and-issues/policy-items/lng-exports/liquefied-natural-gas-exports-americas-opportunity-and-advantage (last accessed 16/01/2014).
40. P. Bloxham and A. Richardson, Australia’s Growing Role in Asian Gas,2013; www.morningstar.com.au/funds/article/asian-gas/6179?q¼printme (last accessed 16/01/2014).
41. HM Government, The Environmental Permitting (England and Wales)Regulations 2010, 2010; www.legislation.gov.uk/ukdsi/2010/9780111491423 (last accessed 16/01/2014).
42. Department for Energy and Climate Change, Oil and Gas Onshore Ex-ploration and Production Publications, Guidance and Data including Map-ping, Seismic Activity, Wells, and Licensing and Regulation for Onshore Oiland Gas, 2013; http://og.decc.gov.uk/en/olgs/cms/explorationpro/onshore.aspx (last accessed 16/01/2014).
43. Institution of Gas Engineers and Managers, IGEM/G/101, Onshore Nat-ural Gas Extraction. Guidance, 2012; http://www.igem.org.uk/media/291311/igem-g-101.pdf (last accessed 16/01/2014).
44. Polish Geological Institute National Research Institute Report, FinancialTimes, 5th June 2013.
45. D. Carrington, Fracking will not Reduce UK Gas Prices, 2013; http://www.theguardian.com/environment/2013/nov/29/browne-fracking-not-reduce-uk-gas-prices-shale-energy-bills (last accessed 16/01/2014).
46. Defra, National Atmospheric Emissions Inventory, Emission Factors forTransport, 2013; http://naei.defra.gov.uk/data/ef-transport (last accessed3rd February 2014).
47. J. Broderick, K. Anderson, R. Wood, P. Gilbert and M. Sharmina, ShaleGas: an Updated Assessment of Environmental and Climate Change impacts,
44 Peter Hardy
Dow
nloa
ded
on 1
7/01
/201
5 22
:12:
21.
Publ
ishe
d on
19
Aug
ust 2
014
on h
ttp://
pubs
.rsc
.org
| do
i:10.
1039
/978
1782
6205
56-0
0001
View Online
2011; http://www.co-operative.coop/Corporate/Fracking/Shale%20gas%20update%20-%20full%20report.pdf (last accessed 16/01/2014).
48. Regeneris Consulting. Economic Impact of Shale Gas Exploration & Pro-duction in Lancashire and the UK, A Report prepared for CuadrillaResources, 2011; http://www.cuadrillaresources.nl/wp-content/uploads/2012/02/Full_Report_Economic_Impact_of_Shale_Gas_14_Sept.pdf (lastaccessed 16/01/2014).
49. Advanced Resources International, EIA/ARI World Shale Gas and Shale OilResource Assessment. Technically Recoverable Shale oil and Shale Gas Re-sources: An assessment of 137 Shale Formations in 41 Countries Outside ofthe United States, 2013, Table 6; http://www.adv-res.com/pdf/A_EIA_ARI_2013%20World%20Shale%20Gas%20and%20Shale%20Oil%20Resource%20Assessment.pdf (16/01/2014).
50. R. L. Santoro, R. H. Howarth, and A. R. Ingraffea, Indirect Emissions ofCarbon Dioxide from Marcellus Shale Gas Development, 2011; http://www.eeb.cornell.edu/howarth/IndirectEmissionsofCarbonDioxidefromMarcellusShaleGasDevelopment_June302011%20.pdf (16/01/2014).
51. Department of Energy and Climate Change. Bowland Shale Gas Report,2013; https://www.gov.uk/government/uploads/system/uploads/attachment_data/file/226874/BGS_DECC_BowlandShaleGasReport_MAIN_REPORT.pdf (last accessed 16/01/2014).
52. U.S. Energy Information Administration Information, U.S. Natural GasWellhead Price, 2013; http://www.eia.gov/dnav/ng/hist/n9190us3m.htm(16/01/2014).
45Introduction and Overview: the Role of Shale Gas in Securing Our Energy Future
Dow
nloa
ded
on 1
7/01
/201
5 22
:12:
21.
Publ
ishe
d on
19
Aug
ust 2
014
on h
ttp://
pubs
.rsc
.org
| do
i:10.
1039
/978
1782
6205
56-0
0001
View Online