Embed Size (px)
Citation preview
“Introduction and Overview of OECD BondMarkets”
by: Hans Blommestein
reprint from: OECD Public Debt Markets: Trends andRecent Structural Changes, OECD, 2002.
Second International Roundtable on SecuritiesMarkets in China
6-7 June 2002, Shanghai
CHAPTER 1
INTRODUCTION AND OVERVIEW OF OECD BOND MARKETS*
I. Background
At its meeting in October 2000, the Committee on Financial Markets requestedthe Working Party on Public Debt Management to undertake a study on recenttrends and developments in OECD bond markets. Subsequently, the studywould be discussed at the meeting of the Committee in October 2001. TheWorking Party discussed this request at its meeting in November 2000. Inresponse, a task force, consisting of delegates to the Working Party, was formedto draft the various chapters. Prior to the drafting of the contributions,guidelines were distributed to the authors and a first, complete draft of the studywas reviewed by all the authors as well as the Steering Group of the WorkingParty. This chapter serves as an introduction and overview of OECD bondmarkets. Detailed information on countries, regions and background analysescan be found in the subsequent chapters.
II. The Development of Liquid Public Debt Markets in the OECD Area
Market-based financing of budget deficits has been a major factor behind thegrowth of the global sovereign bond market in the 1980s and 1990s. A largenumber of OECD governments adopted measures to strengthen the role of
* This study, led by Paul Malvey (US Treasury) and Hans Blommestein
(OECD), has been prepared for the Committee on Financial Markets by a taskforce consisting of the following members from the OECD Working Party onPublic Debt Management:Paul Malvey (USA), Rob Stewart (Canada), GuenterMueller and Axel Schaller (Germany), Eric Thedeen, Malin Holmlund andTord Arvidsson (Sweden), Ove Jensen (Denmark), Richard Batley and MikeWilliams (UK), Kunimasa Antoku (Japan), Peter McCray (Australia), AndrewTurner (New Zealand), Arkadiusz Kaminski (Poland), Demet Bozkurt andNilgun Pehlivan (Turkey), Margarita Martinez and Felipe Izaguirre (Mexico),P.H. Shin (Korea), and Hans Blommestein (Secretary to the Working Party).Helpful comments were also provided by the members of the Steering Group ofthe OECD Working Party on Public Debt Management.

market principles in government debt management by improving primary andsecondary market arrangements. Also, an increasing number of debt managersfrom emerging markets are emulating the best practices of their counterpartsfrom advanced markets, including financing government deficits usingmarketable debt instruments. Along with an improved infrastructure --including advanced clearing and settlement systems and modernisation of theregulatory framework -- as well as deregulation, the flow of government bondshelped to establish more liquid benchmark issues. Liquid government bondmarkets facilitated issuance also by private sector borrowers. Thus, in manycountries the larger corporate borrowers stepped-up issuance of bonds andshorter dated paper such as commercial paper. Key corporate issuers as well asnational and regional government borrowers in emerging markets becameimportant issues in the international bond markets.
Until the later part of the 1990s, government deficits in the OECD area grewstrongly. After that deficit era, , many OECD governments (with the notableexception of Japan) started to run budget surpluses or were projected to do soin the near future. Most recently, however, some surplus OECD countries haveentered a period where budget deficits are expected to return and to last for thenext few years, brought on by the recession and budgetary consequences of theterrorist attacks of September 11, 2001.This contribution provides a conciseoverview of trends and recent structural changes in the main OECD public debtmarkets. In doing so, use will be made of a unique new database on OECDgovernment debt 1.
An important part of OECD capital markets is fixed-income securities markets,which in most countries are dominated by public debt markets. Liquid publicdebt markets proved to be key for the development of corporate debt markets asthe yield curve associated with government securities markets is important forthe correct pricing of corporate bonds. Almost all OECD countries havedeveloped their fixed-income government securities markets pressed by thenecessity of financing fiscal deficits. Total outstanding debt of OECD centralgovernments amounted to around US$ 12860 billion at the end of 2000 [seeTable 1: Central Government Debt]. The 1980s trend in OECD countries toimprove the depth and liquidity of government debt instruments has continuedduring the 1990s when, on average, 84 per cent of government borrowingrequirements were met through marketable instruments [Chart 1: Marketableand non-marketable public debt instruments in OECD area 1990-2000].
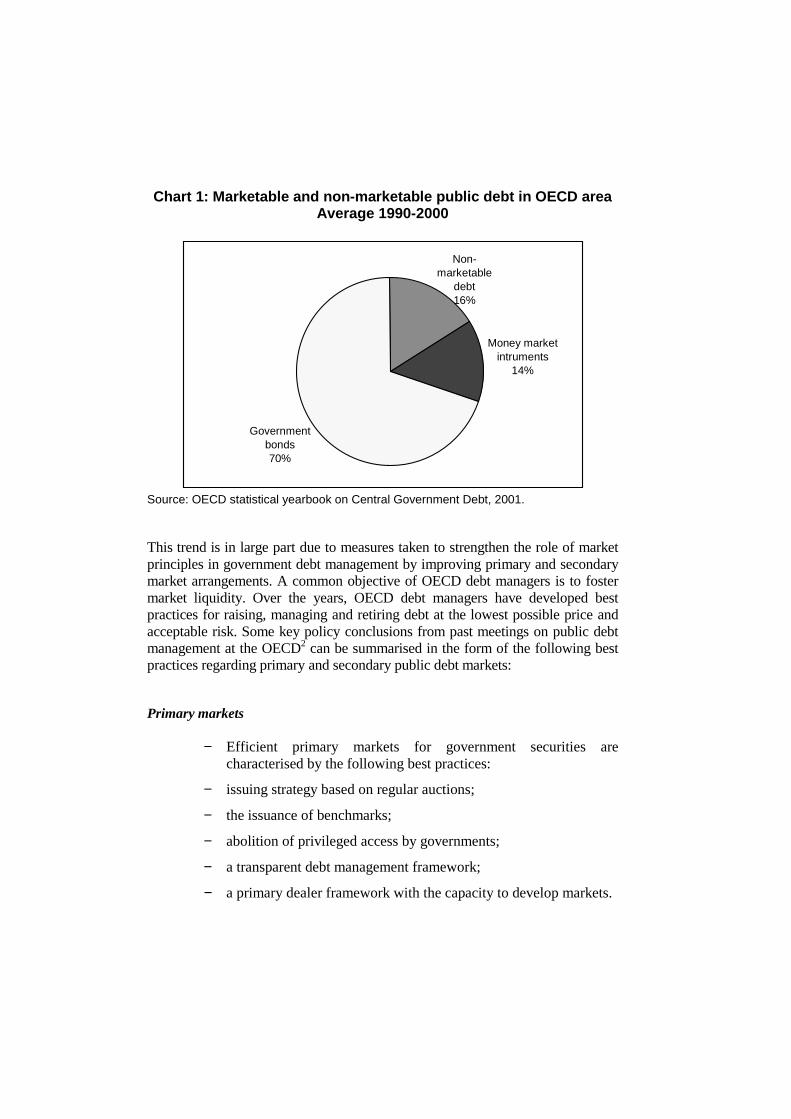
Chart 1: Marketable and non-marketable public debt in OECD areaAverage 1990-2000
Money market intruments
14%
Government bonds70%
Non-marketable
debt16%
Source: OECD statistical yearbook on Central Government Debt, 2001.
This trend is in large part due to measures taken to strengthen the role of marketprinciples in government debt management by improving primary and secondarymarket arrangements. A common objective of OECD debt managers is to fostermarket liquidity. Over the years, OECD debt managers have developed bestpractices for raising, managing and retiring debt at the lowest possible price andacceptable risk. Some key policy conclusions from past meetings on public debtmanagement at the OECD2 can be summarised in the form of the following bestpractices regarding primary and secondary public debt markets:
Primary markets
− Efficient primary markets for government securities arecharacterised by the following best practices:
− issuing strategy based on regular auctions;
− the issuance of benchmarks;
− abolition of privileged access by governments;
− a transparent debt management framework;
− a primary dealer framework with the capacity to develop markets.

Secondary Markets
− Efficient secondary government securities markets arecharacterised by the following features:
− liquid markets with a large stock of outstanding benchmark issuesand repo market financing;
− safe and sound clearing and settlement systems;
− transparent and equitable regulatory and supervisory framework;
− a market-making structure based on primary dealers;
− liquid futures markets;
− good access by foreign investors to domestic debt markets.
As a result of implementing these best practices, liquidity in OECD public debtmarkets increased significantly and a yield curve of benchmark bonds wasestablished. Also the internationalisation of domestic markets and investor basesplayed a major role in making these debt markets more efficient, liquid andtransparent. As an asset class, government securities are assessed as virtuallyfree from credit risk. These characteristics distinguish most OECD governmentdebt markets from private debt markets. As a result, government bonds havebeen increasingly used for pricing corporate debt. Market participants started touse them also for hedging operations and positioning in both duration andvolatility, as vehicles for managing liquidity, as instruments for investment, ascollateral for secured borrowing, as a base for futures market contracts, and as asafe-haven during periods of market turmoil3.
Although OECD public debt markets are considered relatively liquid, marketliquidity differs considerably across countries4. Moreover, liquidity isconcentrated in specific instruments (or markets), often at the expense ofliquidity in closely related markets. Especially in markets for assets that can actas substitutes for one another, liquidity is often concentrated in relatively fewspecific issues. For example, in public debt markets bid-ask spreads for on-the-run issues are usually much narrower than those for off-the-run issues5.
By the late 1990s, longer-term instruments accounted for the larger part ofgovernment debt [Chart 1: Marketable and non-marketable public debtinstruments in OECD area 1990-2000; Chart 2: Composition of CentralGovernment Debt in 2000] as debt managers sought to minimise re-financingrisk as well as interest risk. Although most of the instruments are fixed(nominal), an interesting development during the last few years is that a number

of governments (the United States, France) have joined a number of OECDcountries that were already issuing index-linked bonds: Australia, Canada,Iceland, New Zealand, Sweden and the United Kingdom. Also Mexico issuesindexed bonds linked to the rate of inflation. Indexed debt is issued to assistwith the overall debt management objective of raising, managing and retiringdebt at the lowest possible price and acceptable risk. Specific objectives relatedto indexed debt include an opportunity to diversify and the provision of a realrate that is useful for policy makers and market participants. However, indexedmarkets tend to be less liquid, have fewer participants and have a narrowerinvestor base than nominal markets.
III. Trends in North American debt markets
In this study this region encompasses the United States and Canada. These twocountries have some similarities, including efficient financial marketinfrastructures. Additionally, the governments of both of these countries inrecent years entered a period of fiscal surplus, which led to a decline in theamount of government debt being issued. Recently, however, the United Statesentered a period where budget deficits are expected to last for the next 2 to 3years, brought on by a recession and fiscal responses to the terrorist attacks ofSeptember 11.
Outstanding debt levels of both Canada and the United States rose during thefirst half of the 1990s, peaked in 1997, and subsequently fell for the duration ofthe decade. In Canada, the government began to run budget surplusesbeginning in 1997-98. Over the last four years, Canada’s net public debt hasfallen by C$38.5 billion. As a percentage of GDP, Canada’s net public debt hasfallen from a peak of 71.2 percent in 1997-98 to below 53 percent at the end ofthe 2000-01 fiscal year (ending in March 2001). In the United States, federalbudget deficits declined for 5 years, before a budget surplus was achieved in1998. As a percent of GDP, publicly held debt peaked in 1993 at slightly morethan 50 percent, and has since fallen to about 33 percent of GDP at the end ofFY 2001.
The primary markets for government debt of Canada and the United States bearsome resemblance to one another. Both governments maintain benchmarksecurities in 3- and 6- month treasury bills, and in 2-,5-, and 10- year securities.Canada additionally maintains a benchmark in the 30- and 1-year sectors;maturity sectors which the United States recently eliminated altogether.6 Also,both governments issue inflation-linked securities: the U.S. issues 10-yearinflation-indexed securities, while Canada issues Real Return Bonds with a 30-

year maturity. One notable dissimilarity is that, unlike the United States, Canadaalso issues foreign currency denominated securities.
Public debt plays an important role in the domestic economies of both Canadaand the United States. Government debt is used by each country’s respectivemonetary authority in carrying out monetary policy. Additionally, governmentdebt of both countries is viewed as “risk free” and is used domestically as apricing benchmark and hedging vehicle. Currently, U.S. Treasury securitiesalso play a very active role in the global financial markets and are very much indemand as the only dollar-denominated credit risk free asset available toinvestors. They are actively used for hedging purposes by underwriters,portfolio managers, arbitrageurs, swaps desks and foreign central banks, as wellas other investors and traders. At present, the United States has the deepest andmost liquid private debt securities market in the world. Its size is bigger than allother private securities markets together7.
When the issuance of government debt instruments was declining, Canada andthe United States had somewhat divergent experiences with regard to thedevelopment of surrogate pricing benchmarks. In the United States, both agencyand swaps curves are regularly used as pricing benchmarks and high-gradecorporate debt is also beginning to assume benchmark functions. In Canada, thedomestic market has not had quite the same experience. Although Canada hasfederal agencies that borrow with the full faith and credit of the Canadiangovernment, their level of activity is far less and they do not enjoy the samelevel of liquidity as Government of Canada debt. The situation is similar withCanada’s domestic swap market, which, while active, does not offer the deepand liquid investment alternative and pricing benchmark it has becomeelsewhere.
More recently, however, economic sluggishness and the fiscal response to theaftermath of the tragic events of September 11,2001 have also played a part inincreasing near-term financing needs. In Canada, projected surpluses havedeclined in size. The US government has entered a period where budget deficitsare expected for the next 2 to 3 years before forecasts for budget surplusesresume. The short-term budget situation has been affected by the recenteconomic downturn and the aftermath of the events of September 11, resultingin increased bill issuance, which in turn has helped to decrease the averagelength of the privately held marketable debt.
IV. The emergence of a pan-European public debt market
The size of debt markets in the countries of the European Union (EU) variesconsiderably, both in absolute and relative terms. Italy has the largestgovernment debt market standing at EUR 1200 billion at the end of 1999,followed by Germany, the UK and France with a market debt of around EUR650 billion. Public debt of Spain, Belgium, the Netherlands and Sweden is inthe range EUR 150-300 billion, while the debt of the other EU member states isbelow EUR 130 billion. Not surprisingly, this picture changes when thecountries are ranked in terms of the debt relative to GDP. While Belgium,Greece and Italy have a ratio of debt to GDP of more than 100 per cent,Germany has one of the lowest ratios of debt to GDP at 35 per cent.8
In the wake of the introduction of the Euro, the creation of a truly pan-European government-bond market would provide benefits similar to those ofthe US government securities market: a large and liquid market along the entireyield curve. To that end, important developments within the euro-area havebeen the conversion of the existing stock of government debt denominated inthe former domestic currencies into euro, the convergence of the composition ofdebt (by type of instrument and maturity), the co-ordination of issuingprocedures and the harmonisation of market conventions. These developmentsreflect the efforts by EU debt managers to promote liquid, transparent andefficient government-securities markets in individual countries. Increasedcompetition between EU governments to attract investors and thestandardisation of instruments and market practices also encouraged theintroduction of electronic trading platforms (Euro-MTS and BrokerTec).
But this same competition has also been mentioned as an obstacle in thecreation of an euro area-wide government debt market9. Liquidity is mostlyconcentrated in the debt instruments of the three biggest issuers (Germany,France and Italy). Consequently, a pan-European benchmark yield curve ismissing. However, the euro derivatives markets, especially the futures andinterest rate swaps markets, became quite quickly highly integrated. In theabsence of a homogeneous sovereign yield curve, the swap curve is instead usedas a reference by financial market participants.
In recent years, central-government borrowing requirements in EU countries haveshown a declining trend. Declining borrowing requirements and greatercompetition have encouraged EU countries to use buy-back and switchingoperations to concentrate their debt in fewer, larger series. The smaller euro-zonecountries have restructured their debt around a limited selection of benchmarksecurities which provide adequate liquidity to the large international investors. Inmost EU member states high priority is given to the 10-year segment, with
outstanding volumes of between EUR 5 and 24 billion, depending on theborrowing requirement of the issuer. The smallest outstanding volume of EUR 5billion corresponds to one of the criteria for participation in the electronic tradingsystem EuroMTS. There is a tendency for expansion of electronic trading at bothdomestic and European levels. This reduces the costs of trading certaingovernment bonds, and at the same time increases liquidity.
V. Trends and recent developments in the Asian-Pacific public debtmarkets
The markets for government debt in this region vary significantly, withsimilarities existing between New Zealand and Australia, while Japan showsmarked contrast.
During the 1990s, both New Zealand and Australia achieved improvements intheir fiscal situations, allowing them to reduce their levels of outstandinggovernment debt by the end of the decade. Also, during this time, bothcountries began to develop a debt portfolio of benchmark securities,concentrating issuance in relatively few securities (from 8 to 13) in order tomake their debt more liquid and desirable for investors. The volume ofoutstanding debt in New Zealand in absolute terms increased significantlybetween 1991 and 1993 before improvements in its fiscal position stabiliseddebt levels within a relatively narrow band throughout the rest of the decade. InAustralia, outstanding debt rose for most of the 1990s and peaked in 1997,before falling significantly for the remainder of the decade, again, due to animproved fiscal situation. The volumes of Australian and New Zealandgovernment bonds outstanding have been equivalent to 10 to 15 per cent ofGDP and 15 to 25 per cent of GDP, respectively, for most of the 1990s.
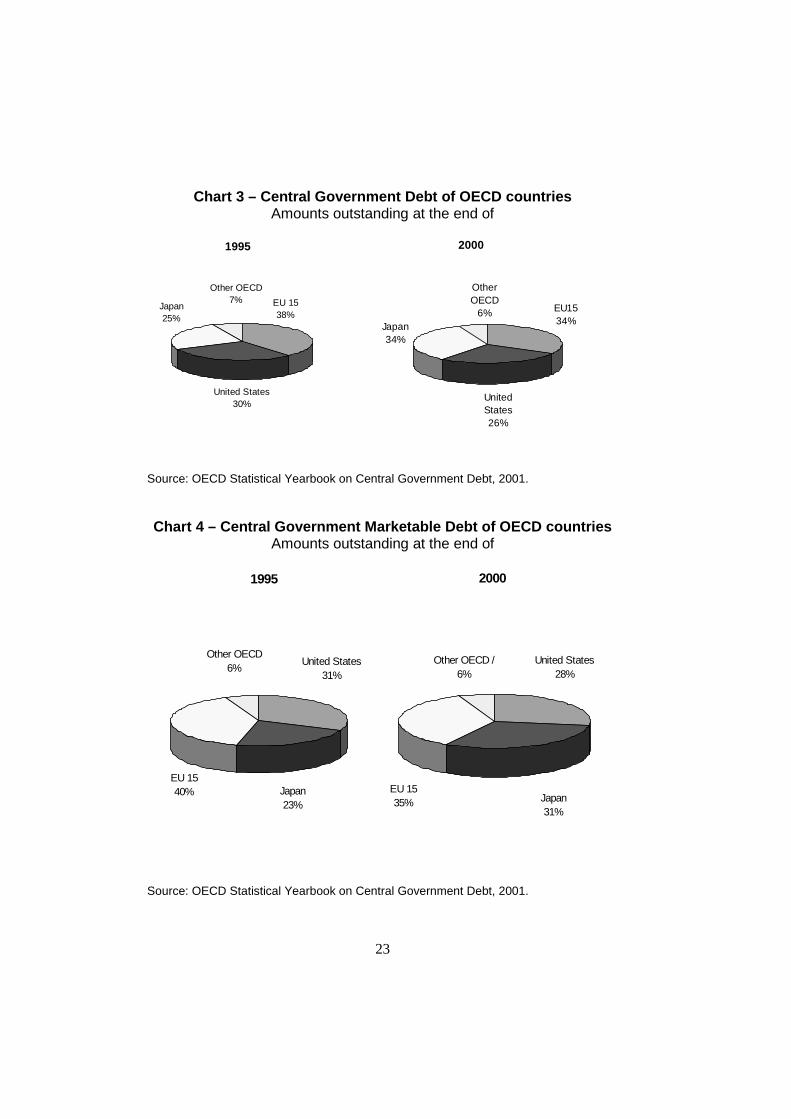
In contrast, Japan’s debt levels increased throughout the 1990s, and rose fromaround 58 percent of GDP in 1991 to around 118 percent of GDP in 1999; in2000 it stood at 104 percent of GDP. The Japanese government bond market isexpanding rapidly [Chart 3: Central Government Debt of OECD countries andChart 4: Central Government Marketable Debt of OECD countries]. In 1999,the Japanese government bond market became -- in absolute terms -- the largestin the world, with outstanding stock of central government debt of more thanUS $ 4620 billion, followed by the United States with around US $ 3665billion; In 2000, these stocks stood at US $ 4321 billion for Japan and US$3395 billion for United States. With the fiscal deficit relative to GDP projectedto remain high, Japanese bond issues are expected to account for the bulk oftotal net OECD government bond issuance in the next few years.
The primary market for debt of each country in this region has its own salientfeatures. Japan offers most of its securities via price auctions in which thecoupon, maturity and issue amount are all predetermined. In New Zealand,securities are sold through a multiple-price auction system and without thepresence of primary dealers or officially appointed market makers. In Australia,dates and amounts for its competitive auctions are not pre-announced, unlikesome other government debt issuers.
Public debt plays similar roles in all three countries. Government debt serves asa low risk instrument for investors and is used for hedging purposes. Yieldcurves provide a reference for pricing. In addition, government debt plays animportant role in the implementation of monetary policy.
With regard to the market effects and policy implications of the budgetenvironments of the three sovereign debt issuers in this region, there are manydifferences. In New Zealand, the mid-1990s brought forecasts of largesurpluses and implications of large reductions in debt issuance. Howeverreductions in outstanding debt did not materialise and current projections are forincreasing levels of outstanding Government bonds in nominal terms, althoughrelatively stable levels as a percentage of GDP. Australia, on the other hand, isin a position where gross debt elimination may be seen as quite possible in thenear term.
Japan, in contrast to New Zealand and Australia, is operating in anenvironment of budget deficits. The envisaged rapid build-up in net debt willmake debt management a key issue in Japan. This includes furtherimprovements in the infrastructure for Japanese government bonds (JGB) byeliminating the sources of fragmentation such as reform of the withholding taxregime, improvements in the clearing and settlement infrastructure and thefurther development of benchmark issues along the entire yield curve. Thesereforms would result in liquid and deep Japanese government bond markets,including a well-functioning JGB repo market. This in turn would generate anincreasing volume of government debt more palatable and more easily absorbedby foreign and domestic investors, thereby limiting the government’s financingcosts. Some changes have already been made to increase liquidity, decrease thetax burden and to smooth the maturity structure of the debt. For example,several initiatives have recently been taken to further improve the functioning ofprimary and secondary markets such as the creation of benchmarks at 30-year,five-year, and one-year maturities.
VI. Trends in emerging debt markets
The development of bond markets in different emerging regions has taken verydifferent courses, and is at different stages of development. The resulting majordifferences between individual countries make a comprehensive and consistentoverview of these markets very difficult or even impossible. Hence, the focus inpart V of this study is on the generic structural problems and policy issues thatmany of the debt managers from emerging markets are facing.
The overall stage of development in emerging markets can be characterised asfollows. Governments are the dominant issuers in all local debt markets. Mostlocal debt markets are only liquid at the short end of the market. In other words,there is a relatively well-functioning money market, but not a bond market. Afew markets have introduced a limited range of derivatives. Moreover, mostemerging fixed-income markets consist solely of public debt instruments.
In Asia, maturities of active instruments are focused on one year; exceptions aresome corporate instruments in Korea and Malaysia. Treasury bills dominate inCentral Europe. In Latin America, only Chile has been issuing for some timefixed-rate bonds with longer-term maturities. Mexico has started to issue 3-yearfixed-rate in February 2000, and, more recently, 5-year and 10-year fixed-ratebonds. (Longer-term bonds for index-linked and floating-rate bonds have beenavailable for a longer period.) In Asia, fixed-rate instruments are the mostcommon, while floating rate instruments proliferate in Central Europe and LatinAmerica.
While in Latin America and Eastern Europe, government bonds have spear-headed the establishment of the markets, in some Asian countries, the corporatesector has led the development (e.g. decrease and cessation of governmentbonds in Malaysia and Thailand before the Asian financial crisis, paralleled byan increase in the bond issues by Malaysia’s Cagamas, and Thailand’sgovernment enterprises). Another relevant characteristic that differentiates EastAsian from Latin American emerging market economies is the higher savingpropensity in East Asian countries.
Underdeveloped capital markets with a weak and inefficient infrastructure entailfinancial stability risk, higher transaction costs, a narrower financing base forenterprises, as well as higher investment risk. The higher level of uncertaintyassociated with such markets could discourage capital investment or raise thecost of capital formation. The international financial crises in 1997-1998 havebrought sharply into focus the risks and costs associated with underdevelopedfixed-income securities markets, in particular, that underdeveloped marketshave encouraged excessive reliance on foreign and domestic bank financing.

VII. Policy issues during periods of budgetary surpluses and decliningpublic debt
After the era of large budget deficits, many OECD governments started to runbudget surpluses or were projected to do so in the near future. Most recently,though, some surplus OECD countries have entered a period where budgetdeficits are expected to return and to last for the next few years. Nonetheless,after that deficit period, surpluses are expected to resume.
Surpluses reduce net borrowing requirements by governments and lead to areduction in the supply of securities on issue. Thus, in some cases in the recentpast, strong demand had encountered reduced supplies, which had resulted inshortages of selected bonds with the usual pricing anomalies.
Clearly, in case further reductions in the supply of bonds and the stock of grossdebt will materialise over the medium-term, OECD debt managers will continueto face the policy implications of lower liquidity in traditional benchmarkmarkets. As a consequence of their reduced need to borrow and the effect thishas had on some market segments, governments in a number of jurisdictionshad implemented a reduction in auction sizes and frequencies (sometimes tozero), buy-back programmes or reverse auctions and conversions (including re-issuing or re-opening). Most of these programmes are targeting less liquidoutstanding issues so as to boost overall liquidity in debt markets; for example,buy-back operations are being used to restructure the outstanding debt (mainlyto smooth the redemption profile of the debt and building up of new issues).Partly as an alternative to extensive debt buybacks, some governments mightuse their expected budget surpluses to acquire financial assets; for example, byacquiring foreign currency or government paper. For most issuers, though,details as to the volume and type of assets to be acquired have not yet beenfinalised.
The key challenge for governments with budgetary surpluses will be to managethe decline in debt in such a way that many of the benefits of deep public debtmarkets that currently exist are maintained to as large a degree as possible.Against the backdrop of budgetary surpluses, two general financial policy issuescan be distinguished.
First, there is the issue of the benefits and costs of fully paying down nationaldebt. Some debt managers have argued that complete elimination of the debt isnot desirable. This view is based on the reasoning that a minimum volume ofissuing activity is necessary to sustain the government debt marketinfrastructure and minimise future cost of borrowing, given expectations thatdeficits will return in the foreseeable future. Maintaining a minimum level of

gross debt would eliminate the costs of re-building the government bond marketinfrastructure over the next several decades — when the budgetary needs of anageing population are expected to result in an increase in net debt.
It may be necessary therefore to maintain a minimum level of liquid, grosspublic debt despite the reduction in net debt. As mentioned above, buying backless liquid issues, conversions and changing issuing calendars are being used tomaintain liquid debt markets, even when issuing volumes are decreasing. Evenif net debt would drop to zero, governments could continue to nurture smallerbut liquid debt markets by investing government surpluses in private financialassets (domestic or foreign). Some issuers have indicated the minimum level ofgross debt they consider sufficient to maintain liquidity in the government bondmarket, so as to permit to continue issuing in a few benchmark segments and forsupporting private securities markets based on government bond markets, suchas derivative markets.
Other have argued that, while there would be start-up costs associated with apossible need for re-entry of the government into the financial markets, theycould be offset by the many benefits that eliminating the publicly held debtwould yield for the economy as a whole. Eliminating the publicly held debtwill increase national saving and make more funds available for private use.Individuals should see the relative costs of mortgages, automobile and otherconsumer durable loans decline as pressures on interest rates ease. On thecorporate front, as reduced government borrowing frees up more funds for theprivate sector, the cost of capital should decline on a relative basis. Theresulting additional resources should lead to increased productivity and outputgrowth, creating increases in earnings. The government will also obviouslysave on interest costs.
Second, opinions are divided whether private debt can fulfil all the desirablefunctions of public debt. Some debt managers and other analysts argue thathigh-quality corporate securities or government-sponsored instruments cannotachieve the same status as government debt and that therefore they cannot act ina satisfactory fashion as a substitute benchmark for this risk-free rate. This inturn may hamper the proper pricing of private assets and negatively affect thedevelopment of corporate securities markets (including derivatives).
Others are of the opinion that certain classes of high-grade corporate debt couldfulfil similar functions as public debt despite (somewhat) higher credit risk.Also the curves of government-sponsored institutions and swap curves offer inthe United States widely accepted benchmarks for pricing purposes. Marketparticipants could use collateralisation techniques and/or employ implicitgovernment guarantees to upgrade certain types of private debt (thereby
reducing credit risk). This could make them a close substitute for centralgovernment debt with regard to risk characteristics. In this regard, debt issues ofgovernment-sponsored companies are bonds backed (indirectly) by privatemortgages or public sector loans, and may be seen as reasonably comparable togovernment debt. US government-sponsored institutions such as Fannie Maeand Freddie Mac enjoy a considerable funding advantage through a perceivedgovernment guarantee, while the issuers of German Pfandbriefe and FrenchObligation Fonciere seem to benefit mainly from the strict regulations and highstandards regarding their collateralisation and their excellent payment trackrecord. The issuers in these markets are increasingly emulating the bestpractices of the primary and secondary government bond markets. They areissuing on a regular basis bonds with a small set of maturities and in relativelylarge sizes in order to create liquid markets -- i.e. they are creating benchmarkbonds, sometimes by using similar selling technique such as auctions.
Finally, some analysts point out that even when the risk and liquiditycharacteristics of private (or government-sponsored) debt securities differ(somewhat) from those of government debt, they may be still able to fulfil somefunctions of the latter. Thus, in the large US corporate bond market high-quality, liquid alternative benchmarks are being established. These benchmarkissues can be used for hedging purposes and to price other private debt. Alsosome short-term liquidity and funding activities were being shifted toward high-grade, liquid alternatives to the United States Treasury bill and repo markets.However, it seems that not in all jurisdictions with budget surpluses viablesubstitutes to public debt instruments were being developed.
VIII. The growing importance of electronic trading systems
An important recent development is the impact of new electronic tradingsystems (ETS) on debt management and government securities markets. Theadvance of ETS is inevitable and will reshape the fixed income markets. Theycould improve national markets by extending access to, and awareness of, themarkets.
Various types of ETS can be distinguished, including dealer-based ones,matching systems, competitive bidding and auction systems. When choosing asystem, issues to consider include participation, market-making obligations,vendors, international alliances and consultation of primary dealers. Threetypes of primary market systems are usually distinguished: competitive biddingsystems (issuer to dealers), online selling systems (dealer to clients), and directprimary issuance systems (issuer to clients). And two types of secondary
trading systems: single and multiple (co-mingled) dealer systems (to clients),and cross-matching systems (between dealers and client to client).
This is an extremely fast-moving area in which it is not clear which businessmodel will succeed. The number and types of fixed-income ETSs are growingrapidly. Markets and governments will have to adapt to this new reality. Severalforces shaping the greater use of ETS can be observed. The first istechnological change. This is forcing globalisation of the markets, and allowingthe creation of cheaper communications networks. It is enhancing pricingengines and security, and also making the transfer of information cheaper andmore timely. A second driving force is transparency. Previously, fixed-incomemarkets were not highly transparent as dealers preferred having privilegedaccess to information. ETS improve access to information, reduce informationasymmetries, and allow market-wide integration of real-time tradinginformation. A third important driving force is cost-reduction. ETS cut resourcecosts of all parties - sales, trading and back-office. They are most attractive incommoditised securities markets such as those for government bonds whereaccess can be offered at minimal costs.
Some types of securities are traded on several electronic platforms. As a result,it is sometimes hard to assess the market penetration of ETS. However, it isclear that the OTC-market has still an important market share. This may in partbe due to impediments to market access, but also preferences play a role (e.g.for large, complex transactions, institutional investors seem to prefer to tradedirectly with dealers).
ETS are mostly focused on dealers. Institutional investors have in most cases nodirect access. It is expected that this gap will be filled by either electronicbroking systems or by customer-to-dealer systems. Intermediation will alsoremain important as ETS are not a substitute for committed dealers.
The regulatory status of the electronic trading systems varies. In some countriesthey have the status of an official (regulated) market, while in others ETS areregulated as a broker. The differences in regulatory approach raise the issue ofthe need for a level playing field. While transparency is critical, and willnaturally improve, it may need public support. Other regulatory concernsinclude access, member and market rules, and market soundness, namely thereduction of systemic and credit risks.
Another point of concern is the impact of order-driven electronic tradingplatforms on market liquidity. It has been argued that electronic order booksmay suffer from “fair weather liquidity”, that is, sufficient liquidity in normaltimes but vanishing liquidity during periods of market stress. Analysts have
pointed out that there is a tendency of limit orders, the ultimate source ofliquidity in order-driven systems, to be removed from the electronic order bookduring periods of serious market turmoil. A key policy question is whether thisvanishing liquidity is worse than the reluctance of dealers in quote-drivenmarkets to provide liquidity during periods of market stress.
It has been argued that liquidity in a wide range of financial markets may havebeen reduced by the fragmentation of trading activity associated with thegrowth of ETS10. However, the possibility of market fragmentation seemspredominantly to be related to the impact of ETS on the centralised equitymarkets. The situation is different for fixed-income markets because they arealready more decentralised than equity markets. In fact, it has been argued thatETS are pushing the development towards more centralised fixed-incomesecurities markets. The move to multi-dealer and cross-matching systems ishaving a centralising effect. This is leading to a bigger pool of liquidity.Competition for liquidity, in turn, is stimulating fewer trading systems andstrengthening the centralisation trend. This is very clear in the Euro-zone wherethe MTS electronic inter-dealer broker systems have been established, using acommon technology. Also in the United States there are incentives for dealersto concentrate liquidity in fewer trading platforms.
IX. Trends in the organisation of debt management offices
An increasing number of OECD governments are giving the operational armfor debt management greater independence. The emphasis is on more autonomyfor the execution of debt management policies by debt management offices(DMOs). This independence is therefore not the same as the autonomy given tocentral banks to set and execute (monetary) policy. Sometimes greaterautonomy takes the form of a separate DMO outside the Ministry of Finance(and Central Bank). Other countries opt for a separate entity within the Ministryof Finance (sometimes in a different geographical location) or within the centralbank.
In spite of the diversity in terms of location and other institutional features ofDMOs, there is general agreement that the agency should have sufficientautonomy from the political sphere, and that it should be principally concernedwith the operational aspects of the management of sovereign debt. There is alsounanimous agreement that the management of State debt should be clearlyseparated from the implementation of monetary policy (which is theresponsibility of the Central Bank). Otherwise debt management decisionscould be perceived to be influenced by inside information on interest ratedecisions.
More specifically, the reasons for establishing debt management offices withmore independence from both the ministry of finance (the political and fiscalpowers) and central banks are several: (1) to create clearer accountability andgreater transparency; (2) greater sophistication of financial management ingeneral and debt management in particular, given the growing emphasis on thecontrol of risk; and (3) to overcome problems of recruiting and retaining staffwith special expertise in the area of finance in a central government agency(which may be especially difficult for a ministry of finance that needs to set agood example in terms of wage restraint for other ministries).
It is especially during the last few years that we are witnessing theestablishment of an increasing number of independent debt managementoffices (DMOs) in OECD countries. In addition to Sweden (whose debt officedates back to the 18th century) and Finland (from the 19th century), there arenow such DMOs in Australia, Austria, Belgium, France, Germany, Greece,Hungary, Iceland, Ireland, the Netherlands, New Zealand, Portugal, and theUnited Kingdom.
DMOs can have additional functions to that of debt management, such as cashmanagement (an important function of the UK debt office), and themanagement of contingent liabilities (where the Swedish debt office has a longexperience). In fact, country experiences show that a range of functions, inaddition to debt management, can benefit from being executed jointly with themanagement of debt.
Lately, the trend to more autonomous DMOs is accompanied by an increasedemphasis on risk assessment and risk management. In parallel with, andsupport of, this development, governments are giving greater importance totransparency and accountability in the debt management process11
X. The use of derivatives
Derivatives have become important instruments for many sovereigns to managethe risks related to debt management operations as well as for improving theprofile of the debt. The use of these instruments by market participants adds tothe liquidity in secondary government securities markets. In general, derivativesand risk management instruments can be used by both the debt managers andmarket participants to protect the value of an investment or transform thecharacteristics of assets or liabilities into alternative, more desirable forms.
However, not all OECD debt managers participate actively or directly in thederivative market activity. For example, the Unites States introduced in 1985 its
Separate Trading of Registered Interest and Principal of Securities (STRIPS)programme. Strips are a zero-coupon Treasury derivative securities instrument.But, the United States Treasury neither issues nor sells STRIPS directly toinvestors. Although United States Treasury derivative contracts are activelytraded over the counter and on organised exchanges, it is the exchanges, bonddealers and investors that are directly involved in issuing, buying or sellingthem.
Futures and forward contracts provide the ability to hedge risks. Alsooptions have become indispensable risk management tools. The generallystrong correlation between yields on sovereigns and on private debt securitiesmeans that government securities can be used to hedge general interest raterisks. A special type of forward transaction is the when-issued market, wheregovernment securities are sold before and immediately following the auctions,but before settlement. As dealers can distribute primary issues before theirparticipation in the auction, this contributes to deepen the primary market. Alsothe functioning of the secondary market can be improved by opening newavenues for pre-auction distribution and encouragement of price discoveryleading into auctions.
Also STRIPS can be used to improve the functioning of primary and secondarydebt markets Currently, many debt managers in the OECD are using them. Byseparating future coupon payments and principal payment at maturity from atreasury bond, investors can purchase separate series of coupon payments orprincipal separately. This feature of strips is creating more demand forgovernment securities because by buying them some institutional investors (e.g.pension funds) can generate a stream of future cash flows that matches bettertheir liabilities.
Swaps are simple but important tools of risk management, which have longbeen used by debt managers. For example, in Denmark the central governmenthas been using swaps to reduce the costs of borrowing, and to manage thecurrency composition and interest rate risk on the stock of debt. Canada isregularly using cross-currency swaps of domestic obligations as part of itsmanagement of international reserves.
An important policy issue for debt managers and market participants is therelationship of market liquidity between the cash and derivative markets forpublic debt instruments, especially the use of futures and swaps for trading andhedging purposes. There are two important types of links12. The first link isbased on a complementary effect, whereby liquidity in the two markets tendsto be positively related, with trading in the cash market leading to more hedgingactivities in the futures market. The second link follows from the situation that

cash issues (especially benchmarks) and futures contracts may act assubstitutes for each other, because both markets reflect the same underlyingrisks. In that situation, liquidity would be inversely related in the two markets.There is evidence that both effects are present within the public debt markets ofindividual countries13. For example, in the United States cash-market volumetends to decline as maturity increases, while the opposite is true for the tradingvolume in futures markets. In Canada, volume measures in the two cash andfutures markets are positively correlated. After the introduction in Japan of afutures market on the Tokyo Stock Exchange, short-term trading shifted fromthe 10-year benchmark to the corresponding futures market.
Recent structural developments in the cash markets are having an importantimpact on derivative markets. In the United States cash market the benchmarkstatus shifted from the 30-year bond to the 10-year note. As a result, positions in10-year note futures now exceed positions in 30-year bond futures14. There isalso evidence that participants in United States markets are relying increasinglyon futures contracts on government-sponsored agency paper and LIBOR-basedOTC interest rate swaps. As mentioned above, this development is mirroringthe recent trend that cash instruments such as government-sponsored agencypaper and bank deposits have begun to replace United States Treasury paper insome roles.
Large imbalances between activities in cash and futures markets positions maycreate the potential for market manipulations. For example, the introduction ofthe euro accentuated the disproportion between the broad use of the 10-yearGerman bond futures for risk management purposes in the euro-zone and therelatively narrow basis of the underlying on-the-run cash bonds. This has led toseveral market squeezes, the last one in March 200115.
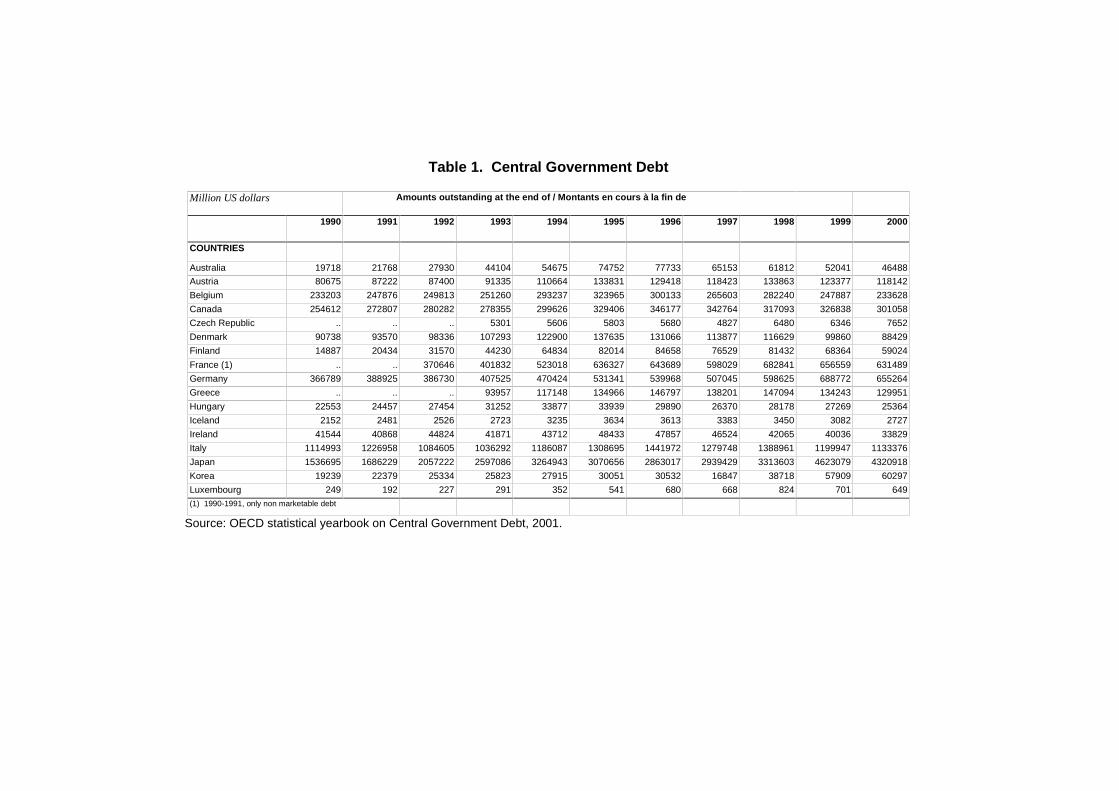
Table 1. Central Government Debt
Million US dollars Amounts outstanding at the end of / Montants en cours à la fin de
1990 1991 1992 1993 1994 1995 1996 1997 1998 1999 2000
COUNTRIES
Australia 19718 21768 27930 44104 54675 74752 77733 65153 61812 52041 46488
Austria 80675 87222 87400 91335 110664 133831 129418 118423 133863 123377 118142
Belgium 233203 247876 249813 251260 293237 323965 300133 265603 282240 247887 233628
Canada 254612 272807 280282 278355 299626 329406 346177 342764 317093 326838 301058
Czech Republic .. .. .. 5301 5606 5803 5680 4827 6480 6346 7652
Denmark 90738 93570 98336 107293 122900 137635 131066 113877 116629 99860 88429
Finland 14887 20434 31570 44230 64834 82014 84658 76529 81432 68364 59024
France (1) .. .. 370646 401832 523018 636327 643689 598029 682841 656559 631489
Germany 366789 388925 386730 407525 470424 531341 539968 507045 598625 688772 655264
Greece .. .. .. 93957 117148 134966 146797 138201 147094 134243 129951
Hungary 22553 24457 27454 31252 33877 33939 29890 26370 28178 27269 25364
Iceland 2152 2481 2526 2723 3235 3634 3613 3383 3450 3082 2727
Ireland 41544 40868 44824 41871 43712 48433 47857 46524 42065 40036 33829
Italy 1114993 1226958 1084605 1036292 1186087 1308695 1441972 1279748 1388961 1199947 1133376
Japan 1536695 1686229 2057222 2597086 3264943 3070656 2863017 2939429 3313603 4623079 4320918
Korea 19239 22379 25334 25823 27915 30051 30532 16847 38718 57909 60297
Luxembourg 249 192 227 291 352 541 680 668 824 701 649
(1) 1990-1991, only non marketable debt
Source: OECD statistical yearbook on Central Government Debt, 2001.
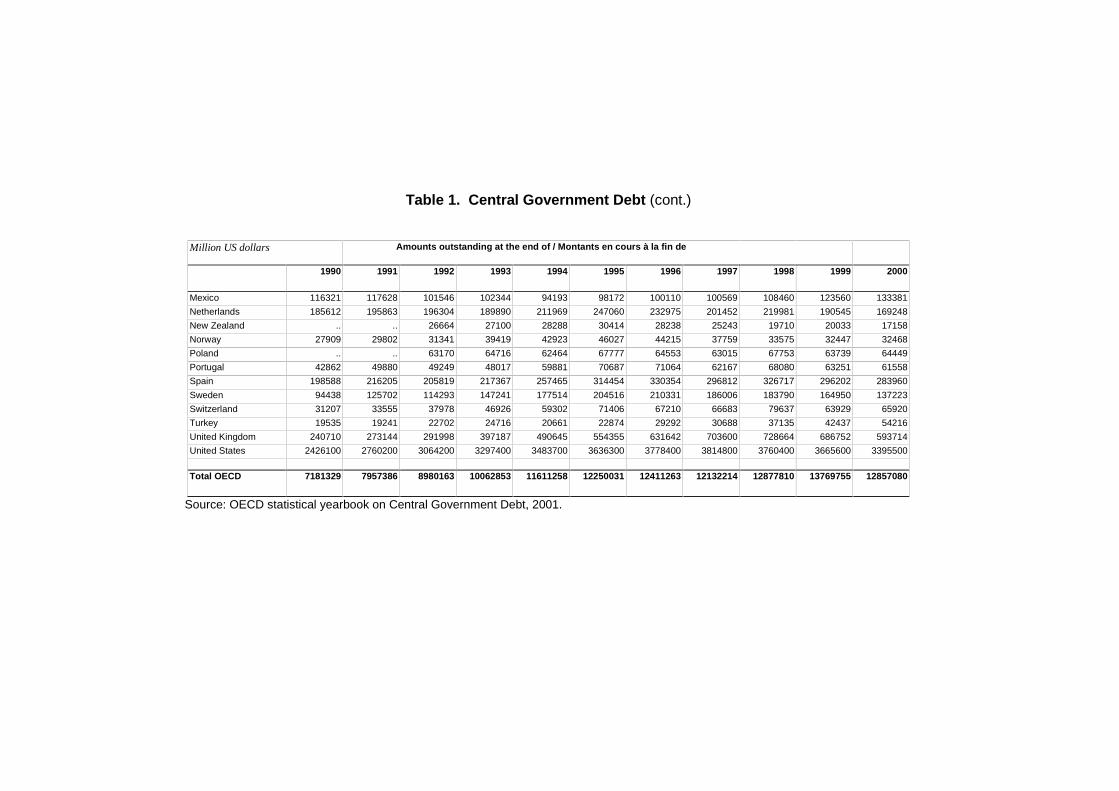
Table 1. Central Government Debt (cont.)
Million US dollars Amounts outstanding at the end of / Montants en cours à la fin de
1990 1991 1992 1993 1994 1995 1996 1997 1998 1999 2000
Mexico 116321 117628 101546 102344 94193 98172 100110 100569 108460 123560 133381
Netherlands 185612 195863 196304 189890 211969 247060 232975 201452 219981 190545 169248
New Zealand .. .. 26664 27100 28288 30414 28238 25243 19710 20033 17158
Norway 27909 29802 31341 39419 42923 46027 44215 37759 33575 32447 32468
Poland .. .. 63170 64716 62464 67777 64553 63015 67753 63739 64449
Portugal 42862 49880 49249 48017 59881 70687 71064 62167 68080 63251 61558
Spain 198588 216205 205819 217367 257465 314454 330354 296812 326717 296202 283960
Sweden 94438 125702 114293 147241 177514 204516 210331 186006 183790 164950 137223
Switzerland 31207 33555 37978 46926 59302 71406 67210 66683 79637 63929 65920
Turkey 19535 19241 22702 24716 20661 22874 29292 30688 37135 42437 54216
United Kingdom 240710 273144 291998 397187 490645 554355 631642 703600 728664 686752 593714
United States 2426100 2760200 3064200 3297400 3483700 3636300 3778400 3814800 3760400 3665600 3395500
Total OECD 7181329 7957386 8980163 10062853 11611258 12250031 12411263 12132214 12877810 13769755 12857080
Source: OECD statistical yearbook on Central Government Debt, 2001.
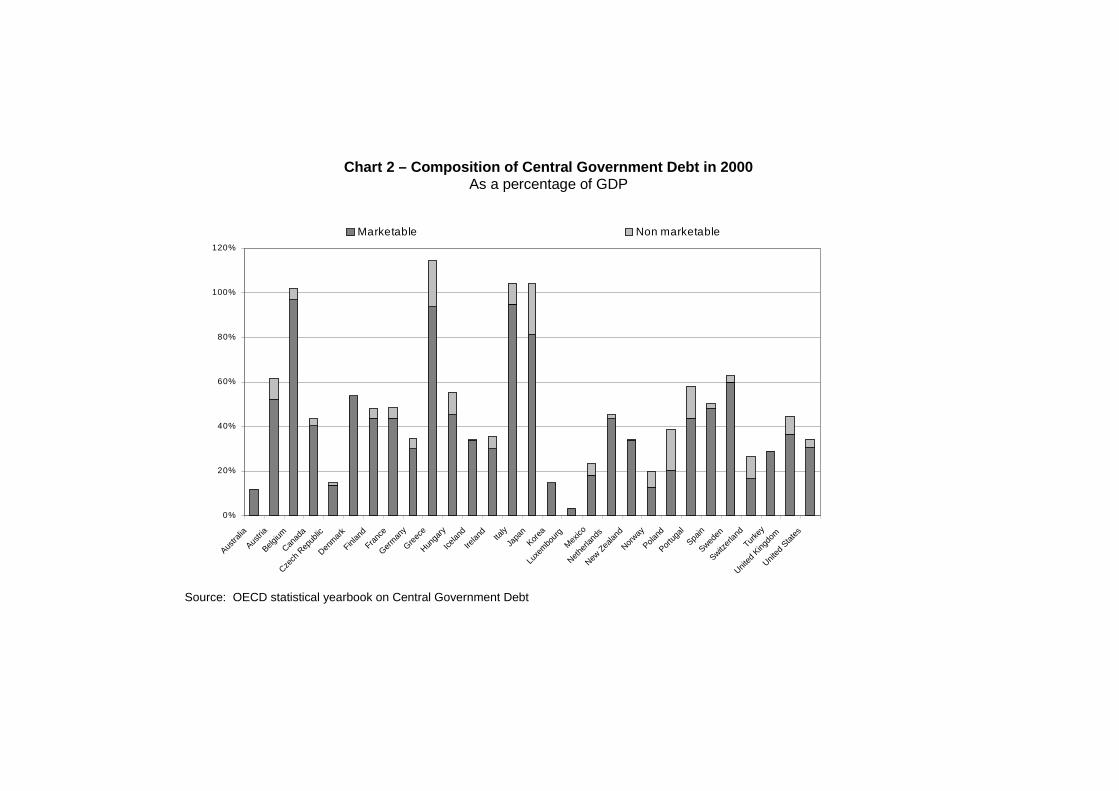
Chart 2 – Composition of Central Government Debt in 2000As a percentage of GDP
0%
20%
40%
60%
80%
100%
120%
Austra
lia
Aus
tria
Belgium
Canad
a
Czech
Rep
ublic
Denm
ark
Finlan
d
Fra
nce
Germ
any
Gre
ece
Hunga
ry
Ice
land
Irelan
d
Ita
ly
Japa
n
Kor
ea
Luxe
mbo
urg
Mex
ico
Nethe
rland
s
New Z
ealan
d
Nor
way
Pola
nd
Por
tuga
l
Spain
Swed
en
Switzer
land
Turke
y
United
King
dom
United
Stat
es
Marketable Non marketable
Source: OECD statistical yearbook on Central Government Debt
23
Chart 3 – Central Government Debt of OECD countriesAmounts outstanding at the end of
2000
United States 26%
EU1534%
Other OECD
6%Japan 34%
1995
Other OECD 7%
Japan25%
EU 1538%
United States30%
Source: OECD Statistical Yearbook on Central Government Debt, 2001.
Chart 4 – Central Government Marketable Debt of OECD countriesAmounts outstanding at the end of
1995
Other OECD6%
United States 31%
Japan23%
EU 1540%
2000
Other OECD /6%
United States28%
Japan31%
EU 1535%
Source: OECD Statistical Yearbook on Central Government Debt, 2001.
24
1 The new OECD publication, Central Government Debt: Statistical Yearbook, provides comparative
statistics on marketable and non-marketable debt of OECD central governments. This means that the debtof state and local governments, as well as social security funds, are not included. Statistics are derived fromnational sources based on a questionnaire prepared under the auspices of the OECD Working Party onPublic Debt Management. Concepts and definitions are based, when possible, on the System of NationalAccounts. The reader is referred to the new publication for additional information on institutional coverageand method of calculation and to take note of the methodological country notes that provide a unique anddetailed overview of the various debt instruments in each country.
2 This work started in a specialised forum at the OECD in 1979. In that year the OECD Working Party onDebt Management was set up as a special working group of the OECD’s Committee on Financial Markets.Since its creation, the Working Party has been a unique policy forum for government debt managers andexperts from OECD Member countries to exchange their views and experiences in the field of governmentdebt management and government securities markets. Over the years, the Working Party has compiled acomprehensive pool of knowledge on best practices in this special field of government activity and policy.Information about the best practices for primary and secondary markets has also been shared with debtmanagers from emerging market economies. To that end, the Working Party initiated in 1990 a policydialogue with transition countries and, later on, with emerging markets in several regional and globalpolicy forums, including the Annual OECD/World Bank Workshop on the Development of Fixed-IncomeSecurities Markets in Emerging Market Economies, the OECD’s Annual Baltic-Nordic Forum on PublicDebt Management, and the Annual OECD Meeting on Government Securities Markets and Public DebtManagement in Emerging Markets.
3 In recent history, during periods of severe international (or regional) financial market turmoil, investorshave traditionally fled to the United States Treasury market. The emergence of a pan-European public debtmarket raises the possibility that an alternative, international safe-haven would become available.
4 BIS, Market Liquidity: Research Findings and Selected Policy Implications, Committee on the GlobalFinancial System, 3 May 1999.
5 BIS, Market Liquidity: Research Findings and Selected Policy Implications, Committee on the GlobalFinancial System, 3 May 1999.
6 The US Treasury sold marketable fixed-rate and inflation-indexed bonds prior to its announcement onOctober 31,2001 that new sales of all 30-year Treasury bonds were being suspended.
7 IMF International Capital Markets 2001.
8 These data concern central-government debt, and not the debt of the general-government sector as definedin the EU Treaty.
9 IMF International Capital Markets 2001.
10 See BIS, (2001), The Implications of Electronic Trading in Financial Markets, Report by Committee on theGlobal Financial System.
11 For details, see upcoming OECD publication, Public Debt Management and Government SecuritiesMarkets in the 21st Century

25
12 BIS, Market Liquidity: Research Findings and Selected Policy Implications, Committee on the Global
Financial System, 3 May 1999..
13 BIS, Market Liquidity: Research Findings and Selected Policy Implications, Committee on the GlobalFinancial System, 3 May 1999.
14 IMF International Capital Markets 2001.
15 See IMF International Capital Markets 2001 for a description of the mechanics of this squeeze.