Embed Size (px)
Citation preview
Introduction and Measurement IssuesEcon 3102
Canhui Hong
University of Minnesota
Fall 2015
Canhui Hong (UofM) Introduction and Measurement Issues Fall 2015 1 / 28

Chapter 1 - Topics
What is Macroeconomics?
GDP, economic growth, business cycles
Macroeconomic models
Understanding recent and current macroeconomics events
Canhui Hong (UofM) Introduction and Measurement Issues Fall 2015 2 / 28

What is Macroeconomics?
Macroeconomics is the study of the behavior of large collections of
economic agents
I aggregate behavior of consumers and �rmsI behavior of governmentsI overall level of economic activity in individual countriesI e�ects of �scal and monetary policy
Important phenomena:
I long-run growth: increase in a nation's productive capacity and averagestandard of living that occurs over a long period of time
I business cycles: short-run ups and downs in aggregate economic activity
Canhui Hong (UofM) Introduction and Measurement Issues Fall 2015 3 / 28
Gross Domestic Product, Economic Growht and BusinessCycles
Gross Domestic Product (GDP): quantity of goods and services
produced within a country's borders over a particular period of time
Time series of GDP can be separated into trend and business cycle
components
Canhui Hong (UofM) Introduction and Measurement Issues Fall 2015 4 / 28
Per Capita Real GDP (in 2005 Dollars)
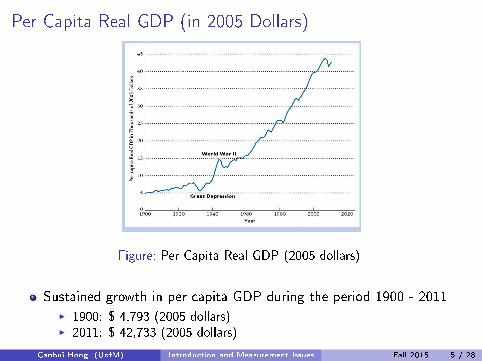
Figure: Per Capita Real GDP (2005 dollars)
Sustained growth in per capita GDP during the period 1900 - 2011I 1900: $ 4,793 (2005 dollars)I 2011: $ 42,733 (2005 dollars)
Canhui Hong (UofM) Introduction and Measurement Issues Fall 2015 5 / 28
Per Capita Real GDP (in 2005 Dollars)
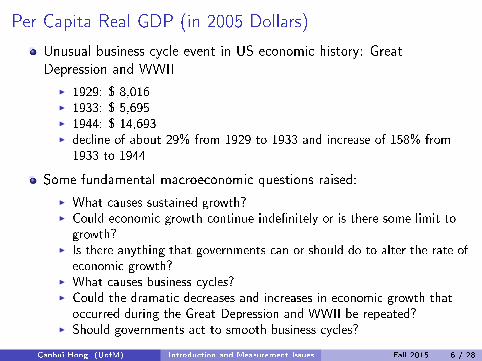
Unusual business cycle event in US economic history: Great
Depression and WWII
I 1929: $ 8,016I 1933: $ 5,695I 1944: $ 14,693I decline of about 29% from 1929 to 1933 and increase of 158% from1933 to 1944
Some fundamental macroeconomic questions raised:
I What causes sustained growth?I Could economic growth continue inde�nitely or is there some limit togrowth?
I Is there anything that governments can or should do to alter the rate ofeconomic growth?
I What causes business cycles?I Could the dramatic decreases and increases in economic growth thatoccurred during the Great Depression and WWII be repeated?
I Should governments act to smooth business cycles?
Canhui Hong (UofM) Introduction and Measurement Issues Fall 2015 6 / 28
Real GDP Per Capita - Natural Logarithm
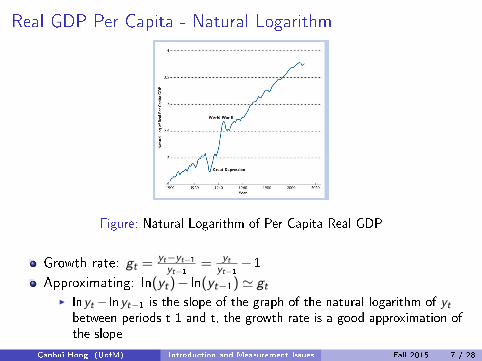
Figure: Natural Logarithm of Per Capita Real GDP
Growth rate: gt =yt−yt−1yt−1
= ytyt−1−1
Approximating: ln(yt)− ln(yt−1)' gtI lnyt − lnyt−1 is the slope of the graph of the natural logarithm of ytbetween periods t-1 and t, the growth rate is a good approximation ofthe slope
Canhui Hong (UofM) Introduction and Measurement Issues Fall 2015 7 / 28
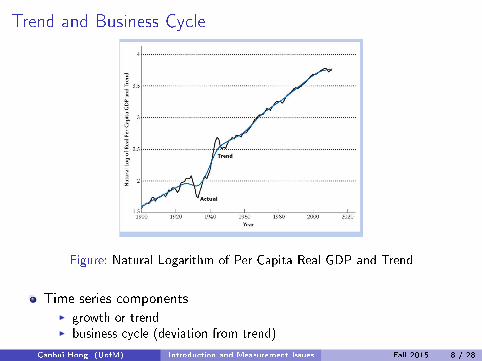
Trend and Business Cycle
Figure: Natural Logarithm of Per Capita Real GDP and Trend
Time series componentsI growth or trendI business cycle (deviation from trend)
Canhui Hong (UofM) Introduction and Measurement Issues Fall 2015 8 / 28
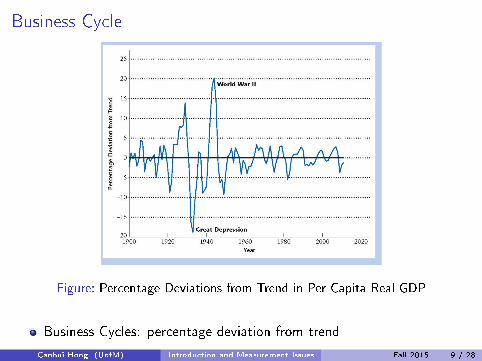
Business Cycle
Figure: Percentage Deviations from Trend in Per Capita Real GDP
Business Cycles: percentage deviation from trend
Canhui Hong (UofM) Introduction and Measurement Issues Fall 2015 9 / 28
Macroeconomic Models
It is not possible to run macroeconomic experiments
A macroeconomic model captures the essential features of the world
needed to analyze a particular macroeconomic problem
It should be simple, but they need not be realistic
Approach: build up macroeconomic analysis from microeconomic
principles
Basic structure of a macroeconomic model:
I consumers and �rmsI set of goods that consumers consumeI consumer's preferencesI production technologyI resources available
Canhui Hong (UofM) Introduction and Measurement Issues Fall 2015 10 / 28

Recent and Current Macroeconomic Events
Aggregate productivity
Unemployment and vacancies
Taxes, government spending and government de�cit
In�ation
Interest rates
Business Cycles in the US
Credit markets and the �nancial crisis
Current account surplus
Canhui Hong (UofM) Introduction and Measurement Issues Fall 2015 11 / 28
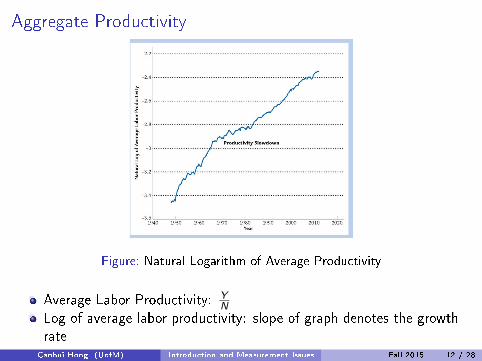
Aggregate Productivity
Figure: Natural Logarithm of Average Productivity
Average Labor Productivity: YN
Log of average labor productivity: slope of graph denotes the growth
rateCanhui Hong (UofM) Introduction and Measurement Issues Fall 2015 12 / 28
Unemployment Rate
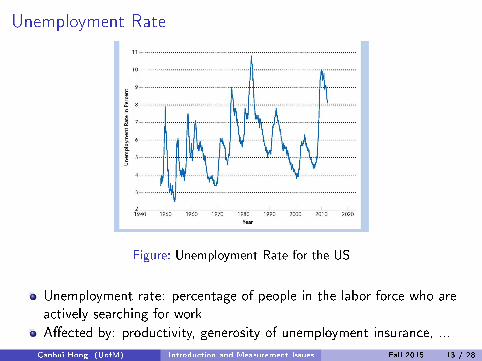
Figure: Unemployment Rate for the US
Unemployment rate: percentage of people in the labor force who are
actively searching for work
A�ected by: productivity, generosity of unemployment insurance, ...
Canhui Hong (UofM) Introduction and Measurement Issues Fall 2015 13 / 28
Unemployment: Beveridge Curve
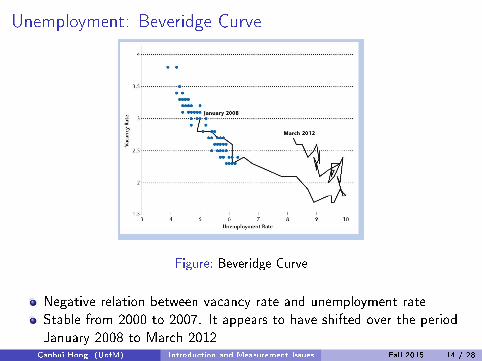
Figure: Beveridge Curve
Negative relation between vacancy rate and unemployment rate
Stable from 2000 to 2007. It appears to have shifted over the period
January 2008 to March 2012Canhui Hong (UofM) Introduction and Measurement Issues Fall 2015 14 / 28
Taxes, Gov Spending and Gov De�cit
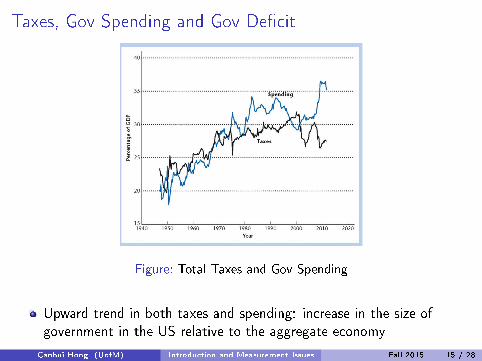
Figure: Total Taxes and Gov Spending
Upward trend in both taxes and spending: increase in the size of
government in the US relative to the aggregate economy
Canhui Hong (UofM) Introduction and Measurement Issues Fall 2015 15 / 28
Total Government Surplus
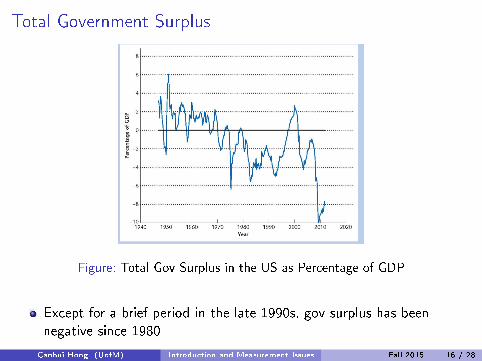
Figure: Total Gov Surplus in the US as Percentage of GDP
Except for a brief period in the late 1990s, gov surplus has been
negative since 1980
Canhui Hong (UofM) Introduction and Measurement Issues Fall 2015 16 / 28
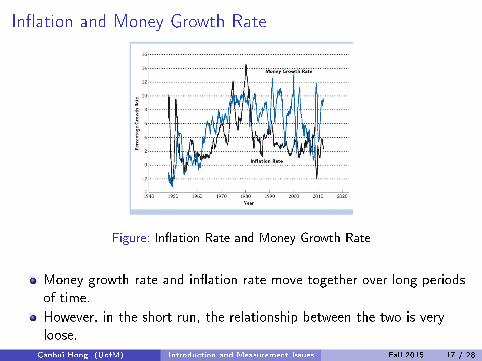
In�ation and Money Growth Rate
Figure: In�ation Rate and Money Growth Rate
Money growth rate and in�ation rate move together over long periods
of time.
However, in the short run, the relationship between the two is very
loose.Canhui Hong (UofM) Introduction and Measurement Issues Fall 2015 17 / 28
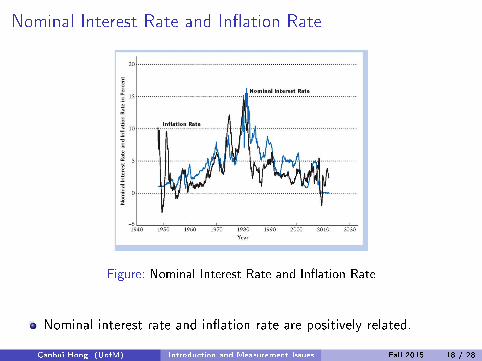
Nominal Interest Rate and In�ation Rate
Figure: Nominal Interest Rate and In�ation Rate
Nominal interest rate and in�ation rate are positively related.
Canhui Hong (UofM) Introduction and Measurement Issues Fall 2015 18 / 28
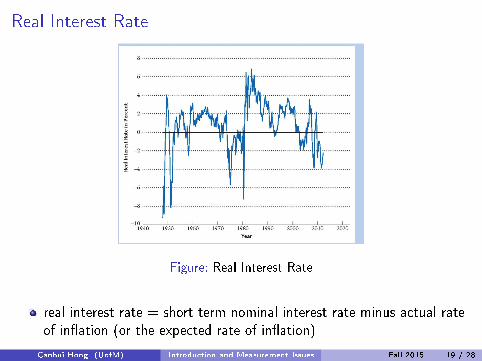
Real Interest Rate
Figure: Real Interest Rate
real interest rate = short term nominal interest rate minus actual rate
of in�ation (or the expected rate of in�ation)
Canhui Hong (UofM) Introduction and Measurement Issues Fall 2015 19 / 28
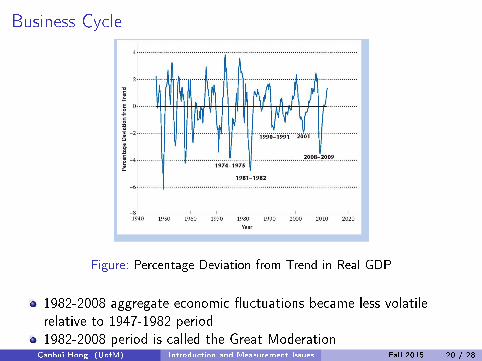
Business Cycle
Figure: Percentage Deviation from Trend in Real GDP
1982-2008 aggregate economic �uctuations became less volatile
relative to 1947-1982 period
1982-2008 period is called the Great ModerationCanhui Hong (UofM) Introduction and Measurement Issues Fall 2015 20 / 28
Credit Markets and Financial Crisis
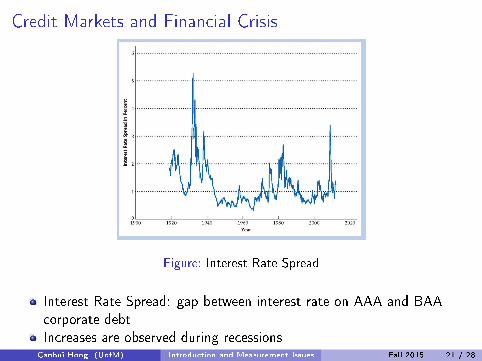
Figure: Interest Rate Spread
Interest Rate Spread: gap between interest rate on AAA and BAA
corporate debt
Increases are observed during recessionsCanhui Hong (UofM) Introduction and Measurement Issues Fall 2015 21 / 28
Credit Markets and Financial Crisis
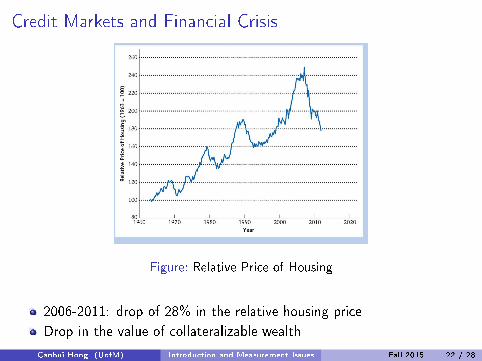
Figure: Relative Price of Housing
2006-2011: drop of 28% in the relative housing price
Drop in the value of collateralizable wealth
Canhui Hong (UofM) Introduction and Measurement Issues Fall 2015 22 / 28
Current Account Surplus
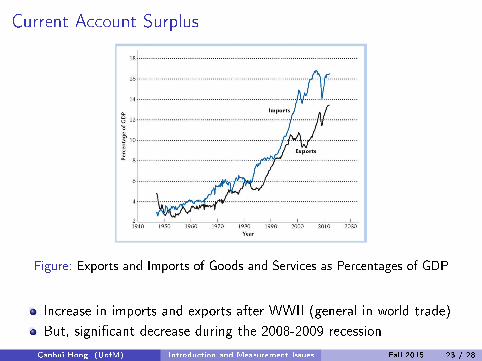
Figure: Exports and Imports of Goods and Services as Percentages of GDP
Increase in imports and exports after WWII (general in world trade)
But, signi�cant decrease during the 2008-2009 recession
Canhui Hong (UofM) Introduction and Measurement Issues Fall 2015 23 / 28
Current Account Surplus
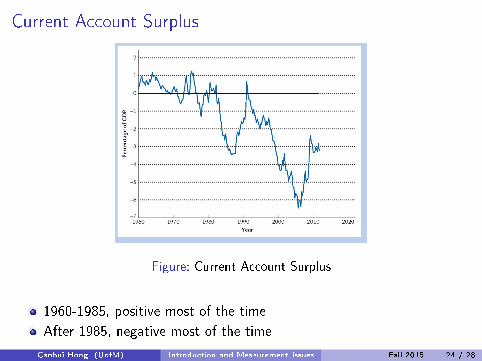
Figure: Current Account Surplus
1960-1985, positive most of the time
After 1985, negative most of the time
Canhui Hong (UofM) Introduction and Measurement Issues Fall 2015 24 / 28
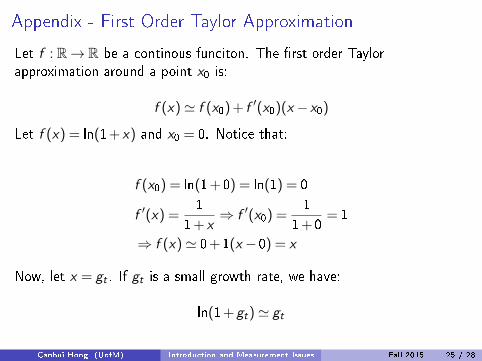
Appendix - First Order Taylor Approximation
Let f : R→ R be a continous funciton. The �rst order Taylor
approximation around a point x0 is:
f (x)' f (x0)+ f ′(x0)(x−x0)
Let f (x) = ln(1+ x) and x0 = 0. Notice that:
f (x0) = ln(1+0) = ln(1) = 0
f ′(x) =1
1+ x⇒ f ′(x0) =
1
1+0= 1
⇒ f (x)' 0+1(x−0) = x
Now, let x = gt . If gt is a small growth rate, we have:
ln(1+gt)' gt
Canhui Hong (UofM) Introduction and Measurement Issues Fall 2015 25 / 28
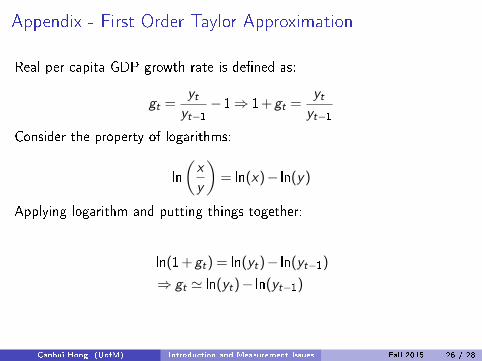
Appendix - First Order Taylor Approximation
Real per capita GDP growth rate is de�ned as:
gt =ytyt−1
−1⇒ 1+gt =ytyt−1
Consider the property of logarithms:
ln
(x
y
)= ln(x)− ln(y)
Applying logarithm and putting things together:
ln(1+gt) = ln(yt)− ln(yt−1)
⇒ gt ' ln(yt)− ln(yt−1)
Canhui Hong (UofM) Introduction and Measurement Issues Fall 2015 26 / 28
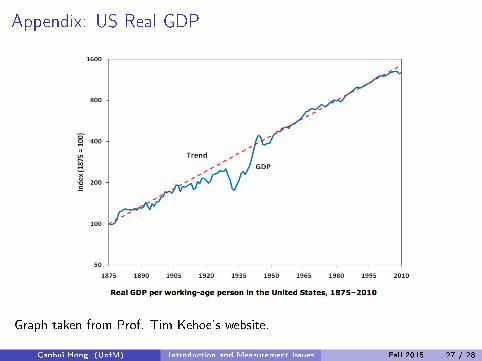
Appendix: US Real GDP
Graph taken from Prof. Tim Kehoe's website.
Canhui Hong (UofM) Introduction and Measurement Issues Fall 2015 27 / 28

Appendix
The graphs were taken from Williamson's book slides. The graphs are also
in Chapter 1.
Canhui Hong (UofM) Introduction and Measurement Issues Fall 2015 28 / 28