Embed Size (px)
Citation preview

INTRODUCTION ABOUT INTRODUCTION ABOUT TEXTILE & GARMENT,TEXTILE & GARMENT,AGRICULTURE, FORESTRY AGRICULTURE, FORESTRY & FISHERY SECTORS IN & FISHERY SECTORS IN VIETNAMVIETNAM
Presented by: Mr. Ly Quoc HungPresented by: Mr. Ly Quoc HungDirector General of South West Asia & Africa Market Director General of South West Asia & Africa Market Department, Ministry of Industry and Trade of Viet Department, Ministry of Industry and Trade of Viet
NamNam
Ha Noi, 5 November 2012Ha Noi, 5 November 2012

Contents:Contents:
I. TEXTILE & I. TEXTILE & GARMENT SECTORGARMENT SECTOR
II. AGRICULTURE, II. AGRICULTURE, FORESTRY & FORESTRY & FISHERY SECTORSFISHERY SECTORS

I. TEXTILE & GARMENT SECTORI. TEXTILE & GARMENT SECTOR1. Number of enterprises (2011)1. Number of enterprises (2011)
* Enterprises : over 3,710 of which:* Enterprises : over 3,710 of which:- SOE : 0.5%SOE : 0.5%- Joint Stock and Limited Company: Joint Stock and Limited Company:
77%77%- FDI and Co-operates: 22.5%FDI and Co-operates: 22.5%
* Labor force: app. 2.5 million* Labor force: app. 2.5 million
2. Number of enterprises by 2. Number of enterprises by location location
The red river Delta 27%
Northern Midland & Mountainous Area 3%
Northern Central Area & Central Coastal Area 7%
Highland 1%
South - East Area 58%
The Mekong River Delta 4%

3. Number of enterprises by production 3. Number of enterprises by production fieldfield
Spinning 6%
Weaving 17%
Dyeing 4%
Garment 70%
Supporting Industry 3%
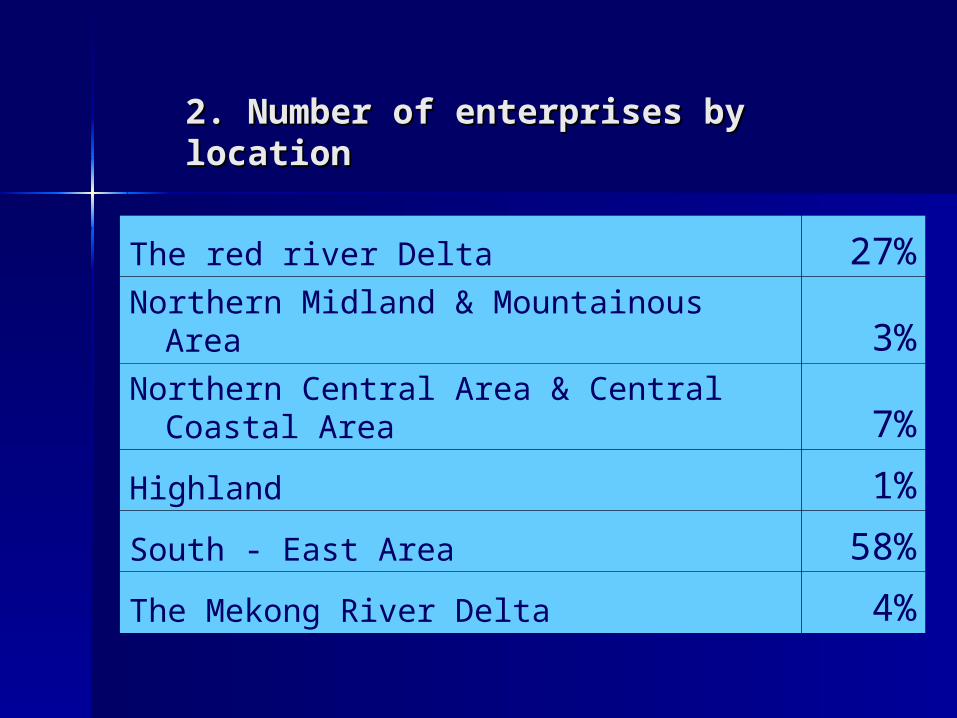
4. Production capacity (2009)4. Production capacity (2009)
SectorNo. of
EnterprisesNo. of
MachineriesAnnual capacity
1. Upstream
Cotton ginning 60,000 tons
Spinning 145 units 3,789,000 spindles 350,000 tons
2. Midstream
Weaving 401 units 21,800 units 1,000 mil M2
Knitting 105 units 3,800 units 200,000 tons
Non-woven 7 units 5,000 tons
Dyeing and Finishing 94 units 1,109 units 700 mil. M2
3. Downstream
Garment 2,424 units 918,700 units 2,400 mil. units
Terry towel 62,000 tons

5. FDI 5. FDI
FDI: 485 FDI projects registered, FDI: 485 FDI projects registered, total capital worth USD 2 billion total capital worth USD 2 billion between 2007-2012between 2007-2012
FDI enterprises account for 60% FDI enterprises account for 60% of Viet Nam’s textile & apparel of Viet Nam’s textile & apparel export during first 9 months 2012export during first 9 months 2012

6. Viet Nam’s textile & garment 6. Viet Nam’s textile & garment ExportExport
Viet Nam is: Viet Nam is:
among world’s top seven exporters of among world’s top seven exporters of textile & appareltextile & apparel
22ndnd largest supplier of textile & apparel to largest supplier of textile & apparel to USAUSA
Export volume in 2011: USD 15.8 billion, Export volume in 2011: USD 15.8 billion, increased 26% as compared to that of 2010increased 26% as compared to that of 2010
Key export markets: USA (50%), EU, JapanKey export markets: USA (50%), EU, Japan
New markets: Korea, Taiwan, Middle East, New markets: Korea, Taiwan, Middle East, Singapore, China, TurkeySingapore, China, Turkey

7. Export market structure7. Export market structure
USA55%
EU18%
Japan11%
ASEAN2%
Korea3%
Taiwan2%
Others9% USA
EUJapanASEANKoreaTaiwanOthers

8. Main buyers of Viet Nam’s 8. Main buyers of Viet Nam’s textile and garment productstextile and garment products
• EUEU: Seidenstickers, A&A, Otto, Karstadt : Seidenstickers, A&A, Otto, Karstadt
Quelle, Marks and Spencers, Casino, Jacque, Quelle, Marks and Spencers, Casino, Jacque, Britt, Camel, Pierre Cardin, adams, Next, Britt, Camel, Pierre Cardin, adams, Next, Kickers, Steilmann, Zara, El Corte, Mango, Kickers, Steilmann, Zara, El Corte, Mango, H&M, Puma, Alain Delon…H&M, Puma, Alain Delon…
• USA:USA: Philip Van Heusen, The Gap, JC Penney, Philip Van Heusen, The Gap, JC Penney, AMC, Express, Perry Ellis, Liz Claiborne, Nike, AMC, Express, Perry Ellis, Liz Claiborne, Nike, Target, Limited, Supreme, Tommy Hilfigers...Target, Limited, Supreme, Tommy Hilfigers...
• JapanJapan: Itochu, Mitsui, Nissho Iwai, Kamata, : Itochu, Mitsui, Nissho Iwai, Kamata, Marubeni, Aeon, Seikyo, Mitsu Koshi, Ceicil, Marubeni, Aeon, Seikyo, Mitsu Koshi, Ceicil, Katakura…Katakura…

9. Vietnam’s textile and apparel 9. Vietnam’s textile and apparel export export by categories in 2009by categories in 2009
Other14.74% Knitted Shirts
23.14%
Pants and Shorts20.82%
Jackets and Coats18.42%
Woven Shirts5.51%
Children wear3.40%
Fabric3.96%
Swim wear0.70%
Sleep wear1.15%
Sport wear1.38%
Skirts4.01%
Underwear2.76%

10. Benefits from FTA agreemetns10. Benefits from FTA agreemetns
FTAs already signed:FTAs already signed:– ASEAN-South Korea FTAASEAN-South Korea FTA– ASEAN-India FTAASEAN-India FTA– ASEAN-Australia-New Zealand FTAASEAN-Australia-New Zealand FTA
FTAs currently being negotiated:FTAs currently being negotiated:– Trans-Pacific Partnership FTATrans-Pacific Partnership FTA– ASEAN-EFTA (European Free Trade ASEAN-EFTA (European Free Trade
Association: Switzerland, Iceland, Association: Switzerland, Iceland, Liechtenstein, Norway)Liechtenstein, Norway)
– FTA Viet nam-UEFTA Viet nam-UE– FTA Viet Nam-South KoreaFTA Viet Nam-South Korea
Benefits: market access; increased FDI Benefits: market access; increased FDI inflowsinflows

11. Targets11. Targets
– Being among the world’s top three exportersBeing among the world’s top three exporters– Export volume reaching USD 16 - 18 billion Export volume reaching USD 16 - 18 billion
in 2015; labour force: 3 million workers; in 2015; labour force: 3 million workers; fabric production: 1.5 million metric tons; fabric production: 1.5 million metric tons; fiber production: 0.5 million metric tons; fiber production: 0.5 million metric tons; localization: 60%localization: 60%
– Annual growth rate of 20-30%Annual growth rate of 20-30%– Export volume reaching USD 20 billion in Export volume reaching USD 20 billion in
20202020
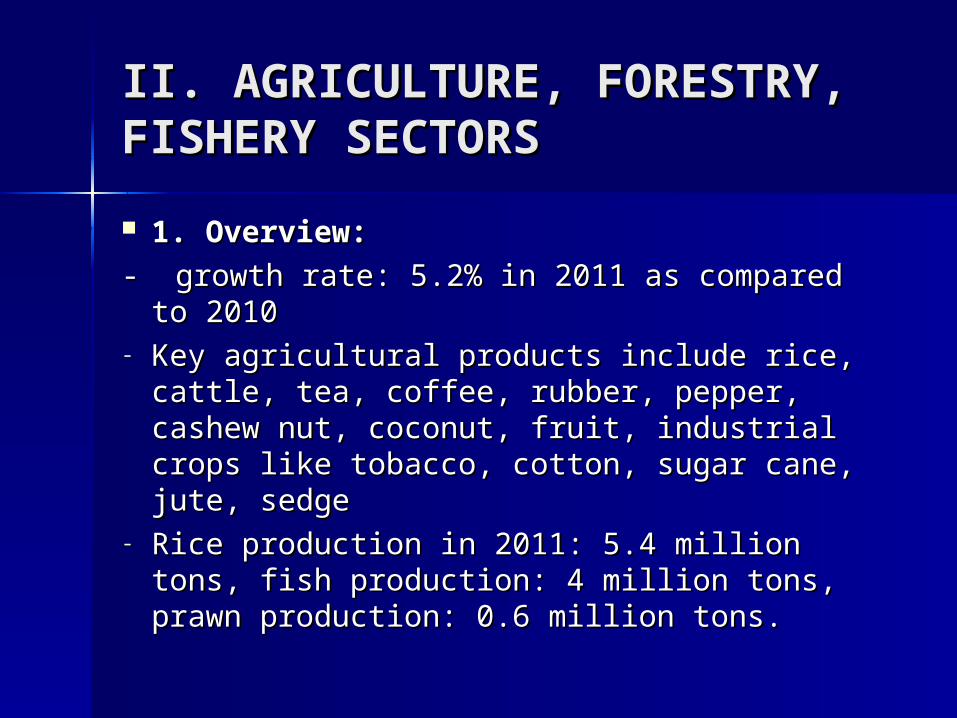
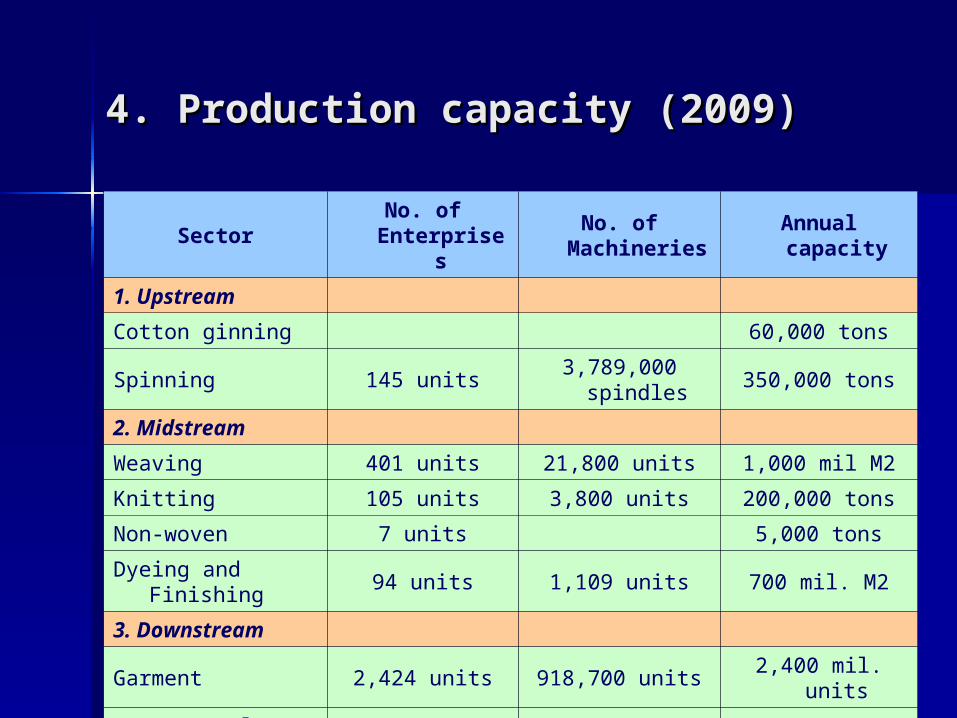
II. AGRICULTURE, FORESTRY, II. AGRICULTURE, FORESTRY, FISHERY SECTORSFISHERY SECTORS
1. Overview:1. Overview:
- growth rate: 5.2% in 2011 as compared to - growth rate: 5.2% in 2011 as compared to 20102010
- Key agricultural products include rice, Key agricultural products include rice, cattle, tea, coffee, rubber, pepper, cashew cattle, tea, coffee, rubber, pepper, cashew nut, coconut, fruit, industrial crops like nut, coconut, fruit, industrial crops like tobacco, cotton, sugar cane, jute, sedgetobacco, cotton, sugar cane, jute, sedge
- Rice production in 2011: 5.4 million tons, Rice production in 2011: 5.4 million tons, fish production: 4 million tons, prawn fish production: 4 million tons, prawn production: 0.6 million tons.production: 0.6 million tons.

1. Overview …1. Overview …
2,356 enterprises in the fields of 2,356 enterprises in the fields of agriculture, forestry and fishery; 89 agriculture, forestry and fishery; 89 companies are 100% foreign own companies are 100% foreign own enterprises.enterprises.
The fishery sector: 4% of Viet Nam’s The fishery sector: 4% of Viet Nam’s GDP. GDP.
Seafood: 3Seafood: 3rdrd largest export item (only largest export item (only after oil and textile and garment), and is after oil and textile and garment), and is among top export earners of Viet Nam. among top export earners of Viet Nam.

2. Export turnover2. Export turnover
2011: total export turnover of the 2011: total export turnover of the agriculture, forestry and fishery agriculture, forestry and fishery sectors was USD 25 billion. sectors was USD 25 billion.
10 months of 2012: the turnover 10 months of 2012: the turnover reached USD 22.5 billion, an reached USD 22.5 billion, an increase of 9.5% over the same increase of 9.5% over the same period last year (high exports: period last year (high exports: coffee, tapioca and related products)coffee, tapioca and related products)

3. Exporting goods3. Exporting goods3.1. Coffee3.1. Coffee
In 2011: export quantity was 1.2 million In 2011: export quantity was 1.2 million tons (USD 2.7 billion)tons (USD 2.7 billion)
10 months of 2012: export was 1.4 10 months of 2012: export was 1.4 million tons in quantity (USD 3.02 million tons in quantity (USD 3.02 billion), increasing 37.7% in terms of billion), increasing 37.7% in terms of quantity and 32.7% in terms of volume quantity and 32.7% in terms of volume over the same period last year. over the same period last year.
Exporting markes: USA, Germany, Exporting markes: USA, Germany, IndonesiaIndonesia

3.2. Tapioca3.2. Tapioca
Tapioca and related products have Tapioca and related products have also seen remarkable growth in such also seen remarkable growth in such markets as China, South Korea, and markets as China, South Korea, and the Philippines. the Philippines.
10 months of 2012: tapioca and 10 months of 2012: tapioca and related products export was 3.6 related products export was 3.6 million tons in quantity (USD 1.13 in million tons in quantity (USD 1.13 in volume), increased 38% as compared volume), increased 38% as compared to the same period last year.to the same period last year.

3.3. Tea3.3. Tea
in 2011: export was 131 thousand in 2011: export was 131 thousand tons in quantity (USD 198 million)tons in quantity (USD 198 million)
10 months of 2012: were 110 10 months of 2012: were 110 thousand tons (USD 182 million). thousand tons (USD 182 million).
Exporting market: Pakistan (21% Exporting market: Pakistan (21% of the total tea export of Viet of the total tea export of Viet Nam)Nam)
3.4. Rice 3.4. Rice - 2011: export reached 7.2 million 2011: export reached 7.2 million
tons (USD 3.7 billion). tons (USD 3.7 billion). - 10 months of 2012: rice export 10 months of 2012: rice export
was estimated at 6.9 million tons was estimated at 6.9 million tons (USD 3.14 billion)(USD 3.14 billion)

3.5. Rubber3.5. Rubber 10 months 2012: rubber export was 10 months 2012: rubber export was
811 thousand tons (USD 2.3 billion)811 thousand tons (USD 2.3 billion)
3.6. Wood & wooden 3.6. Wood & wooden products products
- Export in 2011: USD 3.9 billion (USD Export in 2011: USD 3.9 billion (USD 3.8 billion)3.8 billion)
- 10 months of 2012: increased 19.3% 10 months of 2012: increased 19.3% over the same period last year. over the same period last year.
- Key export markets: UAE, China, Japan. Key export markets: UAE, China, Japan.
3.7. Aquaculture products 3.7. Aquaculture products - 2011: USD 6.1 billion; 10 months of 2011: USD 6.1 billion; 10 months of
2012: USD 5 billion) 2012: USD 5 billion) - Key export markets include USA (Key export markets include USA (19%19%), ),
Japan (1Japan (15,1%5,1%), South Korea ), South Korea (7,9%). (7,9%).

THANK YOUTHANK YOU
VERY MUCH!VERY MUCH!