Embed Size (px)
Citation preview

Introducing the Euro as Legal Tender - Benefits and Costs of Eurorization
for Cape Verde
Patrick Imam
WP/09/146

© 2009 International Monetary Fund WP/09/146 IMF Working Paper
African Department
Introducing the Euro as Legal Tender—Benefits and Costs of Eurorization
for Cape Verde
Prepared by Patrick Imam1
Authorized for distribution by Francesco Caramazza July 2009
Abstract
This Working Paper should not be reported as representing the views of the IMF. The views expressed in this Working Paper are those of the author and do not necessarily represent those of the IMF or IMF policy. Working Papers describe research in progress by the author and are published to elicit comments and to further debate.
In recent years, recommendations for countries to unilaterally dollarize/eurorize have become common, particularly when the countries lack economic credibility. After exploring the characteristics of dollarizing/eurorizing economies, we look at the merits and costs of unilateral eurorization for Cape Verde, a highly tourism based economy that has become increasingly integrated into the euro-zone area and that has a strong macroeconomic track record. We illustrate that neither the benefits nor the costs of unilateral eurorization are large and conclude that there is no compelling case to change the current exchange rate arrangement at this point in time. Econometrically, we assess the characteristics of dollarized economies and demonstrate that few of them apply to Cape Verde, further confirming that Cape Verde does not fit the pattern of most dollarizing countries. JEL Classification Numbers: E60, F33, F42 Keywords: Fixed exchange rate, eurorization, dollarization, Cape Verde Author’s E-Mail Address: [email protected]
1 This paper was presented at the Conference Commemorating the 10th Anniversary of the Exchange Rate Cooperation Agreement between Portugal and Cape Verde, held in Praia on the 31st of October 2008. I would like to thank Philippe Callier, Eduardo Castro, Sandro de Brito, Roland Kpodar, Lamin Leigh, David Nellor, Rosa Pinheiro, Marcio Ronci, Daouda Sembene and George Tsibouris for their useful comments. The usual disclaimer applies.
2
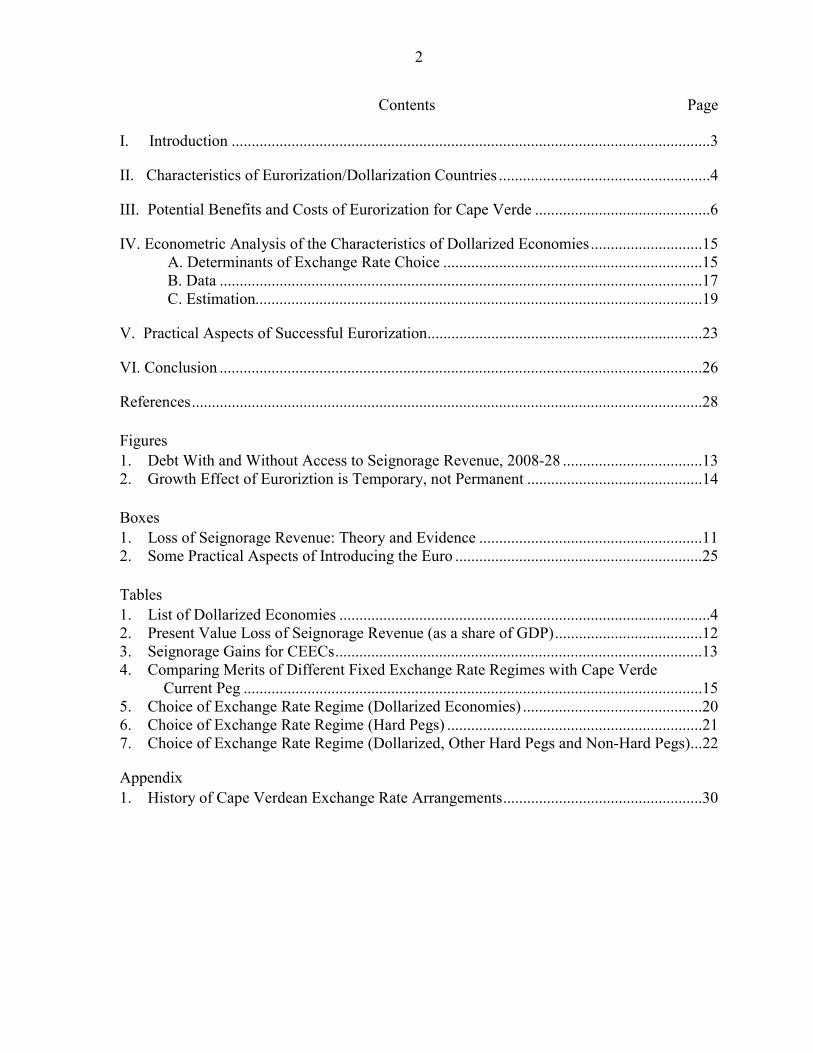
Contents Page
I. Introduction ........................................................................................................................3
II. Characteristics of Eurorization/Dollarization Countries .....................................................4
III. Potential Benefits and Costs of Eurorization for Cape Verde ............................................6
IV. Econometric Analysis of the Characteristics of Dollarized Economies............................15 A. Determinants of Exchange Rate Choice .................................................................15 B. Data .........................................................................................................................17 C. Estimation................................................................................................................19
V. Practical Aspects of Successful Eurorization.....................................................................23
VI. Conclusion .........................................................................................................................26
References................................................................................................................................28 Figures 1. Debt With and Without Access to Seignorage Revenue, 2008-28 ...................................13 2. Growth Effect of Euroriztion is Temporary, not Permanent ............................................14 Boxes 1. Loss of Seignorage Revenue: Theory and Evidence ........................................................11 2. Some Practical Aspects of Introducing the Euro ..............................................................25 Tables 1. List of Dollarized Economies .............................................................................................4 2. Present Value Loss of Seignorage Revenue (as a share of GDP).....................................12 3. Seignorage Gains for CEECs............................................................................................13 4. Comparing Merits of Different Fixed Exchange Rate Regimes with Cape Verde Current Peg ...................................................................................................................15 5. Choice of Exchange Rate Regime (Dollarized Economies) .............................................20 6. Choice of Exchange Rate Regime (Hard Pegs) ................................................................21 7. Choice of Exchange Rate Regime (Dollarized, Other Hard Pegs and Non-Hard Pegs)...22
Appendix 1. History of Cape Verdean Exchange Rate Arrangements..................................................30

3
I. INTRODUCTION
Like many other highly tourism-based economies, Cape Verde’s exchange rate arrangement is a conventional peg, to the euro. The current exchange rate system was set up in 1998 by a new government that recognized the importance of credibility for both exchange operations and macroeconomic stability.2 In that year, Cape Verde signed an Exchange Cooperation Accord with Portugal that established a fixed parity between the Cape Verde and the Portuguese escudo (now the euro). The accord committed Cape Verde to adopting guidelines to safeguard the fixed parity. Fiscal reforms included introduction of a value-added tax (VAT), strengthening tax collection, a massive reduction in public debt through privatization and foreign aid, and limits to monetization of debt. A foreign exchange law was passed to remove all restrictions on current and capital account transactions, which was essentially achieved by 2004. In return, the Portuguese government provided a short-term precautionary line of credit of €45 million in case of need, to be repaid at the end of each year with an annual interest rate of 0.5 percent (see IMF, 1999, for a summary).
With the peg, the economy grew rapidly, driven by foreign direct investment (FDI) in tourism. Despite initial problems—overspending led to depletion of foreign reserves—the situation improved in 2001 after efforts were made to get the fiscal deficit under control. Rapid and sustained growth ensued. With its close ties to Europe, specialization of the Cape Verdean economy in tourism meant that the economy became more synchronized with the European growth cycle. Moreover, most of the remittances from the Cape Verde diaspora are from Europe (see IMF, 2008).
Recognizing the increasingly close links with Europe, the government of Cape Verde is now considering the costs and benefits of keeping the current exchange rate arrangement or moving to eurorize.3 In this paper we examine potential benefits and costs for Cape Verde of eurorization. The merits of eurorization cannot be analyzed in the abstract; we must look at Cape Verde’s unique characteristics to assess them. The historical evidence and the difficulty of quantifying some of the theoretical benefits and costs suggests it will not be possible to draw robust quantitative conclusions. Nonetheless, our findings imply that it is not clear from either theory or empirical evidence that the net benefits of eurorization outweigh the costs at this point in time. It is important to note that this conclusion is tentative and will have to be revisited in the future, as “No Single Currency Regime is Right for All Countries or at All Times."
2 See Appendix 1 for a history of Cape Verde’s exchange rate arrangements.
3 We will use dollarization and eurorization interchangeably, to mean the adoption of another country’s currency as the official legal tender.
4
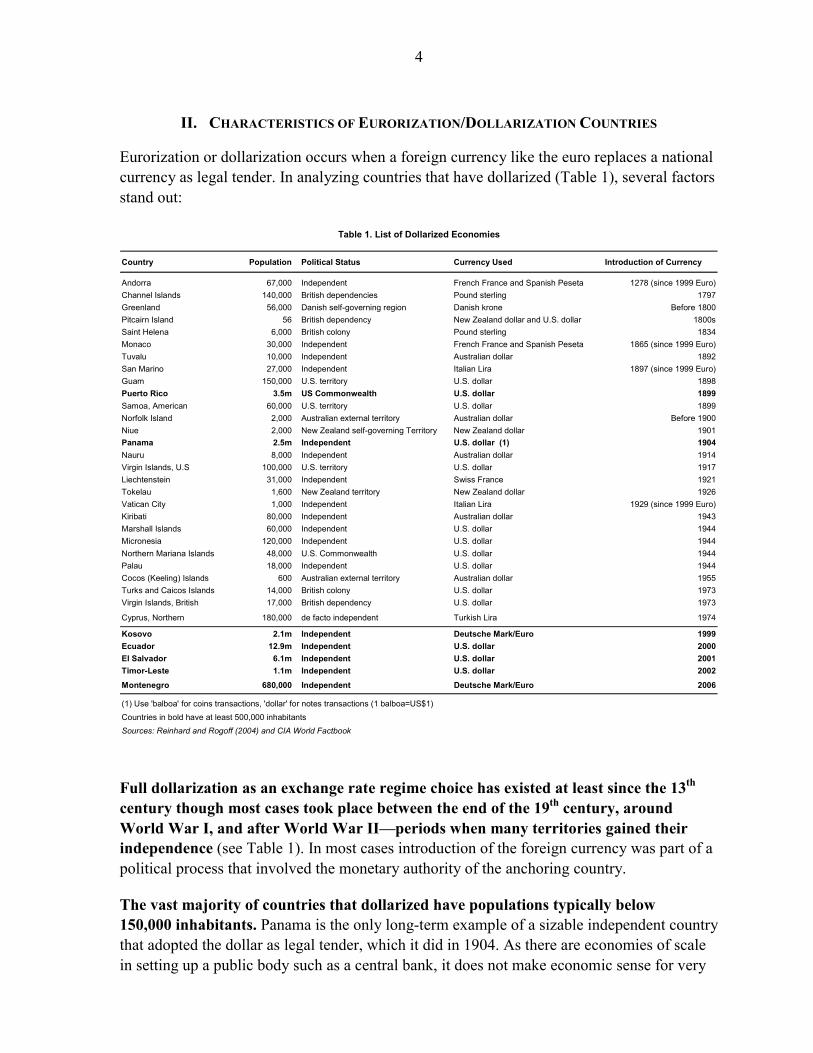
II. CHARACTERISTICS OF EURORIZATION/DOLLARIZATION COUNTRIES
Eurorization or dollarization occurs when a foreign currency like the euro replaces a national currency as legal tender. In analyzing countries that have dollarized (Table 1), several factors stand out:
Country Population Political Status Currency Used Introduction of Currency
Andorra 67,000 Independent French France and Spanish Peseta 1278 (since 1999 Euro)Channel Islands 140,000 British dependencies Pound sterling 1797Greenland 56,000 Danish self-governing region Danish krone Before 1800Pitcairn Island 56 British dependency New Zealand dollar and U.S. dollar 1800sSaint Helena 6,000 British colony Pound sterling 1834Monaco 30,000 Independent French France and Spanish Peseta 1865 (since 1999 Euro)Tuvalu 10,000 Independent Australian dollar 1892San Marino 27,000 Independent Italian Lira 1897 (since 1999 Euro)Guam 150,000 U.S. territory U.S. dollar 1898Puerto Rico 3.5m US Commonwealth U.S. dollar 1899Samoa, American 60,000 U.S. territory U.S. dollar 1899Norfolk Island 2,000 Australian external territory Australian dollar Before 1900Niue 2,000 New Zealand self-governing Territory New Zealand dollar 1901Panama 2.5m Independent U.S. dollar (1) 1904Nauru 8,000 Independent Australian dollar 1914Virgin Islands, U.S 100,000 U.S. territory U.S. dollar 1917Liechtenstein 31,000 Independent Swiss France 1921Tokelau 1,600 New Zealand territory New Zealand dollar 1926Vatican City 1,000 Independent Italian Lira 1929 (since 1999 Euro)Kiribati 80,000 Independent Australian dollar 1943Marshall Islands 60,000 Independent U.S. dollar 1944Micronesia 120,000 Independent U.S. dollar 1944Northern Mariana Islands 48,000 U.S. Commonwealth U.S. dollar 1944Palau 18,000 Independent U.S. dollar 1944Cocos (Keeling) Islands 600 Australian external territory Australian dollar 1955Turks and Caicos Islands 14,000 British colony U.S. dollar 1973Virgin Islands, British 17,000 British dependency U.S. dollar 1973
Cyprus, Northern 180,000 de facto independent Turkish Lira 1974
Kosovo 2.1m Independent Deutsche Mark/Euro 1999Ecuador 12.9m Independent U.S. dollar 2000El Salvador 6.1m Independent U.S. dollar 2001Timor-Leste 1.1m Independent U.S. dollar 2002
Montenegro 680,000 Independent Deutsche Mark/Euro 2006
(1) Use 'balboa' for coins transactions, 'dollar' for notes transactions (1 balboa=US$1)Countries in bold have at least 500,000 inhabitantsSources: Reinhard and Rogoff (2004) and CIA World Factbook
Table 1. List of Dollarized Economies
Full dollarization as an exchange rate regime choice has existed at least since the 13th century though most cases took place between the end of the 19th century, around World War I, and after World War II—periods when many territories gained their independence (see Table 1). In most cases introduction of the foreign currency was part of a political process that involved the monetary authority of the anchoring country.
The vast majority of countries that dollarized have populations typically below 150,000 inhabitants. Panama is the only long-term example of a sizable independent country that adopted the dollar as legal tender, which it did in 1904. As there are economies of scale in setting up a public body such as a central bank, it does not make economic sense for very
5
small countries to have their own currency. New states realized that a new national currency based on fiduciary forms of money would not replace hard currencies until the state could gain enough credibility for people to have confidence in the new currency, a time-consuming and potentially costly process. The institutional infrastructure required to manage monetary policy—a central bank, the necessary starting capital, the necessary skilled staff, data collection capacity, etc.—can be costly for countries with small populations. Because smaller economies are very open, they are also likely to benefit the most from savings on transaction costs. Most small independent states initially continued to use the currency of the former colonial power, essentially outsourcing exchange rate and monetary policy.
Because they have small populations, dollarized countries tend to be highly concentrated in that they produce only a few goods and services. They tend to either have high-end tourism (San Marino, Virgin Islands), provide financial services (Lichtenstein, Monaco), produce primary products such as fish (Greenland) or have natural resources (Nauru’s phosphate). None of them are specialized on producing manufacturing, or other goods and services, because the workforce is too small.
The choice of foreign legal tenders tends to be based on geographical consideration or trade links. Most countries and territories use, as expected, the currency of the former colonial power. Former French territories use the euro, Danish territories the Danish krone, and U.S.-administered trusteeships the US dollar. In the Pacific, countries that were formerly British-controlled now use either the New Zealand or the Australian dollar.
Rather than being based on purely economic considerations, most dollarized economies before 1999 were the result of exceptional political circumstances. Most countries that dollarized have remained dependencies, and those that have gained independence remain closely connected to the anchoring country. While some states decided to become politically independent, essentially they remained economically dependent on the former colonizing country. Newly independent states did not necessarily expect large economic gains from keeping a foreign currency as legal tender—though some of them were far from negligible (see below). Keeping the currency of the former colonial power helped maintain a close political link with that country.
Dollarization cases in recent years differ from previous cases because the countries are much larger and the decision is driven largely by economic considerations. Full dollarization took place in 2000 in Ecuador, which was hit by hyperinflation; and later in El Salvador, which was already highly dollarized; Kosovo and Montenegro, which were ravaged by war; and Timor-Leste, which emerged as an independent country provide case studies of the costs and benefits of dollarization. They are all unilateral dollarization cases that did not involve the anchoring country’s monetary authority or that were meant to lead to political rapprochement. The brevity of their experience and economic peculiarities (e.g.,

6
Timor-Leste and Kosovo have huge aid inflows) mean that it is too early to draw lessons about the benefits of dollarization for pure economic reasons.4
Dedollarization has been the exception, not the rule. With the notable exception of Liberia in 1983, there is no precedent for de jure dedollarization, which suggests that interest in dollarization may arise precisely because it is so difficult to reverse and hence so credible.
At a first look, therefore, many characteristics of dollarizing countries do not seem to apply to Cape Verde. The Cape Verdean escudo is a credible currency; backed by strong macroeconomic policies; the population is much larger than most dollarized economies except the more recent ones; and a well-functioning central bank has skilled personnel able to handle monetary policy.
III. POTENTIAL BENEFITS AND COSTS OF EURORIZATION FOR CAPE VERDE
Let us now analyze the benefits and costs of eurorization for Cape Verde. One of the problems we face is that not all benefits and costs are readily quantifiable. The evidence presented will show nonetheless that though the benefits are unlikely to be large, neither are the costs—with the possible exception of seignorage losses.
The analysis assumes that Cape Verde eurorizes unilaterally, rather than as part of a formal agreement with the European Central Bank (ECB). This is because Cape Verde cannot adopt the euro with the consent of the ECB, as European Union law requires that a country be part of the EU before it can join the euro. To be an EU member, a country must be democratic and geographically located in Europe. While Cape Verde is indeed democratic, it is not geographically part of Europe (see also Stark, 2008).5
4 While comparing the macroeconomic environment of dollarized economies before and after introduction of the dollar might appear informative, in practice this type of analysis would suffer from a selection bias: countries choosing to dollarize for economic reasons, especially recently, generally have done so precisely because of their poor initial economic conditions. 5 The Ecofin Council of November 7, 2000, in its conclusion on exchange rate strategies for accession countries, emphasized that “any unilateral adoption of the single currency by means of eurorization would run counter to the underlying economic reasoning of EMU [Economic and Monetary Union] in the Treaty, which foresees eventual adoption of the euro as the endpoint of a structured convergence process within a multilateral framework. Therefore, unilateral eurorization would not be a way to circumvent the stages foreseen by the Treaty for the adoption of the euro.” However, this applies only to EU accession countries. Non-accession countries can therefore eurorize unilaterally without the consent of the European Commission, but will not be able to influence monetary policy decisions, or ask for seignorage revenues.
7
Benefits
There are two possible types of benefits for Cape Verde from successful eurorization6: microeconomic advantages resulting from lower transaction costs, and increased macroeconomic stability resulting, for example, from constraining fiscal policy by eliminating the possibility of printing money to finance fiscal deficits. The most visible direct effect would be elimination of the transaction costs of dealing with the euro zone, Cape Verde’s most important economic partner. Because a common currency eliminates exchange rate risk with eurorized partners, it increases trade flows and leads to further economic integration with the EU (see Rose, 2000).
Moreover, by eliminating exchange rate uncertainty, eurorization would help eliminate currency risk. This should lower interest rates by eliminating inflation and exchange devaluation premiums on rates charged to Cape Verdean companies and the government (though the sovereign default risk premium would not be directly affected).7 Lower interest rates benefit growth by reducing the cost of credit and encouraging investment, notably FDI. The price stability resulting from eurorization should also stimulate growth.
However, because Cape Verde’s current peg is credible, it is not obvious how large the currency risk on bond issues would be. The benefit of lower interest rates would be large for countries with a poor macroeconomic track record that experience frequent currency crises. That is not necessarily true for a country like Cape Verde, which has a credible macroeconomic track record. Similarly, with neither the Cape Verdean government nor private companies currently floating foreign currency–denominated bonds abroad, it is not clear in practice how big this benefit would be. On top of this, given the strong macroeconomic track record of the past few years, price stability is also already achieved under the current system, and therefore the benefits of eurorization would be limited.
Another benefit from eurorization is improved economic stability resulting from fiscal discipline: The Cape Verde government would need to follow a very prudent fiscal policy because monetization of debt would no longer be possible. Without fiscal discipline, there is a risk that, in a eurorized system, fiscal policy would become procyclical. If the government runs a fiscal deficit and has no buffer, it would have to either borrow or cut spending and
6 Historically, bimonetary systems have also existed, though they are unusual. Before the euro was introduced, the Belgium-Luxembourg Monetary Union ensured that the Belgium franc was legal tender in Luxembourg, but Luxembourg also issued its own currency, which circulated at par. The National Bank of Belgium was responsible for monetary and exchange rate policy for the union and held foreign reserves. Seignorage revenue were shared pro rate between the two countries based on population (Organization for Economic Cooperation and Development, 1997). This peculiar structure, which requires the consent of both countries, means that today such an arrangement would only be possible with ECB consent, an unlikely scenario (see Stark, 2008).
7 Dollarization would not eliminate the risk of external crisis; investors may still leave the country if the fiscal position change or banking problems arise, as happened in Panama (see Moreno-Villalaz, 1999).
8
raise taxes, a procyclical fiscal stance. Because Cape Verde fiscal policy is already run in a conservative way, it is not clear why fiscal constraints could be enhanced.
Eurorization could in principle be a good basis for a sound financial sector. Currency risk can be a major source of the vulnerability of financial systems, especially when there is a mismatch in assets and liabilities; eliminating it contributes to a sound financial system. Eurorization eliminates the vulnerabilities that arise from sudden and large devaluations or exchange rate fluctuations when financial systems have liability eurorization. The British Virgin Islands, Monaco, and Liechtenstein are financial centers in part because they are dollarized economies. Since Cape Verde intends to make its emerging offshore financial sector a pillar of its development and diversification strategy, the benefit could be substantial.
Since Cape Verde does not have a heavily eurorized private financial sector, the financial sector is not very vulnerable to currency risk, so the benefits of eurorization would not be large (see IMF, 2008). Moreover, the advantage of countries like the British Virgin Islands is not just the fact that they are eurorized but that they also have favorable tax advantages and secrecy laws. It is not clear that eurorization on its own is enough to promote development of the financial sector.
Costs
The costs of eurorization are mainly macroeconomic; they relate to the elimination of tools now at the disposal of the authorities to adjust to shocks.
Adopting the euro as legal tender would remove the possibility of using the exchange rate as a shock absorber. This matters, because the probability of shocks is higher for an economy as specialized as Cape Verde’s. If the country adopts the euro and an asymmetric shock occurs, inability to apply an adjustment mechanism could cause problems, because while Cape Verde has a fixed exchange rate regime, as Ronci (2009) illustrated, given imperfect capital markets the Bank of Cape Verde (BCV) has the ability to follow limited independent monetary policy. With eurorization, all adjustment would have to come from wages and prices, which is not easy when wages and prices are sticky. Without an agreement with the EU, labor migration to Europe and fiscal transfers from Europe, the two other mechanisms for coping with asymmetric shocks, will not work as a shock absorber.8
Given the current peg of Cape Verde’s currency, this loss of flexibility is likely to be limited, except perhaps in extreme circumstances, where there is scope to exit the exchange rate arrangement. Even devaluation is probably a much less flexible instrument than is often thought. Once used, it affects the expectations of economic agents in a way that makes it more difficult to use in the future. Moreover, in emerging markets in recent years 8 It is possible to make the case that the overseas development assistance that Cape Verde has obtained has acted as a de facto shock absorber (like a fiscal transfer) during shocks. Now that Cape Verde has graduated to lower-middle-income status, aid will gradually decline and cannot be relied upon as a shock-absorbing tool.

9
devaluations have often been contractionary because of balance sheet effects (though this probably does not apply to Cape Verde, which has limited liability eurorization). Moreover, the inelasticity of exports and imports that characterizes small countries like Cape Verde makes devaluation ineffective in restoring external balances (see Imam, 2008).
Another cost of eurorization would be that the BCV would lose its ability to function as a lender of last resort (LOLR) because the credibility of the LOLR function typically is linked to the ability to print money. Here it is necessary to distinguish the role of the central bank in operating a discount window to provide short-term liquidity, which is still possible with eurorization, from its role as guarantor of the stability of the financial system if there is a bank run, which would be lost. To provide liquidity, for instance, the BCV would have to accumulate funds in advance or secure lines of credit with international banks, though in practice (e.g., in Argentina) these have not been very successful (Borenzstein and Berg, 2000). Because the BCV could lend only up to the amount of its reserves, it would not be able to rescue the financial system if there were a systemic bank crisis.
Since most banks are foreign-owned (mainly Portuguese), in principle the LOLR facility that matters should be the Portuguese Central Bank, not necessarily the BCV. Therefore, the loss of the LOLR function would not be large for Cape Verde.
The political price of eurorization for Cape Verde is another cost to consider. Policy-initiated eurorization eliminates the local currency, a national symbol that might be important for Cape Verdeans who fought for independence. In part due to this loss of a national symbol, the Ecuadorian government that proposed full dollarization had to resign in the face of opposition, even though it had a solid case because hyperinflation was ravaging the country.9 But for Cape Verde, the political cost is likely to be marginal—especially if the economic benefits are visible—and as the old generation passes it is likely to fall over time. The government should, however, ensure that the benefits of eurorization are well distributed across the population and that losers are compensated. Conceivably benefits and costs would not be equally distributed: The benefits could go to the tourism sector, and the costs fall more heavily on agriculture and industry.10
With Cape Verde’s development at a different stage from that of the average euro zone country, the Balassa-Samuelson effect—the extent to which productivity growth differs between tradable and nontradable industries—will lead to observable differences in inflation
9 While the euro enjoys a solid reputation for monetary stability, which is enshrined in the status of the ECB, the situation is not guaranteed to hold forever. Most currencies at one time or another suffer from weaknesses. While the euro is likely to remain stable for the foreseeable future, the option to switch to a different currency would be lost. Since this is not likely to be a problem in the foreseeable future, though, this cost is likely to be minute.
10 Another question the government must consider before eurorizing is how the decision will be taken: Will there be a referendum on giving up the escudo for the euro, or a parliamentary vote?

10
between Cape Verde and the euro area, another possible problem with eurorization. If that should happen, the price of nontraded relative to traded goods will rise faster in Cape Verde. With a fixed exchange rate the Balassa-Samuelson effect will result in real exchange rate appreciation due to higher inflation than in the euro zone. As inflation rises over time, the real effective exchange rate (REER) of Cape Verde will appreciate, making the economy less competitive and reducing growth. If the effect is substantial, the authorities might feel compelled to keep monetary and fiscal policies very restrictive, which would retard development.
However, it is questionable how strong the Balassa-Samuelson effect is likely to be in Cape Verde because productivity gains are not likely to be impressive in the tradable sector. This sector mainly consists of tourism, which by its very nature is labor-intensive, and has limited productivity growth potential. Nonetheless, the Balassa-Samuelson effect could eventually become important if the tradable sector diversifies.
A more substantial cost from eurorization would be the loss of seignorage revenue—the profit accruing to the monetary authority from its right to issue currency (see Borensztein and Berg, 2000). To the extent that the government borrows to compensate for this loss, it may destabilize the fiscal position. Raising more tax revenues (despite an underdeveloped tax system) to compensate for the loss could also take time, which could increase debt further.
The costs of seignorage revenue can be decomposed into two:
• Immediate one-off ”stock” costs. As the euro is introduced and domestic currency is withdrawn from circulation, the monetary authority must buy back the domestic currency held by the public and banks. A related one-off indirect cost arises if the country does not have enough foreign reserves to buy domestic currency to be dollarized, in which case it must acquire the initial stock. If the country is credit-constrained and cannot borrow the reserves, it will have to run current account surpluses to acquire them. This might mean that the country will have to forego investment opportunities that might have arisen if it could run a current account deficit.
• Future permanent seignorage earnings loss. This loss stems from the flow of new currency printed to satisfy increases in demand for money. The amount of seignorage revenue lost on the adoption of the euro depends on the rate of return on the euro and the rate of inflation, which could be large (see Box 1).

11
Box 1. Loss of Seignorage Revenue: Theory and Evidence
How much loss of seignorage is associated with eurorization? The amount depends on the assumptions made. A correct estimation of seignorage losses needs to take into account both the costs of purchasing the initial stock of foreign currency needed to replace local currency, and the costs of purchasing later increases in the stock. These costs can be thought of as income lost (a) from international reserves used to exchange the monetary base for the foreign currency, and (b) from future increases in reserves as a result of increases in the demand for money. A back-of-the-envelope calculation can be made based on two simplifying assumptions: 1. Output and prices grow at constant rates g and π, and the latter is assumed to follow the inflation rate in the country from which the new currency is borrowed. 2. The currency-to-(nominal) GDP ratio remains constant at the initial level, denoted c. On these assumptions the total flow of seignorage is exactly equivalent to a perpetuity that pays an interest rate of i on a stock of international reserves that grows at the rate
ρ= (1+ π)(1+g)–1 ,
the rate of growth of demand for the currency on which seignorage is collected. In turn, the present value of the perpetuity is given by:
ρπ
−=
+
++= +
∞
=∑i
cGDPii
gcGDPiS o
tt
t )()1(
)]1)(1)[((1
0 0
where i is the government’s opportunity cost. Since the real interest rate can be computed directly as r=(1+i)/(1+π) –1, the equation immediately gives us the seignorage cost in terms of GDP for any expected real interest, inflation, and growth rates and any expected monetization ratio. Source: Levy-Yeyati and Sturzenegger, 2001.
To estimate seignorage for Cape Verde we assume a constant currency-to-GDP ratio c of 20 percent (M0 in December 2007 was CVE 23.9 bn and GDP in 2007 was CVE 129.4 bn) and a real interest rate r of 4 percent for different growth and inflation assumptions.11 The annual (flow) loss of seignorage revenue is likely to be on the order of 1.2 percent (assuming c=20, r=4, and inflation=2, the implicit ECB target). 12 The reason seignorage costs are high
(continued…)
11 Because monetization is higher in developed than in developing countries, for the latter the rate of growth of demand for money may be higher in the short run than in the steady state if levels eventually converge to those of more developed economies. This entails an additional seignorage cost in the form of higher flow costs in the transition period.
12 According to Article 33 of the ECB, which deals with the allocation of net profits and losses of the ECB: ”The net profit of the ECB shall be transferred in the following order: (a) an amount to be determined by the
12
in Cape Verde is that, unlike some Latin American countries, it has limited currency substitution, meaning that demand for money is high.
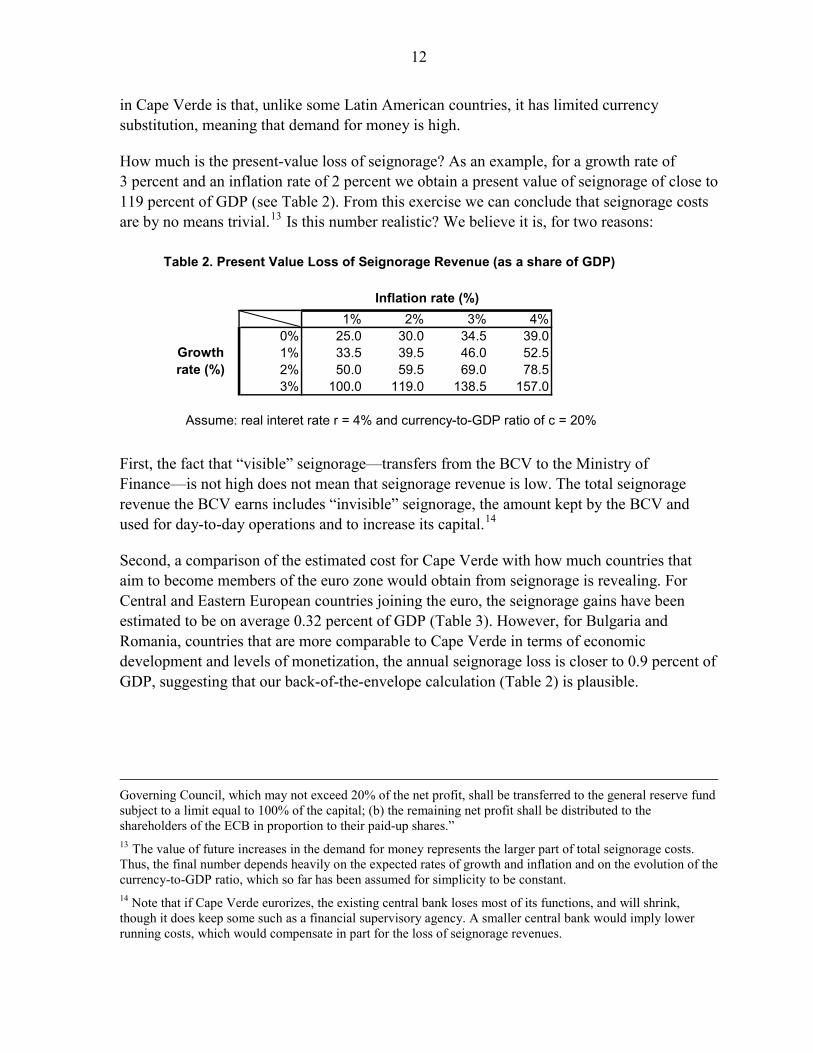
How much is the present-value loss of seignorage? As an example, for a growth rate of 3 percent and an inflation rate of 2 percent we obtain a present value of seignorage of close to 119 percent of GDP (see Table 2). From this exercise we can conclude that seignorage costs are by no means trivial.13 Is this number realistic? We believe it is, for two reasons:
Table 2. Present Value Loss of Seignorage Revenue (as a share of GDP)
1% 2% 3% 4%0% 25.0 30.0 34.5 39.01% 33.5 39.5 46.0 52.52% 50.0 59.5 69.0 78.53% 100.0 119.0 138.5 157.0
Assume: real interet rate r = 4% and currency-to-GDP ratio of c = 20%
Inflation rate (%)
Growth rate (%)
First, the fact that “visible” seignorage—transfers from the BCV to the Ministry of Finance—is not high does not mean that seignorage revenue is low. The total seignorage revenue the BCV earns includes “invisible” seignorage, the amount kept by the BCV and used for day-to-day operations and to increase its capital.14
Second, a comparison of the estimated cost for Cape Verde with how much countries that aim to become members of the euro zone would obtain from seignorage is revealing. For Central and Eastern European countries joining the euro, the seignorage gains have been estimated to be on average 0.32 percent of GDP (Table 3). However, for Bulgaria and Romania, countries that are more comparable to Cape Verde in terms of economic development and levels of monetization, the annual seignorage loss is closer to 0.9 percent of GDP, suggesting that our back-of-the-envelope calculation (Table 2) is plausible.
Governing Council, which may not exceed 20% of the net profit, shall be transferred to the general reserve fund subject to a limit equal to 100% of the capital; (b) the remaining net profit shall be distributed to the shareholders of the ECB in proportion to their paid-up shares.” 13 The value of future increases in the demand for money represents the larger part of total seignorage costs. Thus, the final number depends heavily on the expected rates of growth and inflation and on the evolution of the currency-to-GDP ratio, which so far has been assumed for simplicity to be constant. 14 Note that if Cape Verde eurorizes, the existing central bank loses most of its functions, and will shrink, though it does keep some such as a financial supervisory agency. A smaller central bank would imply lower running costs, which would compensate in part for the loss of seignorage revenues.
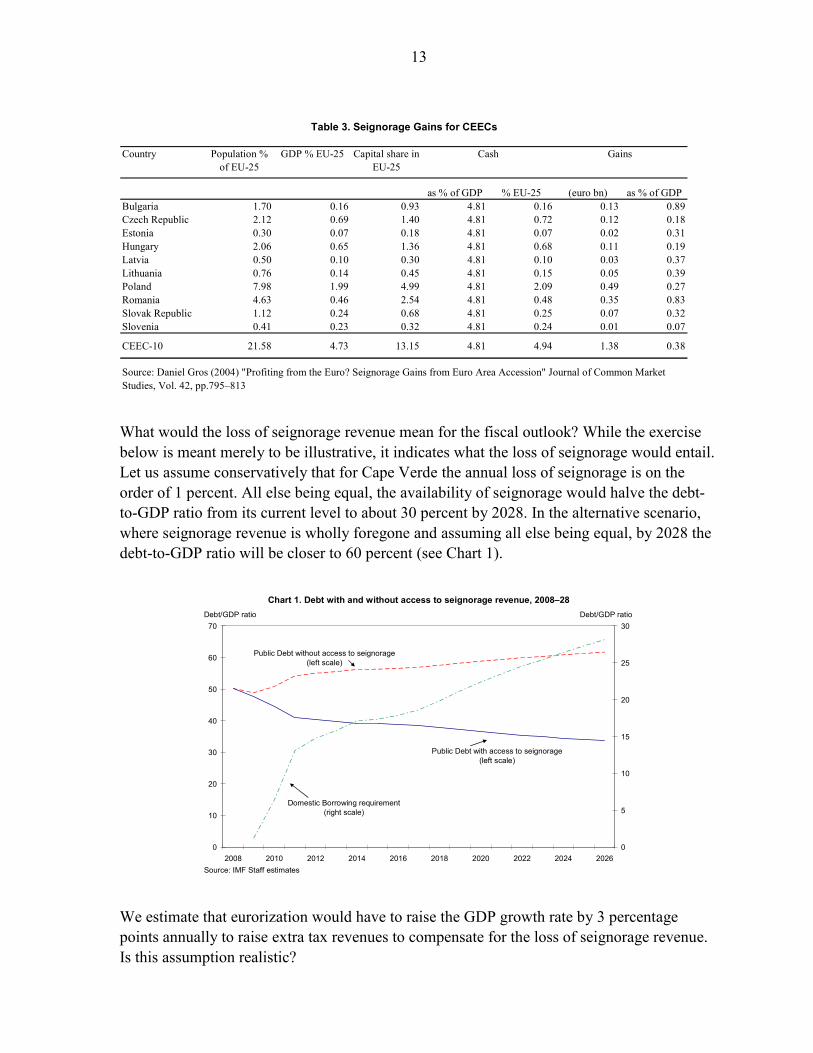
13
Country Population % of EU-25
GDP % EU-25 Capital share in EU-25
as % of GDP % EU-25 (euro bn) as % of GDPBulgaria 1.70 0.16 0.93 4.81 0.16 0.13 0.89Czech Republic 2.12 0.69 1.40 4.81 0.72 0.12 0.18Estonia 0.30 0.07 0.18 4.81 0.07 0.02 0.31Hungary 2.06 0.65 1.36 4.81 0.68 0.11 0.19Latvia 0.50 0.10 0.30 4.81 0.10 0.03 0.37Lithuania 0.76 0.14 0.45 4.81 0.15 0.05 0.39Poland 7.98 1.99 4.99 4.81 2.09 0.49 0.27Romania 4.63 0.46 2.54 4.81 0.48 0.35 0.83Slovak Republic 1.12 0.24 0.68 4.81 0.25 0.07 0.32Slovenia 0.41 0.23 0.32 4.81 0.24 0.01 0.07
CEEC-10 21.58 4.73 13.15 4.81 4.94 1.38 0
Gains Cash
Source: Daniel Gros (2004) "Profiting from the Euro? Seignorage Gains from Euro Area Accession" Journal of Common Market Studies, Vol. 42, pp.795–813
Table 3. Seignorage Gains for CEECs
.38
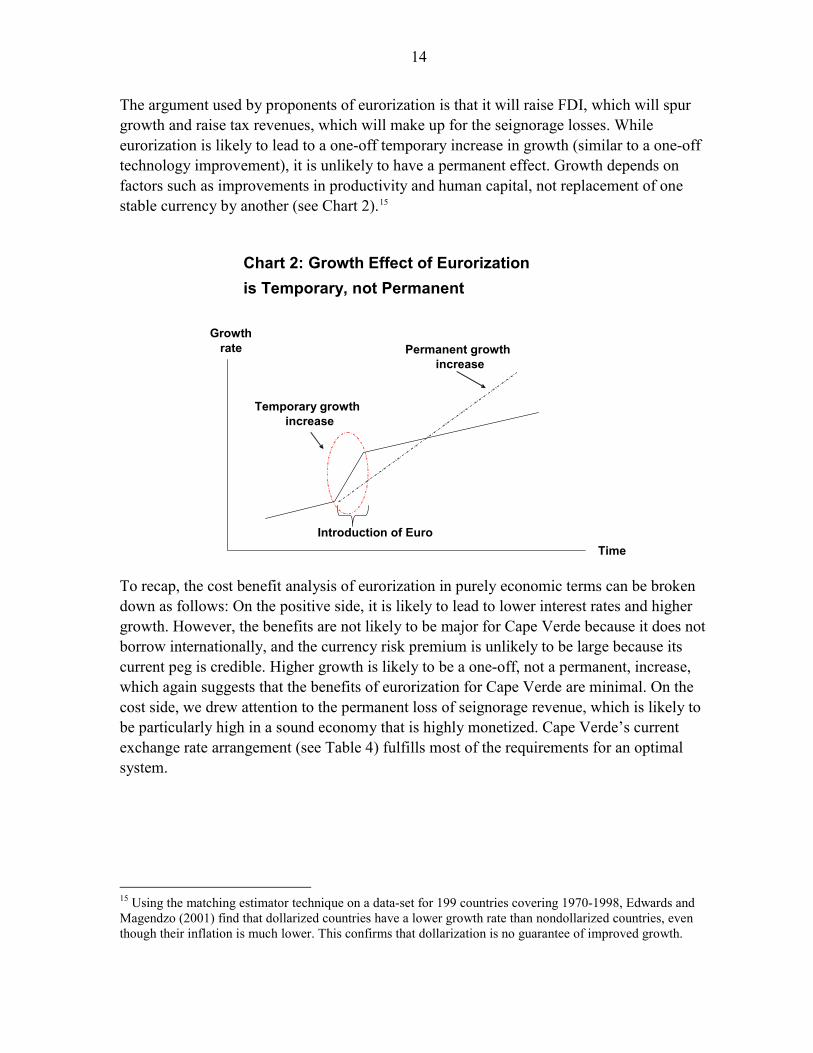
What would the loss of seignorage revenue mean for the fiscal outlook? While the exercise below is meant merely to be illustrative, it indicates what the loss of seignorage would entail. Let us assume conservatively that for Cape Verde the annual loss of seignorage is on the order of 1 percent. All else being equal, the availability of seignorage would halve the debt-to-GDP ratio from its current level to about 30 percent by 2028. In the alternative scenario, where seignorage revenue is wholly foregone and assuming all else being equal, by 2028 the debt-to-GDP ratio will be closer to 60 percent (see Chart 1).
Chart 1. Debt with and without access to seignorage revenue, 2008–28
0
10
20
30
40
50
60
70
2008 2010 2012 2014 2016 2018 2020 2022 2024 20260
5
10
15
20
25
30
Public Debt without access to seignorage(left scale)
Public Debt with access to seignorage(left scale)
Domestic Borrowing requirement(right scale)
Debt/GDP ratio
Source: IMF Staff estimates
Debt/GDP ratio
We estimate that eurorization would have to raise the GDP growth rate by 3 percentage points annually to raise extra tax revenues to compensate for the loss of seignorage revenue. Is this assumption realistic?
14
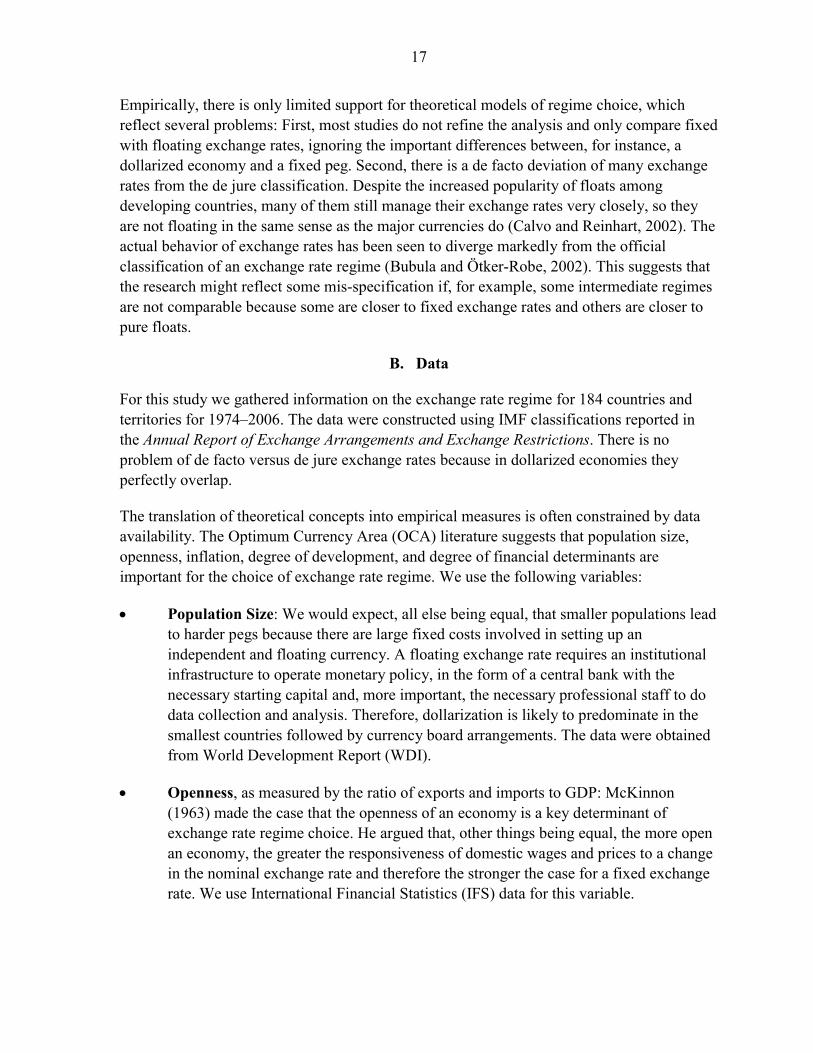
The argument used by proponents of eurorization is that it will raise FDI, which will spur growth and raise tax revenues, which will make up for the seignorage losses. While eurorization is likely to lead to a one-off temporary increase in growth (similar to a one-off technology improvement), it is unlikely to have a permanent effect. Growth depends on factors such as improvements in productivity and human capital, not replacement of one stable currency by another (see Chart 2).15
Chart 2: Growth Effect of Eurorization is Temporary, not Permanent
Growth
Temporary growthincrease
Permanent growth increase
Introduction of Euro
rate
Time
To recap, the cost benefit analysis of eurorization in purely economic terms can be broken down as follows: On the positive side, it is likely to lead to lower interest rates and higher growth. However, the benefits are not likely to be major for Cape Verde because it does not borrow internationally, and the currency risk premium is unlikely to be large because its current peg is credible. Higher growth is likely to be a one-off, not a permanent, increase, which again suggests that the benefits of eurorization for Cape Verde are minimal. On the cost side, we drew attention to the permanent loss of seignorage revenue, which is likely to be particularly high in a sound economy that is highly monetized. Cape Verde’s current exchange rate arrangement (see Table 4) fulfills most of the requirements for an optimal system.
15 Using the matching estimator technique on a data-set for 199 countries covering 1970-1998, Edwards and Magendzo (2001) find that dollarized countries have a lower growth rate than nondollarized countries, even though their inflation is much lower. This confirms that dollarization is no guarantee of improved growth.

15
Dollarization/ Eurorization
Currency Board Pegged Exchange Rate
Cape Verde Pegged Exchange Rate in 2009
Optimum
Seignorage No Yes Yes Yes Yes
Interest Premium Low Medium High Low Low
Lender of Last Resort No No Yes Yes Yes
Interest Rate decision No No No (except if Capital Market
imperfect)
Small one, as capital markets imperfect
Yes
Table 4. Comparing Merits of Different Fixed Exchange Rate Regimes with Cape Verde's Current Peg
There are possible solutions to the problem of seignorage revenue losses. On the one hand, the government could ask donors to consider giving Cape Verde an annual grant to offset seignorage losses like Bulgaria, Romania, and other EU accession countries will get from the EU. This would rid Cape Verde of revenue losses, but it is questionable how feasible this solution really is.
Alternatively, Cape Verde could move to a currency board arrangement. However, while a currency board could minimize the loss of seignorage revenues and strengthen credibility further compared to the current peg, overall it does not provide huge benefits relative to the current system.
IV. ECONOMETRIC ANALYSIS OF THE CHARACTERISTICS OF DOLLARIZED ECONOMIES
A. Determinants of Exchange Rate Choice
We will now analyze econometrically the characteristics of dollarized countries versus other currency arrangements to see how the Cape Verdean economy compares with dollarized countries. Most studies attempting to explain the choice of exchange rate regime have used a binary model: fixed versus flexible (Collins, 1996, Edwards 1996, Poirson, 2001).16 They do not differentiate, for instance, among fixed exchange rates, such as dollarized versus other fixed arrangements. The novelty of our study is that we will compare, using logit and probit
16 According to the “Annual Report on Exchange Rate Arrangements and Exchange Restrictions,” the official classification by the IMF, exchange rate arrangements are divided into three broad categories: (i) pegged or fixed arrangements: currency unions, currency boards, dollarized countries, and fixed exchange rates. (ii) flexible arrangements: free floats, where monetary authorities do not intervene, allowing market forces to determine the exchange rate, and managed floats, where intervention is done to “lean against the wind”; (iii) and exchange rates with “limited flexibility,” an in-between category of arrangements that run the continuum from adjustable pegs, in which countries can periodically realign their pegs; to crawling pegs, in which the peg is frequently reset through a series of devaluations; to a basket peg, where the exchange rate is fixed in terms of a weighted basket of foreign currencies; to target zones (exchange rate regimes with bands), where the authorities intervene when the exchange rate hits pre-announced margins on either side of a central parity.

16
models, both how dollarized economies differ from nondollarized economies and how fixed regimes overall differ from nonfixed regimes.
To determine the empirical specification of our model, we rely on two main literature streams that explain determinants of exchange rates:
• Optimum Currency Area. According to this stream (Mundell, 1961) a country’s structural characteristics explain whether or not its propensity to peg is high. A country is more likely to benefit from a fixed exchange rate regime if it is highly integrated with the pegged country, sharing a similar business cycle; has high factor mobility (labor, capital) and price flexibility (wages, goods and services)—making it easier to adjust to external shocks; and is well diversified, which decreases the likelihood of asymmetric shocks.
• Political Economy Models. The “time inconsistency” literature based on Kydland and Prescott (1977) emphasizes the role of credibility and political factors rather than purely structural ones in the choice of an exchange rate regime. The time inconsistency problem arises because there are incentives for a policymaker to pursue discretionary policy to achieve short-run objectives (short-run Philips curve), such as higher growth and employment, even though the result is poor long-run outcomes, such as high inflation (long-run Philips curve). A country whose authorities have a reputation for pursuing inflationary policies will find it difficult to shed that reputation without a long and costly process of disinflation. The time-consistency literature argues that, to gain a reputation for credibility, authorities must pursue a policy rule that is time-consistent. One way to gain credibility is to tie the hands of the authorities by fixing the exchange rate in terms of the currency of a country that has relatively high anti-inflation credibility.17
In other words, the choice of the exchange rate regime reflects a trade-off between credibility (or discipline) and flexibility. A flexible exchange rate allows a country to have an independent monetary policy, which gives the economy flexibility to accommodate domestic and foreign shocks—such as changes in external terms of trade and interest rates— with little domestic adjustment, but this flexibility usually comes at the cost of some loss in credibility and tends to be associated with higher inflation. Alternatively, fixed exchange rates reduce the flexibility of the system but they are regarded as a commitment mechanism that national authorities can employ, if they choose, to enhance their credibility.
17 Since the capital account crisis of the 1990s, an argument that has gained in importance is that the balance sheet effects from currency movements (e.g., large external debt denominated in foreign currencies, or significant foreign-currency liabilities in the commercial banking system) may cause governments to favor exchange rate stability (Hausmann et al., 2001). This literature, however, is based on the credibility literature and simply reflects the resulting balance sheet problems as opposed to the purely flow problems.
17
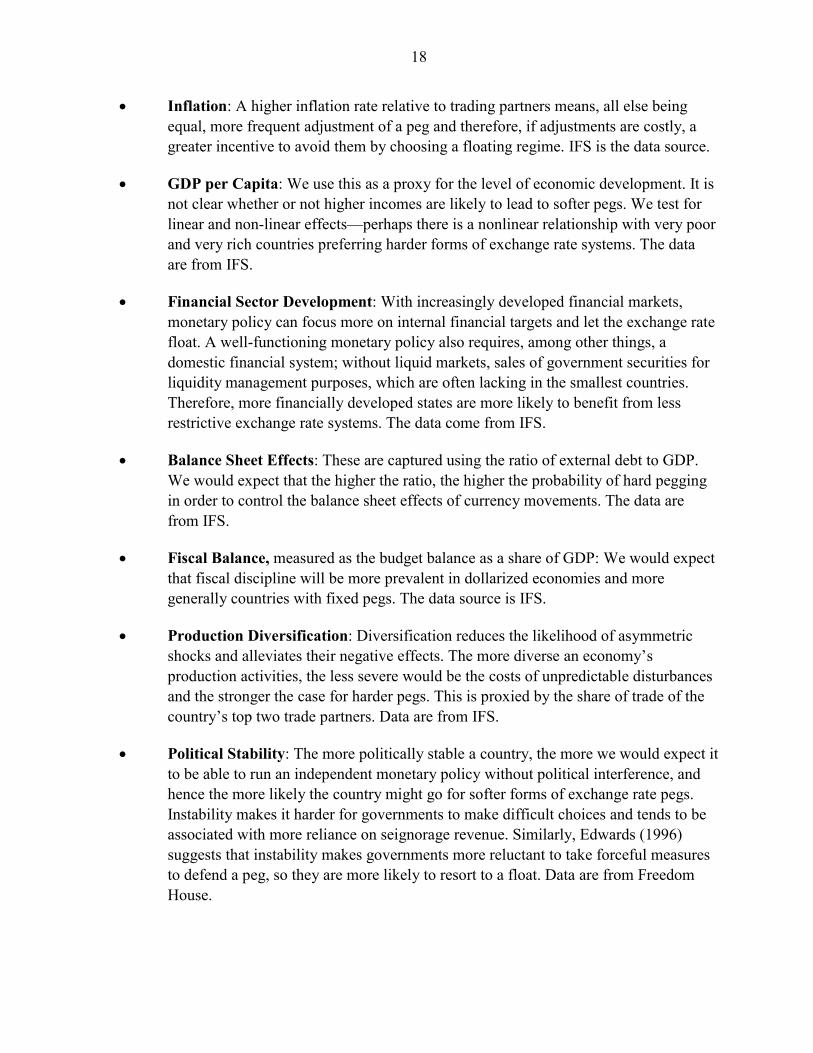
Empirically, there is only limited support for theoretical models of regime choice, which reflect several problems: First, most studies do not refine the analysis and only compare fixed with floating exchange rates, ignoring the important differences between, for instance, a dollarized economy and a fixed peg. Second, there is a de facto deviation of many exchange rates from the de jure classification. Despite the increased popularity of floats among developing countries, many of them still manage their exchange rates very closely, so they are not floating in the same sense as the major currencies do (Calvo and Reinhart, 2002). The actual behavior of exchange rates has been seen to diverge markedly from the official classification of an exchange rate regime (Bubula and Ötker-Robe, 2002). This suggests that the research might reflect some mis-specification if, for example, some intermediate regimes are not comparable because some are closer to fixed exchange rates and others are closer to pure floats.
B. Data
For this study we gathered information on the exchange rate regime for 184 countries and territories for 1974–2006. The data were constructed using IMF classifications reported in the Annual Report of Exchange Arrangements and Exchange Restrictions. There is no problem of de facto versus de jure exchange rates because in dollarized economies they perfectly overlap.
The translation of theoretical concepts into empirical measures is often constrained by data availability. The Optimum Currency Area (OCA) literature suggests that population size, openness, inflation, degree of development, and degree of financial determinants are important for the choice of exchange rate regime. We use the following variables:
• Population Size: We would expect, all else being equal, that smaller populations lead to harder pegs because there are large fixed costs involved in setting up an independent and floating currency. A floating exchange rate requires an institutional infrastructure to operate monetary policy, in the form of a central bank with the necessary starting capital and, more important, the necessary professional staff to do data collection and analysis. Therefore, dollarization is likely to predominate in the smallest countries followed by currency board arrangements. The data were obtained from World Development Report (WDI).
• Openness, as measured by the ratio of exports and imports to GDP: McKinnon (1963) made the case that the openness of an economy is a key determinant of exchange rate regime choice. He argued that, other things being equal, the more open an economy, the greater the responsiveness of domestic wages and prices to a change in the nominal exchange rate and therefore the stronger the case for a fixed exchange rate. We use International Financial Statistics (IFS) data for this variable.
18
• Inflation: A higher inflation rate relative to trading partners means, all else being equal, more frequent adjustment of a peg and therefore, if adjustments are costly, a greater incentive to avoid them by choosing a floating regime. IFS is the data source.
• GDP per Capita: We use this as a proxy for the level of economic development. It is not clear whether or not higher incomes are likely to lead to softer pegs. We test for linear and non-linear effects—perhaps there is a nonlinear relationship with very poor and very rich countries preferring harder forms of exchange rate systems. The data are from IFS.
• Financial Sector Development: With increasingly developed financial markets, monetary policy can focus more on internal financial targets and let the exchange rate float. A well-functioning monetary policy also requires, among other things, a domestic financial system; without liquid markets, sales of government securities for liquidity management purposes, which are often lacking in the smallest countries. Therefore, more financially developed states are more likely to benefit from less restrictive exchange rate systems. The data come from IFS.
• Balance Sheet Effects: These are captured using the ratio of external debt to GDP. We would expect that the higher the ratio, the higher the probability of hard pegging in order to control the balance sheet effects of currency movements. The data are from IFS.
• Fiscal Balance, measured as the budget balance as a share of GDP: We would expect that fiscal discipline will be more prevalent in dollarized economies and more generally countries with fixed pegs. The data source is IFS.
• Production Diversification: Diversification reduces the likelihood of asymmetric shocks and alleviates their negative effects. The more diverse an economy’s production activities, the less severe would be the costs of unpredictable disturbances and the stronger the case for harder pegs. This is proxied by the share of trade of the country’s top two trade partners. Data are from IFS.
• Political Stability: The more politically stable a country, the more we would expect it to be able to run an independent monetary policy without political interference, and hence the more likely the country might go for softer forms of exchange rate pegs. Instability makes it harder for governments to make difficult choices and tends to be associated with more reliance on seignorage revenue. Similarly, Edwards (1996) suggests that instability makes governments more reluctant to take forceful measures to defend a peg, so they are more likely to resort to a float. Data are from Freedom House.

19
• Corruption: Countries with poor governance (e.g., corruption) are not likely to be able to achieve macroeconomic stability for lack of credibility. We could therefore expect more corruption to lead to harder pegs. Data are from Freedom House.
• Terms of Trade Changes: The impact of this variable is ambiguous. A country subject to large terms of trade shocks, should, all else being equal, favor a more flexible form of exchange rate. However, often countries subject to shocks have to raise interest rates to avoid a loss of confidence in the currency, meaning that the impact is likely to depend on the severity of the shock. Data are from WDI.
Most of the variables emerge as statistically significant, as will be shown in the regressions. Other variables we tested were mostly insignificant and therefore were not included in the regressions: Former colonial power status, number of years a country has been independent, and geographical concentration of exports, for instance, were found to be statistically insignificant in explaining dollarization.
C. Estimation
In this section, we present the results of our logit and probit panel models to explain which variables are likely to lead to the highest probabilities of countries officially dollarizing. The models were tested in binomial and multinomial (ordered) versions. We use random effects to obtain unbiased parameter estimates and consistent standard errors in the face of within-unit correlation and heteroscedastic errors across units. In one version of the binomial regressions, the dependent variables take the value of 1 for dollarized economies and 0 otherwise; in the second, the dependent variable takes a value of 1 for hard pegs (dollarized economies, currency boards, monetary unions, and pegged exchange rates) and 0 otherwise. In the multinomial (ordered) version, the dependent variable take the value of 1 for dollarized economies, 2 for hard pegs other than dollarized economies, and 3 for nonhard pegs. Theory explains some of our results better than others.
In Table 5 we present the first set of probit regressions, comparing dollarized to non-dollarized economies. The pseudo-R2 is relatively high, suggesting that the model fits the data well.18 The results do not vary significantly between the logit and probit specifications. 18 The goodness of fit model estimates from a logistic regression are maximum likelihood estimates arrived at through an iterative process. They are not calculated to minimize variance, meaning that the Ordinary Least Square (OLS) approach to goodness-of-fit does not apply. Several pseudo R-squares have been developed to evaluate the goodness-of-fit of logistic models, with McFadden’s pseudo R-squared being probably the most popular. In this model, the log-likelihood of the intercept model ( ) is treated as a total sum of squares,
and the log likelihood of the full model ( ) is treated as the sum of sequared errors. The ratio of the
likelihoods
InterceptM
FullM
)(ln
)(ln1 ^
^
2
Intercept
Full
ML
MLR −= suggests the level of improvement over the intercept model offered by
the full model.

20
Our results suggest that the probability of dollarizing increases when a country is open, reflecting the higher benefits of lower transaction costs for an open economy.19 A country that is more likely to have a budget surplus is more likely to dollarize, though this poses the question of causality, which we do not address.
Binomial Logit
Marginal Effects
Binomial Probit
Marginal Effects
Population -136.243 (***) -42.576 -69.066 (***) -21.583(55.616) (26.540)
GDP p.c. -0.001 (***) 0.000 0.000 (***) 0.000(0.000) (0.000)
OPEN 0.061 (***) 0.050 0.030 (***) 0.012(0.017) (0.009)
Budget Balance 0.191 (**) 0.102 0.100 (**) 0.029(0.096) (0.052)
Corruption -0.116 -0.037 -0.095 -0.041(0.510) (0.267)
Financial Development 0.003 0.001 0.001 0.007(0.014) (0.008)
Government Size in Economy -0.344 (***) -0.111 -0.183 (***) -0.122(0.128) (0.065)
Constant -0.463 0.026(1.328) (0.711)
Chi-squared 100.140 99.570
No. of Observations 725 725
Pseudo-R2 0.6516 0.6479(*) t-statistics is significant at 10% level, (**) significant at 5 percent level, (***) signficiant at 1 percent level
Table 5: Choice of Exchange Rate Regime
Dollarized Economies
We also find, as expected, that the probability of being a dollarized economy rises when countries have smaller populations. When the size of government in the economy rises, a country is less likely to dollarize, which implies that dollarization imposes fiscal discipline that constraints government size. Countries with higher income per capita are less likely to dollarize. This finding is counter to the conventional wisdom that dollarizing countries tend to be richer, though it should be emphasize that the coefficient is very low. We tested for nonlinearity effects on GDP per capita (not reported) but did not find this to be statistically
19 In a discrete dependent variables, such as a probit model, we assume that responses follow a binomial distribution. Let Y be a binary outcome variable, and let X be a vector of regressors. The probit assumes that
),'()'()'(1)1Pr( βφβφβφ iiiii xxxxXY ==−−=== where φ is a cumulative distribution function of the standard normal distribution. The β parameters are estimated by using the method of maximum likelihood (see Greene, 2000, for an illustration).

21
significant either, which suggests that there is also no threshold effect. Corruption (and other policy/institutional variable we tested) does not impact the probability of dollarization, and financial sector development is not statistically significant in explaining dollarization either.
If we modify our dependent variable, by splitting our sample into pegs (i.e. we lump dollarized, currency board, monetary unions, pegged exchange rates together) and non-pegs, and compare it to our logit/probit model of only dollarizing countries, our findings change, suggesting that dollarized economies are empirically distinguishable from other hard pegs. A Chow test reveals that the null hypothesis of equality of coefficients between the two subsamples is decisively rejected in each case. It is notable that the pseudo-R2 falls significantly, which implies that factors other than just the one we have matter for hard pegs in general. The difference are notable (see Table 6).
Binomial Logit
Marginal Effects
Binomial Probit
Marginal Effects
Population -0.001 0.000 -0.001 0.000(0.001) (0.001)
GDP p.c. 0.000 (***) 0.000 0.000 (***) 0.000(0.000) (0.000)
OPEN 0.011 (***) 0.002 0.006 (***) 0.002(0.002) (0.001)
Budget Balance 0.035 0.006 0.022 0.007(0.026) (0.015)
Corruption -0.379 (***) -0.068 -0.216 (***) -0.068(0.106) (0.061)
Financial Development 0.012 (***) 0.002 0.007 (***) 0.002(0.003) (0.002)
Government Size in Economy 0.170 (***) 0.030 0.097 (***) 0.031(0.020) (0.011)
Constant -3.826 (***) -2.200 (***)(0.434) (0.238)
Chi-squared 204.330 202.250
No. of Observations 725 725
Pseudo-R2 0.2341 0.2318(*) t-statistics is significant at 10% level, (**) significant at 5 percent level, (***) signficiant at 1 percent level
Table 6: Choice of Exchange Rate Regime
Hard Pegs
Let us first analyze the similarities between dollarization and hard pegs. Openness is a statistically important predictor of going for a hard peg, as it is for dollarizing countries. Therefore, open economies are as likely to go for hard pegs such as dollarization as for other ones such as currency boards or pegged exchange rates.

22
Unlike dollarizing countries, where a small population is a good predictor of adoption, for hard pegs in general population size is not statistically significant, suggesting that population size is not a predictor of hard pegs, with countries that have both small and large population size going for hard pegs. Having a balanced budget does not raise the probability of going for a hard peg, unlike dollarizing regimes, suggesting that the fiscal discipline imposed upon dollarized countries does not hold for hard pegs more generally. Whereas corruption was not statistically correlated with dollarization, it is negatively and statistically correlated with hard pegs in general, implying that corruption tends to diminish under various forms of hard pegs, but not necessarily under dollarization. The probability of going for a hard peg increases with income per capita, but not with dollarization, suggesting that as countries get richer, they move away from dollarization. Financially developed countries are more likely to go for hard pegs than dollarizing countries, again rejecting the myth that dollarization is good for development of the domestic banking system. Finally, a good predictor of going for hard pegs is the size of the government in the economy, which contrasts again with dollarizing countries, where it was negatively correlated with the probability of dollarizing.
If we test for multinomial ordered logit and probit models (Table 7), the results do not
change significantly.
Ordered Logit
Marginal Effects (Dollarized)
Ordered Probit
Marginal Effects (Dollarized)
Population -0.001 0.000 -0.001 0.000(0.001) (0.001)
GDP p.c. 0.000 (***) 0.000 0.000 (***) 0.000(0.000) (0.000)
OPEN 0.011 (***) 0.002 0.006 (***) 0.002(0.002) (0.001)
Budget Balance 0.035 0.006 0.022 0.007(0.026) (0.015)
Corruption -0.379 (***) -0.068 -0.216 (***) -0.068(0.106) (0.061)
Financial Development 0.012 (***) 0.002 0.007 (***) 0.002(0.003) (0.002)
Government Size in Economy 0.170 (***) 0.030 0.097 (***) 0.031(0.020) (0.011)
Chi-squared 41.500 40.948
No. of Observations 725 725
Pseudo-R2 0.0468 0.0391(*) t-statistics is significant at 10% level, (**) significant at 5 percent level, (***) signficiant at 1 percent level
Dollarized, Other Hard Pegs and Non-Hard Pegs
Table 7: Choice of Exchange Rate Regime
23
What do our findings imply for Cape Verde? The regressions illustrated that many of the characteristics of dollarized economies are not present in Cape Verde, which suggests that conditions for it to profit from eurorization are not optimal: most dollarizing countries compared to other hard-pegged countries have very small population, which is not the case for Cape Verde (at least by the standards of dollarizing countries). Cape Verde’s financial sector is starting to take off, institutional weaknesses such as corruption are falling, income per capita is rising—these are attributes that our findings suggest characterize hard pegs other than dollarization. Therefore, carrying on with a hard peg other than dollarization seems at this stage to be the right option for Cape Verde.
V. PRACTICAL ASPECTS OF SUCCESSFUL EURORIZATION
If the Cape Verdean authorities decide to go ahead with eurorization, despite the lack of obvious net benefits, several practical factors would have to be taken into account.
The government has to be aware that eurorization is time-consuming. Between the date a country decides to eurorize and the day euros become legal tender, the ECB advises five years of preparations. While there have been examples of “overnight” eurorization in countries that had large macroeconomic imbalances or recently gained independence, the process was often disorderly. More generally, Cape Verde will require a number of institutional, technical, and structural reforms before introducing the euro as a national currency.
First, a flexible economy is crucial. Wages, prices, and the budget must be able to adjust quickly if economic circumstances change. Otherwise, with exchange rate devaluations and interest rate cuts no longer possible, there can be painful swings in output and employment. Cape Verde still has work to do in these structural areas (see IMF, 2008).
Because Cape Verde’s economy is much more volatile than the euro zone, a larger fiscal buffer is needed so that fiscal policy can be used as a countercyclical tool against a negative growth shock. Fiscal policy in particular must avoid a pattern of high spending in good times and low spending in bad ones. The windfall of lower debt servicing cost as borrowing spreads fall and revenue buoyancy as the tax base temporarily surges is better put to use to reduce public debt rather than spending more, even if this entails somewhat less growth in the short term. Portugal, which spent the windfall after joining the euro, has one of the lowest growth rates in the EU. Its experience suggests that the structural fiscal deficit—the deficit corrected for the economic cycle—should be well below the 3 percent Maastricht limit, especially for countries like Cape Verde where public debt is still relatively high.
Financial reforms to make the banking system more robust, especially better supervision, are also needed. Euro-zone banks have access to their national central banks as lender of last resort; Cape Verde has access only to a limited credit line from the Portuguese Treasury. If the euro is adopted, BCV will not be able to act as an LOLR as it would with a conventional peg, because its reserves of euros will be limited. Better supervised financial institutions and markets can reduce the need of the BCV to act as an LOLR.
24
Adopting a foreign currency as legal tender has been seen to lead to volatility early in the process. First, the exchange parity needs to be in equilibrium, since too low a rate would raise domestic inflation and too high a rate would bring in painful downward price adjustment to get the real exchange rate right. In the euro zone, introduction of the euro at exchange rate levels that were not in equilibrium led to a divergence of macroeconomic variables (consumption, investment, export, imports, inflation) between countries. Growth rates have been high in some countries (Spain, Ireland) that entered at undervalued exchange rates and low in some (Germany) that entered at overvalued rates. This problem has been compounded by interest rates that became procyclical—too low for high-growth economies and too high for slow-growth economies. Cape Verde will have to avoid these mistakes by estimating the best possible equilibrium exchange rate at which it wants to eurorize; not an easy task.
A related problem is that the sudden decrease in currency risk following eurorization may trigger large one-off inflows of capital into the banking system, creating far too much liquidity and leading to inflation. Often adoption of the euro or dollar as legal tender triggers large credit booms, which increase the volatility of the economy and can lead to a boom-and-bust cycle.
Dollarization has in practice meant that dollar notes were used for domestic transactions, but where the population is generally poor, as in Ecuador and Panama, local coins had to be introduced for smaller transactions. In Ecuador average transactions involve much smaller sums than in the U.S., and thus demand for coins has been much greater than the government’s ability to meet them. Such practical problems must also be addressed before eurorization.
The possibility of disenchantment with introduction of the euro if the previous exchange rate was stable should also be recognized. Introduction of the euro in Western Europe led to the perception that prices had increased dramatically, even though this is not corroborated by the statistical evidence. Prices of some food items that are consumed frequently but constitute a small share of household spending, such as a cup of coffee, did rise disproportionately as services rounded up the conversion rate. People extrapolated from these prices to prices in general, forgetting that big-ticket items, such as housing rents, were converted at the exact exchange rate. This could lead to opposition to the adoption of the euro.
Finally, technical aspects of introducing the euro have to be thought through, and they are not negligible (see Box 2).

25
Box 2. Some Practical Aspects of Introducing the Euro
Changes in the Law
a. The legal framework will have to change to allow for adoption of the euro.
b. The irrevocably fixed conversion rate from the euro unit to the national currency unit must be established.
Technical Preparation
a. Rounding: Converting amounts from the Cape Verde escudo to the euro will unavoidably cause rounding differences. Their effects vary from being merely a nuisance to bringing information processing to a halt;
b. Interfaces between systems: Developing interfaces between systems that use different currency units is often more complicated than expected because of rounding differences. Special care needs to be taken to avoid information systems accidentally combining amounts expressed in euros with amounts expressed in the national currency unit.
c. Converting historical data: Many financial information systems store the same information more than once. Conversion of historical data requires that all instances of the same data are converted in exactly the same way, otherwise unpredictable results and errors may occur. Conversion from the national currency unit to the euro involves rounding to the nearest cent. Multiplication of amounts that have been rounded results in multiplication of the rounding differences;
e. Thresholds: Very often financial information systems use threshold values that define the actions of the system. These thresholds must be converted to euros to avoid unexpected actions by the information system.
f. Displaying two currencies: Displaying information in two currency units at the same time can be difficult because the amount of space (number of columns) available on computer displays and printed reports is limited.
g. Spreadsheets: It is impossible to design a utility that can automatically convert spreadsheet models to euros. Therefore, the preferred option will often be to rebuild the spreadsheet model rather than trying to convert a spreadsheet model manually.

26
Banking Charges for Conversion to the Euro
These relate primarily to
a. the conversion of incoming and outgoing payments denominated in the euro unit or in the national currency unit during the transitional period
b. the conversion of accounts from the national currency unit to the euro unit both during and at the end of the transitional period
c. the exchange for customers of “household amounts” of national banknotes and coins for euro banknotes and coins.
d. In addition, banks should not charge a different fee for services in euros than the fee for identical services in the national currency unit.
Dialogue, Monitoring and Communications to Facilitate the Transition
a. Consumer and professional organizations could, where necessary, make voluntary agreements on good practices concerning dual display, payment practices, and minimum standards of information provision.
b. Because the changeover to the euro may pose particular problems for small enterprises, businesses, individually or through representative organizations, should agree on principles which would help small enterprises with the changeover. In particular, firms should give a period of notice before issuing or asking for invoices in euros to give their customers and suppliers time to prepare themselves properly. In addition, where a small firm requests a supplier to continue showing prices in national currency alongside prices in euros on invoices, the supplier should accept.
Source: "Update on the Practical Aspects of the Introduction of the Euro"
http://www.cnmv.es/delfos/DOSSGM/EURO/europaper21.htm .
VI. CONCLUSION
While deciding on whether to eurorize is a political decision, with the debate ideally involving the whole of society, the ultimate criterion should be economic: Do the benefits outweigh the costs?
After investigating, both empirically and theoretically, the costs and benefits of eurorization for Cape Verde, there seems to be no compelling rationale for changing the current pegged exchange rate. There are no discernible gains for hardening the peg now through eurorization
27
or any other regime given currently entrenched fiscal discipline, much enhanced policy credibility, and improved investor confidence, as evidenced by the decline in the country’s risk premium. On the contrary, eurorization
implies loss of seignorage revenues, which are significant to the BCV as a source of independent income;
constrains future regime options, making it difficult to adjust the nominal exchange rate or adopt an alternative exchange rate arrangement if that need ever arises;
imposes transitional costs because unofficial eurorization is limited in Cape Verde; and
raises legal issues for existing contracts because domestic financial instruments, short- and long-term, are predominantly denominated in local currency.
With both monetary management and fiscal policy promoting external stability, the exchange rate peg has served Cape Verde well as an anchor for financial stability and remains appropriate at this point in time. If the authorities do want to proceed, despite the lack of major tangible net benefits, one recommendation would be to ask donors to replace the seignorage losses with grants before proceeding to eurorization, which is, however, not likely to happen. Another option would be to move to a currency board, as a transitional arrangement to eventual adoption of the euro as legal tender.

28
REFERENCES
Borensztein, Eduardo, and Berg, Andrew, 2000, “The Pros and Cons of Full Dollarization,” IMF Working Paper No.50 (International Monetary Fund, Washington DC).
Bubula, A., and I. Ötker-Robe, 2002, “The Evolution of Exchange Rate Regimes Since 1990: Evidence from De Facto Policies,” IMF Working Paper No. 155 (International Monetary Fund, Washington DC).
Calvo, Guillermo, and Carmen Reinhart, 2002, “Fear of Floating,” Quarterly Journal of Economics, Vol. 117, pp. 379–408.
Collins, S., 1996, “On Becoming more Flexible: Exchange Rate Regimes in Latin America and the Caribbean,” Journal of Development Economics, Vol. 51, pp. 117–38.
ECOFIN, 2000, “Report by the ECOFIN Council on the Exchange-rate Aspects of Enlargement,” 7 November 2000, http://ue.eu.int/newsroom/main.cfm?LANG=1.
Edwards, Sebastian, 1996, “The Determinants of the Choice Between Fixed and Flexible Exchange Rate Regimes,” NBER Working Paper No. 5756 (Cambridge, MA: National Bureau of Economic Research).
Edwards, Sebastian, and Igal Magendzo, 2001, “Dollarization, Inflation and Growth” (photocopy; Los Angeles: UCLA).
Greene, William H., 2000, Econometric Analysis. (New Jersey: Prentice Hall; fourth edition).
Gros, Daniel, 2004, “Profiting from the Euro? Seignorage Gains from Euro Area Accession,” Journal of Common Market Studies, Vol. 42, No. 4, pp. 795–813.
Hausmann, Ricardo, Ugo Panizza, and Ernesto Stein, 2001. "Why Do Countries Float The Way They Float?" Journal of Development Economics Vol. 66, pp.387-414
Imam, Patrick, 2008, “Rapid Current Account Adjustments: Are Micro-States Different,” IMF Working Paper No. 233 (Washington: International Monetary Fund).
IMF, 1999, “Cape Verde—Recent Economic Developments” (Washington: International Monetary Fund), http://www.imf.org/external/pubs/cat/longres.cfm?sk=3134.0 .
IMF, 2008, “Cape Verde : Third Review Under the Policy Support Instrument—Staff Report” (Washington: International Monetary Fund). ,http://www.imf.org/external/pubs/cat/longres.cfm?sk=21640.0.
Kydland, Finn and Edward Prescott, 1977 “"Rules Rather than Discretion: The Inconsistency of Optimal Plans" Journal of Political Economy, Vol. 85, pp. 473-492.

29
Levy-Yeyati, Eduardo, and Federico Sturzenegger, 2001, “Dollarization: A Primer,” http://200.32.4.58/~fsturzen/CHAPTER1.pdf .
McKinnon, Ronald, 1963, “Optimum Currency Areas,” American Economic Review, Vol. 53, pp. 717-25
Mundell, Robert, 1961. "A Theory of Optimum Currency Areas," American Economic Review, Vol. 51, pp. 657-665
Moreno-Villalaz, Juan Luis, 1999, “Lessons from the Monetary Experience of Panama: A Dollar Economy with Financial Integration,” Cato Journal, Vol. 18, pp. 421–39.
Organization for Economic Cooperation and Development, 1997, “Belgium/Luxembourg,” OECD Economic Surveys, 1996–1997 (Paris: OECD).
Poirson, Helene, 2001, “How Do Countries Choose their Exchange Rate Regime?” IMF Working Paper No. 01/46 (Washington: International Monetary Fund).
Ronci, Marcio, 2009, “Navigating the ’Impossible Trinity’ – Monetary Management under the Exchange Rate Peg in Cape Verde,” IMF Working Paper (forthcoming) (Washington: International Monetary Fund).
Rose, Andrew, 2000. “One Money, One Market: The Effect of Common Currencies on Trade,” Economic Policy, Vol. 15, pp.7–45.
Stark, Juergen, 2008, “The Adoption of the Euro: Principles, Procedures and Criteria,” speech by a Member of the ECB Executive Board ECB delivered at the Icelandic Chamber of Commerce Reykjavik, 13 February. (http://www.ecb.int/press/key/date/2008/html/sp080213.en.html) .

30
APPENDIX 1.
HISTORY OF CAPE VERDEAN EXCHANGE RATE ARRANGEMENTS20 Colonial Period For four centuries after the uninhabited island of Cape Verde was colonized by Portugal in 1456, the main coins in circulation was the real, the currency circulating in Portugal at the time. During this period, Cape Verde became a trading center for African slaves and later a coaling and resupply stop for whaling and transatlantic shipping.
When Portugal set out in 1853 to establish a currency for its overseas colonies, in part to allow seignorage revenues to accrue to the colonies and to avoid the shipping of notes, it decreed in 1853 that coins in Cape Verde and its other colonies would have the same ratings as in Portugal. The local real was pegged one-to-one to the Portuguese real. The Banco Nacional Ultramarino, Portugal’s private monopoly note-issuer for its colonies, issued a separately marked note for Cape Verde when it opened its branch there in 1865. (Until 1930, the coins used in Cape Verde were Portuguese; its own first coins were issued in 1930).21
When the Portuguese monarchy was overthrown in 1910, the real (“royal”) was renamed the escudo (“shield”). Accounting in the new currency only began in Cape Verde and the other colonies in 1914. The escudo was, however, chronically weak until the currency reform of 1928, which explains why Portugal introduced exchange controls on September 24, 1914, and revoked them only in 1937. In 1948 the separate colonial foreign-currency funds were centralized in Lisbon. The currency reform of 1953 unified the Portuguese escudo and the currencies of its colonies, making them a true currency area similar to the sterling area or the French franc zone. Portugal established a Monetary Fund of the Escudo Zone in 1962. On February 21, 1963, Portugal issued a ministerial decree liberalizing capital movements in the escudo zone. On March 1, 1963, the fund took measures to organize a new payments system for the zone. However, Angola and Mozambique were persistently in deficit to the fund. The result was that high-priority payments were settled immediately at 1 overseas escudo = 1 Portuguese escudo, but low-priority payments experienced delays, which were a form of rationing, until funds were available to settle them at the official rate. Portugal imposed exchange controls on private transfers from overseas territories to Portugal on November 6, 1971.
20 This section draws mainly from http://www.dollarization.org and various Article IV reports on Cape Verde.
21 The Banco Nacional Ultramarino, was not required to keep its colonial currencies at par with the Portuguese escudo, though its revised charter of 31 November 1901 did require it to accept notes of one branch at any other branch at a discount of no more than 2% (except regarding Mozambique).

31
Independence In 1975 Cape Verde became independent after an evolution that took more than 20 years: In 1951 Cape Verde had become an overseas province of Portugal rather than a colony. In 1961 its citizens obtained full Portuguese citizenship. Even so, there was a strong independence movement, led by the African Party for the Independence of Guinea-Bissau and Cape Verde (Portuguese initials PAIGC). (Guinea-Bissau, on the African mainland, had also been granted provincial status.) Portuguese forces withdrew from Cape Verde and other colonies in 1975, following a coup of democratically minded leftist military against the Portuguese dictatorship in April 1974. Cape Verde became independent on July 5, 1975. In 1981, following a coup in Guinea-Bissau, Cape Verde abandoned hope of a union with it.
Until independence in 1975, the Cape Verde escudo had been equal to the Portuguese escudo. Cape Verde introduced the Cape Verde escudo (CVEsc) in 1977. The CVEsc was initially pegged to the Portuguese escudo and later repegged to a basket of currencies. In 1977–78 it depreciated by about 30 per cent and in 1982–84 by another 40 per cent. It has since been fairly stable against the Portuguese escudo. The central bank’s main monetary policy instrument was to maneuver the basket, consistently devaluing the CVEsc by 6–10 percent a year to maintain competitiveness. The BCV also rationed foreign currency when demand became excessive. As a result, foreign exchange queues were frequent. Due to shortages in their foreign currency holdings, commercial banks accumulated approved but unmet applications for foreign currencies from importers.
In 1998 a newly elected government announced a comprehensive economic reform program, including full convertibility of CVEsc. The peg system was initially changed to the Portuguese escudo, with a 6 percent devaluation, at the rate of 0.55 CVEsc/ PSE, and then to the euro at the rate of 110.3 CVEsc. The IMF provided a precautionary Stand-by- Arrangement for 1998–2000 to underpin a donor-supported domestic debt operation. The government undertook serious reforms in order to support the change in the exchange system. One of the major supports for the reform effort was a credit line arrangement with Portugal agreed in July 1998, the Exchange Cooperation Accord. The accord provides a short-term precautionary credit line from the Portuguese government of up to US$50 million, to be repaid by the end of each year with annual interest of 0.5 percent. The accord also set up a committee of representatives of the ministries of foreign affairs and finance and the central bank of both countries to monitor economic conditions. The committee can recommend to the Portuguese government suspension of the credit line. A foreign exchange law was passed in June 1998 with the ultimate intent of removing all restrictions on current and capital account transactions. In 2004 the country accepted Article VIII of the IMF’s Articles of Agreement.
The economy grew rapidly once the euro-peg system was introduced, led by FDI in export-oriented manufacturing, construction of tourism facilities, and increasing remittances.

32
However, despite the strict internal and bilateral monitoring the fiscal situation worsened in 1999 and 2000 because of elections, a severe drought, and the mounting costs of cleaning up banking sector problem),. The government consequently breached its statutory limits on central bank financing, and the external balance rapidly deteriorated. By mid-1999 the central bank had depleted foreign reserves to defend the peg. The government responded to the crisis by temporarily reintroducing foreign exchange rationing, using some privatization receipts for current budgetary obligations, and, as a last resort to defend the peg system, drew on the Portuguese credit line. In 2000 the government again drew on the credit line but failed to meet the year-end repayment, triggering a temporary suspension of the facility. External assistance virtually dried up as fiscal performance deteriorated and arrears to foreign creditors accumulated. The government, with significant help from the Portuguese government, reinitiated its reform efforts and by late 2001 the situation was normalized.
After the crisis, the government’s comprehensive reform efforts significantly improved macroeconomic conditions. The fiscal deficit was reduced to about 5 percent of GDP and the current account deficit declined to less than 10 percent of GDP. Inflation fell to the low single digits. A dynamic private sector emerged and the export base became larger and more diversified, driven by FDI . Tourism income grew to more than 10 percent of GDP. Foreign reserves accumulated and the BCV developed a number of policy instruments to control inflation and currency pressures.

33
Table 1. Exchange Rate Arrangements of Cape Verde
Dates Official arrangement
Source Unofficial arrangement, if different
Remarks
1462–October 1865 fixed; used Portuguese and other currencies
starting date inferred from general histories; no specific information on monetary history
Portuguese colonization began in 1462. "Real" is the Portuguese word for "royal." The milreis (which means "1,000 reals") and conto (1 million reals) were widely used units of account, especially toward the end of this period. In Portugal, the milreis became the main unit of account by Portugal, edict of 24 April 1835. Portugal and Portuguese colonies using its units of account became decimalized.
Oct. 1865–31 Dec. 1913 pegged; 1 local real = 1 Portuguese real
Portugal, decree of 19 October 1853
The decree of 1853 established the same ratings for coins in Cape Verde as in Portugal. The Banco Nacional Ultramarino had a separately marked note issue for Cape Verde when it opened in 1865. Its opening changed the exchange rate from fixed to pegged. Foreign coins were stripped of their legal tender quality by Portugal, decree of 1 July 1886 plus Cape Verde, decree of apparently later in 1886.
1 Jan. 1914–28 Feb. 1977 pegged; 1 local escudo = 1 Portuguese escudo
Portugal, decree of 22 May 1911; decree of 28 October 1911; Decree No. 141, 18 September 1913
Portugal changed the name of its currency to the escudo on 22 May 1911; 1 escudo = 1,000 reals (in Portuguese, reis ), or 1 milreis. Accounting in the new unit did not actually begin overseas until 1 January 1914. The change of the currency's name from real (meaning royal) to escudo (meaning shield) reflected the revolution that overthrew Portugal's monarchy in 1910. The conto, formerly 1 million reals, now became 1,000 escudos.
1 Mar.–30 Jun. 1977 local escudo, repressed (flexible basket)
Banco de Cabo Verde Web site, viewed 7 April 2005
Unlinked from the Portuguese escudo, which was suffering depreciation, and linked to an unspecified basket. Cape Verde never registered a gold parity with the IMF, since it became a member several months after IMF members had by agreement abandoned the system of gold parities.
1 Jul.–1 Sep. 1993 Cape Verde escudo, repressed (flexible basket)
Banco de Cabo Verde Web site, viewed 7 April 2005
Various issues of World Currency Yearbook show parallel market premiums of over 50% in 1984, the first year available, peaking at over 90% in 1988, then falling to mid double digits until data cease in 1993.
An issue of local notes by the central bank made changeover to a new national currency complete. The basket had 18 currencies and was weighted, though the IMF does not specify by what criteria (IMF ARER 1979: 91).
2 Sep. 1993–12 Mar. 1998 Cape Verde escudo, flexible basket
consequence of Cape Verde, revised Lei Orgânica do Banco de Cabo Verde, August 1993, cited in Banco de Cabo Verde Web site, viewed 7 April 2005
From 1996 onward there were queues for foreign exchange in the official market, but the black-market premium in the first six months of 1998 was generally well below 4% (Olters 1999: 7).
The monobank system ceased and a market in foreign currency was allowed to develop.
13 Mar.–29 Mar. 1998 pegged; 0.50 Cape Verde escudo = 1 Portuguese escudo
Cape Verde and Portugal, Acordo de Cooperação Cambial, 13 March 1998, cited in IMF ARER (1999: 179)
There were queues for foreign exchange in the official market, but the black-market premium in the first six months of 1998 was generaly well below 4% (Olters 1999: 7).
Repegged to the Portuguese escudo in the context of an economic cooperation agreement with Portugal, which apparently however did not become operational until July 1998.
30 Mar.–31 Dec. 1998 pegged; 0.55 Cape Verde escudo = 1 Portuguese escudo
Cape Verde and Portugal, Acordo de Cooperação Cambial, 13 March 1998, cited in IMF (ARER 1999: 179)
There were queues for foreign exchange in the official market, but the black-market premium in the first six months of 1998 was generaly well below 4% (Olters 1999: 7).
Devalued. Olters (1999: 7) offers a different account. He says the switch from a basket to the Portuguese escudo was announced at the end of March 1998 but became effective on 5 July 1998, and that when the switch was announced, the Cape Verde escudo was simultaneously devalued 6% against the basket. On 5 July 1998, though, the central bank maintained the preannounced exchange rate of 0.55 Cape Verde escudo = 1 Portuguese escudo.
1 Jan. 1999–present pegged; 110.27 Cape Verde escudos = 1 European euro
IMF ARER (2000: 183, 187)
Queues in the official foreign-exchange market apparently diminished toward zero at the beginning of this period.
Switched to the European euro as the anchor currency at prevailing cross rate with the Portuguese escudo when the European euro replaced the Portuguese escudo.
Source: Kurt Schuler (2008) http://www.dollarization.org/

34
Table 2. Cape Verde Monetary Authority
Dates Type Name Source Remarks
Oct. 1865–12 Sep. 1974 private monopoly issue (as part of a currency union from 1953)
Banco Nacional Ultramarino (headquarters Lisbon, Portugal)
Portugal, law of 16 May 1864 chartering Banco Nacional Ultramarino, reprinted in Banco Nacional Ultramarino (1977: 20-2); Ministry of Marine and Overseas, portaria (decree) of 4 October 1865 to government of Cape Verde, cited in Banco de Cabo Verde Web site, viewed 7 April 2005
The Banco Nacional Ultramarino received permission to operate in Portuguese colonies (except, initially, Macau and East Timor). The bank had separately marked note issues for each colony. It opened a branch in Praia in October 1865, the first bank in Cape Verde. The second bank was the Banco Colonial Português (headquarters Lisbon, Portugal), in Praia, by 1924. It went into liquidation in 1925 or 1926 (Clarence-Smith 1985: 128). The second durable bank seems to have been the Banco Totta e Açores (headquarters Lisbon, Portugal), in Praia, in 1995, although a post office savings bank (the Caixa Económica Postal) had been created in 1928. The first coins for Cape Verde were issued in 1930.
13 Sep. 1974–28 Sep. 1975
de facto central bank (with commercial banking functions)
Banco Nacional Ultramarino (headquarters Lisbon, Portugal)
Portugal, Decree-Law 451/74, 13 September 1974
The Portuguese government nationalized Portuguese-owned banks in Portugal and its colonies after coup by democratic-minded left-wing military officers in Lisbon on 25 April 1974.
29 Sep. 1975–1 Sep. 1993
monobank Banco de Cabo Verde (headquarters Praia, Cape Verde)
Cape Verde, Law 25/75, 29 September 1975; Lei Orgânica do Banco de Cabo Verde, Decision with Force of Law No. 13/76, 26 June 1976, cited in Banco de Cabo Verde Web site, viewed 7 April 2005
The banking system, previously nationalized by the Portuguese, came under local control. Cape Verde adopted a centrally planned economy. The Banco de Cabo Verde began full-fledged operations on 1 July 1976, when it received the assets and liabilities of the Banco Nacional Ultramarino and the Banco de Fomento Nacional em Cabo Verde Cape Verde. Notes of the Banco de Cabo Verde notes replaced those of the Banco Nacional Ultramarino on 1 July 1977. The central bank also took over issuance of coins, previously the responsibility of the government treasury. Cape Verde joined the IMF on 20 November 1978.
2 Sep. 1993–present central bank Banco de Cabo Verde (headquarters Praia, Cape Verde)
Cape Verde, Lei Orgânica do Banco de Cabo Verde, 1990; revised Lei Orgânica do Banco de Cabo Verde, August 1993, cited in Banco de Cabo Verde Web site, viewed 7 April 2005
The commercial banking functions of the Banco de Cabo Verde were spun off into the government-owned Banco Comercial do Atlântico (headquarters Praia, Cape Verde), in Praia. Moreover, the post office savings bank became a commercial bank, the Caixa Económica de Cabo Verde (headquarters Praia, Cape Verde). It was the second competing bank but only had about 15% of deposits.
Source: Kurt Schuler (2008) http://www.dollarization.org/