Embed Size (px)
Citation preview
Issues in Informing Science and Information Technology Volume 4, 2007
Introducing Students to Business Intelligence: Acceptance and Perceptions of OLAP Software
Mike Hart, Farhan Esat, Michael Rocha, and Zaid Khatieb Department of Information Systems
University of Cape Town, Cape Town, South Africa
[email protected] [email protected] [email protected] [email protected]
Abstract This research concerns a practical on-line analytic processing (OLAP) project given to 2nd year information systems major students. They were required to analyse two sets of sales data with two different OLAP software tools, and report both on their findings and on their experiences of working with the two products. Students then completed a validated instrument with questions about each OLAP tool, and data was analysed to assess whether proposed relationships in an adapted technology acceptance model (TAM) were supported. For each OLAP product the cog-nitive instrumental factors of result demonstrability, output quality, job relevance and perceived ease of use were found to be positively related to perceived usefulness. This supported local and international studies of business users. Facilitating conditions affected perceived ease of use, but anxiety played no significant role. Qualitative student experiences and perceptions are briefly commented on, and suggestions made about future OLAP projects.
Keywords: OLAP, business intelligence, technology acceptance, student project
Introduction In a fast-changing discipline such as information systems, it is important for academics to keep up with major current trends, and to give students both a strong practical and theoretical insight into areas regarded as important by industry and society. Since 2004 business intelligence has been a “top three” key information systems (IS) management issue and application development area both locally and internationally (e.g. Hart, Berkowitz, Ryan & Waspe, 2004; Luftman & McLean, 2004). On-line analytical processing (OLAP) is a major component of business intelligence that is mature and more accessible to a wider range of people in industry than, say, data mining. Sec-ond year students majoring in information systems at the University of Cape Town are given some lectures on business intelligence areas such as data warehousing, OLAP and data mining in their Database Systems course. Since 2004 they have also been given a practical project where
they play the role of product, brand or country managers, analyse international sales data stored in multi-dimensional OLAP cubes using a desktop version of the Cognos Powerplay product (www.cognos.com), and report on their findings. Sometimes students have also had to construct the multi-dimensional cube.
Material published as part of this publication, either on-line or in print, is copyrighted by the Informing Science Institute. Permission to make digital or paper copy of part or all of these works for personal or classroom use is granted without fee provided that the copies are not made or distributed for profit or commercial advantage AND that copies 1) bear this notice in full and 2) give the full citation on the first page. It is per-missible to abstract these works so long as credit is given. To copy in all other cases or to republish or to post on a server or to redistribute to lists requires specific permission and payment of a fee. Contact [email protected] to request redistribution permission.
Introducing Students to Business Intelligence
106
In 2006 the course organizers decided to make use of some of the business intelligence facilities offered by the US-based Teradata Student Network (TSN) (Wixom, 2004; www.teradatastudentnetwork.com ), instead of just continuing with the previous OLAP tool. The authors’ country has until recently had only one national telecommunications provider, resulting in typically low available Internet bandwidth by international standards, due to its exorbitant costs. Initial investigations with the TSN showed that the benefits of having free access to an Internet-based OLAP product and datasets were offset by very slow student access and by certain limitations in the version of the product offered.
The project for 2006 was therefore finally designed to cover analysis of a sales data cube with a desktop version of Powerplay 7 (PP) as well as analysis of a different sales dataset with a web-based version (some functionality excluded) of MicroStrategy Web (MS) (www.microstrategy.com). Students could use PowerPlay at the university or their place of resi-dence, and could access MicroStrategy over the Internet from anywhere once they had registered. As brand manager of certain retail products, they were required to write a report on subsets of each of the two OLAP datasets, compare their perceptions of the two OLAP software products, and comment on their experiences while doing the project. The main aims of the project were to give them practical exposure to using two top-ranked OLAP tools, and to a real-world business situation, as well as to improve their general analytical and writing skills. Students were in addi-tion later requested to complete a Likert-scale questionnaire on their attitude to various questions about each of the OLAP tools. This instrument was based on past technology acceptance re-search, and provided useful validated material with which course organizers and graduate stu-dents could evaluate student reaction to the products, and extend past research. It also enabled comparison of student perceptions of the products with those previously obtained from industry users. In addition, the qualitative and quantitative information gathered provided useful feedback for arranging future student projects.
The paper commences with a few comments on what is commonly referred to as business intelli-gence, and on OLAP as one of its main components. It then switches to an overview of adoption and acceptance of new technologies, as viewed through the Davis (1989) technology acceptance model (TAM) and its successors. Research objectives are specified in conjunction with an adapted TAM2 model, and the research design is described. Results of both quantitative and qualitative analysis are then given, followed by discussion and conclusions.
Overview of OLAP and Technology Acceptance
Business Intelligence The term Business Intelligence (BI) has been used in its present sense since an1989 Gartner Group article by Howard Dresner. Lönnqvist and Pirttimäki (2006) state that BI has evolved into a managerial philosophy and a business tool, which can be used to refer to:
“An organised and systematic process by which organisations acquire, analyze, and dis-seminate information from both internal and external information sources significant for their business activities and for decision making” (p. 32).
The essence of Lönnqvist and Pirttimäki’s (2006) definition is confirmed by Golfarelli, Rizzi and Cella (2004), who state that BI is the process by which businesses transform relatively meaning-less data into useful, actionable information and then into knowledge. This knowledge can be used to guide the business in the running of its day-to-day activities, as well as serving as a basis by which strategic planning and decision-making processes can be efficiently and effectively car-ried out (Golfarelli et al., 2004; Lönnqvist & Pirttimäki, 2006).
Hart, Esat, Rocha, & Khatieb
107
It is important to note that BI is a broad umbrella term or concept, and there are also many other similar and partially overlapping terms such as Competitive Intelligence, Customer Intelligence, Market Intelligence, and Strategic Intelligence (Lönnqvist & Pirttimäki, 2006).
“BI is a healthy market with continued convergence and innovation” (Friedman et al., 2005, p. 1), given the large number of varied tools, applications and technologies, and in terms of Gartner’s “Hype Cycle”, OLAP is regarded as a mature technology, now on the “plateau of productivity”. The need for academic research in the BI area is highlighted by Negash and Gray (2003, p. 3190): “Demand for Business Intelligence (BI) applications continues to grow even at a time when de-mand for most information technology (IT) products is soft. Yet, IS research in this field is, to put it charitably, sparse”.
On-line Analytical Processing (OLAP) Although multi-dimensional software existed a decade earlier, the term ‘OLAP’ was first used in 1993 by Dr. E.F. Codd, the inventor of the relational database (Hart & Porter, 2004; Pendse, 2005). Codd defined 18 rules that a product should comply with, in order to be considered an OLAP system. Codd’s OLAP rules were, however, refuted by academia on the basis that the re-search was commissioned by a vendor whose own product attributes were similar to those identi-fied (Hart & Porter, 2004; Pendse, 2005). The FAMSI (Fast Analysis of Shared Multidimensional Information) test is currently the most widely used and accepted definition of OLAP (Pendse, 2005). According to Hart and Porter (2004) and Delmater and Hancock (2001), OLAP is a pow-erful, highly interactive BI tool that enables users to, amongst other things:
• perform fast and dynamic analysis of aggregate data;
• view information from multiple perspectives or dimensions;
• carry out trend analysis over sequential time periods;
• ‘drill-down’ through various levels of data to retrieve the underlying details.
The purpose of OLAP is to “enable enterprises to gain competitive advantage by exploiting the ever-growing amount of data that is collected and stored in corporate databases and files for bet-ter and faster decision-making” (Chaudhuri & Dayal, 1997).
OLAP applications OLAP is a mature and robust technology that can "provide incremental, but significant, im-provements to established processes that will result in increased revenue or cost savings for an enterprise" (Friedman et al., 2005, p. 20). The existing literature reveals a large number of OLAP applications. These include Marketing and Sales Analysis, Clickstream Analysis, Database Mar-keting, Budgeting, Financial Reporting and Consolidation, Management Reporting, Executive Information Systems (EIS), Balanced Scorecard Applications and Corporate Performance Man-agement, Profitability Analysis, and Quality Analysis (Hart & Porter, 2004; Pendse, 2005). Due to the growing adoption of OLAP, there is a need for the acceptance of such technologies and the underlying influences to be examined if the full benefits are to be derived.
Adoption and Acceptance of Information Technology The user acceptance and adoption of IT strongly impacts many different sectors of the economy. According to Pervan and Schaper (2004), the user acceptance of IT will become progressively more significant as IT continues to play a major role in the global economy. Many organizations continue to invest large amounts of financial resources in new IT, and determining the potential user acceptance of these new information technologies is important in assessing the success of
Introducing Students to Business Intelligence
108
these investments (Chau, 1996). If the new IT is accepted and adopted by users, the chances of the system and investments being a success greatly increases (Behrens, Jamieson, Jones & Cran-ston, 2005).
Technology acceptance models Extensive research has been conducted to understand the user acceptance of IT (Taylor & Todd, 1995b; Venkatesh & Davis, 2000). Taylor and Todd (1995b, 145) state that “understanding the determinants of information technology usage should help to ensure effective deployment of IT resources in an organization”. Venkatesh and Davis (2000) note that significant progress has been made over the past decade in trying to understand and explain user acceptance of IT.
Individual reactions to using
information technology
Intentions to use information technology
Actual use of information technology
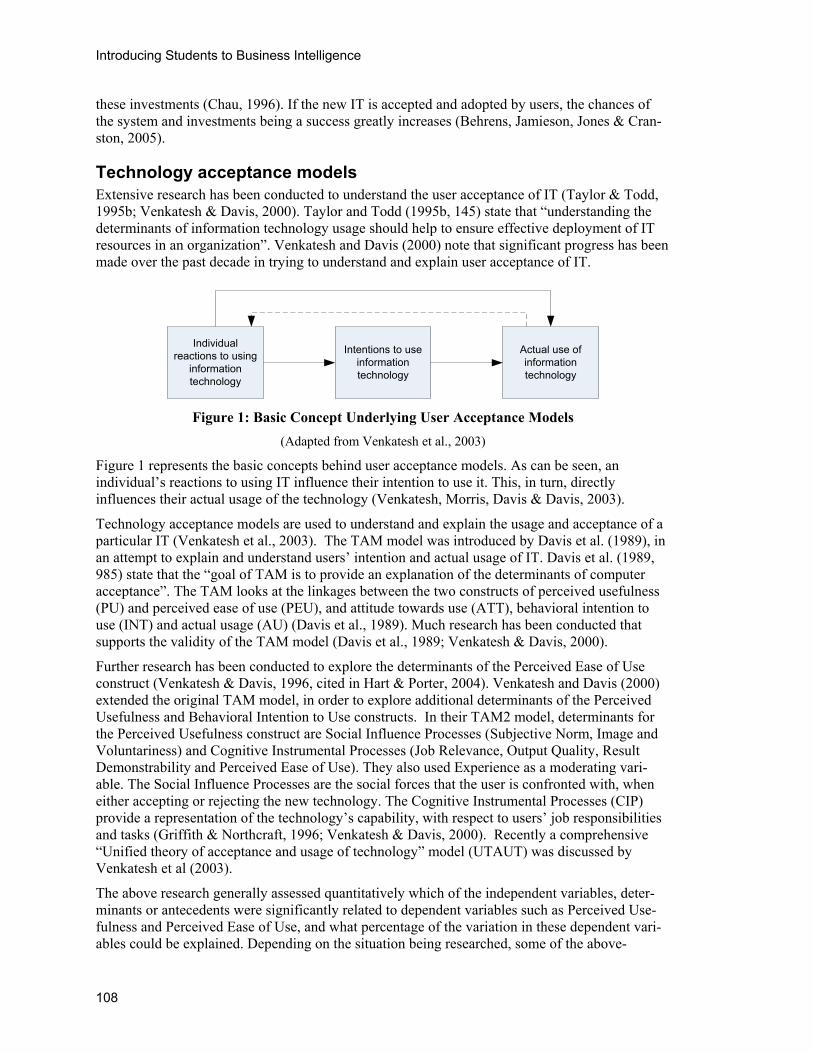
Figure 1: Basic Concept Underlying User Acceptance Models
(Adapted from Venkatesh et al., 2003)
Figure 1 represents the basic concepts behind user acceptance models. As can be seen, an individual’s reactions to using IT influence their intention to use it. This, in turn, directly influences their actual usage of the technology (Venkatesh, Morris, Davis & Davis, 2003).
Technology acceptance models are used to understand and explain the usage and acceptance of a particular IT (Venkatesh et al., 2003). The TAM model was introduced by Davis et al. (1989), in an attempt to explain and understand users’ intention and actual usage of IT. Davis et al. (1989, 985) state that the “goal of TAM is to provide an explanation of the determinants of computer acceptance”. The TAM looks at the linkages between the two constructs of perceived usefulness (PU) and perceived ease of use (PEU), and attitude towards use (ATT), behavioral intention to use (INT) and actual usage (AU) (Davis et al., 1989). Much research has been conducted that supports the validity of the TAM model (Davis et al., 1989; Venkatesh & Davis, 2000).
Further research has been conducted to explore the determinants of the Perceived Ease of Use construct (Venkatesh & Davis, 1996, cited in Hart & Porter, 2004). Venkatesh and Davis (2000) extended the original TAM model, in order to explore additional determinants of the Perceived Usefulness and Behavioral Intention to Use constructs. In their TAM2 model, determinants for the Perceived Usefulness construct are Social Influence Processes (Subjective Norm, Image and Voluntariness) and Cognitive Instrumental Processes (Job Relevance, Output Quality, Result Demonstrability and Perceived Ease of Use). They also used Experience as a moderating vari-able. The Social Influence Processes are the social forces that the user is confronted with, when either accepting or rejecting the new technology. The Cognitive Instrumental Processes (CIP) provide a representation of the technology’s capability, with respect to users’ job responsibilities and tasks (Griffith & Northcraft, 1996; Venkatesh & Davis, 2000). Recently a comprehensive “Unified theory of acceptance and usage of technology” model (UTAUT) was discussed by Venkatesh et al (2003).
The above research generally assessed quantitatively which of the independent variables, deter-minants or antecedents were significantly related to dependent variables such as Perceived Use-fulness and Perceived Ease of Use, and what percentage of the variation in these dependent vari-ables could be explained. Depending on the situation being researched, some of the above-
Hart, Esat, Rocha, & Khatieb
109
mentioned constructs might not be applicable or appropriate. Constructs to be used in the re-search that follows are now described in more detail.
TAM constructs from the model to be investigated Perceived Usefulness (PU): This is described as “the prospective user’s subjective probability that using a specific application system will increase his or her job performance within an organ-izational context” (Davis et al., 1989, p. 985). In the original TAM model, this is one of the two key measures influencing attitude towards new technology.
Perceived Ease of Use (PEU): Davis et al. (1989, p. 985) define Perceived Ease of Use as the “degree to which the prospective user expects the target system to be free of effort”. Research conducted by Taylor and Todd (1995b) revealed that Perceived Ease of Use has a significant positive effect on Perceived Usefulness, as did Stoel and Lee (2003), in their research of student acceptance of an online student portal. Numerous studies, including Venkatesh and Davis (2000), Hart and Porter (2004) and Avlonitis and Panagopoulos (2005), have also found a positive asso-ciation between Perceived Ease of Use and Perceived Usefulness. Agarwal and Karahanna (2000) and Yi and Hwang (2003), on the other hand, found no effect of Perceived Ease of Use on Per-ceived Usefulness.
Job Relevance (JR): This is defined as being “an individual’s perception regarding the degree to which the target system [or technology] is applicable to his or her job” (Venkatesh & Davis, 2000, 191). A research study carried out by Chismar and Wiley-Patton (2003) on physicians’ ac-ceptance of internet-based health applications revealed that Job Relevance had a significant posi-tive effect on Perceived Usefulness, as did research of Venkatesh and Davis (2000) and Hart and Porter (2004).
Output Quality (OQ): This refers to “consideration of what tasks a system is capable of per-forming and the degree to which those tasks match their job goals (job relevance), people will take into consideration how the system performs those tasks” (Venkatesh & Davis, 2000). Venkatesh and Davis (2000), Chismar and Wiley-Patton (2003) and Hart and Porter (2004) found Output Quality to have a significant positive impact on Perceived Usefulness.
Result Demonstrability (RD): In order for technology to gain acceptance, users should be able to explicitly attribute any gains in their job performance directly to their usage of the technology (Venkatesh & Davis, 2000). Therefore, Result Demonstrability is defined as “the tangibility of the results of using the innovation” (Moore & Benbasat, 1991, 203, cited in Venkatesh & Davis, 2003). In addition to a study conducted by Venkatesh and Davis (2000), Hart and Porter (2004) found there to be a significant positive effect of Result Demonstrability on Perceived Usefulness.
Since the inception of the original TAM model, many additional constructs have been added to further enhance and improve understanding around the acceptance of technology (Lee, Kozar & Larsen, 2003). These include Computer Anxiety (ANX) and Facilitating Conditions (FC).
Computer Anxiety (ANX): “Computer anxiety is defined as an individual’s apprehension, or even fear, when she/he is faced with the possibility of using computers” (Simonson, Maurer, Montag-Torardi & Whitaker, 1987, cited in Venkatesh, 2000). Studies conducted by Venkatesh (2000) and Hackbarth, Grover and Yi (2003) found Anxiety to have a negative effect on Per-ceived Ease of Use.
Facilitating Conditions (FC): Despite extensive research being carried out in the area of tech-nology adoption, limited research focusing on Facilitating Conditions has been conducted (Hart & Henriques, 2006). Facilitating Conditions are defined as “the degree to which an individual believes that an organizational and technical infrastructure exists to support use of the system”
Introducing Students to Business Intelligence
110
(Venkatesh et al., 2003, p. 453). Venkatesh (2000) found Perceptions of External Control (i.e. Facilitating Conditions) to have a significant effect on Perceived Ease of Use.
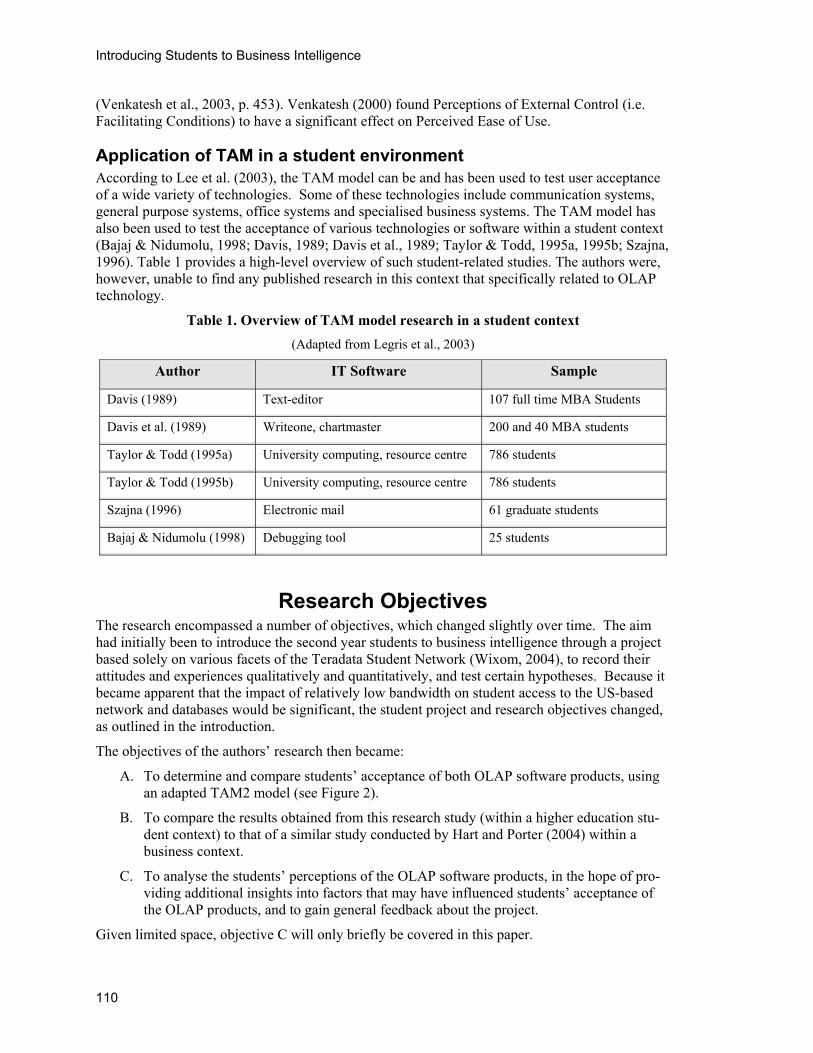
Application of TAM in a student environment According to Lee et al. (2003), the TAM model can be and has been used to test user acceptance of a wide variety of technologies. Some of these technologies include communication systems, general purpose systems, office systems and specialised business systems. The TAM model has also been used to test the acceptance of various technologies or software within a student context (Bajaj & Nidumolu, 1998; Davis, 1989; Davis et al., 1989; Taylor & Todd, 1995a, 1995b; Szajna, 1996). Table 1 provides a high-level overview of such student-related studies. The authors were, however, unable to find any published research in this context that specifically related to OLAP technology.
Table 1. Overview of TAM model research in a student context (Adapted from Legris et al., 2003)
Author IT Software Sample
Davis (1989) Text-editor 107 full time MBA Students
Davis et al. (1989) Writeone, chartmaster 200 and 40 MBA students
Taylor & Todd (1995a) University computing, resource centre 786 students
Taylor & Todd (1995b) University computing, resource centre 786 students
Szajna (1996) Electronic mail 61 graduate students
Bajaj & Nidumolu (1998) Debugging tool 25 students
Research Objectives The research encompassed a number of objectives, which changed slightly over time. The aim had initially been to introduce the second year students to business intelligence through a project based solely on various facets of the Teradata Student Network (Wixom, 2004), to record their attitudes and experiences qualitatively and quantitatively, and test certain hypotheses. Because it became apparent that the impact of relatively low bandwidth on student access to the US-based network and databases would be significant, the student project and research objectives changed, as outlined in the introduction.
The objectives of the authors’ research then became:
A. To determine and compare students’ acceptance of both OLAP software products, using an adapted TAM2 model (see Figure 2).
B. To compare the results obtained from this research study (within a higher education stu-dent context) to that of a similar study conducted by Hart and Porter (2004) within a business context.
C. To analyse the students’ perceptions of the OLAP software products, in the hope of pro-viding additional insights into factors that may have influenced students’ acceptance of the OLAP products, and to gain general feedback about the project.
Given limited space, objective C will only briefly be covered in this paper.
Hart, Esat, Rocha, & Khatieb
111
Research Methodology
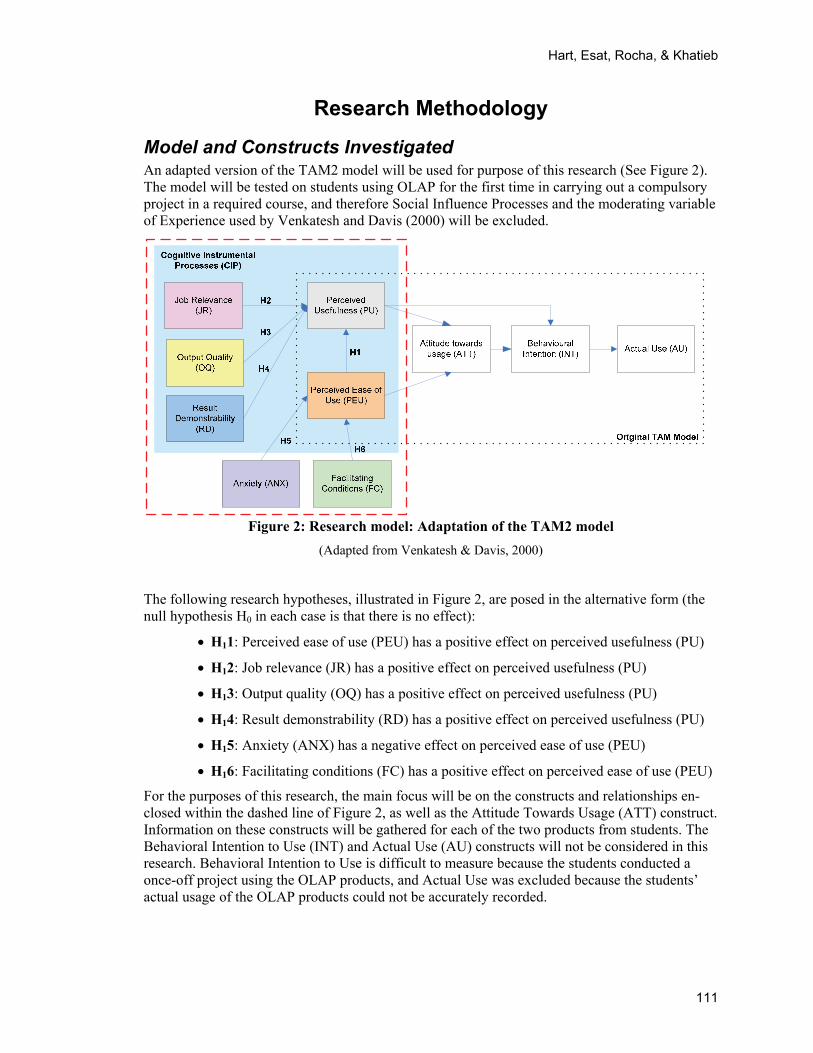
Model and Constructs Investigated An adapted version of the TAM2 model will be used for purpose of this research (See Figure 2). The model will be tested on students using OLAP for the first time in carrying out a compulsory project in a required course, and therefore Social Influence Processes and the moderating variable of Experience used by Venkatesh and Davis (2000) will be excluded.
Figure 2: Research model: Adaptation of the TAM2 model (Adapted from Venkatesh & Davis, 2000)
The following research hypotheses, illustrated in Figure 2, are posed in the alternative form (the null hypothesis H0 in each case is that there is no effect):
• H11: Perceived ease of use (PEU) has a positive effect on perceived usefulness (PU)
• H12: Job relevance (JR) has a positive effect on perceived usefulness (PU)
• H13: Output quality (OQ) has a positive effect on perceived usefulness (PU)
• H14: Result demonstrability (RD) has a positive effect on perceived usefulness (PU)
• H15: Anxiety (ANX) has a negative effect on perceived ease of use (PEU)
• H16: Facilitating conditions (FC) has a positive effect on perceived ease of use (PEU)
For the purposes of this research, the main focus will be on the constructs and relationships en-closed within the dashed line of Figure 2, as well as the Attitude Towards Usage (ATT) construct. Information on these constructs will be gathered for each of the two products from students. The Behavioral Intention to Use (INT) and Actual Use (AU) constructs will not be considered in this research. Behavioral Intention to Use is difficult to measure because the students conducted a once-off project using the OLAP products, and Actual Use was excluded because the students’ actual usage of the OLAP products could not be accurately recorded.
Introducing Students to Business Intelligence
112
Research Design The following section provides details of how this research study was designed and carried out. A positivistic philosophy was followed, with an explanatory, quantitative approach being used for objectives A and B, and a more exploratory, qualitative approach for objective C. A quantitative, hypothesis-testing approach is traditional for assessing applicability of the TAM models and their extensions, while the qualitative approach was employed to gain further insights into the students’ perceptions and any issues influencing their acceptance of the OLAP products.
The research strategy involved the distribution of structured questionnaires to the class of stu-dents, as well as use of open-ended qualitative feedback received as part of the students’ project requirements, containing descriptions of their experiences of working with the OLAP products. Given the short time allocated to the project (just under three weeks), a cross-sectional, rather than longitudinal study was undertaken.
Questionnaire design The questionnaires were adapted from strongly validated, existing research instruments and were refined to better suit the context of the target population - i.e. students. (In some questions stu-dents were asked to consider the products in terms of the future environment they expected to be working in, as opposed to their present situation). The questionnaire was built up largely from questions administered on a seven point Likert scale, taken from research instruments developed by Venkatesh and Davis (2000), Venkatesh et al. (2003), and Hart and Porter (2004). In addition there were a few demographic questions such as gender and home language.
Subjects and data collection The research subjects were second year Commerce students majoring in Information Systems at the University of Cape Town. They were currently taking a course on Database Systems which incorporated a small section on business intelligence, data warehousing, data mining and OLAP, and the practical OLAP project earlier described. The authors personally administered question-naires to the students, so as to be able to clarify any uncertainties the students may have had with specific questions, as well as to establish rapport and motivate the students. This was done shortly after the students had completed their project. Completed questionnaires were received from all members of the class present, and their anonymity was assured.
Data capture and analysis methods The responses to the questionnaires were captured electronically into a Microsoft Excel spread-sheet for preliminary data analysis, and then exported to Statistica v7 for more detailed statistical analyses and hypothesis-testing. Values for each construct were obtained by taking the mean of the scores for each question comprising the construct. Since questions 23 (ANX) and 24 (FC) were negatively phrased, the data relating to these questions (on a 7-point Likert scale) was trans-formed by subtracting from 8.
In accordance with the University of Cape Town’s research ethics guidelines, the qualitative data was extracted from the students’ electronic project reports by a third party and provided to the authors in a manner that ensured the anonymity of the students. The raw data was stored in Mi-crosoft Word documents, which were then analysed for key issues and themes. MindManagerX5 was then used to produce a mind-map that graphically represented the uncovered issues and themes, in addition to being able to track all relevant student responses.
Hart, Esat, Rocha, & Khatieb
113
Data Analysis & Results
Description of the Research Sample All 53 students at a workshop completed the questionnaire, while 11 were absent on that day (their absence did not appear to skew the sample in any significant direction). Of the 53, 75% were male and 25% were female (not far from the class composition of 72% male and 28% fe-male). There was a diverse range of home languages in the sample, the most common being Eng-lish (60%), followed by Xhosa (9%), Shona (6%), Twsana (6%) and Afrikaans (4%). Less com-mon home languages included Ndebele, Fante, Sesotho, French, Hindi, Venda, Chinese and Se-pedi (2% each).
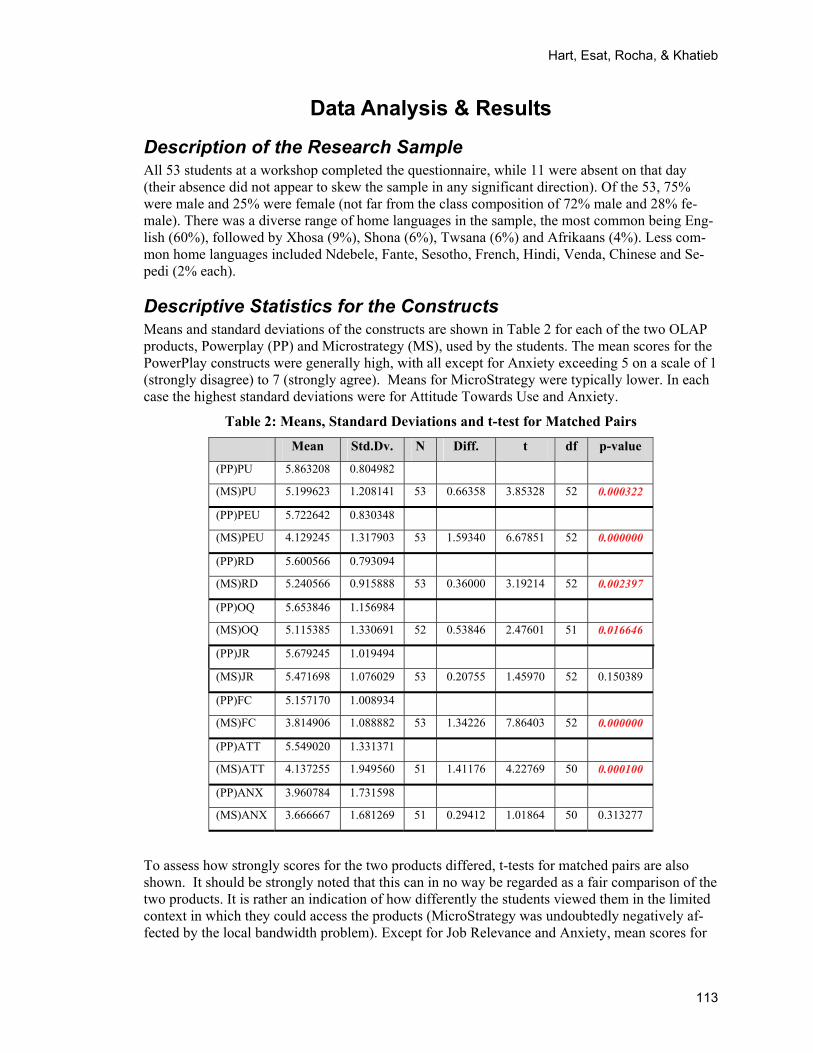
Descriptive Statistics for the Constructs Means and standard deviations of the constructs are shown in Table 2 for each of the two OLAP products, Powerplay (PP) and Microstrategy (MS), used by the students. The mean scores for the PowerPlay constructs were generally high, with all except for Anxiety exceeding 5 on a scale of 1 (strongly disagree) to 7 (strongly agree). Means for MicroStrategy were typically lower. In each case the highest standard deviations were for Attitude Towards Use and Anxiety.
Table 2: Means, Standard Deviations and t-test for Matched Pairs
Mean Std.Dv. N Diff. t df p-value
(PP)PU 5.863208 0.804982
(MS)PU 5.199623 1.208141 53 0.66358 3.85328 52 0.000322
(PP)PEU 5.722642 0.830348
(MS)PEU 4.129245 1.317903 53 1.59340 6.67851 52 0.000000
(PP)RD 5.600566 0.793094
(MS)RD 5.240566 0.915888 53 0.36000 3.19214 52 0.002397
(PP)OQ 5.653846 1.156984
(MS)OQ 5.115385 1.330691 52 0.53846 2.47601 51 0.016646
(PP)JR 5.679245 1.019494
(MS)JR 5.471698 1.076029 53 0.20755 1.45970 52 0.150389
(PP)FC 5.157170 1.008934
(MS)FC 3.814906 1.088882 53 1.34226 7.86403 52 0.000000
(PP)ATT 5.549020 1.331371
(MS)ATT 4.137255 1.949560 51 1.41176 4.22769 50 0.000100
(PP)ANX 3.960784 1.731598
(MS)ANX 3.666667 1.681269 51 0.29412 1.01864 50 0.313277
To assess how strongly scores for the two products differed, t-tests for matched pairs are also shown. It should be strongly noted that this can in no way be regarded as a fair comparison of the two products. It is rather an indication of how differently the students viewed them in the limited context in which they could access the products (MicroStrategy was undoubtedly negatively af-fected by the local bandwidth problem). Except for Job Relevance and Anxiety, mean scores for
Introducing Students to Business Intelligence
114
PowerPlay were significantly higher (at a 5% level or less) than those for MS. (A nonparametric Wilcoxon test gave similar results).
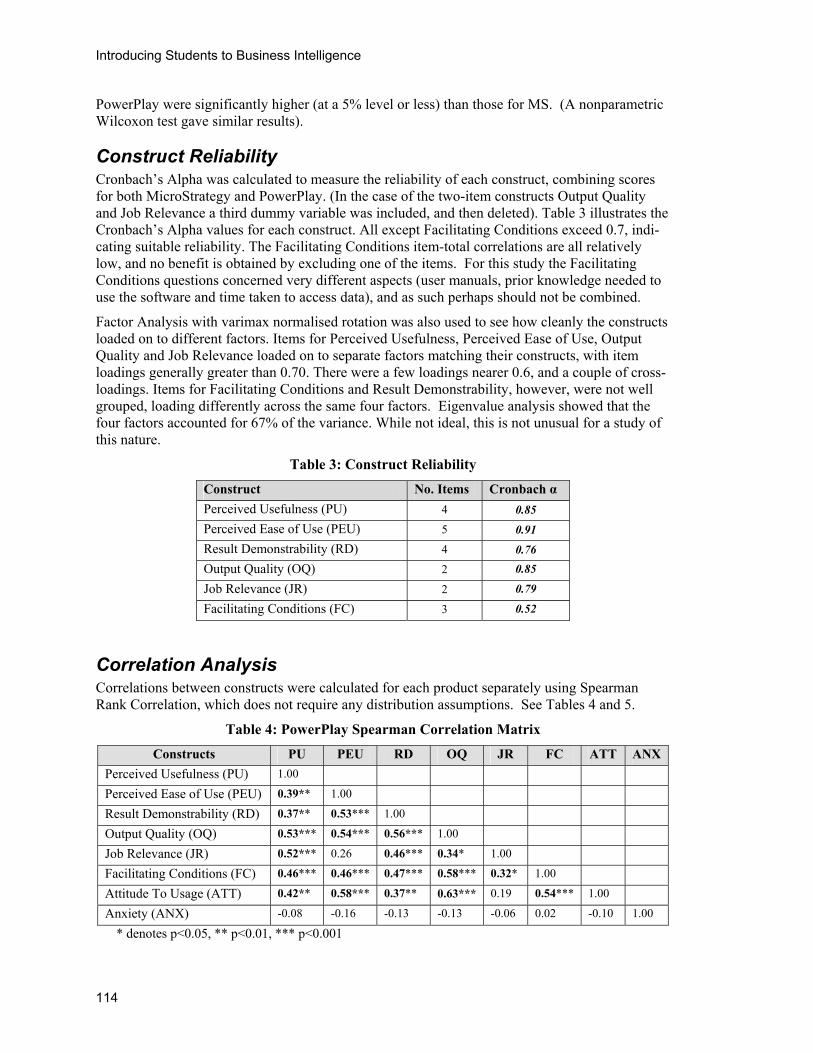
Construct Reliability Cronbach’s Alpha was calculated to measure the reliability of each construct, combining scores for both MicroStrategy and PowerPlay. (In the case of the two-item constructs Output Quality and Job Relevance a third dummy variable was included, and then deleted). Table 3 illustrates the Cronbach’s Alpha values for each construct. All except Facilitating Conditions exceed 0.7, indi-cating suitable reliability. The Facilitating Conditions item-total correlations are all relatively low, and no benefit is obtained by excluding one of the items. For this study the Facilitating Conditions questions concerned very different aspects (user manuals, prior knowledge needed to use the software and time taken to access data), and as such perhaps should not be combined.
Factor Analysis with varimax normalised rotation was also used to see how cleanly the constructs loaded on to different factors. Items for Perceived Usefulness, Perceived Ease of Use, Output Quality and Job Relevance loaded on to separate factors matching their constructs, with item loadings generally greater than 0.70. There were a few loadings nearer 0.6, and a couple of cross-loadings. Items for Facilitating Conditions and Result Demonstrability, however, were not well grouped, loading differently across the same four factors. Eigenvalue analysis showed that the four factors accounted for 67% of the variance. While not ideal, this is not unusual for a study of this nature.
Table 3: Construct Reliability
Construct No. Items Cronbach α Perceived Usefulness (PU) 4 0.85 Perceived Ease of Use (PEU) 5 0.91 Result Demonstrability (RD) 4 0.76 Output Quality (OQ) 2 0.85
Job Relevance (JR) 2 0.79
Facilitating Conditions (FC) 3 0.52
Correlation Analysis Correlations between constructs were calculated for each product separately using Spearman Rank Correlation, which does not require any distribution assumptions. See Tables 4 and 5.
Table 4: PowerPlay Spearman Correlation Matrix
Constructs PU PEU RD OQ JR FC ATT ANX Perceived Usefulness (PU) 1.00
Perceived Ease of Use (PEU) 0.39** 1.00
Result Demonstrability (RD) 0.37** 0.53*** 1.00
Output Quality (OQ) 0.53*** 0.54*** 0.56*** 1.00
Job Relevance (JR) 0.52*** 0.26 0.46*** 0.34* 1.00
Facilitating Conditions (FC) 0.46*** 0.46*** 0.47*** 0.58*** 0.32* 1.00
Attitude To Usage (ATT) 0.42** 0.58*** 0.37** 0.63*** 0.19 0.54*** 1.00
Anxiety (ANX) -0.08 -0.16 -0.13 -0.13 -0.06 0.02 -0.10 1.00
* denotes p<0.05, ** p<0.01, *** p<0.001
Hart, Esat, Rocha, & Khatieb
115
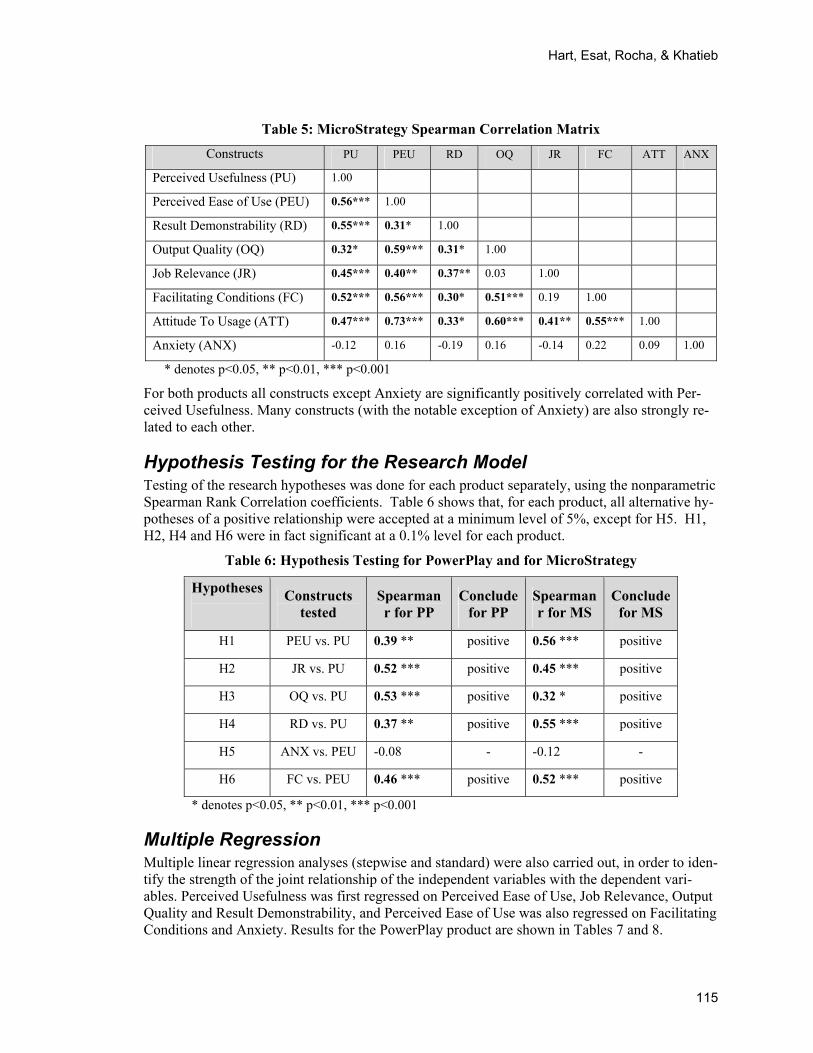
Table 5: MicroStrategy Spearman Correlation Matrix
Constructs PU PEU RD OQ JR FC ATT ANX
Perceived Usefulness (PU) 1.00
Perceived Ease of Use (PEU) 0.56*** 1.00
Result Demonstrability (RD) 0.55*** 0.31* 1.00
Output Quality (OQ) 0.32* 0.59*** 0.31* 1.00
Job Relevance (JR) 0.45*** 0.40** 0.37** 0.03 1.00
Facilitating Conditions (FC) 0.52*** 0.56*** 0.30* 0.51*** 0.19 1.00
Attitude To Usage (ATT) 0.47*** 0.73*** 0.33* 0.60*** 0.41** 0.55*** 1.00
Anxiety (ANX) -0.12 0.16 -0.19 0.16 -0.14 0.22 0.09 1.00
* denotes p<0.05, ** p<0.01, *** p<0.001
For both products all constructs except Anxiety are significantly positively correlated with Per-ceived Usefulness. Many constructs (with the notable exception of Anxiety) are also strongly re-lated to each other.
Hypothesis Testing for the Research Model Testing of the research hypotheses was done for each product separately, using the nonparametric Spearman Rank Correlation coefficients. Table 6 shows that, for each product, all alternative hy-potheses of a positive relationship were accepted at a minimum level of 5%, except for H5. H1, H2, H4 and H6 were in fact significant at a 0.1% level for each product.
Table 6: Hypothesis Testing for PowerPlay and for MicroStrategy
Hypotheses
Constructs
tested Spearman r for PP
Conclude for PP
Spearman r for MS
Conclude for MS
H1 PEU vs. PU 0.39 ** positive 0.56 *** positive
H2 JR vs. PU 0.52 *** positive 0.45 *** positive
H3 OQ vs. PU 0.53 *** positive 0.32 * positive
H4 RD vs. PU 0.37 ** positive 0.55 *** positive
H5 ANX vs. PEU -0.08 - -0.12 -
H6 FC vs. PEU 0.46 *** positive 0.52 *** positive
* denotes p<0.05, ** p<0.01, *** p<0.001
Multiple Regression Multiple linear regression analyses (stepwise and standard) were also carried out, in order to iden-tify the strength of the joint relationship of the independent variables with the dependent vari-ables. Perceived Usefulness was first regressed on Perceived Ease of Use, Job Relevance, Output Quality and Result Demonstrability, and Perceived Ease of Use was also regressed on Facilitating Conditions and Anxiety. Results for the PowerPlay product are shown in Tables 7 and 8.
Introducing Students to Business Intelligence
116
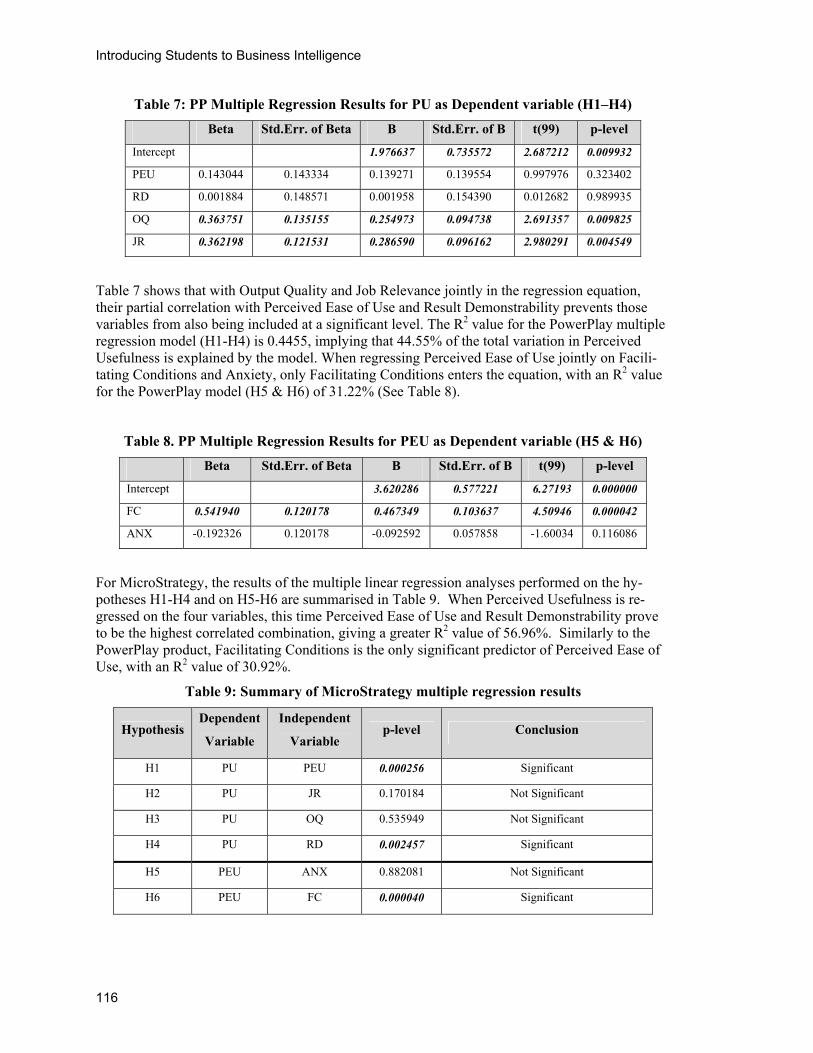
Table 7: PP Multiple Regression Results for PU as Dependent variable (H1–H4)
Beta Std.Err. of Beta B Std.Err. of B t(99) p-level
Intercept 1.976637 0.735572 2.687212 0.009932
PEU 0.143044 0.143334 0.139271 0.139554 0.997976 0.323402
RD 0.001884 0.148571 0.001958 0.154390 0.012682 0.989935
OQ 0.363751 0.135155 0.254973 0.094738 2.691357 0.009825
JR 0.362198 0.121531 0.286590 0.096162 2.980291 0.004549
Table 7 shows that with Output Quality and Job Relevance jointly in the regression equation, their partial correlation with Perceived Ease of Use and Result Demonstrability prevents those variables from also being included at a significant level. The R2 value for the PowerPlay multiple regression model (H1-H4) is 0.4455, implying that 44.55% of the total variation in Perceived Usefulness is explained by the model. When regressing Perceived Ease of Use jointly on Facili-tating Conditions and Anxiety, only Facilitating Conditions enters the equation, with an R2 value for the PowerPlay model (H5 & H6) of 31.22% (See Table 8).
Table 8. PP Multiple Regression Results for PEU as Dependent variable (H5 & H6)
Beta Std.Err. of Beta B Std.Err. of B t(99) p-level
Intercept 3.620286 0.577221 6.27193 0.000000
FC 0.541940 0.120178 0.467349 0.103637 4.50946 0.000042
ANX -0.192326 0.120178 -0.092592 0.057858 -1.60034 0.116086
For MicroStrategy, the results of the multiple linear regression analyses performed on the hy-potheses H1-H4 and on H5-H6 are summarised in Table 9. When Perceived Usefulness is re-gressed on the four variables, this time Perceived Ease of Use and Result Demonstrability prove to be the highest correlated combination, giving a greater R2 value of 56.96%. Similarly to the PowerPlay product, Facilitating Conditions is the only significant predictor of Perceived Ease of Use, with an R2 value of 30.92%.
Table 9: Summary of MicroStrategy multiple regression results
Hypothesis Dependent
Variable
Independent
Variable p-level Conclusion
H1 PU PEU 0.000256 Significant
H2 PU JR 0.170184 Not Significant
H3 PU OQ 0.535949 Not Significant
H4 PU RD 0.002457 Significant
H5 PEU ANX 0.882081 Not Significant
H6 PEU FC 0.000040 Significant
Hart, Esat, Rocha, & Khatieb
117
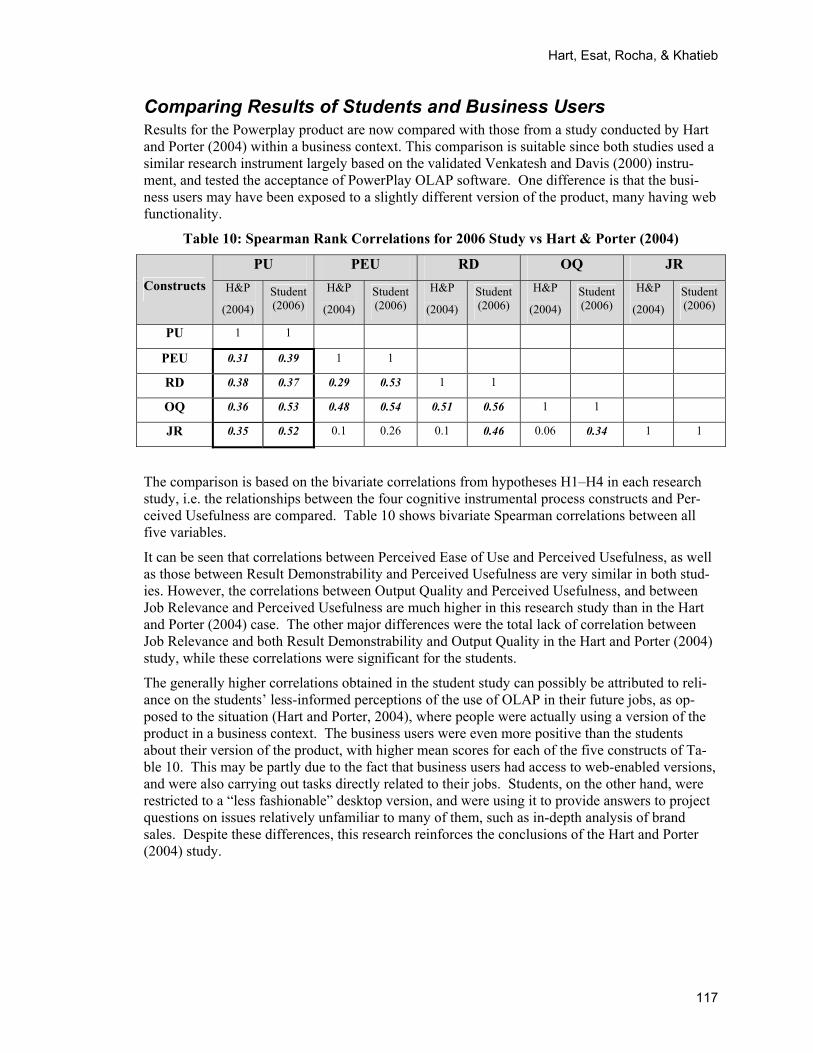
Comparing Results of Students and Business Users Results for the Powerplay product are now compared with those from a study conducted by Hart and Porter (2004) within a business context. This comparison is suitable since both studies used a similar research instrument largely based on the validated Venkatesh and Davis (2000) instru-ment, and tested the acceptance of PowerPlay OLAP software. One difference is that the busi-ness users may have been exposed to a slightly different version of the product, many having web functionality.
Table 10: Spearman Rank Correlations for 2006 Study vs Hart & Porter (2004)
PU PEU RD OQ JR Constructs H&P
(2004) Student (2006)
H&P
(2004) Student (2006)
H&P
(2004) Student (2006)
H&P
(2004) Student (2006)
H&P
(2004) Student (2006)
PU 1 1
PEU 0.31 0.39 1 1
RD 0.38 0.37 0.29 0.53 1 1
OQ 0.36 0.53 0.48 0.54 0.51 0.56 1 1
JR 0.35 0.52 0.1 0.26 0.1 0.46 0.06 0.34 1 1
The comparison is based on the bivariate correlations from hypotheses H1–H4 in each research study, i.e. the relationships between the four cognitive instrumental process constructs and Per-ceived Usefulness are compared. Table 10 shows bivariate Spearman correlations between all five variables.
It can be seen that correlations between Perceived Ease of Use and Perceived Usefulness, as well as those between Result Demonstrability and Perceived Usefulness are very similar in both stud-ies. However, the correlations between Output Quality and Perceived Usefulness, and between Job Relevance and Perceived Usefulness are much higher in this research study than in the Hart and Porter (2004) case. The other major differences were the total lack of correlation between Job Relevance and both Result Demonstrability and Output Quality in the Hart and Porter (2004) study, while these correlations were significant for the students.
The generally higher correlations obtained in the student study can possibly be attributed to reli-ance on the students’ less-informed perceptions of the use of OLAP in their future jobs, as op-posed to the situation (Hart and Porter, 2004), where people were actually using a version of the product in a business context. The business users were even more positive than the students about their version of the product, with higher mean scores for each of the five constructs of Ta-ble 10. This may be partly due to the fact that business users had access to web-enabled versions, and were also carrying out tasks directly related to their jobs. Students, on the other hand, were restricted to a “less fashionable” desktop version, and were using it to provide answers to project questions on issues relatively unfamiliar to many of them, such as in-depth analysis of brand sales. Despite these differences, this research reinforces the conclusions of the Hart and Porter (2004) study.
Introducing Students to Business Intelligence
118
Further Discussion
Testing the Adapted TAM2 Research Model Results showed that for both OLAP products, Perceived Usefulness was significantly related to all cognitive instrumental constructs (Perceived Ease of Use, Result Demonstrability, Output Quality and Job Relevance). These findings on the links between Perceived Usefulness and the cognitive instrumental constructs are in agreement with the research conducted by Venkatesh and Davis (2000) and Hart and Porter (2004), amongst others. Table 6 also shows the very strong positive relationship between Facilitating Conditions and Perceived Ease of Use for both prod-ucts, agreeing with the research of Venkatesh (2000), who viewed Facilitating Conditions as Per-ceptions of External Control.
It is notable that Anxiety has no relationship with Perceived Ease of Use, or any other construct, for both PowerPlay and MicroStrategy. This contradicts research conducted by Venkatesh (2000), who found computer anxiety to have a negative effect on Perceived Ease of Use. The authors be-lieve that this contradiction could be partly attributable to the inclusion of only one question used to measure the Anxiety construct, but mainly to the fact that the research sample consisted of stu-dents who had chosen information systems as a major, and so were unlikely to exhibit typical computer anxiety symptoms.
Apart from the Anxiety construct, the research shows that, even with two OLAP products with very different levels of acceptance in terms of mean scores obtained, the adapted TAM2 research model is strongly supported within a student population.
Going one stage further in the Figure 2 model, it can be seen from Tables 4 and 5 that for each product, Attitude Towards Usage is strongly positively related to Perceived Usefulness and more so, to Perceived Ease of Use. The construct most strongly correlated with Attitude Towards Us-age is Output Quality for PowerPlay and Perceived Ease of Use for MicroStrategy.
Another interesting result was that, for both the studies involving PowerPlay, when Perceived Usefulness was regressed on all four CIP variables, Output Quality and Job Relevance were the two variables selected to enter the equation, with Perceived Ease of Use and Result Demonstra-bility excluded. With MicroStrategy in the student study, the two significant variables were Re-sult Demonstrability and Perceived Ease of Use. There does not seem to be a clear explanation for this, and, as stressed before, these were “constrained” versions of the OLAP products.
Some Qualitative Feedback from Students (Objective C) Given space limitations of this article, very little can be reported here, but the issues mentioned most frequently, together with a few quotes are given below:
Limited bandwidth Whilst students were able to use PowerPlay either in the computer laboratories or install a copy on their home PCs, MicroStrategy had to be accessed through the Teradata Student Network (TSN) via the Internet. Most students cited the limited bandwidth (due to the virtual telecommu-nications monopoly in South Africa) as being one of the biggest challenges they faced when working with MicroStrategy. "The fact that the MicroStrategy system relies on connection speeds to and from the Internet plays against this package to a large extent”.
Graphical user interface (GUI) design Students pointed out that the GUI design of the OLAP products affected their ability to carry out their required tasks. The students’ responses around this issue were mixed, with some students
Hart, Esat, Rocha, & Khatieb
119
stating a preference for the PowerPlay GUI, whilst others stating a preference for that of Mi-croStrategy.
Help and support Students were provided with very limited tutorial-based training on the OLAP products, and their primary sources of help and support were reference manuals and on-line help. The content and quality of such materials was of importance to students, as this affected their ability to carry out their required tasks and consequently their perceptions of the two products.
Learning curve Since students had a limited period of time to conduct the project, the initial familiarisation period was of significant importance. Whilst many of the students found that they became familiar and comfortable working with PowerPlay within a short period of time, the same cannot be said about their experiences with MicroStrategy. "...without reference to the manual, reasonable preliminary results [with PowerPlay] could be obtained". "The biggest problem with the MicroStrategy soft-ware was that it took a long time to understand how to use it. Once we had figured it out, we found it to be very intuitive".
Reporting features and Interfaces with other products As part of their project, students were required to generate and manipulate reports within each of the OLAP products. From the responses, it was generally found that students perceived the re-porting features to be easier with PowerPlay than with MicroStrategy. Certain students, however, perceived the features of MicroStrategy to be superior. Some students indicated that they encoun-tered difficulties when trying to interface with (i.e. export report data to) various software prod-ucts such as Microsoft Word and Excel to create a common report.
Usability From students’ responses, the overall usability of the OLAP products also played an important role in their perceptions of them. In particular, many students cited various usability traits or characteristics as affecting the perceptions of the ease of use of the OLAP products. The term “user-friendly” featured strongly here.
Web-based nature of MS Despite the limited bandwidth issue pointed out by the majority of the students, some students suggested that the web-based nature of MicroStrategy meant a superior OLAP software product. For example: "The biggest advantage of this program is that it is web based and thus allows re-porting and analysis to take place anywhere in the world 24 hours a day. The design mode allows you to customize reports and retrieve data from the darkest of corners. This is a superb product for those always on the move". This comment would appear to relate closely to the students’ per-ceived usefulness of the product.
General comments Certain students also highlighted the considerable value and insight that they were able to gain from the OLAP project. "It was a very interesting project which crystallized the meaning of On Line Analytical Processing (OLAP) and turned it into something that was no longer theoretical, but actual, that we could manipulate and explore to understand. This hands on experience was very valuable".
Introducing Students to Business Intelligence
120
Triangulation of qualitative and quantitative information Space does not permit much comment here, but it can be seen that the main issues brought out in the comments of students on their experiences with the two products, and their attitudes towards them, reinforce the quantitative findings. Many comments refer to effects of Perceived Ease of Use issues (more so than Perceived Usefulness), and of Facilitating Conditions. This is interest-ing, as for each product the correlations with Attitude were higher for Perceived Ease of Use and Facilitating Conditions than for Perceived Usefulness. The web/bandwidth situation that appears to create differences in ratings between the two products is also widely covered in student com-ments.
Conclusions The research produced a number of useful conclusions. From the curricular point of view, it showed that students could gain a valuable understanding and practical experience of one of the primary components of business intelligence, OLAP, through a relatively short project. Students used two OLAP products with different structures and datasets, in varied conditions (an Internet-based version affected by low bandwidth, and a desktop version available at home and on cam-pus), and were able to report successfully on both the business data and the products.
The project organiser had been very concerned that the effect of slow access and timeouts due to limited bandwidth might be such that students would not be able to perform certain functions, or would be very negative about the web-based product, and the project as a whole. As it was, 82% of the students in a later course evaluation rated the OLAP project learning experience as either excellent, very good or good (vs. inadequate, poor or unacceptable). This compared with 76% in these categories for a programming and SQL project. Comments revealed that many students were prepared to endure, if necessary, the “world wide wait” to obtain the results they needed, and showed enthusiasm for the knowledge and experience gained overall. The information gath-ered from this research will be valuable in designing the project for the following year.
The results obtained also extend the published research into technology acceptance. While they are in general agreement with those from past research, it is suggested that the context of the re-search has clearly played a role. Differences from past research in significance and emphasis of relationships, and in mean scores, can to a fair extent be explained by the fact that these are 2nd year information systems students without practical experience of the business world.
The research found that the four Cognitive Instrumental Process constructs (Job Relevance, Out-put Quality, Result Demonstrability and Perceived Ease of Use) each had a significant positive effect on Perceived Usefulness. This confirms results of previous studies conducted by Venkatesh and Davis (2000), and by Hart and Porter (2004). Contrary to certain previous research (Venkatesh, 2000; Hackbarth et al., 2003), it found that Computer Anxiety had no effect on Per-ceived Ease of Use (not unexpected for IS students). Facilitating Conditions, however, had a posi-tive effect on Perceived Ease of Use for both OLAP products.
The results for students using PowerPlay supported those obtained from industry OLAP users by Hart and Porter (2004), although students tended to score the constructs lower. Not only were all four CIP variables significantly associated with Perceived Usefulness, but Output Quality and Result Demonstrability jointly explained most of its variance in each case. The students’ attitudes towards the products were more strongly affected by Perceived Ease of Use issues than by Per-ceived Usefulness ones. This appears to make sense, as they have received some general infor-mation on how important BI and OLAP are in today’s business world, but have not yet been able to experience their value in the working environment. They have, however, had to learn quickly how to come to grips with two OLAP products, and to be able to use them effectively, in the un-
Hart, Esat, Rocha, & Khatieb
121
familiar role of brand manager, to gain suitable answers to a range of questions about their sales data. In doing so they have gained strong views on ease of use.
Overall this research has added to the literature on technology acceptance in the broad business intelligence area, and will also assist the authors’ department in designing further BI projects.
Copies of the questionnaire used and the project requirements are available from the first author.
Bibliography Agarwal, R. & Karahanna, E. (2000). Time flies when you're having fun: Cognitive absorption and beliefs
about information technology usage. MIS Quarterly, 24 (4), 665-694.
Avlonitis, G. J. & Panagopoulos, N. G. (2005). Antecedents and consequences of CRM technology accep-tance in the sales force. Industrial Marketing Management, 34 (4), 355-368.
Bajaj, A. & Nidumolu, S. (1998). A feedback model to understand information system usage. Information & Management, 33 (4), 213-224.
Baron, S., Patterson, A. & Harris, K. (2006). Beyond technology acceptance: understanding consumer prac-tice. International Journal of Service Industry Management, 17 (2), 111-135.
Behrens, S., Jamieson, K., Jones, D. & Cranston, M. (2005). Predicting system success using the technol-ogy acceptance model: A case study. Paper presented at the 16th Australasian Conference on Informa-tion Systems. Sydney, Australia.
Chau, P. (1996). An empirical assessment of a modified technology acceptance model. Journal of Man-agement Information Systems, 13 (2), 185-204.
Chaudhuri, S. & Dayal, U. (1997). Data warehousing and OLAP for decision support. Tucson, Arizona: ACM Press.
Chismar, W. & Wiley-Patton, S. (2003). Does the extended technology acceptance model apply to physi-cians? Proceedings of the 36th Hawaii International Conference on System Sciences (HICSS’03), Ha-waii.
Davis, F. (1989). Perceived usefulness, perceived ease of use, and user acceptance of information technol-ogy. MIS Quarterly, 13 (3), 319-340.
Davis, F., Bagozzi, R. & Warshaw, P. (1989). User acceptance of computer technology: A comparison of two theoretical models. Management Science, 35 (8), 982-1003.
Delmater, R. & Hancock, M. (2001). Data mining explained - A manager's guide to customer-centric busi-ness intelligence. Woburn, Massachusetts (MA): Digital Press, Butterworth-Heinemann.
Friedman, T., Buytendijk, F., Hostmann, B., Dresner, H.J., Gassman, B., Schlegel, K., Bitterer, A., Feinberg, D., Linden, A., Beyer, MA., Herschel, G., Geishecker, L. & Rayner, N. (2005, July). Hype cycle for business intelligence and data warehousing, Gartner Inc. Research, G00127569.
Golfarelli, M., Rizzi, S. & Cella (2004). Beyond data warehousing: What's next in business intelligence? Presentation to DOLAP'04, 12-13th November 2004, Washington DC, USA: DOLAP.
Griffith, T. & Northcraft, G. (1996). Cognitive elements in the implementation of new technology: Can less information provide more benefits?,MIS Quarterly, 20 (1), 99-110.
Hackbarth, G., Grover, V. & Yi, M. (2003). Computer playfulness and anxiety: Positive and negative me-diators of the system experience effect on perceived ease of use. Information & Management, 40 (3), 221-232.
Hart, M.L., Berkowitz, S., Ryan, J. & Waspe. K. 2004. Key information systems management issues: A comparative study in South Africa. South African Journal of Business Management, 35(4), 49-59.
Hart, M.L. & Porter, G. (2004). The impact of cognitive and other factors on the perceived usefulness of OLAP. Journal of Computer Information Systems, 45 (2), 47-56.
Introducing Students to Business Intelligence
122
Hart, M.L. & Henriques, V. (2006). On the influence of facilitating conditions on DSS usage. Presentation to South African Computer Lecturers’ Association Conference, 25th-27th June 2006, Cape Town; SACLA.
Lee, Y., Kozar, K. & Larsen, K. (2003). The technology acceptance model: Past, present, and future. Com-munications of the Association for Information Systems, 12, 752-780.
Legris, P., Ingham, J. & Collerette, P. (2003). Why do people use information technology? A critical re-view of the technology acceptance model. Information & Management, 40, 191-204.
Lönnqvist, A. & Pirttimäki, V. (2006). The measurement of business intelligence. Information Systems Management Journal, Winter 2006, 32-40.
Luftman, J. & McLean, E.R. (2004). Key issues for IT executives. MISQ Executive, 3 (2), 89-104.
Negash, S. & Gray, P. (2003). Business intelligence. In Proceedings of the Ninth Americas Conference on Information Systems, 3190-3199.
Pendse, N. (2005). The OLAP report, [Online], Retrieved April 7, 2006 from http://www.olapreport.com
Pervan, G. & Schaper, L. (2004). A model of information and communication technology acceptance and utilisation by occupational therapists. Decision Support in an Uncertain and Complex World: The IFIP TC8/WG8.3 International Conference.
Stoel, L. & Lee, K. (2003). Modeling the effect of experience on student acceptance of Web-based course-ware. Internet Research: Electronic Networking Applications and Policy, 13 (5), 364-374.
Szajna, B. (1996). Empirical evaluation of the revised technology acceptance model, Management Science, 42 (1), 85-92.
Taylor, S. & Todd, P. (1995a). Assessing IT usage: The role of prior experience. MIS Quarterly, 19 (4), 561-570.
Taylor, S. & Todd, P. (1995b). Understanding information technology usage: A test of competing models. Information Systems Research, 2, 144-176.
Venkatesh, V. & Davis, F. (2000). A theoretical extension of the technology acceptance model: Four longi-tudinal field studies. Management Science, 46 (2), 186-204.
Venkatesh, V. (2000). Determinants of perceived ease of use: Integrating control, intrinsic motivation, and emotion into the technology acceptance model. Information Systems Research, 11 (4), 342-365.
Venkatesh, V., Morris, M., Davis, G. & Davis, F. (2003). User acceptance of information technology: To-ward a unified view. MIS Quarterly, 27 (3), 425-478.
Wixom, B.H. (2004). Business intelligence software for the classroom: MicroStrategy resources on the Teradata University network, Communications of the Association of Information Systems, 14, 234-246.
Yi, M. & Hwang, Y. (2003). Predicting the use of web-base information systems: self-efficacy, enjoyment, learning goal orientation, and the technology acceptance model. International Journal of Human-Computer Studies, 59 (4), 431-449.
Hart, Esat, Rocha, & Khatieb
123
Biographies Currently Professor in the Department of Information Systems at the Uni-versity of Cape Town, South Africa, Mike Hart teaches mainly postgradu-ates and supervises research, and was previously H.O.D. He has an MSc in Operations Research and a PhD in Mathematical Statistics from UCT, and did post-doctoral studies at the London School of Economics and Stanford University. He has held planning, distribution and information systems management positions in retailing, financial services and manufacturing. With various local and international publications, his research and consult-ing interests are mainly in business intelligence and analytics in organiza-
tions. He is presently on the editorial boards of JITE, JITCAR and EJBRM.
Farhan Esat and Michael Rocha graduated in 2006 from the University of Cape Town with Bachelor of Business Science degrees with Honours in Information Systems. Farhan is now a business consultant with an IT consulting group in Johannesburg, and Michael is employed by a software development company in Cape Town.
Zaid Khatieb graduated in 2006 from the University of Cape Town with a BCom (Honours) de-gree in Information Systems, and now has an IT position in the health insurance industry in Cape Town.