Embed Size (px)
Citation preview
CHAPTER I
INTRODUCI'ION AND REVIEW OF LITERATURE
Public expenditure plays a significant role
in the functions of economy at almost all stages of
economic development. The government resorts to expenditure
and revenue programmes to produce desirable effects on the
national income, production and employment. Public
expenditure aims at the expansion of the volume and rate of
investment in both public and private sectors and the
increase in the production of agricultural and industrial
sectors. Further, a planned scheme of public expenditure
provides for an optimum resource allocation which is not
guaranteed by the market, and also reduces the inequality
in the distribution of resources by properly directing the
expenditure towards education, medical and health care of
the low income section of the community. Besides, public
expenditure counteracts inflatlonary pressures and helps
to stabilize the economy by formulating suitable
fiscal policies such as drawing up the budget, providing
surpluses in deficit and boom in recessions by
accelerating the rate of development expenditure in the
public sector steadily. The attainment of these goals of
the state governments depends on the fiscal policy of the
central government and the autonomy of the state
governments in raising revenue and spending it.
The division of functions and revenue raising
powers between the central and fitate governments is
governed by the Constitution, largely influenced by the
Government of India Act, 1935. Functions like defence,
external affairs, foreign trade, railways, national
highways, ports, interstate trade, currency and coinage
having national significance are assigned to the Centre.
In order to carry out these functions, the Centre has been
endowed with powers to levy maJor taxes like income tax,
customs including export dutles, and corporation tax.
But the states are provided with functions like public
order, police, administration of justice, agriculture,
water supply, irrigation and canals, education, public
health and other social security services. They are
conferred with powers to levy less important taxes like
land revenue, agricultural income tax, sales tax, excise
on alcoholic liquors, entertainment tax, motor vehicles tax,
and stamp duties.
The state governments' own sources of revenue are
inadequate to meet their expanding responsibilities.
Hence, there arises a gap between the fiscal needs and the
revenue resources of the state. The framers of the
Constitution anticipated these vertical imbalances and
provided for a fiscal re-adjustment in the Constitution
itself. The Constitution proposes a transfer of resources
from the Centre to the states such as assignment of the
entire proceeds of certain taxes fkvied by the Union
Government, mandatory sharing of the proceeds of income
tax, participation in the proceeds of Union excise duty
and statutory grants-in-aid to the states. In addition, it
has also provided for an independent statutory body of
finance commissions to regulate the transfer of resources
from the Centre to the states periodically, every five
years.
Since 1951, nine finance commissions have been
set up to determine the principles of tax devolution and
grants-in-aid on the basis of certain criteria such as
Population, per capita income, indicators of
backwardness, tax efforts, percentage of Scheduled Caste
and Scheduled Tribe to the total population, and
percentage of enrolment in schools with main emphasis on
population and collection of taxes. The main issue is
whether these broad indicators coi-ncide with the reality
or whether there are any other factors which determine
the expenditure needs of the state governments. The
factors influencing public expenditure need empirical
verification of causality between expenditure and tax
revenue, which form the main components of government
finances. In this context, a brief review of both
causality and determinant studies will be useful in order to
identify the gaps in earlier studies.
1.2 REVIEW OF LITERATURE
The literature on public finance abounds with
studies that deal directly or indirectly with the
expenditure determinants of government at national, state
and local levels. The increasing significance of public
expenditure in economic development and the identification
of the determinants of public expenditure have become the
subject of recent interest among economists. The present
study reviews the literature on causality studies and on
public expenditure determination.
1.2.1 Review of Causality Studies
Among the determinants of public expendlture, tax
revenue is considered the most important because government
spending is limited by the budget constraint, which consists
of direct and indirect tax receipts. Just as an
individual's spending decisions are determined by
accumulated wealth and income, the government's spending
decisions are also determined by the resources of the
government, namely tax receipts. To find the nature and
direction of the relationship between revenue and
expenditure, causality test is administered. These
causality studies centre around certain hypotheses, such as
taxes lead to more spending and higher expenditure causes
higher tax revenues. Economists like %-iedmanl are of the
view that raising taxes will lead to more spending.
Buchanan and wagner2 argue that deceptive government
financing leads to a higher level of spending. Barro 3
states that higher government spending leads to higher
taxes. Thus,there are different views regarding the
relationship between tax revenue and expenditure. But
systematic econometric tests, like the causality test, will
reveal the exact relationship between tax revenue and
expenditure. There are several causality studies undertaken
at national and international levels to test the direction
of tax revenue and expenditure.
Most of the international otudies are related to
the U.S. federal budget. William Anderson and wallace4 have
tested the relationship between real federal spending and
real federal taxes through ranger ' s5 test of causality.
Two other variables, namely Gross National Product and
Inflation, are also included in this model. The variables
are taken both in total and per capita terms. The study
covers the period 1946-1983 based on the data of the U.S.
federal government. The results agree with Barro's
hypothesis that expenditure causes revenues, and it is
contrary to Friedman's and Wagner's views that increased
revenues cause increased expenditure. The findings are:
real expenditure causes real taxes and there is a lack of
relationship between inflation and government revenues.
Manage and ~ a r l o w ~ have examined the causal
relationship between federal expenditure and federal tax
revenue of the United States during 1929-1982 by employing
Granger's test of causality with three alternative
specifications nominal values of government outlays and tax
revenues, real government outlays and real tax receipts
deflated by the consumer price Index, and nominal government
outlays minus net interest payments on the public debt and
nominal tax receipts. In all these three specifications,
the result indicates feedback or bi-directional causality
between revenue and expenditure for all lag structures
except for (2,2) and ( 5 , 5 ) lag length. The (2,2) and ( 5 , 5 )
lag structure indicates uni-directional causality from tax
receipts to expenditure. This study does not favour tax
increases over spending reduction as a means of closing
future deficit levels of the federal government.
In their second study, Manage and hiarlow7 have
examined the causal relationship of these two variables in
the state and local governments of the U.S. during the
period 1952-1982 by employing the same test. According to
this study based on the state nominal data, there is uni-
directional causality from tax receipts to expenditure for
all lag structures except the shortest ( 2 , Z ) . For the
shortest lag structure, the test indicates bi-directional - causality. But the result on local government data reveals
no causality between the variables, i.e., the variables
remain independent. The authors have mentioned the problem
of aggregation as the reason for this result. The policy
implication is that, to solve deficit at all levels, the
government should consider the linkage between tax receipts
and expenditure.
~lackley' has tested the proposition for the U.S.
federal government that fluctuations in revenue cause
fluctuations in expenditure, and vice-versa. Also a tri-
variate causality analysis has been done by including the
Gross National Product along with these variables. The
study pertaining to 1929-1982 employs both Granger and simsg
test. According to both the tests, revenue growth causes
greater growth in expenditure. According to the trivariate
analysis, the impact of revenue on expenditure is much
greater than that of the Gross National Product.
1.2.2 Studies in Public Expenditure determinants
Based on the hypotheses of wagnerlO, and Peacock
and wiseman'', empirical studies of public expenditure have
been attempted in many countries. Adolf wagner12 has
studied the growth of public expenditure by establishing a
functional relationship between the growth of economy and
the growth of public sector activity. His law is referred
to as the Law of Increasing State Activities. Peacock and
wiseman13 have made an empirical study of the growth of
public expenditure in the United Kingdom during the period
1890-1955. They explain the growth of expenditure in terms
of displacement effect, i.e., emergencies like war and
depression cause a larger impact on public expenditure.
usg gravel^ has analysed the growth of expenditure by classifying it into (a) public capital expenditure, (b)
public consumption expenditure and (c) transfer payments.
He has also established a functional relationship between
the above disaggregated expenditure and a set of factors
such as per-capita income and population.
The pioneering study in the determinant aspect has
been the one by ~abricant,'~ in the USA and his 'Triko',
three variables, cover per-capita income, degree of
urbanisation, and density of population, to explain 72 per
cent of the variations in expenditure differences among
states. Other studies have also been made in the USA using
Fabricant's determinants.
~isherl' has analysed variations of state and
local expenditure in terms of per capita income, density of
population, and urbanisation in 48 states of the United
States in 1957. He has also examined the variation of
expenditure by functional classifications. According to the
findings, the density of population has a negative
relationship with all expenditures ewept expenditure on
police and fire protection. In contrast, increased
urbanisation is often associated with increased expenditure
except in the case of higher education, highways and natural
resources. The high income states spent more on almost all
functions. Thus, variation in population density, degree of
urbanisation and per-capita income explain a considerable
amount of variation in per-capita state and local government
expenditure among the states.
Ernest Kurnow ' s l7 model explains more
satisfactorily the variability in per capita state and local
expenditure of the Unlted States in 1952 than either
Fisher's or Fabricant's study. In order to improve the
predictive ability of the model, one more variable is
introduced namely, federal grants-in-aid, and the four
variables employed are per-capita personal income, degree of
urbanisation, per-capita federal aid and student teacher
ratio. According to the findings, for every 10 per cent
increase in per-capita income, there is 5.6 per cent
increase in per capita expenditure and degree of
urbanisation; federal grants also have the same positive
relationship, while the student-teacher ratio has a
negative relationship with expenditure.
Bird18 has suggested that the positive theory of
public expenditure for present purposes may be considered to
encompass the study of the following subjects: (i) the
determinants of the volume of public egenditure. (ii) the
determinants of composition of public expenditure, i.e.,
what goods and services are financed through the public
sector and how the size of expenditure changes over time,
and (iii) behavioural properties of public expenditure such
as centralisation and stability.
~a11" has established a relatlonshlp between per
capita income and expenditure disaggregated as current
economic services, health services and agr~culture, in
forty-six developing countries by using cross-section data.
The countries have been divided into three groups on the
basis of their per capita income. Hls study shows that
there is no significant relationship between per capita
Gross National Product and total government expenditure
expressed as per cent of Gross Domestic Product. The
changes in per capita income explain a relatively smaller
part of the changes in government expenditure.
Metwally and ~ohamoud~' offer a cross-country
analysis, classifying the countries of the world into low-
income developing economies, lower-middle income developing
economies, upper-middle-income developing economies, high-
income oil exporters, and developed industrial market
economies on the basis of per capita income. The study
examines the effect of the stage of development on the
relationship between the country's size and its expenditure
and tests for economies of scale with respect to total
expenditure as well as different types of expenditure as
defence, education, health, housing amenities, social
Security, welfare and economic services. His main findings
are: (i) the higher the stage of development, the larger the
amount of total gross national product absorbed by total
expenditure on government services: (ii) The ratio of total
expenditure on government services does not vary with the
country's size as measured by population; (lil) per capita
total expenditure is correlated wlth income per capita only
in the middle income developing countries. ~otz'' analyses
variation in the composition and size of government
expenditure among thirty-seven developing countries and the
factors which influence government expenditure decisions by
using cross-section data. He classifies expenditure into
economic services, education and health, social welfare and
defence, and relates these types of expenditure with six
socio- economic variables, namely per capita income, per
cent of population living in urban areas, exports of
minerals and oil as per cent of Gross National Product,
literacy rate, and notes and coins per capita. He finds a
closer relationship between welfare expenditure and degree
of urbanisation, literacy, per capita income and degree of
monetisation. Besides, education and health expenditure is
closely related to openness and per capita income. The
defence expenditure and per capita income are found to have
a negative relationship.
Martin and ~ewis" have analysed the size and
composition of public expenditure and revenue for 16
countries, which are classified as developing and developed
countries. The expenditure is classified into revenue and
capital expenditure, and the study shows that the richer
countries have a higher revenue expendlture relative to
Gross National Product (GNP). ~uznet'~ does not support
Martin-Lewis' findings that high Income countries spend more
on defence relative to Gross National Product than the low
income countries. He also establishes a positive
relationship between per capita income and the current
transfers in different countries.
Richard horn'^ has found that the percentage of Central government expendlture in Gross National Product
(GNP) and the proportion of social expenditure to total
government expenditure are positively correlated to per
capita income in developing countries. i err is'^ identifies public spending pattern for several categories, education,
welfare, housing, health, highways and defence. Based on
the data 1973 by taking into consideration variables like
tax, price, household income, education, poverty level
income and number of cars. This is an attitudinal approach
based on demand.
~euthold'~ model is a median v6ter model used to
predict the state spending for the fiscal year 1985 in the
state of Illionis. State public expenditure is classified
into four major categories namely, human services,
elementary and secondary education, higher education, and
health services. The important explanatory variables are
median income and median tax share, total population, school
age population, young adult population, income per capita
and income growth. The study shows that in the human
services, income per capita and income growth are important,
and that an increase in these variables results in a
reduction in the share of this expenditure. The size of the
school age population has a strong positive influence on the
total education expenditure. The share of the health
service expenditure is related to the size of the resident
population.
Mann and ~ c h u l t h u s e s ~ ~ have carried out an
analysis of expenditure determination in Argentina's public
spending during the period 1930-1977. Public expenditure
has been disaggregated into i) current expenditure on (a)
wages and salaries, (b) impersonal goods and services, c)
transfer to families, and ii) capital expenditure. The
explanatory variables under four broad concepts are:
1) Under economic factors - i) real Gross Demestic Product per Capita, ii) ratio of imports to Gross Domestic Product,
iii) ratio of Exports to Gross Domestic Product, iv) foreign
trade co-efficient, v) manufacturing sectdral share of Gross
Domestic Product, and vi) agricultural sectoral share of
Gross Domestic Product; 2) Under monetary factors - i) money
supply, and ii) inflation rate, and 3) Under financial
factors - i) total tax revenue, ii) personal income tax
revenue, iii) per capita personal income tax revenue, and
iv) share of personal income taxes in total tax revenue, and
4) Under political factors - i) president elected by popular
vote or not, ii) civilian or military president, and ili)
year in which new president took office. Thus this analysls
covers all the economic, flnnncial, monetary and political
factors to predict the changes in the expenditures of the
State. The main findings of this model are that real per
capita Gross Domestic Product tends to pull the expenditure
output ratio upward while the tax revenue and non-elected
government acts in the opposite direction, whereas the
civilian and popularly elected government administration
tends to increase the spending levels. The rate of
inflation influences the expenditure output ratio both
inversely and directly. The revenue also influences capital
expenditure. There is a direct relationship between real
Gross Domestic Product per capita and the transfer share of
Gross Domestic Product. According to this model, rate of
economic growth based on Gross Domestic Product, political
factors and rate of inflation mainly influence the public
spending of Argentina.
~ a n d a u ~ ~ establishes a relationship between share
of government consumption expenditure in Gross Domestic
Product and the rate of growth of real per capita of Gross
Domestic Product in nearly 104 countries of the world
classified as high income, middle income, low income, and
Third world countries including oil producers during
1961-1972. The study shows that there is a negative
relationship between the share of government consumption
expenditure in Gross Domestic Product and the rate of growth
of per capita Gross Domestic Product in all these countries.
Higher government expenditure and investment in education
explain the slow growth of low income countries. There is
also a positive relationship between total investment in
education and the growth rate, according to this study.
29 The growth of government is explained by Muller
in a public choice perspective, i.e., the economic analysis
of political institutions in the United States during
1929-1982. Meltzer and kIichard3O have also presented a
public choice analysis where the role of the median voter is
emphasised in the growth of government.
Sohrab Abizadeh and Mahmood yousefi3' empirically
examine the secular growth of federal government expenditure
in Canada using both political and economic variables. The
expenditure is classified as exhaustive and non-exhaustive,
and again as expenditure in real or nominal terms. This
study takes into consideration both econqmic and political
variables like, internationnlly induced economic change,
dependency ratio, rate of unemployment and the growth in
real income. The study shows that in Canada, the use of
real or nominal data does not change the results. The use
of exhaustive and non-exhaustive measures of the size of
government significantly changes the results, which
indicates that factors affecting exhaustive expenditures are
not necessarily the same as those which affect non-
exhaustive measures. Internationally induced economic
changes have influenced significantly the growth of
government. The results also show that larger the
dependency ratio, the higher the federal government's
expenditure on social goods and services. The higher the
rate of unemployment, the higher the growth of government
expenditure in the next period. The more liberal' the
leader of the party in power the larger will be the size of
public spending. Finally, the growth in real income is
accompanied by higher government expenditure. Thus, the
above study considers both economic and political variables
that determine public spending in Canada.
Morss, Fredland and ~ y m a n s ~ ~ specify certain
economic, demographic and political factors which have a
short run impact on the expenditure pattern of the
governments of 48 states in the United States during
1951-1962. The dependent variables are total expenditure
and capital expenditure, and the explanatory variables
influencing this expenditure are budgetary deficit,
population, per capita state debt, and political factors.
The findings show the importance of financial variables in
the case of capital expenditure. In addition, inter-party
competition and the degree of co-operation between
legislature and governor have an important lmpact on
expenditure behaviour. This study implies that for
understanding the determinants of state expenditure a
disaggregated study of the political and institutional
environments , of individual states is necessary.
~ h a r a n s k ~ ~ ~ and ~ i s h e r ~ l also emphasise the influence of
political variables in the expenditure determinant studies
by segregating the effect of regional factors and political
factors of index of two party competition at state and local
level expenditure respectively.
The above international studies on expenditure
determinants have analysed the influence of economic,
demographic, financial, monetary, and political factors on
the expenditure of national, state and local governments.
However, most of the studies in India have concentrated on
the growth and pattern of public expenditure and a very few
studies on this aspect of expenditure determinants.
Mathews3' has analysed the pattern of expenditure during
1937-1956 in the Indian Union and examined the significance
of government policies in the changing expenditure pattern.
Mukherjee3' has established a theoretical link between
aggregate economic activity and the activity of the public
sector. Sir Purushotamdass Thakuradas Research Wing Study 37
presents a factual study of the finances of government of
India from 1950-51 to 1964-65. ~anchmukhi~~ examines the
effects of expenditure on education and health, the
knowledge of which is essential for making rational
decisions in policy making.
Following Peacock and Wiseman, eddy^' has presented an analysis of the growth of public expenditure in
India from 1872 to 1968 and examined it in relation to
national income, and also tested the hypothesis of Wagner in
the Indian context. In his second study4', he has analysed
the growth of public sector employment and identified the
variation in public sector expenditure from state to state.
He explains the variance in terms of per capita federal
transfers.
~ u ~ t a ~ l has evaluated the effect of Central
Government expenditure on income redistribution and 42
generation of employment opportunities in 1977. Zahir
has also followed the same income redistribution in Indian
public expenditure analysis. ~ a d a l g i ~ ~ has presented the
trend and growth in state government expenditure of the
Indian states from 1951-52 to 1965-66. His study is
confined only to revenue expenditure. ~ h i m m a i a h ~ ~ and
~ a n ~ u n d a p p a ~ ~ have also made inter-state comparison in state
expenditures and analysed the growth and expenditure of
state governments. ~ a n j e g o w d a ~ ~ has examined impact of
public expenditure on the growth process and on the feedback
effects on tax revenues necessary to finance it in the State
of Karnataka. Thus, all these studies have focussed only on
the growth trend and pattern of expenditure in India and
Indian states.
~ a t t a ~ ~ has examined the determinants of
expenditure in the economy of West Bengal during 1951-52 to
1973-74. He has classified expenditure into total
expenditure, revenue, capital and non-developmental
expenditure, on both accounts and both in aggregate and per
capita terms. The explanatory variables are per capita
income, the degree of urbanisation, financial transfers from
the centre to the state, expenditure on debt services, per
capita revenue, etc. he' findings show that the influence
of per capita income is significant on total expenditure on
both accounts.
~an~anal' attempts to explain the expenditure
behaviour of the government of Rajasthan during 1954-55 to
1974-75 by considering two dependent variables namely, per
capita total expenditure and per capita capital expenditure.
The set of explanatory variables represents percentage of
scheduled caste and scheduled tribe population, per capita
income, density of population, percentage of urban
population, per capita federal aid, percentage of employees
in public sector and per capita debt. According to her
findings, percentage of urban population, per capita income,
and percentage of employees in public sector are the
variables which explain the variations in per capita capital
expenditure significantly, while percentage of scheduled
caste and scheduled tribe, per capita federal aid, and
percentage of employees in public sector variables explain
the variation in per capita total expenditure in a
significant way. ~ a o ~ ' has identified the factors that
cause change in tax revenues and non-plan revenue
expenditures in four Indian states, namely Karnataka,
Orissa, West Bengal, and Kerala. The independent factors
are per capita income, percentage of primary sectoral
income, and price index for working class in the states.
Besides these economic variables, change of political
parties in power is included through the dummy variable
technique. The main findings of this study are: (i) in all
the four states, the growth of expenditure is due to the
increased cost of providing them; (ii) In Kerala and West
Bengal, the level of expenditure is not influenced by the
economic variables; and (iii) Less stable government
results in significantly higher level of expenditure,
particularly in social and economic services. The
ideological leanings of the parties in power have not been
found to affect significantly the level of expenditure in
the states.
These expenditure determinant studies show that
factors influencing expenditure are not examined in depth
either on macro or on micro level, particularly in the
Indian context. Further, most of the Indlan studies are
based on cross section analysis and confine themselves to
only a few items of expenditure. Thus, the review of the
above studies reveals the following gaps in the current
literature of determinants of public expenditure in the
Indian context:-
i) Causal relationship between tax revenue and
expenditure of Indian states has not been verified
empirically.
ii) The political, economic and demographic factors are not
considered together to identify the determinant
factors of each item of public expenditure in Indian
States.
iii) There are vast changes in the political scenario and
the expenditure policies of the state governments.
In this area also, attempts have not been made to
identify the impact of political instability on public
expenditure.
1.3 OBJECTIVES OF TBE PRESENT STUDY
In view of these gaps in determining the states'
expenditure the present study has the following objectives:-
i) To inquire into the role of finance commissions in the
transfer of resources from the Centre to the State
governments.
ii) To examine the trend and pattern of expenditure of
Indian states under different functional
classifications.
iii) To elucidate the causal relationship between tax
revenue and total expenditure and disaggregated total
expenditure as capital and revenue expenditure with tax
revenue.
iv) To identify the factors influencing each item of
expenditure of Indian states over the period 1969-70 to
1988-89.
V) To examine how far the political variables
significantly influence each item of expenditure
across Indian states and also to identify the
changes in the factors influencing each item of
expenditure at different points of time.
To test the causal relationship between tax
revenue and expenditure of all Indian states and the
total expenditure disaggregated as capital and revenue
expenditure with tax revenue of states, ranger^' and Sims 5 1
Causality Tests are used.
Let Rt(tax revenue) and Et(expenditures) be - jointly covariant stationary with Et and Gt representing all
* * past values, and R and E all past and present values of
each. Also, let Q. '(Et/2) be the minimum error variance
or prediction Et given Z which is composed of any - - combination of Rt, Et, and R * ~ . Taking note in the
opposite direction, the four situations may be defined as
- (1) If r '(E~/%~, Rt) ( Q2(~t/~t), then R causes
to E, that is "Inclusion of past R in the set of values
upon which the prediction of E is conditioned lowers
the minimum predictive error variance"52, (2) If 0
2 - - 6 ( E ~ / E ~ , R * ~ ) < C'(E~/E~, R ~ ) , then R instantaneously
causes E. (3) If situation (1) holds for both directions
(i.e. R causes to B, and vice versa), then the feedback
effect is said to be present. ( 4 ) If neither the inclusion
- * of Rt and R improve the prediction of Et and vice
versa, then R and E move independently. For a
simple bivariate model these patterns of-causality can be
identified by estimating regressions of R and E on all the
relevant variables including current and past values of R
and E respectively, and by testing the appropriate
hypothesis with the application of Granger and Sims
Test. The Granger Test is specified in the following
model.
where et and Et are mutually uncorrelated.
(1) and ( 2 ) are estimated and the null hypothesis
is tested that c ,=Y .=O for all i(i=0,1,2,. . . . .n) 1 1
against the alternative hypothesis that ci # 0 and
3i f 0 for at least some i's.
The Sims test (1972) follows the logic that the
future cannot cause the past. The causation between Xt and
Yt may be identified by estimating the following equation:
Under the maintained hypothesis Xt causes Yt.
(ii) f bj (j LO) =/=O j=-n
for hi-directional causality (feedback) between the two
variables, it is to be satisfied that %'ai (i 4 0) = 0 and
& b. (j L 0) = 0. The condition of independence is that J
2 a i ( i < 0 ) # 0 and z b ( J C O ) = + O i=-m j=-n J
Generally, the F test is quite sensitive to the
presence of auto-correlation among the residuals. Hence,
the causality test is also examlned with the help of
filtering the time series data. Sims (1972) used a filter
(1-0.75 L ) ~ when LRt = LRt-1 and claimed that "this filter
approximately flattens the spectral density of most economic
time series". 53
In order to identify the factors influencing the
aggregate expenditure of Indian states under different heads
over a period of time, first the log linear multiple
regression model is applied.
&-I Yjt = poi + f$ 4 BijlnXijt + e . J 1 Where i = 1,2,. . . . . ,9
j = 1,2 ,......, 14
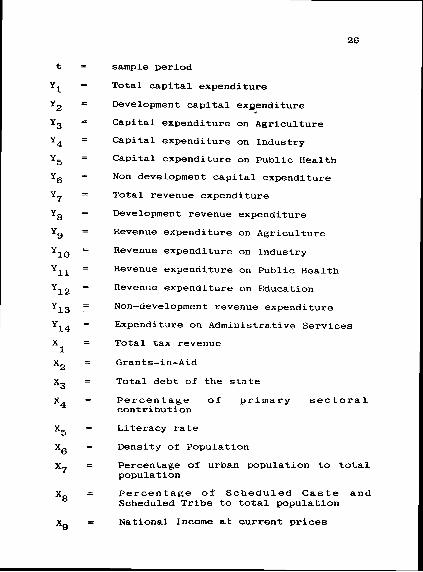
sample period
Total capital expenditure
Development capital expenditure
Capital expenditure on Agriculture
Capital expenditure on Industry
Capital expenditure on Public Health
Non development capital expenditure
Total revenue expenditure
Development revenue expenditure
Revenue expenditure on Agriculture
Revenue expenditure on Industry
Revenue expenditure on Public Health
Revenue expenditure on Education
Non-development revenue expenditure
Expenditure on Administrative Services
Total tax revenue
Total debt of the state
Percentage of primary sectoral contribution
Literacy rate
Density of Population
Percentage of urban population to total population
Percentage of Scheduled Caste and Scheduled Tribe to total population
National InCOIne at current prices
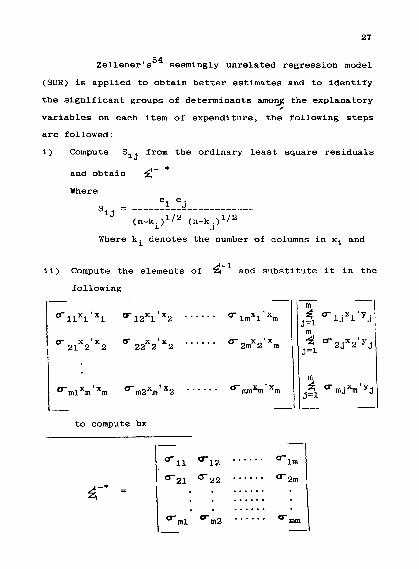
~ellener's~~ seemingly unrelated regression model
(SUR) is applied to obtain better estimates and to identify
the significant groups of determinants amon& the explanatory 1
variables on each item of expenditure, the following Steps
are followed:
i) Compute S . from the ordinary least square residuals 1 J
and obtain f - * Where
Where ki denotes the number of columns in xi and
ii) Compute the elements of 4-I and substitute it in the following
- CTl1X1'x1 Wl2X1'X2 ......
u x 'x 6 22~2 ' ~ 2 ...... 1 2 1 2 2 j=1
...... ~-,~x,,,'x~ crm2xm'x2 ~mrnxmtxrn
- to compute bx
- - vmjxm'Yj
-
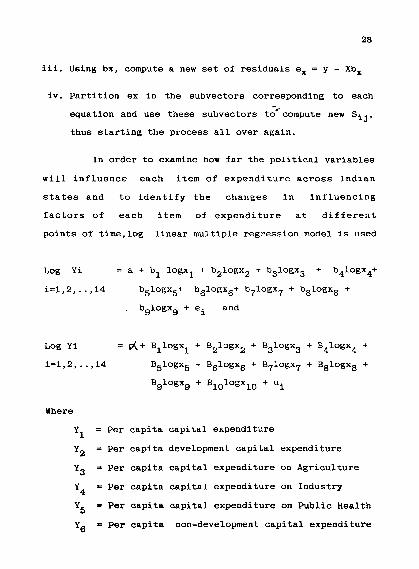
iii. Using bx, compute a new set of residuals ex = y - Xbx
iv. Partition ex in the subvectors corresponding to each - equation and use these subvectors to8 compute new Sij.
thus starting the process all over again.
In order to examine how far the political variables
will influence each item of expenditure across Indian
states and to identify the changes in influencing
factors of each item of expenditure at different
points of time,log linear multiple regression model is used
Log Yi = a + bl logxl + b210gx2 + b310gxg + b410gxq+
i=1,2,..,14 b510gx5+ b610gx6+ b710gx7 + bglogxg +
b910gx9 + e. and
Log Yi = &+ Bllogxl + B 2 logx2 + B 3 logxg + B 4 logx4 +
i=1,2,..,14 B510gx5 + B610gx6 + B710gx7 + B810gxg +
Bglogxg + BIOlogx10 + ui
Where
Y1 = Per capita capital expenditure
Y2 = Per capita development capital expenditure
Yg = Per capita capital expenditure on Agriculture
Y4 = Per capita capital expenditure on Industry
Y5 = Per capita capital expenditure on Public Health
Y6 - Per capita non-development capital expenditure
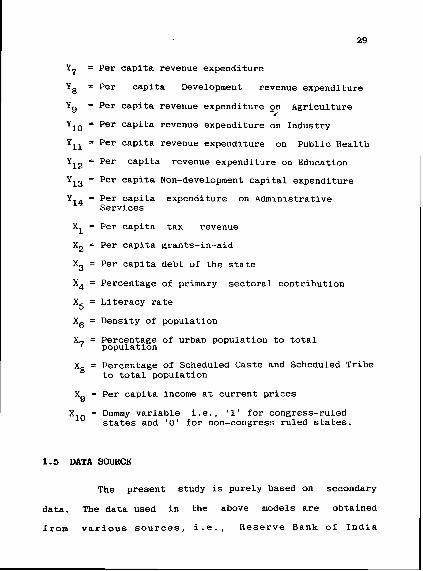
Y7 = Per capita revenue expenditure
Y8 = Per capita Development revenue expenditure
Yg = Per capita revenue expenditure on Agriculture I
Y10 = Per capita revenue expenditure on Industry
Yll = Per capita revenue expenditure on Public Health
Y12 = Per capita revenue expenditure on Education
Y13 = Per capita Non-development capital expenditure
Y14 = Per capita expenditure on Administrative Services
X = Per capita tax revenue 1
Xg = Per capita grants-in-aid
X3 = Per capita debt of the state
X4 = Percentage of primary sectoral contribution
X5 = Literacy rate
X6 = Density of population
Percentage population
urban population total
X8 = Percentage of Scheduled Caste and Scheduled Tribe to total population
Xg = Per capita income at current prices
X10 = Dummy variable i.e., '1' for congress-ruled states and '0' for non-congress ruled states.
1.5 DATA SOURCE
The present study is purely based on secondary
data. The data used in the above models are obtained
from various sources, i.e., Reserve Bank of India
Bulletin, Report on Currency and Finance, National Income
Accounts and Statistics, Finance Commission Reports,
Census of India, Estimates of state domestic product and - various reports of the Government of India. In order to
eliminate price effects the data are also deflated by
wholesale price index.
1.6 PERIOD OF STUDY
The present study covers a period of 20 years
from 1969-70 to 1988-89 to identify the causality between
tax revenue and public expenditure of Indian states and
the same period is also selected to examine the
factors determining aggregate expenditure of states under
different heads. The year 1969 1s selected as the base
year as it was the beginning of the fourth five-year plan.
In order to identify the influence of political variables
and to examine variation in factors influencing each item
of expenditure across Indian states at different points of
time, the years selected for the study are 1969-70,
1980-81, and 1988-89.
1.7 ARM OF STUDY
The study area covers twenty-two Indian states
viz., Andhra Pradesh, Assam, Bihar, Gujarat, Haryana,
Himachal Pradesh, Jammu & Kashmir, Kerala, Karnataka,
Madhya Pradesh, Maharashtra, Manipur, Meghalaya, Nagaland,
Orissa, Punjab, Rajasthan, Sikkim, T a m Y Nadu, Tripura,
Uttar Pradesh and West Bengal.
1.8 SCOPE AND LIMITATIONS
In order to verify the causal relationship
between the expenditure and tax revenue and disaggregated
expenditure into capital and revenue expenditure with
total tax revenue, the causality test is employed. The
present study is the first of its kind in India to employ
SUR model in identifying the determinants of each item of
expenditure of Indian states. Also the study employs
the economic, demographic and political factors
influencing public expenditure. Further, both time
series and cross-section data are used for the study.
However, the present study is subject to the limitations of
aggregation of expenditure of all Indian states. It is
also limited to the extent of the hetrogeneous characters
of the Indian states. In addition, the study is also
subject to the assumptions of the classical linear
regression model. Finally, it is also restricted to the
extent of explanatory variables selected for identifying
the factors influencing each item of expenditure.
1.9 PLAN OF STUDY
The present study comprises seven chapters.
Chapter one deals with the problems,
objectives, methodology, review of literature, scope and
plan of the study.
Chapter two examines the role of finance
commissions in intergovernmental transfer of resources.
Chapter three deals with the trend, pattern and
growth of each item of expenditure of Indian states.
Chapter four examines the causal relationship
between expenditure and tax revenue and total expenditure
disaggregated as capital and revenue expenditure with tax
revenue.
Chapter five identifies the determinants of each
item of expenditure of Indian states taken together over
the period 1969-1970 to 1988-1989.
Chapter six deals with variations in the
determining factors on each item of expenditure of Indian
states at different points of time, viz. 1969-70, 1980-81,
and 1988-89.
Chapter seven sums up the findings and makes a few
recommendations.
NOTES AM) REFERENCES
1. Friedman, Milton, An Economist's Protest, New Grey Thoma Harton Company, 1972, p.21.
2. Buchanan, James, M. and Richard W. Wagner, Democrac~ & Deficit, Acadamic Press, New York, 1977.
3. Barro, Robert, J. "Are Government Bonds Net Wealth? Journal of Political Economy, Nov/Dec., 1974, pp.1095- -- 1118.
4. William Anderson, Myles, S.Wallace, John, T. Warner, "Government Spending and Taxations. What Causes What? Southern Economic Journal, Vo1.52, 1986, pp.630-639.
5. Granger, C.N.J. "Investigating Causal Relationship by Econometric Models and Cross Spectral Methods", Econometrics, July, 1969, pp.424-38.
6. Manage N. and Marlow, M.L., "The Causal Relation Between Federal Expenditure and Ilecelpts", Southern Economic Journal, Vo1.52, Jan, 1986, pp.617-629.
7. Manage, N. and Marlow, M.L., "Expenditure and Receipts, Testing for Causality in State and Local Government Finances", ,Public Choice, 801.53, 1987, pp.242-255.
8. Blackley, R. Paul, "Causality between Revenue and Expenditure and the size of the Federal Budget", Public Finance Quarterly, Vo1.14, Nov.1986, pp.139-156.
9. Sims, C.A., "Money, Income and Causality", American Economic Review, Vo1.62, pp.540-542.
lo. Wagner Adolf, 'rhrcc l22tyng~s on Public Finance-, Macmillan and Co. Ltd., London, 1958, p.8.
11. Peacock, A.T. and Wiseman, J., Growth of gu_b_'&c_ Expenditure & the United Kingdom, Revised edition, George Allen and Unwin Ltd., London, 1967, p.23.
12. Wagner Adolf, op.cit., p.10.
13. Peacock, A.T. and Wiseman J., op.cit., p.28.
14. Musgrave, R.A., Figpal gxgtpgg, New Havens Yale University Press, 1969, pp.69-124.
15. Fabricant S., The Trend of Government Activit in the U. S. ~inck 1 9 0 0 - ~ ~ a ~ ~ u r e a u of Economic 'Research Inc., New York, 1952, pp.112-139.
16. Glenn, W. Fisher, "determinants ofyetate and Local Governemnt Expenditure, A Preliminary Analysis", National Tax Journal, Vol.XIV, Dec, 1961, pp.349 - 355.
17. Ernest Kurnow, "Determinants of State and Local Expenditure, Reexamined", National ,Jou_J_~1, Vol.XV1, pp.252-254.
18. Bird, R.M., Growth of Government Spending in Canada, Canadian Tax Foundation, Torondo, 1979, p.8.
19. S.Lal1, "A Note on Government Expenditure in Developing Countries", The Economic Journal, June, 1969, pp.413- 417.
20. Metwallv. M.M. and Mohmoud. M.F. "Slze of State and ~overnent Expenditure - A cross country studyn, Indian Journal of Public Administration, March 1984, - -- - - - - V0l.XXXIV, p.73.
21. Joergen, R . Lotz, "Problem of Government Spending in Developing Countries", Manchester School, June 1980, VOl.XIV, p. 121.
22. Martin, A. and Arthur Lewis, A.W., "Pattern of Public Revenue and Expenditure", The Manchester School of Economic and Social Studies, Vol.XXIV, 1956, p.102.
23. Kuznet, Simon, "Quantitative Aspects of the Economic Growth of Nations", Economic Development and Cultural Change, Vol.X, No,2, Jan. 1962, p.124.
24. Richard, S. Thorn, "The Evolution of Public Finance During Economic Development", The Manchester School, Jan.1907, pp.71-95.
25. James, M. Ferris, "Demands for Public Spending - An Attitudinal Approach", Public Choice, Vo1.40, 1983, p.137.
26. Jane, H. Leuthold, "A Forecasting Model for State Sxpenditure", Public Choice, Vo1.56, 1988, p.46.
27. Arthur, J. Mann and Walter, E. Schulthuses, "Long Run Expenditure Constraints in Argentina", Public Finance Quarterly, Vo1.14, Jan. 1986, p.28.
Daniel Landau, "Government Expenditure and Economic Growth - A Cross Country Study" Southern Economic Journal, Vol. 49, Jan. 1983, p.783-j92.
Dennis, C. Muller, "The Growth of Government in Public Choice Perspective", IMF Staff Pap-, Vo1.34, 1987, p.115.
Meltzer and Richard, "Tests of a Rational Theory of the Size of Government", Public Choice, Vo1.41, 1983, p.403.
Sohrab Abizadeh and Mohamood Yousefi, "Growth of Government Expenditure, The Case of Canada", Public Finance Warterly, Vo1.16, Jan.1988, p.78.
Morss, E.R., Fredland, E.J. and Hyman, S.H., "Fluctuations in State Expenditure - An Econometric Analysis", Southern Economic Journal, Vol.XXXII1, 1967, pp. 501.
Sharanskv. J.. "Some More Thoushts About the ~eterminant' of dovernment ~xpenditure;', National Tax Journal, Vo1.20, June, 1967, p.171.
Fisher, Glenn, W., op.cit., p.353.
Mathews, Economics of Public Expend-, Vora & Co. Publishers Pvt. Ltd., Bombay, 1972, p.35.
Vinod Kumar Singh, Government Expenditure and Economic Development, Criterion Publication, New Delhi, 1986, p.19.
Panchmukhi, P.R., "Measurement of the Effect of Public Expenditure (With Special Reference to Public Education and Health Expenditure in India), Ph.D. Thesis submitted to Bombay University, 1967.
Reddy, K.N., Growth of Public Expenditure India, 1872-1968 (A Secular and Time Pattern Analysis). Sterling Publishers, New Delhi, 1972, p.11.
Reddy. K.N., "Trend of Government Activity in India Since Independence (A Research Report), M.S. University, Economic Series, Baroda, 1976, p.85.
Gupta, A.P., "Who Benefits From Central Government Expenditure", Economic and Political Weekly, Feb.1977, pp.267-286.
42. Zahir, M., Public Expenditure and Income Distribution in India, Associated Publishing House, New Delhi, 1972, p. 92.
43. Madalgi, S.S., "State Government Exfinditure, 1951-52 to 1965-66", RBI Bulletin, June, 1966, p.624.
44. Thimmaiah, G. Centre-State Financial Relations, Gangatharaya, Mysore, India, 1968, p.162.
45. NanJUndappa, Some Aspects of Karnataka Economy, Prakash Publishers, Dharward, India, 1971, p.241.
46. Nanje Gowda, D.T., Public Ex enditure Under Plannin - A Case Study of Karnataka, 'Indus Publishing Co., %eii - -- Delhi, 1988, p.15.
47. Datta, Sibani, Public Expenditure and Economic Development, "Ashish Publishing House, New Delhi, 1985, p.93.
48. Raniana. "Determinants of State Ex~endit~re - A Case study of Rajasthan", presented at 26th Indian Economic Conference, Bombay, Jan.2-1, 1989, p.3.
49. Govinda Rao, M., Political Economiy of Tax and Expenditure Determinants I A Case Study of Four Indian States, Allied Publishers Private Ltd., New Delhi, 1981, p.93.
50. Granger, op.cit., p.424.
51. Sims, op.cit., p.543.
52. Feige and Pearce, "The Causal Relations Between Money and Income, Some Caveats for Time Series Analysis, Review of Economics Statistics, Vo1.61, p.521-533. --
53. Nerlov, Marc., "Spectral Analysis of Seasonal Adjustment and Procedure", Econometrica, Vo1.32, pp.241-286.
54. Johnston, J., Econometric Methods, McGraw Hills Books Co., Singapore, 1984, p.337.