Embed Size (px)
Citation preview

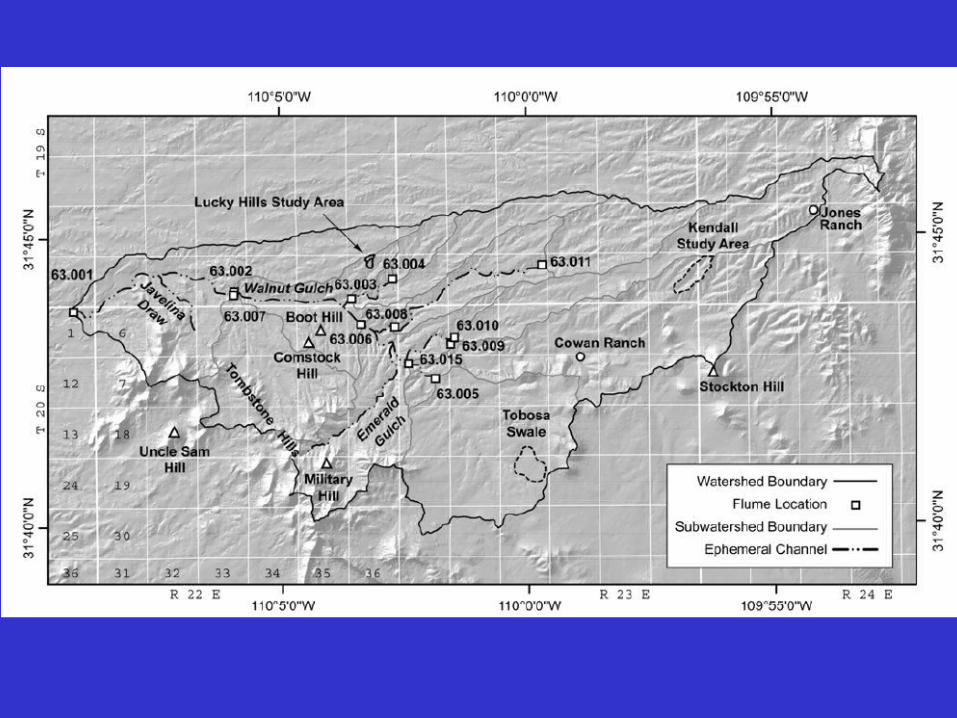
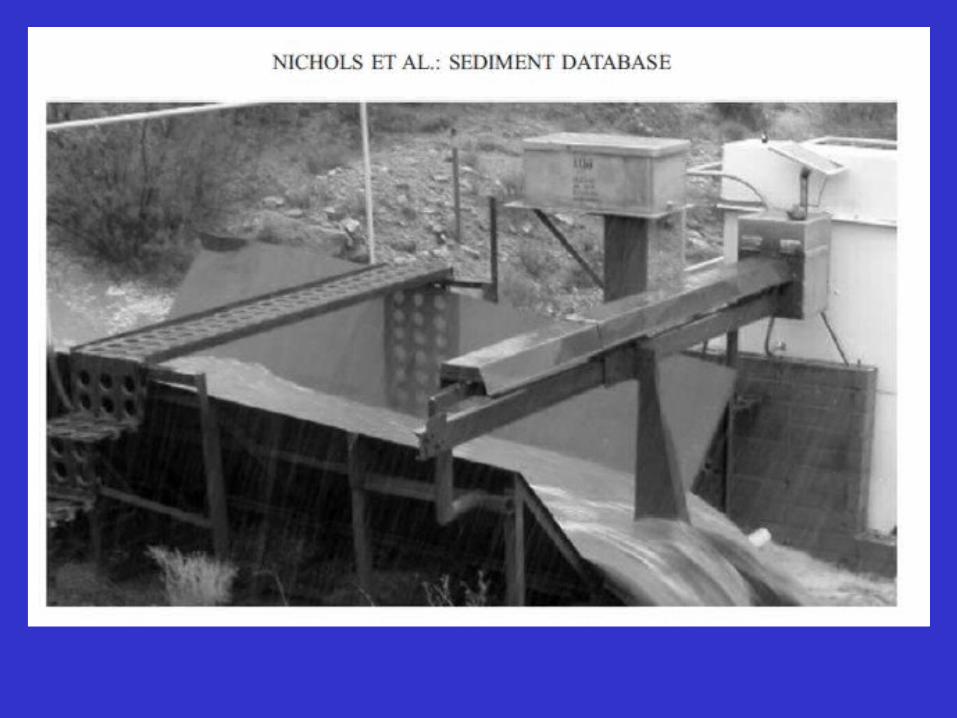
Intro to Geomorphology (Geos 450/550)Lecture 5: watershed analyses • field trip #3 – Walnut Gulch• watersheds• estimating flood discharges

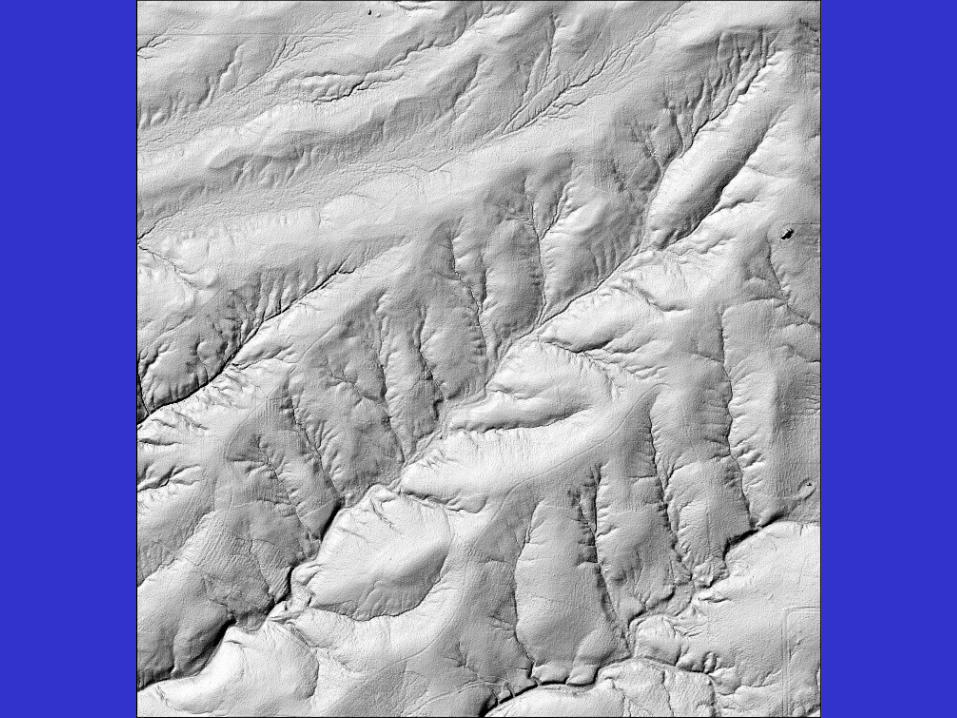
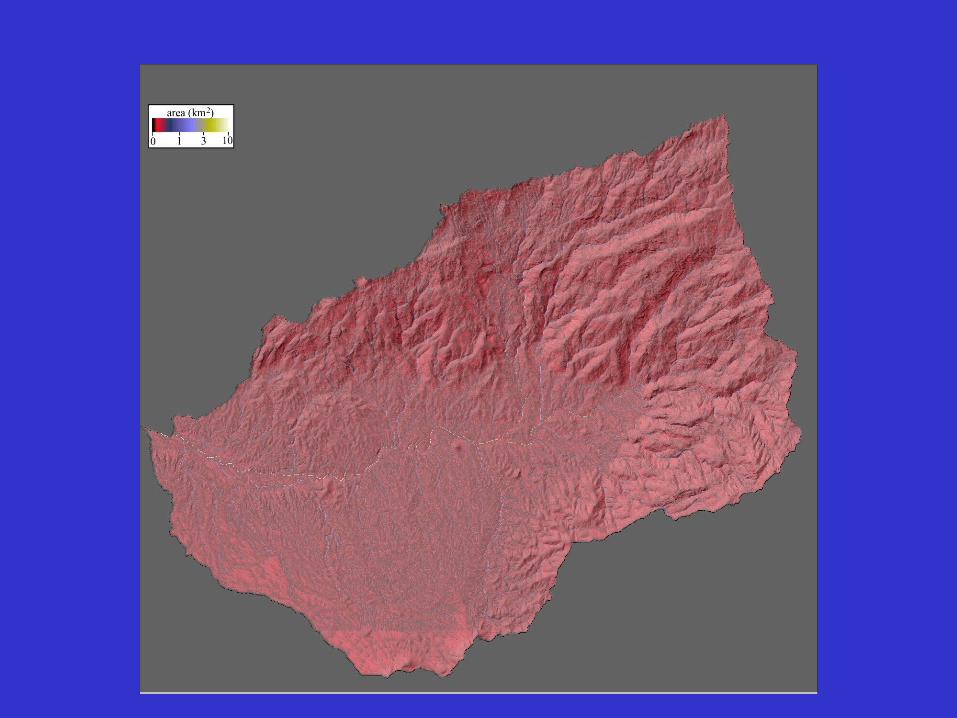
Lidar shaded relief image of WGEW

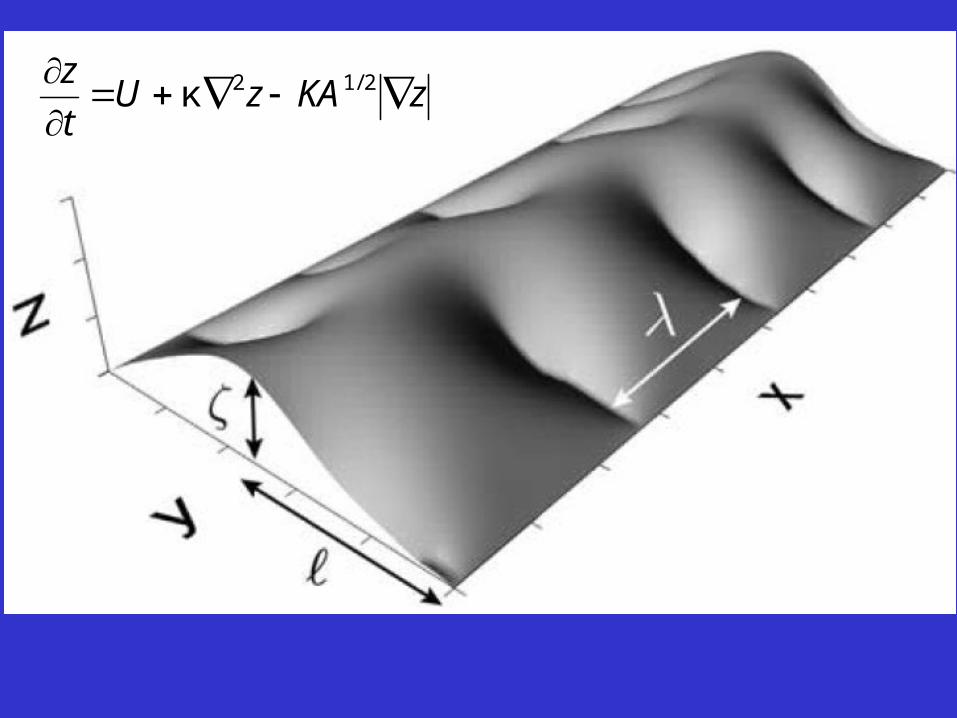
zKAzUt
z
2/12κ
Liquid water flow predicts:• observed runout distance iffreezing rate is tuned optimally • a single distal lobe inconsistent with observations

Please read: Pearthree and Calvo (1987)
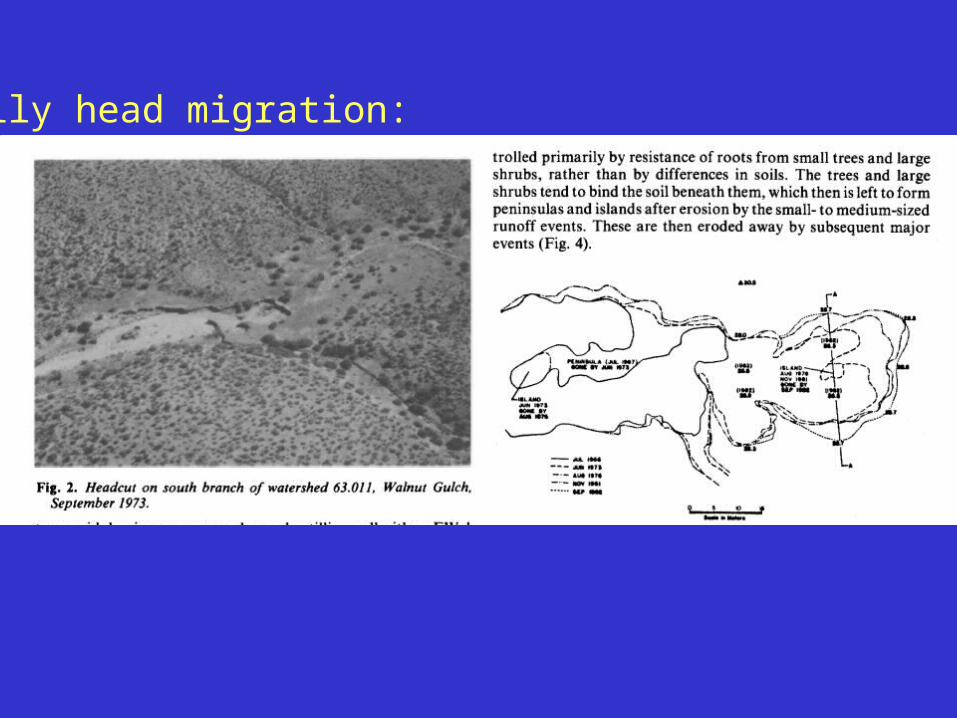
Gully head migration:
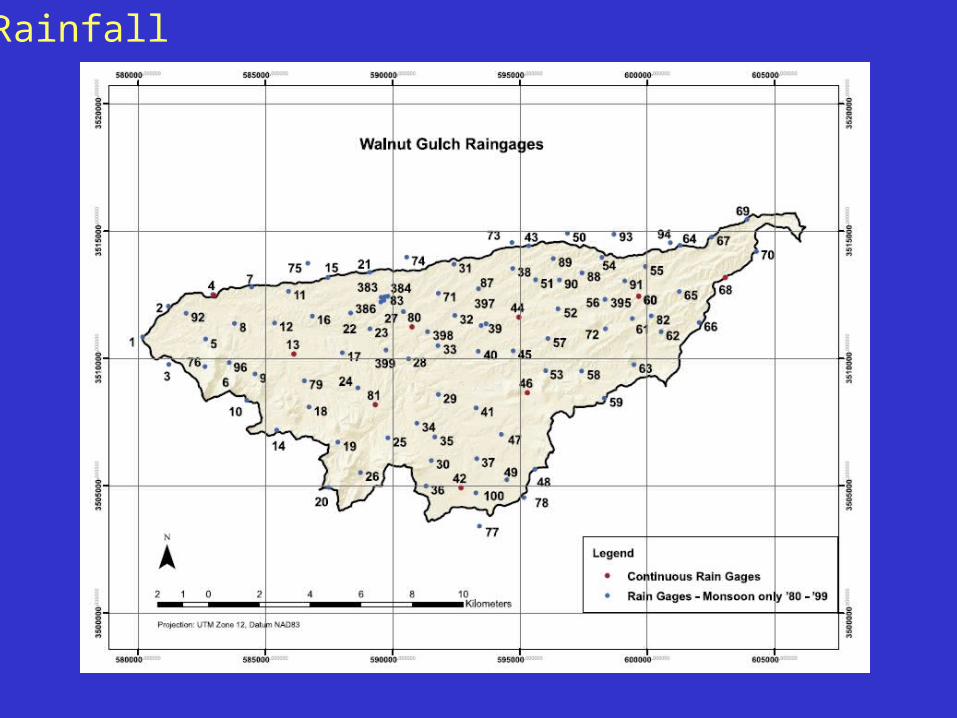
Rainfall
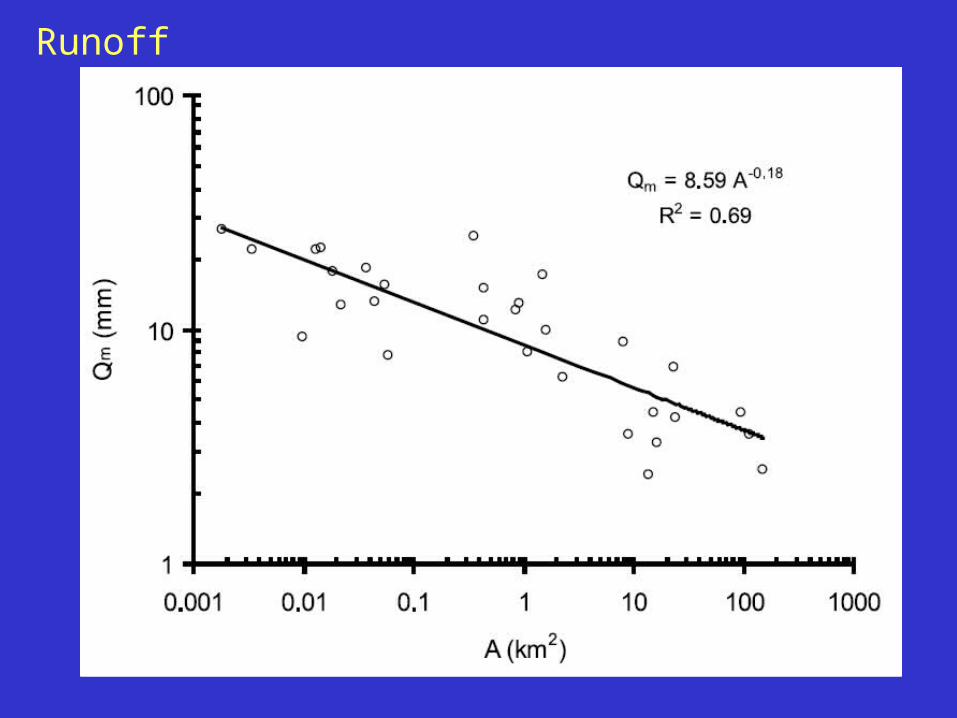
Runoff
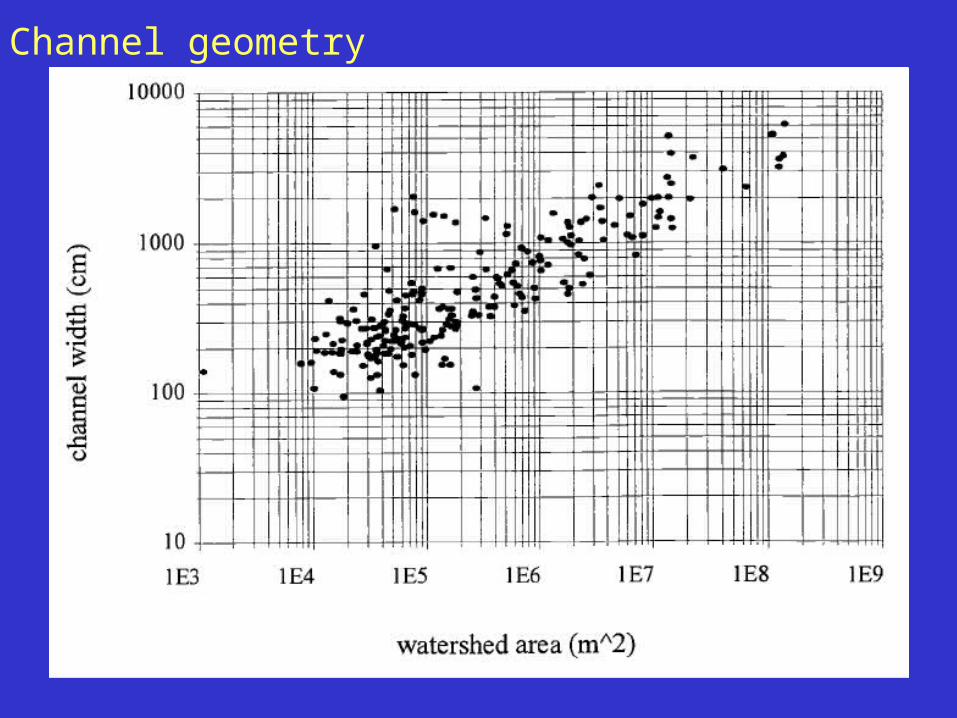
Channel geometry

Heat, mass exchange (flux tower)
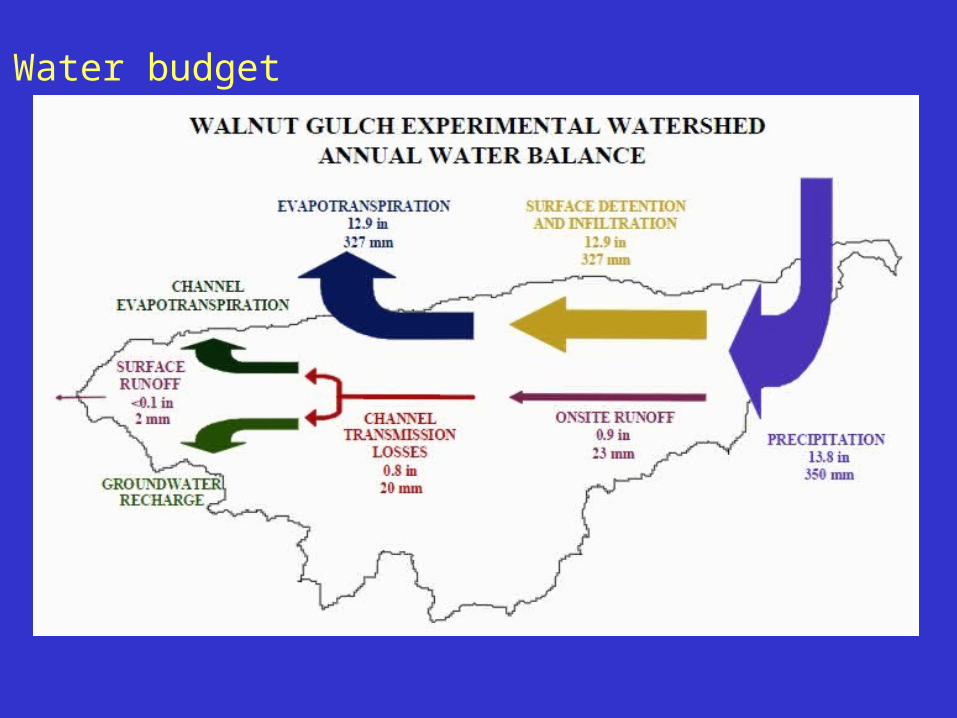
Water budget

Dispersion of flood waves

Manipulation experiments
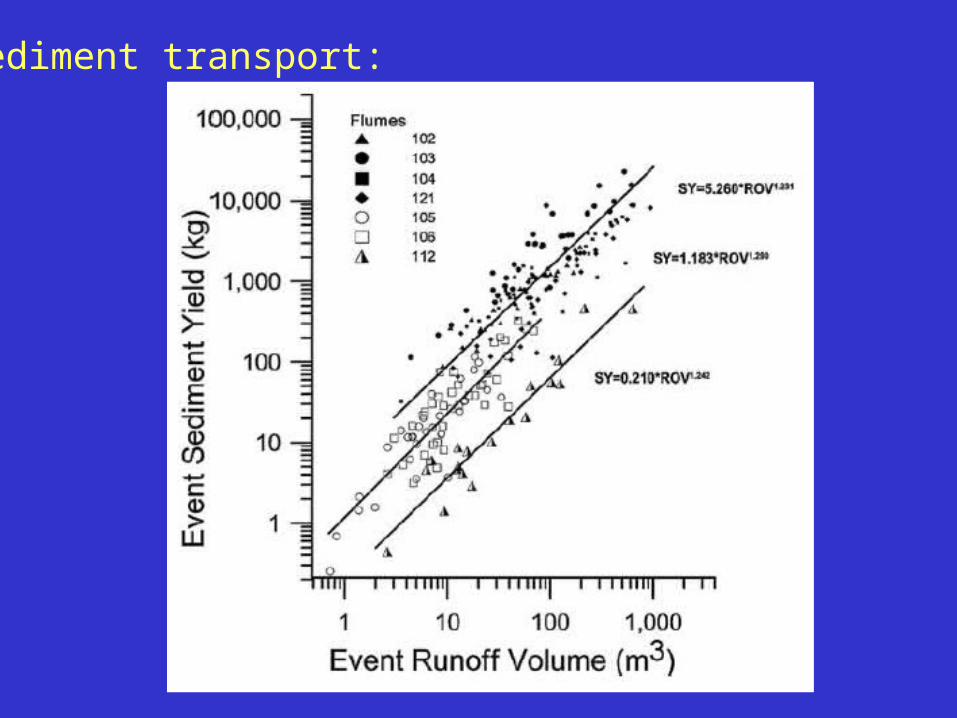
Sediment transport:

The UNIVERSITY of NORTH CAROLINA at CHAPEL HILL
Types of Transport
Suspension occurs here
• Particles entrained at the bed-load layer
• Suspended load transported by convection, diffusion, and turbulence
Figure from Chanson, p. 200

Isotopic tracers

How much water?
Method 1: Event rank analysis
• Rank all events – decreasing size– rank of event (m)– number of years (n)
• Frequency = f = m / n• Recurrence Interval = T = 1 / f (= n / m)

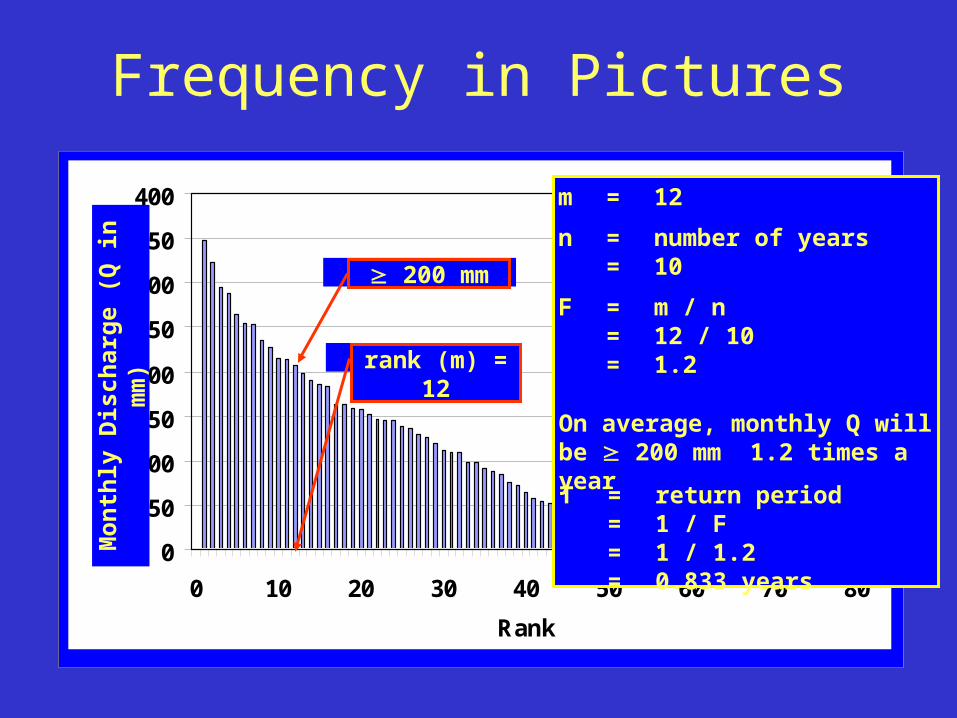
Frequency in Pictures
0
50
100
150
200
250
300
350
400
0 1 2 3 4 5 6 7 8 9 10
Years
Ra
infa
ll (m
m)
Mo
nth
ly D
isch
arg
e (Q
in
mm
)

Frequency in Pictures
0
50
100
150
200
250
300
350
400
0 10 20 30 40 50 60 70 80 90 100 110 120
Rank
Ra
infa
ll (m
m)
Mo
nth
ly D
isch
arg
e (Q
in
mm
)
Frequency in Pictures
0
50
100
150
200
250
300
350
400
0 10 20 30 40 50 60 70 80
Rank
Rai
nfa
ll (
mm
)
200 mm
rank (m) = 12
m = 12
n = number of years
= 10
F = m / n= 12 / 10= 1.2
On average, monthly Q will be 200 mm 1.2 times a year
T = return period= 1 / F= 1 / 1.2= 0.833 years
Mo
nth
ly D
isch
arg
e (Q
in
mm
)

Frequency in Pictures
0
50
100
150
200
250
300
350
400
0 10 20 30 40 50 60 70 80
Rank
Rai
nfa
ll (
mm
)
rank (m) = 1
m = 1
n = number of years
= 10
F = m / n= 1 / 10= 0.1
On average, monthly Q will be 345 mm 0.1 times a year
T = return period= 1 / F= 1 / 0.1= 10 years
largest event
Mo
nth
ly D
isch
arg
e (Q
in
mm
)
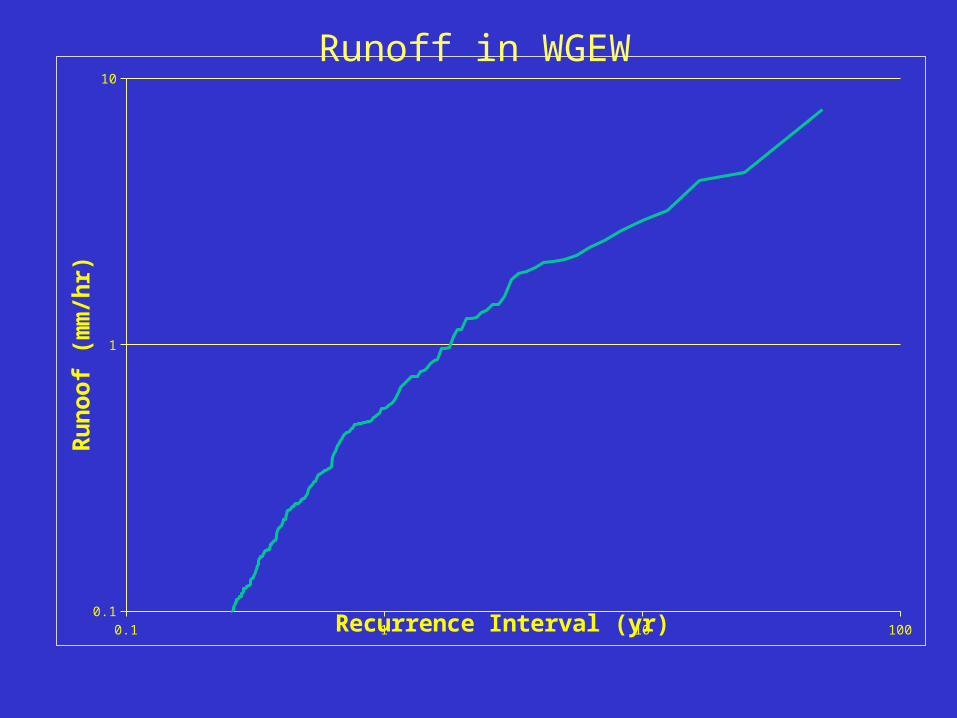
0.1 1 10 1000.1
1
10
Recurrence Interval (yr)
Run
oof
(mm
/hr)
Runoff in WGEW

0.1 1 10 1000.0001
0.001
0.01
0.1
1
10
100
Recurrence interval (yr)
area
(km
2)Frequency-size distribution, wildfire SNP
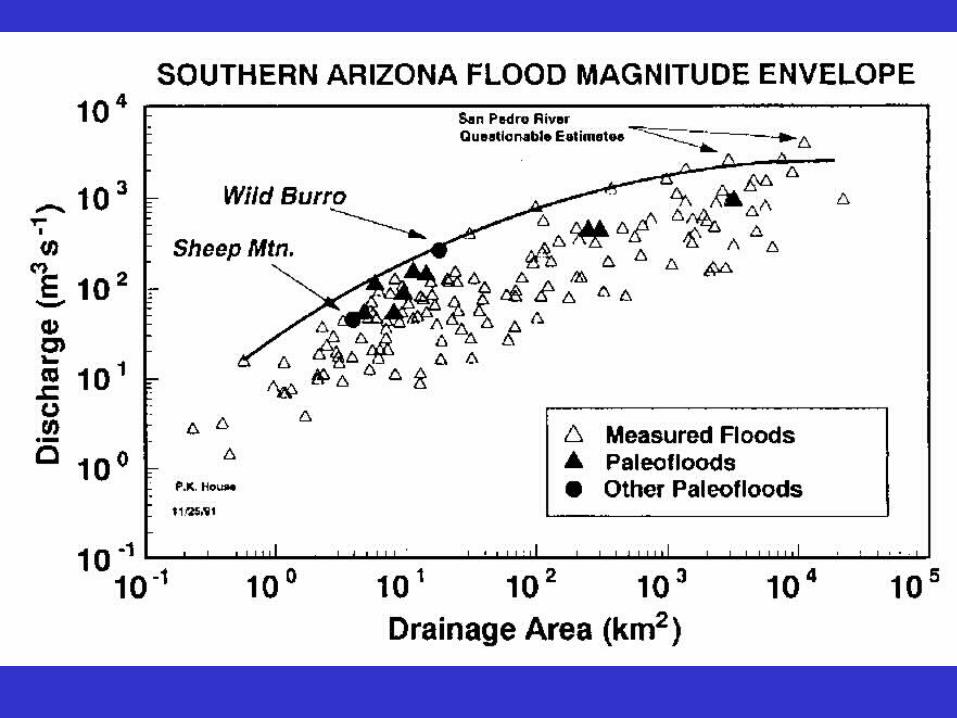
How much water?
Method 2: Regression analysis
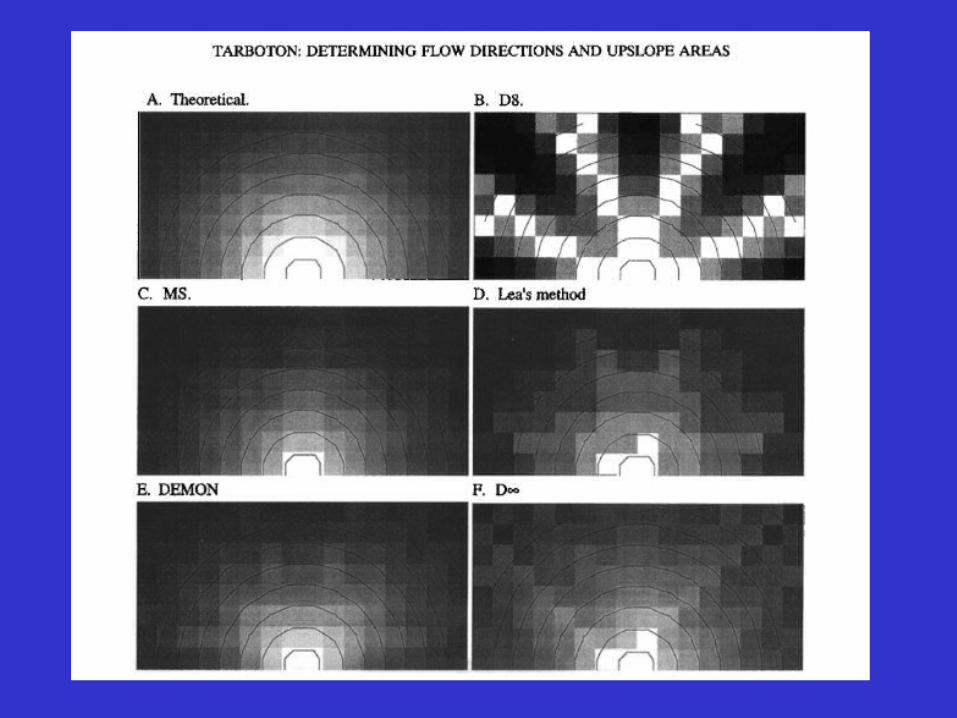
• Compute contributing area using DEM• Estimate Qn using regression curves

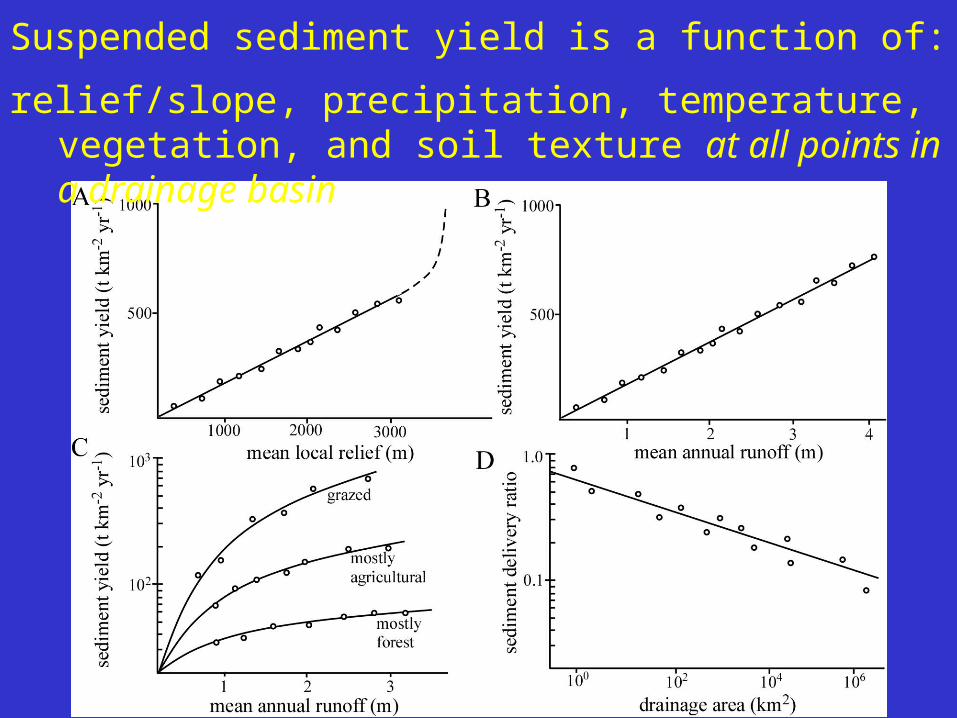
Suspended sediment yield is a function of:
relief/slope, precipitation, temperature, vegetation, and soil texture at all points in a drainage basin
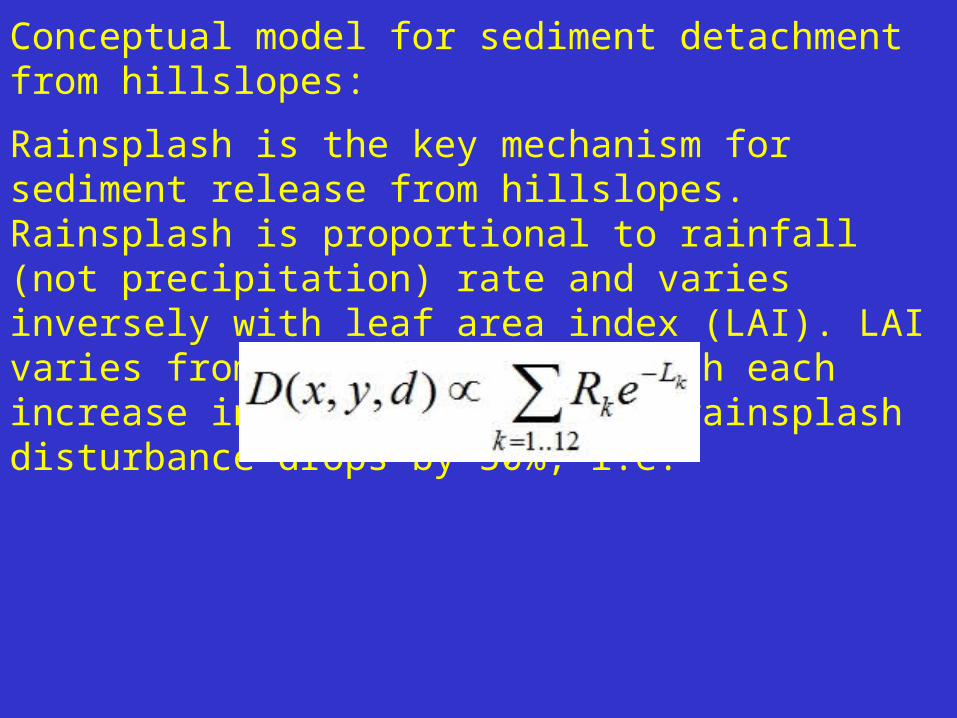
Conceptual model for sediment detachment from hillslopes:
Rainsplash is the key mechanism for sediment release from hillslopes. Rainsplash is proportional to rainfall (not precipitation) rate and varies inversely with leaf area index (LAI). LAI varies from 0 to approx. 8. With each increase in LAI value of 0.5, rainsplash disturbance drops by 50%, i.e.
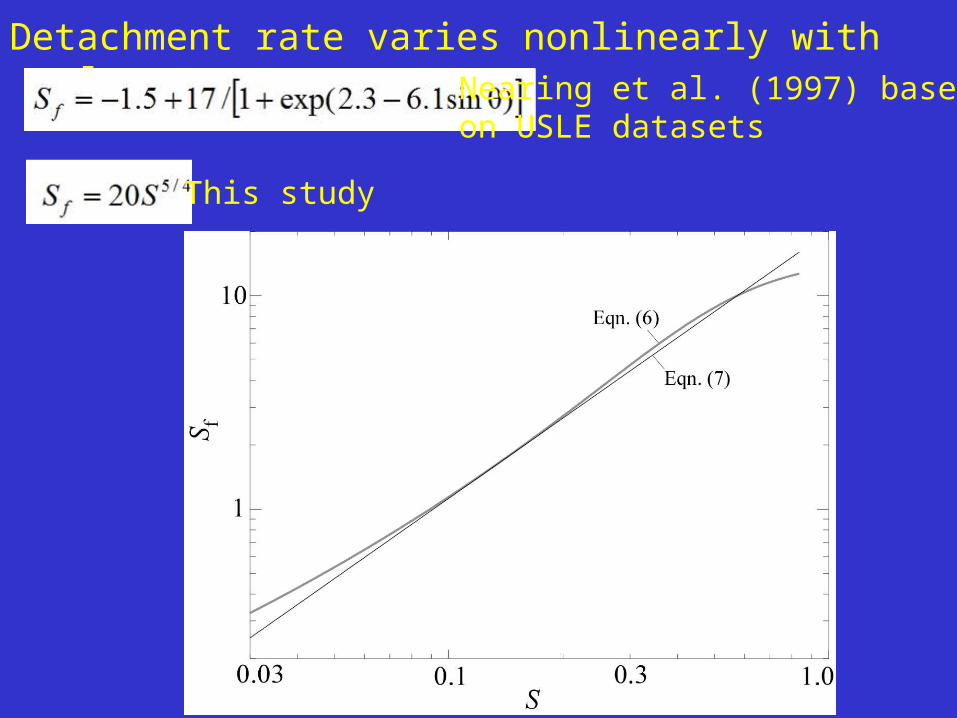
Detachment rate varies nonlinearly with slope:
This study
Nearing et al. (1997) based on USLE datasets

This model distinguishes detachment and transport. Detachment is primarily a function of rainsplash, which in turn is a function of rainfall intensity and leaf area index (LAI). Transport is a function of slope (at the hillslope scale) and bed shear stress and sediment texture (and the watershed scale).
D(x,y,d) = detachment rate (kg m–2 yr–1), c1 is a free parameter (dimensionless) calibrated to measured global sediment discharge data, ρb is the bulk density of the soil (kg m–3), fd is the fraction of the soil within each soil texture bin of grain diameter d (dimensionless), S is slope gradient (dimensionless), Rk is the mean monthly rainfall (m yr–1)), and Lk is the mean monthly LAI (dimensionless).
The first equation provides a map of the average detachment rate for every month. Sediment is routed downslope in suspension if the Rouse number is smaller than one (the definition of suspended sediment).

More on Rouse number calculation:Shear velocity (in the Rouse number denominator) is a function of slope and flow depth (related to unit discharge). However, flow depthvaries by only one order of magnitude over a wide range of scaleswhile slope varies by 4 – 5 orders of magnitude. So, we assume thatRouse number varies only with slope.

Input data layers: (5 arcmin or 10 km resolution)

Brute-force model calibration:
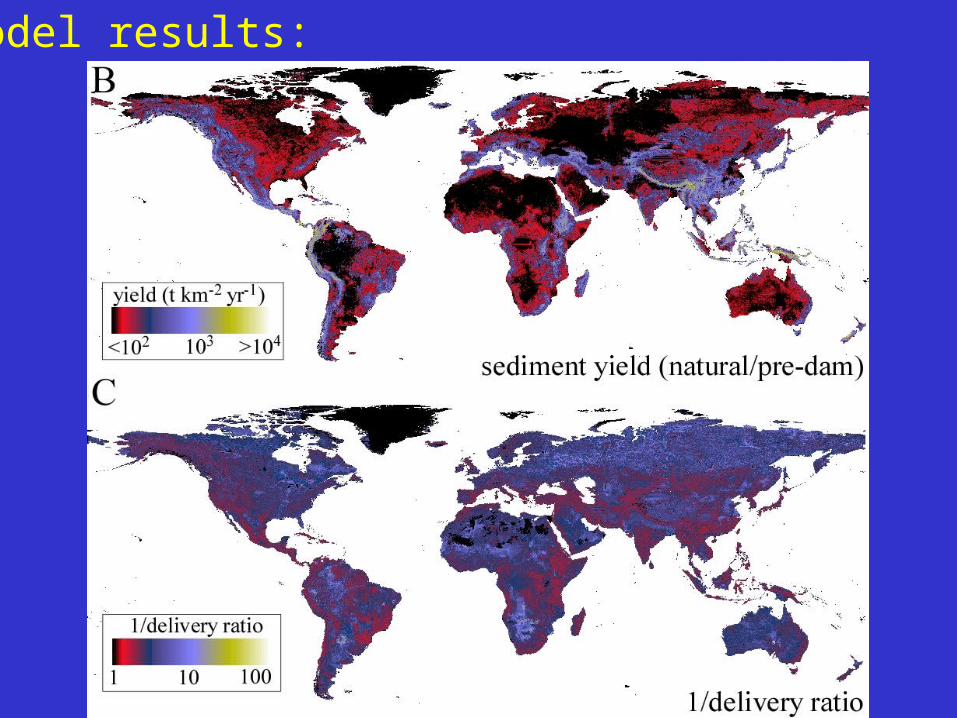
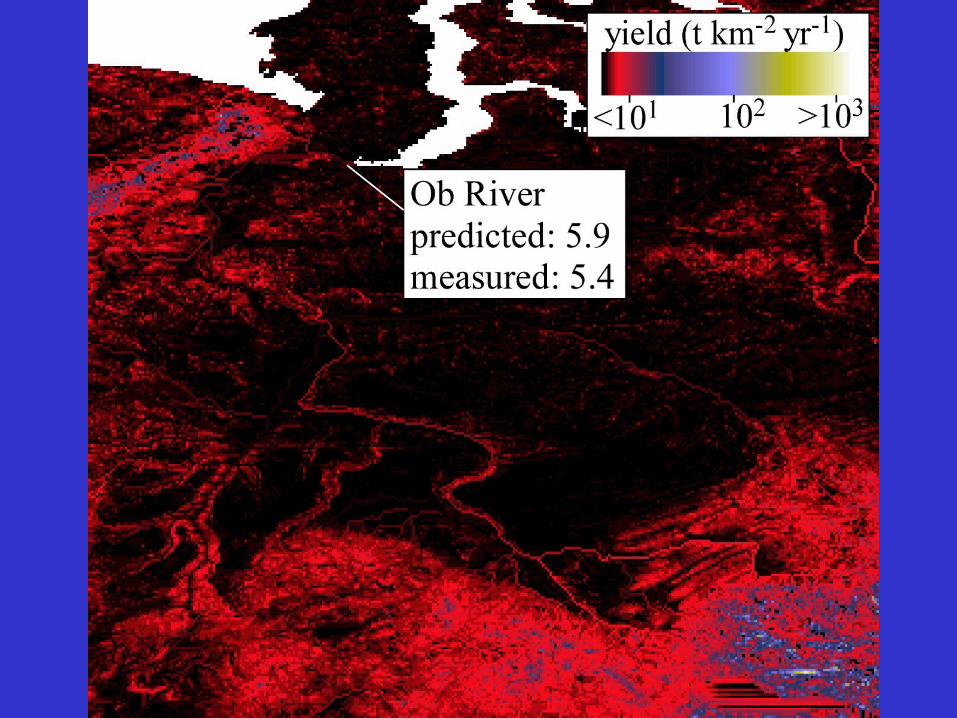
Model results:
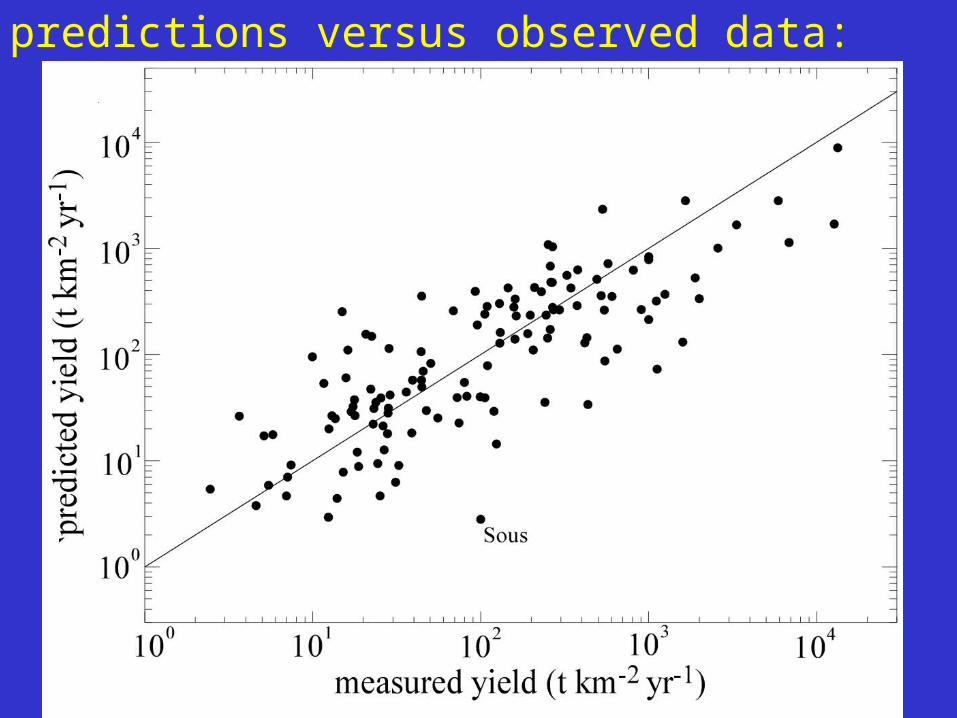
Model predictions versus observed data:


Model reproduces observed relations between sediment delivery ratio and drainage basin area (top), yield and basin area (middle), and yield and average basin slope (bottom).