Embed Size (px)
Citation preview

on June 28, 2018http://rsif.royalsocietypublishing.org/Downloaded from
rsif.royalsocietypublishing.org
ResearchCite this article: Kelly LA, Cresswell AG,
Racinais S, Whiteley R, Lichtwark G. 2014
Intrinsic foot muscles have the capacity
to control deformation of the longitudinal arch.
J. R. Soc. Interface 11: 20131188.
http://dx.doi.org/10.1098/rsif.2013.1188
Received: 19 December 2013
Accepted: 8 January 2014
Subject Areas:biomechanics
Keywords:multi-segment foot model, foot stiffness,
electromyography
Author for correspondence:Glen Lichtwark
e-mail: [email protected]
& 2014 The Author(s) Published by the Royal Society. All rights reserved.
Intrinsic foot muscles have the capacityto control deformation of thelongitudinal arch
Luke A. Kelly1,2, Andrew G. Cresswell1, Sebastien Racinais1,2,Rodney Whiteley2 and Glen Lichtwark1
1Centre for Sensorimotor Neuroscience, School of Human Movement Studies, The University of Queensland,Brisbane, Queensland, Australia2Department of Exercise and Sport Science, Aspetar, Qatar Orthopaedic and Sports Medicine Hospital,Doha, Qatar
The human foot is characterized by a pronounced longitudinal arch (LA) that
compresses and recoils in response to external load during locomotion, allow-
ing for storage and return of elastic energy within the passive structures
of the arch and contributing to metabolic energy savings. Here, we examine
the potential for active muscular contribution to the biomechanics of arch
deformation and recoil. We test the hypotheses that activation of the three
largest plantar intrinsic foot muscles, abductor hallucis, flexor digitorum
and quadratus plantae is associated with muscle stretch in response to external
load on the foot and that activation of these muscles (via electrical stimulation)
will generate sufficient force to counter the deformation of LA caused by the
external load. We found that recruitment of the intrinsic foot muscles increased
with increasing load, beyond specific load thresholds. Interestingly, LA defor-
mation and muscle stretch plateaued towards the maximum load of 150%
body weight, when muscle activity was greatest. Electrical stimulation of the
plantar intrinsic muscles countered the deformation that occurred owing
to the application of external load by reducing the length and increasing the
height of the LA. These findings demonstrate that these muscles have
the capacity to control foot posture and LA stiffness and may provide a buttres-
sing effect during foot loading. This active arch stiffening mechanism may
have important implications for how forces are transmitted during locomotion
and postural activities as well as consequences for metabolic energy saving.
1. IntroductionThe human foot is a flexible structure, capable of conforming to variations in
surface and load to maintain effective force transmission between the lower
limb and the ground. This functionality is achieved via an intricate interaction
of movements occurring in a series of small joints, which allows the longitudi-
nal arch (LA) to lengthen and lower during stance [1] and absorb loading forces
as elastic strain energy [2,3]. Later in the stance phase, passive elastic recoil of
the plantar aponeurosis contributes to positive work generation for propulsion,
aided by the windlass mechanism, which effectively stiffens the LA during toe
extension [2–4]. This process allows for a highly efficient bipedal gait that is
unique to humans [5].
The plantar aponeurosis along with the windlass mechanism is considered
the key contributors to foot stiffness during human gait [2,4]. It is proposed that
extension of the toes in mid- to late-stance, creates increased tension in the plan-
tar aponeurosis, resulting in shortening of the LA via flexion and adduction of
the metatarsals in combination with supination of the rear-foot [4,6]. These
alterations in bony alignment act to stiffen the foot and transform it from a com-
pliant attenuator to a rigid lever, allowing ankle plantar flexor torque to be
efficiently transmitted to the ground [7]. Recent studies investigating the bio-
mechanics of LA deformation during locomotion have confirmed that the

Figure 1. Experimental set-up. Foot motion, ground reaction forces andintramuscular electromyography were recorded during incremental loading(experiment 1) and independent electrically evoked contractions of thethree major plantar intrinsic foot muscles (experiment 2). Loads rangingfrom 0% to 150% of body mass were added to a loading device, whichwas secured to the distal aspect of the participants right thigh. The partici-pant’s foot was placed on the centre of a force plate and four motion analysiscameras were positioned to record three-dimensional motion of the shankand two individual foot segments during each task.
rsif.royalsocietypublishing.orgJ.R.Soc.Interface
11:20131188
2
on June 28, 2018http://rsif.royalsocietypublishing.org/Downloaded from
plantar aponeurosis has a critical influence on the stiffness of the
LA [6,8]. However, these studies [8] and others by Pataky et al. [9]
and Bates et al. [10] have also highlighted the potential contri-
bution of an active stiffening mechanism, possibly produced
by muscles such as the plantar intrinsic foot muscles.
The plantar intrinsic foot muscles possess origins and
insertions that are contained within the foot with the three
largest muscles, abductor hallucis (AH), flexor digitorum
brevis (FDB) and quadratus plantae (QP), having muscle–
tendon units that span the length of the LA [11–13]. The
function of these muscles during stance and gait has been
the subject of speculation for many years and remains an
area of intense interest. Anatomy texts describe these muscles
as accessory toe flexors, which may also aid in fore-foot stabil-
ization during the push-off phase of gait [14]. It appears,
however, that a disparity exists between the mechanical
action proposed by textbooks and the electromyography
(EMG) profiles described in the literature. Early EMG studies
suggest these muscles may play a role in stabilization of the
LA, with muscle recruitment occurring in response to
increased loading [15,16]. Further supporting this hypothesis,
individuals with a lower LA height in stance (i.e. greater LA
deformation) were shown to display greater levels of intrinsic
muscle activity [17]. Recent studies from our own laboratory
using intramuscular EMG have reported that the plantar intrin-
sic muscles act in a synchronous manner to provide postural
support for the foot, with activation amplitude and timing
being correlated with postural task difficulty and medial
postural sway, respectively [18].
Despite some evidence suggesting that the plantar intrin-
sic foot muscles may actively contribute to regulation of foot
stiffness during stance and gait [8,9], the specific mechanical
functions of these muscles are yet to be described. It is also
unknown whether these small muscles are able to generate
enough force to produce a significant alteration in foot bio-
mechanics under loaded conditions, in order to influence
LA biomechanics. Here, we tested two hypotheses, first,
that the LA would deform under increasing load, producing
stretch of the plantar intrinsic foot muscles (AH, FDB and
QP) and an increase in involuntary activity. Second, we
tested the hypothesis that these same muscles are capable
of generating sufficient forces to attenuate LA deformation
produced by the load, effectively increasing LA stiffness.
Activation of these muscles with load and their ability to gen-
erate sufficient force to counter LA deformation may have
important implications for how the foot can absorb and
generate energy during gait.
2. Material and methods2.1. ParticipantsNine healthy males with no history of neuromuscular disorder
or lower limb injury in the previous six months volunteered
to participate in the study (mean+ standard deviation (s.d.) for
age, height and body mass were 30+4 years, 179+7 cm and
80+6 kg, respectively). All participants were informed of the
study requirements, benefits and risks before giving written
informed consent. The procedures were approved by the local
scientific ethics committee and performed according to the
Declaration of Helsinki. Two discrete experiments with similar
experimental set-ups were performed on the same group of
participants during the one test session, in order to address our
two hypotheses.
2.2. Experiment 1: foot loadingThe aim of this experiment was to examine the relationship
between mechanical loading of the foot and both deformation
of the foot and also muscle activity of the intrinsic foot muscles
(AH, FDB and QP). Loads were incrementally applied to the
thigh via a loading rig described in detail below (figure 1).
Loads ranged from 0% body mass to 150% body mass with
25% increments. A period of approximately 5 s was maintained
at each loading increment, during which time intramuscular
EMG, kinematic and force plate data were recorded. Subjects
were advised to remain still and refrain from any voluntary
movement throughout the trial.
2.3. Experiment 2: electrically evoked musclecontractions
The aim of this experiment was to determine the mechanical
response of the foot to stimulation of the individual intrinsic
foot muscles (AH, FDB and QP) under different loading con-
ditions. Loads corresponding to 50% and 100% of body mass
were applied using the same loading rig described above while
each individual muscle was electrically stimulated. One exper-
imental trial consisted of three electrically evoked contractions,
each separated by 15 s, for each muscle. The trial was completed
for each of the three muscles under the two loading conditions,
which were undertaken in a randomized order. As such, a
total of six trials were completed for each participant.
2.4. General experimental set-upEach participant was seated with their right foot placed flat on a
marked area in the centre of a force plate (Kistler 9286A, Zurich,
Switzerland). The shank was positioned at approximately 108 of
flexion (relative to vertical) with the femur positioned parallel to
the floor. Loads of up to 150% of body mass could be applied to
the distal aspect of thigh using a custom built rig (figure 1), so
that the vertical force was located slightly anterior to the ankle
joint axis, similar to where it occurs during quiet standing [19].
2.4.1. Muscle activation and stimulationPaired, fine wire, intramuscular electrodes (0.051 mm stainless
steel, Teflon-coated, Chalgren, USA) were inserted into both
the proximal and distal ends of the AH, FDB and QP muscles
in the right foot (figure 2) of each subject using delivery needles
AH QPFDB
(b)(a) (c)
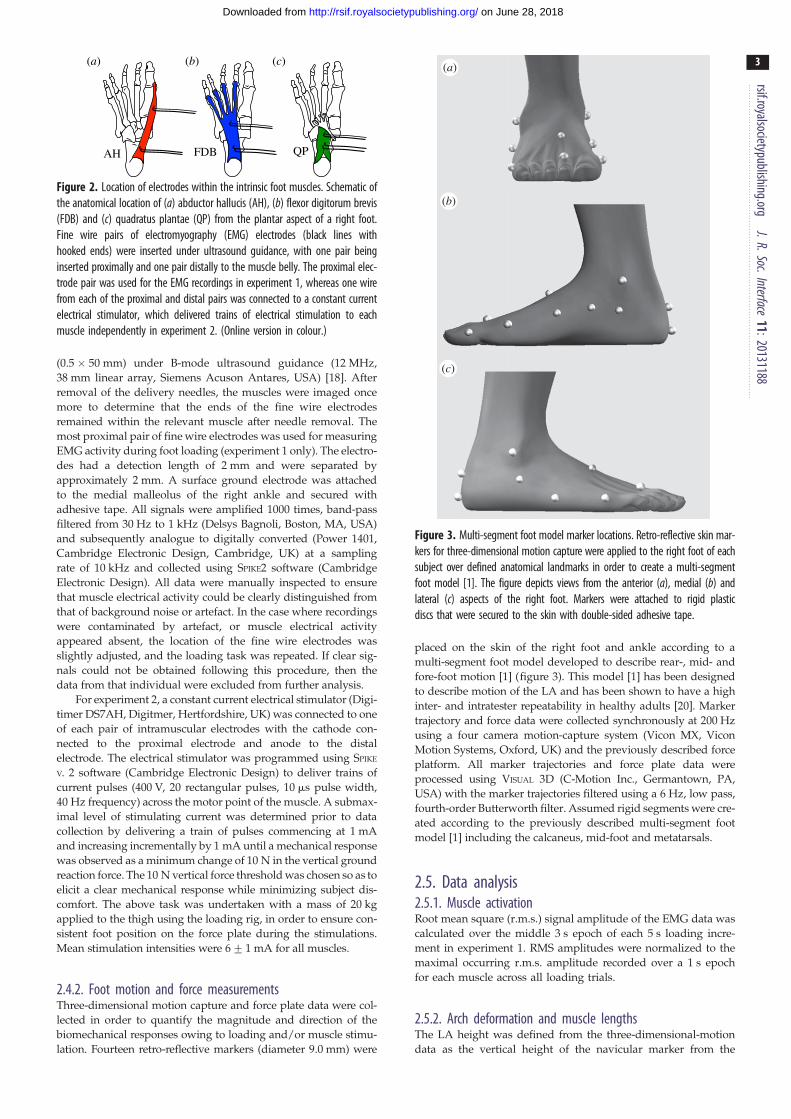
Figure 2. Location of electrodes within the intrinsic foot muscles. Schematic ofthe anatomical location of (a) abductor hallucis (AH), (b) flexor digitorum brevis(FDB) and (c) quadratus plantae (QP) from the plantar aspect of a right foot.Fine wire pairs of electromyography (EMG) electrodes (black lines withhooked ends) were inserted under ultrasound guidance, with one pair beinginserted proximally and one pair distally to the muscle belly. The proximal elec-trode pair was used for the EMG recordings in experiment 1, whereas one wirefrom each of the proximal and distal pairs was connected to a constant currentelectrical stimulator, which delivered trains of electrical stimulation to eachmuscle independently in experiment 2. (Online version in colour.)
(b)
(a)
(c)
Figure 3. Multi-segment foot model marker locations. Retro-reflective skin mar-kers for three-dimensional motion capture were applied to the right foot of eachsubject over defined anatomical landmarks in order to create a multi-segmentfoot model [1]. The figure depicts views from the anterior (a), medial (b) andlateral (c) aspects of the right foot. Markers were attached to rigid plasticdiscs that were secured to the skin with double-sided adhesive tape.
rsif.royalsocietypublishing.orgJ.R.Soc.Interface
11:20131188
3
on June 28, 2018http://rsif.royalsocietypublishing.org/Downloaded from
(0.5 � 50 mm) under B-mode ultrasound guidance (12 MHz,
38 mm linear array, Siemens Acuson Antares, USA) [18]. After
removal of the delivery needles, the muscles were imaged once
more to determine that the ends of the fine wire electrodes
remained within the relevant muscle after needle removal. The
most proximal pair of fine wire electrodes was used for measuring
EMG activity during foot loading (experiment 1 only). The electro-
des had a detection length of 2 mm and were separated by
approximately 2 mm. A surface ground electrode was attached
to the medial malleolus of the right ankle and secured with
adhesive tape. All signals were amplified 1000 times, band-pass
filtered from 30 Hz to 1 kHz (Delsys Bagnoli, Boston, MA, USA)
and subsequently analogue to digitally converted (Power 1401,
Cambridge Electronic Design, Cambridge, UK) at a sampling
rate of 10 kHz and collected using SPIKE2 software (Cambridge
Electronic Design). All data were manually inspected to ensure
that muscle electrical activity could be clearly distinguished from
that of background noise or artefact. In the case where recordings
were contaminated by artefact, or muscle electrical activity
appeared absent, the location of the fine wire electrodes was
slightly adjusted, and the loading task was repeated. If clear sig-
nals could not be obtained following this procedure, then the
data from that individual were excluded from further analysis.
For experiment 2, a constant current electrical stimulator (Digi-
timer DS7AH, Digitmer, Hertfordshire, UK) was connected to one
of each pair of intramuscular electrodes with the cathode con-
nected to the proximal electrode and anode to the distal
electrode. The electrical stimulator was programmed using SPIKE
V. 2 software (Cambridge Electronic Design) to deliver trains of
current pulses (400 V, 20 rectangular pulses, 10 ms pulse width,
40 Hz frequency) across the motor point of the muscle. A submax-
imal level of stimulating current was determined prior to data
collection by delivering a train of pulses commencing at 1 mA
and increasing incrementally by 1 mA until a mechanical response
was observed as a minimum change of 10 N in the vertical ground
reaction force. The 10 N vertical force threshold was chosen so as to
elicit a clear mechanical response while minimizing subject dis-
comfort. The above task was undertaken with a mass of 20 kg
applied to the thigh using the loading rig, in order to ensure con-
sistent foot position on the force plate during the stimulations.
Mean stimulation intensities were 6+1 mA for all muscles.
2.4.2. Foot motion and force measurementsThree-dimensional motion capture and force plate data were col-
lected in order to quantify the magnitude and direction of the
biomechanical responses owing to loading and/or muscle stimu-
lation. Fourteen retro-reflective markers (diameter 9.0 mm) were
placed on the skin of the right foot and ankle according to a
multi-segment foot model developed to describe rear-, mid- and
fore-foot motion [1] (figure 3). This model [1] has been designed
to describe motion of the LA and has been shown to have a high
inter- and intratester repeatability in healthy adults [20]. Marker
trajectory and force data were collected synchronously at 200 Hz
using a four camera motion-capture system (Vicon MX, Vicon
Motion Systems, Oxford, UK) and the previously described force
platform. All marker trajectories and force plate data were
processed using VISUAL 3D (C-Motion Inc., Germantown, PA,
USA) with the marker trajectories filtered using a 6 Hz, low pass,
fourth-order Butterworth filter. Assumed rigid segments were cre-
ated according to the previously described multi-segment foot
model [1] including the calcaneus, mid-foot and metatarsals.
2.5. Data analysis2.5.1. Muscle activationRoot mean square (r.m.s.) signal amplitude of the EMG data was
calculated over the middle 3 s epoch of each 5 s loading incre-
ment in experiment 1. RMS amplitudes were normalized to the
maximal occurring r.m.s. amplitude recorded over a 1 s epoch
for each muscle across all loading trials.
2.5.2. Arch deformation and muscle lengthsThe LA height was defined from the three-dimensional-motion
data as the vertical height of the navicular marker from the

rsif.royalsocietypublishing.orgJ.R.Soc.Interface
11:20131188
4
on June 28, 2018http://rsif.royalsocietypublishing.org/Downloaded from
floor [21,22]. LA length was defined as the straightline distance
between the markers located on the medial calcaneus and the
head of the first metatarsal.
For experiment 1, LA height and muscle tendon unit (MTU)
lengths were calculated over the same 3 s epochs as the EMG
data, corresponding to each 25% loading increment. These values
were normalized to the values recorded prior to any loading
being applied to the rig. Thus, LA length and height and MTU
length were expressed as changes relative to the unloaded posture.
For experiment 2, LA length and height prior to electrical
stimulation (loading condition) and that occurring during stimu-
lation (stimulated condition) were calculated for each loading
condition (50% and 100% body mass). The peak values for the
three stimulations recorded during each trial were averaged for
each condition and normalized to the LA length and height
recorded prior to the application of any load to determine the
effect of load and stimulation.
MTU lengths for AH, FDB and QP were determined based on a
geometrical model according to the multi-segment three-dimen-
sional-motion data, by defining virtual markers corresponding to
the origin, tether and insertion points for AH and FDB, in accord-
ance with previous cadaveric descriptions for these muscles
[11–13]. Origin, tether and insertion points were expressed as
fixed locations on the bony segment to which they were attached,
allowing estimation of changes in MTU length according to the
motion of the rigid foot segments. A tether point (a point that
the line of action of the muscle is constrained to pass through)
was created for the AH muscle to represent the fascial encapsula-
tion of this muscle that occurs posterior to the navicular bone,
extending from the deltoid ligament [23]. This encapsulation
serves as a pulley, changing the anatomical pathway for this
muscle. Each MTU length was defined as the straightline distance
from the origin to the insertion, via any tether points.
In order to provide detailed insights into the contribution
of individual foot segments to the biomechanics of the LA
owing to the application of load and muscle stimulation, seg-
ment angles for the calcaneus and metatarsals were calculated
in the sagittal, frontal and transverse planes (experiment 2
only). Angular rotations of these segments were defined relative
to the laboratory coordinate system (þx-lateral, þy-anterior,
þz-up) and according to an x–y–z Cardan sequence of rotations,
i.e. rotation about the x-axis—sagittal plane motion; rotation
about the y-axis—frontal plane motion; rotation about the
z-axis—transverse plane motion. For the purpose of aligning
our findings with previous cadaveric and in vivo data, we
termed rotation about the x-axis as extension (positive) and flex-
ion, rotation about the y-axis as inversion (positive) and eversion,
and z-axis rotations as adduction (positive) and abduction.
Segment angles were normalized to unloaded segment angles
that were recorded in the experimental position prior to the
application of load, so that zero degrees about all axes rep-
resented the segment angle when the foot was unloaded. For
each participant, mean angular rotations were calculated
within the sagittal, frontal and transverse planes by creating an
average of the angular path associated with the three stimu-
lations in each task across a 2 s window from the onset of
stimulation and continuing for 1.5 s following the cessation of
the stimulation train. Joint angles were normalized and calcu-
lated for loading and stimulation conditions by applying the
same method described for LA length and height.
2.5.3. Force measurementsVertical ground reaction force (Fz) and centre of pressure (COP) in
the anteroposterior (COPAP) and mediolateral (COPML) directions
were calculated from the ground reaction force and moment data
which were low-pass filtered with a fourth-order 6 Hz Butterworth
filter. During experiment 2, the COP position and Fz values were
calculated prior to muscle stimulation, as well as the peak value
occurring during muscle stimulation. Centre of pressure and Fz
values were averaged over the three stimulations for each muscle
and condition using the same procedure described for the
kinematic data.
2.6. StatisticsGroup means for LA height, MTU length and EMG r.m.s. activity
were calculated at each loading increment in order to describe how
these variables change as loading increased (experiment 1). A two-
way repeated measures ANOVA was used to determine the effect
of loading (50% versus 100% body mass) and muscle stimulation
on LA length, LA height, segment angles, COP and Fz for AH,
FDB and QP muscles (experiment 2). Multiple comparison tests
including Bonferroni corrections were applied as post hoc analysis
between conditions when significant main effects were reported.
Statistical differences were established at p � 0.05. Results are
presented as mean+ s.e., unless otherwise stated.
3. Results3.1. Experiment 1: response to loadingIntramuscular EMG datafor the AH and FDB muscles were obtai-
ned from all nine participants, however, QP data were only
obtained from five participants due-poor signal to noise quality.
Mean unloaded lengths for the AH, FDB and QP MTUs were
168.8+6.9, 153.3+4.5 and 65.5+3.9 mm, respectively.
The relationship between the external load applied to the
leg and foot, and (i) change in LA height, (ii) change in AH,
FDB and QP length, and (iii) AH, FDB and QP normalized
EMG r.m.s. activity are shown in figure 4. With an increase
in load, there was a reduction in LA height and a subsequent
stretch in the MTUs of AH, FDB and QP. The load under
which muscle activity could first be detected, or load
threshold, was different for each muscle. Despite MTU
lengthening, muscle activity was first evident when loading
reached 50%, 75% and 100% of body mass for FDB, QP and
AH, respectively. Beyond these individual muscle thresholds,
there was a progressive increase in activation with increasing
load for all muscles. LA height and the lengths of the AH,
FDB and QP MTUs appeared to plateau around 125% body
mass, whereas muscle activation continued to increase up
to the highest load tested (150% body mass).
3.2. Experiment 2: response to stimulation3.2.1. Longitudinal arch length and heightMean unloaded LA length and height was 156.7+18.2 and
53.5+4.7 mm, respectively. The height and length of the
LA was significantly influenced by loading and muscle
stimulation for all muscles (all p � 0.05). The LA was signifi-
cantly longer and lower when loaded with 100%, compared
with 50% body mass ( p � 0.05, figure 5). Individual stimu-
lation of AH, FDB and QP muscles countered the LA
deformation produced by the load, by reducing the length
and increasing the height of the LA when loaded with both
50% and 100% body mass (all p � 0.05, figure 5).
The alterations in LA length and height described above
occurred as a result of a series of rotations occurring in multiple
segments of the foot. In order to provide additional insights into
the biomechanics of LA deformation and the impact of the plan-
tar intrinsic foot muscles on this process, we have described the
motion of the calcaneus and metatarsal segments during the

–8
–6
–4
–2
0(a)
(b)
(c)
LA height
nor
mal
ized
EM
G (
%)
D m
uscl
e le
ngth
(%
)
body mass (%)
D ar
ch h
eigh
t (%
)
0
0.5
1.0
1.5
2.0
2.5
25
50
75
100
0 25 50 75 100 125 150
FDB AH QP
Figure 4. Group means+ s.d. for (a) change in longitudinal arch (LA) height,(b) change in muscle tendon unit length and (c) normalized electromyographic(EMG) root mean square (r.m.s.) plotted as a function of load applied to thethigh during the incremental loading task. For each participant, musclelength and arch height were normalized to the resting unloaded values. TheEMG r.m.s. amplitude was normalized to the maximal value recorded duringthe 150% body mass trial. Open circles (red) represent abductor hallucis,open squares (blue) represent flexor digitorum brevis and open triangles(green) represent quadratus plantae muscle. (Online version in colour.)
LA length
LA height
LA height (%)
–4 –2 0 2 4
AH
FDB
QP
mus
cle
mus
cle
LA length (%)
loadingstimulation
loading stimulation
–20 –15 –10 –5 0
AH
FDB
QP
50%
100%
50%
100%
(a)
(b)
(c)
Figure 5. (a) Diagram of the measurements of longitudinal arch (LA) lengthand height. (b) Group mean+ s.e. for LA length and height with 50%(open) and 100% (filled) body mass loading for abductor hallucis (AH,red), flexor digitorum brevis (FDB, blue) and quadratus plantae (QP, green)muscles. LA length and height values are shown in response to loading(squares) and stimulation (circles). Length and height of the LA are presentedas a percentage change from the resting unloaded LA values (mean unloadedLA length ¼ 156.7+ 18.2 mm, mean unloaded LA height ¼ 53.5+4.7 mm). Stimulation of AH, FDB and QP resulted in a significant reductionin LA length and increase in LA height for all conditions (all p � 0.05).(Online version in colour.)
rsif.royalsocietypublishing.orgJ.R.Soc.Interface
11:20131188
5
on June 28, 2018http://rsif.royalsocietypublishing.org/Downloaded from
loading and stimulation tasks. These findings are explained
below and a visual depiction can be found in figure 6.
3.2.2. Calcaneus motionWhen loaded with 50% body mass, angular displacements
of the calcaneus were observed in the sagittal (extension), fron-
tal (eversion) and transverse (adduction) planes, with the
orientation of the calcaneus remaining similar when load was
increased to 100% of body mass (all p . 0.05, figure 7). Stimu-
lation of AH produced extension, inversion and abduction of
the calcaneus in the 50% body mass condition ( p � 0.05) and
inversion and abduction of the calcaneus in the 100% body
mass condition ( p � 0.05). Stimulation of FDB produced
inversion and abduction of the calcaneus in both 50% and
100% body mass conditions (all p � 0.05), whereas stimulation
of QP produced abduction of the calcaneus in both 50% and
100% loading conditions (both p � 0.05).
3.2.3. Metatarsal motionUnder loads equivalent to 50% body mass, the metatarsal
segment flexed (sagittal plane) and abducted (transverse
plane), with these rotations increasing significantly when
load was increased to 100% of body mass (all p � 0.05,
figure 7). Individual stimulation of AH, FDB and QP signifi-
cantly changed the orientation of the metatarsal segment, in
the opposite direction to that observed with the application

(a)
(b) (c)
Figure 6. Depiction of foot motion changes occurring owing to stimulation ofabductor halluces (AH). The position of the foot segments under load is rep-resented by the grey-shaded image and the stimulated position isrepresented by the red outlined image. The movements include (a) calcanealextension and metatarsal flexion in the sagittal plane (b) calcaneal abductionand metatarsal adduction in the axial plane and (c) calcaneal inversion in thefrontal plane. This combination of segment movements lead to a reduction inlength and an increase in height of the longitudinal arch. (Online versionin colour.)
rsif.royalsocietypublishing.orgJ.R.Soc.Interface
11:20131188
6
on June 28, 2018http://rsif.royalsocietypublishing.org/Downloaded from
of load (all p � 0.05). Stimulation of AH produced flexion and
adduction of the metatarsals, whereas stimulation of FDB
and QP produced adduction of the metatarsals under loads
of 50% and 100% of body mass (all p � 0.05).
3.2.4. Force measurementsThe location of COPML or COPAP remained unchanged
in both loading conditions ( p . 0.05). Stimulation of AH
shifted the COP posteriorly and laterally for both 50% and
100% loading conditions (both p � 0.05), whereas stimula-
tion of FDB and QP produced a significant posterior shift
in the location of the COP for both loading conditions (both
p � 0.05, figure 8).
Individual stimulation of AH, FDB and QP produced an
increase in vertical force, in both the 50% (AH: 23.09+8.7
N, FDB: 21.89+13.2 N and QP: 20.43+11.4 N, all p � 0.05)
and 100% (AH: 22.73+12.1 N, FDB: 20.97+21.5 N and QP:
20.36+21.8 N, all p � 0.05) body mass loading conditions.
4. DiscussionOur results demonstrate the importance of the intrinsic foot
musculature in contributing to foot arch posture under phys-
iological loads that would be exerted during tasks such as
walking. We have shown that increased vertical loading
resulted in significant LA length and height deformations,
stretching of the arch musculature and increased electrical
activity of the intrinsic foot muscles beyond specific load
thresholds. This indicates that the intrinsic foot muscles
respond to loading of the foot, however, their onset seems
not to be mediated by stretch as MTU length increases were
evident, whereas EMG activity was notably absent at the
lowest loading condition. Interestingly, foot deformation
and muscle stretch plateaued at the highest loads; when
muscle activity was still increasing. Our second experiment
demonstrated that electrically induced contractions of indi-
vidual intrinsic foot muscles (AH, FDB and QP), over and
beyond their natural activity, can attenuate and even reverse
LA arch deformation. Hence, these muscles have the capacity
to stiffen the LA under load and could potentially account for
the plateau in arch deformation observed at higher loads.
The capacity for the arch of the human foot to compress
when loaded, allowing for storage of elastic strain energy,
was dubbed the ‘foot spring’ mechanism by Ker et al. [2].
They reported that energy was stored as elastic strain in the
passive ligamentous structures located within the LA, such
as the plantar aponeurosis and plantar ligaments. This pro-
cess was shown to provide metabolic energy savings as
well as structural support countering compression of the
LA. The results of our initial experiment confirm that the
intrinsic foot muscles also stretch in response to LA defor-
mation, with activation of these muscles increasing at
higher loads. Results from experiment 2 suggest that these
muscles have the capacity to contribute and attenuate arch
deformation during loading. Therefore, activation of the
intrinsic foot muscles with load may have the potential to
provide a buttressing effect in parallel to that provided by
the plantar aponeurosis. It appears that regulation of
muscle activation may be contingent on loading demands,
allowing forces generated from the intrinsic foot muscles to
augment the contributions of the plantar aponeurosis once
specific force or deformation thresholds are exceeded and
potentially assisting in providing stabilization of the arch
when encountered with excessive load.
A novel aspect of our study was the use of intramuscular
electrical stimulation in addition to vertical loading to provide
detailed insights into the biomechanical capability of the three
largest plantar intrinsic foot muscles: AH, FDB and QP. Our
data revealed that individual activation of AH, FDB and QP
was sufficient to produce forces large enough to induce angu-
lar displacement of the calcaneus (extension, inversion and
abduction) and metatarsals (flexion and adduction), which
reduced the initial loading deformation by reducing LA
length and increasing LA height. A conceptual figure demon-
strating the general movement that occurs when the AH
muscle is stimulated is shown in figure 6.
Despite the similareffect that individual muscle stimulations
had on overall LA motion, differences did exist between muscles
and the axis in which each muscle exerted mechanical influence
on the calcaneal and metatarsal segments. The AH has the lar-
gest physiological cross-sectional area (PCSA) of the plantar
intrinsic foot muscles [11,12] and stimulation of this muscle pro-
duced the most pronounced alterations in segment angles in all
anatomical planes, including extension, inversion and abduc-
tion of the calcaneus, with flexion and adduction of the
metatarsals. The FDB and QP have smaller PCSAs than AH
[11,12] and, for the submaximal stimulation intensity used
here, only exerted significant influence in the frontal (calcaneal
inversion) and transverse (calcaneal abduction and metatarsal
adduction) planes. The AH is also the most medially located
of the three muscles investigated [13], therefore compared with
FDB and QP, it may possess a greater moment arm over the
joints of the LA, thereby giving it the possibility to produce
larger torques and therefore greater segmental motion.

50% bodymass loading
muscle stimulationwith 50% loading
100% bodymass loading
muscle stimulationwith 100% loading
–4
–2
0
2
4
6
–4
–2
0
2
4
6
–4
–2
0
2
4
6
sagittal frontal axial sagittal frontal axial
calcaneus metatarsal
D ca
lcan
eus
angl
e (°
)
–4
–2
0
2
4
6
D m
etat
arsa
l ang
le (
°)
D ca
lcan
eus
angl
e (°
)
D m
etat
arsa
l ang
le (
°)
–4
–2
0
2
4
6
–4
–2
0
2
4
6
D ca
lcan
eus
angl
e (°
)
D m
etat
arsa
l ang
le (
°)
AH
FDB
QP
b
b
b
b
bb
* *
*
*
**
*
**
**
* *
* *
* ** *
*
Figure 7. Changes in calcaneal and metatarsal segment angles owing to passive loading and intrinsic foot muscle stimulation. Group means+ s.e. for changes incalcaneal and metatarsal segment angles owing to loading, 50% (open) and 100% (filled) body mass as well as the subsequent changes in segment anglesoccurring with stimulation of abductor hallucis (AH, red), flexor digitorum brevis (FDB, blue) and quadratus plantae (QP, green) muscles. Segment angles areshown in response to loading (squares) and stimulation (circles). Angular rotations are defined relative to the laboratory coordinate system (x-lateral, y-anterior,z-upward) and according to an x – y – z Cardan sequence of rotations, with extension – flexion ( positive extension) as the rotation about the x-axis, inversion –eversion ( positive inversion) as the rotation about the y-axis and abduction – adduction ( positive adduction) as the rotation about the z-axis. Segment anglesare normalized to the seated, unloaded segment angle, such that zero degrees equals the unloaded segment angle for all axes. b indicates significant effectof load (100% versus 50% body mass) on segment angle. Asterisk indicates significant change in segment angle owing to muscle stimulation. (Online versionin colour.)
rsif.royalsocietypublishing.orgJ.R.Soc.Interface
11:20131188
7
on June 28, 2018http://rsif.royalsocietypublishing.org/Downloaded from
Stimulation of the individual plantar intrinsic foot muscles
produced angular displacement of the calcaneus and metatarsal
segments which led to a reduction in arch length and an increase
in arch height. Given that the applied downward load was con-
stant during our muscle stimulations, a reduction in length of
the LA indicates an overall increase in LA stiffness (reduced
deformation for the same load). This may provide an expla-
nation for the findings of Carravaggi et al. [8], Bates et al. [10]
and Pataky et al. [9] who have suggested that active contractile
mechanisms may provide substantial contributions to regu-
lation of the stiffness of the LA. The presence of an active force
generating element in parallel with a passive elastic element
may help in both attenuation of impact forces and the generation
of sufficient stiffness to transmit forces from the leg for effective
forward propulsion [5]. Active stiffening of the LA may occur in
a feedback or feed-forward manner in response to known or
unknown variations in surface or loading demand, with the
intrinsic foot muscles contributing either negative or positive
work in order to provide transient adjustments in stiffness, in
addition to that provided by the passive structures [2–4,6].
This mechanism may contribute additional positive work, as
required to provide postural stability [18] and aid in the trans-
fer of ankle plantarflexion moments during gait and possibly
generate additional positive power during propulsion [24].
A recent paper by Kelly et al. [18] used intramuscular EMG
to describe the activation patterns of the plantar intrinsic foot
muscles during various standing balance tasks and reported
highly correlated intermuscular activation with medial pos-
tural sway. This study was unable to determine whether
these relatively small muscles were capable of generating suffi-
cient force to alter COP position and thus influence posture. In
this study, we have extended the findings of Kelly et al. [18] by
confirming that even individual activation of these muscles is
capable of shifting the COP location, and as such could play

–12
–9
–6
–3
0 3 6 9 12
D COPML (mm)
D C
OP A
P (m
m)
lateral
post
erio
r
Figure 8. Changes in centre of pressure (COP) position owing to intrinsic footmuscle stimulation. Mean+ s.e. for COP in the mediolateral (COPML, x-coor-dinate) and anteroposterior (COPAP, y-coordinate) directions occurring owingto electrically evoked contractions in abductor hallucis (red circle), flexor digi-torum brevis (blue square) and quadratus plantae (green triangle) with both50% (open) and 100% (filled) loading conditions. Changes in COP positionwere calculated by subtracting the COP position immediately prior to stimu-lation from the subsequent maximum COP displacement that occurred duringmuscle stimulation, such that 0,0 (x,y) represents the COP position prior tomuscle stimulation, for all conditions. Stimulation of AH, FDB and QP pro-duced significant changes in COP position in both loading conditions (allp � 0.05). (Online version in colour.)
rsif.royalsocietypublishing.orgJ.R.Soc.Interface
11:20131188
8
on June 28, 2018http://rsif.royalsocietypublishing.org/Downloaded from
a part along with other lower limb muscles in balance control.
An interesting finding from this study was that stimulation of
the intrinsic foot muscles resulted in a posterior shift in COP.
This may be due to the shortening of the LA, predominantly
arising from its distal end, and thus a posterior displacement
in COP. In this study, we have largely eliminated postural influ-
ences by recording data from subjects in a seated position with
weights loaded on to their knees, in order to simulate the loads
applied during standing, in the absence of postural sway. This
may help to explain the divergence in results between this
study and that of Kelly et al. [18] who found no correlation
between COPAP and intrinsic foot muscle activation, as any
relationship between COPAP and muscle activity may have
been hidden by the moments produced by the significantly
larger soleus and gastrocnemius muscles.
There are some limitations to the approach used here in
attempting to understand the capacity of the intrinsic foot
muscles to adapt foot stiffness under load. During the incre-
mental loading task, QP muscle activation was not able to be
collected from all participants. In four participants, muscle
activation could not be distinguished from background
noise. This may have been due to the unstable nature of
recordings from this small muscle, or conversely, it may
also be due to a lack of activation within QP under the
loading conditions produced in this study. Additionally, for
experiment 2, we have not made direct statistical comparison
between muscles, as we are uncertain whether all muscles
were contracting with the same relative intensity. Normaliza-
tion of the stimulation intensity across muscles could be
achieved by evoking a supramaximally stimulated contrac-
tion, however, this was not attempted due to the risk of
damage to muscle tissue, discomfort and the increased risk
of the stimulation current spreading to other nearby muscles
which would confound the results. It is also difficult to ascer-
tain what the summative effect of muscle activation might be
in terms of both kinematics and kinetics as we did not simul-
taneously stimulate all three muscles. Our prediction is,
however, that simultaneous activation (which is likely to be
the physiological normality in walking and running) would
increase the overall effect with an even greater increase in
LA height and reduction of LA length. It must also be
acknowledged that as we did not record EMG from these
muscles during the evoked muscle stimulations, we cannot
verify that they were quiescent during these tasks. In fact,
based on the results of experiment 1, it is likely that these
muscles may been active in the 100% body mass loading con-
dition and as such our measures may have been influenced
by a low level of background activation. Finally, we relied
on skin-mounted markers to determine changes in LA
height and length as well as movement of calcaneus and
metatarsal segments. This approach is likely to underestimate
some of the motion of the mid-foot during walking [25], how-
ever, we are confident that the general movement directions
measured are consistent with what actually occurred during
loading and muscle stimulation. The model we have used
has been specifically designed to examine LA biomechanics,
and has been shown to have high repeatability [20]. In our
measures, the movement of the foot segments is limited com-
pared with walking and hence the contribution of factors
such as skin movement relative to the foot segments is also
more limited and changes in marker position are likely to
represent motion of foot rather than that of the skin.
In summary, our initial experiment has shown that the
intrinsic foot musculature stretched in a similar manner to
that of the plantar aponeurosis in response to LA deforma-
tion, whereas muscle activation increased considerably as
loads increased beyond certain threshold loads for each
muscle. Our following experiment has shown that activation
of the plantar intrinsic foot muscles under load produced sig-
nificant alterations in metatarsal and calcaneus segment
angles, which countered the deformation occurring owing to
the initial load and ultimately increased LA stiffness. This
active arch buttressing mechanism may have important impli-
cations for how forces are transmitted during locomotion and
postural activities. Future studies should examine the influence
of the plantar intrinsic foot muscles on LA biomechanics
during dynamic activities such as walking and running.
References
1. Leardini A, Benedetti MG, Berti L, Bettinelli D,Nativo R, Giannini S. 2007 Rear-foot, mid-foot andfore-foot motion during the stance phase of gait.Gait Posture 25, 453 – 462. (doi:10.1016/j.gaitpost.2006.05.017)
2. Ker RF, Bennett MB, Bibby SR, Kester RC, AlexanderRM. 1987 The spring in the arch of the human foot.Nature 325, 147 – 149. (doi:10.1038/325147a0)
3. Erdemir A, Hamel AJ, Fauth AR, Piazza SJ, SharkeyNA. 2004 Dynamic loading of the plantar
aponeurosis in walking. J Bone Joint Surg. Am. A86, 546 – 552.
4. Hicks J. 1954 The mechanics of the foot: II.The plantar aponeurosis and the arch. J. Anat.88, 25.

rsif.royalsocietypublishing.orgJ.R.Soc.Interface
11:20131188
9
on June 28, 2018http://rsif.royalsocietypublishing.org/Downloaded from
5. Vereecke EE, Aerts P. 2008 The mechanics of thegibbon foot and its potential for elastic energystorage during bipedalism. J. Exp. Biol. 211,3661 – 3670. (doi:10.1242/jeb.018754)
6. Caravaggi P, Pataky T, Goulermas JY, Savage R,Crompton R. 2009 A dynamic model of thewindlass mechanism of the foot: evidence forearly stance phase preloading of the plantaraponeurosis. J. Exp. Biol. 212, 2491 – 2499.(doi:10.1242/jeb.025767)
7. Donatelli R. 1985 Normal biomechanics of the footand ankle. J. Orthop. Sports Phys. Ther. 7, 91 – 95.(doi:10.2519/jospt.1985.7.3.91)
8. Caravaggi P, Pataky T, Gunther M, Savage R,Crompton R. 2010 Dynamics of longitudinal archsupport in relation to walking speed: contribution ofthe plantar aponeurosis. J. Anat. 217, 254 – 261.(doi:10.1111/j.1469-7580.2010.01261.x)
9. Pataky TC, Caravaggi P, Savage R, Parker D,Goulermas JY, Sellers WI, Crompton RH. 2008 Newinsights into the plantar pressure correlates ofwalking speed using pedobarographic statisticalparametric mapping ( pSPM). J. Biomech. 41,1987 – 1994. (doi:10.1016/j.jbiomech.2008.03.034)
10. Bates KT et al. 2013 The evolution of compliance inthe human lateral mid-foot. Proc. R. Soc. B 280,20131818. (doi:10.1098/rspb.2013.1818)
11. Kura H, Luo ZP, Kitaoka HB, An KN. 1997Quantitative analysis of the intrinsic muscles of thefoot. Anat. Rec. 249, 143 – 151. (doi:10.1002/
(SICI)1097-0185(199709)249:1,143::AID-AR17.3.0.CO;2-P)
12. Ledoux WR, Hirsch BE, Church T, Caunin M. 2001Pennation angles of the intrinsic muscles of thefoot. J. Biomech. 34, 399 – 403. (doi:10.1016/S0021-9290(00)00194-9)
13. Tosovic D, Ghebremedhin E, Glen C, Gorelick M,Brown JM. 2012 The architecture and contractiontime of intrinsic foot muscles. J. Electromyogr.Kinesiol. 22, 930 – 938. (doi:10.1016/j.jelekin.2012.05.002)
14. Thibodeau GA, Patton KT. 2007 Anatomy andphysiology, 6th edn. St Louis, MO: Mosby Elsevier.
15. Basmajian JV, Stecko G. 1963 The role of muscles inarch support of the foot. J. Bone Joint Surg. Am. 45,1184 – 1190.
16. Mann R, Inman VT. 1964 Phasic activity of intrinsicmuscles of the foot. J. Bone Joint Surg. Am. 46,469 – 481.
17. Gray EG, Basmajian JV. 1968 Electromyography andcinematography of leg and foot (‘normal’ and flat)during walking. Anat. Rec. 161, 1 – 15. (doi:10.1002/ar.1091610101)
18. Kelly LA, Kuitunen S, Racinais S, Cresswell AG. 2012Recruitment of the plantar intrinsic foot muscleswith increasing postural demand. J. Clin. Biomech.27, 46 – 51. (doi:10.1016/j.clinbiomech.2011.07.013)
19. Tokuno CD, Carpenter MG, Thorstensson A, GarlandSJ, Cresswell AG. 2007 Control of the triceps surae
during the postural sway of quiet standing. ActaPhysiol. 191, 229 – 236. (doi:10.1111/j.1748-1716.2007.01727.x)
20. Caravaggi P, Benedetti MG, Berti L, Leardini A. 2011Repeatability of a multi-segment foot protocol inadult subjects. Gait Posture 33, 133 – 135. (doi:10.1016/j.gaitpost.2010.08.013)
21. Nielsen RG, Rathleff MS, Simonsen OH, Langberg H.2009 Determination of normal values for naviculardrop during walking: a new model correcting forfoot length and gender. J. Foot Ankle Res. 2, 12.(doi:10.1186/1757-1146-2-12)
22. Hageman ER, Hall M, Sterner EG, Mirka GA. 2011Medial longitudinal arch deformation duringwalking and stair navigation while carrying loads.Foot Ankle Int. 32, 623 – 629. (doi:10.3113/FAI.2011.0623)
23. Wong YS. 2007 Influence of the abductor hallucismuscle on the medial arch of the foot: a kinematicand anatomical cadaver study. Foot Ankle Int. 28,617 – 620. (doi:10.3113/FAI.2007.0617)
24. Zelik KE, Kuo AD. 2010 Human walking isn’t allhard work: evidence of soft tissue contributions toenergy dissipation and return. J. Exp. Biol. 213,4257 – 4264. (doi:10.1242/jeb.044297)
25. Nester C, Jones RK, Liu A, Howard D, Lundberg A,Arndt A, Lundgren P, Stacoff A, Wolf P. 2007 Footkinematics during walking measured using boneand surface mounted markers. J. Biomech. 40,3412 – 3423. (doi:10.1016/j.jbiomech.2007.05.019)