Embed Size (px)
Citation preview
RESEARCH ARTICLE
Intraspecific Genetic Admixture and theMorphological Diversification of an EstuarineFish Population ComplexJulian J. Dodson1☯*, Audrey Bourret2☯, Marie France Barrette2☯, Julie Turgeon1☯,Gaétan Daigle3☯, Michel Legault4, Frédéric Lecomte4☯
1 Département de Biologie, Université Laval, Québec, Québec, Canada, 2 Département de Biologie,Université de Sherbrooke, Sherbrooke, Québec, Canada, 3 Département de Mathématique et de Statistique,Université Laval, Québec, Québec, Canada, 4 Direction Générale de l’Expertise sur la Faune et sesHabitats-Secteur de la Faune, Ministère des Forêts, de la Faune et des Parcs, Québec, Québec, Canada
☯ These authors contributed equally to this work.* [email protected]
AbstractThe North-east American Rainbow smelt (Osmerus mordax) is composed of two glacial
races first identified through the spatial distribution of two distinct mtDNA lineages. Contem-
porary breeding populations of smelt in the St. Lawrence estuary comprise contrasting mix-
tures of both lineages, suggesting that the two races came into secondary contact in this
estuary. The overall objective of this study was to assess the role of intraspecific genetic ad-
mixture in the morphological diversification of the estuarine rainbow smelt population com-
plex. The morphology of mixed-ancestry populations varied as a function of the relative
contribution of the two races to estuarine populations, supporting the hypothesis of genetic
admixture. Populations comprising both ancestral mtDNA races did not exhibit intermediate
morphologies relative to pure populations but rather exhibited many traits that exceeded the
parental trait values, consistent with the hypothesis of transgressive segregation. Evidence
for genetic admixture at the level of the nuclear gene pool, however, provided only partial
support for this hypothesis. Variation at nuclear AFLP markers revealed clear evidence of
the two corresponding mtDNA glacial races. The admixture of the two races at the nuclear
level is only pronounced in mixed-ancestry populations dominated by one of the mtDNA lin-
eages, the same populations showing the greatest degree of morphological diversification
and population structure. In contrast, mixed-ancestry populations dominated by the alter-
nate mtDNA lineage showed little evidence of introgression of the nuclear genome, little
morphological diversification and little contemporary population genetic structure. These re-
sults only partially support the hypothesis of transgressive segregation and may be the re-
sult of the differential effects of natural selection acting on admixed genomes from
different sources.
PLOS ONE | DOI:10.1371/journal.pone.0123172 April 9, 2015 1 / 21
OPEN ACCESS
Citation: Dodson JJ, Bourret A, Barrette MF,Turgeon J, Daigle G, Legault M, et al. (2015)Intraspecific Genetic Admixture and theMorphological Diversification of an Estuarine FishPopulation Complex. PLoS ONE 10(4): e0123172.doi:10.1371/journal.pone.0123172
Academic Editor: Matthias Stöck, Leibniz-Institute ofFreshwater Ecology and Inland Fisheries, GERMANY
Received: June 18, 2014
Accepted: February 5, 2015
Published: April 9, 2015
Copyright: © 2015 Dodson et al. This is an openaccess article distributed under the terms of theCreative Commons Attribution License, which permitsunrestricted use, distribution, and reproduction in anymedium, provided the original author and source arecredited.
Data Availability Statement: All AFLP andmorphological data are available on Dryad throughthe doi: 10.5061/dryad.kr3hf
Funding: This study was supported by 1. (a)Discovery research grant; Natural Sciences andEngineering Research Council (NSERC, Canada) (b)research contract; Direction de la faune aquatique,Ministère du Développement Durable, del’Environnement, de la Faune et des Parcs duQuébec (now the Ministère des Forêts, de la Fauneet des Parcs, Québec) 2. Québec governmentfunders, represented by ML and FL, participated in
IntroductionNumerous intraspecific phylogeographic studies show how many vertebrate species are com-posed of morphologically and genetically distinct lineages resulting from the vicariant isolationof intraspecific groups in isolated refugia, particularly those created during Pleistocene conti-nental glaciation events [1]. Historical divergence and subsequent secondary contact of distinctraces may result in the genetic admixture of previously isolated gene pools. In such cases, sever-al processes have been hypothesized to occur. On the one hand, if such intraspecific admixtureproduces hybrids of low fitness, then reinforcement can lead to character displacement and theevolution of reproductive isolation between distinct morphotypes, a process that is the intra-specific analog of interspecific character displacement [2, 3, 4, 5]. On the other hand, such hy-bridization may produce hybrids that are not less fit, involving either the production of newpopulations of mixed ancestry that remain distinct from both parental populations (the earlystages of hybrid speciation: [6, 7] or the production of a hybrid swarm where the boundariesbetween the parental and hybrid populations are eventually blurred. According to the model ofadditive genetic variance, gene flow between divergent allopatric populations will tend to re-duce differences between them [8].
Hybridization may also have positive effects on fitness, including heterosis (hybrid vigor) atthe individual level and/or high genetic variance for relevant phenotypic traits at the popula-tion level [9, 10]. These two features may help hybrids to adapt to novel and/or heterogeneousenvironments better than the parental lineages [10]. For example, several studies support thehypothesis that invasive organisms from disparate native-range sources form genetically ad-mixed populations with elevated genetic variation that may facilitate invasion success and thedisplacement of native populations [11,12,13]. Thus, intraspecific hybridization may representan important mechanism contributing to phenotypic diversification and population formationfollowing the post-glacial recolonization events that bring into contact previously isolatedintraspecific races.
Studies of morphological traits in some hybrid populations have reported the presence ofextreme phenotypes with trait values exceeding the range of parental trait values, a phenome-non known as transgressive segregation [14, 15]. This is hypothesized to be an importantmechanism responsible for producing novel adaptations observed in new hybrid forms [14].Furthermore, morphological differences among recently founded populations can be explainedby the differential admixture of source populations [12]. Thus, contemporary phenotypic vari-ation among intraspecific populations may be attributable to intraspecific hybridization in thecurrent environment.
The rainbow smelt (Osmerus mordax), a widespread, abundant, carnivorous fish of north-eastern North America occupying lakes, rivers, estuaries and coastal waters, provides an oppor-tunity to assess the consequences of genetic admixture on morphological divergence andpopulation structure. Anadromous/estuarine ecotypes naturally occur from the upperSt. Lawrence River to Newfoundland and southwards along the Atlantic seaboard [16]. Theyform numerous local populations supposedly reflecting historical landscape isolation main-tained by low dispersal and hypothesized selective forces [17,18,19]. The species is composedof two glacial races characterized by distinct mtDNA lineages first identified using RFLP overthe entire mitochondrial genome, corresponding to a 0.7% net sequence divergence [20,21,22].Direct sequencing of several mitochondrial genes allowed identifying diagnostic restrictionsites [23]. The distribution of the two mtDNA lineages throughout the native range reveal ageographical dichotomy far more evident in lacustrine than estuarine populations. In lakes,populations of the St. Lawrence River drainage are either fixed or largely dominated by onelineage and populations to the south of the Appalachian Mountains are largely dominated by
Intraspecific Morphological Divergence
PLOS ONE | DOI:10.1371/journal.pone.0123172 April 9, 2015 2 / 21
study design, data collection and preparation of themanuscript.
Competing Interests: The authors have declaredthat no competing interests exist.
the alternate lineage. Such a dichotomy is far less evident in estuarine populations [22]. Thisphylogeographic discontinuity strongly suggested that smelt survived in two glacial refugia andfollowed different post-glacial dispersal routes. The most likely refugium for the more easterlydistributed lineage was hypothesized to be the Acadian refugium located on the exundatedGrand Banks whereas that of the more westerly-distributed lineage was the Atlantic refugiumlocated along the Atlantic coastal plains [22]. The two mtDNA lineages are thus considered di-agnostic for the Acadian and Atlantic races.
Following the retreat of the glaciers, it is hypothesized that smelt from the Atlantic refugiumcolonized continental areas through the Hudson River valley and colonized the St. LawrenceRiver watersheds [21,22]. Smelt from the Acadian refuge preferentially colonized the water-sheds of the Gulf of St. Lawrence and the Atlantic coast. The great majority of contemporary la-custrine populations along putative post-glacial dispersion routes comprise a single lineagecharacteristic of either glacial race, although there are rare occurrences of the alternate lineage[22]. Thus, the two mtDNA races may not be completely reciprocally monophyletic because ofsome retention of ancestral polymorphism. Contemporary breeding populations of estuarinesmelt in the St. Lawrence drainage appear unique in comprising contrasting mixtures of bothlineages, suggesting that the two glacial races came into secondary contact in the St. LawrenceRiver [22]. This scenario is consistent with the identification of Lake Ontario and theSt. Lawrence River as an important suture zone, encompassing a cluster of secondary contactzones for many northeastern fish species that survived in more than one glacial refugium [24].
Co-occurrence of the two smelt races in contemporary breeding populations along theSt. Lawrence River drainage system suggests that smelt derived from the two refugia initially in-terbred upon secondary contact before forming a number of morphologically and geneticallydistinct populations [21, 22, 25, 26]. Of particular interest is the observation that two popula-tions occur sympatrically in the brackish water estuary, with one distributed mostly in thechannels along the north shore and the second restricted to the shallow shoals of the southshore of the estuary. These two populations are characterized by the presence of both mtDNAlineages but in significantly different frequencies. The so-called north shore population is char-acterized by the predominance of the Atlantic race (85% of individuals exhibit a mtDNA At-lantic lineage) and the so-called south shore population is characterized by the predominanceof the Acadian race (82% of individuals exhibit a mtDNA Acadian lineage). This suggests a pe-riod of mixing following secondary contact of the two founding races in the St. Lawrence estu-ary that subsequently produced two sympatric populations exhibiting distinct patterns of lifehistory, morphology and ecology [27, 28]. Genetic evidence based on nuclear DNA is,however, lacking.
The overall objective of this study was to assess the role of intraspecific genetic admixture inthe morphological diversification of estuarine rainbow smelt. Although the two races possessdistinct morphologies in the lacustrine environment, these morphologies were observed inpopulations composed uniquely of one of the two glacial races [29]. The extent of morphologi-cal divergence among estuarine populations as a function of differing proportions of the twoancestral races is unknown. Given the strong suggestion of secondary contact between the tworaces in the St. Lawrence River and the contrasting proportions of the founding races in estua-rine populations, we hypothesized that intraspecific genetic admixture may have contributedto phenotypic variation among populations. We first tested if and how the morphology ofmixed-ancestry populations (co-occurrence of Acadian and Atlantic mtDNA races) varied as afunction of the relative contribution of the two races to estuarine populations sampledthroughout northeastern North America. In the case of a significant effect of mixed ancestryon morphological diversity, we tested two alternative outcomes. If gene flow between divergentallopatric populations reduces differences between them, we expected that populations of
Intraspecific Morphological Divergence
PLOS ONE | DOI:10.1371/journal.pone.0123172 April 9, 2015 3 / 21
mixed ancestry would exhibit intermediate morphologies in comparison with populations de-rived uniquely from either glacial race. Conversely, in the case of transgressive segregation,populations of mixed ancestry would exhibit extreme morphologies relative to populations de-rived uniquely from either glacial race. Secondly, given the possibility that differential mtDNAlineage composition may be due to the retention of ancestral polymorphism rather than geneticadmixture following secondary contact, we sought evidence that two ancestral races are evidentwithin the nuclear gene pool and that the co-occurrence of mtDNA lineages reflects genetic ad-mixture and introgression at the level of the nuclear genome. Finally, nuclear genotype distri-bution throughout the putative zone of secondary contact is used to test the presumption thatthe two mtDNA lineages truly represent two divergent glacial races.
Material and Methods
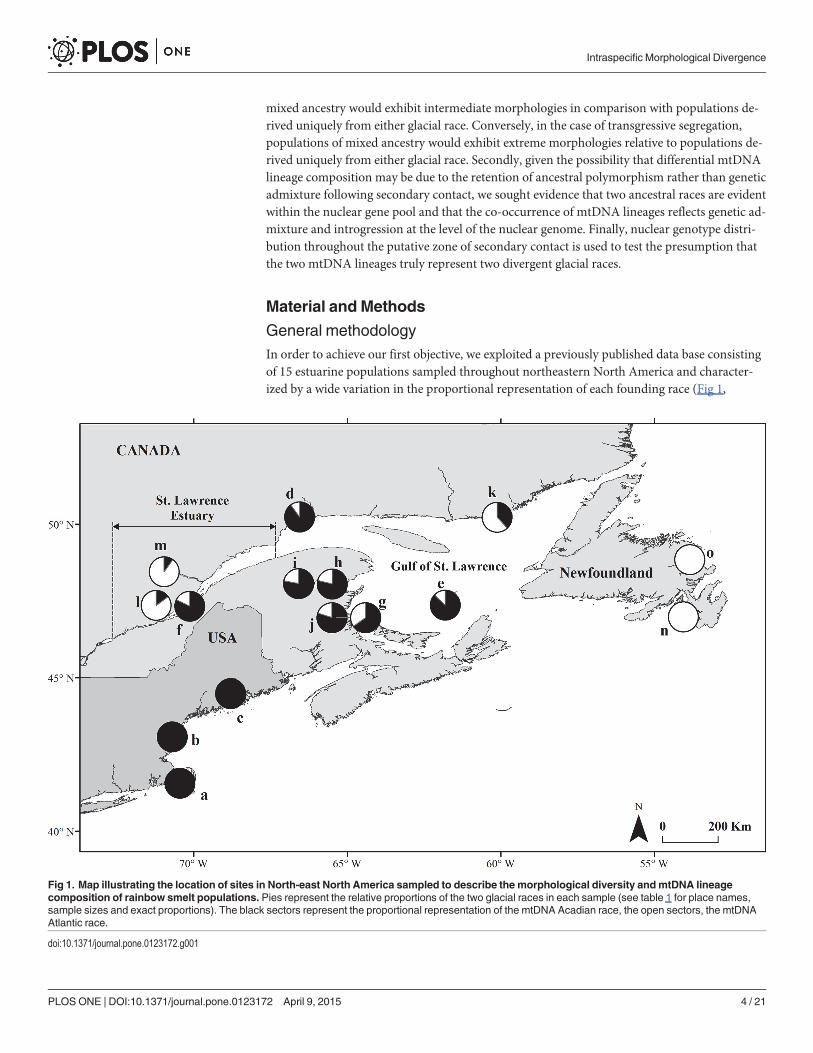
General methodologyIn order to achieve our first objective, we exploited a previously published data base consistingof 15 estuarine populations sampled throughout northeastern North America and character-ized by a wide variation in the proportional representation of each founding race (Fig 1,
Fig 1. Map illustrating the location of sites in North-east North America sampled to describe the morphological diversity andmtDNA lineagecomposition of rainbow smelt populations. Pies represent the relative proportions of the two glacial races in each sample (see table 1 for place names,sample sizes and exact proportions). The black sectors represent the proportional representation of the mtDNA Acadian race, the open sectors, the mtDNAAtlantic race.
doi:10.1371/journal.pone.0123172.g001
Intraspecific Morphological Divergence
PLOS ONE | DOI:10.1371/journal.pone.0123172 April 9, 2015 4 / 21
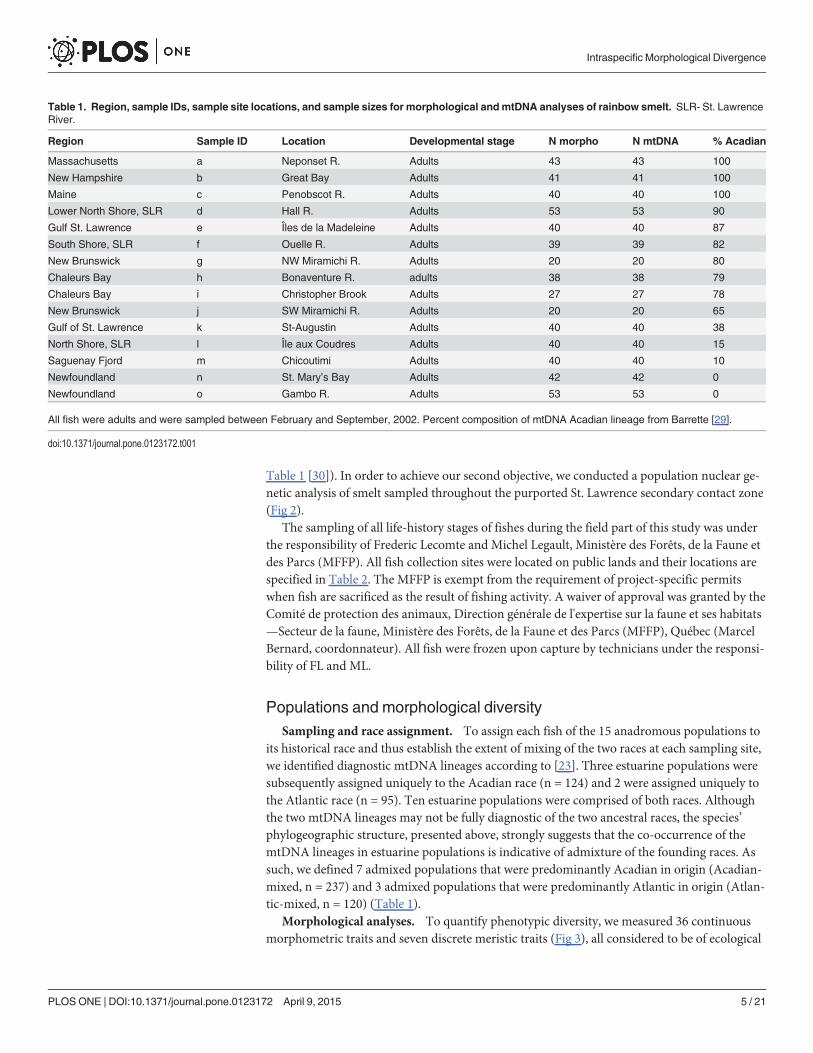
Table 1 [30]). In order to achieve our second objective, we conducted a population nuclear ge-netic analysis of smelt sampled throughout the purported St. Lawrence secondary contact zone(Fig 2).
The sampling of all life-history stages of fishes during the field part of this study was underthe responsibility of Frederic Lecomte and Michel Legault, Ministère des Forêts, de la Faune etdes Parcs (MFFP). All fish collection sites were located on public lands and their locations arespecified in Table 2. The MFFP is exempt from the requirement of project-specific permitswhen fish are sacrificed as the result of fishing activity. A waiver of approval was granted by theComité de protection des animaux, Direction générale de l'expertise sur la faune et ses habitats—Secteur de la faune, Ministère des Forêts, de la Faune et des Parcs (MFFP), Québec (MarcelBernard, coordonnateur). All fish were frozen upon capture by technicians under the responsi-bility of FL and ML.
Populations and morphological diversitySampling and race assignment. To assign each fish of the 15 anadromous populations to
its historical race and thus establish the extent of mixing of the two races at each sampling site,we identified diagnostic mtDNA lineages according to [23]. Three estuarine populations weresubsequently assigned uniquely to the Acadian race (n = 124) and 2 were assigned uniquely tothe Atlantic race (n = 95). Ten estuarine populations were comprised of both races. Althoughthe two mtDNA lineages may not be fully diagnostic of the two ancestral races, the species’phylogeographic structure, presented above, strongly suggests that the co-occurrence of themtDNA lineages in estuarine populations is indicative of admixture of the founding races. Assuch, we defined 7 admixed populations that were predominantly Acadian in origin (Acadian-mixed, n = 237) and 3 admixed populations that were predominantly Atlantic in origin (Atlan-tic-mixed, n = 120) (Table 1).
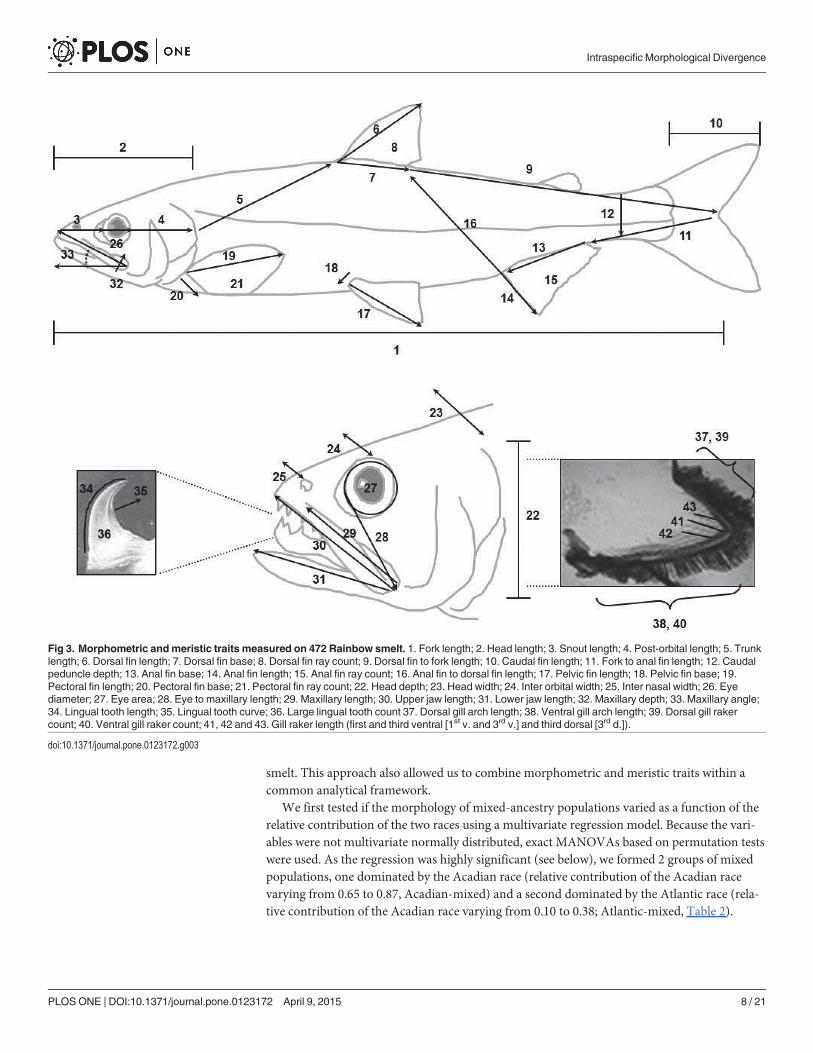
Morphological analyses. To quantify phenotypic diversity, we measured 36 continuousmorphometric traits and seven discrete meristic traits (Fig 3), all considered to be of ecological
Table 1. Region, sample IDs, sample site locations, and sample sizes for morphological andmtDNA analyses of rainbow smelt. SLR- St. LawrenceRiver.
Region Sample ID Location Developmental stage N morpho N mtDNA % Acadian
Massachusetts a Neponset R. Adults 43 43 100
New Hampshire b Great Bay Adults 41 41 100
Maine c Penobscot R. Adults 40 40 100
Lower North Shore, SLR d Hall R. Adults 53 53 90
Gulf St. Lawrence e Îles de la Madeleine Adults 40 40 87
South Shore, SLR f Ouelle R. Adults 39 39 82
New Brunswick g NW Miramichi R. Adults 20 20 80
Chaleurs Bay h Bonaventure R. adults 38 38 79
Chaleurs Bay i Christopher Brook Adults 27 27 78
New Brunswick j SW Miramichi R. Adults 20 20 65
Gulf of St. Lawrence k St-Augustin Adults 40 40 38
North Shore, SLR l Île aux Coudres Adults 40 40 15
Saguenay Fjord m Chicoutimi Adults 40 40 10
Newfoundland n St. Mary’s Bay Adults 42 42 0
Newfoundland o Gambo R. Adults 53 53 0
All fish were adults and were sampled between February and September, 2002. Percent composition of mtDNA Acadian lineage from Barrette [29].
doi:10.1371/journal.pone.0123172.t001
Intraspecific Morphological Divergence
PLOS ONE | DOI:10.1371/journal.pone.0123172 April 9, 2015 5 / 21
significance, of 576 estuarine smelt according to the procedures of Barrette et al. [28]. Jaw,head and eye measurements as well as gill arch dimensions and the number and length of gillrakers are of significance to foraging strategy and relative fin sizes and body dimensions are ofsignificance to swimming dynamics.
Data analysisWe applied a statistical procedure employing Principal Component Analysis, DiscriminantFunction Analysis and ANOVA models to quantify the nature, extent and sources of variationin phenotypic diversity. We first log transformed all morphometric data to approach multivari-ate normality. We then standardized morphometric measures for fish of different sizes as weare concerned principally with differences in ecologically relevant morphological traits inde-pendent of the size effect. We performed a Principal Components Analysis (PCA) [31, 32] withtarget populations pooled to generate factorial axes. We removed the size effect by regressing
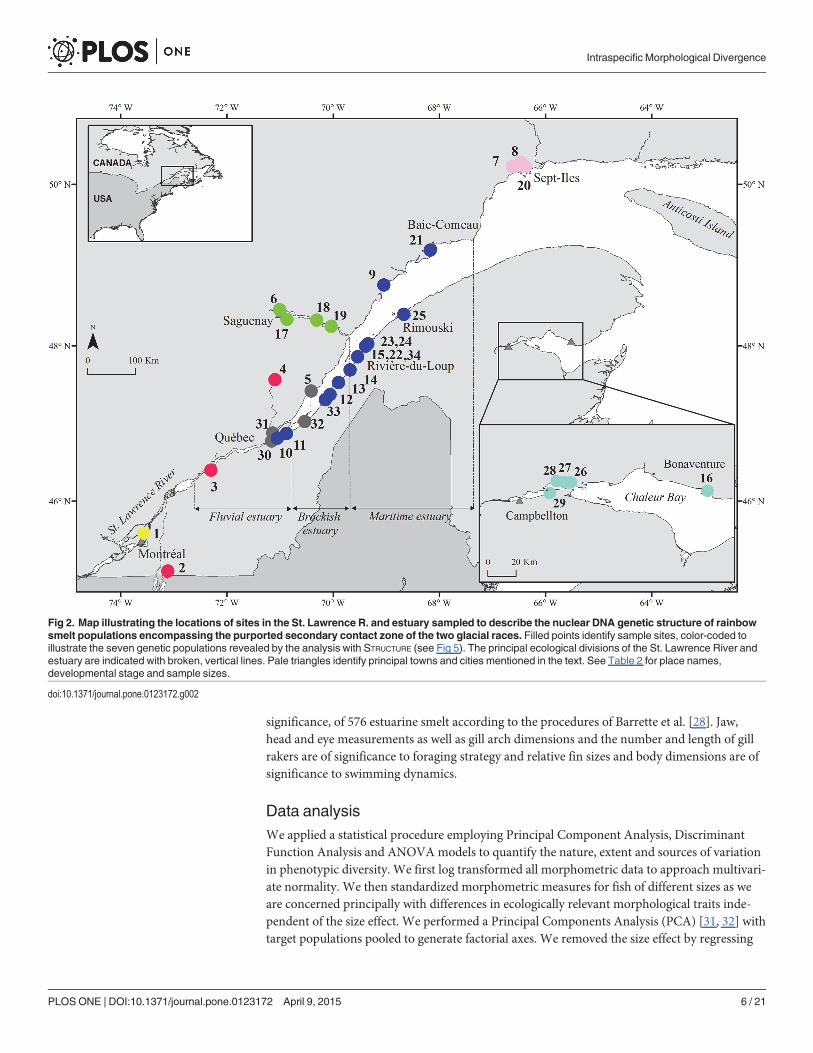
Fig 2. Map illustrating the locations of sites in the St. Lawrence R. and estuary sampled to describe the nuclear DNA genetic structure of rainbowsmelt populations encompassing the purported secondary contact zone of the two glacial races. Filled points identify sample sites, color-coded toillustrate the seven genetic populations revealed by the analysis with STRUCTURE (see Fig 5). The principal ecological divisions of the St. Lawrence River andestuary are indicated with broken, vertical lines. Pale triangles identify principal towns and cities mentioned in the text. See Table 2 for place names,developmental stage and sample sizes.
doi:10.1371/journal.pone.0123172.g002
Intraspecific Morphological Divergence
PLOS ONE | DOI:10.1371/journal.pone.0123172 April 9, 2015 6 / 21
the value of each variable for each fish on the first factorial axis that is largely explained by vari-ation in size among fish. The residual values obtained were thus used to analyze intraspecificmorphological diversity [28]. The size effect revealed by the first factorial axis involves all mor-phometric measurements, not just body length. Although we removed the size effect, the dataare not allometry free and axes may still remain partly correlated with body size measurements.Meristic measures were used without any transformation as they were independent of size in
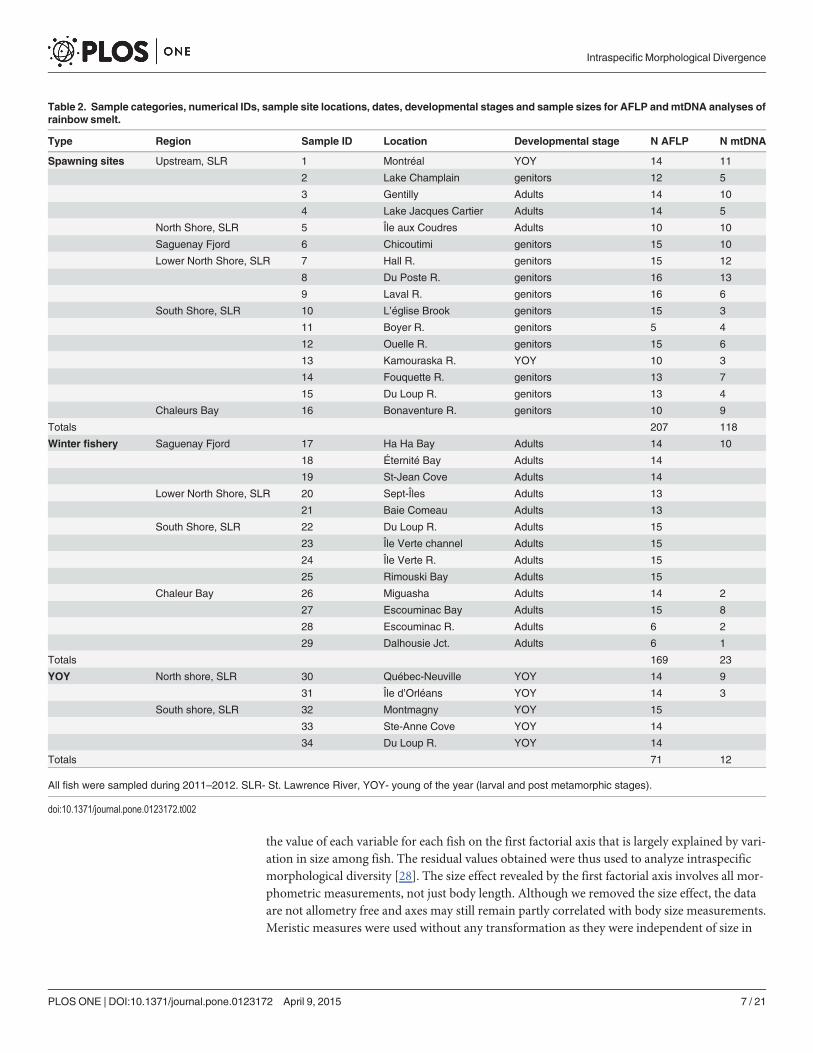
Table 2. Sample categories, numerical IDs, sample site locations, dates, developmental stages and sample sizes for AFLP andmtDNA analyses ofrainbow smelt.
Type Region Sample ID Location Developmental stage N AFLP N mtDNA
Spawning sites Upstream, SLR 1 Montréal YOY 14 11
2 Lake Champlain genitors 12 5
3 Gentilly Adults 14 10
4 Lake Jacques Cartier Adults 14 5
North Shore, SLR 5 Île aux Coudres Adults 10 10
Saguenay Fjord 6 Chicoutimi genitors 15 10
Lower North Shore, SLR 7 Hall R. genitors 15 12
8 Du Poste R. genitors 16 13
9 Laval R. genitors 16 6
South Shore, SLR 10 L’église Brook genitors 15 3
11 Boyer R. genitors 5 4
12 Ouelle R. genitors 15 6
13 Kamouraska R. YOY 10 3
14 Fouquette R. genitors 13 7
15 Du Loup R. genitors 13 4
Chaleurs Bay 16 Bonaventure R. genitors 10 9
Totals 207 118
Winter fishery Saguenay Fjord 17 Ha Ha Bay Adults 14 10
18 Éternité Bay Adults 14
19 St-Jean Cove Adults 14
Lower North Shore, SLR 20 Sept-Îles Adults 13
21 Baie Comeau Adults 13
South Shore, SLR 22 Du Loup R. Adults 15
23 Île Verte channel Adults 15
24 Île Verte R. Adults 15
25 Rimouski Bay Adults 15
Chaleur Bay 26 Miguasha Adults 14 2
27 Escouminac Bay Adults 15 8
28 Escouminac R. Adults 6 2
29 Dalhousie Jct. Adults 6 1
Totals 169 23
YOY North shore, SLR 30 Québec-Neuville YOY 14 9
31 Île d’Orléans YOY 14 3
South shore, SLR 32 Montmagny YOY 15
33 Ste-Anne Cove YOY 14
34 Du Loup R. YOY 14
Totals 71 12
All fish were sampled during 2011–2012. SLR- St. Lawrence River, YOY- young of the year (larval and post metamorphic stages).
doi:10.1371/journal.pone.0123172.t002
Intraspecific Morphological Divergence
PLOS ONE | DOI:10.1371/journal.pone.0123172 April 9, 2015 7 / 21
smelt. This approach also allowed us to combine morphometric and meristic traits within acommon analytical framework.
We first tested if the morphology of mixed-ancestry populations varied as a function of therelative contribution of the two races using a multivariate regression model. Because the vari-ables were not multivariate normally distributed, exact MANOVAs based on permutation testswere used. As the regression was highly significant (see below), we formed 2 groups of mixedpopulations, one dominated by the Acadian race (relative contribution of the Acadian racevarying from 0.65 to 0.87, Acadian-mixed) and a second dominated by the Atlantic race (rela-tive contribution of the Acadian race varying from 0.10 to 0.38; Atlantic-mixed, Table 2).
Fig 3. Morphometric andmeristic traits measured on 472 Rainbow smelt. 1. Fork length; 2. Head length; 3. Snout length; 4. Post-orbital length; 5. Trunklength; 6. Dorsal fin length; 7. Dorsal fin base; 8. Dorsal fin ray count; 9. Dorsal fin to fork length; 10. Caudal fin length; 11. Fork to anal fin length; 12. Caudalpeduncle depth; 13. Anal fin base; 14. Anal fin length; 15. Anal fin ray count; 16. Anal fin to dorsal fin length; 17. Pelvic fin length; 18. Pelvic fin base; 19.Pectoral fin length; 20. Pectoral fin base; 21. Pectoral fin ray count; 22. Head depth; 23. Head width; 24. Inter orbital width; 25. Inter nasal width; 26. Eyediameter; 27. Eye area; 28. Eye to maxillary length; 29. Maxillary length; 30. Upper jaw length; 31. Lower jaw length; 32. Maxillary depth; 33. Maxillary angle;34. Lingual tooth length; 35. Lingual tooth curve; 36. Large lingual tooth count 37. Dorsal gill arch length; 38. Ventral gill arch length; 39. Dorsal gill rakercount; 40. Ventral gill raker count; 41, 42 and 43. Gill raker length (first and third ventral [1st v. and 3rd v.] and third dorsal [3rd d.]).
doi:10.1371/journal.pone.0123172.g003
Intraspecific Morphological Divergence
PLOS ONE | DOI:10.1371/journal.pone.0123172 April 9, 2015 8 / 21
We then analyzed the two races (Acadian and Atlantic) occurring in populations character-ized by the absence or presence of mixed ancestry (pure Acadian, pure Atlantic, Acadian-mixed, Atlantic-mixed) using a nearest neighbor nonparametric discriminant function analysis(DFA). We employed 3 contrasts to test several hypotheses. First, we hypothesized that themorphology of groups composed of populations derived from each historical race and showingno evidence of genetic mixture are divergent, as demonstrated in lacustrine populations by Bar-rette et al. [29]. Secondly, we compared the morphology of populations dominated by onefounding race with that of populations derived from both founding races. P-values were calcu-lated for pairwise comparison of the groups on the most significant DFA axes with a mixedANOVA model using populations as a random effect. Corrections were applied to P-values tocontrol the type I error rate using the Bonferroni method. We also used loadings on the differ-ent axes of the DFAs to identify phenotypic correlations associated with different groups. Weidentified significant loadings using Fisher’s inverse hyperbolic tangent transformation [33]with a Bonferroni correction to control the type I error rate at the 1% level. We also evaluatedthe success of reclassification using the leave-one-out cross-validation method [34].
We quantified, with random ANOVA models, the relative importance of the major among-and within-population sources of variation acting to differentiate groups according to the ca-nonical axes. The random ANOVA model provides a quantitative means to partition the varia-tion observed on each canonical axis among the designated groups. The variance componentswere estimated by the maximum likelihood method [35] via the procedure VARCOMP of SAS(version 9.3, SAS Institute Inc, NC). Tests of significance on these variance components weremade using the bootstrap technique with 5000 bootstrap replicates of each population [36].The ANOVA model also quantified the within population variation that served as the errorterm. The random ANOVA model was fitted on the main canonical axes of the DFA using thefollowing variance components: (1) pure Acadian vs pure Atlantic; (2) Acadian-mixed vs Aca-dian-pure; (3) Atlantic- mixed vs Atlantic pure (4) the remaining among-population variation,nested within groups (df = 11). We used this variance component to evaluate the importanceof unaccounted sources of variation in influencing morphology.
In the case of a significant effect of genetic mixture, median values of traits significantly cor-related with the discriminant functions were compared for evidence of transgressive segrega-tion. Medians and their variance were used as the morphological trait values were not normallydistributed. Traits of mixed-ancestry populations were considered as being transgressive iftheir medians were significantly smaller or larger than the smallest and largest median trait val-ues, respectively, of populations showing no evidence of mixed ancestry of historical lineages[37]. We restricted this analysis to traits that contributed significantly to differentiating popula-tion groups in DFA. To calculate trait medians, the morphometric variables were back-trans-formed to their original scale, but expressed around an average fish (averaged for allmorphological traits of the 576 fish) to remove the size effect (S1 Protocol). We then tested theequality of trait medians among groups using the median one-way nonparametric ANOVA.The equality of medians was rejected at P< 0.0167 following the Bonferonni correction formultiple comparisons.
Populations and patterns of genetic admixtureStudy site. Smelt of different age classes were sampled at different seasons during 2011–
2012 throughout the St. Lawrence River (SLR; Fig 2, Table 2). The SLR extends 1600 km fromthe outlet of Lake Ontario to the Atlantic Ocean, and comprises three fluvial lakes connected tolotic sections, a freshwater estuary, a brackish estuary, and a lower (marine) estuary flowinginto the Gulf of St. Lawrence (Fig 2) [38]. We sampled the lotic section of the river in the
Intraspecific Morphological Divergence
PLOS ONE | DOI:10.1371/journal.pone.0123172 April 9, 2015 9 / 21
vicinity of Montreal, the freshwater estuary, the brackish estuary, the maritime estuary (includ-ing the Saguenay fjord) and Chaleur Bay (Fig 2). The brackish estuary encompasses two ecolog-ically distinct environments. A steep rocky shoreline and deep channel characterize the northshore and extensive shallow mud flats characterize the south shore of the estuary. These twoenvironments are exploited by the two distinct sympatric (in the geographical sense) popula-tions, the ‘north-shore’ and ‘south-shore’ populations (see above).
Sampling. Three categories of fish were sampled. Firstly, reproductive fish were sampledon known spawning grounds to examine the degree of reproductive isolation among putativelocal populations. Secondly, we sampled adult smelt captured during the winter recreationalice fishery and, thirdly, young-of-the-year (YOY) fish, at several sites (Fig 2, Table 2) so as toincrease the probability of discovering previously unsampled populations in the St. Lawrence.The locations of spawning grounds of 2 putative local populations were unknown and thus rep-resented by YOY fish; sites 1 and 3 (Fig 2, Table 2). The spawning grounds of the north-shorepopulation are unknown, but the definition of this population is based on the capture of post-spawning adults in the vicinity of Île aux Coudres (site 5, Fig 2), on the north shore of theSt. Lawrence estuary, prior to the spring spawning season of the south shore population [39]. Asample of these fish thus served to genetically characterize the north-shore population. Finally2 lacustrine populations were sampled. Lake Champlain smelt are pure mtDNA Atlantic raceand provided the opportunity to relate a pure Atlantic mtDNA population with a nuclear geno-mic profile. A sample of adult fish was obtained from Jacques Cartier Lake (Fig 2, Table 2), anisolated population of lacustrine smelt that was recently founded by transplanting fish fromsource populations that were representative of both historical races. Although not estuarine,this population served to validate our ability to detect evidence of genetic admixture of thefounding races.
Genetic characterisation. We extracted DNA from EtOH-preserved tissues with the QIA-GEN blood and tissues extraction kit (QIAGEN), and quantified DNA concentration by spec-trophotometry. We generated AFLP fragments for 447 individuals following the AFLP PlantMapping protocol (Applied Biosystems Inc. Foster City, CA, USA). We used ca. 100 ng ofDNA for the restriction-ligation step and two EcoRI/MseI primer pairs in selective PCRs(ATG/CAG and ACC/CAC). Fragments were migrated on ABI capillary sequencer and peakswith a minimum relative fluorescence of 100 units were scored manually using GeneMapper3.7. For a subset of 153 individuals scored for AFLPs (Table 2), we sequenced a 565-bp segmentof the ND5/ND6 mitochondrial DNA segment containing diagnostic differences between theAcadian and Atlantic mtDNA lineages [23].
We used STRUCTURE 2.3.3 [40, 41, 42] to determine the number of distinct genetic clusterswithin the SLR (50,000 burn-in followed by 200,000 iterations, admix model, with and withoutprior information on sampling location (Loc Prior), 10 runs for each of K = 1–20). We usedthe criteria of Pritchard et al. [40] and Evanno et al. [43] to infer the most likely number ofgroups (K). Figs. were made with DISTRUCT [44]. The most likely number of clusters was consid-ered to distinguish contemporary populations within the system. As a complement, pairwiseFST between sample sites were estimated based on the distance matrix of pairwise differencesbetween AFLP profiles with ARLEQUIN 3.5 [45]. Finally, an analysis of molecular variance(AMOVA) was conducted to assess if clusters account for a significant proportion of geneticvariance beyond that occurring among samples within clusters. Calculations were done using1000 permutations in ARLEQUIN 3.5. [45].
To assess the patterns of admixture between the two founding races, we considered the re-sults of structure with K = 2. First, we assessed the extent of genome admixture of the foundingnuclear races using two independent methods. Namely, we used q, the Bayesian coefficient ofancestry provided by STRUCTURE for K = 2, and h, the maximum-likelihood hybrid index
Intraspecific Morphological Divergence
PLOS ONE | DOI:10.1371/journal.pone.0123172 April 9, 2015 10 / 21
estimated with INTROGRESS [46, 47]. For the latter, based on the results of STRUCTURE, we consid-ered samples fromMontreal and du Loup River as representative of the reference and alterna-tive parental populations for nuclear DNA, respectively.
Finally, we tested the correspondence between the nuclear and mtDNA evidence for two an-cestral races using a logistic regression analysis [48], where the binary response variable was as-signment to either the Atlantic or Acadian mtDNA race. Specifically, we calculated theprobability of being classified in the mtDNA Atlantic race as a function of the inferred ancestry(q) in cluster 2 (when K = 2) and, in a second model, as a function of h, the maximum likeli-hood hybrid index. The Hosmer-Lemeshow test was used to confirm the goodness of fit ofboth models to the data. To quantify the concordance between the nuclear and mtDNA races,the area under the receiver operating characteristics (ROC) curve was calculated.
Results
Populations and morphological diversityThe preponderance of the Atlantic mtDNA lineage in populations of the northern Gulf ofSt. Lawrence and Newfoundland (Fig 2) suggests a different dispersal history of the Atlanticrace than previously surmised [22]. Secondary contact of the two races thus appears not tohave been restricted to the St. Lawrence estuary. The morphology of the mixed-ancestry popu-lations differed according to the relative contributions of the founding races. The multivariateregression model was highly significant (F Wilk’s lambda = 21.43; df = 42, 314; P< 0.0001). Whengrouping estuarine smelt populations characterized by the extent of mixture of the two histori-cal mtDNA races (pure Acadian, pure Atlantic, Acadian-mixed, Atlantic-mixed), the morphol-ogies of the 4 groups differed significantly (MANOVA: FWilk’s lambda = 11.97; d.f. = 126,1591.9; P< 0.0001). All three discriminant functions were significant (P< 0.0001), with thefirst function explaining 58.7% of the variance, and the second and the third functions explain-ing 26.6% and 14.7% respectively. Reclassification of smelt to their group of origin revealedthat smelt from populations of mixed ancestry were more successfully reassigned (Acadian-mixed, 88.6%; Atlantic-mixed, 84.2%) than smelt from populations of pure ancestry (pure Aca-dian, 67.7.0%; pure Atlantic, 61.1%). The suite of correlated traits accounting for the greatestdegree of morphological divergence discriminated smelt from Atlantic-mixed populations(Fig 4). The Atlantic-mixed populations differed significantly from all other groups on this axis(P = 0.0019). No significant differences occurred among the remaining 3 population groups.Contrasting Atlantic-mixed populations with pure Atlantic populations explained 47.8% of thevariance associated with this function (Table 3). Contrasting pure-Atlantic and pure Acadianpopulation groups explained 40.1% of the total variance (Table 3), reflecting the historical di-vergence of the two historical races (S1 File). The third contrast, comparing the pure Acadianpopulations with Acadian-mixed populations, explained less than 2% of the variation on thisaxis. Finally, the remaining among-population variation was only 2.4%. Twenty-two morpho-logical traits were significantly correlated with the first axis (Table 4). Briefly, Atlantic-mixedpopulations were characterized by bigger eyes, longer gill arches, deeper heads, larger jaw di-mensions and longer gill rakers relative to all other estuarine population groups.
The second suite of correlated traits (function 2), discriminated smelt from Acadian-mixedpopulations (Fig 4). This population group differed significantly from all other populationgroups on this axis (P = 0.008) whereas no significant differences occurred among the remain-ing 3 groups. Contrasting Acadian-mixed populations with pure Acadian populations ex-plained 52.9% of the variance associated with this function (Table 3). Contrasting groups withno evidence of mixed ancestry (pure Acadian, pure Atlantic) explained 10.8% of the total vari-ance. The third contrast, comparing pure Atlantic race populations and Atlantic-mixed
Intraspecific Morphological Divergence
PLOS ONE | DOI:10.1371/journal.pone.0123172 April 9, 2015 11 / 21
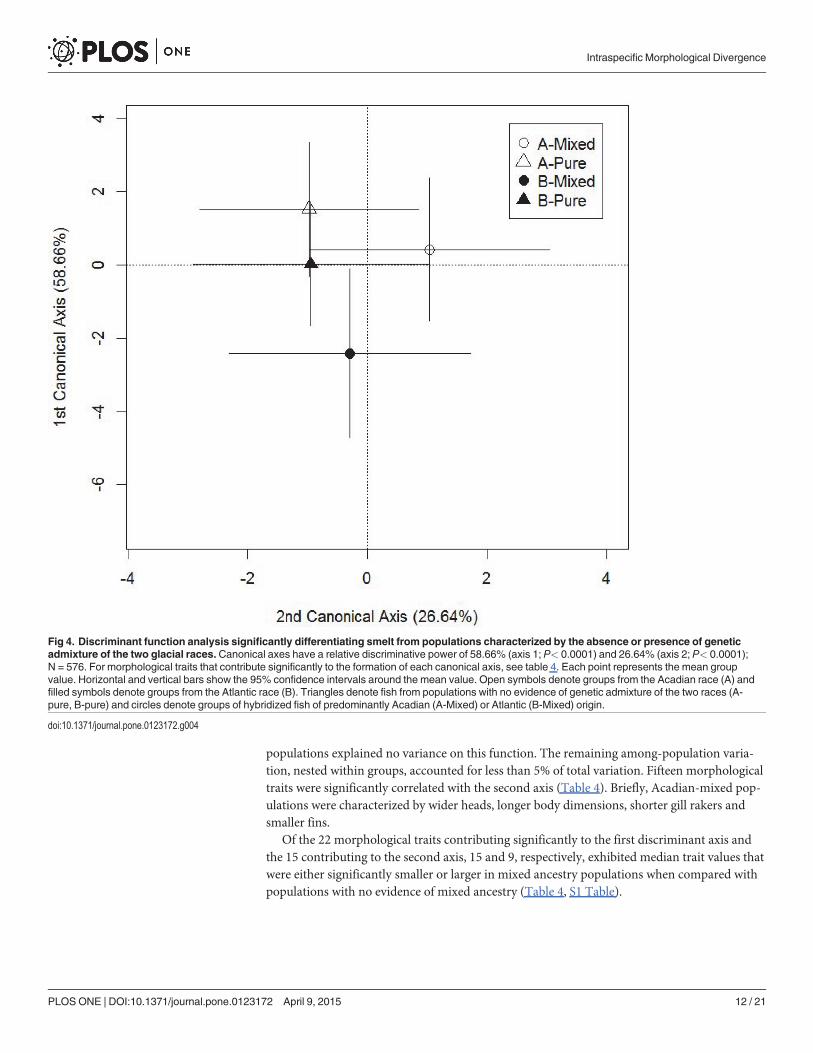
populations explained no variance on this function. The remaining among-population varia-tion, nested within groups, accounted for less than 5% of total variation. Fifteen morphologicaltraits were significantly correlated with the second axis (Table 4). Briefly, Acadian-mixed pop-ulations were characterized by wider heads, longer body dimensions, shorter gill rakers andsmaller fins.
Of the 22 morphological traits contributing significantly to the first discriminant axis andthe 15 contributing to the second axis, 15 and 9, respectively, exhibited median trait values thatwere either significantly smaller or larger in mixed ancestry populations when compared withpopulations with no evidence of mixed ancestry (Table 4, S1 Table).
Fig 4. Discriminant function analysis significantly differentiating smelt from populations characterized by the absence or presence of geneticadmixture of the two glacial races.Canonical axes have a relative discriminative power of 58.66% (axis 1; P< 0.0001) and 26.64% (axis 2; P< 0.0001);N = 576. For morphological traits that contribute significantly to the formation of each canonical axis, see table 4. Each point represents the mean groupvalue. Horizontal and vertical bars show the 95% confidence intervals around the mean value. Open symbols denote groups from the Acadian race (A) andfilled symbols denote groups from the Atlantic race (B). Triangles denote fish from populations with no evidence of genetic admixture of the two races (A-pure, B-pure) and circles denote groups of hybridized fish of predominantly Acadian (A-Mixed) or Atlantic (B-Mixed) origin.
doi:10.1371/journal.pone.0123172.g004
Intraspecific Morphological Divergence
PLOS ONE | DOI:10.1371/journal.pone.0123172 April 9, 2015 12 / 21
Populations and genetic admixtureAmong the 447 smelt collected in the SLR and successfully analyzed, a total of 108 AFLP bandswere unambiguously scored, of which 64 were polymorphic. However, 35 of these polymor-phisms were uninformative, occurring at a frequency lower than 5% in any one sample. Wethus retained 29 bands for subsequent analyses. Although only 29 bands were retained, we con-sidered this adequate for population definition. The associated FST values were highly signifi-cant (see S2 Table) and the genotyping error rate extremely low (1.9%; [49]). Furthermore, theAMOVA conducted among the 7 genetic groups defined in STRUCTURE (see below) explained alarge proportion of the total genetic variance (14.9%, P< 0.00001), almost 5 times more thanthat accounted for by variance among samples within groups (3.2%, P< 0.00001).
The cluster analysis performed with STRUCTURE using Pritchard’s criterion supported the def-inition of K = 7 distinct genetic clusters along the SLR (Fig 5). These include 2 populations lo-cated at the upstream end of the SLR (table 2; Population 1 sampled at site 1 (yellow in Fig 2and 5), and Population 2 sampled at sites 2, 3 and 4 (red in Fig 2 and 5)), the North Shore Pop-ulation sampled at site 5 (grey in Fig 2 and 5), the Fjord Population sampled at site 6 (green inFig 2 and 5), the Lower North Shore Population at sites 7 and 8 (pink in Fig 2 and 5), the SouthShore Population at sites 10, 11, 12, 13, 14, 15 and 9 (dark blue in Fig 2 and 5) and the ChaleurBay Population at site 16 (light blue in Fig 2 and 5). There are marked differences in the spatialextent of clusters, with the South Shore Population forming a large, undifferentiated groupalong the estuary’s south shore (with an extension to the north shore (site 9)) while several dis-tinct clusters are found along the estuary’s north shore. The distribution of the 7 groups is simi-lar among the winter fishery samples (samples17-29) and among the YOY samples (samples30–34) (Fig 2 and 5), indicating that the distribution of these life stages reflects that of the localspawning populations. Pairwise Fst values between samples representative of 16 known or pre-sumed local spawning groups confirmed this pattern. Of 120 pairwise comparisons, only 22
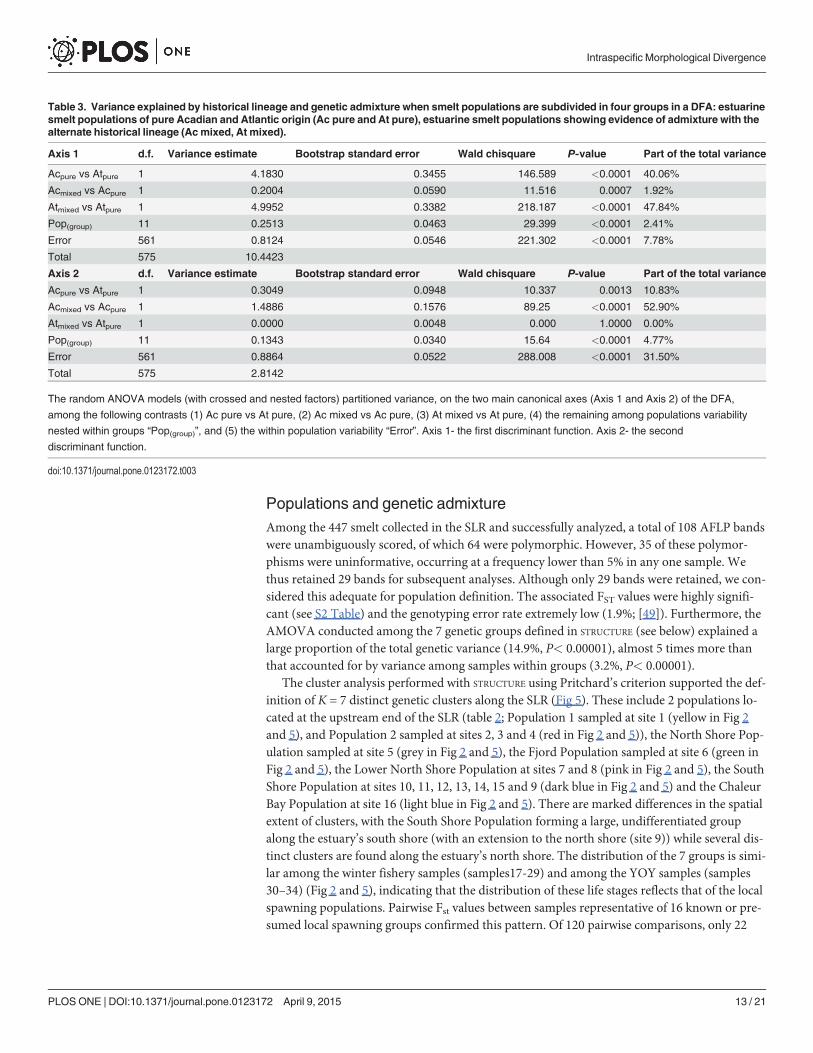
Table 3. Variance explained by historical lineage and genetic admixture when smelt populations are subdivided in four groups in a DFA: estuarinesmelt populations of pure Acadian and Atlantic origin (Ac pure and At pure), estuarine smelt populations showing evidence of admixture with thealternate historical lineage (Acmixed, At mixed).
Axis 1 d.f. Variance estimate Bootstrap standard error Wald chisquare P-value Part of the total variance
Acpure vs Atpure 1 4.1830 0.3455 146.589 <0.0001 40.06%
Acmixed vs Acpure 1 0.2004 0.0590 11.516 0.0007 1.92%
Atmixed vs Atpure 1 4.9952 0.3382 218.187 <0.0001 47.84%
Pop(group) 11 0.2513 0.0463 29.399 <0.0001 2.41%
Error 561 0.8124 0.0546 221.302 <0.0001 7.78%
Total 575 10.4423
Axis 2 d.f. Variance estimate Bootstrap standard error Wald chisquare P-value Part of the total variance
Acpure vs Atpure 1 0.3049 0.0948 10.337 0.0013 10.83%
Acmixed vs Acpure 1 1.4886 0.1576 89.25 <0.0001 52.90%
Atmixed vs Atpure 1 0.0000 0.0048 0.000 1.0000 0.00%
Pop(group) 11 0.1343 0.0340 15.64 <0.0001 4.77%
Error 561 0.8864 0.0522 288.008 <0.0001 31.50%
Total 575 2.8142
The random ANOVA models (with crossed and nested factors) partitioned variance, on the two main canonical axes (Axis 1 and Axis 2) of the DFA,
among the following contrasts (1) Ac pure vs At pure, (2) Ac mixed vs Ac pure, (3) At mixed vs At pure, (4) the remaining among populations variability
nested within groups “Pop(group)”, and (5) the within population variability “Error”. Axis 1- the first discriminant function. Axis 2- the second
discriminant function.
doi:10.1371/journal.pone.0123172.t003
Intraspecific Morphological Divergence
PLOS ONE | DOI:10.1371/journal.pone.0123172 April 9, 2015 13 / 21
were not significant (S2 Table); 19 of these involved spawning sites of the South ShorePopulation.
The same cluster analysis using Evanno’s criterion supported the definition of K = 2 distinctgenetic clusters (Fig 5). These clusters exhibit a clear gradient along the upstream-downstreamand the north shore-south shore axes (Fig 5). Cluster 1 (blue in Fig 5) dominates samples locat-ed along the south shore (samples 10–15), downstream on the lower north shore (samples 7–9)and in Chaleur Bay (sample 16) (Fig 5). In contrast, cluster 2 (red in Fig 5) is largely restrictedto the upstream sites and the north shore of the SLR among spawning samples (site 1–6). Onceagain, the distribution of the 2 groups is similar among the winter fishery samples and amongthe YOY samples.
Estimates of the degree of genetic admixture between the two races (K = 2) indicate that ad-mixture occurred principally upstream and along the north shore of the SLR with little evi-dence of admixture occurring along the south shore (Fig 5). The hybrid index (h) and thecoefficient of ancestry (q, calculated without Loc Prior) (Fig 6) decline downstream from
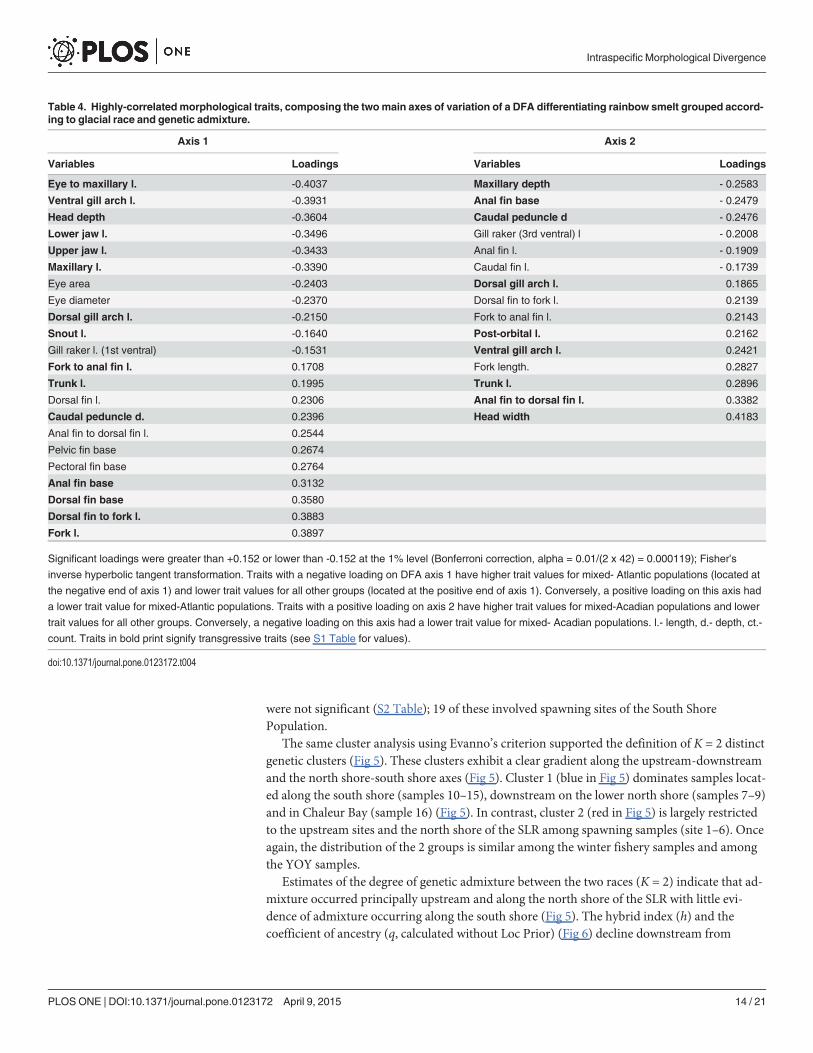
Table 4. Highly-correlated morphological traits, composing the twomain axes of variation of a DFA differentiating rainbow smelt grouped accord-ing to glacial race and genetic admixture.
Axis 1 Axis 2
Variables Loadings Variables Loadings
Eye to maxillary l. -0.4037 Maxillary depth - 0.2583
Ventral gill arch l. -0.3931 Anal fin base - 0.2479
Head depth -0.3604 Caudal peduncle d - 0.2476
Lower jaw l. -0.3496 Gill raker (3rd ventral) l - 0.2008
Upper jaw l. -0.3433 Anal fin l. - 0.1909
Maxillary l. -0.3390 Caudal fin l. - 0.1739
Eye area -0.2403 Dorsal gill arch l. 0.1865
Eye diameter -0.2370 Dorsal fin to fork l. 0.2139
Dorsal gill arch l. -0.2150 Fork to anal fin l. 0.2143
Snout l. -0.1640 Post-orbital l. 0.2162
Gill raker l. (1st ventral) -0.1531 Ventral gill arch l. 0.2421
Fork to anal fin l. 0.1708 Fork length. 0.2827
Trunk l. 0.1995 Trunk l. 0.2896
Dorsal fin l. 0.2306 Anal fin to dorsal fin l. 0.3382
Caudal peduncle d. 0.2396 Head width 0.4183
Anal fin to dorsal fin l. 0.2544
Pelvic fin base 0.2674
Pectoral fin base 0.2764
Anal fin base 0.3132
Dorsal fin base 0.3580
Dorsal fin to fork l. 0.3883
Fork l. 0.3897
Significant loadings were greater than +0.152 or lower than -0.152 at the 1% level (Bonferroni correction, alpha = 0.01/(2 x 42) = 0.000119); Fisher’s
inverse hyperbolic tangent transformation. Traits with a negative loading on DFA axis 1 have higher trait values for mixed- Atlantic populations (located at
the negative end of axis 1) and lower trait values for all other groups (located at the positive end of axis 1). Conversely, a positive loading on this axis had
a lower trait value for mixed-Atlantic populations. Traits with a positive loading on axis 2 have higher trait values for mixed-Acadian populations and lower
trait values for all other groups. Conversely, a negative loading on this axis had a lower trait value for mixed- Acadian populations. l.- length, d.- depth, ct.-
count. Traits in bold print signify transgressive traits (see S1 Table for values).
doi:10.1371/journal.pone.0123172.t004
Intraspecific Morphological Divergence
PLOS ONE | DOI:10.1371/journal.pone.0123172 April 9, 2015 14 / 21
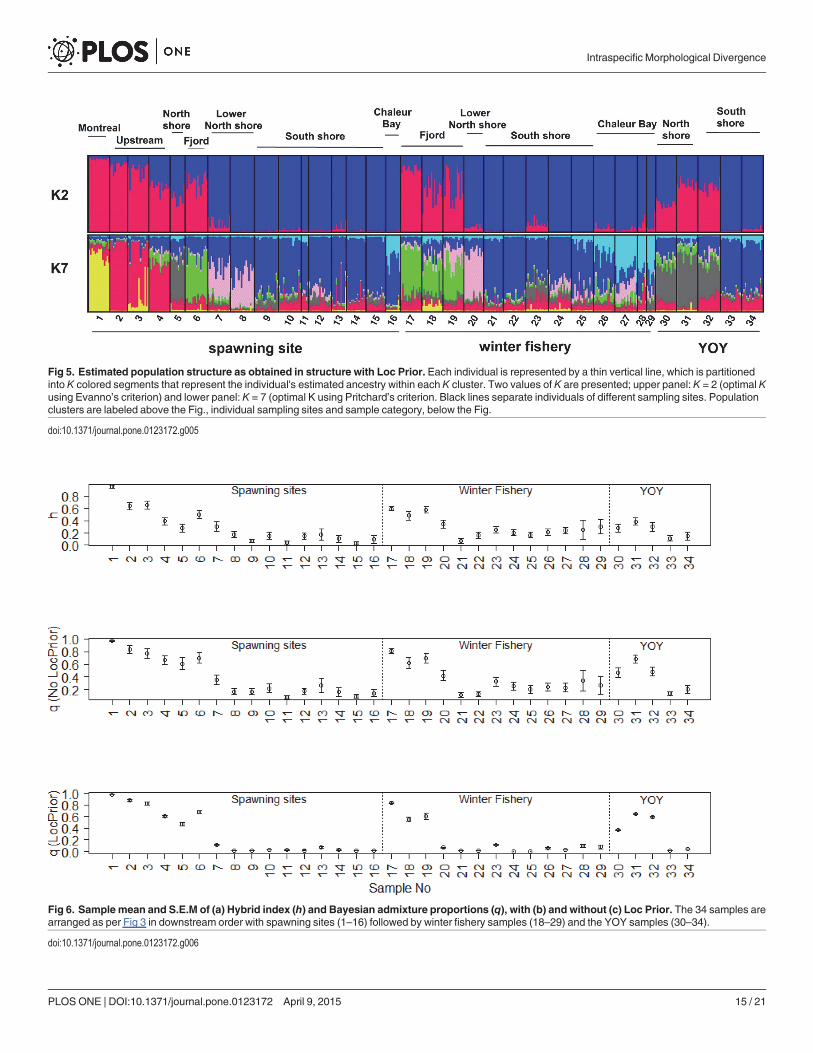
Fig 6. Sample mean and S.E.M of (a) Hybrid index (h) and Bayesian admixture proportions (q), with (b) and without (c) Loc Prior. The 34 samples arearranged as per Fig 3 in downstream order with spawning sites (1–16) followed by winter fishery samples (18–29) and the YOY samples (30–34).
doi:10.1371/journal.pone.0123172.g006
Fig 5. Estimated population structure as obtained in structure with Loc Prior. Each individual is represented by a thin vertical line, which is partitionedinto K colored segments that represent the individual's estimated ancestry within each K cluster. Two values of K are presented; upper panel: K = 2 (optimal Kusing Evanno’s criterion) and lower panel: K = 7 (optimal K using Pritchard’s criterion. Black lines separate individuals of different sampling sites. Populationclusters are labeled above the Fig., individual sampling sites and sample category, below the Fig.
doi:10.1371/journal.pone.0123172.g005
Intraspecific Morphological Divergence
PLOS ONE | DOI:10.1371/journal.pone.0123172 April 9, 2015 15 / 21
Montreal, showing considerable admixture in the populations of Lake Jacques Cartier, theNorth Shore Population and the Fjord Population. Values of h and q remain low in the SouthShore, Chaleur Bay and Lower North Shore populations. This gradient is repeated in all threesample types. This tendency is most evident when calculating q with Loc Prior (Fig 6). LocPrior tends to polarize q values, underestimating q when the hybrid index approaches 0 andoverestimating q when the hybrid index approaches 1 thus amplifying the distinction of geneti-cally admixed populations. The population from Lake Jacques Cartier (site 4) conforms to theexpectation of a genetically admixed population (as it was so stocked). Similarly, the NorthShore Population (spawners, 5 and YOY, 30, 31 and 32), and the Fjord Population (spawners,6 and winter fishery, 17, 18 and 19) are also admixed relative to all other populations.
Finally, the logistic regression models revealed that the probability of being classified in themtDNA Atlantic race increases significantly with q or h (respectively, Wald chi-square = 19.27,df = 1, P<0.0001; Wald chi-square = 12.34, df = 1, P = 0.0004). In the first and second models,respectively, 70.9% and 67.7% of the predicted probabilities were in concordance with observedassignments. Moreover, variables q and h are highly correlated to each other (Pearson correla-tion r = 0.89) and the inferred ancestry (q) is the most important of the two variables for classi-fying individuals. After considering the effect of q, the index h explains no further part ofvariation (Wald chi-square = 1.25, df = 1, P = 0.2628). The blue cluster illustrated in Fig 5 thuscorresponds to the Acadian mtDNA race and the red cluster illustrated in Fig 5 corresponds tothe Atlantic mtDNA race.
DiscussionThe morphology of mixed-ancestry populations (co-occurrence of Acadian and AtlanticmtDNA races) varied as a function of the relative contribution of the two races to estuarinepopulations, supporting the hypothesis of genetic admixture as opposed to ancestral polymor-phism. If the lineage composition of these populations were uniquely due to the retention ofancestral polymorphisms, there would be no reason to expect that populations dominated byone or the other lineage would be consistently morphologically distinct relative to populationscomprising a single lineage. Pure estuarine populations of the two races are morphologicallydistinct, as observed in lacustrine populations [29]. We observed that populations comprisingboth ancestral mtDNA lineages did not exhibit intermediate morphologies relative to popula-tions comprising a single lineage. On the contrary, the genetic mixture of the ancestral mtDNAraces generated suites of correlated morphological traits, many of which exceeded the parentaltrait values. The morphology of Atlantic-mixed populations explained the greatest part of thetotal morphological variation revealed by our analyses, representing the major source of varia-tion on the first discriminant axis. Furthermore, over 68% of morphological traits distinguish-ing Atlantic-mixed populations exhibited extreme values relative to pure Atlantic populations,consistent with the hypothesis of transgressive segregation. The morphology of Acadian-mixedpopulations also differed significantly from all others on the second axis. However, as the sec-ond axis explained less than half of the variance accounted for by the first axis, contrasting Aca-dian-mixed populations with pure Acadian populations accounts for only approximately onehalf of the variance explained by contrasting Atlantic-mixed populations with pure Atlanticpopulations. Sixty percent of traits distinguishing Acadian-mixed populations exhibited ex-treme values relative to pure Acadian populations.
The observations presented above are consistent with the hypothesis of transgressive segre-gation. Evidence for genetic admixture at the level of the nuclear gene pool, however, providesonly partial support for this hypothesis. The nuclear genome of rainbow smelt revealed clearevidence that two races were admixed within some populations of the purported secondary
Intraspecific Morphological Divergence
PLOS ONE | DOI:10.1371/journal.pone.0123172 April 9, 2015 16 / 21
contact zone within the St. Lawrence system. In particular, the admixture of the two nuclearraces is pronounced in mixed-ancestry populations dominated by the Atlantic race, the samepopulations showing the greatest degree of morphological differentiation. Earlier studies of theSt. Lawrence sympatric smelt populations identified head length, eye area and jaw length asbeing responsible for the strong morphological differentiation between the ‘north-shore’ and‘south-shore’ St. Lawrence estuary populations [27, 28]. Relative to smelt populations of thepure Atlantic race, populations of admixed smelt of Atlantic origin also exhibit significantlybigger head and jaw dimensions (including a longer upper and lower jaw and a bigger eye di-ameter, head depth and snout length) than all other estuarine populations, the same traits thatwere previously associated uniquely with the ‘north-shore’ population of the St. Lawrence estu-ary. Large jaws and big eyes are thus characteristic of at least 3 Atlantic-mixed populationsfound throughout the St. Lawrence system.
Coincidentally, many of the populations comprising the St. Lawrence smelt complex residein the fluvial estuary, along the north shore of the middle estuary and in the Saguenay fjord,areas associated with the greatest degree of admixture of the 2 nuclear gene pools. This may belargely due to the strong physical heterogeneity of the region, favoring reproductive isolationthrough philopatry. These areas and the south shore of the estuary are only separated by severaltens of kilometers, well within the dispersal capacity of smelt [19]. Atlantic-mixed smelt maybe at a competitive advantage in the more heterogeneous estuarine environments because ofgreater niche-partitioning opportunities associated with large gape size and better vision. Dif-ferences in mouth morphology have been implicated as a major determinant of variation inprey types and sizes consumed by predatory fishes [50,51]. Large-gape predators feed on smallprey sizes while also being able to feed on large prey that are unavailable to smaller predators.In addition, as they grow, they simply incorporate larger prey as their increased gape size per-mits [52]. Among many marine species, gape size is a good indicator of maximum prey sizeconsumed [51] and trophic level [53]. In addition to the benefits of large gape size, big eyes fa-cilitate foraging on elusive prey in mid-water [54]. We speculate that the diversification in cra-niofacial phenotypes documented here for admixed smelt populations may be key to adaptiveradiation, as hypothesized for vertebrates in general [55].
The pattern of admixture based on nuclear DNA did not always reflect the pattern of ad-mixture suggested by mtDNA. The Atlantic mtDNA lineage composed approximately 20% ofthe mtDNA gene pool of the South Shore and Chaleur Bay populations, but these populationsshowed little evidence of introgression of the two nuclear gene pools and differed morphologi-cally from pure Acadian populations to a far lesser degree. As a result, the correspondence be-tween nuclear and mtDNA races, albeit significant, is not perfect. Although we cannotdiscount completely the retention of ancestral polymorphism as a contributing factor, the lackof complete concordance between nuclear and mtDNA races most likely reflects introgressionof mtDNA lineages between the two ancestral nuclear DNA races.
The lack of evidence for admixture of the two nuclear DNA races along the south shore, inspite of evidence for the likely introgression of the mtDNA races in this area, may involve ac-tive selection against the Atlantic genome. In contrast to the north shore of the SLR, the smeltsampled in different spawning tributaries along the south shore of the SLR shows little evidenceof introgression of the nuclear genome and no contemporary population genetic structure.Furthermore, the Acadian-mixed populations occupying the St. Lawrence and the estuaries ofNew Brunswick exhibit little morphological diversification relative to populations comprisinguniquely the Acadian lineage. As selection is typically expected to favor locally adapted geno-types and can act against admixed individuals, there may be some conditions under which ad-mixture will have negative impacts on population fitness [13]. Although speculative, theAcadian race phenotype may be well suited to the shallow, shoal environment typical of the
Intraspecific Morphological Divergence
PLOS ONE | DOI:10.1371/journal.pone.0123172 April 9, 2015 17 / 21
south shore of the estuary. Admixture with the Atlantic morphotype may have contributed tothe loss of advantageous parental traits with negative impacts on fitness. Another possibility isthat differential phenotypic plasticity between the two ancestral races may have played a role,as has been proposed for postglacial populations of threespine stickleback (Gasterosteus aculea-tus) that evolved under greater seasonal temperature extremes following invasion of lakes fromthe sea [56]. If we speculate that the Atlantic race possesses greater phenotypic plasticity thanthe Acadian race, such plasticity may have been disadvantageous in the relatively homogenousshallow, coastal environments occupied by the Acadian race resulting in selection against ad-mixed individuals. We are unable to test this hypothesis.
Our findings are not entirely consistent with the biogeographical hypothesis of two routesof postglacial re-colonization of North-east North America by smelt [22]. The presence inNewfoundland (located next to the putative Acadian refugium) of two populations comprisinga mtDNA lineage diagnostic of the Atlantic race (sites n, o; Fig 2) and the presence of a mixedancestry population on the north coast of the Gulf of St. Lawrence dominated by the Atlanticrace (site k; Fig 2) suggests that post-glacial dispersal of the Atlantic race may have been morewidespread than the single inland route proposed by Bernatchez [22]. The observation of sig-nificant genetic and morphological discontinuities in estuarine populations of smelt in New-foundland and the Canadian Maritime provinces has also led to the questioning ofcolonization of these waters uniquely from the Acadian refugium [57]. If the Atlantic race alsodispersed via a maritime route rather than a unique inland route, admixture of the Atlanticand Acadian races may have occurred at numerous locations outside the St. Lawrence estuary.The observation, on the north coast of the Gulf of St. Lawrence, of a mixed-ancestry populationdominated by the Atlantic race exhibiting significantly bigger head and jaw dimensions tendsto support this possibility. However, far more extensive genetic and morphological analyses ofthe Gulf of St. Lawrence and Newfoundland smelt populations are needed to re-evaluate thebiogeographical history of the species.
We set out to find evidence that genetic admixture within rainbow smelt populations con-tributed to the morphological diversification and population structure of the species in north-eastern North America rather than to a net loss of diversity through genetic homogenizationand an averaging of morphological features. We have presented two contrasting outcomes forthe role of natural selection within the smelt population complex, acting both for and againstadmixed genomes. Other evolutionary processes, not documented in this study, are no doubtinvolved in the evolution of this species complex. Nevertheless, the presence of extreme pheno-types associated with admixed populations of Atlantic origin implicates transgressive segrega-tion in the diversification of the estuarine population complex. It has been proposed thatgenetic admixture among the cichlid fishes of the East African rift lakes may increase evolvabil-ity by providing new phenotypic variation previously unseen by selection, through transgres-sive segregation [58, 59]. Historical events involving postglacial contacts between closelyrelated lineages have also been hypothesized to contribute to the extreme phenotypic variabilityof North American ciscoes Coregonus spp. [60]. The hypothesis that organisms from disparatenative-range sources form genetically admixed populations with elevated genetic variation thatmay facilitate invasion success [11, 61] may serve as a present-day analogy of the dynamics ofpost-glacial colonization of new environments by previously isolated intraspecific races.
Supporting InformationS1 Protocol. Back transformation of measurements to an average fish.(DOCX)
Intraspecific Morphological Divergence
PLOS ONE | DOI:10.1371/journal.pone.0123172 April 9, 2015 18 / 21
S1 File. The morphological distinction of saltwater and freshwater forms of rainbow smelt.(DOCX)
S1 Table. Median values of morphological traits correlated with the first and second axes ofthe discriminant function analysis.(DOCX)
S2 Table. FST pairwise comparisons.(DOCX)
AcknowledgmentsThe authors wish to thank all of the biologists and personnel of the Ministère des Forêts, de laFaune et des Parcs, Québec, who provided samples for the realisation of this project. Manythanks to Dr. Gabriel Colbeck who initiated the AFLP protocol and conducted preliminaryanalyses for the genetic project. Drs. Jacques Labonne and Bernard Angers provided construc-tive comments on earlier drafts of this paper as did several anonymous referees. Many thanksto Dr. Mélanie Bégeur-Pon for preparing Figs. This work is a contribution to the research pro-gram of Québec-Océan.
Author ContributionsConceived and designed the experiments: JD MFB ML FL. Performed the experiments: JD ABJT MFB. Analyzed the data: JD ABMFB JT GD. Contributed reagents/materials/analysis tools:JT GDML FL. Wrote the paper: JD ABMFB JT GDML FL.
References1. Avise JC. Molecular markers, natural history and evolution. 2nd edition. Sunderland, Ma: Sinauer;
2004.
2. Dayan T, Simberloff D. Ecological and community-wide character displacement: the next generation.Ecol Lett. 2005; 8: 875–894.
3. Schluter D, Conte GL. Genetics and ecological speciation. Proc Natl Acad Sc. USA. 2009; 106 (suppl.1): 9955–9962. doi: 10.1073/pnas.0901264106 PMID: 19528639
4. Pfennig DW, Pfennig KS. Character displacement: ecological and reproductive responses to a com-mon evolutionary problem. Q Rev Biol. 2009; 84: 253–276. PMID: 19764283
5. Pfennig DW, Pfennig KS. Character displacement and the origins of diversity. Am Nat. 2010; 176:S26–S44. doi: 10.1086/657056 PMID: 21043778
6. Mallet J. Hybrid speciation. Nature 2007; 446: 279–283. PMID: 17361174
7. Abbott RJ, Hegarty MJ, Hiscock SJ, Brennan AC. Homoploid hybrid speciation in action. Taxon. 2010;59: 1375–1386. doi: 10.1099/jmm.0.021980-0 PMID: 20651040
8. Bell MA, Travis MP. Hybridization, transgressive segregation, genetic covariation, and adaptive radia-tion. Trends Ecol Evol. 2007; 20: 358–361.
9. Facon B, Pointier JP, Jarne P, Sarda V, David P. High genetic variance in life-history strategies withininvasive populations by way of multiple introductions. Curr Biol. 2008; 18: 363–367. doi: 10.1016/j.cub.2008.01.063 PMID: 18334202
10. Benvenuto C, Tabone E, Vercken E, Sorbier N, Colombel E, Warot S, Fauvergue X, Ris N. Intraspecificvariability in the parasitoid wasp Trichogramma chilonis: can we predict the outcome of hybridization?Evol Appl. 2012; 5(S1): 498–510.
11. Ellstrand NC, Schierenbeck KA. Hybridization as a stimulus for the evolution of invasiveness in plants?Proc Natl Acad Sci USA. 2000; 97: 7043–7050. PMID: 10860969
12. Kolbe JJ, Larson A, Losos JB. Differential admixture shapes morphological variation among invasivepopulations of the lizard Anolis sagrei. Mol Ecol. 2007; 16: 1579–1591. PMID: 17402975
13. Rius M, Darling JA. How important is intraspecific genetic admixture to the success of colonising popu-lations? Trends Ecol Evol. 2014; 29: 233–242. doi: 10.1016/j.tree.2014.02.003 PMID: 24636862
Intraspecific Morphological Divergence
PLOS ONE | DOI:10.1371/journal.pone.0123172 April 9, 2015 19 / 21
14. Rieseberg LH, Archer MA, Wayne RK. Transgressive segregation, adaptation and speciation. Heredity.1999; 83: 363–372. PMID: 10583537
15. Stelkens RB, Schmid C, Selz O, Seehausen O. Phenotypic novelty in experimental hybrids is predictedby the genetic distance between species of cichlid fish. BMC Evol Biol. 2009; 9: 283. doi: 10.1186/1471-2148-9-283 PMID: 19961584
16. Scott WB, Crossman EJ. Freshwater fishes of Canada. Ottawa: Bulletin of the Fisheries ResearchBoard of Canada 184; 1973.
17. Bradbury IR, Coulson MW, Campana SE, Bentzen P. Morphological and genetic differentiation in anad-romous smeltOsmerus mordax (Mitchill): disentangling the effects of geography and morphology ongene flow. J Fish Biol. 2006; 69 (Supplement C): 95–114.
18. Bradbury IR, Coulson MW, Campana SE, Paterson IG, Bentzen P. Contemporary nuclear and mito-chondrial genetic clines in a north temperate estuarine fish reflect Pleistocene vicariance. Mar EcolProg Ser. 2011; 438: 207–218.
19. Kovach AI, Breton TS, Enterline C, Berlinsky DL. Identifying the spatial scale of population structure inanadromous rainbow smelt (Osmerus mordax). Fish Res. 2013; 141: 95–106.
20. Baby M-C, Bernatchez L, Dodson JJ. Genetic structure and relationships among anadromous andlandlocked populations of rainbow smelt,Osmerus mordax, Mitchill, as revealed by mtDNA restrictionanalysis. J Fish Biol. 1991; 39 (supplement A): 61–68.
21. Bernatchez L, Martin S. Mitochondrial DNA diversity in anadromous rainbow smelt,Osmerus mordaxMitchill: a genetic assessment of the member–vagrant hypothesis. Can J Fish Aquat Sci. 1996; 53:424–433.
22. Bernatchez L. Mitochondrial DNA analysis confirms the existence of two glacial races of rainbow smelt(Osmerus mordax) and their reproductive isolation in the St-Lawrence R. estuary (Québec, Canada).Mol Ecol. 1997; 6: 73–83.
23. Pigeon D, Dodson JJ, Bernatchez L. A mtDNA analysis of spatio-temporal distribution of two sympatriclarval populations of rainbow smelt (Osmerus mordax) in the St. Lawrence river estuary, Québec, Cana-da. Can J Fish Aquat Sci. 1998; 55: 1739–1747.
24. April J, Hanner RH, Dion-Côté AM, Bernatchez L. Glacial cycles as an allopatric speciation pump innorth-eastern American freshwater fishes. Mol Ecol. 2013; 22: 409–422. doi: 10.1111/mec.12116PMID: 23206322
25. Fréchet A, Dodson JJ, Powles H. Les parasites de l'éperlan d'Amérique (Osmerus mordax) anadromede Québec et leur utilité comme étiquettes biologiques. Can J Zoo. 1983a; 61: 621–626.
26. Fréchet A, Dodson JJ, Powles H. Use of variation in biological characters for the classification of anad-romous rainbow smelt (Osmerus mordax) groups. Can J Fish Aquat Sci. 1983b; 40: 718–727.
27. Lecomte F, Dodson JJ. Role of early life-history and resource polymorphism in the segregation of sym-patric populations of an estuarine fish. Evol Ecol Res. 2004; 6: 631–658.
28. Lecomte F, Dodson JJ. Distinguishing trophic and habitat partitioning among sympatric populations ofan estuarine fish (Osmerus mordaxMitchill). J Fish Biol. 2005; 66:1601–1623.
29. Barrette M-F, Daigle G, Dodson JJ. Intraspecific vicariant history and the evolution of adaptive morpho-logical diversity in a fish species (Osmerus mordax). Biol J Linn Soc. 2009; 97: 140–151.
30. Barrette M-F. Influence des contraintes historiques et des adaptations contemporaines dans le façon-nement de la diversité morphologique chez l’éperlan arc-en-ciel,Osmerus mordax. M.Sc. thesis, Uni-versité Laval. 2004.
31. Gardner-Lubbe S, le Roux NJ, Gower JC. Measure of fit in principal component and canonical variateanalyses. J Appl Stat. 2008; 35: 947–965.
32. Douglas ME, MatthewsWJ. Does morphology predict ecology? Hypothesis testing within a freshwaterstream fish assemblage. Oikos. 1992; 65: 213–224.
33. Sokal RS, Rohlf FJ. Biometry: the principles and practice of statistics in biological research. 3rd edition.New York: W.H. Freeman and company; 1995.
34. Lachenbruch PA. An almost unbiased method of obtaining confidence intervals for the probability ofmisclassification in discriminant analysis. Biometrics. 1967; 23: 65. PMID: 6050473
35. Searle SR, Casella G, McCulloch CE. Variance Components. New York: JohnWiley and Sons Inc;1992.
36. Efron B, Tibshirani RJ. An Introduction to the Bootstrap. New York: Chapman and Hall/CRC; 1998.
37. Stelkens R, Seehausen O. Genetic distance between species predicts novel trait expression in their hy-brids. Evolution. 2009; 63: 884–897. doi: 10.1111/j.1558-5646.2008.00599.x PMID: 19220450
38. Therriault J-C. The Gulf of St. Lawrence: small ocean or big estuary? Ottawa: Canadian Special Publi-cation of Fisheries and Aquatic Sciences 113; 1991.
Intraspecific Morphological Divergence
PLOS ONE | DOI:10.1371/journal.pone.0123172 April 9, 2015 20 / 21
39. Lecomte F. Déterminisme écologique de la ségrégation génétique des populations sympatriquesd’éperlans arc-en-ciel (Osmerus mordax) de l’estuaire moyen du Saint-Laurent. Ph.D. thesis. Univer-sité Laval. 2005.
40. Pritchard JK, Stephens M, Donnelly P. Inference of population structure using multilocus genotypedata. Genetics. 2000; 155: 945–959. PMID: 10835412
41. Falush D, Stephens M, Pritchard JK. Inference of population structure using multilocus genotype data:dominant markers and null alleles. Mol Ecol Notes. 2007; 7: 574–578. PMID: 18784791
42. Hubisz MJ, Falush D, Stephans M, Pritchard, J.K. Inferring weak population structure with the assis-tance of sample group information. Mol Ecol Resour. 2009; 9: 1322–1332. doi: 10.1111/j.1755-0998.2009.02591.x PMID: 21564903
43. Evanno G, Regnault S, Goudet J. Detecting the number of clusters of individuals using the softwareSTRUCTURE: a simulation study. Mol Ecol. 2005; 14: 2611–2620. PMID: 15969739
44. Rosenberg NA. DISTRUCT: a program for graphical display of population structure. Mol Ecol Notes.2004; 4: 137–138.
45. Excoffier L, Lischer HEL. Arlequin suite ver 3.5: a new series of programs to perform population geneticanalyses under Linux andWindows. Mol Ecol Resour. 2010; 10: 564–567. doi: 10.1111/j.1755-0998.2010.02847.x PMID: 21565059
46. Buerkle CA. Maximum-likelihood estimation of a hybrid index based on molecular markers. Mol EcolNotes. 2005; 5: 684–687.
47. Gompert Z, Buerkle CA. INTROGRESS: a software package for mapping components of isolation inhybrids. Mol Ecol Resour. 2010; 10: 378–384. doi: 10.1111/j.1755-0998.2009.02733.x PMID:21565033
48. Hosmer DW. Lemeshow S. Applied Logistic Regression. New York: JohnWiley & Sons Ltd; 2000.
49. Bonin A, Ehrich D, Manel S. Statistical analysis of amplified fragment length polymorphism data: atoolbox for molecular ecologists and evolutionists. Mol Ecol. 2007; 16: 3737–3758. PMID: 17850542
50. Labropoulou M, Eleftheriou A. The foraging ecology of two pairs of congeneric demersal fish species:importance of morphological characteristics in prey selection. J Fish Biol. 1997; 50:324–340.
51. Scharf FS, Juanes F, Rountree RA. Predator size—prey size relationships of marine fish predators: in-terspecific variation and effects of ontogeny and body size on trophic-niche breadth. Mar Ecol Prog Ser.2000; 208: 229–248.
52. Bachiller E, Irigoien X. Allometric relations and consequences for feeding in small pelagic fish in theBay of Biscay. ICES J Mar Sci. 2013; 70: 232–243.
53. Karpouzi VS, Stergiou KI. The relationships between mouth size and shape and body length for 18 spe-cies of marine fishes and their trophic implications. J Fish Biol. 2003; 62: 1353–1365.
54. Motta PJ, Clifton KB, Hernandez P, Eggold BE. Ecomorphological correlates in ten species of subtropi-cal seagrass fishes: diet and microhabitat utilization. Environ Biol Fish. 1995; 44: 37–60.
55. Roberts RB, Hub Y, Albertson RC, Kochera TD. Craniofacial divergence and ongoing adaptation viathe hedgehog pathway. Proc Natl Acad Sci USA. 2011; 108: 13194–13199. doi: 10.1073/pnas.1018456108 PMID: 21788496
56. Morris MRJ, Richard R, Leder, EH, Barrett RDH, Aubin-Horth N, Rogers SM. Gene expression plasticityevolves in response to colonization of freshwater lakes in threespine stickleback. Mol Ecol. 2014; 23:3226–3240. doi: 10.1111/mec.12820 PMID: 24889067
57. Bradbury IR, Coulson MW, Campana SE, Bentzen P. Morphological and genetic differentiation in anad-romous smeltOsmerus mordax (Mitchill): disentangling the effects of geography and morphology ongene flow. J Fish Biol. 2006; 69 (Supplement C): 95–114.
58. Seehausen O. Hybridization and adaptive radiation. Trends Ecol Evol. 2004; 19: 198–207. PMID:16701254
59. Parsons KJ, Son YH, Albertson RC. Hybridization promotes evolvability in African cichlids: connectionsbetween transgressive segregation and phenotypic integration. Evol Biol. 2011; 38: 306–315.
60. Turgeon J, Bernatchez L. Reticulate evolution and phenotypic diversity in North American ciscoes, Cor-egonus spp. (Teleostei: Salmonidae): implications for the conservation of an evolutionary legacy. Con-serv Gen. 2003; 4: 67–81.
61. Kolbe JJ, Larson A, Losos JB, de Queiroz K. Admixture determines genetic diversity and population dif-ferentiation in the biological invasion of a lizard species. Biol Lett. 2008; 4: 434–437. doi: 10.1098/rsbl.2008.0205 PMID: 18492644
Intraspecific Morphological Divergence
PLOS ONE | DOI:10.1371/journal.pone.0123172 April 9, 2015 21 / 21
![Intraspecific morphological and genetic variation of ......variation in non-model organisms is increasingly possible owing to advancements in methods and decreases in costs [5]. In](https://img.pdfslide.us/doc/110x75/602f61c70a36dc6abe5b4068/intraspecific-morphological-and-genetic-variation-of-variation-in-non-model.jpg)