Embed Size (px)
Citation preview
A Work Project, presented as part of the requirements for the Award of a Masters Degree in
Finance from the Faculdade de Economia da Universidade Nova de Lisboa.
INTRADAY VOLATILITY
Evidence from the Euronext Lisbon Equity Market
Sílvia Leal Soares, 99
A Project carried out on the Financial Markets course, with the supervision of:
Professor J. C. Rodrigues da Costa
Lisbon, 12th of June, 2009
Intraday Volatility: Evidence from the Euronext Lisbon Equity Market
Universidade Nova de Lisboa – Faculdade de Economia 1
Abstract
Daily stock price volatility is found to be significanlty and frequently different whether
measured via successive open or close prices. This induced different authors to the analysis of
the volatility behaviour during the trading session in several important Stock Exchanges around
the globe. This paper focuses on the analysis of the Portuguese case. The major finding is that
intraday volatility tends to depict a U-shaped curve for the average variance of returns measured
during the trading session. This has important implications for regulators and practioners since it
suggests that prices discovered both at the opening and at the closing periods may not clearly
reflect the market dynamics around these two moments. Few reasons are predicted for such
misrepresentation. This analysis covers the main share index - PSI 20 - and three individual
shares selected from different industrial sectors and with different levels of liquidity.
Keywords: intraday volatility, auction mechanisms, Portuguese equity market.

Intraday Volatility: Evidence from the Euronext Lisbon Equity Market
Universidade Nova de Lisboa – Faculdade de Economia 2
“Very strikingly, the three most volatile minutes in a trading day are the two minutes that follow
the open and the final minute that precedes the close.”
Robert A. Schwartz, 2008
Intraday Volatility: Evidence from the Euronext Lisbon Equity Market
Universidade Nova de Lisboa – Faculdade de Economia 3
INDEX
ABSTRACT 1
1. INTRODUCTION 4
2. LITERATURE REVIEW 6
3. INSTITUTIONAL SETTINGS 10
4. DATA SET 12
5. METHODOLOGY AND RESULTS 13
5.1 PSI 20 Index for 5-minute intervals 14
5.2 Stocks and PSI 20 Index for 30-minute intervals 15
5.3 The role of market mechanisms: call auctions dynamics 18
5.3.1 Market Opening with and without Open Price 19
5.3.2 Market Closing with and without Close Price 19
6. CONCLUSION 20
REFERENCES 25
ANNEXES 27
A1. Trading Session Schedule in Euronext Lisbon 27
A2. PSI 20 Intraday Variability, per 5-minute intervals. 4Q08 and 4Q07 28

Intraday Volatility: Evidence from the Euronext Lisbon Equity Market
Universidade Nova de Lisboa – Faculdade de Economia 4
1. INTRODUCTION
Volatility has always been a matter of study concerning trading activity and stock markets
functioning. But after the work of Black and Scholes (1973) on options’ valuation, for which
volatility is a determinant factor, it has become a major focus of attention both among scholars
and practioners. However, and unlike asset prices or interest rates that are directly observed in
the market, volatility can be assessed through indirect ways. During several years, the analysis
was focused on interday volatility, due to lack of information of prices evolution during the trading
sessions. It was observed more recently though, that such interday volatility estimation varied,
depending on the particular daily prices that were used. Empirical studies typically found greater
volatility from open-to-open returns than from close-to-close returns, suggesting that the two
prices – Open and Close – may exhibit different motivations that investors and market
participants develop before these two crucial moments.
Given that financial markets display high speed of adjustment, studies based on single
daily (or longer) observations cannot capture critical information contained in intraday price
movements (Worthington and Higgs, 2003). Only more recently have data bases started to record
the prices of the successive trades occuring during the day, instead of simply recording the open,
close, high and low daily values, further allowing the extension of daily analysis of market volatility
to a more detailed intraday perspective. Recent empirical work on intraday volatility of returns has
found a tendency for a particular pattern, in a majority of Stock Exchanges, which is associated
with their market microstructure characteristics (Tian and Guo, 2007). Wood et. al (1985) were
the first to document a U-shaped pattern of returns’ volatility over the trading session, concluding
that price variability is higher near the opening and the closing moments of the session than at
any other time in-between. This fact is in accordance with volatility estimates observed in interday
analysis.
Since the re-opening of the Portuguese Exchange, in 1977, after the suspension of April
1974, the national stock market has passed through several significant transformations which

Intraday Volatility: Evidence from the Euronext Lisbon Equity Market
Universidade Nova de Lisboa – Faculdade de Economia 5
ultimately allowed, in 2002, the integration into Euronext and in April 2007 into the transatlantic
Group, NYSE Euronext. This opening and enlargement of the market set the required conditions
to perform a fine analysis of volatility, in the same light of other works conducted for other
Exchanges (mainly for North America, developed-Europe and some developed-Asia).
This paper examines the behaviour of intraday return volatility of the Portuguese Index PSI
20, in order to investigate the existence of patterns in intraday behaviour of returns variability. So
far, and to the best of my knowledge, no empirical studies were conducted on the particular case
of the Portuguese equity market using intraday data. Further investigation on other variables of
trading activity, such as transaction volume, number of trades per day and bid-ask spread would
be of interest in shedding more light onto this matter. Should intraday volatility exhibit a pattern on
its intraday evolution, one may presume either that information arrival in the market is
concentrated on trading hours, or that information is assymetric across market participants. This
would allow supposing that investors ultimately concentrate trading decisions and trading activity
in specific moments of the session, due to information gathering, costs and portfolio decisions.
The role of auction mechanisms in stock markets’ openings and closings is usually
perceived as to balance prices, after a period of concentration of participants and orders in the
market. As so, the information accumulated overnight plus the trading decisions transposed from
the previous session would be reflected in the Pre-Opening period1 and ultimately in the Open
Price. This price derives from the call auction that ends this period. If the trading halt from the
overnight period is a likely reason to explain higher price movements in early periods of the
trading session (as often predicted among literature) shouldn’t the Pre-Opening period - 1 hour
and 45 minutes in Euronext Lisbon – be enough to incorporate and reflect the information
accumulated so far, even though no orders are executed?
This paper provides an additional qualitative analysis to understand whether the call
auctions contribute to smooth stock prices variability or, conversely, to accentuate it. Therefore,
1 The Pre-Opening Period is a period that allows investors to accumulate orders, with no execution though, before trading session starts. Its purpose may defined as to balance and “calm down” the market before trading starts, as it displays constantly a theoretical equilibrium price.
Intraday Volatility: Evidence from the Euronext Lisbon Equity Market
Universidade Nova de Lisboa – Faculdade de Economia 6
this study should be of relevance to market participants as well as to regulators and policy
makers involved in the conception of efficient trading systems.
Within the literature on intraday stock returns volatility, research has concentrated more on
Index analysis and less on individual securities. Since it is likely that volatility effects vary across
individual securities, the analysis of return volatility at the company level would elucidate on the
characteristics of volatility on a single market (Worthington and Higgs, 2003). Therefore, a similar
analysis is performed in this paper in relation to a few shares selected from the PSI 20 Index.
The analysis of volatility aimed at the field of this work must not be confused with the
volatility estimations provided by Volatility Indexes that exist in some exchanges, (example of VIX
and VDAX), as these are measures of the estimated volatility implicit in the term to maturity of
several derivatives.
The remainder of this document is structured as follows: Section 2 provides a Literature
Review and Section 3 describes the institutional features of the Euronext Lisbon Exchange.
Section 4 examines the data set whereas the methodology and results are given in Section 5.
Section 6 provides a conclusion and some recommendations for further analysis.
2. LITERATURE REVIEW
Hong and Wang (2000) distinguish two incentives for trading: when the market is open,
investors trade stocks either to rebalance their portfolios – hedging trades - or to speculate on
future stock payoffs using their private information – speculative trades. When the market closes
and investors hold on to their closing positions from the previous trading period, new information
keeps arriving, leading those investors to optimally adjust their trading decisions over time. Time
variations of prices arise as a consequence of the anticipation and following such market closures
(Hong and Wang, 2000).
Empirical studies on interday volatility suggest some regularity in its behaviour, as they
typically find greater variability from open-to-open returns than from close-to-close returns, as well

Intraday Volatility: Evidence from the Euronext Lisbon Equity Market
Universidade Nova de Lisboa – Faculdade de Economia 7
as during trading hours rather than during non-trading periods2. Amongst the explanations offered
for this variability are the different trading mechanisms used for the opening and closing moments
in stock exchanges. Amihud and Mendelson (1987) examine the effects of the mechanism by
which securities are traded in the New York Stock Exchange (NYSE), where specialists operate
as market makers. In the NYSE, the open price is determined through a call auction procedure
whereas the close price results from continuous trading. The authors report that stock daily
returns computed using open-to-open prices show higher variance than when using close-to-
close prices, and they attribute the result to the differences in trading mechanisms between the
opening and closing transactions. Other reasons as the monopoly power of the specialist, in
some US Exchanges (Stoll and Whaley, 1990)3, methodological issues related to the
measurement of returns (Ronen, 1997) and a combination of the aforementioned factors, are also
often referred as explaination for daily price volatility. However, research into other Exchanges’
settings suggests that the information accumulated overnight is also relevant in explainig the
variability of open prices (Tian and Guo, 2007). To better understand this, Amihud and
Mendelson (1991) examine the Japanese market, which has two daily trading sessions, each
based on a call auction for the opening and on a continuous session to the close, and find that
the morning open-to-open volatility is high, but not the afternoon open-to-open volatility.
Consequently, they find the preceding non-trading period more significant than the trading
mechanism to explain the accentuated variability of opening prices.
In what concerns the more recent intraday analysis of trading activity, empirical work is
largely concentrated on the NYSE, whose trading system is centred on the specialist. Wood et al.
(1985) are the first to document a U-shaped pattern of returns’ volatility during the trading day,
but Harris (1986) and Jain and Joh (1988) also identify later the same behaviour on intraday
returns volatility, in stocks of the NYSE. Foster and Viswanathan (1990) observe as well a U-
2 The latter is usually measured by comparing open-to-close returns to close-to-open returns. 3 For the specific case of NYSE, where there are specialists: the authors theorize that this participant, operating in the capacity of his position, is able to observe the order book before setting the open price which allows him to earn a monopoly profit not possible during the rest of the day (Lepone et al., 2006).
Intraday Volatility: Evidence from the Euronext Lisbon Equity Market
Universidade Nova de Lisboa – Faculdade de Economia 8
shaped curve in the variance of price changes on stocks from the NYSE, by hour of the day. Still,
Lockwood and Linn (1990) examine the stability of intraday variance returns on the Dow Jones
Industrial Average, between 1964 and 1989, and find that return volatility is heterogeneous and
ordered, falling from the opening until the early afternoon and rising thereafter.
The recent availability of intraday data from non-US equity markets has led to the extension
of the analysis of intraday seasonalities to different institutional systems. By extending
investigation to a dealership market context, Abhyankar et al. (1997) analyse intraday variations
in the bid-ask spread, trading volume and return volatility of 835 stocks for a 3-months period in
the London Stock Exchange, reporting U-shaped patterns in bid-ask spreads and return volatility
during trading hours, but not in trading volume. Ozenbas, Schwartz and Wood (2002) examine
intraday patterns over the year of 2000 for two North American Exchanges - NYSE and NASDAQ
- and three European Exchanges - London Stock Exchange, Euronext Paris and Deutsche
Bourse - and identify a U-shaped pattern on intraday volatility, with a particular sharp spike for the
opening half-an-hour of the trading session (Tian and Guo, 2007), suggesting that the volatility
rise is due to spreads, market impact, price discovery and momentum trading.
Several reasons have been advocated for explaining the higher variability of returns and
higher trading activity verified at the opening and closing periods of the trading session.
Information is often pointed as a major factor for seasonalities in trading activity during the day,
because it is asymmetric among investors and because the market facilities do not operate
continuously 24 hours a day. Since there are transaction costs to bear, including those related
with information assymetry and liquidity constraints, investors may prefer to time their trading,
assuming they are rational participants and aim at minimizing costs. On the one hand, French
and Roll (1986) argue that, since there are more informed traders who make use of their private
information before market closes, the returns volatility tends to be more accentuated at this
moment: these investors will be more active towards the closing of the session, before the
information becomes public, during the overnight period. Merton (1987) agrees that investors time

Intraday Volatility: Evidence from the Euronext Lisbon Equity Market
Universidade Nova de Lisboa – Faculdade de Economia 9
their trade decisions and concentrate their trading activity at market closure to minimize trading
costs. However, during the period in which the market is closed, investors keep on searching for
information as it is fundamental in the allocation of their wealth (Bellalah and Derhy, 2005).
Bellalh and Derhy (2005) conclude that the observed variability of returns – more accentuated at
the opening of the trading session - is affected by the periodic inability to trade i.e. the overnight
period. The effect of trading interruptions from the overnight period is also referred by Brock and
Kleidon (1992), due to portfolio rebalancing. The information accumulated when the market is
closed modifies investors’ portfolios; as a consequence, it can intensify trading activity when the
market re-opens. Similarly, the potential exposure during the overnight period encourages
investors to close positions by the day’s end, then explaining the higher activity as the session
approaches the closing (Brock and Kleidon, 1992). Furthermore, seasonalities in trading activity,
and specifically in intraday volatility of returns, arise because brokers may need to fill remaining
orders before the end of the trading session. Besides, the fact that traders’ payoffs can be
dependent on the time of the day in which orders are executed, persuades once again trade
timing. For the case of fund managers, for example, who are evaluated at closing prices, this
might provide an incentive to trade (Bellalah and Derhy, 2005) and a temptation to manipulate
prices. In fact, although fund managers may be tempted to influence close prices, the effective
gains and losses result from transactions occurred before the trading session closes. This might
explain that transaction prices depict more significant variations during the period that precedes
the market closing, as well as differ from the close price. Still, this is the price used for settlement
of several derivatives. Therefore, the Close Price can end up being more representative for funds’
valuation and derivatives settlement, rather than representing and reflecting the market forces
and dynamics of the closing moment of each trading session.
The results later observed in this work suggest that the return volatility tends to be higher at
the open, declining thereafter along the day with a slight rise at the close. Results do not post a
perfect “U” as some noise may be observed during the session, mainly around lunchtime. The

Intraday Volatility: Evidence from the Euronext Lisbon Equity Market
Universidade Nova de Lisboa – Faculdade de Economia 10
influence of other Stock Exchanges on the Euronext Lisbon’s daily session can be anticipated. In
fact, literature suggests that stock markets are generally sensitive to news originated in other
markets. Harju and Hussain (2008) confirm this “market contagion” as they find that the daily
session of the NYSE typically affects the diurnal pattern in some major European markets.
3. INSTITUTIONAL SETTINGS
Nowadays, the centralized Portuguese market is run by the Euronext Lisbon (EL), a branch
of the much larger NYSE Euronext Group of Exchanges4. Although EL works like any domestic
Stock Exchage, it shares one single technological infrastructure with Euronext Paris, Euronext
Amsterdam and Euronext Brussels. This common trading facility allows all securities listed in EL
to be visible to all members of the other branches of the Group. Further, they can also be traded
by much larger and more shopisticated intermediaries, headquarted in other market places like
London, Paris, Amsterdam and Germany.
The trading system is full automatic and provides two trading regimes: trading at
continuous for the more liquid securities and roll-calls mechanisms for the less liquid ones. In
what concerns the continuous trading, there is in EL an opening auction at 8am Portuguese Time
(PT)5 and a closing auction at 4.35pm PT. Members can enter, amend and cancel orders during
the Pre-Opening period, from 6.15am up tp 8am PT for the first auction, and between 4.30pm and
4.35 pm PT for the second auction, though no orders are executed then. In both cases, the
trading system is always displaying the equilibrium price between buy and sell sides, even if that
price does not represent actual executions, as it is a simple indicative price. The Open/Close
price corresponds to that single value that maximes the volume of trades obtained from the
orders valid in the Order Book at those particular moments (view Annex 1). For the less liquid
4 Since the integration of Euronext and NYSE groups, in November 2007. 5 Portuguese Time: CET minus 1 hour.

Intraday Volatility: Evidence from the Euronext Lisbon Equity Market
Universidade Nova de Lisboa – Faculdade de Economia 11
assets there can be either one single auction per day around the middle of the session, or two
calls per day – in the morrning and in the afterrnon -, depending on the type of security.
Additionally, for those securites that trade at continuous, there is an extra period of 5
minutes for trading after the closing auction, between 4.35pm and 4.40pm PT, called the ‘Trading
At Last (TAL)’, where orders can be introduced and executed only at the Close price (i.e. only
market orders or limit orders limited at the close price of that session). A similar 5-minute period is
available after each auction for those securities traded though call system.
PSI 20 is the benchmark share index of EL that averages the prices of the 20 most
representative6 listed shares in the Euronext segment of EL. They all trade at continuous. PSI 20
is a capitalization weighted Index and its value is updated every 15-seconds. Unfortunately, most
of the liquidity in this market applies for only a few share issues among the Index, with the
following implications upon its value: (i) index returns are mainly determined by the larger issues;
(ii) only these more liquid shares trade at frequencies comparable to the 15-second updating
regime adopted for the Index - as some stocks often exhibit periods of some minutes without any
trade; (iii) the number of trades per day varies widely among the 20 stocks, from the high values
of these few issues to very low figures for the last less liquid Index members. Typically, the
shares listed in EL do not have market makers providing extra liquidity. However, it is always
possible for small issuers to contract liquidity providers for their own share issues.
Due to similar tendencies found in other external financial markets to institutionalize the
family savings’ management, and due to the integration of EL in the multinational trading
platform, the clear majority of traded volumes in EL (71.4%) come from institutional investors and
only 28.6% from non-institutional participants7.
6 The largest and most liquid listed companies, in terms of stock market turnover. 7 Turnover on Orders Received in Behalf of Third Parties and Per Investor, 2007 Annual Report on the CMVM’s Activity and the Securities Markets.

Intraday Volatility: Evidence from the Euronext Lisbon Equity Market
Universidade Nova de Lisboa – Faculdade de Economia 12
4. DATA SET
This paper uses intraday data from the PSI 20 Index covering the period of October 1,
2008 to December 31, 2008 i.e. for the last quarter of 2008. The same intraday analysis is also
performed for the Index for the 4th Quarter of 2007, in order to compare intraday volatility during a
less turbulent period. Two different analyses are accomplished: at a first glance, the intraday
behaviour of return volatility is observed for the Index. The same intraday analysis is then
conducted for three selected stocks - BCP, EDP and BRISA. These were selected since they are
among the most representative Index members, which must allow the conduction of an intraday
analysis and should minimize liquidity constraints already referred regarding trading frequency.
Besides, the selection of three issues with different dimensions, trading activity and liquidity levels
allows showing that even being among the most liquid and largest shares in the Index,
differences in intraday patterns can still be accounted. Finally, they were chosen from different
industrial sectors: financials - Banco Comercial Português, energy - Energias de Portugal and
motorways/utilities – Brisa. As indicators of trading activity, both trading volume and the number
of trades per day shall be good proxies of liquidity for each stock. The market figures and
indicators on trading activity of stocks presented in Table 1 allow us to classify EDP and BCP as
more liquid shares and Brisa as a relatively less liquid issue.
Table 1. Market Indicators and indicators of daily trading activity of stocks in 4Q08.
Rank1 Weight in the Index2 Market Capitalisation2 Average Number of Trades3 Average Volume 3 Average Volume 3
(Millions of Euros) (Traded shares) (Millions of Euros)EDP 1º 13,4% 10.315,09 2980 10.373.212 26.585,24 BCP 4º 11,7% 3.652,40 1616 10.912.358 9.878,91 BRISA 7º 6,3% 3.060,60 1253 1.010.395 6.158,24 1 In terms of Weight in PSI20 Index.2 Values as of June 10th 2009.3 Average per day, of 62 trading days within 01.10.2008 to 31.12.2008.Sources: Bloomberg and Euronext.
The aim of analyzing three individual securities is to compare these stocks with the Index
they compose, and to understand whether different liquidity levels allow for different intraday
patterns. For instance, Abhyankar et al. (1997) observe an inverse relationship between the bid-
ask spread and trading frequency and find more definite U-shaped pattern for intraday volume
among more liquid stocks.

Intraday Volatility: Evidence from the Euronext Lisbon Equity Market
Universidade Nova de Lisboa – Faculdade de Economia 13
,tdtSdtSdS εσµ ⋅⋅⋅+⋅⋅=
Historical data on Open and Close prices and intraday transactions was collected at two
levels: from the Euronext database for the PSI 20 Index, with a price frequency of 15 seconds,
and electronically from Bloomberg, for series of intraday prices on the three stocks. Days in which
EL closed earlier or that comprise incomplete data were excluded.8
5. METHODOLOGY AND RESULTS
Intraday variability is expressed in percentage per hour (variance per hour) and security
prices are assumed to follow a stochastic process, according to the following model:
)1,0(~ Ntε
Intraday returns between two successive moments are calculated as the natural logarithm
of transaction prices:
According to Itô’s Lemma:
[ ] tdtdtSd εσσµ ⋅⋅+⋅⎟⎟⎠
⎞⎜⎜⎝
⎛−=
2)ln(
2
ttt
t ttt
SSR εσσµ ⋅∆⋅+∆⋅⎟⎟
⎠
⎞⎜⎜⎝
⎛−=
∆−
=⇒ −
2)ln()ln( 2
1 ,
Let y represent ln(S). Then,
ttt
ty εσσµ ⋅⎟⎟
⎠
⎞⎜⎜⎝
⎛
∆∆⋅
+⎟⎟⎠
⎞⎜⎜⎝
⎛−=
∆∆
2
2
,
which means that stock returns are distributed according to a certain average with some level of
variability per interval of time (∆t).
In order to overcome the fact that stocks do not trade at a constant frequency like the Index
value, returns are calculated as ty
∆∆ and expressed as percent variations per hour, as ∆t is also
8 Periods when the market closed early (half-day trading sessions) are December 24 and December 31, 2008. For the case of PSI 20, due to lack of complete data were excluded October 8, October 10, October 23 and October 24, 2008. For the analysis of 4th Quarter of 2007, October 15 and October 26, 2007 were excluded due to incomplete data and December 24 and December 31, 2007 as correspond to half-session days.
)/ln( 1−= ttt SSR

Intraday Volatility: Evidence from the Euronext Lisbon Equity Market
Universidade Nova de Lisboa – Faculdade de Economia 14
expressed in hours. As already referred, two separate analyses are conducted: the PSI 20 Index
and the three individual securities.
5.1 PSI 20 Index for 5-minute intervals
Due to the high-frequency of PSI 20’s intraday values available in databases (every 15
seconds), a fine analysis is first conducted for 5-minute intraday intervals. The trading session is
divided into 102 adjacent intervals of 5 minutes (from 8.00am to 4.30pm PT) while the first and
last prices of each intraday series are respectively the open and close prices of each day.9 Given
that the Index value is fixed every 15 seconds, ∆t is 1/240 hours, and therefore 15-second
returns are converted into hourly values by simply multiplying them by 240 (number of 15-second
intervals per hour). Variances are calculted from the 20 returns10 included in each 5-minute
intraday interval j of each trading day k, and are then averaged across K trading days.
Figure 1. PSI20 4Q08 Intraday Variability, per 5-minute intervals. Average of 56 trading days11.
PSI20 4Q08(5‐min intraday intervals)
0%
5%
10%
15%
20%
8:00 AM 9:00 AM 10:00 AM 11:00 AM 12:00 PM 1:00 PM 2:00 PM 3:00 PM 4:00 PM
Time of trading session (CET ‐ 1)
Intraday Retruns Variabilit
(var/hou
r)
Figure 1 shows that the average variability of index returns is highest at the open (14.97%),
declines thereafter along the day for a band of 0-1%, and rises slightly at the close (7.25%),
suggesting the U-shaped pattern found in other Stock Exchanges. One could expect that such
behaviour of intraday variances could be related, in some extent, to the uncertainty that persisted
in financial markets in this recent period. However, when conducting the same analysis for a less
9Last intraday interval corresponds to 4.25-4.30pm PT plus the close price, set at 4.35pm. Note that no trades are executed between 4.30-4.35pm. 10 Some exceptions to be accounted here: i) intraday data available starts at 8.01am PT thus the first 5-minute interval ends at 8.06am PT; ii) the last intraday interval ends at 4.30pm PT and still includes the closing price. In order to set intraday intervals at a 5-minute multiples, two samples are adjusted, namely 12.05am PT that comprises 17 observations, and 3.25pm PT that comprises 21 observations. These two moments are selected from the middle of trading session to minimize distortion concerns. 11 Values are presented in Annex A2.

Intraday Volatility: Evidence from the Euronext Lisbon Equity Market
Universidade Nova de Lisboa – Faculdade de Economia 15
turbulent historical period as the 4th Quarter of 2007, results post a similar pattern of intraday
variability behaviour, though, as expected, with significantly lower levels of average variances12.
Figure 2. PSI20 4Q07 Intraday Variability, per 5-minute intervals. Average of 61 trading days.
PSI20 4Q07(5‐min intraday intervals)
0,0%
0,5%
1,0%
1,5%
2,0%
8:00 AM 9:00 AM 10:00 AM 11:00 AM 12:00 PM 1:00 PM 2:00 PM 3:00 PM 4:00 PM
Time of tradinh session (CET ‐ 1)
Intraday Retruns Variabilit
(var/hou
r)
As observed in Figure 2, variance per hour reaches its maximum of 1.38% right after the
market opening at 8.00am, decreases along the trading session for a range of 0-0.5%, exhibits a
spike around 3.35pm PT and rises again when approaching the closing of the market, for the
second highest level (1.21%). Thus, the analysis confirms the hypothesis of the U-shaped pattern
of return variability in the PSI 20 Index.
5.2 Stocks and PSI 20 Index for 30-minute intervals
The assessment of intraday volatility for the case of the three individual Portuguese stocks
selected from PSI 20 for the 4th Quarter of 2008 is performed within longer intraday intervals.
Since stocks are transacted in the market through the matching between buy and sell orders,
trading times are distributed during the session; therefore, there are no equidistant valuations of
each stock as there are for the Index. For too short sampling intervals, there is the risk of not
having a single price available. Another motivation for choosing those particular shares has to do
with the following: more active stocks are traded at higher frequency and so the trading data
available is higher. By choosing 30-minute intervals, in line with previous works13, each sample
shall include (in principle) a significant number of transaction prices. However, even though
12 Values are presented in Annex A2. 13 Bellalah and Derhy (2005) examine the effects of opening and closing moments on trade demand, volume and stock volatility for 30-minute time intervals during the 1992-1998 period. Lockwood and Linn (1990) study intraday volatility on an hourly basis between 1964-1989 for the DJIA. Abhyankar et al. (1997) choose 15-minute intervals to analyse intraday patterns of return series, in order to smooth the graph of the series used.

Intraday Volatility: Evidence from the Euronext Lisbon Equity Market
Universidade Nova de Lisboa – Faculdade de Economia 16
Intraday Period J(CET ‐ 1) PSI 20 BRISA EDP BCP
j 1 8:30 AM 4,47% 6,19% 3,53% 4,38%j 2 9:00 AM 1,20% 3,01% 1,64% 2,59%j 3 9:30 AM 0,71% 2,30% 1,16% 1,72%j 4 10:00 AM 0,54% 1,55% 0,89% 1,29%j 5 10:30 AM 0,57% 1,48% 0,76% 1,50%j 6 11:00 AM 0,53% 1,26% 0,88% 1,29%j 7 11:30 AM 0,43% 0,80% 0,77% 0,87%j 8 12:00 PM 0,39% 1,49% 0,79% 0,67%j 9 12:30 PM 0,47% 1,18% 1,08% 1,40%j 10 1:00 PM 0,44% 1,18% 1,01% 0,93%j 11 1:30 PM 0,40% 0,91% 0,83% 1,12%j 12 2:00 PM 0,45% 0,94% 0,78% 1,09%j 13 2:30 PM 0,49% 1,41% 0,74% 1,05%j 14 3:00 PM 0,66% 2,16% 1,23% 1,35%j 15 3:30 PM 0,75% 2,53% 1,20% 1,47%j 16 4:00 PM 0,80% 2,08% 1,29% 1,18%j 17 4:30 PM 2,02% 3,54% 1,86% 1,49%
4th Quarter of 2008 Intraday Return Variability (variance/hour)
choosing three relatively liquid stocks, some constraints may arise at this point. For example, the
intraday series of Brisa returns for December 23rd 2008 comprises a single return in the 30-
minute interval of 1.00-1.30pm PT14. In fact, only 45% of all 30-minute intervals of the 4Q0815, in
Brisa series, encompass more than 15 transaction prices, which give additional evidence to the
relative lack of liquidity of this issuer.
Therefore, the trading session was divided into 17 intervals of 30 minutes, from 8.00am to
4.30pm PT, where first and last prices of each intraday series are, respectively, the open and
close prices of each day.
As in the case of PSI 20 analysis, returns are measured by (now with different ∆t)
and so variance is expressed in percentage per hour, for each 30-minute interval. Variances are
calculated from the returns included in each 30-minute intraday interval j of each trading day k, for
each stock i and are then averaged across K trading days. The same analysis in terms of 30-
minute intraday intervals is performed for PSI 20 to allow for comparison purposes.
Table 2. Intraday Variances of 30-minute intervals of PSI20, Brisa, EDP and BCP for the 4thQ08.
Results on all securities demonstrate that the average variance of returns is not constant
during the trading session. Rather, it is highest right after the opening, declines thereafter during
the day and increases slightly again as the session approaches its closing, denoting the same
14 To overcome this, the previous and next returns of the series were included in this sample for calculating its variance. 15 1054 intervals in total, i.e. 17 30-minute intervals per day times 62 trading days.
ty
∆∆
Intraday Volatility: Evidence from the Euronext Lisbon Equity Market
Universidade Nova de Lisboa – Faculdade de Economia 17
BRISA TIME (CET ‐ 1) INTRADAY VARIANCE (µ) σ
8:30 AM 6,19% 0,0789:00 AM 3,01% 0,0409:30 AM 2,30% 0,03610:00 AM 1,55% 0,02610:30 AM 1,48% 0,02911:00 AM 1,26% 0,01811:30 AM 0,80% 0,01412:00 PM 1,49% 0,04112:30 PM 1,18% 0,0251:00 PM 1,18% 0,0241:30 PM 0,91% 0,0152:00 PM 0,94% 0,0142:30 PM 1,41% 0,0243:00 PM 2,16% 0,0463:30 PM 2,53% 0,0404:00 PM 2,08% 0,0284:30 PM 3,54% 0,059
EDPINTRADAY VARIANCE (µ) σ
3,53% 0,0451,64% 0,0151,16% 0,0130,89% 0,0080,76% 0,0070,88% 0,0100,77% 0,0090,79% 0,0101,08% 0,0141,01% 0,0140,83% 0,0110,78% 0,0070,74% 0,0051,23% 0,0141,20% 0,0111,29% 0,0091,86% 0,022
BCPINTRADAY VARIANCE (µ) σ
4,38% 0,0502,59% 0,0401,72% 0,0171,29% 0,0141,50% 0,0181,29% 0,0190,87% 0,0100,67% 0,0051,40% 0,0290,93% 0,0131,12% 0,0151,09% 0,0141,05% 0,0131,35% 0,0151,47% 0,0201,18% 0,0111,49% 0,012
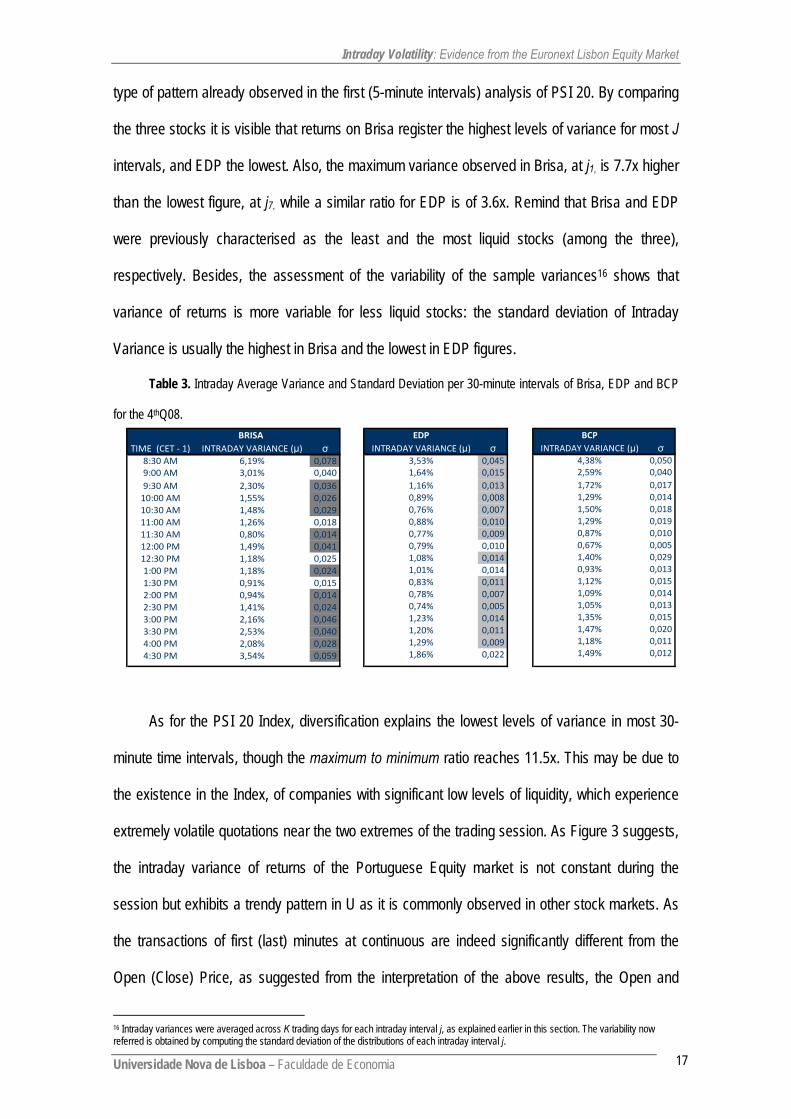
type of pattern already observed in the first (5-minute intervals) analysis of PSI 20. By comparing
the three stocks it is visible that returns on Brisa register the highest levels of variance for most J
intervals, and EDP the lowest. Also, the maximum variance observed in Brisa, at j1, is 7.7x higher
than the lowest figure, at j7, while a similar ratio for EDP is of 3.6x. Remind that Brisa and EDP
were previously characterised as the least and the most liquid stocks (among the three),
respectively. Besides, the assessment of the variability of the sample variances16 shows that
variance of returns is more variable for less liquid stocks: the standard deviation of Intraday
Variance is usually the highest in Brisa and the lowest in EDP figures.
Table 3. Intraday Average Variance and Standard Deviation per 30-minute intervals of Brisa, EDP and BCP
for the 4thQ08.
As for the PSI 20 Index, diversification explains the lowest levels of variance in most 30-
minute time intervals, though the maximum to minimum ratio reaches 11.5x. This may be due to
the existence in the Index, of companies with significant low levels of liquidity, which experience
extremely volatile quotations near the two extremes of the trading session. As Figure 3 suggests,
the intraday variance of returns of the Portuguese Equity market is not constant during the
session but exhibits a trendy pattern in U as it is commonly observed in other stock markets. As
the transactions of first (last) minutes at continuous are indeed significantly different from the
Open (Close) Price, as suggested from the interpretation of the above results, the Open and
16 Intraday variances were averaged across K trading days for each intraday interval j, as explained earlier in this section. The variability now referred is obtained by computing the standard deviation of the distributions of each intraday interval j.

Intraday Volatility: Evidence from the Euronext Lisbon Equity Market
Universidade Nova de Lisboa – Faculdade de Economia 18
Intraday Variance of Brisa, BCP, EDP & PSI 204Q of 2008
0%
1%
2%
3%
4%
5%
6%
7%
8:15 AM 9:15 AM 10:15 AM 11:15 AM 12:15 PM 1:15 PM 2:15 PM 3:15 PM 4:15 PM
Time of trading Session (CET ‐1)
Intraday Return Variability (variance/hou
PSI 20
BRISA
EDP
BCP
Close prices may not clearly represent the market forces and information on the respective
trading moments. However, some disturbance in returns volatility can be perceived also during
the lunchtime period, from 12.00 to 1.00pm PT, and some spikes are observed around 3.15pm
PT, increasing as the liquidity of stocks decreases (Brisa draws the noisiest curve). In fact, the
variance of Brisa returns rises in an increasing pace from 1.30 to 3.30pm PT, after which it
decreases, before increasing again towards the end of the day. It is during this period that the
trading session of the NYSE starts, namely at 2.30pm PT. As stated before, stock markets are
generally sensitive to news originated in other markets, and the referred market contagion may
be pointed as one cause for these accentuated movements.
Figure 3. Intraday Variances of 30-minute intervals of PSI20, Brisa, EDP and BCP for the 4thQ08.
5.3 The role of market mechanism: call auctions dynamics
Regarding the importance of market mechanisms in price determination widely referred
among literature, and given the regularities already found in returns distribution during the trading
session, the role of call auctions is analysed. In order to understand how the call auctions may
impact such intraday behaviour, a particular analysis is performed to measure the significance of
Open/Close prices. This is assessed by comparing the average variance per hour for the first and
for the last 30-minute intraday intervals (j1 and j17) of each trading day, including and excluding

Intraday Volatility: Evidence from the Euronext Lisbon Equity Market
Universidade Nova de Lisboa – Faculdade de Economia 19
Open_Close Without O/C Dif. Open_Close Without O/C Dif. Open_Close Without O/C Dif. Open_Close Without O/C Dif.
j 1 8:30 AM 4,47% 4,48% 0,27% 6,19% 5,71% ‐7,76% 3,53% 3,36% ‐4,69% 4,38% 4,30% ‐1,87%(…) (…) (…) (…) (…)
j 17 4:30 PM 2,02% 1,20% ‐40,70% 3,54% 3,62% 2,40% 1,86% 1,85% ‐0,29% 1,49% 1,49% ‐0,14%
(CET ‐ 1)PSI20 BRISA EDP BCPIntraday Period J
the Open and the Close prices in those two samples. Table 4 compares the variances of the two
intervals with and without those prices determined by the means of auction mechanisms.
Table 4. Intraday Variances of PSI20, Brisa, EDP and BCP for the 4thQ08, including and excluding daily open
and close prices (only 30-minute intraday intervals).
5.3.1 Market Opening with and without Open Price
From the first column of Table 4, we can observe that the average variance of PSI 20 for
the first intraday period j1, is higher when excluding the open price of each trading day. This
suggests that the open price contributes to decrease the variability of first Index returns of each
trading session. Conversely, for the cases of the three individual stocks, when excluding open
prices from the sample of intraday prices for time interval j1, the average variance per hour
decreases 7.8% in Brisa, 4.7% in EDP and 1.9% in BCP. For these cases, there is evidence that
open prices contribute to increase the variance of returns in the first half-an-hour of the session.
5.3.2 Market Closing with and without Close Price
The analysis of the closing figures provides mixed results. The variability of the PSI 20
intraday returns decreases significantly (-40.7%) when excluding the Close Price from the last
time interval (j17). However, for the case of the three stocks, the variance of intraday returns
increases 2.4% in Brisa, decreases 0.3% in EDP and does not change in BCP. While this
suggests that the close price disturbs significantly the returns distribution during the last 30
minute interval in the case of the Index, no pattern is found for individual stocks.

Intraday Volatility: Evidence from the Euronext Lisbon Equity Market
Universidade Nova de Lisboa – Faculdade de Economia 20
6. CONCLUSION
This paper examines the intraday behaviour of returns volatility for the PSI 20 Index and
three individual stocks from the Euronext Lisbon during the 4Q08. By defining intraday intervals of
two different durations for the assessment of average variances per hour, a tendency for higher
volatility of security returns is observed around the opening and closing periods of the trading
session, more accentuated in the morning. The results can be summarized as follows. First,
intraday average variance of returns is highest at market openings, relatively flat during the day
and slightly accentuated as the session approaches the close. The same tendency for a U-
shaped curve is verified for the last quarter of 2007 though with lower levels of variance.
Therefore, turbulence and uncertainty of a financial crisis period shall not be responsible for the
intraday pattern of volatility, but only for increasing its levels along the curve.
The U-shaped trend observed in intraday returns volatility in the EL may be related to the
role of the two auctions conducted in the beginning and in the end of the session. Empirical
results show that, after the trading session starts at the Open Price, returns’ movements are more
significant during the first 30 minutes of trading rather than during any other time of the day.
Besides, the execution prices of first period’s transactions widely vary within the interval.
Considering that the Open Price would be, to some extent, a balanced price that follows a period
of “market testing” (Pre-Opening period) and a particular moment designed to match market
forces (Opening auction), the prices of transactions that occur during the following moments
should not diverge very significantly, unless those mechanisms are not being used by market
participants efficiently. On the other hand, if the same dynamics were applied for the closing
period, the Close Price would be a representative value that would reflect the equilibrium of
investors’ decisions and information accumulated during the period that precedes the closing
auction. The observed results show that the variability of Index returns decreases significanlty
when excluding the close prices, suggesting that the Close Price is in fact considerably different
from prices of the last transactions at continuous.

Intraday Volatility: Evidence from the Euronext Lisbon Equity Market
Universidade Nova de Lisboa – Faculdade de Economia 21
The Closing auction analysis implies some facts that allow us think that the Close Price
may be influenced into values that are convenient rather than representative, since, in the end of
the day, this is the value used for purposes of portfolios’ valuation, derivatives settlement and for
trades executed at the TAL. Therefore, there might be several market participants in EL aiming at
reaching a determined value, which will cause a noisier price discovery as the session
approaches the closing17. Still, it is likely that investors wait until the closing to execute their
trades either to simply close their open positions – the case of day traders –, in order to avoid the
potential exposure and portfolio readjustments from the overnight period, or because they hold
until the “last minute” to fulfil their orders in order to minimize transaction costs (understood as
trade timing). This allows for a higher concentration of orders in the market at this specific
moment, including large orders to be executed “no matter what”, thus intensifying trading activity,
which may be able to accentuate movements on stock returns. In fact, a significant rally or slump
of the close price is often observed in daily sessions, as exampled below. Also, the herding effect
shall be amongst the causes of such movement, as these sudden effects are likely to follow some
kind of information cascade or event that significantly disturbs investors’ decisions and
consequently stock prices’ evolution. In fact, an inaccurate price discovery may easily arise,
particularly when investors are influenced by what they see other investors doing.
Figure 4. PSI 20 trading session for the March 20th of 2009. Source: Euronext Lisbon.
In line with this, information must be accounted as a relevant exogenous factor that induces
changes in stock prices and influences investors’ decisions and trading timing. On the one hand,
several investors aim at accumulating as much information as possible until the end, in order to
17 Price manipulation is supported by Block et. al (2000) as they document high concentration of portfolio managers’ decisions in early-morning and late-afternoon then suggesting that the timing of trading decisions affects returns behaviour at the open and close of the market.

Intraday Volatility: Evidence from the Euronext Lisbon Equity Market
Universidade Nova de Lisboa – Faculdade de Economia 22
minimize trading costs. On the other hand, and because information is assymetric among market
participants18, the presence of informed traders may contribute to shape intraday behaviour of
returns volatility, as the less informed will avoid trading at such moments. In fact, the less
informed investors, who trade for liquidity, end up bearing the costs from the more informed.19
Still, this could also confirm the permiss of Hong and Wang (2000) of the prevalence of the
information assymetry effect, reflected in speculative trading, over the so called hedging trading
(for purposes of portfolio rebalancing), around the opening and closing moments20.
Moreover, the huge volatility of stock returns observed in EL during the first moments of the
trading-at-continuous period could indicate that several orders may be postponed from the Pre-
Opening period (then not reflected in the Open Price). This may suggest that market participants
prefer to hold on, while observing how the market really reacts to the accumulated information as
the trading session starts, before ‘stepping in’21. In this sense, the volatility of returns observed in
EL, which attains its highest right after the opening auction, could represent the pursuit for an
equilibrium price, which is only achieved some minutes after the auction is perfomed. However,
results also showed that the volatility of the Index returns, of the first half-an-hour period,
decreases when the open price is included in the interval. Therefore, the role of the Opening
auction must not be disregarded, as it seems that this mechanism, in fact, provides some
stabilization effect, as argued by Tian and Guo (2007). Then, we must say that the Opening
auction does contribute to stabilize prices, even though it is not the best expression of the real
price discovery on that moment, since its dynamics may end up being more visible as the trading-
at-continuous starts.
18 As assumed by Merton (1887) and Hong and Wang (2000). 19 This idea was supported by Admati and Pfleiderer (1988) who observed a higher concentration of more informed investors around market openings and closings. Those would make use of their private information, then disturbing stock returns on those moments. The distinction between more informed and uninformed/liquidity investors is based on Kyle (1985). 20 According to Hong and Wang (2000) when the hedging trading is dominated by the information asymmetry effect, returns volatility tends to increase over time. Besides, the authors argue that information asymmetry increases near the closing. 21 Recent personal experience from working in a national Investment Bank and some declarations of some Portuguese traders, allow me to find some evidence on this: several traders prefer to delay, to some extent, their trading decision of entering, in order to observe in advance how the market evolves and to form their expectation on short term performance.
Intraday Volatility: Evidence from the Euronext Lisbon Equity Market
Universidade Nova de Lisboa – Faculdade de Economia 23
Furthermore, although results denote a visible influence of the opening of NYSE session in
EL trading session, we can argue that this effect is less relevant than the pressures observed
near the two auctions.
In spite of the reduced sample of securities analysed on this work, two indications
suggest that liquidity constraints affect the stability of stock prices: the intraday behaviour of
returns volatility is noisier the less liquid the stock is and the volatility enlargement near the
auctions is more accentuated with reduced liquidity levels. The dispersion of the intraday variance
figures also confirms this impact of liquidity in price evolution. Indeed, a little larger order in the
market may be sufficient to change significantly the price for a less liquid stock. As a
consequence, liquidity shall contribute to smooth price discovery during the trading session in EL.
Besides, there is evidence that the effect of returns’ volatility of the less liquid issues of PSI 20,
prevails over the diversification effect from the Index composition, since the Index denotes the
largest amplitude of volatility levels during the day.
Ultimately, some suggestions for market regulators might arise following the conduction of
this work. The existent market mechanisms in EL for the Open/Close prices determination are not
the same world wide. Some international exchanges do not use or have suspended this auction
mechanism alleging its impact on the stability of price evolution. As an example, the Hong Kong
Stock Exchange has recently planned to suspend the closing auction22, in order to provide more
transparency and farness in the market and minimize the potential abuse that seems to appear
during this moment23. Being so, additional attention to the dynamics of these specific moments of
trading sessions may be suggested, given the regularities on the intraday behaviour of the trading
variable analysed.
Further analysis on the behaviour of other intraday variables, such as bid-ask spreads,
trading volume, number of transactions and orders flow (not included in this work due to time and
data availability constraints), would be of interest in order to provide additional conclusions on the
22 By an average of prices randomly selected from transactions occurred on the last minutes of the trading-at-continuous period. 23 Source: FOCUS, 2009.

Intraday Volatility: Evidence from the Euronext Lisbon Equity Market
Universidade Nova de Lisboa – Faculdade de Economia 24
intraday evolution of the Portuguese Stock Exchange. The effectiveness of Program Trading in
reducing the volatility of stock prices during the trading session would be another possible
extension for the analysis on this matter.

Intraday Volatility: Evidence from the Euronext Lisbon Equity Market
Universidade Nova de Lisboa – Faculdade de Economia 25
REFERENCES
Abhyankar, A. et al. 1997. “Bid-Ask Spreads, Trading Volume and Volatility: Intraday Evidence from the London
Stock Exchange.” Journal of Business Finance & Accounting, 23 (3) & (4).
Admati, A. and Pfleiderer, P. 1988. “A Theory of Intraday Patterns: Volume and Price Variability.” Review of Financial
Studies, 1: 3-40.
Amihud, Y. and Mendelson, H. 1987. “Trading Mechanisms and Stock Returns: An Empirical Investigation.” The
Journal of Finance, 42 (3): 533-553.
Amihud, Y. and Mendelson, H. 1991. “Efficiency and Trading: Evidence from the Japanese Stock Market.” The
Journal of Finance, 46: 1765-1790.
Bellalah, M. and Derhy, A. 2005. “Volume, Volatility and Periodic Closure with Information Uncertainty.” International
Journal of Business.
Black, F. and Scholes, M. 1973. “The Pricing of Options and Corporate Liabilities.” Journal of Political Economy, 81
(3): 637-654.
Block, S. B. et al. 2000. “The Pattern of Intraday Portfolio Management Decisions: a Case Study of Intraday Security
Returns Patterns.” Journal of Business Research, 50: 321-326.
Brock, W. and Kleidon, A. W. 1992. “Periodic Market Closure and Trading Volume: a Model of Intraday Bids and
Asks.” Journal of Economic Dynamics and Control, 16: 451-489.
Foster, F. D. and Viswanathan, S. 1990. “A Theory of Interday Variations in Volumes, Variances and Trading Costs
in Securities Markets.” Review of Financial Studies, 3: 593-624.
French, K.R. and Roll, R. 1986. “Stock Return Variances: the Arrival of Information and the Reaction of Traders.”
Journal of Financial Economics, 17: 5-26.
Gerety, M. S. and Mulherin, J. H. 1992. “Trading Halts and Market Activity: an Analysis of Volume at the Open and
the Close.” Journal of Finance, 47: 1765-1784.
Harris, L. 1986. “A Transaction Data Study of Weekly and Intraday Patterns in Stock Returns.” Journal of Financial
Economy, 16: 99-117.
Hong, H. and Wang, J. 2000. “Trading and Returns under Periodic Market Closures.” Journal of Finance, 55 (1): 297-
354.
Harju, K. and Hussain, S. M. 2008. “Intraday Return and Volatility Spillovers Across International Equity Markets.”
International Research Journal of Finance and Economics.
Jain, P.C. and Joh, G. H. 1988. “The Dependence between Hourly Prices and Trading Volume.” Journal of Financial
Quantitative Analsyis, 23: 269-283.
Intraday Volatility: Evidence from the Euronext Lisbon Equity Market
Universidade Nova de Lisboa – Faculdade de Economia 26
Kyle, A.S. 1985. “Continuous Auctions and Inside Trading.” Econometrica, 53 (6): 1315-1335.
Lepone, A., et al. 2006. “A Note on Opening Call Auctions: International Evidence.” Journal of Economic Literature.
Lockwood, L.J. and Linn, S. 1990. “An Examination of Stock Market Return Volatility During Overnight and Intraday
Periods, 1964-1989.” The Journal of Finance, 45 (2): 591-601.
McInish, T. H. and Wood, R. 1992. “An Analysis of Intraday Patterns in Bid-Ask Spreads for NYSE Stocks.” The
Journal of Finance, 47: 753-764.
Merton, R. 1987. “A Simple Model of Capital Market Equilibrium with Incomplete Information.” Journal of Finance, 42.
Ozenbas, D., Schwartz, R. and Wood, R. 2002. “Volatility in US and European Equity Markets: An Assessment of
Market Quality.” International Finance, 5 (3): 437-461.
Ronen, T. 1997. “Tests and Properties of Variance Ratios in Microstructures Studies.” Journal of Financial and
Quantitative Analysis, 32 (2): 183-204.
Schwartz, R. A. 2008. “Markets at Risk.” (Working paper).
Stoll, H. R. and Whaley, R. E. 1990. “Stock Market Structure and Volatility.” Review of Financial Studies, 3: 421-436.
Tian, G. and Guo, M. 2007. “Interday and Intraday Volatility: Evidence from the Shanghai Stock Exchange.” Journal
of Economic Literature.
Wood, R. A. et al. 1985. “An Investigation of Transactions Data for NYSE Stocks.” The Journal of Finance, 40: 723-
739.
Worthington, A. C. and Higgs, H. 2003. “Modelling the Intraday Return Volatility Process in the Australian Equity
Market: an Examination of the Role of Information Arrival in S&P/Asx 50 Stocks.” Journal of Economic Literature.
“FOCUS, The monthly newsletter of regulated exchanges, with key market figures”. World Federation of Exchanges.
193 (March 2009): 18.

Intraday Volatility: Evidence from the Euronext Lisbon Equity Market
Universidade Nova de Lisboa – Faculdade de Economia 27
ANNEXES
A1. Trading Session Schedule in Euronext Lisbon

Intraday Volatility: Evidence from the Euronext Lisbon Equity Market
Universidade Nova de Lisboa – Faculdade de Economia 28
PSI20 4Q 08 PSI20 4Q 07
j 1 8:05 AM 14,97% 1,38%j 2 8:10 AM 3,41% 0,59%j 3 8:15 AM 3,35% 0,60%j 4 8:20 AM 1,70% 0,43%j 5 8:25 AM 1,32% 0,42%j 6 8:30 AM 1,21% 0,48%j 7 8:35 AM 1,49% 0,41%j 8 8:40 AM 1,30% 0,32%j 9 8:45 AM 1,13% 0,38%j 10 8:50 AM 1,35% 0,35%j 11 8:55 AM 1,09% 0,36%j 12 9:00 AM 0,86% 0,35%j 13 9:05 AM 0,94% 0,33%j 14 9:10 AM 0,68% 0,36%j 15 9:15 AM 0,63% 0,38%j 16 9:20 AM 0,62% 0,32%j 17 9:25 AM 0,67% 0,31%j 18 9:30 AM 0,72% 0,36%j 19 9:35 AM 0,64% 0,28%j 20 9:40 AM 0,54% 0,32%j 21 9:45 AM 0,49% 0,33%j 22 9:50 AM 0,55% 0,33%j 23 9:55 AM 0,54% 0,36%j 24 10:00 AM 0,53% 0,35%j 25 10:05 AM 0,80% 0,32%j 26 10:10 AM 0,64% 0,29%j 27 10:15 AM 0,55% 0,27%j 28 10:20 AM 0,49% 0,30%j 29 10:25 AM 0,50% 0,32%j 30 10:30 AM 0,49% 0,34%j 31 10:35 AM 0,44% 0,28%j 32 10:40 AM 0,50% 0,31%j 33 10:45 AM 0,46% 0,31%j 34 10:50 AM 0,68% 0,34%j 35 10:55 AM 0,51% 0,35%j 36 11:00 AM 0,60% 0,38%j 37 11:05 AM 0,50% 0,31%j 38 11:10 AM 0,48% 0,29%j 39 11:15 AM 0,46% 0,31%j 40 11:20 AM 0,44% 0,28%j 41 11:25 AM 0,39% 0,26%j 42 11:30 AM 0,37% 0,30%j 43 11:35 AM 0,36% 0,28%j 44 11:40 AM 0,39% 0,33%j 45 11:45 AM 0,37% 0,35%j 46 11:50 AM 0,42% 0,32%j 47 11:55 AM 0,41% 0,28%j 48 12:00 PM 0,43% 0,30%j 49 12:05 PM 0,44% 0,34%j 50 12:10 PM 0,47% 0,31%
Intraday Period J (CET ‐1) PSI20 4Q 08 PSI20 4Q 07
j 51 12:15 PM 0,48% 0,26%j 52 12:20 PM 0,44% 0,26%j 53 12:25 PM 0,57% 0,29%j 54 12:30 PM 0,43% 0,27%j 55 12:35 PM 0,50% 0,28%j 56 12:40 PM 0,42% 0,24%j 57 12:45 PM 0,40% 0,29%j 58 12:50 PM 0,45% 0,23%j 59 12:55 PM 0,35% 0,21%j 60 1:00 PM 0,51% 0,25%j 61 1:05 PM 0,45% 0,23%j 62 1:10 PM 0,31% 0,24%j 63 1:15 PM 0,43% 0,24%j 64 1:20 PM 0,40% 0,25%j 65 1:25 PM 0,43% 0,28%j 66 1:30 PM 0,39% 0,25%j 67 1:35 PM 0,50% 0,27%j 68 1:40 PM 0,44% 0,22%j 69 1:45 PM 0,40% 0,27%j 70 1:50 PM 0,39% 0,29%j 71 1:55 PM 0,51% 0,27%j 72 2:00 PM 0,50% 0,29%j 73 2:05 PM 0,48% 0,27%j 74 2:10 PM 0,50% 0,28%j 75 2:15 PM 0,53% 0,27%j 76 2:20 PM 0,50% 0,25%j 77 2:25 PM 0,42% 0,27%j 78 2:30 PM 0,58% 0,28%j 79 2:35 PM 0,50% 0,33%j 80 2:40 PM 0,77% 0,33%j 81 2:45 PM 0,66% 0,41%j 82 2:50 PM 0,64% 0,35%j 83 2:55 PM 0,69% 0,39%j 84 3:00 PM 0,76% 0,36%j 85 3:05 PM 0,65% 0,37%j 86 3:10 PM 0,80% 0,34%j 87 3:15 PM 0,83% 0,37%j 88 3:20 PM 0,67% 0,31%j 89 3:25 PM 0,73% 0,33%j 90 3:30 PM 0,76% 0,40%j 91 3:35 PM 0,83% 0,61%j 92 3:40 PM 0,79% 0,41%j 93 3:45 PM 0,75% 0,40%j 94 3:50 PM 0,75% 0,37%j 95 3:55 PM 0,75% 0,38%j 96 4:00 PM 1,03% 0,51%j 97 4:05 PM 0,86% 0,48%j 98 4:10 PM 0,89% 0,56%j 99 4:15 PM 1,35% 0,47%j 100 4:20 PM 1,02% 0,54%j 101 4:25 PM 0,99% 0,53%j 102 4:30 PM 7,25% 1,21%
Intraday Period J (CET ‐1)
A2. PSI 20 Intraday Variability, per 5-minute intervals. 4Q08 and 4Q07.

Intraday Volatility: Evidence from the Euronext Lisbon Equity Market
Universidade Nova de Lisboa – Faculdade de Economia 29