Embed Size (px)
Citation preview

Intracellular Drug Distribution-Based Targeting: Exploiting Lysosomes to Enhance
the Selectivity of Drugs Towards Cancer Cells
By
Rosemary A. Ndolo
B.A., Berea College, 2005
M.S., University of Kansas, 2008
Submitted to the graduate degree program in Pharmaceutical Chemistry and the Graduate
Faculty of the University of Kansas in partial fulfillment of the requirements for the
degree of Doctor of Philosophy.
________________________________
Chairperson: Jeffrey P. Krise
________________________________
M. Laird Forrest
________________________________
C. Russell Middaugh
________________________________
Thomas E. Prisinzano
________________________________
Teruna J. Siahaan
Date Defended: November 1, 2010
ii
The Dissertation Committee for Rosemary A. Ndolo
certifies that this is the approved version of the following dissertation:
Intracellular Drug Distribution-Based Targeting: Exploiting Lysosomes to Enhance
the Selectivity of Drugs Towards Cancer Cells
________________________________
Chairperson: Jeffrey P. Krise
Date approved: November 1, 2010
iii
Abstract
Under the most ideal circumstances, anticancer agents should be minimally toxic
to normal cells and maximally noxious to cancer cells. Unfortunately, an optimal degree
of selectivity is not typically achieved and chemotherapy is often prematurely stopped
due to potentially life threatening side effects. For this reason, various approaches have
been explored in an attempt to enhance the selectivity of anticancer drugs. For the most
part, these techniques are based on Paul Ehrlich‘s concept of a ―magic bullet‖ which is
the attempt to target drugs to a disease site while avoiding healthy tissues. These
approaches therefore share a common requirement that the active drug achieves greater
concentration in or around tumor cells relative to normal cells. However, many of these
approaches have achieved limited success due to the difficulty of achieving site-specific
accumulation of conventional anticancer agents.
A rarely considered option in enhancing drug selectivity lies in optimizing the
intracellular distribution of drugs to achieve favorable distribution in cancer cells (i.e. in
compartments that allow drug-target interactions), and unfavorable distribution in normal
cells (i.e. in compartments that diminish drug-target interactions), essentially an
intracellular drug distribution-based (IDB) targeting approach. The IDB targeting
approach presents a paradigm shift from the classical approaches to enhance selectivity,
since the active drug is not expected to achieve higher concentrations in cancer cells
relative to normal cells. Instead the drug accumulates to the same extent in both normal
and cancer cells, but the aforementioned differences in intracellular drug distribution
result in selectivity.
iv
In the work presented here, we investigated whether the defective lysosomal
acidification associated with some cancer cells can be exploited to enhance selectivity of
weakly basic anticancer agents. Normal cells typically have very acidic lysosomes, which
provide a driving force for the accumulation of weakly basic drugs (with appropriate
physicochemical properties) into lysosomes. Some cancer cells have been shown to have
defective acidification of lysosomes, leading to a reduction in the extent of lysosomal
trapping of such weakly basic drugs. Our hypothesis is that the reduced sequestration of
weakly basic drugs in lysosomes of cancer cells would increase cytosolic drug
concentration, thus enhancing drug-target interactions, compared to the case in normal
cells, where extensive sequestration would diminish drug-target interactions. We
proposed that these differences in drug localization patterns between normal and cancer
cells, and the resultant difference in drug activity, would enhance selectivity of
lysosomotropic anticancer drugs to cancer cells.
In order to establish the potential for broad therapeutic application of this
approach, we assessed the prevalence of defective lysosomal acidification in cancer cells,
and whether lysosomal targeting of anticancer drugs could reduce their systemic toxicity.
We also evaluated whether IDB selectivity can be optimized according to relevant
physicochemical parameters of drug candidates, specifically the ionization constant
(pKa). These evaluations provide a rationale for the design or modification of anticancer
drugs with physicochemical properties that maximize lysosomal trapping in order to
enhance selectivity.
Collectively, our results demonstrate that drugs with optimal lysosomotropic
properties are more selective to cells with defective lysosomal acidification. Therefore,
v
intracellular drug-distribution based (IDB) targeting provides a viable approach to
enhance anticancer drug selectivity. As mentioned previously, the major limitation to
enhancing selectivity through site-directed targeting of conventional anticancer drugs to
tumors is the difficulty of achieving site-specific localization. Enhancing selectivity
through IDB targeting represents a rational approach that will not be subject to the
limitations faced by site-directed targeting approaches since there is no requirement that
drugs achieve tumor-specific localization.

vi
This dissertation is dedicated to Mum and Dad, and to Joseph.
vii
Acknowledgements
I would like to thank my advisor and committee chair, Dr. Jeffrey P. Krise for his
mentorship and support through the years. Additional thanks to my committee members:
Drs. Teruna J. Siahaan, C. Russell Middaugh, Thomas E. Prisinzano and M. Laird
Forrest. Special thanks to the dissertation readers, Drs. Siahaan and Forrest, for their
helpful feedback.
It was great working with all past and present members of the Krise Lab—Murali,
Samidha, Allyn, Alana, Stephen, Ryan, Randy, Archana and Damon.
Much gratitude to Joanna Krise for training me on running the mass spec and
always being willing to help if problems arose with the instrument, as well as for her
great sense of humor.
Were it not for Nancy Schwarting, I would never have touched a single one of the
mice described in Chapter 4 of this dissertation. Not only did she help me learn how to do
the tricky mouse tail vein injections, she was always willing to help me when I just
couldn‘t get them to happen.
Much thanks to Nancy, Ann, Nicole, Richard and Karen for all their help in
various issues pertaining to the daily academic, employment and lab life of a Pharm
Chem grad student.
I cannot thank Alana, Elodie, Pallabi, Ryan, Chuda, Supang, Barlas, Archana, and
Asha enough for good times and/or conversations.
Lastly, much thanks to the entire University of Kansas Department of
Pharmaceutical Chemistry for financial support and intellectual nurturing.
viii
TABLE OF CONTENTS
Chapter 1
1.1. Introduction ............................................................................................................ 2
1.2 A historical perspective of anticancer drug development ...................................... 6
1.3. Classical strategies to enhance cancer drug selectivity.......................................... 8
1.3.1 Tumor-targeting drug conjugates ............................................................. 10
1.3.2 Site-activated prodrugs ............................................................................ 15
1.3.3. Passive tumor targeting via the EPR effect ............................................. 16
1.4. Limitations to site-specific drug targeting ............................................................. 17
1.5. Intracellular drug distribution and implications for drug activity and
selectivity ............................................................................................................... 19
1.6. Intracellular drug distribution based (IDB) selectivity .......................................... 23
1.7. References .............................................................................................................. 27
Chapter 2:
The prevalence and mechanism of defective acidification in cancer
Cells ............................................................................................................................. 38
2.1 Introduction ............................................................................................................. 39
2.2 Materials and Methods ............................................................................................ 42
2.2.1. Cell culture .............................................................................................. 42
2.2.2. Antibodies and reagents .......................................................................... 43
2.2.3. Immunofluorescence ............................................................................... 43
2.2.4. Lysosomal pH assay ............................................................................... 44
2.2.5. Expression of SV40-LT in RPTE cells ................................................... 46
2.2.6. Western blotting ...................................................................................... 48
2.3. Results .................................................................................................................... 49
2.3.1. Time dependent localization of dextran in lysosomes ............................ 49
2.3.2. Lysosome pH in normal and cancer cells ............................................... 51
2.3.3. Expression of SV40 LT in RPTE cells ................................................... 53
2.3.4. Transformation influences expression of V-ATPase subunit E
and lysosomal pH ................................................................................... 54
2.4. Discussion .............................................................................................................. 58
2.5. References .............................................................................................................. 64
Chapter 3:
The pKa of weakly basic anticancer agents correlates with the degree of
intracellular drug distribution-based selectivity to cancer cells ............................. 68
3.1 Introduction ............................................................................................................. 69
3.2 Materials and Methods ............................................................................................ 72
3.2.1. Synthesis of geldanamycin analogs ........................................................ 72
ix
3.2.2. Cell lines and cell culture reagents ......................................................... 72
3.2.3. Determination of pKa values of geldanamycin analogs ......................... 73
3.2.4. Assessment of Hsp90 binding affinity of geldanamycin
analogs .................................................................................................. 73
3.2.5. Knockdown of V-ATPase subunit V1E1 ................................................ 75
3.2.6. Western blotting ...................................................................................... 76
3.2.7. Lysosome pH determination ................................................................... 76
3.2.8. Cytotoxicity assay ................................................................................... 77
3.3. Results .................................................................................................................... 78
3.3.1. 1H-NMR determination of geldanamycin analogue pKa ........................ 78
3.3.2. Assessment of Hs90 binding affinity of geldanamycin analogs ............. 81
3.3.3. Selectivity assessment of geldanamycin analogs in normal
versus cancer cells................................................................................. 83
3.3.4. Selectivity assessment of geldanamycin analogs in cancer cells
with low or elevated lysosomal pH ....................................................... 86
3.3.5. Selectivity assessment of other classes of anticancer drugs ................... 90
3.4. Discussion .............................................................................................................. 93
3.5. References .............................................................................................................. 99
Chapter 4:
The role of lysosomes in limiting drug toxicity in vivo .......................................... 103
4.1 Introduction ........................................................................................................... 104
4.2 Materials and Methods .......................................................................................... 106
4.2.1. Animals ................................................................................................. 106
4.2.2. Chemicals .............................................................................................. 106
4.2.3. Drug treatments and morbidity evaluations in mice ............................. 106
4.2.4. Elevation and measurement of lysosomal pH in mice .......................... 107
4.2.5. Fluorescence microscopy .................................................................... 109
4.2.6. Biochemical assays of serum arginase activity and serum
creatinine ............................................................................................. 110
4.2.7. Analysis of tissue/plasma drug concentrations ..................................... 110
4.2.7.1. Drug treatments ....................................................................... 110
4.2.7.2. Sample preparation and HPLC analysis .................................. 111
4.2.8. Histopathology ...................................................................................... 112
4.2.9. Statistical analysis ................................................................................. 112
4.3. Results .................................................................................................................. 113
4.3.1. Lysosomal pH elevation in mice........................................................... 113
4.3.2. Influence of lysosomal pH on drug-induced morbidity in mice ........... 115
4.3.3. Influence of lysosomal pH on drug-induced changes in liver
and kidney function .............................................................................. 117
4.3.4. Tissue/plasma drug concentrations ....................................................... 121
4.3.5. Tissue histopathology evaluations ........................................................ 125
4.3.6. Influence of lysosomal pH on intracellular distribution of the weakly basic
amine Lysotracker Red ......................................................................... 126
4.4. Discussion ............................................................................................................ 131
4.5. References ............................................................................................................ 138

x
Chapter 5:
Research summary and future directions............................................................... 142
5.1. Summary and conclusions ................................................................................. 143
5.2 Future studies: Expanding the scope of IDB selectivity .................................... 150
5.3. References ........................................................................................................... 155

1
Chapter 1: Introduction
2
1.1. Introduction
Ideally, anti-cancer drugs should be minimally toxic to normal cells and
maximally noxious to cancer cells. Unfortunately, an optimal degree of selectivity is not
typically achieved and chemotherapy is often prematurely stopped due to potentially life
threatening damage to normal tissues and organs [1,2]. A great deal of research has been
carried out on developing methods to improve the selectivity of existing anticancer drugs.
Many such approaches are based on the ‗magic bullet‘ approach, first envisioned by Paul
Ehrlich as a means to target drugs to a disease site while avoiding healthy tissues [3].
Accordingly, all of these approaches share a common requirement in that the active drug
is expected to accumulate to a greater extent in or around cancer cells, relative to normal
cells. To this end, a number of creative drug delivery strategies have been tested, e.g.
drugs conjugated to tumor targeting moieties and site-activated prodrugs. However, the
therapeutic usefulness of these approaches have been somewhat limited [3].
An important, but rarely considered variable in drug design is the intracellular
distribution of therapeutic agents. Since cells are highly compartmentalized, drugs as well
as drug targets are often localized in distinct compartments. For a drug to exert a
therapeutic response it must interact with its target, hence it has to localize in the same
compartment as its target. It is now well understood that physicochemical properties of
drugs influence their intracellular distribution [4,5,6]. Drug properties can therefore be
optimized to achieve the most favorable intracellular localization in target cells. It is
conceptually feasible to develop a selectivity approach that relies on differences in
intracellular drug distribution between normal and target (cancer) cells, contingent upon
differences in sub-cellular features between the cell types that could influence drug
3
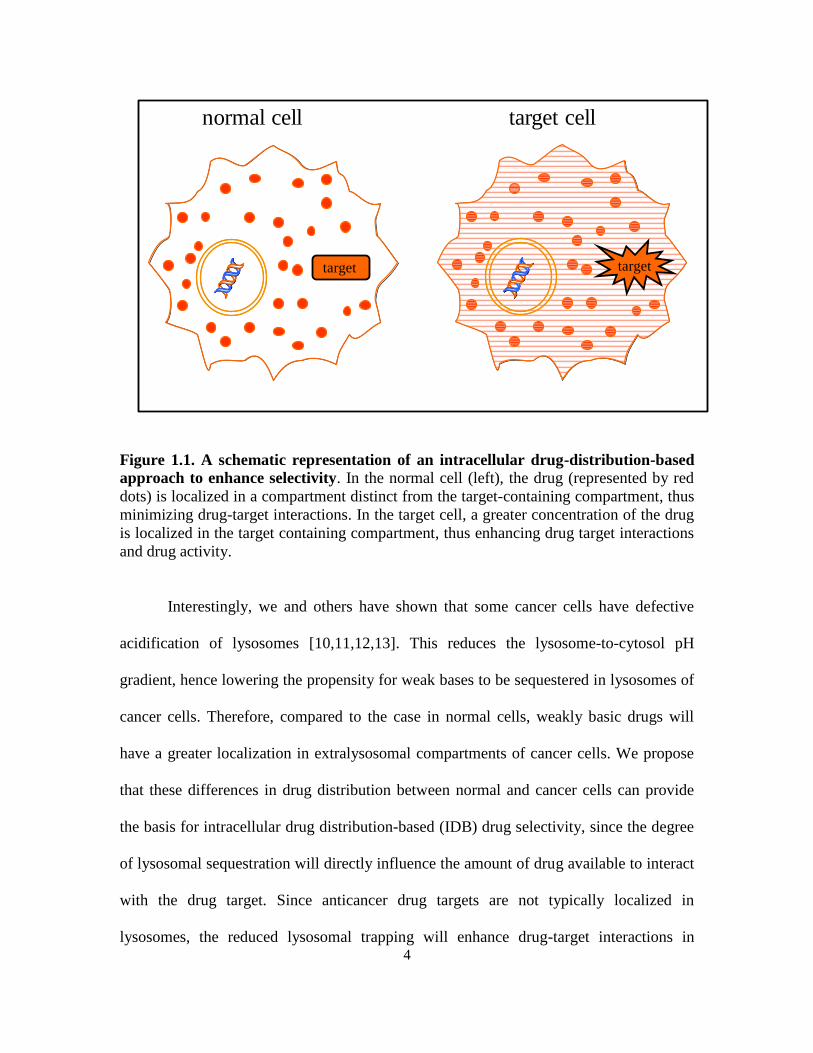
distribution. Such an approach would require that the drug achieve favorable distribution
in target cells (i.e. in compartments that allow drug-target interactions), and unfavorable
distribution (in compartments that diminish drug-target interactions) in normal cells. A
schematic representation of this approach is shown in Figure 1.1, for a drug with a
cytosolic target. In normal cells the drug would be localized in compartments distinct
from the cytosol, thus preventing drug-target interactions, while in target cells it would be
localized in the cytosol, thus promoting drug-target interactions.
One of the most prevalent intracellular drug distribution phenomena is the
lysosomal sequestration of weak bases, which has been shown to occur with numerous
weakly basic drugs [7,8,9]. Lysosomal sequestration occurs via ion trapping, whereby the
accumulation of weak bases from the cytosol into lysosomes is driven by the lysosome-
to-cytosol pH gradient. While the cytosolic pH is typically close to neutral, the pH of
lysosomes in normal cells is typically very acidic, with pH values around 4-4.5. This
creates a large lysosome-to-cytosol pH gradient that drives the extensive accumulation of
weakly basic drugs (with optimal physicochemical properties) into lysosomes. The
theoretical principles of ion-trapping were first introduced by Christian de Duve [8], and
will be discussed in mechanistic detail in a subsequent section of this chapter.
4
normal cell target cell
targettarget
Figure 1.1. A schematic representation of an intracellular drug-distribution-based
approach to enhance selectivity. In the normal cell (left), the drug (represented by red
dots) is localized in a compartment distinct from the target-containing compartment, thus
minimizing drug-target interactions. In the target cell, a greater concentration of the drug
is localized in the target containing compartment, thus enhancing drug target interactions
and drug activity.
Interestingly, we and others have shown that some cancer cells have defective
acidification of lysosomes [10,11,12,13]. This reduces the lysosome-to-cytosol pH
gradient, hence lowering the propensity for weak bases to be sequestered in lysosomes of
cancer cells. Therefore, compared to the case in normal cells, weakly basic drugs will
have a greater localization in extralysosomal compartments of cancer cells. We propose
that these differences in drug distribution between normal and cancer cells can provide
the basis for intracellular drug distribution-based (IDB) drug selectivity, since the degree
of lysosomal sequestration will directly influence the amount of drug available to interact
with the drug target. Since anticancer drug targets are not typically localized in
lysosomes, the reduced lysosomal trapping will enhance drug-target interactions in
5
cancer cells. In normal cells however, extensive lysosomal sequestration will minimize
the degree of drug interaction with targets, thereby reducing drug activity.
The overall objective of this dissertation is to evaluate the feasibility of the
intracellular drug distribution-based approach to enhance selectivity of anticancer drugs,
specifically, whether the lysosomal acidification defect associated with some cancer cells
can be exploited to enhance anticancer drug selectivity. In order to establish the potential
for therapeutic applicability of the IDB targeting approach to a broad spectrum of cancer
types, we evaluated the prevalence of defective acidification of lysosomes as outlined in
Chapter 2. In Chapter 3, we investigated whether IDB selectivity of lysosomotropic drugs
can be optimized according to the ionization constant (pKa) of the weak base, which is a
key physicochemical parameter influencing lysosomal sequestration. Since the ultimate
goal of enhancing specificity of anticancer drugs is to reduce systemic toxicity of the
parent drug, in Chapter 4 we evaluated the role of lysosomal sequestration on drug
toxicity in vivo.
The indiscriminate toxicity of anticancer drugs to cancer cells and normal cells
alike is due in part to traditional anticancer drug discovery approaches. The traditional
empirical approach to cancer drug discovery contributes to a drug identification process
that is skewed toward potent drugs that have poor selectivity. Therefore, in this chapter
we discuss the early development of anticancer drugs and how this could contribute to
their high toxicity.
The indiscriminate toxicity of anticancer agents has led to a variety of research
efforts into drug delivery approaches that could enhance their selectivity. In general, the
classical approaches to enhance anticancer drug selectivity require that the active drug
6
achieves a higher concentration around cancer cells relative to normal cells. Some of
these approaches will be discussed herein, as well as specific and general reasons why
they have not yielded an effective and generally applicable route to reducing the toxicity
associated with anticancer drugs. Many of the factors that limit the success of classical
drug targeting approaches stem from the difficulty in achieving truly site-specific drug
delivery, a limitation that would not be encountered by an IDB targeting approach.
Therefore, if the IDB targeting approach to enhance selectivity is feasible and applicable
to a range of cancer types, it will result in significant gains in improving the therapeutic
efficacy of anticancer drugs.
1.2. A historical perspective of anticancer drug discovery
The toxicity of traditional anticancer drugs can be explained in part by the empirical
nature of early anticancer drug development. Most early anticancer drug candidates were
pursued based on evidence of toxicity, without an understanding of their molecular
mechanism of action [14]. For instance, it was due to the toxic effects of the chemical
weapon sulfur mustard, originally synthesized in 1854 and used in World War I that
anticancer drugs were discovered [15]. In World War II soldiers accidentally exposed to
sulfur mustard at Bari Harbor, Italy suffered from severe irritation of the respiratory tract
and eye, and it was soon recognized that the toxic effects of sulfur mustard targeted the
rapidly dividing cells of the gastrointestinal tract and blood forming organs [15,16]. The
selective toxicity of sulfur mustard to rapidly dividing cells led to the postulation that
rapidly dividing tumor cells would likewise be highly susceptible to similar agents.
Subsequently, researchers at Yale carried out successful experiments using nitrogen
7
mustard against a murine lymphoid tumor that demonstrated its efficacy against tumor
growth [16]. Later, nitrogen mustard was administered to patients with non-Hodgkins
lymphoma [15], whereby the drug was found to induce marked tumor regression.
The discovery of nitrogen mustard as a novel anticancer drug resulted in a great deal
of optimism that cancer could finally be cured. A burst of research activity to develop
new anticancer drugs therefore resulted, which yielded thousands of additional
compounds with potent anti-tumor activity [16]. The major obstacle to further cancer
drug discovery became the lack of an appropriate model to test this vast array of new
anticancer compounds and identify the ones with therapeutic potential. In 1935, Murray
Shear of the United States Public Health Service developed the first anticancer drug
screening model, which consisted of murine tumor cells, since the culture of human cells
had not been successfully accomplished at the time. Of three thousand compounds
initially tested by Shear, only two made it to clinical trials, but were eventually dropped
due to unacceptable toxicity [16].
The early use of fast-growing murine tumor models resulted in a vast majority of
anticancer drugs selected in these early discovery programs being anti-proliferative [15].
Such drugs have an inherent selectivity to cancer cells due to the typically enhanced rate
of cell division characteristic of many cancer types. However, there are a host of normal
cells that undergo a rapid turnover, particularly cells of the gastrointestinal tract, hair
follicles and bone marrow, which proliferate almost as rapidly as any growing tumor
[17]. For this reason, anti-proliferative cancer drugs will be just as active in these types of
normal cells, resulting in the typical side effects of chemotherapy such as nausea, hair
loss and immune suppression.
8
Over the years, the screening model used in the evaluation of new anti-cancer drugs
has evolved from the use of murine cancer types to the currently used NCI-60 cell line
screen, a panel of 60 human cancer cells lines representing various tumor types (both fast
and slow growing cells of varied lineage) that was developed to provide a more
therapeutically relevant screening model [18]. Although this screening model is
instrumental in the identification and development of potent anti-cancer drugs, it fails to
identify potent anticancer drugs with a concomitant lack of activity against normal cells.
Indeed, many novel anticancer agents continue to be identified, but few find clinical
utility due to unacceptable toxicity [17], a clear indicator that there is a need for a
screening approach that can identify potent drugs with reduced activity in normal cells
very early in the anticancer drug development process.
Given the high concentration of drug required to achieve tumor regression, the dose-
limiting toxicity of anticancer drugs inevitably poses a challenge to successful
chemotherapy. Most efforts to enhance the selectivity of existing anticancer drugs have
focused on enhancing delivery of the active drug to cancer cells, while attempting to limit
accumulation around normal cells. Some of these classical approaches are reviewed
subsequently.
1.3. Classical strategies to enhance cancer drug selectivity
In general, a tumor targeting drug-delivery system consists of a derivative of the
parent drug that incorporates a tumor recognition moiety that targets cancer cells [3],
which should ideally be inactive until delivery to the tumor site is achieved. Tumor
targeting is made possible by the existence of various biochemical and phenotypic
9
differences between normal and cancer cells [19,20,21]. For example, rapidly growing
tumors tend to have an increased need for certain nutrients, vitamins and growth factors
[22,23], and therefore have an enhanced uptake of such molecules relative to normal cells
[24]. Phenotypic differences between normal and cancer cells may include receptors or
proteins that are expressed on the plasma membranes of tumor cells but are minimally
present or absent from normal cells [19]. Lastly, the tumor vasculature [25] and
microenvironment [26] also have features distinct from that of normal tissue, which could
be exploited to enable tumor specific delivery.
Classical drug delivery strategies that have been explored to enhance the
selectivity of anticancer drugs include conjugating drugs to antibodies that can recognize
tumor specific antigens [19,27], or conjugating drugs to molecules that are taken up at a
higher rate by cancer cells relative to normal cells, such as folic acid [28]. Passive
targeting to tumor cells of a drug that is anchored to or encapsulated in an appropriately
sized carrier can be achieved due to defects in tumor vasculature and lymphatic drainage,
which allow the carrier to accumulate and be retained to a greater extent in tumor tissue
relative to normal tissues [29]. Prodrugs that can be selectively activated by enzymes, or
other features unique to the tumor environment, are yet another approach to achieve site
specific localization of an active anticancer drug [30,31].
These conventional approaches to enhance tumor targeting of cancer drugs are
discussed in the following section. Although a discussion of all the drug delivery
approaches that have been explored for improving cancer drug selectivity is outside the
scope of this dissertation, they are for the most part similar in principle to the examples
discussed here.
10
1.3.1. Tumor-targeting drug conjugates
The principle of this approach is that an active drug can be conjugated to a tumor
targeting moiety that ideally, will allow a drug that is administered systemically to
localize specifically around tumor tissue. This can be achieved either by conjugating a
drug to a moiety that will recognize tumor-specific molecules, or conjugation to
molecules preferentially taken up by cancer cells. Some examples of this approach are as
follows:
Antibody-drug conjugates: The presence of antigens on the surface of tumor cells
that are absent, or minimally present on the surfaces of normal cells [19] makes it
possible to conjugate drugs to antibodies that can deliver drugs selectively to such tumor
cells. These tumor associated antigens (TAAs) may include gangliosides, glycoproteins,
growth factor receptors and oncoproteins [19,32,33]. Antibodies that recognize these
antigens can be conjugated to cytotoxic agents, via linkers that should ideally be stable
until the conjugate is specifically delivered to the tumor site, in order to avoid premature
release of the drug [34].
The concept of antibody drug targeting is theoretically very appealing, since a
highly specific antibody should be capable of targeting the drug very efficiently to the
tumor site. However, the reality is that the success of this approach has been quite
modest. Many antibodies bind to some extent to antigens expressed on normal cells as
well [34], thus reducing the specificity of targeting. The number of molecules that can be
conjugated to an antibody is limited by the need to preserve the activity of the antibody,
therefore drug-antibody conjugates often fail to deliver an effective concentration of drug
to the tumor site [35]. Moreover, the sheer size of antibodies hinders the penetration of
11
antibody drug conjugates into solid tumors. In fact, it has been shown that only about 1%
of dosed antibody typically reaches the tumor site [17].
In a clear indicator of the challenges facing this approach, the only FDA approved
antibody-drug conjugate for cancer treatment-gemzutumab ozogamicin (Mylotarg®),
licensed for treatment of AML [36], was recently withdrawn from market due to
unacceptable toxicity. [37]. Mylotarg is an antibody drug conjugate consisting of a
humanized mAb, P67.6, conjugated via a hydrazone and a disulfide linker to the highly
cytotoxic agent N-acetyl-calicheamicin, which is released intracellularly upon lysosomal
cleavage of the hydrazone linker [30]. The withdrawal of Mylotarg was necessitated by
its high degree of systemic toxicity, including myelosuppression, thrombocytopenia, and
nausea [36].
Although antibody-drug conjugates are a rational and conceptually appealing
approach to enhance tumor drug delivery, they are faced with a number of limitations, as
mentioned, which have limited their utility. Besides these limitations, they may face other
issues such as stability concerns necessitating complex formulation.
Folic acid-drug conjugates: Tumor cells have been found to require more folic
acid, and to have a higher affinity for it than normal cells [38] , since it is required for
DNA and RNA synthesis [39]. The folate receptor is therefore overexpressed in a number
of cancers including ovarian cancer [38,40], colon carcinoma [38] and osteosarcoma
[41]. Folic acid is therefore an attractive choice as a tumor targeting moiety, and has been
conjugated to various drugs for this purpose. Leamon and Low were the first to exploit
folic acid as a so called ‗trojan horse‘ to deliver anticancer agents into cancer cells [42],
12
and since then a number of other drugs conjugated to folic acid have been described. Lee
et al. attached folic acid to paclitaxel through an oligoethyleneylglycol linker [43].
However, they found that the folate receptor binding affinity of a representative
conjugate, C-7-(PEG-3)-folyl paclitaxel, to FR positive KB cells was only 1/4 that of free
folic acid. The successful in vivo evaluation of folic-acid conjugated to a proprietary
cytotoxic warhead has been described by Leamon and Ready [42]. The conjugate is
reported to have exhibited enhanced activity against human KB xenografts and reduced
systemic toxicity.
Although folic acid has been lauded as a model tumor targeting moiety, since its
small size allows penetration into solid tumors, and prevents an immune response [28], so
far there is no approved folic acid-drug conjugate for tumor targeting, although some
advancement has been made in the use of folic acid to target radio-imaging agents to
tumors [27].
Peptide-drug conjugates: Tumor targeting with peptides is feasible based on the
finding that receptors of many regulatory peptides are overexpressed in tumor cells
compared to normal tissues [44,45,46]. An example is the somatostatin membrane
receptor (SSTR), which binds to the neuropeptide somatostatin (SST) with a very high
affinity [27]. Therefore, SST and its analogs can be applied as tumor targeting moieties,
and a few such approaches have been described. Sun et al. described the conjugation of a
somatostatin analog to camptothecin [47], which exhibited anti-angiogenic and anti-
invasive properties, but had no appreciable activity against the cancer cell line tested (PC-
3 prostate cancer). The authors predicted an improvement of systemic toxicity of the
13
conjugate, but did not evaluate this conclusion in vivo. Conjugation of doxorubicin and a
super-active doxorubicin derivative, 2-pyrrolino-DOX to somatostatin has been described
by Nagy and co-workers [48]. These conjugates retained cytotoxic activity and were less
toxic in vivo than the parent compounds. Another peptide with potential for drug
targeting is luteinizing hormone-releasing hormone (LHRH), whose receptor has also
been found to be overexpressed in some cancer types relative to normal cells [49]. A
number of reports of LH-RH-anticancer drug analogues have also been described [50].
Conjugation of drugs to bombesin, a homolog of gastrin-releasing peptide (GRP), whose
receptors have also been found to be overexpressed in some cancer cells [51,52] has also
been explored.
Despite some promise, the use of peptides in drug targeting is hampered by their
short-half-life in blood and generally poor bioavailability [53]. Chemical modification is
often necessary to increase the serum stability of peptides, but such modified peptides
may be more immunogenic.
Poly-unsaturated fatty acid-drug conjugates: Several studies have shown that -
poly unsaturated fatty acids (PUFAs) stimulate several stages in the development of
cancer [54]. Cancer cells appear to take up PUFAs at a higher rate than normal cells,
presumably for use as biochemical precursors and energy sources [55]. Therefore,
PUFAs are potential vehicles for selective delivery of drugs to cancer cells, especially
since they are naturally occurring in many foods and are hence regarded as safe. Some
naturally occurring PUFAs found in the diet are linolenic acid (LNA), linoleic acid (LA),
arachidonic acid (AA), eicosapentaenoic acid (EPA), and docosahexaenoic acid (DHA).
14
Bradley et al. conjugated DHA to the C-2′ position of paclitaxel, achieving a derivative
(Taxoprexin) that exhibited substantially increased antitumor activity and reduced
systemic toxicity as compared to paclitaxel [56]. However, Ojima and co-workers argue
that the released Paclitaxel would be a prime candidate for extrusion by Pgp activity, and
would therefore not be effective against drug resistant cancer cells. As an alternative, this
group developed so-called second generation taxoids with reduced Pgp activity and
enhanced anti-tumor activity and conjugated these drugs to DHA and α-LA to create
conjugates with reduced systemic toxicity in mice [57].
Hyaluronic acid-drug conjugates: Hyaluronic acid (HA), or hyaluronan is a high
molecular weight compound found particularly in loose connective tissue [58]. It has a
number of functions in the extracellular matrix, and has been shown to be elevated in
various cancers, including breast, ovarian, prostrate and colorectal cancers [59]. The
elevated expression of HA in tumors has been associated with increased tumor cell
migration and metastasis [60,61]. Tumor cells also overexpress HA receptors such as the
cell surface glycoprotein CD44 [62], and the receptor for hyaluronic acid-mediated
motility, CD168 [63]. Therefore, conjugation of HA to various cytotoxics has potential
for enhanced site specific delivery of drugs to tumor sites. HA conjugated drugs are taken
up into the cell via receptor-mediated endocytosis followed by intracellular degradation
of HA and release of active drug [64]. This approach has been described for enhancing
tumor delivery of doxorubicin [64] paclitaxel [65] and butyric acid [66]. This approach is
however limited by the fact that only a few drug molecules can be conjugated to HA.
Highly loaded HA-drug conjugates were found to have poor cellular uptake due to
15
reduced affinity to the HA receptor [66]. This limitation would greatly reduce the
concentration of active drug that could be delivered to the tumor site.
1.3.2. Site activated prodrugs
A prodrug is a bioreversible derivative of a molecule, which is designed to
overcome the barrier or barriers to the utility of the said molecule [26]. The
indiscriminate toxicity of anticancer drugs presents a barrier to their efficacy, which can
be overcome by the use of site-activated prodrugs, which would ideally be inactive until
selectively activated or released at the tumor site. Characteristics unique to the tumor
microenvironment such as low pH, hypoxia and tumor specific enzymes [26] have been
exploited to provide routes to site-specific activation of prodrugs. The low pH around
tumors is caused by increased production of lactic acid due to anaerobic respiration [67].
A few instances of pH-activated anti-tumor prodrugs have been described. For example,
Tomlinson et al. conjugated doxorubicin to a hydrolytically-labile amino-pendent
polyacetal with pH-dependent degradation [68].
In order to invade other tissues and metastasize, tumor cells tend to have an
increased production of proteolytic enzymes, which break down the extracellular matrix
to allow cell migration [69]. Such enzymes can provide a route to tumor-specific
activation of prodrugs, since they do not exist or are minimally present around normal
tissues. Some of these enzymes include β-glucuronidase, matrix metalloproteinases and
cathepsin B which can cleave the tumor specifying moiety from the protease cleavable
prodrug [30]. A majority of enzyme activated prodrugs have a releasable linker between
the tumor specifier and the drug, which reduces steric hindrance to cleavage of the
16
targeting moiety [30]. Since, most enzymes are not usually distributed in a consistent
manner in tumors, an alternative approach is to target the activating enzyme to the tumor
site using antibodies to tumor antigens, an approach known as antibody directed enzyme
prodrug therapy (ADEPT).
Hypoxic conditions in the tumor microenvironment, which are a consequence of
the malformed structure of the tumor vasculature leading to low oxygenation [26], can be
exploited to enhance the tumor specificity of bioreductive anticancer prodrugs.
Bioreduction occurs via enzymes that are also present in normal tissues; however
complete reduction to the active agent occurs in the absence of oxygen, thus imparting
tumor specificity of activation. A number of hypoxia-activated anti-cancer prodrugs have
been described that are activated through reduction of applicable moieties such as
quinones N-oxides and heteroaromatic nitro groups [30] .
A disadvantage of site-activated prodrugs is that premature cleave of the cytotoxic
agent can lead to systemic toxicity. Secondly, for pH activated prodrugs, the difference in
extracellular pH between normal and tumor tissue is typically quite small (~0.4 units),
which is a very narrow range to attempt to exploit for selective activation in tumor tissue.
1.3.3. Passive tumor targeting via the EPR effect
The enhanced permeability and retention (EPR) effect refers to the enhanced
accumulation of macromolecules in tumor tissue due to the characteristic increased
permeability of tumor blood vessels, and enhanced retention due to poor lymphatic
drainage [29]. To obtain nutrients for growth, and to metastasize, tumors often co-opt
existing blood vessels, and recruit endothelial cells from bone marrow to grow new ones
17
[70], thus creating a vasculature that is structurally abnormal and functionally impaired,
with haphazardly interconnected blood vessels. To aid in the sprouting of new blood
vessels, vascular endothelial growth factor (VEGF), a key regulator of vascular
permeability [71,72] is often overexpressed in solid tumors, leading to an overly
permeable, ‗leaky‘ tumor vasculature. This allows large molecules, ranging from 10 to
100nm in size, to be released from the tumor vasculature into the tumor interstitial space
[73]. Impaired lymphatic drainage enhances retention of the drug-carrying
macromolecule at the tumor site. This phenomenon, termed enhanced permeability and
retention (EPR), first described by Maeda et al.[29], allows large molecules to
‗extravasate‘ from the blood vessels into the tumor and become trapped within the tumor
region [74]. This phenomenon creates the opportunity to load molecules of a certain size
with cytotoxic drugs and ensures that delivery is restricted to tumor sites, since normal
vasculature does not allow molecules of this size to exit blood vessels [75]. For tumor
selective drug delivery, the EPR effect has been exploited to enhance delivery of drugs
conjugated to macromolecules, and particulate carriers such as liposomes [76].
1.4. Limitations to site-specific drug targeting
Despite the creativity of the above approaches to achieve anticancer drug
selectivity, the ‗magic bullet‘ for cancer therapy is yet to be discovered. Site directed
targeting has achieved only modest advances in reducing the toxicity of available anti-
cancer drugs, and has so far failed to produce an effective and generally applicable site-
specific drug delivery system [3]. There are several limitations contributing to the lack of
success of tumor directed targeting, some of which were discussed specifically for each
18
of the targeting approaches described above. However, the overriding obstacle to the
success of these approaches is the difficulty in achieving site-specific delivery of the
traditional anticancer drugs employed in these approaches. The very nature of
conventional therapeutics (low molecular weight, lipophilicity) which allows them to
traverse cells membranes and accumulate in cells, also renders them highly likely to
diffuse away from targeted sites following site-specific delivery [77]. Therefore, it is not
that drug targeting completely fails to achieve site specific accumulation at the site, rather
delivered drugs are not retained at the site. The general conclusion is that drugs for site-
directed targeting must have physicochemical features that will allow them to be retained
at the desired site of delivery [78]. In addition, successful delivery of a drug targeting
vessel or carrier to the target organ may not guarantee that an adequate amount of the free
drug will be available at the actual targets (which for most anticancer drugs are
intracellular). Additional processes such as active/passive transport across the cell
membrane, release from carriers, and metabolism will influence the overall outcome [3]
and must separately be studied and optimized.
An additional consideration is whether the additional cost that is inevitably
associated with the production of drug-conjugates justifies their use. An approach that
would obviate this concern was briefly alluded to in the introduction and is based on the
optimization of intracellular drug distribution to achieve the desired activity in cancer
cells and not in normal cells. The intracellular drug distribution-based selectivity
approach proposes modifications on the chemical structure of a drug that can influence
intracellular distribution by altering the physicochemical properties of the drug, while
19
having minimal impact on cell uptake, tumor penetration and activity of the drug. The
principles and mechanism of this approach is discussed in the next section.
1.5. Intracellular drug distribution and implications for drug activity and selectivity
The previously described approaches to enhance selectivity of anticancer drugs all
rely on targeting the active anticancer drug to the vicinity of cancer cells while avoiding
drug delivery to normal cells. However, an often overlooked variable in determining drug
effectiveness is the intracellular distribution and localization of drugs. Several studies
have addressed how structural and physicochemical properties can influence the
intracellular distribution of drugs [6]. For example, lipophilic compounds with a
delocalized positive charge are known to localize in mitochondria due to the organelle‘s
negative membrane potential [79]. Planar aromatic compounds such as anthracyclines are
have a high binding affinity to DNA base pairs and therefore predominantly localize in
the nucleus [6].
Just as drugs may localize in any of several compartments, drug targets also
typically have well-defined intracellular localization sites. Many cancer drug targets are
localized either in the cell cytosol, for example heat shock proteins [80,81] and
microtubules [82] or in the nucleus, i.e. DNA [83,84], and topoisomerases [85,86].
Therefore, for an anticancer drug to exert its therapeutic effect it must sufficiently
concentrate in the same intracellular compartment as its target. For this reason, it is
crucial that this important variable not be overlooked, particularly in the early stages of
drug screening.
20
Of all the intracellular drug localization phenomena associated with drugs due to
their physicochemical characteristics, lysosomal sequestration of weak bases is one of the
most prevalent. Many weakly basic molecules are excellent substrates for extensive
sequestration in acidic lysosomes according to an ion trapping type of mechanism
[4,87,88]. Christian de Duve, the Nobel laureate credited with discovering lysosomes,
published a detailed theoretical analysis on ion trapping [8]. According to this work,
substrates for ion trapping are typically weakly basic molecules with pKa values around 7
that are membrane permeable in their unionized state and are relatively membrane
impermeable when ionized [4,9,89]. Such molecules will exist to a significant extent in
their membrane-permeable, free base form when they are present in the neutral cell
cytosol. From the cytosol, the molecules can freely partition across all organelle lipid
bilayers. When these molecules partition into organelles with very acidic internal
environments (i.e., lysosomes, pH ~4-4.5), they are virtually 100% ionized. Unable to
diffuse back out to the cytosol, the charged molecule remains trapped inside lysosomes.
Normal cells typically have low lysosomal pH values around 4.0, and can theoretically
concentrate up to 1000-fold higher concentration of drug compared to the cytosol [8,90].
The extent of lysosomal sequestration of weakly basic drugs is a relevant
therapeutic consideration, since in some instances lysosomal sequestration can account
for nearly 100% of the total drug accumulation within a cell [7,89]. A diagrammatic
representation of ion trapping is shown in Figure 1.2.
21
cytosol
(~pH 7.4)
D
DH+
D
DH+
lysosome
(~pH 4.5)
DH+
DH+
DH+
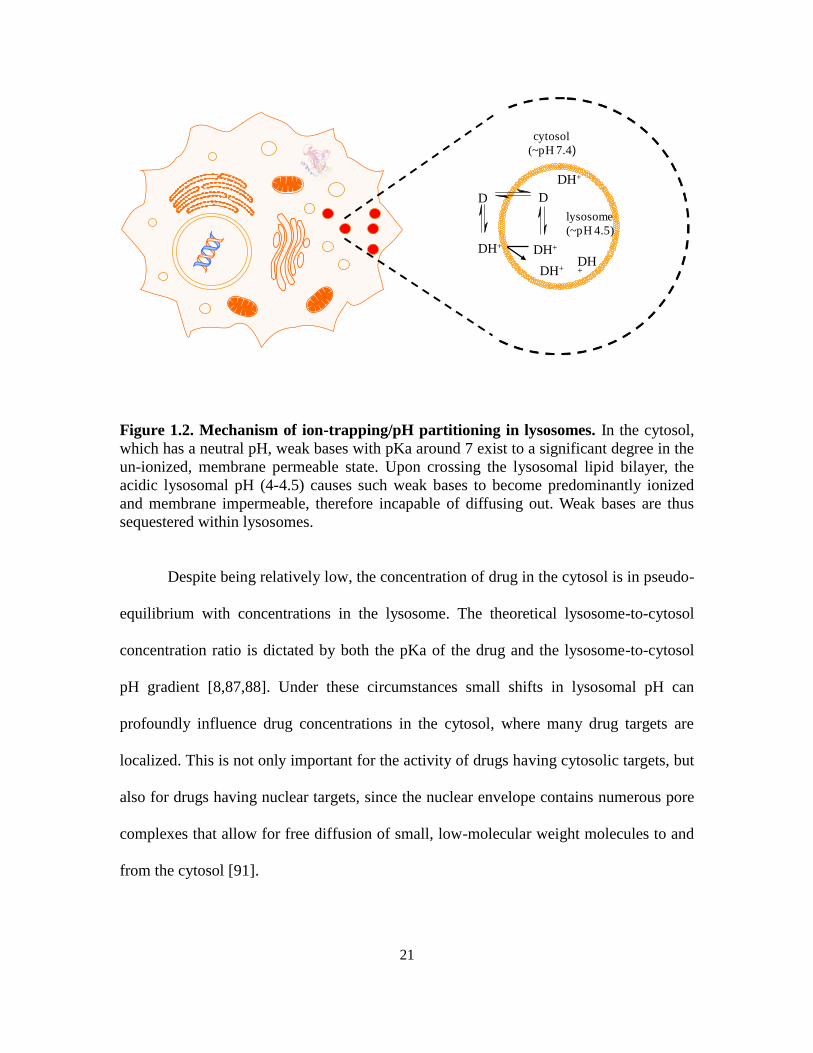
Figure 1.2. Mechanism of ion-trapping/pH partitioning in lysosomes. In the cytosol,
which has a neutral pH, weak bases with pKa around 7 exist to a significant degree in the
un-ionized, membrane permeable state. Upon crossing the lysosomal lipid bilayer, the
acidic lysosomal pH (4-4.5) causes such weak bases to become predominantly ionized
and membrane impermeable, therefore incapable of diffusing out. Weak bases are thus
sequestered within lysosomes.
Despite being relatively low, the concentration of drug in the cytosol is in pseudo-
equilibrium with concentrations in the lysosome. The theoretical lysosome-to-cytosol
concentration ratio is dictated by both the pKa of the drug and the lysosome-to-cytosol
pH gradient [8,87,88]. Under these circumstances small shifts in lysosomal pH can
profoundly influence drug concentrations in the cytosol, where many drug targets are
localized. This is not only important for the activity of drugs having cytosolic targets, but
also for drugs having nuclear targets, since the nuclear envelope contains numerous pore
complexes that allow for free diffusion of small, low-molecular weight molecules to and
from the cytosol [91].
22
The maintenance of low pH in a subset of intracellular organelles, including
lysosomes, is required for activation and functioning of lysosomal enzymes, and is
necessary for cell growth and survival [92]. Lysosomal pH is maintained by several
mechanisms, that balance the rate of proton pumping into organelles against proton
leakage and counterion conductance [92]. Protons are pumped into lysosomes against a
concentration gradient by the vacuolar-type ATPase (V-ATPase), a large multiple subunit
enzyme consisting of two domains, a cytosolic V1 domain, and a membrane localized
domain, V0 [93]. The activity of V-ATPase is regulated both intrinsically, by the
association and dissociation of its V0 and V1 domains in response to signals such as
glucose availability [93,94], and extrinsically by the build-up of a positive membrane
potential due to the accumulation of protons, which inhibits further proton pumping [92].
The V-ATPase has been shown to be efficient at maintaining low pH values in lysosomes
despite the neutralization capacity of the accumulating bases, perhaps due to dissipation
of the positive membrane potential, which allows lysosomes to continue to take up weak
bases even after they accumulate to very high concentrations.
While the lysosomal pH of normal cells is tightly regulated, as described above,
we and others have shown that some cancer cell lines have defective acidification of
lysosomes (18-21). Various studies have suggested a link between transformation and
defective acidification of organelles in cancer cells. Jiang et al. demonstrated that
transformation of human and murine cells with an H-ras oncogene resulted in elevation
of lysosomal pH [95]. In other studies, the E5 oncoprotein found in the human
papillomavirus was shown to interact with the 16-kDa proton pumping subunit of the V-
23
ATPase and inhibit endosomal acidification [96]. Some tumor cell lines express V-
ATPases at their plasma
Consistent with ion trapping theory, defective acidification of lysosomal pH in
cancer cells should theoretically result in a reduced capacity for lysosomal sequestration
relative to normal cells. Indeed quantitative evaluations carried out in our lab confirmed
that cells with impaired lysosomal sequestration had reduced concentrations of the weak
base tested in lysosomes relative to cells with normal, low lysosomal pH [88].
1.6. Intracellular drug distribution based (IDB) selectivity
According to the ion trapping mechanism described previously, the low lysosomal
pH of normal cells leads to extensive lysosomal sequestration of weakly basic drugs.
Conversely, defective acidification of lysosomes in cancer cells results in a relatively
reduced sequestration of weak bases in lysosomes. We propose that these differences in
intracellular drug distribution between normal and cancer cells can be exploited to
enhance selectivity of drugs with optimal physicochemical properties to cancer cells,
essentially an intracellular distribution-based (IDB) drug targeting approach. The
principle of the IDB targeting approach is that relative to normal cells with low lysosomal
pH, reduced lysosomal sequestration of drugs in cancer cells with elevated lysosomal pH
would allow a greater amount of the drug to interact with cytosolic and/or nuclear targets,
thus enhancing activity.
On the other hand, extensive sequestration in normal cells with low lysosomal pH
would minimize drug-target interactions and therefore decrease the activity of the drug in
normal cells, resulting in an overall enhancement of selectivity. A schematic of the
24
proposed IDB targeting approach is shown in Figure 1.3. The classical approaches to
enhance selectivity of anticancer drugs discussed in the preceding section require the
active drug to localize preferentially in or around cancer cells relative to normal cells, an
approach which as discussed, has multiple limitations. In the IDB targeting approach,
selectivity is achieved based on the fact that anticancer agents with optimized
physicochemical properties can distribute differently in normal versus cancer cells,
resulting in differences in drug-target interactions and ultimately, differences in drug
response. Sequestration of the drug in lysosomes of normal cells, away from drug targets
would reduce toxicity to normal tissues, thus increasing the maximum tolerated dose of a
given weakly basic anticancer drug.
We have preliminarily evaluated the aforementioned IDB drug targeting platform,
using inhibitors of the molecular chaperone Hsp90, with or without lysosomotropic
properties. Since Hsp90 inhibitors have cytosolic targets, their activity should be
responsive to the degree of lysosomal sequestration, or lack thereof. We tested the
inhibitors in vitro using cultured cells with low or elevated lysosome pH [22] and found
that the lysosomotropic Hsp90 inhibitors were much more toxic (lower IC50) to cells with
elevated lysosomal pH compared to cells with normal, low lysosomal pH. On the other
hand, the non- lysosomotropic inhibitor GDA had no differential selectivity, regardless of
the lysosomal pH status of cells.
Quantitative evaluations of lysosome-to-cytosol concentration ratios of neutral
and weakly basic inhibitors demonstrated that lysosome-to-cytosol concentration ratios
for lysosomotropic inhibitors decreased in cells with elevated lysosomal (i.e., cancer-like
cells). Alternatively, the lysosome-to-cytosol concentration ratio for the non-
25
lysosomotropic GDA was low (near 1) and was not influenced by lysosomal pH. These
evaluations are consistent with differences in intracellular distribution of lysosomotropic
drugs due to differences in lysosomal pH having a significant impact on drug activity and
selectivity in cells.
NORMAL
low lysosomal pH
CANCER
elevated lysosomal pH
lyso
som
otr
op
ic
dru
g
non
-ly
soso
mo
tro
pic
dru
g
target target
targettarget
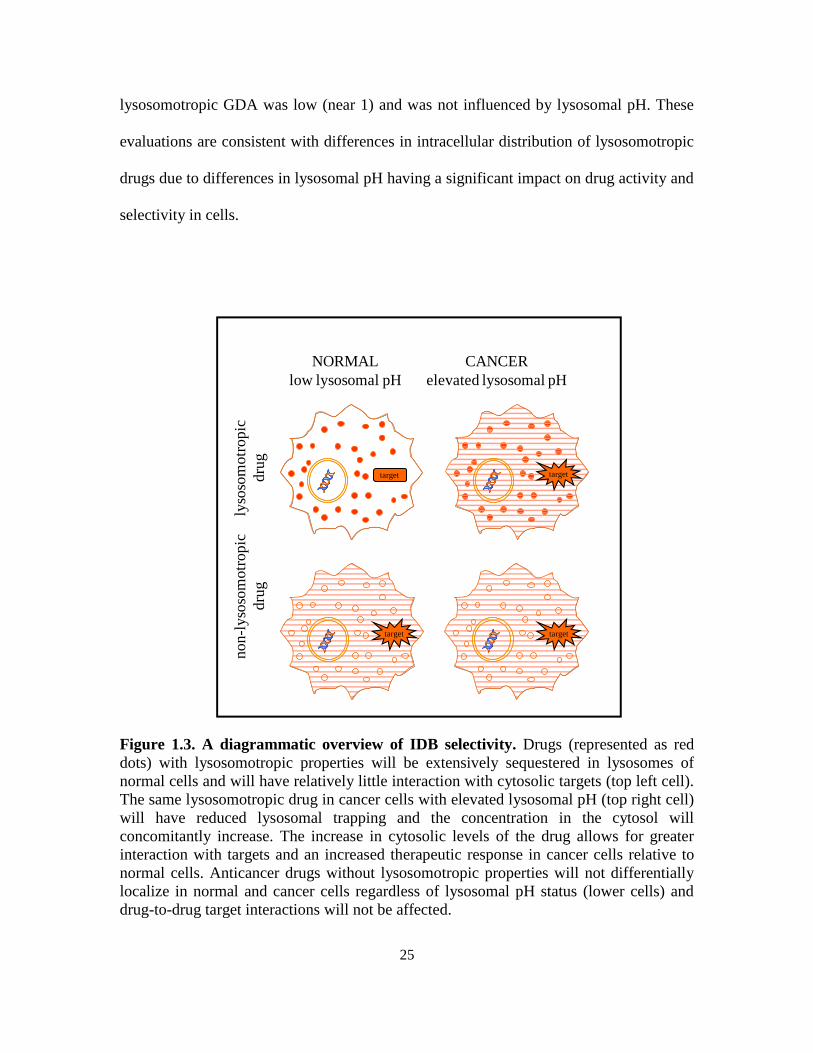
Figure 1.3. A diagrammatic overview of IDB selectivity. Drugs (represented as red
dots) with lysosomotropic properties will be extensively sequestered in lysosomes of
normal cells and will have relatively little interaction with cytosolic targets (top left cell).
The same lysosomotropic drug in cancer cells with elevated lysosomal pH (top right cell)
will have reduced lysosomal trapping and the concentration in the cytosol will
concomitantly increase. The increase in cytosolic levels of the drug allows for greater
interaction with targets and an increased therapeutic response in cancer cells relative to
normal cells. Anticancer drugs without lysosomotropic properties will not differentially
localize in normal and cancer cells regardless of lysosomal pH status (lower cells) and
drug-to-drug target interactions will not be affected.
26
The preliminary evaluations discussed above indicate that differences in
lysosomal pH between normal and cancer cells can have a profound influence on the
differential intracellular distribution of weakly basic anticancer drugs in normal versus
cancer cells, leading to profound differences in selectivity between the cell types. The
objective of this thesis, therefore, is to evaluate the applicability of IDB selectivity to a
broad spectrum of cancer cells, and whether optimizing physicochemical properties that
influence lysosomotropism can further enhance IDB selectivity. A further objective is to
determine whether lysosomal targeting of anticancer drugs concomitantly lowers
systemic toxicity. The successful completion of this work will provide a basis for the
rational design of anti-cancer agents with optimal physicochemical properties for
selectivity, and hopefully provide impetus for researchers to explore intracellular
targeting as a viable option to enhance selectivity.
27
1.7. References
1. Dutcher JP, Novik Y, O'Boyle K, Marcoullis G, Secco C, et al. (2000) 20th-century
advances in drug therapy in oncology--Part I. J Clin Pharmacol 40: 1007-1024.
2. Dutcher JP, Novik Y, O'Boyle K, Marcoullis G, Secco C, et al. (2000) 20th-century
advances in drug therapy in oncology--Part. II. J Clin Pharmacol 40: 1079-1092.
3. Petrak K (2005) Essential properties of drug-targeting delivery systems. Drug Discov
Today 10: 1667-1673.
4. Duvvuri M, Gong Y, Chatterji D, Krise JP (2004) Weak base permeability
characteristics influence the intracellular sequestration site in the multidrug-
resistant human leukemic cell line HL-60. J Biol Chem 279: 32367-32372.
5. Egorin MJ, Clawson RE, Cohen JL, Ross LA, Bachur NR (1980) Cytofluorescence
localization of anthracycline antibiotics. Cancer Res 40: 4669-4676.
6. Horobin RW (2002) Biological staining: mechanisms and theory. Biotechnic Histo 77:
3 - 13.
7. Bulychev A, Trouet A, Tulkens P (1978) Uptake and intracellular distribution of
neutral red in cultured fibroblasts. Expl Cell Res 115: 343-355.
8. de Duve C, de Barsy T, Trouet A, Tulkens P, van Hoof F (1974) Lysosomotropic
agents. Biochem Pharmacol 23: 2495 - 2531.
9. Kaufmann AM, Krise JP (2007) Lysosomal sequestration of amine-containing drugs:
Analysis and therapeutic implications. J Pharm Sci 96: 729-746.
10. Schindler M, Grabski S, Hoff E, Simon SM (1996) Defective pH regulation of acidic
compartments in human breast cancer cells (MCF-7) is normalized in adriamycin-
resistant cells (MCF-7adr). Biochemistry 35: 2811-2817.
28
11. Altan N, Chen Y, Schindler M, Simon SM (1998) Defective acidification in human
breast tumor cells and implications for chemotherapy. J Exp Med 187: 1583-
1598.
12. Gong Y, Duvvuri M, Krise JP (2003) Separate roles for the Golgi apparatus and
lysosomes in the sequestration of drugs in the multi-drug resistant human
leukemic cell line HL-60. J Biol Chem 278: 50234-50239
13. Kokkonen N, Rivinoja A, Kauppila A, Suokas M, Kellokumpu I, et al. (2004)
Defective acidification of intracellular organelles results in aberrant secretion of
cathepsin D in cancer cells. J Biol Chem 279: 39982-39988.
14. Sausville E, Johnson J, Cragg G, Decker S (2001) Cancer drug discovery and
development: New paradigms for a new millenium. In: Ojima I, Vite G, Altmann
K-H, editors. Anticancer agents: frontiers in cancer chemotherapy: ACS .pp 1-15.
15. Powis G, Hacker MP, editors (1991) The toxicity of anticancer drugs. New York:
Pergamon Press. 228 p.
16. DeVita VT, Jr., Chu E (2008) A History of cancer chemotherapy. Cancer Res 68:
8643-8653.
17. Boyle FT, Costello, GF (1998) Cancer therapy: A move to the molecular level. Chem
Soc Rev 27:251-261.
18. Shoemaker RH (2006) The NCI60 human tumour cell line anticancer drug screen.
Nat Rev Cancer 6: 813-823.
19. Pagé M, editor (2002) Tumor targeting in cancer therapy. Totowa, New Jersey:
Humana Press. 463 p.
29
20. Houshmand P, Zlotnik A (2003) Targeting tumor cells. Curr Opin in Cell Biol 15:
640-644.
21. Imai K, Takaoka A (2006) Comparing antibody and small-molecule therapies for
cancer. Nat Rev Cancer 6: 714-727.
22. Bauer DE, Hatzivassiliou G, Zhao FP, Andreadis C, Thompson CB (2005) ATP
citrate lyase is an important component of cell growth and transformation.
Oncogene 24: 6314-6322.
23. Jones RG, Thompson CB (2009) Tumor suppressors and cell metabolism: a recipe for
cancer growth. Gene Dev 23: 537-548.
24. Reske SN, Grillenberger KG, Glatting G, Port M, Hildebrandt M, et al. (1997)
Overexpression of glucose transporter 1 and increased FDG uptake in pancreatic
carcinoma. J Nucl Med 38: 1344-1348.
25. Greish K (2007) Enhanced permeability and retention of macromolecular drugs in
solid tumors: A royal gate for targeted anticancer nanomedicines. J Drug Target
15: 457-464.
26. Goode JaC, DJ, editor (2001) The Tumour Microenvironment: Causes and
Consequences of Hypoxia and Acidity. New York:John Wiley and Sons. p 303.
27. Jaracz S, Chen J, Kuznetsova LV, Ojima I (2005) Recent advances in tumor-targeting
anticancer drug conjugates. Bioorg Med Chem 13: 5043-5054.
28. Vastag B (2000) Folate gains momentum as a vehicle for drug delivery. J Natl Cancer
Inst 92: 1800-1801.
29. Maeda H (1992) The tumor blood vessel as an ideal target for macromolecular
anticancer agents. J Control Release 19: 315-324.
30
30. de Groot V (2007) Cancer - Small Molecules. In: Stella V, Borchardt R, Hageman M,
Oliyai R, Maag H et al., editors. Prodrugs: Challenges and Rewards Part I. New
York, NY: Springer. pp 279-506.
31. Denny WA (2001) Prodrug strategies in cancer therapy. Eur J Med Chem 36: 577-
595.
32. Brossart P, Stuhler G, Flad T, Stevanovic S, Rammensee H-G, et al. (1998) Her-
2/neu-derived peptides are tumor-associated antigens expressed by human renal
cell and colon carcinoma lines and are recognized by in vitro induced specific
cytotoxic T ymphocytes. Cancer Res 58: 732-736.
33. Bagshawe KD (1974) Tumour-Associated Antigens. Br Med Bull 30: 68-73.
34. Chari RVJ (1998) Targeted delivery of chemotherapeutics: tumor-activated prodrug
therapy. Adv Drug Deliver Rev 31: 89-104.
35. Saleh MN, Sugarman S, Murray J, Ostroff JB, Healey D, et al. (2000) Phase I Trial of
the anti–Lewis Y drug immunoconjugate BR96-doxorubicin in patients with
Lewis Y–expressing epithelial tumors. J Clin Oncol 18: 2282-2292.
36. Carter PJ, Senter PD (2008) Antibody-Drug Conjugates for Cancer Therapy. Cancer
J 14: 154-169 110.1097/PPO.1090b1013e318172d318704.
37. Jefferson E (2010) FDA: Pfizer Voluntarily Withdraws Cancer Treatment Mylotarg
from U.S. Market.
38. Weitman SD, Lark RH, Coney LR, Fort DW, Frasca V, et al. (1992) Distribution of
the folate receptor GP38 in normal and malignant cell lines and tissues. Cancer
Res 52: 3396-3401.
31
39. Choi S-W, Mason JB (2000) Folate and carcinogenesis: An integrated scheme1-3. J
Nutr 130: 129-132.
40. Sudimack J, Lee RJ (2000) Targeted drug delivery via the folate receptor. Adv Drug
Deliver Rev 41: 147-162.
41. Yang R, Kolb EA, Qin J, Chou A, Sowers R, et al. (2007) The folate receptor is
frequently overexpressed in osteosarcoma samples and plays a role in the uptake
of the physiologic substrate 5-Methyltetrahydrofolate. Clin Cancer Res 13: 2557-
2567.
42. Leamon CP, Reddy JA (2004) Folate-targeted chemotherapy. Adv Drug Deliver Rev
56: 1127-1141.
43. Lee JW, Lu JY, Low PS, Fuchs PL (2002) Synthesis and evaluation of taxol-folic
acid conjugates as targeted antineoplastics. Bioorg Med Chem 10: 2397-2414.
44. Mező G, Manea M (2010) Receptor-mediated tumor targeting based on peptide
hormones. Expert Opin Drug Del 7: 79-96.
45. Schally A, Nagy A (1999) Cancer chemotherapy based on targeting of cytotoxic
peptide conjugates to their receptors on tumors. Eur J Endocrinol 141: 1-14.
46. Orlando C, Raggi C, Bianchi S, Distante V, Simi L, et al. (2004) Measurement of
somatostatin receptor subtype 2 mRNA in breast cancer and corresponding
normal tissue. Endocr Relat Cancer 11: 323-332.
47. Sun L-C, Luo J, Mackey LV, Fuselier JA, Coy DH (2007) A conjugate of
camptothecin and a somatostatin analog against prostate cancer cell invasion via a
possible signaling pathway involving PI3K/Akt, αVβ3/αVβ35 and MMP-2/-9.
Cancer Letters 246: 157-166.
32
48. Nagy A, Schally AV, Halmos Gb, Armatis P, Cai R-Z, et al. (1998) Synthesis and
biological evaluation of cytotoxic analogs of somatostatin containing doxorubicin
or its intensely potent derivative, 2-pyrrolinodoxorubicin. P Natl Acad Sci USA
95: 1794-1799.
49. Yates C, Wells A, Turner T (2005) Luteinising hormone-releasing hormone analogue
reverses the cell adhesion profile of EGFR overexpressing DU-145 human
prostate carcinoma subline. Br J Cancer 92: 366-375.
50. Janaky T, Juhasz A, Bajusz S, Csernus V, Srkalovic G, et al. (1992) Analogues of
luteinizing hormone-releasing hormone containing cytotoxic groups. P Natl Acad
Sci USA 89: 972-976.
51. Fleischmann A, Waser B, Reubi JC (2007) Overexpression of gastrin-releasing
peptide receptors in tumor-associated blood vessels of human ovarian neoplasms.
Cellular Oncol 29: 421-433.
52. Rogers BE, Bigott HM, McCarthy DW, Manna DD, Kim J, et al. (2003) MicroPET
Imaging of a Gastrin-Releasing Peptide Receptor-Positive Tumor in a Mouse
Model of Human Prostate Cancer Using a 64Cu-Labeled Bombesin Analogue.
Bioconjugate Chem 14: 756-763.
53. Shadidi M, Sioud M (2003) Selective targeting of cancer cells using synthetic
peptides. Drug Resist Update 6: 363-371.
54. Rose DP, Connolly JM, Rayburn J, Coleman M (1995) Influence of diets containing
eicosapentaenoic or docosahexaenoic acid on growth and metastasis of breast
cancer cells in nude mice. J Natl Cancer Inst 87: 587-592.
33
55. Sauer LA, Dauchy RT (1992) Uptake of plasma lipids by tissue-isolated hepatomas
7288CTC and 7777 in vivo. Br J Cancer 66: 290-296.
56. Bradley MO, Webb NL, Anthony FH, Devanesan P, Witman PA, et al. (2001) Tumor
targeting by covalent conjugation of a natural fatty acid to paclitaxel. Clin Cancer
Res 7: 3229-3238.
57. Kuznetsova L, Chen J, Sun L, Wu X, Pepe A, et al. (2006) Syntheses and evaluation
of novel fatty acid-second-generation taxoid conjugates as promising anticancer
agents. Bioorg Med Chem Letters 16: 974-977.
58. Fraser JRE, Laurent TC, Laurent UBG (1997) Hyaluronan: its nature, distribution,
functions and turnover. J Intern Med 242: 27-33.
59. Toole BP, Hascall VC (2002) Hyaluronan and tumor growth. Am J Pathol 161: 745-
747.
60. Zhang L, Underhill CB, Chen L (1995) Hyaluronan on the surface of tumor cells is
correlated with metastatic behavior. Cancer Res 55: 428-433.
61. McCormick BA, Zetter BR (1992) Adhesive interactions in angiogenesis and
metastatasis. Pharmacol Ther 53: 239-260.
62. Griffioen AW, Horst E, Heider KH, Wielenga VJM, Adolf GR, et al. (1994)
Expression of CD44 splice variants during lymphocyte activation and tumor
progression. Cell Commun Adhes 2: 195-200.
63. Wang C, Thor AD, Moore DH, Zhao Y, Kerschmann R, et al. (1998) The
overexpression of RHAMM, a hyaluronan-binding protein that regulates ras
signaling, correlates with overexpression of mitogen-activated protein kinase and
34
is a significant parameter in breast cancer progression. Clin Cancer Res 4: 567-
576.
64. Luo Y, Bernshaw NJ, Lu Z-R, Kopecek J, Prestwich GD (2002) Targeted delivery of
doxorubicin by HPMA copolymer-hyaluronan bioconjugates. Pharm Res 19: 396-
402.
65. Luo Y, Prestwich GD (1999) Synthesis and selective cytotoxicity of a hyaluronic
acid−antitumor bioconjugate. Bioconjugate Chem 10: 755-763.
66. Coradini D, Pellizzaro C, Miglierini G, Daidone MG, Perbellini A (1999) Hyaluronic
acid as drug delivery for sodium butyrate: Improvement of the anti-proliferative
activity on a breast-cancer cell line. Int J Cancer 81: 411-416.
67. Tannock IF, Rotin D (1989) Acid pH in tumors and its potential for therapeutic
exploitation. Cancer Res 49: 4373-4384.
68. Tomlinson R, Heller J, Brocchini S, Duncan R (2003) Polyacetal−doxorubicin
conjugates designed for pH-dependent degradation. Bioconjugate Chem 14: 1096-
1106.
69. Stetler-Stevenson WG, Liotta LA, Kleiner DE, Jr. (1993) Extracellular matrix 6: role
of matrix metalloproteinases in tumor invasion and metastasis. FASEB J 7: 1434-
1441.
70. Jain RK (2005) Normalization of tumor vasculature: An emerging concept in
antiangiogenic therapy. Science 307: 58-62.
71. Lal BK, Varma S, Pappas PJ, Hobson RW, Durán WN (2001) VEGF Increases
permeability of the endothelial cell monolayer by activation of PKB/akt,
35
endothelial Nitric-Oxide synthase, and MAP kinase pathways. Microvasc Res 62:
252-262.
72. Sirois MG, Edelman ER (1997) VEGF effect on vascular permeability is mediated by
synthesis of platelet-activating factor. Am J Physiol Heart Circ Physiol 272:
H2746-2756.
73. Petros RA, DeSimone JM (2010) Strategies in the design of nanoparticles for
therapeutic applications. Nat Rev Drug Discov 9: 615-627.
74. Eberhard A, Kahlert S, Goede V, Hemmerlein B, Plate KH, et al. (2000)
Heterogeneity of angiogenesis and blood vessel maturation in human tumors:
Implications for antiangiogenic tumor therapies. Cancer Res 60: 1388-1393.
75. Sarin H (2010) Physiologic upper limits of pore size of different blood capillary types
and another perspective on the dual pore theory of microvascular permeability. J
Angiogen Res 2: 14.
76. Gabizon A, Goren D, Horowitz AT, Tzemach D, Lossos A, et al. (1997) Long-
circulating liposomes for drug delivery in cancer therapy: a review of
biodistribution studies in tumor-bearing animals. Adv Drug Deliver Rev 24: 337-
344.
77. Nori A, Kopecek J (2005) Intracellular targeting of polymer-bound drugs for cancer
chemotherapy. Adv Drug Deliver Rev 57: 609-636.
78. Stella VJ, Himmelstein KJ (1980) Prodrugs and site-specific drug delivery. J Med
Chem 23: 1275-1282.
36
79. Ngen EJ, Rajaputra P, You Y (2009) Evaluation of delocalized lipophilic cationic
dyes as delivery vehicles for photosensitizers to mitochondria. Bioorg Med Chem
17: 6631-6640.
80. Ciocca DR, Clark GM, Tandon AK, Fuqua SAW, Welch WJ, et al. (1993) Heat shock
protein hsp70 in patients with axillary lymph node-negative breast cancer:
prognostic implications. J Natl Cancer Inst 85: 570-574.
81. Stebbins CE, Russo AA, Schneider C, Rosen N, Hartl FU, et al. (1997) Crystal
structure of an Hsp90-geldanamycin complex: targeting of a protein chaperone by
an antitumor agent. Cell 89: 239-250.
82. Jordan MA, Wilson L (2004) Microtubules as a target for anticancer drugs. Nat Rev
Cancer 4: 253-265.
83. Issa J-PJ (2007) DNA methylation as a therapeutic target in cancer. Clin Cancer Res
13: 1634-1637.
84. Hurley LH (2002) DNA and its associated processes as targets for cancer therapy. Nat
Rev Cancer 2: 188-200.
85. Fortune JM, Velea L, Graves DE, Utsugi T, Yamada Y, et al. (1999) DNA
topoisomerases as targets for the anticancer drug TAS-103: DNA interactions and
topoisomerase aatalytic inhibition Biochemistry 38: 15580-15586.
86. Nitiss J, Wang JC (1988) DNA topoisomerase-targeting antitumor drugs can be
studied in yeast. P Natl Acad Sci USA 85: 7501-7505.
87. Duvvuri M, Konkar S, Funk RS, Krise JM, Krise JP (2005) A chemical strategy to
manipulate the intracellular localization of drugs in resistant cancer
cells Biochemistry 44: 15743-15749.
37
88. Duvvuri M, Konkar S, Hong KH, Blagg BSJ, Krise JP (2006) A new approach for
enhancing differential selectivity of drugs to cancer Cells. ACS Chem Biol 1:
309-315.
89. Duvvuri M, Krise JP (2005) A novel assay reveals that weakly basic model
compounds concentrate in lysosomes to an extent greater than pH-partitioning
theory would predict. Mol Pharma 2: 440-448.
90. Yang WCT, Strasser FF, Pomerat CM (1965) Mechanism of drug-induced
vacuolization in tissue culture. Expl Cell Res 38: 495-506.
91. Tonini R, Grohovaz F, Laporta CAM, Mazzanti M (1999) Gating mechanism of the
nuclear pore complex channel in isolated neonatal and adult mouse liver nuclei.
FASEB J 13: 1395-1403.
92. Weisz OA (2003) Organelle acidification and disease. Traffic 4: 57-64.
93. Toei M, Saum R, Forgac M (2007) Regulation and isoform function of the V-
ATPases. Biochemistry 49: 4715-4723.
94. Lafourcade Cl, Sobo K, Kieffer-Jaquinod S, Garin Jr, van der Goot FG (2008)
Regulation of the V-ATPase along the endocytic pathway occurs through
reversible subunit association and membrane localization. PLoS ONE 3: e2758.
95. Jiang LW, Maher VM, McCormick JJ, Schindler M (1990) Alkalinization of the
lysosomes is correlated with ras transformation of murine and human fibroblasts.
J Biol Chem 265: 4775-4777.
96. Straight SW, Herman B, McCance DJ (1995) The E5 oncoprotein of human
papillomavirus type 16 inhibits the acidification of endosomes in human
keratinocytes. J Virol 69: 3185-3192.
38
Chapter 2: The prevalence and mechanism of defective acidification in cancer cells.
39
2.1. Introduction
The IDB drug targeting approach that was introduced in Chapter 1 relies on
differences in the intracellular distribution of weakly basic anticancer drugs in normal
versus cancer cells to enhance selectivity. As discussed, these alterations in intracellular
distribution of weakly basic drugs in normal versus cancer cells arise from differences in
lysosomal-to-cytosol pH gradients that can exist between normal and cancer cells. While
normal cells typically have a low lysosomal pH, some cancer cells have been shown to
have defective lysosomal acidification [1,2,3,4], leading to differences in lysosome-to-
cytosol pH gradients between the cell types. In cancer cells with elevated lysosomal pH,
the reduced lysosome-to-cytosol pH gradient reduces the degree of lysosomal trapping of
weakly basic drugs. As a result, drug interaction with extralysosomal targets is enhanced
in cancer cells relative to normal cells, leading to enhanced activity in cancer cells and
providing an intracellular drug distribution based (IDB) selectivity.
Since the changes in intracellular distribution of weak bases between normal and
cancer cells rely on differences in lysosomal pH, the successful enhancement of
selectivity through IDB targeting can only be achieved for cancer cells with defectively
acidified lysosomes. Considering this significant limitation, it is important to establish the
prevalence of defective acidification in cancer cells as well as to understand the
mechanism leading to defective lysosomal acidification. In preliminary evaluations of
IDB selectivity, our results showed that even small changes in lysosomal pH (~0.5 pH
units) could significantly increase the IDB selectivity of a drug with optimal
lysosomotropic properties [5]. Therefore, a major focus of the work described in this
chapter was to develop a lysosome pH-determination assay that is highly sensitive to
40
small differences in lysosomal pH between normal and cancer cells in order to identify
the extent to which the principles of IDB selectivity could potentially be applied.
Although there are a number of reports of defective lysosomal acidification, it is
not clear whether this phenomenon is typical of all cancer types, or whether it is a
preserve of a few cancers. Defective lysosomal acidification has been reported for MCF-
7 (breast adenocarcinoma, [6]); CaCo-2 (colorectal adenocarcinoma [1]); HL-60
(leukemia [3]) cancer cells, and in ras-transformed fibroblasts [2], which represent only a
small fraction of cancer types. Thus far a systematic comparison of lysosomal pH
between normal and cancer cells has not been carried out. Our studies aimed to evaluate
lysosomal pH in normal and cancer cells to first of all define what constitutes a normal
lysosomal pH, since a wide range of values have been reported in the literature. Based on
this, we can determine the scope of cancer cells that will be candidates for IDB
selectivity.
It is important to understand the molecular mechanism underlying defective
lysosomal acidification, first and foremost to ensure that this phenomenon is not
artifactual, for example due to cell culturing conditions. Studies on defective lysosomal
acidification to date have been inconclusive with regard to the mechanism and/or cause
of defective acidification of cancer. While some reports postulate that defective
acidification may be a prerequisite for transformation [7], other reports suggest that
defective acidification is a consequence of transformation [8].
In other studies, metastatic cancer cells were shown to express V-ATPase at the
plasma membrane [9], an unusual occurrence because V-ATPases are typically localized
in endocytic organelles, where they function to acidify luminal pH. It is possible that
41
tumors growing in an acidic environment, which is caused by anaerobic respiration and
build-up of lactic acid [10], may re-localize V-ATPases to the plasma membrane from
endocytic organelles to maintain the neutral pH of the cytosol by extruding protons into
the extracellular space. It has also been proposed that metastatic tumor cells purposefully
recruit V-ATPases to the plasma membrane to acidify the extracellular environment so as
to aid in metastasis and invasion [11]. Interestingly, in drug sensitive cancer cells
characterized as having defective lysosomal acidification, lysosomal acidity is often
restored in multi-drug resistant variants [4]. This scenario may contribute to drug
resistance by enhancing the lysosomal sequestration of weakly basic anticancer drugs.
In our investigations, we wanted to evaluate the influence of transformation on
the lysosomal pH of a normal, primary cell. Primary cells, unlike established cell lines,
are capable of limited cycles of cell division and are often obtained with limited passage
numbers. If transformation has an effect on lysosomal pH, this would rule out the
possibility that defective acidification is caused by artifactual factors unrelated to the
process of a cell becoming a cancer cell. To investigate whether transformation
influences lysosomal pH, we transformed RPTE cells with the simian vacuolating virus
40 large T antigen (SV40 LT), which is a DNA tumor virus [12] well known to induce
transformation of cells in vitro [13,14], and evaluated lysosomal pH before and after
transformation. Since lysosomal acidification is known to be regulated primarily by the
V-ATPase [15,16] we also evaluated the expression of V-ATPase subunit E1 in normal
RPTE cells, and after transformation with SV40.
While all the normal cells evaluated had a lysosomal pH centered around 4, the
cancer cells exhibited a range of pH values, from values similar to that of normal cells, to
42
significantly elevated pH values. Many of the cell lines evaluated had lysosomal pH that
would make them candidates for IDB selectivity (i.e., 0.5 pH units greater than lysosomal
pH of normal cells). The transformation study showed that normal primary cells
transformed with SV40-LT experience a disruption of lysosomal acidification, which is
accompanied by changes in V-ATPase expression.
These results ascertain that defective acidification occurs due to the process of
transformation, and that the change in pH is mediated by the V-ATPase, as we might
expect. In addition, we found that though not all cancer cells exhibit defective lysosomal
acidification, a number of them have sufficiently elevated lysosomal pH to be candidates
for IDB selectivity.
2.2. Materials and Methods
2.2.1. Cell culture
HL-60 cells were previously obtained from Dr Yueshang Zhang (formerly of
Arizona Cancer Center), and were propagated in RPMI media to which 10% BCS,
sodium bicarbonate, sodium pyruvate and HEPES buffer were added. Renal proximal
tubule epithelial (RPTE) cells were obtained from Lonza USA, and were maintained in
DMEM/F12 media supplemented with 10 ng/mL epidermal growth factor, insulin-
transferrin-selenium solution (Sigma) and 10% fetal bovine serum. Peripheral blood
monocytes were isolated using density centrifugation. Briefly, 10 mL of venous blood
was collected into an acid citrate dextrose tube by an experienced phlebotomist and
immediately transported to the laboratory. The blood was mixed with 50 µL/mL of
RosetteSep Human B cell enrichment cocktail (Stem Cell Technologies, Vancouver,
43
Canada), and incubated for 20 min at room temperature. The sample was diluted with an
equal volume (10 mL) of PBS containing 2% FBS and mixed gently. It was then layered
on 15mL of Ficoll-Paque density medium (Stem Cell Technologies, Vancouver, Canada)
and centrifuged at 1200g for 20 min. The enriched B-cells were collected from the
interphase between plasma and red blood cells. A pipette was used to draw out the
plasma layer, and the B-cell fraction collected into a 15 mL centrifuge tube, washed twice
with PBS + 2%FBS solution and incubated at 37°C, 5% CO2 incubator. All other cell
lines were obtained from the American Type Culture Collection (Manassas, VA), and
were maintained and propagated as recommended by the manufacturer.
2.2.2. Anti-bodies and reagents
Unless otherwise noted, reagents were obtained from Sigma (St. Louis, MO).
Mouse anti-LAMP-1 was obtained from Developmental Studies Hybridoma (University
of Iowa), mouse anti-SV40 LT from Santa Cruz Biotechnology (Santa Cruz, CA) and
HRP-conjugated goat anti-mouse IgG from Sigma. Alexa Fluor 647 conjugated mouse
IgG, Oreqon Green dextran (10,000MW) and lysine-fixable fluorescein dextran
(10,000MW) were from Invitrogen (Carlsbad, CA).
2.2.3 Immunofluorescence
Coverslips were sterilized by rinsing with 90% ethanol, followed by exposure to
UV light for 1 h, and then placed into the wells of a 6-well cell culture plate. Normal skin
fibroblasts were seeded onto the coverslips in at a density of 2X10⁵
cells per well. Cells
were allowed to adhere overnight, after which they were labeled with 1 mg/mL lysine-
44
fixable fluorescein dextran for 2 h, followed by incubation in dextran-free media (chase)
for various time periods (0, 3, 6, 9 hrs). At the end of the respective chase periods, cells
were rinsed X2 with PBS, fixed with freshly made 4% paraformaldehyde in PBS and
permeabilized with 0.05% saponin. Primary and secondary antibody solutions were made
in 0.05% saponin and 10% FBS in PBS. Cells were labeled for 2 h with a 1:100 dilution
of mouse anti-LAMP-1. Subsequent to incubation with primary antibody, the cells were
rinsed x3 with PBS, followed by labeling for 1 h with a 1:1000 Alexa Fluor 647
conjugated anti-mouse IgG. Cells were washed x3 with PBS, coverslips inverted onto a
microscope slide and sealed with wax. Cells were imaged through the appropriate filter
sets to visualize Oregon Green and Alexa Fluor 647 (fluorescein and Cy5 filters,
respectively) mounted on a Nikon 80i epifluorescence microscope equipped with a
Hamamatsu Orca ER digital camera. Images were processed using Metamorph software
version 7 from Universal Imaging Corp (Downington, PA).
2.2.4. Lysosomal pH assay
A ratiometric fluorescence technique to determine lysosomal pH has been
described previously [2,3,17], which we modified for lysosomal pH evaluations. The pH
dependence of the Oregon Green spectrum was determined by dissolving 1µg/ mL of
Oregon Green dextran into buffers of consisting of 150 mM NaCl, 20 mM Mes, 5 mM
KCl, and 1 mM MgSO4, and adjusted to pH 4, 5, 6, 6.5 and 7, respectively using 1N
NaOH. The fluorophore solution (500 µL) was pipetted into respective wells of an 8-well
cell culture slide (Becton Dickinson, Franklin Lakes, NJ) and excitation spectra recorded
from 425 to 510 nm wavelengths through a 525/10 nm band pass emission filter using a
45
microscope adapted Ratiomaster spectrofluorimeter (PTI, Trenton, NJ). The Ratiomaster
spectrofluorimeter was equipped with a photomultiplier tube detector, Xenon excitation
light source and monochromator to select excitation wavelengths. To evaluate the
concentration dependence of the Oregon Green excitation spectrum, various amounts of
the fluorophore were dissolved in pH 7 (composition described above) buffer to yield
concentrations of 0.2, 0.4, 0.6 and 0.8 µg/mL and excitation spectra recorded as
described.
To determine lysosomal pH of cells, adherent cell types were plated at a density
of 50,000 cells per well of an 8-well cell culture slide and allowed to adhere overnight.
Cells were pulsed with 1 mg/mL Oregon Green dextran for 2 h, followed by a 6 h chase
in dextran-free media. At the end of the chase period, the cells were washed with a buffer
consisting of 150 mM NaCl, 20 mM Mes, 5 mM KCl, and 1 mM MgSO4, pH 7.4.
Suspension cells were centrifuged after labeling, washed and resuspended in buffer to a
final concentration of 5-10x106
cells/mL. Twenty µL of cell suspension was pipetted onto
a microscope slide and sealed with a coverslip prior to lysosomal pH determinations. The
emission intensity ratio of Oregon Green excited at 495 and 450 nm was measured
through a 525/10 nm band pass filter using a microscope adapted Ratiomaster
spectrofluorimeter (PTI, Trenton, NJ), equipped with a photomultiplier tube detector,
Xenon excitation source coupled to a monochromator to select excitation wavelengths.
Emission wavelengths were selected through the use of a FITC filter. Due to the
sensitivity of the PMT, it was necessary to protect samples from all ambient light (i.e.,
from computer monitors or overhead lights) by covering the microscope completely, in
order to increase the signal/noise ratio. The ratios of Oregon Green emission (525 nm)
46
intensity at the two excitation-wavelength (495/450) ratios were calculated concurrently
with the intensity measurements using the ratio function of the Felix software (PTI -
Trenton, NJ). To create a calibration curve for pH determination cells were incubated in
pH 4 - 7 buffers respectively containing the ionophores nigericin (10 μM) and monensin
(20 μM), which equilibrate intracellular pH with buffer pH [10]. Curves were fit to a
linear equation, which was used to determine lysosomal pH of the test cells.
2.2.5. Expression of SV40-LT in RPTEC cells
Expression of SV40-LT in RPTE cells was performed as previously described
[14,18] A retroviral vector plasmid encoding the sequence for SV40 LT,
pBABEpuroSV40LT (with ampicillin and puromycin selection markers) transformed into
Escherichia coli, was obtained from the Addgene plasmid repository (Cambridge, MA)
as a bacterial stab. Bacteria were plated on a Luria Bertani (LB) agar (10 g NaCl, 10 g
peptone, 5 g yeast extract and 15 g agar) plate containing 100 µg/mL ampicillin. A single
E.coli colony was picked out and grown in 5 mL broth containing 100 µg/mL ampicillin
for approximately 16 h. When the OD600 of the bacterial suspension was between 0.2 and
0.6, the 5 mL bacterial suspension was scaled up to 100 mL broth in an autoclaved 250
mL Erlenmeyer tube, and grown a further 16 h. Plasmid DNA was extracted using the
Wizard® Plus Midi Prep Kit (Promega, Madison, WI). Quantification and evaluation of
purity was done using A260/A280 measurements using a Shimadzu BioMini
spectrophotometer. SV40LT retroviruses were produced by co-transfecting the pBABE-
SV40LT plasmid with a replication incompetent packaging virus plasmid, pCL-Ampho
(Imgenex, San Diego, CA) into HEK 293T cells. On the day before transfection of HEK
47
293T cells, 1x 10⁶
cells were plated in a 6 cm Costar cell culture plate (Fisher Scientific,
Pittsburg, PA). DNA (1 µg SV40 + 1 µg pCL-Ampho) was transfected into the cells
using the Fugene-6 transfection reagent (Roche, Indianapolis, IN), according to the
manufacturer‘s instructions. Total DNA to Fugene-6 ratio was 2:6. The DNA complexes
were maintained on the cells overnight, and 18 h post-transfection the media containing
the DNA complexes was removed and replaced with fresh media (DMEM + 10% FBS).
Twenty four hours later, the supernatant (containing retroviruses) was harvested from the
HEK 293T cells, and the media replaced. A second harvest of viral particles was done
after an additional 24 h. The two viral harvests were either stored at -80°C until use, or
added to RPTE cells right after harvesting. RPTE cells to be infected with SV40 particles
were plated the day prior to infection with viral particles to allow for adherence. On the
day of infection, the media was removed from the RPTE cells and replaced with the viral
supernatant harvested from HEK 293T cells, in the presence of hexadimethrine bromide
(polybrene). The viral particles were incubated on the RPTE cells overnight. An
additional overnight infection of RPTE cells was carried out with the second viral
harvest, and the media changed to growth media. The RPTE cells were allowed to
express the SV40 LT protein for 24 h, after which they were split into medium containing
2 µg/mL puromycin for selection of transfected cells. The cells were maintained in
puromycin until all control (non-transfected) cells died. Western blotting was then carried
to evaluate expression of SV40 LT. The puromycin concentration with which to select
efficiently transduced cells was determined by creating a kill curve whereby RPTE cells
were passaged in various concentrations of puromycin ranging from 0 to 10 µg/mL. The
48
lowest concentration of puromycin that killed all control cells within 14 days was used to
select transduced cells.
2.2.6. Western blotting
The expression of SV40LT in virally infected RPTE cells was evaluated using a
western dot blot procedure, as described elsewhere [3]. To prepare cell lysates, one 75
cm2 flask of RPTE cells, and one flask of RPTE cells transfected with SV40 (henceforth
designated RPTE-SV40) were trypsinized, washed x3 with PBS and re-suspended in 1
mL of a hypotonic buffer consisting of 15 mM potassium chloride, 1.5 mM magnesium
acetate, 1 mM dithiothreitol, 10 mM Hepes (pH 7.4), to which 0.1 mM PMSF, 0.5 µg/mL
DNAse and 1 µg each of aprotinin, leupeptin and pepstatin was added. Cell were allowed
to swell on ice for 15 min, then homogenized with 20 strokes of a dounce homogenizer
(pestle B). To the homogenate was added 0.2 mL of hypertonic buffer consisting of 375
mM potassium chloride, 22.5 mM magnesium acetate, 220 mM Hepes (pH 7.4) and 1
mM dithiothreitol. The lysate was vortexed briefly and centrifuged at 1000 x g on an
Eppendorf benchtop microcentrifuge to pellet nuclei and cell debris. Ten µL of the
resulting supernatant was pipetted onto a nitrocellulose membrane, which was directly
placed into a blocking solution composed of 5% non-fat dry milk in tris-buffered saline
(TBS), pH 7.4 + 1% tween (TBS-T). After blocking overnight, the membrane was
washed with TBS-T and probed with mouse anti-SV40 primary antibody, followed by a
goat-anti-mouse horseradish peroxidase-conjugated secondary antibody. The expression
of V-ATPase subunit V1E1 in RPTE and RPTE-SV40 cells was evaluated by western
blotting following SDS-PAGE. The protein concentration of cell lysates prepared as
49
outlined above was determined using the BCA assay. Twenty µg of protein was loaded
and resolved on a 9% SDS-gel and transferred onto a 0.45 µm nitrocellulose membrane
for 1 h at 100V. After blocking as described above, the membrane was probed with
antibodies to SV40 and actin (control) followed by a goat-anti-mouse HRP-conjugated
secondary. The protein dots or bands were detected with enhanced chemiluminescence
(ECL) reagents, visualized by exposure to Kodak film.
2.3. Results
2.3.1. Time dependent localization of dextran in lysosomes
In order to identify small changes in lysosomal pH between cell types, it was
necessary to further optimize previously described approaches to measure lysosomal pH
so as to develop an assay that was sensitive and reproducible. We first evaluated the
minimum amount of time required for endocytosed fluorescent dextran to traverse the
endocytic pathway and localize specifically in lysosomes. Previous protocols in our lab
[3] and elsewhere [17] employed a 24 h chase period to localize dextran into terminal
lysosomes. However, we have since shown that at 24 h, a significant portion of
intracellular dextran was released into cell culture medium [19], which could reduce the
of sensitivity the assay.
The time dependent localization of fluorescent 10,000MW dextran in lysosomes
was determined by evaluating the colocalization of dextran and lysosomes at various time
points. To do this, we evaluated the time required for endocytosed dextran to co-localize
specifically with the lysosome associated membrane protein-1 (LAMP-1), which is a well
studied lysosomal marker [10]. After 3 h of chase, most of the endocytosed dextran was
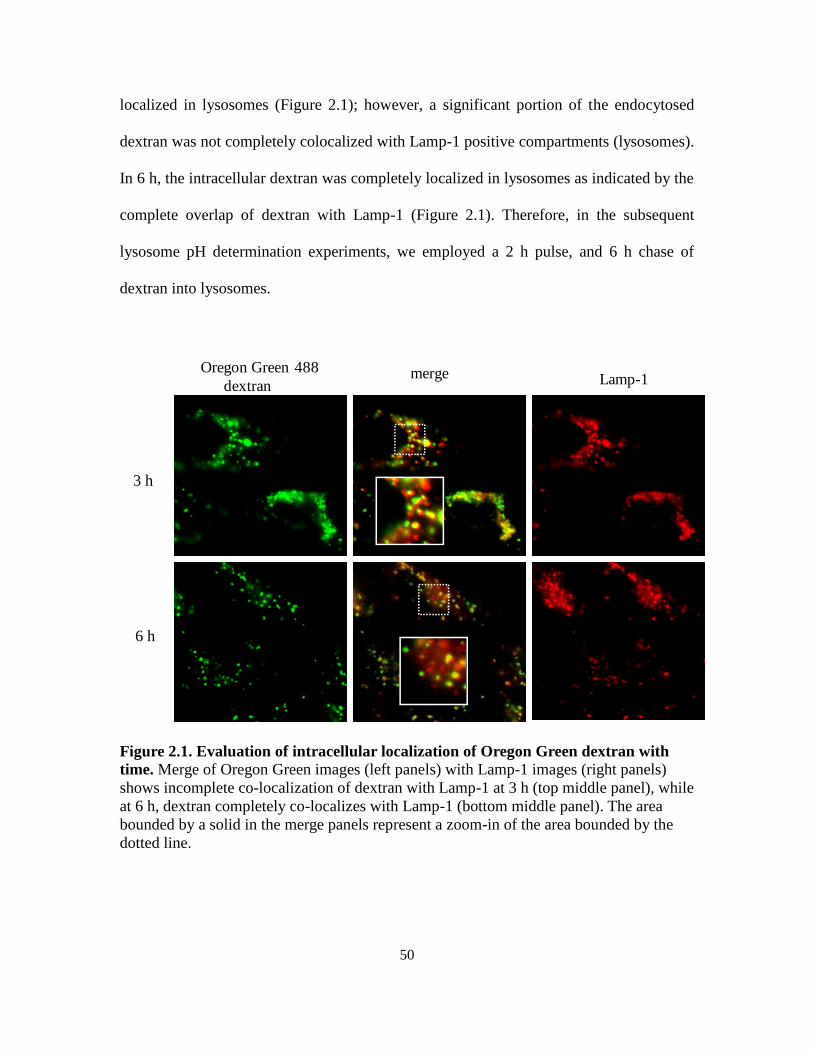
50
localized in lysosomes (Figure 2.1); however, a significant portion of the endocytosed
dextran was not completely colocalized with Lamp-1 positive compartments (lysosomes).
In 6 h, the intracellular dextran was completely localized in lysosomes as indicated by the
complete overlap of dextran with Lamp-1 (Figure 2.1). Therefore, in the subsequent
lysosome pH determination experiments, we employed a 2 h pulse, and 6 h chase of
dextran into lysosomes.
3 h
Oregon Green 488
dextranmerge Lamp-1
Figure 2.1. Evaluation of intracellular localization of Oregon Green dextran with
time. Merge of Oregon Green images (left panels) with Lamp-1 images (right panels)
shows incomplete co-localization of dextran with Lamp-1 at 3 h (top middle panel), while
at 6 h, dextran completely co-localizes with Lamp-1 (bottom middle panel). The area
bounded by a solid in the merge panels represent a zoom-in of the area bounded by the
dotted line.
3 h
6 h
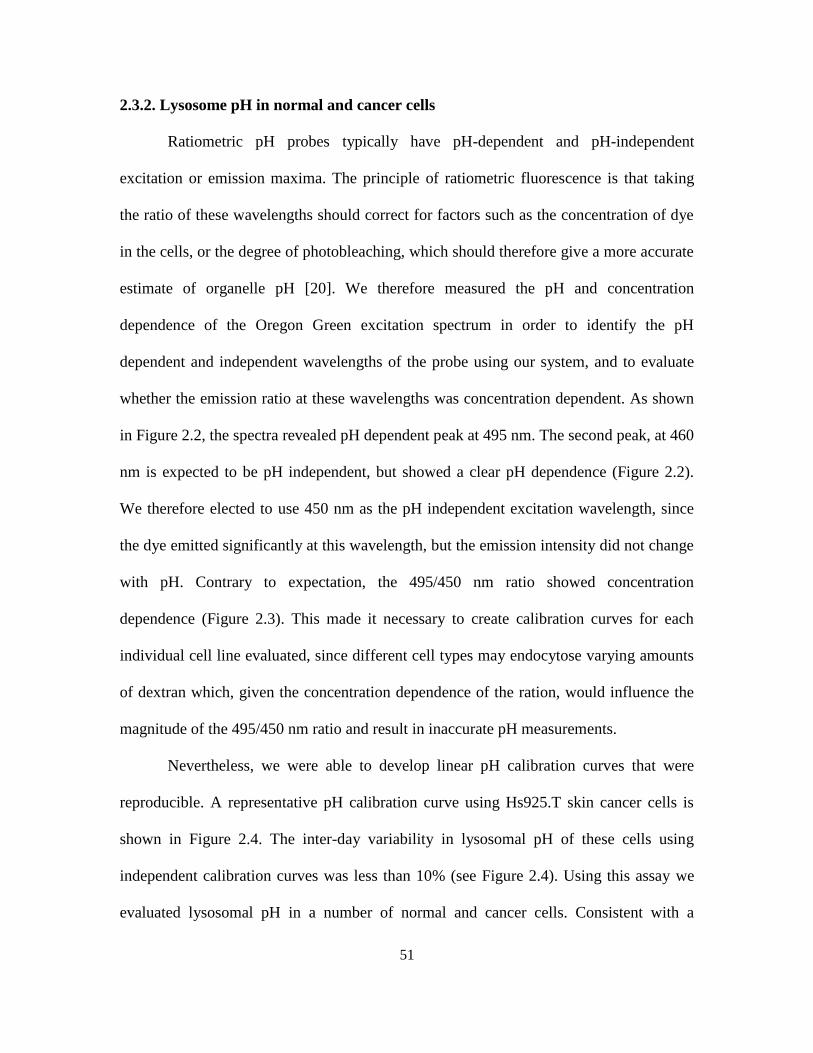
51
2.3.2. Lysosome pH in normal and cancer cells
Ratiometric pH probes typically have pH-dependent and pH-independent
excitation or emission maxima. The principle of ratiometric fluorescence is that taking
the ratio of these wavelengths should correct for factors such as the concentration of dye
in the cells, or the degree of photobleaching, which should therefore give a more accurate
estimate of organelle pH [20]. We therefore measured the pH and concentration
dependence of the Oregon Green excitation spectrum in order to identify the pH
dependent and independent wavelengths of the probe using our system, and to evaluate
whether the emission ratio at these wavelengths was concentration dependent. As shown
in Figure 2.2, the spectra revealed pH dependent peak at 495 nm. The second peak, at 460
nm is expected to be pH independent, but showed a clear pH dependence (Figure 2.2).
We therefore elected to use 450 nm as the pH independent excitation wavelength, since
the dye emitted significantly at this wavelength, but the emission intensity did not change
with pH. Contrary to expectation, the 495/450 nm ratio showed concentration
dependence (Figure 2.3). This made it necessary to create calibration curves for each
individual cell line evaluated, since different cell types may endocytose varying amounts
of dextran which, given the concentration dependence of the ration, would influence the
magnitude of the 495/450 nm ratio and result in inaccurate pH measurements.
Nevertheless, we were able to develop linear pH calibration curves that were
reproducible. A representative pH calibration curve using Hs925.T skin cancer cells is
shown in Figure 2.4. The inter-day variability in lysosomal pH of these cells using
independent calibration curves was less than 10% (see Figure 2.4). Using this assay we
evaluated lysosomal pH in a number of normal and cancer cells. Consistent with a
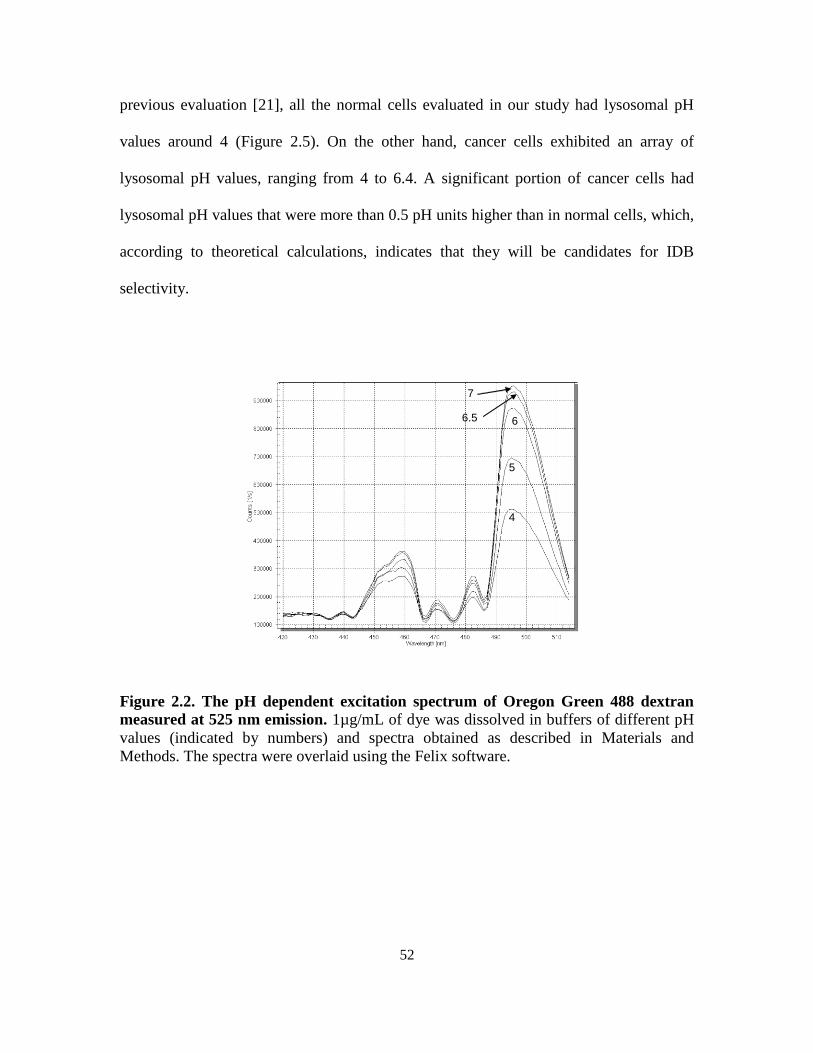
52
previous evaluation [21], all the normal cells evaluated in our study had lysosomal pH
values around 4 (Figure 2.5). On the other hand, cancer cells exhibited an array of
lysosomal pH values, ranging from 4 to 6.4. A significant portion of cancer cells had
lysosomal pH values that were more than 0.5 pH units higher than in normal cells, which,
according to theoretical calculations, indicates that they will be candidates for IDB
selectivity.
Figure 2.2. The pH dependent excitation spectrum of Oregon Green 488 dextran
measured at 525 nm emission. 1µg/mL of dye was dissolved in buffers of different pH
values (indicated by numbers) and spectra obtained as described in Materials and
Methods. The spectra were overlaid using the Felix software.
4
5
66.5
7
53
0.2
0.4
0.8
1.0
Figure 2.3. The concentration dependent excitation spectrum of Oregon Green 488
dextran measured at 525 nm emission. 0.2-1µg/mL of dextran was dissolved in pH 7
buffer and spectra obtained as described in Materials and Methods. The spectra were
overlaid using the Felix software.
2.3.3 Expression of SV40 LT in RPTE cells
In an effort to establish the molecular basis of the defect in lysosomal
acidification observed in some cancer cells, we were interested in evaluating whether
transformation of cells normal RPTE cells would influence lysosomal pH regulation.
Based on our finding that some cancer cells exhibited normal lysosomal pH regulation
(see Figure 2.5), we hypothesized that upon transformation, cells may experience a
disruption in lysosomal acidification, which may be normalized with continuous cell
culture. If this is the case, then immediately after transformation, we should observe a
significant increase in lysosomal pH that may dissipate with time. We therefore
transformed normal primary RPTE cells with the SV40-large T antigen, which is a tumor
oncoprotein that causes transformation by binding to p53 and retinoblastoma which are
cell cycle regulators [23]. Attempts to transiently introduce SV40 into the primary cells
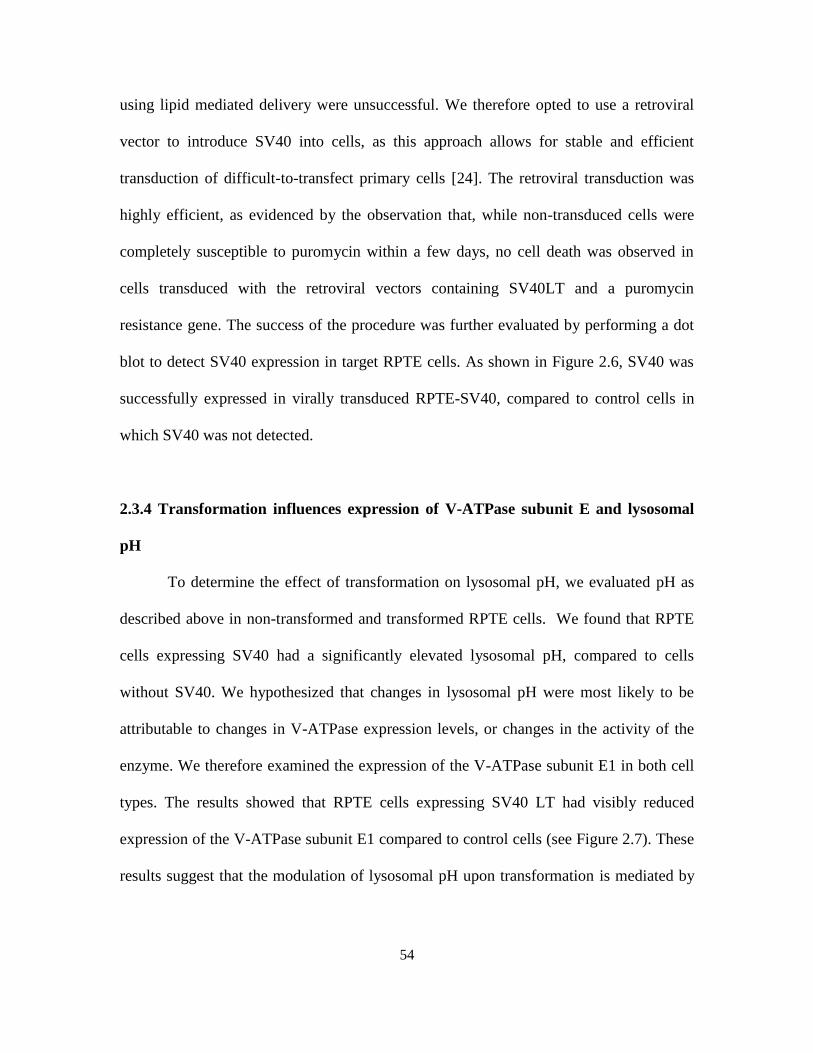
54
using lipid mediated delivery were unsuccessful. We therefore opted to use a retroviral
vector to introduce SV40 into cells, as this approach allows for stable and efficient
transduction of difficult-to-transfect primary cells [24]. The retroviral transduction was
highly efficient, as evidenced by the observation that, while non-transduced cells were
completely susceptible to puromycin within a few days, no cell death was observed in
cells transduced with the retroviral vectors containing SV40LT and a puromycin
resistance gene. The success of the procedure was further evaluated by performing a dot
blot to detect SV40 expression in target RPTE cells. As shown in Figure 2.6, SV40 was
successfully expressed in virally transduced RPTE-SV40, compared to control cells in
which SV40 was not detected.
2.3.4 Transformation influences expression of V-ATPase subunit E and lysosomal
pH
To determine the effect of transformation on lysosomal pH, we evaluated pH as
described above in non-transformed and transformed RPTE cells. We found that RPTE
cells expressing SV40 had a significantly elevated lysosomal pH, compared to cells
without SV40. We hypothesized that changes in lysosomal pH were most likely to be
attributable to changes in V-ATPase expression levels, or changes in the activity of the
enzyme. We therefore examined the expression of the V-ATPase subunit E1 in both cell
types. The results showed that RPTE cells expressing SV40 LT had visibly reduced
expression of the V-ATPase subunit E1 compared to control cells (see Figure 2.7). These
results suggest that the modulation of lysosomal pH upon transformation is mediated by
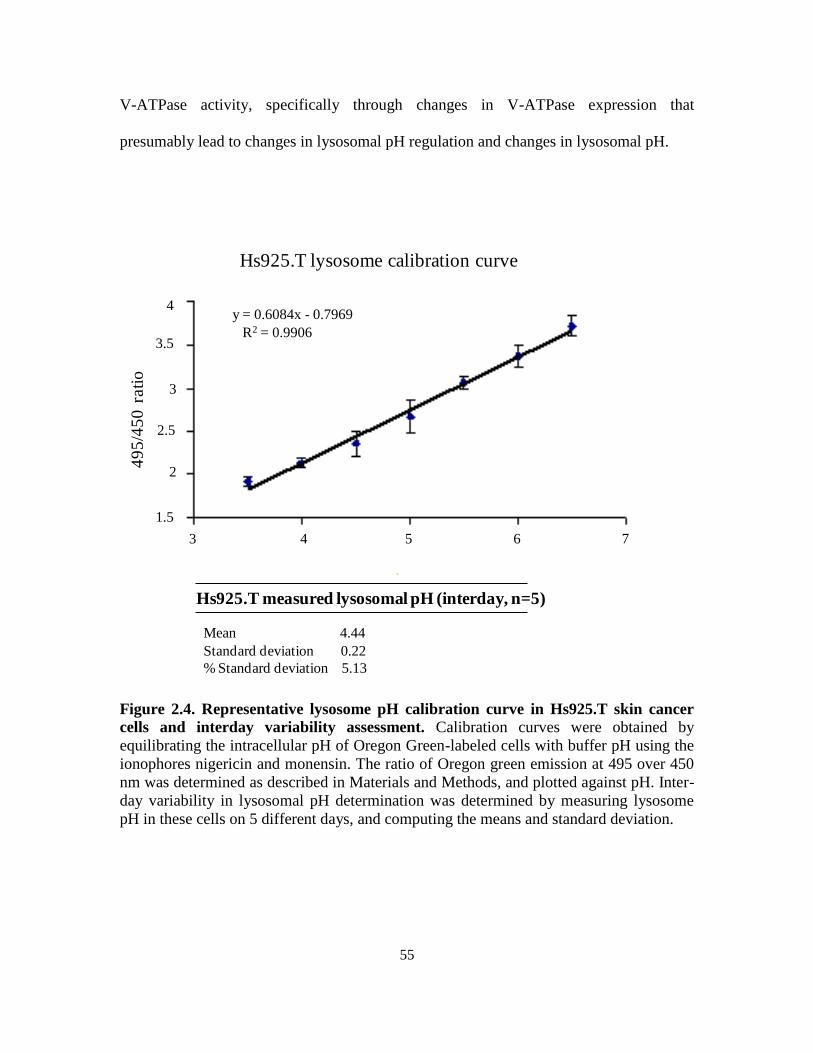
55
V-ATPase activity, specifically through changes in V-ATPase expression that
presumably lead to changes in lysosomal pH regulation and changes in lysosomal pH.
4
3.5
1.5
3
2.5
2
3 4 5 6 7
y = 0.6084x - 0.7969
R2 = 0.9906
Hs925.T lysosome calibration curve
49
5/4
50 r
ati
o
Hs925.T measured lysosomal pH (interday, n=5)
Mean 4.44
Standard deviation 0.22
% Standard deviation 5.13
Figure 2.4. Representative lysosome pH calibration curve in Hs925.T skin cancer
cells and interday variability assessment. Calibration curves were obtained by
equilibrating the intracellular pH of Oregon Green-labeled cells with buffer pH using the
ionophores nigericin and monensin. The ratio of Oregon green emission at 495 over 450
nm was determined as described in Materials and Methods, and plotted against pH. Inter-
day variability in lysosomal pH determination was determined by measuring lysosome
pH in these cells on 5 different days, and computing the means and standard deviation.
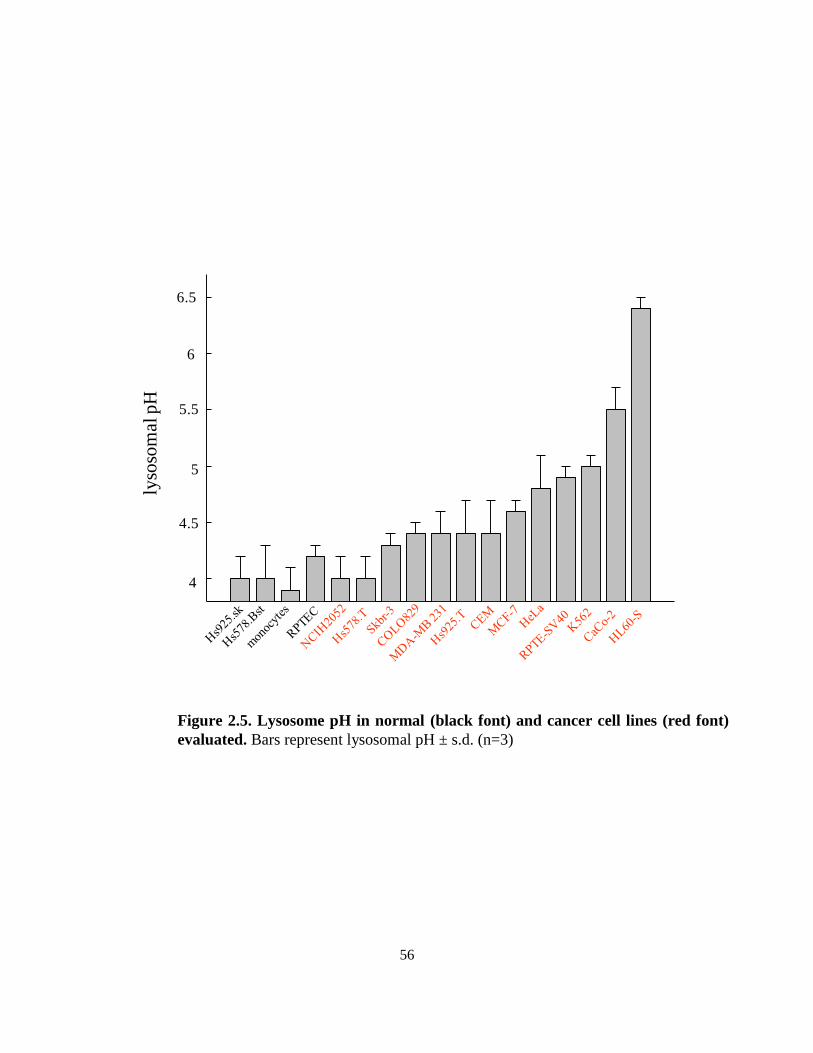
56
lysosom
al pH
4.0
4.5
5.0
5.5
6.0
6.5
lysosomal pH evaluations
lyso
som
al pH
4
4.5
6.5
5.5
6
5
Figure 2.5. Lysosome pH in normal (black font) and cancer cell lines (red font)
evaluated. Bars represent lysosomal pH ± s.d. (n=3)
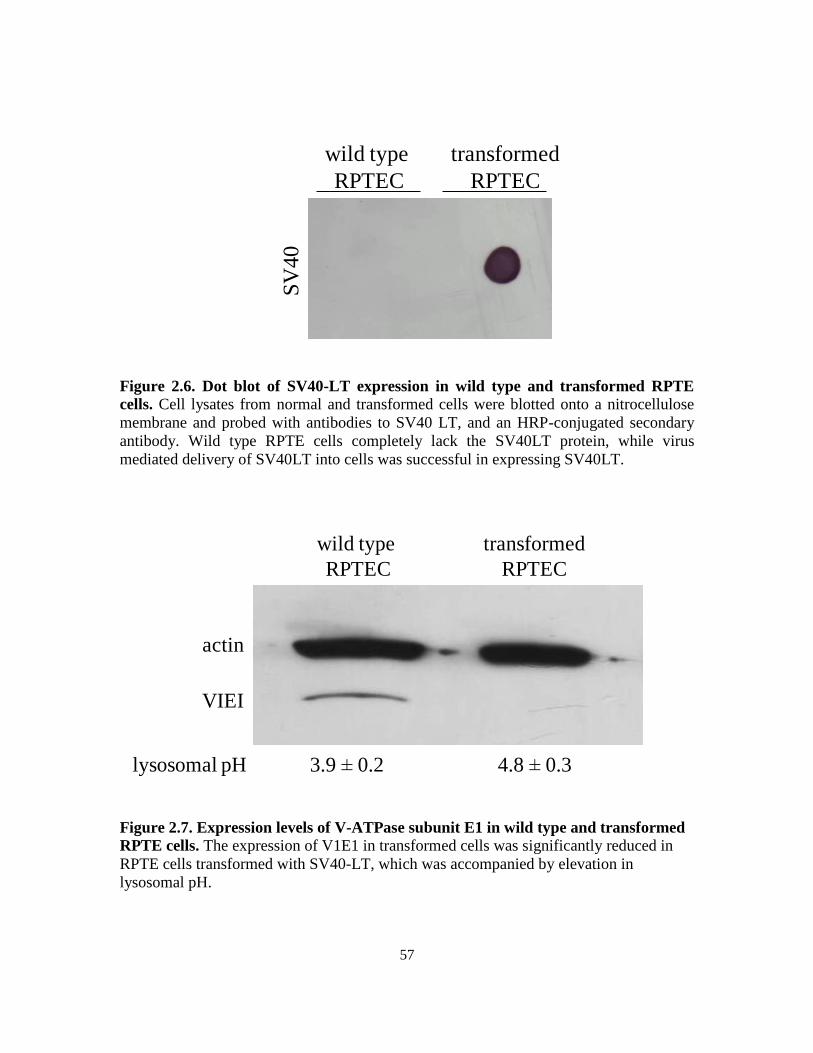
57
transformed
RPTEC
wild type
RPTEC
SV
40
Figure 2.6. Dot blot of SV40-LT expression in wild type and transformed RPTE
cells. Cell lysates from normal and transformed cells were blotted onto a nitrocellulose
membrane and probed with antibodies to SV40 LT, and an HRP-conjugated secondary
antibody. Wild type RPTE cells completely lack the SV40LT protein, while virus
mediated delivery of SV40LT into cells was successful in expressing SV40LT.
actin
VIEI
lysosomal pH 3.9 0.2 4.8 0.3
transformed
RPTEC
wild type
RPTEC
Figure 2.7. Expression levels of V-ATPase subunit E1 in wild type and transformed
RPTE cells. The expression of V1E1 in transformed cells was significantly reduced in
RPTE cells transformed with SV40-LT, which was accompanied by elevation in
lysosomal pH.
58
2.4 Discussion
In chapter 1, we introduced a novel anticancer drug targeting strategy that exploits
a lysosomal defect associated with some cancer cells to enhance the selectivity of weakly
basic anti-cancer drugs. As discussed, the IDB selectivity strategy is applicable only to
cancer cells with defective acidification. The extracellular pH of solid tumors has been
studied extensively, and methods to monitor the extracellular pH of tumors with precision
are well characterized. However, few studies have been dedicated to characterizing the
lysosomal pH of tumor cells. In Chapter 1, we proposed a novel approach to enhance the
selectivity of drugs to cancer cells, based on optimizing intracellular drug distribution
between normal and cancer cells, i.e., intracellular drug distribution-based (IDB)
selectivity. Given that IDB selectivity is only applicable to cancer cells with defective
lysosomal acidification, establishing the potential for broad applicability of this approach
requires an understanding of the prevalence and mechanism of defective lysosomal
acidification in cancer cells.
Theoretical estimations show that perturbations in lysosomal pH as small as 0.5
pH units can greatly influence the cytosolic concentration of weak bases in normal versus
cancer cells according to the ion-trapping mechanism discussed in Chapter 1, thus
influencing selectivity significantly. Therefore, in the interest of developing a lysosomal
pH determination assay that was sensitive to such small pH differences between normal
and cancer cells, a concerted effort was made to optimize the established lysosomal pH
determination protocol so as to enhance sensitivity and reproducibility. In order to ensure
our measurements captured the pH of lysosomes and not other endocytic organelles, we
initially evaluated the time-course of localization of fluorescent dextran in lysosomes by
59
co-staining the endocytosed Oregon Green dextran pH probe with the lysosomal marker
protein, Lamp-1. These evaluations also ensured that we selected the earliest possible
time point at which the dextran was localized in lysosomes, to minimize loss of
fluorescent dextran through release into media as this could reduce sensitivity. After 6 h
of chase (incubation of cells in dextran free medium), the dextran was entirely co-
localized with Lamp-1, indicating that dextran was predominantly localized in lysosomes.
Therefore in the pH determination assay, we employed a 2 h pulse (uptake of dextran into
cells) and 6 h chase (incubation in dye-free medium to allow lysosomal localization).
For our evaluations, we employed the ratiometric pH-dependent fluorophore
Oregon-Green 488 which is a fluorinated derivative of FITC with improved
photostability. In principle, ratiometric fluorophores such as Oregon Green should have
dual excitation (or emission) maxima, one of which is pH dependent, the second pH
independent. Taking the ratio of emission (or excitation) at these wavelengths should
therefore enable pH measurements controlled for variables such as photobleaching and
differences in dye loading between cell types. Oregon Green has dual-excitation emission
peaks; a pH dependent peak at approximately 494 nm excitation and a pH-independent
one at 460 nm [10]. We determined the dual excitation wavelengths of Oregon Green to
be 495 and 460 nm (see Figure 2.2). The pH dependent spectrum showed that the 460 nm
wavelength peak also had a pH dependent emission. We therefore opted to take a ratio of
495 and 450 nm, since the latter wavelength showed minimal pH dependent emission.
However, this ratio showed concentration dependence, which is contrary to expectation.
It was therefore necessary to construct individual calibration curves for each cell line
tested, and to keep pulse-chase and cell density conditions constant as much as possible.
60
While all the normal cells studied exhibited a low lysosomal pH between 4 and
4.2, cancer cells exhibited a range of lysosomal pH values ranging from 4 to 6.4 (Figure
2.5). Our lysosomal pH results for normal cells tend to be lower than has been reported in
the literature, which may be due to the fact that previous such evaluations used
fluorescein dextran as the pH probe [20,21]. Since fluorescein has a pKa of 6.8, it is most
sensitive to pH around these values. In addition it lacks pH dependent fluorescence at pH
values less than 5, creating a possibility that use of FITC-dextran to determine lysosomal
pH overestimates the lysosomal pH. In comparison, Oregon Green dextran has a pKa of
4.8 and shows pH dependent fluorescence intensity at pH values down to 3. It is therefore
more ideal for pH measurements of very acidic lysosomes. As mentioned previously, we
have found that IDB selectivity is enhanced significantly, even with modest differences
in the lysosome pH between cell types. Therefore, the results of lysosomal pH in normal
versus cancer cells suggest that a wide range of cancer cells may be candidates for IDB
selectivity.
It is interesting that although many cancer cells evaluated in our study tended to
have elevated lysosomal pH compared to normal cells, a significant portion cancer cells
maintained the same degree of lysosomal acidification as normal cells. These results
indicate that a complex interplay of factors may responsible for the defective acidification
phenomenon, such as the mechanism of transformation, or length and conditions of cell
culture, and that these factors may influence diverse cell types differently. We speculate
that cancer cells may initially show defective lysosomal pH under in vivo conditions, but
under conditions of cell culture they may revert to having a normal lysosomal pH. Cancer
cells in vivo typically grow in an anaerobic environment due to poor blood perfusion,
61
which results in low oxygenation. They therefore produce high levels of lactic acid into
the cytosol [10]. In order for these cells to maintain the neutral cytosolic pH required for
normal cell functioning, cancer cells may recruit V-ATPases to the cell membrane to
extrude protons into the extracellular medium [10]. Indeed, reports have shown that V-
ATPases are expressed in the plasma membranes of some cells [10]. In conditions of
cells culture, where cells are typically propagated in a monolayer, with plenty of access to
oxygen, cells would no longer need to maintain V-ATPase expression at the plasma
membrane, therefore, V-ATPase could re-localize to endocytic organelles. Our finding
that MCF-7 cells maintained a lysosomal pH that was not significantly different from that
of normal cells (Table 1), whereas, in a previous study, MCF-7 cells were reported to
have significantly elevated lysosomal pH [6], may be explained by this hypothesis. This
also lends credence to the possibility that extended cell culture may lead to a re-
distribution of V-ATPases to lysosomes and re-acidification of lysosomes. To
conclusively answer this question, however, would require that the lysosomal pH of
primary cells freshly isolated from a solid tumor be evaluated, and the effects of extended
cell passaging on the pH evaluated.
Evaluating the impact of transformation on lysosomal pH and pH regulation
machinery of a normal, primary cell can provide information on the mechanism of
defective acidification in the absence of confounding factors, such as length in culture.
Additionally, such an approach can provide insights into the link between transformation
and organelle acidification. To evaluate the role of transformation on lysosomal pH
regulation, we transformed cells with the oncoprotein SV40LT, which effects cellular
transformation by binding to p53 and the retinoblastoma cell cycle regulators [22]. Cells
62
transformed with SV40LT were found to have significantly elevated lysosomal pH (4.8 ±
0.3) compared to control cells (3.9 ± 0.1). In addition, the cells had visibly reduced
expression of the VIEI V-ATPase subunit, suggesting that the transformation process
influences lysosomal acidification through disruption of lysosomal acidification
machinery. Miura and co-workers have shown that the V1E1 subunit of V-ATPase
interacts with the guanine nucleotide exchange factor mSos1, which is involved in
growth factor-mediated cell growth control [23]. Based on their work, it appears as
though V-ATPase itself plays a role in signaling processes that maintain normal cell
growth. It therefore plausible that disruption of normal cell growth signaling during
transformation may result in compensatory modulation of V-ATPase expression, perhaps
an attempt by the cell to keep abnormal cell growth in check after transformation occurs.
Interestingly, another group showed that mutations in the 16kDa subunit of the V-
ATPase that disrupted ATPase function caused cell transformation [7]. Based on this, the
authors concluded that lysosomal de-acidification was a prerequisite for transformation.
However, this could also support a conclusion that the observed lysosomal acidification
defects are due to deficiencies in the cell growth regulatory pathway. It also suggests
therefore, that defective acidification is not necessarily a prerequisite, but a consequence
of transformation.
It is unclear whether every type of cancer cell that expresses SV40LT will exhibit
defective lysosomal acidification. However, our results provide a rationale for screening
cancer cells that express SV40LT in order to logically identify cancer types that may
have defective lysosomal acidification. In fact, SV40LT has been found to be expressed
in a number of cancers [13,24,25]. A systematic study of lysosomal pH in these cell lines
63
would answer the question regarding whether IDB targeting strategy would be generally
applicable to cancer cells that express SV40.
In general, our results suggest that transformation influences lysosomal pH, an
effect that is mediated by changes in the expression levels of V-ATPase. In addition,
these results seem to suggest that cancer cells have defective lysosomal pH regulation
immediately after transformation, an effect that may normalize over time. Further
evaluations are required to provide definitive conclusions in this regard. With regard to
IDB selectivity, our results suggest that although many cancer cells have normal
lysosomal pH regulation, a number exhibit defective acidification that is adequate to
enhance IDB selectivity. However, the scope of our lysosome pH evaluations was limited
by the labor and time intensive approach to determine lysosomal pH. A high-throughput
lysosome pH determination approach, as described by Liu et. al [26] may provide a better
route to truly define the scope of defective lysosomal acidification in cancer cells and
more readily define the extent to which IDB selectivity could be applicable to enhancing
selectivity of anti-cancer drugs.
64
2.5. References
1. Kokkonen N, Rivinoja A, Kauppila A, Suokas M, Kellokumpu I, et al. (2004)
Defective acidification of intracellular organelles results in aberrant secretion of
cathepsin D in cancer cells. J Biol Chem 279: 39982-39988.
2. Jiang LW, Maher VM, McCormick JJ, Schindler M (1990) Alkalinization of the
lysosomes is correlated with ras transformation of murine and human fibroblasts.
J Biol Chem 265: 4775-4777.
3. Gong Y, Duvvuri M, Krise JP (2003) Separate roles for the Golgi apparatus and
lysosomes in the sequestration of drugs in the multi-drug resistant human
leukemic cell line HL-60. J Biol Chem 278: 50234-50239.
4. Altan N, Chen Y, Schindler M, Simon SM (1998) Defective Acidification in Human
Breast Tumor Cells and Implications for Chemotherapy. J Exp Med 187: 1583-
1598.
5. Duvvuri M, Konkar S, Hong KH, Blagg BSJ, Krise JP (2006) A new approach for
enhancing differential selectivity of drugs to cancer cells. ACS Chem Biol 1: 309-
315
6. Schindler M, Grabski S, Hoff E, Simon SM (1996) Defective pH regulation of acidic
compartments in human breast cancer cells (MCF-7) is normalized in adriamycin-
resistant cells (MCF-7adr). Biochemistry 35: 2811-2817.
7. Thomsen P, Rudenko O, Berezin V, Norrild B (1999) The HPV-16 E5 oncogene and
bafilomycin A1 influence cell motility. BBA Mol Cell Res 1452: 285-295.
65
8. Straight SW, Herman B, McCance DJ (1995) The E5 oncoprotein of human
papillomavirus type 16 inhibits the acidification of endosomes in human
keratinocytes. J Virol 69: 3185-3192.
9. Martinez-Zaguilan R, Lynch RM, Martinez GM, Gillies RJ (1993) Vacuolar-type
H(+)-ATPases are functionally expressed in plasma membranes of human tumor
cells. Am J Physiol Cell Physiol 265: C1015-1029.
10. Young JC, Moarefi I, Hartl FU (2001) Hsp90: a specialized but essential protein-
folding tool. J Cell Biol 154: 267-274.
11. Lu X, Qin W, Li J, Tan N, Pan D, et al. (2005) The growth and metastasis of human
hepatocellular carcinoma xenografts are inhibited by small interfering RNA
targeting to the subunit ATP6L of proton pump. Cancer Res 65: 6843-6849.
12. Ahuja D, Saenz-Robles MT, Pipas JM SV40 large T antigen targets multiple cellular
pathways to elicit cellular transformation. Oncogene 24: 7729-7745.
13. Butel JS, Vilchez RA, Jorgensen JL, Kozinetz CA (2003) Association between SV40
and non-Hodgkin's lymphoma. Leukemia Lymphoma 44: 33 - 39.
14. Hahn WC, Dessain SK, Brooks MW, King JE, Elenbaas B, et al. (2002) Enumeration
of the simian virus 40 early region elements necessary for human cell
transformation. Mol Cell Biol 22: 2111-2123.
15. Toei M, Saum R, Forgac M (2007) Regulation and isoform function of the V-
ATPases. Biochemistry 49: 4715-4723.
16. Lafourcade Cl, Sobo K, Kieffer-Jaquinod S, Garin Jr, van der Goot FG (2008)
Regulation of the V-ATPase along the endocytic pathway occurs through
reversible subunit association and membrane localization. PLoS ONE 3: e2758
66
17. Ohkuma S, Poole B (1978) Fluorescence probe measurement of the intralysosomal
pH in living cells and the perturbation of pH by various agents. P Natl Acad Sci
USA 75: 3327-3331.
18. Pear WS, Nolan GP, Scott ML, Baltimore D (1993) Production of high-titer helper-
free retroviruses by transient transfection. P Natl Acad Sci USA 90: 8392-8396.
19. Kaufmann AM, Krise JP (2008) Niemann-Pick C1 functions in regulating lysosomal
amine content. J Biol Chem 283: 24584-24593.
20. Nilsson C, Kågedal K, Johansson U, Öllinger K (2004) Analysis of cytosolic and
lysosomal pH in apoptotic cells by flow cytometry. Meth Cell Sci 25: 185-194.
21. Poole B, Ohkuma S (1981) Effect of weak bases on the intralysosomal pH in mouse
peritoneal macrophages. J Cell Biol 90: 665-669.
22. Bocchetta M, Eliasz S, De Marco MA, Rudzinski J, Zhang L, et al. (2008) The SV40
large T antigen-p53 complexes bind and activate the insulin-like growth factor-I
promoter stimulating cell growth. Cancer Res 68: 1022-1029.
23. Miura K, Miyazawa S, Furuta S, Mitsushita J, Kamijo K, et al. (2001) The Sos1-Rac1
signaling. J Biol Chem 276: 46276-46283.
24. Zhen HN, Zhang X, Bu XY, Zhang ZW, Huang WJ, et al. (1999) Expression of the
simian virus 40 large tumor antigen (Tag) and formation of Tag-p53 and Tag-pRb
complexes in human brain tumors. Cancer 86: 2124-2132.
25. Shah KV (2007) SV40 and human cancer: A review of recent data. Int J Cancer 120:
215-223.
67
26. Liu J, Lu W, Reigada D, Nguyen J, Laties AM, et al. (2008) Restoration of lysosomal
pH in RPE Cells from cultured human and ABCA4-/- mice: Pharmacologic
approaches and functional recovery. Invest Ophthalmol Vis Sci 49: 772-780.

68
Chapter 3: The pKa of weakly basic anticancer agents correlates with the degree of
intracellular drug distribution-based selectivity to cancer cells
69
3.1 Introduction
The high degree of systemic toxicity caused by most anticancer drugs presents an
extreme challenge to successful chemotherapy. In general, attempts to enhance the
selectivity of anti-cancer drugs focus on enhancing the delivery of drugs to cancer cells,
while attempting to reduce drug accumulation in normal cells. In Chapter 1, the classical
approaches to enhance selectivity were discussed. These approaches share a common
requirement in that the active drug is expected to accumulate to a greater extent in or
around cancer cells, while avoiding normal cells. Though conceptually appealing, these
approaches are seldom successful because in reality, it is extremely difficult to achieve
truly site-specific delivery [1].
An alternative approach to enhance anticancer drug selectivity focuses on
intracellular drug distribution-based targeting, which would obviate the need for
increased accumulation of drugs in or around cancer cells relative to normal cells. The
general premise of this approach is that drugs with optimal physicochemical properties
can distribute differently in normal versus cancer cells (i.e. in compartments that enhance
drug-target interactions in cancer cells and in compartments that diminish drug target
interactions in normal cells) thus enhancing selectivity to cancer cells. The mechanism of
the IDB selectivity approach was discussed in detail in Chapter 1, and as discussed, is
made possible by differences in the degree of lysosomal sequestration of weak bases
between normal and cancer cells. Differences in lysosomal trapping arise due to
differences in lysosome-to-cytosol pH gradients between normal and cancer cells which
come about due to defective lysosomal acidification in some cancer cells.
70
In previous quantitative evaluations of the lysosome-to-cytosol concentration ratio
of the weak base Hsp90 inhibitor 17-DMAG in cancer cells with defective lysosomal
acidification (pH 6.5) and cancer cells with a lower lysosomal pH (5.1), we found that the
lysosome-to-cytosol distribution ratio of the weak base 17-DMAG was much greater in
cells with a low lysosomal pH, compared to cells with elevated lysosomal pH. The
lysosome-to-cytosol concentration ratio of the non-lysosomotropic inhibitor,
geldanamycin was not sensitive to differences in lysosomal pH and was close to one for
both cell types.
According to the theoretical principles of ion trapping in lysosomes originally set
forth by de Duve [2], the lysosome-to-cytosol ratio of weakly basic drugs decreases with
pKa, such that compounds with pKa less than 8 undergo progressively less lysosomal
sequestration. We established this experimentally by quantitatively evaluating the
lysosome-to-cytosol ratio of a series of aminoisoquinolines with pKa values ranging from
4 to 9. [3]. We found that aminoisoquinolines with pKa less than 6 had lysosome-to-
cytosol concentration ratios close to 1, whereas those with pKa greater than 7 had
significantly greater concentration ratios. Since both pH and pKa influence the lysosome
versus cytosol weak base distribution, we postulated that pKa would likewise influence
the IDB selectivity of weak bases in cells with differences in lysosomal pH values.
To test this, we evaluated the selectivity of anticancer drugs with varying pKa on
intracellular drug distribution-based drug selectivity, and whether compounds with
optimal pKa for lysosomal sequestration would show the greatest selectivity. We chose to
evaluate Hsp90 inhibitors, which are ideal model compounds for our evaluations, since
Hsp90 is localized in the cytosol [4], therefore the activity of lysosomotropic Hsp90
71
inhibitors should be sensitive to the degree of lysosomal sequestration. The inhibitor
geldanamycin (GDA) and its structural analogs were particularly well-suited for our
evaluations since GDA is neutral and therefore non-lysosomotropic, yet is amenable to
modification at the 17-position to create analogs with lysosomotropic properties.
Importantly, modifications are possible at this position without an impact on Hsp90
binding affinity. We therefore synthesized GDA analogs with pKa values ranging from
5.8 to 12.4 for evaluation of IDB selectivity.
In order to determine the contribution of intracellular drug distribution differences
influence on selectivity, it is important that drugs tested bind to the target (Hsp90) with a
similar affinity, since differences in binding affinity could potentially influence the
apparent selectivity between analogs. Tian et al. studied the influence of structural
modifications of GDA on Hsp90 binding affinity and showed that while some
modifications do not affect Hsp90 binding, addition of bulky substituents to the 17-
position reduced affinity for Hsp90 [5]. For this reason, we evaluated the binding affinity
of geldanamycin analogs to recombinant Hsp90 using a fluorescence polarization
assay[6], which showed that the 17-position modifications did not have a significant
impact on Hsp90 binding.
The selectivity for each analog was assessed by comparing ratios of anti-
proliferative IC50 values in normal human fibroblasts versus human leukemic HL-60
cells. In addition, similar selectivity assessments were performed in a cancer cell line
with or without shRNA treatment against a subunit of the lysosomal V-ATPase that
resulted in a corresponding cell line with a significant lysosomal pH elevation. When
plotted against pKa, selectivity followed a bell-shaped profile with very low or very high
72
pKa analogs showing minimal selectivity. Optimal selectivity peaked for analogs with
pKa values near 8. Additional selectivity evaluation of anti-cancer drugs with
mechanisms of action distinct from that of Hsp90 inhibitors, with or without optimal
lysosomotropic properties, supported these results, suggesting that the IDB selectivity
platform would be applicable to a broad spectrum of anticancer cancer drugs, and not just
to Hsp90 inhibitors.
Collectively, these evaluations mark a significant advancement in understanding
how weakly basic properties can be optimized to achieve maximum selectivity toward
cancer cells with defective lysosomal acidification.
3.2. Materials and Methods
3.2.1. Synthesis of geldanamycin analogs
Geldanamycin (GDA) analogs were synthesized in the laboratory of Dr. M. Laird
Forrest. Synthetic procedures and NMR characterization of the GDA analogs can be
found in Ndolo et al. [7].
3.2.2. Cell lines and cell culture reagents
HL-60 cells were kindly provided previously by Dr Yueshang Zhang (formerly of
Arizona Cancer Center) and were propagated in RPMI media to which 10% BCS, sodium
bicarbonate (1.5 g/L), sodium pyruvate and HEPES buffer were added. Normal human
fibroblasts (CRL-2076) and MDA MB 231 (HTB-26) human breast adenocarcinoma and
HEK 293T cells were obtained from the American Type Culture Collection (ATCC), and
were propagated in DMEM (GIBCO) containing 10% FBS (HyClone).
73
3.2.3. Determination of pKa values of geldanamycin analogs
The ionization constants of geldanamycin analogs were determined by recording
the pH dependent 1H-NMR chemical shift of methylene protons adjacent to the weakly
basic amine of the GDA analogs, as described previously [8,9]. All NMR solvents and
reagents were obtained from Cambridge Isotope Labs (Andover, MA) unless otherwise
noted. Compounds were dissolved at a 1-3mg/ml concentration in D2O. pD
measurements (henceforth denoted pH*) were carried out using a MiniLab model IQ125
pH electrode calibrated with pH 7 and 4 or 10 standard NIST reference buffers (Fisher
Scientific, Pittsburg, PA). pH* was adjusted using NaOD (40% in D2O) or DCl (20% in
D2O). Typically, 0.2 -10 µL of acid or base was added to the sample in the NMR tube,
tube shaken and 30 µL drawn to measure pH*. 1-H NMR spectra were recorded using a
Bruker 400 spectrometer operating at a frequency of 400.13 MHz, and analyzed using the
Bruker Topspin software. Water soluble 4-dimethyl-4-silapentane-1-sulfonic acid (DSS)
was used as the reference peak. The sample probe was maintained at 37°C, and 64-256
scans were collected per spectrum. pH* was converted to pH using the expression: pH =
0.936pH* + 0.412 [10]. The chemical shifts of the appropriate protons at various pH
values were recorded and plotted against pH, yielding sigmoidal plots that were fit to the
sigmoidal, 4-parameter equation using SigmaPlot. The inflection point of the curves gave
the pKa of the compound.
3.2.4 Assessment of Hsp90 binding affinity of geldanamycin analogs
The Hsp90 binding affinity of geldanamycin (GDA) in comparison to its
derivatives was determined by measuring the competitive displacement of the Hsp90-
74
bound fluorescent tracer GDA-FITC, by GDA and its analogs, using a fluorescence
polarization assay previously described by Llauger-Bufi et al. [6]. Non-binding surface
96-well plates (Corning) for high throughput fluorescence polarization were obtained
from Fisher. GDA-FITC, obtained from BioMol (Enzo Life Sciences, Plymouth Meeting,
PA ) was reconstituted in DMSO at a stock concentration of 10µM and further diluted to
a final concentration of 10nM in an assay buffer consisting of 20mM Hepes, pH 7.3,
50mM KCl, 5mM MgCl2, 20mM MgCl2, 20mM Na2MoO4, and 0.01% NP40. 0.1mg/ml
bovine gamma globulin (BGG) and 1mM DTT was added to this buffer just prior to use.
The final concentration per well of tracer was 2 nM. Recombinant Hsp90α (Enzo Life
Sciences) was reconstituted in assay buffer to yield a final concentration of 40 nM per
well. Control wells with buffer and GDA-FITC tracer only were included. Eight different
concentrations of geldanamycin analogs ranging from 0-2000 nM were added, such that
the final volume of protein, tracer and test compound was 100 µL. The plates were placed
on a shaker in a 4°C refrigerator for 4 h, and fluorescence millipolarization (mP) units
determined using a Wallac Envision Multilabel plate reader (Perkin Elmer). The tracer
only mP values were subtracted from the test mP values, and converted to percent of
control (wells devoid of drug) mP to arrive at the % inhibition per treatment. Curves were
fit to 3 or 4 parameter logistic equations using SigmaPlot. The IC50 of inhibition was
determined from the plots, and converted to Ki values using the equation below,
developed by Nikolovska-Coleska et al. [11]
Ki = [I]50/([L50]/Kd + P0/Kd+1)
where, I50 denotes the concentration of the free inhibitor at 50% inhibition and is
equivalent to the IC50, [L]50 is the concentration of free labeled ligand at 50% inhibition,
75
[P]0 is the concentration of protein at 0% inhibition and Kd is the dissociation constant of
the protein-ligand complex. The Kd of GDA-FITC binding to Hsp90 was found to be
33.4nM [6]. The equation is freely available at
http//sw16.im.med.unich.edu/software/calc_ki/ and requires input of Kd of the
fluorescent tracer and the IC50 only. The other relevant parameters in the equation have
been previously determined by the authors, and need not be determined experimentally if
the Ki calculator linked above is used.
3.2.5 Knockdown of V-ATPase subunit V1E1
The lentiviral transfer vector pPGK-Neo-ATP6V1E1 encoding the target
sequence 5‘-CAGATGTCTCCAATTTGATGAAT-3‘ against the V-ATPase V1E1
subunit was obtained from Mission (Sigma, St. Loius, MO). For control cells, pPGK-Neo
transfer vector contained the sequence 5‘-CAACAAGATGAAGAGCACCAA-3‘, which
does not target any known mammalian gene. Lentiviral particles were produced by
transfecting HEK293T cells with the transfer vector plus a lentiviral packaging mix
according to manufacturer‘s instructions (Sigma). Typically, 5 X 10⁵ HEK293T cells
were seeded in 10 cm dishes and allowed to adhere overnight. For transfection, 2.6 μg of
vector DNA was combined with 26 µL of packaging mix and transfected into cells using
Fugene-6 transfection reagent (Roche), as per manufacturer‘s instructions. DNA
complexes were allowed to incubate on the cells overnight, and then media was replaced
with growth media. The virus-containing cell culture supernatants were harvested after
24h, media replenished, and a second harvest of virus particles done another 24h later.
Prior to infection of target MDA MB 231 cells, the virus-containing media supernatant
76
was filtered through a 0.45-μm filter, and added onto 70% confluent 75cc flasks of MDA
MB 231 cells, in the presence of 8 μg/ml hexadimethrine bromide. The viruses were
allowed to infect the cells for 16-18h then media was replaced for a further 24h before
analysis of knockdown was performed.
3.2.6 Western blotting
Cells in a 75-cc cell culture flask were trypsinized, washed X3 with PBS and
resuspended in lysis buffer consisting of 1% NP-40, 50mM Tris and 150mM NaCl to
which a protease inhibitor cocktail containing PMSF, aprotinin, leupeptin and pepstatin
(Sigma, St Louis MO) was added. Protein concentration was determined using the BCA
assay (Pierce, Rockford IL). 20 µg of protein was resolved on a 10% SDS gel and
transferred onto nitrocellulose membrane for 1h at 100V. After transfer, western blot
analysis of V1E1 and actin (loading control) was carried out using a goat polyclonal
antibody to the V1E1 subunit (Santa Cruz Biotechnology) and a mouse monoclonal
antibody to actin (Sigma). Anti-goat HRP conjugated secondary antibody was from Santa
Cruz Biotech, and anti-mouse HRP from Sigma.
3.2.7 Lysosome pH determination
Lysosomal pH was determined following previously published protocols
[12,13,14], with modifications. Briefly, 1x10⁵ cells/well were plated in 8-chamber tissue
culture treated microscope slides (BD Falcon, Bedford, MA) and allowed to adhere
overnight. Cells were incubated with 1mg/ml Oregon Green 488 dextran 10000MW
(Invitrogen) for 2h, followed by a 6h incubation in dye-free medium to allow the dextran
77
to localize in lysosomes. At the end of the chase period, the 525/10 nm emission ratio of
Oregon Green 488 at 495 and 450nm excitation wavelengths, respectively, was measured
using a microscope adapted Ratiomaster spectrofluorimeter (PTI, Trenton, NJ), equipped
with a photomultiplier tube detector. To generate a calibration curve for pH
determination, buffers composed of 150mM NaCl, 20mM Mes, 5mM KCl, and 1mM
MgSO4 were adjusted with 1N NaOH to pH 4, 5, 5.5, and 6 containing 10 μM nigericin
and 20 μM monensin, were added to respective wells of the 8-chamber slide for 1 h to
equilibrate intracellular pH with extracellular pH, and the 495/450 nm emission ratio
measured as described [15,16], and as outlined in Chapter 2. A standard curve was
obtained by plotting buffer pH against 495/450 nm emission ratio, which was linear
between the pH range evaluated.
3.2.8 Cytotoxicity assay
Cell sensitivity to compounds was evaluated using the WST-1 (4-[3[(4-
iodophenyl)-2-(4-nitrophenyl)-2H-5-tetrazolio]-1,3-benzene disulfonate) assay
(BioAssay Systems, Hayward, CA) which was performed according to the
manufacturer‘s instructions. For adherent cells, 4000 cells were seeded per well of a 96-
well plate, and allowed to adhere overnight. Cells were incubated in increasing
concentrations (9 different concentrations ranging from 0.00001 µm to 1000 µM) of drug
for a period of 72 h. Suspension cells were added to wells at a fraction of the final
volume, and drug added so that the final volume in each well was 100 µL. At the end of
the drug treatment period, 10 µL of WST-1 solution was added per well, allowed to
incubate at 37°C for 2 hours and absorbance at 450 and 620nm (reference) measured
78
using a Multiskan model MCC/340 microplate reader (ThermoElectron Corp). Cell
viability as a percent of control (untreated) cell was plotted against drug concentration,
and curves were fit to 3 or 4 parameter logistic Hill plot using SigmaPlot. The IC50 was
determined from the curve fit.
3.3 Results
3.3.1 1H-NMR determination of geldanamycin analogue pKa
In order to evaluate the role of pKa on IDB selectivity to cancer cells we required
a series of anticancer agents with varying pKa values. It is important to evaluate drugs
with the same molecular target and similar affinity for this target, since these factors can
influence the apparent selectivity of the drug candidates. Geldanamycin is a neutral
cytotoxic Hsp90 inhibitor which can readily be modified at the 17-position to create
ionizable analogs. We therefore obtained GDA analogs in which the methoxy-group at
the 17-position was replaced with various amine substituents, the structures of which are
indicated in Table 1. The amine substituents were initially selected such that the
calculated pKa of resultant analogs varied from around 5 to 12. To determine pKa values
experimentally, we monitored the 1H-NMR chemical shift changes of protons adjacent to
the basic ionizable group. Since our measurements were carried out in D2O solvents, a
correction factor was necessary to convert pH-meter readings of inhibitor solutions in
D2O (designated pH*) into pH. We used the equation by Krezel and Bal [10], obtained by
establishing the correlation between pH-meter readings of various substances in H2O and
D2O. Plots of chemical shift versus pKa yielded sigmoidal curves, an example of which is
shown in Figure 3.1. The pKa values of GDA analogs were determined from these plots,
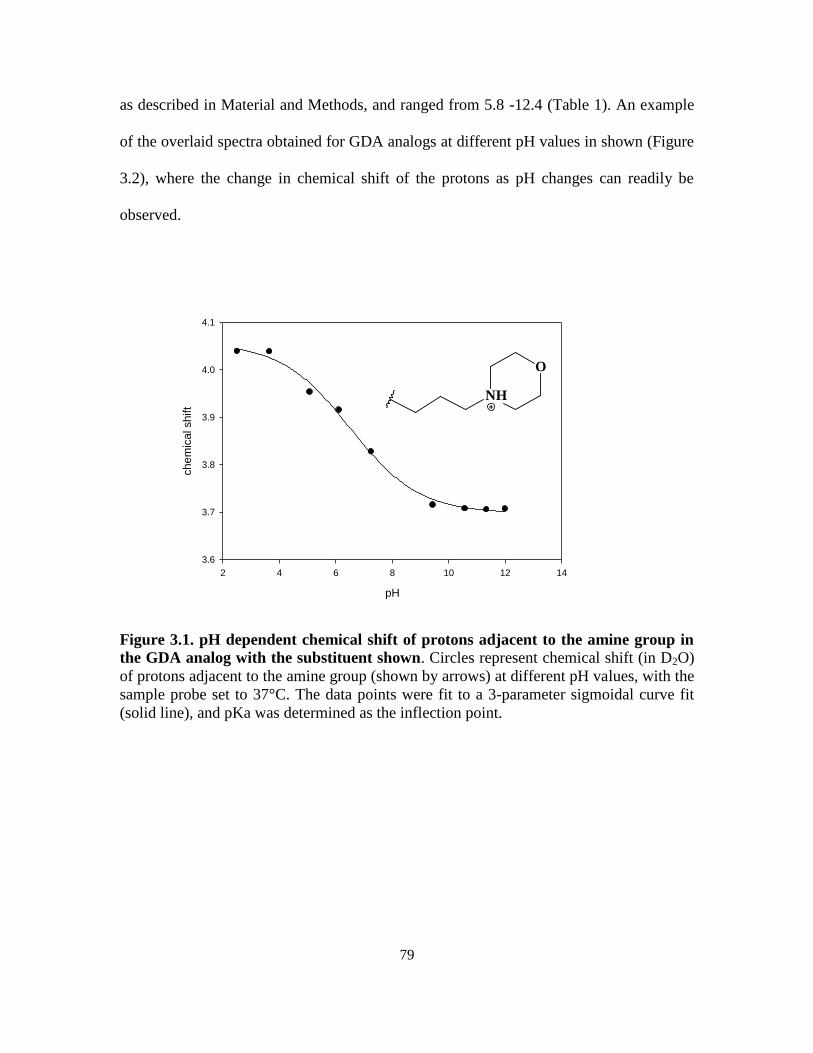
79
as described in Material and Methods, and ranged from 5.8 -12.4 (Table 1). An example
of the overlaid spectra obtained for GDA analogs at different pH values in shown (Figure
3.2), where the change in chemical shift of the protons as pH changes can readily be
observed.
Figure 3.1. pH dependent chemical shift of protons adjacent to the amine group in
the GDA analog with the substituent shown. Circles represent chemical shift (in D2O)
of protons adjacent to the amine group (shown by arrows) at different pH values, with the
sample probe set to 37°C. The data points were fit to a 3-parameter sigmoidal curve fit
(solid line), and pKa was determined as the inflection point.
pH
2 4 6 8 10 12 14
chem
ical shift
3.6
3.7
3.8
3.9
4.0
4.1
O
NH
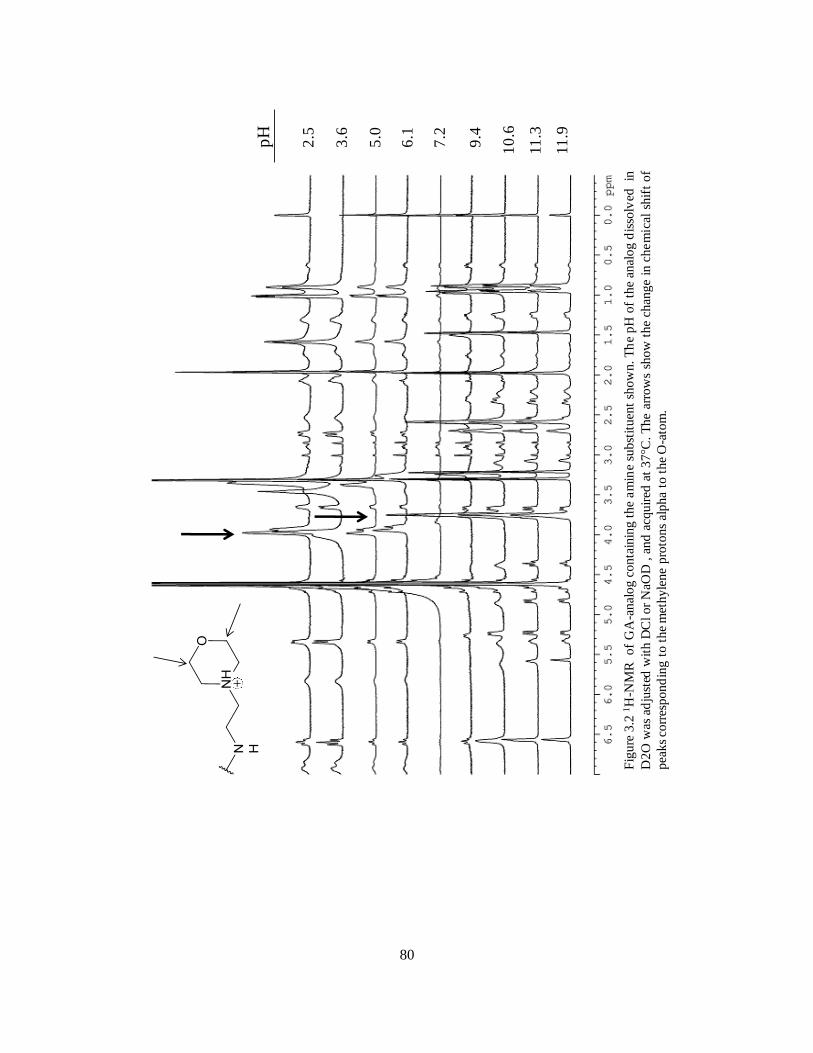
80
Fig
ure
3.2
1H
-NM
Ro
fG
A-a
nal
og
conta
inin
gth
eam
ine
subst
ituen
tsh
ow
n.T
he
pH
of
the
anal
og
dis
solv
edin
D2O
was
adju
sted
wit
hD
Clo
rN
aOD
,an
dac
quir
edat
37 C
.T
he
arro
ws
show
the
chan
ge
inch
em
ical
shif
to
f
pea
ks
corr
espon
din
gto
the
met
hyle
ne
pro
tons
alpha
toth
eO
-ato
m.
pH
2.5
3.6
5.0
6.1
7.2
9.4
10
.6
11
.3
11
.9
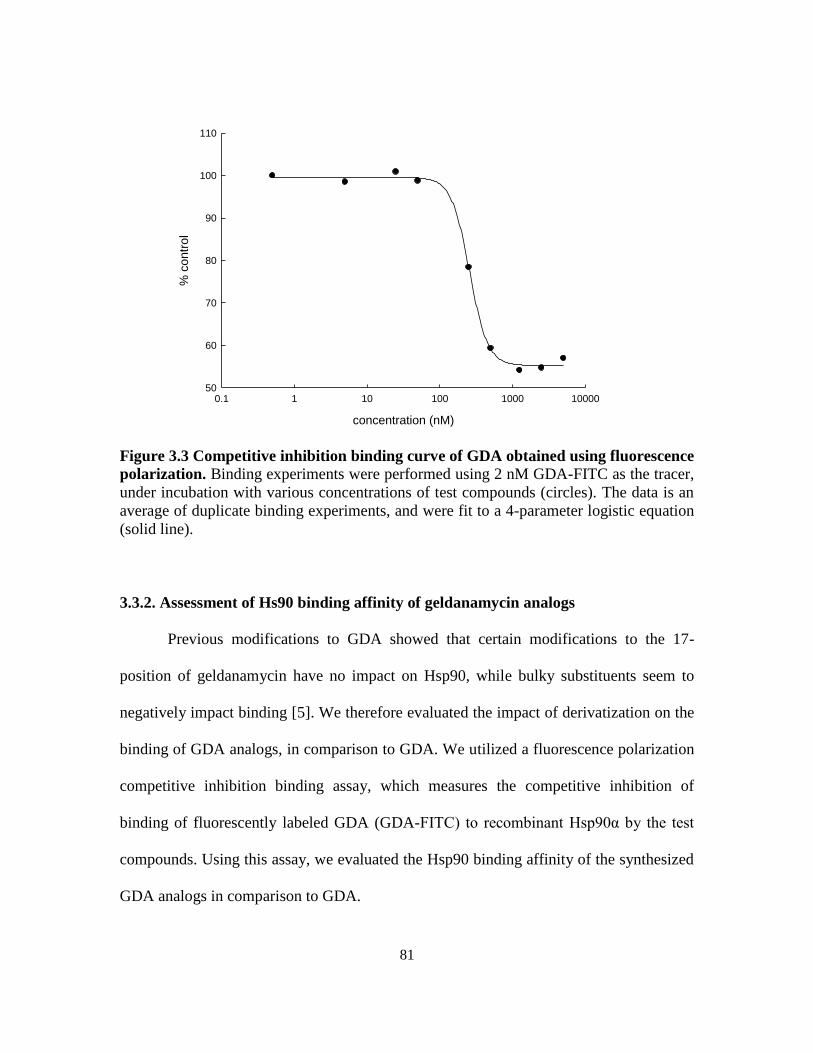
81
concentration (nM)
0.1 1 10 100 1000 10000
% c
ontr
ol
50
60
70
80
90
100
110
Figure 3.3 Competitive inhibition binding curve of GDA obtained using fluorescence
polarization. Binding experiments were performed using 2 nM GDA-FITC as the tracer,
under incubation with various concentrations of test compounds (circles). The data is an
average of duplicate binding experiments, and were fit to a 4-parameter logistic equation
(solid line).
3.3.2. Assessment of Hs90 binding affinity of geldanamycin analogs
Previous modifications to GDA showed that certain modifications to the 17-
position of geldanamycin have no impact on Hsp90, while bulky substituents seem to
negatively impact binding [5]. We therefore evaluated the impact of derivatization on the
binding of GDA analogs, in comparison to GDA. We utilized a fluorescence polarization
competitive inhibition binding assay, which measures the competitive inhibition of
binding of fluorescently labeled GDA (GDA-FITC) to recombinant Hsp90α by the test
compounds. Using this assay, we evaluated the Hsp90 binding affinity of the synthesized
GDA analogs in comparison to GDA.
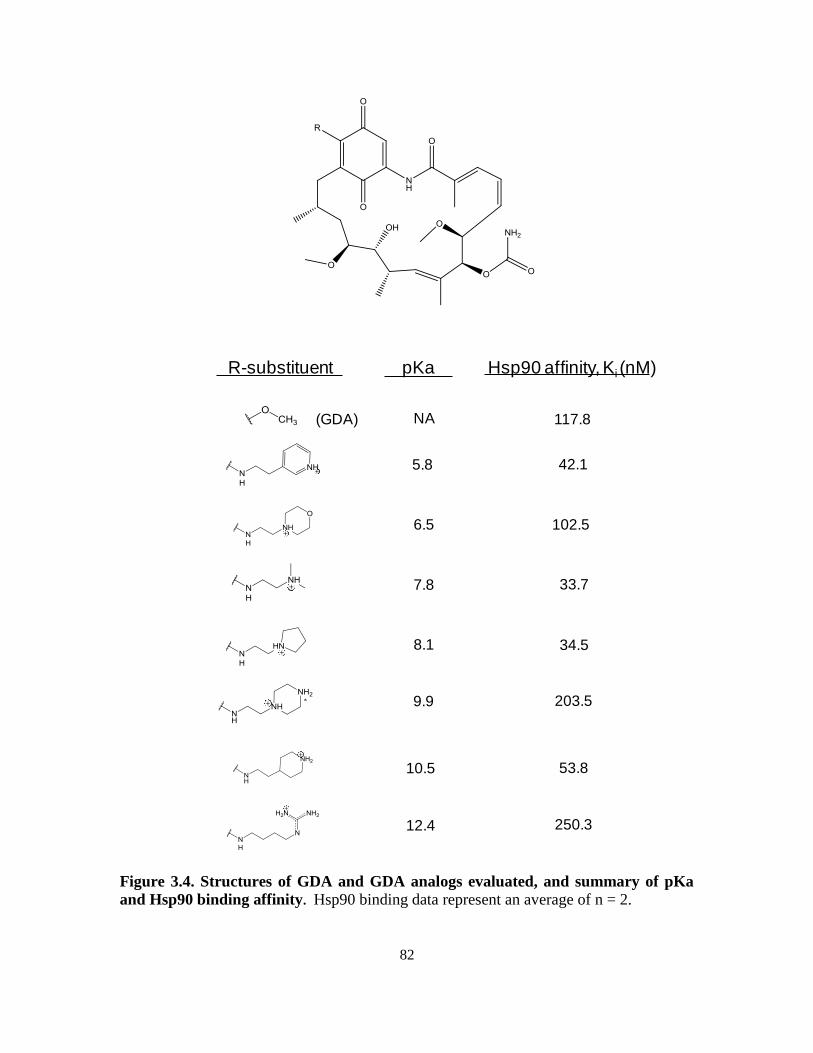
82
5.8
7.8
6.5
8.1
10.5
9.9
NA
12.4
117.8
42.1
102.5
250.3
33.7
34.5
203.5
53.8
pKa Hsp90 affinity, Ki (nM)R-substituent
(GDA)
Figure 3.4. Structures of GDA and GDA analogs evaluated, and summary of pKa
and Hsp90 binding affinity. Hsp90 binding data represent an average of n = 2.
83
Plots of fluorescence polarization (mP) values against log concentration of test
compounds yielded sigmoidal curves, an example of which is shown in Figure 3.3. The
IC50 of binding inhibition was determined from these curves and converted to Ki as
described in the methods section. The Ki of GDA binding to Hsp90 was 117.8 nM,
which is comparable to reported values using fluorescence polarization [17], while that of
the analogs ranged from 33.7 to 250.3 nM. These results confirm that derivatization of
GDA to create analogs with variable pKa had no significant impact on Hsp90 binding
affinity (see Figure 3.4)
3.3.3. Selectivity assessment of geldanamycin analogs in normal versus cancer cells
In our previous work, we showed that changes in the intracellular distribution of
weakly basic drugs in cells with low lysosomal pH versus cells with elevated lysosomal
pH resulted in enhanced selectivity of lysosomotropic Hsp90 inhibitors to cells with
elevated lysosomal pH [18]. In the present work, we sought to identify the optimal pKa
for intracellular distribution based selectivity to cancer cells. We evaluated the selectivity
of Hsp90 inhibitors with variable pKa values in HL60 human leukemic cancer cells,
which, at the time of these experiments, was determined to have a lysosomal pH of 5.6, in
comparison to normal human skin fibroblasts, which were previously determined to have
a lysosomal pH of 4.2 [14] .Selectivity was defined as the ratio of the IC50 of a given
inhibitor in normal cells divided by the IC50 in HL60 cells. Accordingly, ratios close to or
equal to one indicate similar or equal activity of a given drug in both normal and cancer
cell lines, and therefore little or no selectivity towards cancer cells. We determined the
selectivity for each analog and plotted the results against pKa of each inhibitor. Plots of
84
selectivity versus pKa yielded a bell shaped curve, with maximum selectivity observed
for inhibitors with pKa around 8. Inhibitors with pKa less than 7, and greater than 9 had
little selectivity to cancer cells. The neutral inhibitor GDA showed a minimal degree of
selectivity toward HL60 cells (ratio ~ 2) which is consistent with the fact that, being a
non-lysosomotropic compound, it is not subject to changes in intracellular distribution in
response to lysosomal pH.
In an effort to rationally explain the selectivity profile observed for normal versus
cancer cells as a function of pKa we examined the theoretical distribution of weak bases
in lysosomes as a function of pKa. The mechanistic basis for lysosomal sequestration of
weak bases via ion trapping was reviewed in detail by deDuve and co-workers [2]. From
this work, we derived the equation to determine the ratio of drug concentration in
lysosomes to that in the cytosol at steady state as:
al
al
ac
ac
KHα
KH
KH
KHα
[cytosol]
[lysosome]
whereby, Ka denotes the weak base acid dissociation constant, [H+] is the proton
concentration (subscript c represents cytosolic, l represents lysosomal), while α denotes
the ratio of permeability of the un-ionized versus the ionized form of the weak base
through the lysosomal lipid bilayer. This term was previously measured experimentally
for the compound 17-DMAG [19], and was determined to be 0.001. We assumed that for
structurally similar compounds, the α-value would be relatively constant. We therefore
used this α-value in our calculation, since the GDA analogs used in our study are
85
structurally similar to 17-DMAG. The lysosomal and cytosolic pH entered was pH 4.2
and 7.4 respectively, which is typical of normal cells. Using these parameters, we
calculated the theoretical concentration ratio in the lysosomes versus cytosol of weak
bases with pKa values ranging from 4 to 12.4. Plotting these ratios against pKa resulted
in a bell shaped curve, whereby the maximum degree of lysosomal sequestration
occurred with compounds of pKa around 8, as shown in the insets of Figures 3.5 and 3.6
for comparison with selectivity data. The theoretically determined weak base distribution
profile indicates that compounds with pKa approaching 8 will undergo the greatest
degree of lysosomal sequestration in cells with normal, low lysosomal pH and should
therefore have the least activity in normal cells. Assuming that steady state accumulation
of drug is achieved in both cell types, and that the total cellular drug concentration in
normal and cancer cells is the same, the theoretical calculation predicts a 22-fold
difference in cytosolic concentrations of weak bases with pKa 8 between cancer cells
with lysosomal pH 5.6 compared to normal cells with pH 4.4. Therefore, taken together,
the theoretical evaluations and the experimental results provide strong support for the role
of intracellular drug distribution on the selectivity profile as a function of pKa observed
in cancer versus normal cells observed.
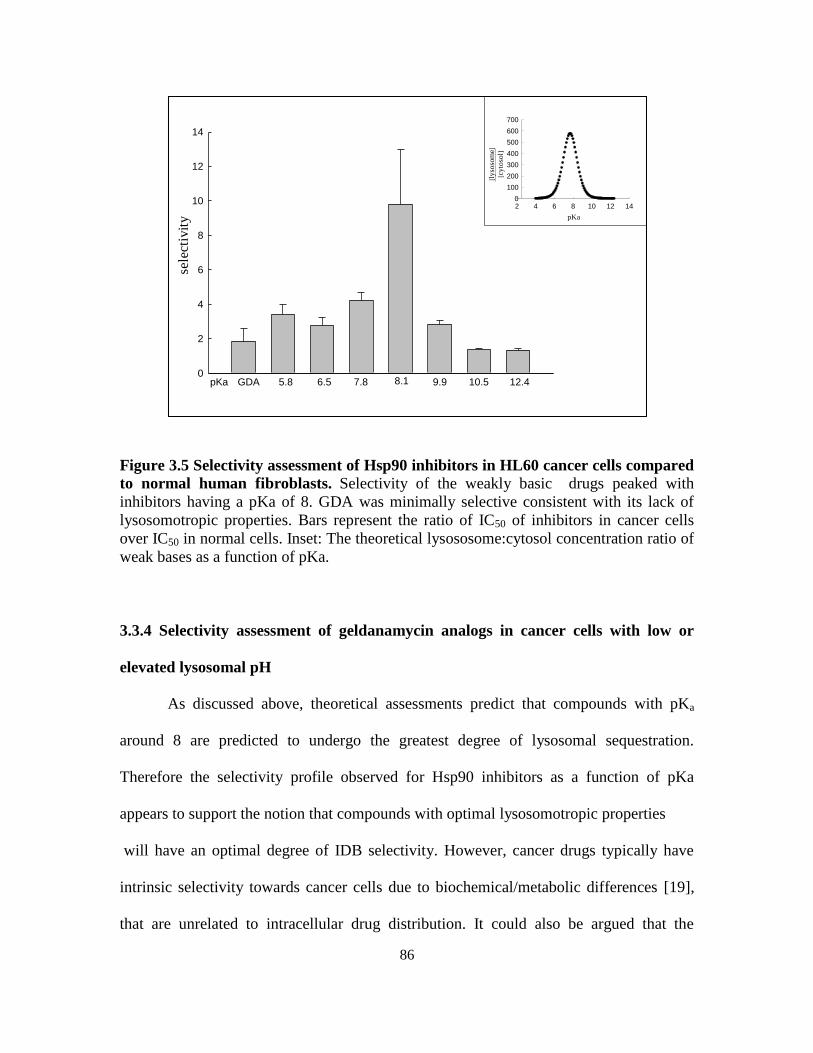
86
IDB
sele
ctivity
0
2
4
6
8
10
12
14
pKa 5.8 6.5 7.8 8.1 9.9 10.5 12.4GDA
sele
ctiv
ity pKa
2 4 6 8 10 12 14
[lysosom
e]
[c
yto
sol]
0
100
200
300
400
500
600
700
[ly
soso
me]
[cy
toso
l]
pKa
Figure 3.5 Selectivity assessment of Hsp90 inhibitors in HL60 cancer cells compared
to normal human fibroblasts. Selectivity of the weakly basic drugs peaked with
inhibitors having a pKa of 8. GDA was minimally selective consistent with its lack of
lysosomotropic properties. Bars represent the ratio of IC50 of inhibitors in cancer cells
over IC50 in normal cells. Inset: The theoretical lysososome:cytosol concentration ratio of
weak bases as a function of pKa.
3.3.4 Selectivity assessment of geldanamycin analogs in cancer cells with low or
elevated lysosomal pH
As discussed above, theoretical assessments predict that compounds with pKa
around 8 are predicted to undergo the greatest degree of lysosomal sequestration.
Therefore the selectivity profile observed for Hsp90 inhibitors as a function of pKa
appears to support the notion that compounds with optimal lysosomotropic properties
will have an optimal degree of IDB selectivity. However, cancer drugs typically have
intrinsic selectivity towards cancer cells due to biochemical/metabolic differences [19],
that are unrelated to intracellular drug distribution. It could also be argued that the
87
increased activity of the Hsp90 inhibitors in cancer cells relative to normal cells can be
attributed to differences in the expression of drug transporters in the two cell types, which
could influence the relative intracellular drug concentrations.
Therefore, to establish the unambiguous contribution of IDB targeting to the
observed selectivity would require evaluation of selectivity in a pair of cell lines that
differ only in lysosomal pH, but are otherwise identical. Although, many cancer cell lines
have been shown to have defective acidification of lysosomes, we found that a number of
cancer cell lines maintain normally acidified lysosomes (see Chapter 2, section 3.1). An
example is the MDA MB 231 breast adenocarcinoma cell line, which maintains a
lysosomal pH around 4.2, similar to the lysosomal pH of most normal cells. We therefore
evaluated selectivity in this cell line, in comparison to the same cell line manipulated
using molecular biology techniques to have defective lysosomal acidification.
Lysosomal acidification is controlled by the activity of V-ATPase, which is a
membrane anchored proton transporter that pumps protons into the lumen of the
lysosomes against a concentration gradient to lower luminal pH [19]. Lu et al. have
previously showed that knocking down a subunit V0c of V-ATPase, resulted in impaired
V-ATPase activity without otherwise influencing cell growth [20]. Although the authors
did not establish the impact of this manipulation on lysosomal pH, we reasoned that it
would impair the proper functioning of V-ATPase, and result in defective lysosomal
acidification, given that proton-pumping by V-ATPase is one of the primary mechanisms
for the acidification of lysosomes [21]. Therefore to create an MDA MB 231 cell line
with elevated lysosomal pH, we targeted the V1E1 subunit of V-ATPase for knockdown
using lentiviral vector shRNA. The lentiviral-mediated transfer was chosen since this
88
approach allows efficient, high throughput and stable knockdown of target proteins [19].
MDA MB 231 cells that were to retain low lysosomal pH were incubated with lentiviral
particles containing non-target sequence shRNA that should have no effect on V-ATPase
expression and therefore have no influence on lysosomal pH. This approach controls for
any non-specific effects of lentiviral infection, if present. Knockdown of the V-ATPase
subunit was confirmed by western blotting, which showed a significant reduction in
V1E1 expression in cells treated with V1E1 shRNA relative to control (Figure 3.6).
Importantly, knockdown of lysosomal pH using this approach had no discernible effect
on the growth of cells (Figure 3.7). Evaluation of lysosomal pH after subunit knockdown
showed that lysosomal pH was significantly elevated to pH 5.6. We subsequently
evaluated the IC50 of Hsp90 inhibitors in both cell types and calculated selectivity as IC50
in MDA MB 231 cells with low lysosomal pH divided by IC50 in MDA MB 231 cells
with elevated lysosomal pH. Similar to the previous results, selectivity in this pair of cell
lines peaked with compounds of pKa around 8 (Figure 3.8). Inhibitors with pKa greater
than 9 or less than 7 had minimal or no selectivity towards cells with elevated lysosomal
pH. The non-lysosomotropic Hsp90 inhibitor GDA showed no difference in activity in
cells with high or low lysosomal pH, therefore no IDB selectivity. This is consistent with
our hypothesis, and provides support to the conclusion that the differences in activity of
Hsp90 inhibitors did not arise from the procedure employed to elevate lysosomal pH or
the elevated lysosomal pH status itself, but due to a difference in drug distribution of
inhibitors in low versus elevated lysosomal pH cells.
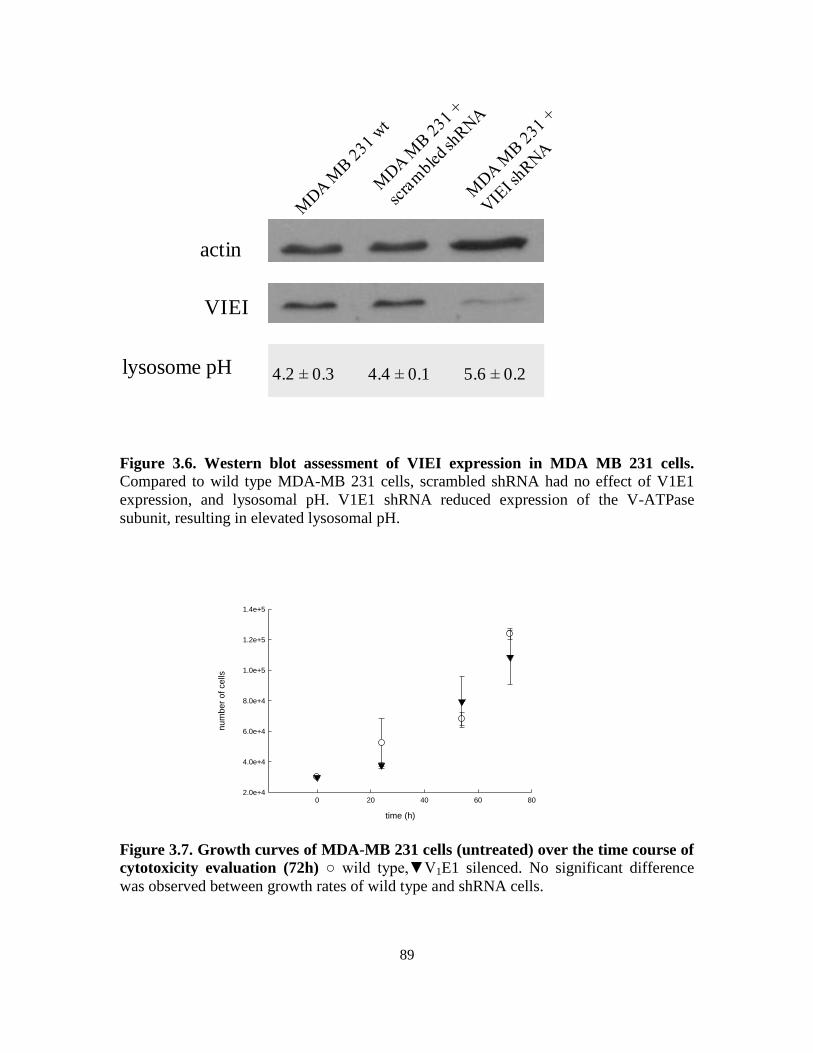
89
actin
VIEI
4.2 0.3 4.4 0.1 5.6 0.2lysosome pH
Figure 3.6. Western blot assessment of VIEI expression in MDA MB 231 cells.
Compared to wild type MDA-MB 231 cells, scrambled shRNA had no effect of V1E1
expression, and lysosomal pH. V1E1 shRNA reduced expression of the V-ATPase
subunit, resulting in elevated lysosomal pH.
time (h)
0 20 40 60 80
num
ber
of
cells
2.0e+4
4.0e+4
6.0e+4
8.0e+4
1.0e+5
1.2e+5
1.4e+5
Figure 3.7. Growth curves of MDA-MB 231 cells (untreated) over the time course of
cytotoxicity evaluation (72h) ○ wild type,▼V1E1 silenced. No significant difference
was observed between growth rates of wild type and shRNA cells.
90
An interesting observation is that the selectivity obtained using identical cells
varying only in lysosomal pH was much greater, and the shape of the IDB selectivity-
pKa curve was different from that observed between normal fibroblasts and HL-60
cancer cells. Several factors could account for this. First, it is possible that the cells lines
vary in the degree of uptake of Hsp90 inhibitors. The plasma membrane permeability,
number of lysosomes as well as lysosome membrane permeability between the cells types
may differ, thus influence the lysosome-to-cytosol distribution. Drug transporters may
also be differentially expressed between the cells lines. Reduced drug uptake in HL-60
cells would reduce the apparent IDB selectivity. Therefore, the ideal model to determine
the influence of intracellular drug distribution differences on selectivity is one of two
identical cell types differing only in lysosomal pH, since both cell types would be
similarly influenced by variables that impact drug uptake and distribution.
3.3.5. Selectivity assessment of other classes of anti-cancer drugs
In the previous studies we employed a series of Hsp90 inhibitors with variable
pKa values to determine the optimal pKa for selectivity enhancement through IDB
targeting. Our results showed that inhibitors with pKa around 8 will have the greatest
enhancement of IDB selectivity. However, to establish the general applicability of the
IDB targeting approach to enhancing the selectivity of anti-cancer drugs, we additionally
tested drugs with mechanisms of action distinct from the Hsp90 inhibitors, with and
without lysosomotropic properties. Mitoxantrone (MTX) and daunorubicin are DNA
alkylating drugs with pKa values of 8 and 8.1, respectively [22]. Accordingly, based on
our hypothesis and previous results, they should be selective to cells with elevated
lysosomal pH.
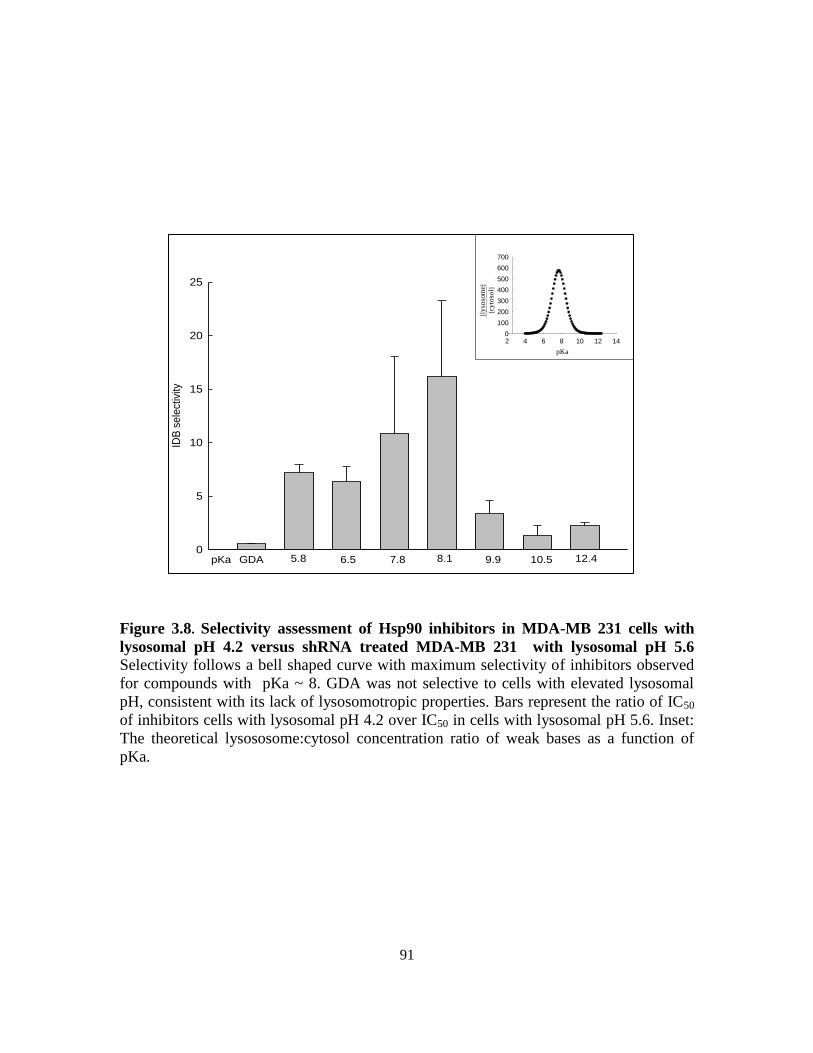
91
ID
B s
ele
ctiv
ity
0
5
10
15
20
25
5.8 6.5 7.8 8.1 9.9 10.5 12.4GDApKa
pKa
2 4 6 8 10 12 14
[lysosom
e]
[c
yto
sol]
0
100
200
300
400
500
600
700
[ly
soso
me]
[cy
toso
l]
pKa
Figure 3.8. Selectivity assessment of Hsp90 inhibitors in MDA-MB 231 cells with
lysosomal pH 4.2 versus shRNA treated MDA-MB 231 with lysosomal pH 5.6
Selectivity follows a bell shaped curve with maximum selectivity of inhibitors observed
for compounds with pKa ~ 8. GDA was not selective to cells with elevated lysosomal
pH, consistent with its lack of lysosomotropic properties. Bars represent the ratio of IC50
of inhibitors cells with lysosomal pH 4.2 over IC50 in cells with lysosomal pH 5.6. Inset:
The theoretical lysososome:cytosol concentration ratio of weak bases as a function of
pKa.
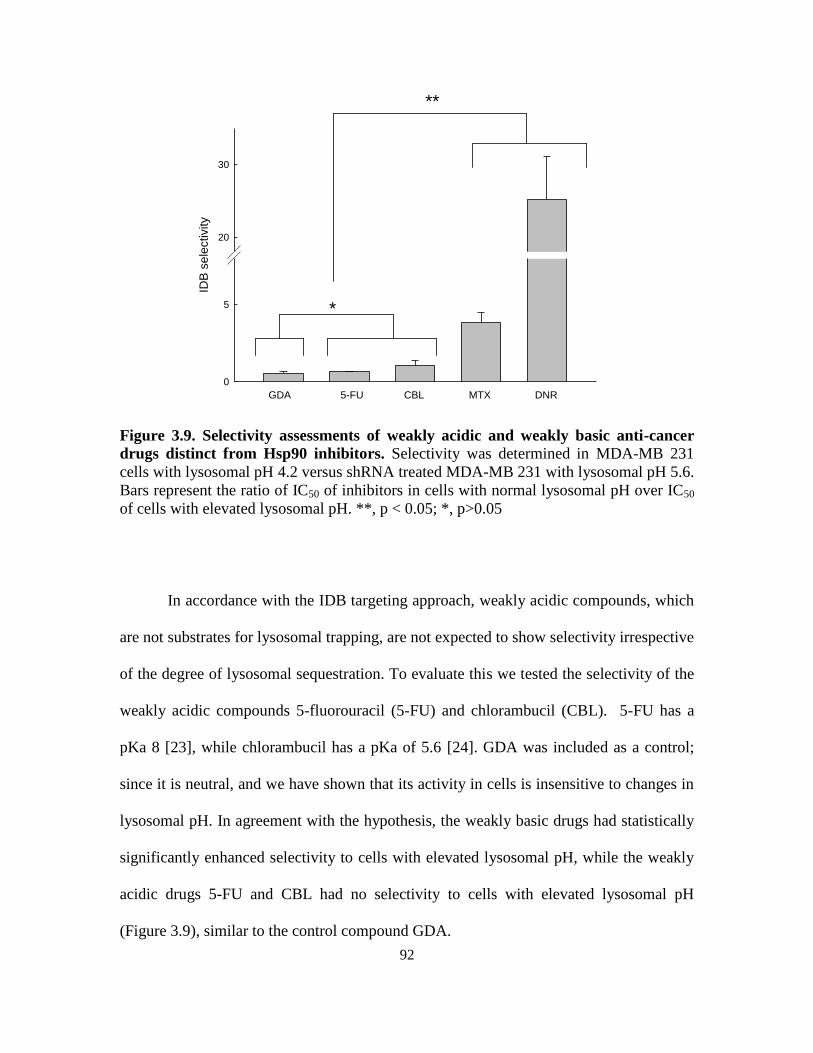
92
Figure 3.9. Selectivity assessments of weakly acidic and weakly basic anti-cancer
drugs distinct from Hsp90 inhibitors. Selectivity was determined in MDA-MB 231
cells with lysosomal pH 4.2 versus shRNA treated MDA-MB 231 with lysosomal pH 5.6.
Bars represent the ratio of IC50 of inhibitors in cells with normal lysosomal pH over IC50
of cells with elevated lysosomal pH. **, p < 0.05; *, p>0.05
In accordance with the IDB targeting approach, weakly acidic compounds, which
are not substrates for lysosomal trapping, are not expected to show selectivity irrespective
of the degree of lysosomal sequestration. To evaluate this we tested the selectivity of the
weakly acidic compounds 5-fluorouracil (5-FU) and chlorambucil (CBL). 5-FU has a
pKa 8 [23], while chlorambucil has a pKa of 5.6 [24]. GDA was included as a control;
since it is neutral, and we have shown that its activity in cells is insensitive to changes in
lysosomal pH. In agreement with the hypothesis, the weakly basic drugs had statistically
significantly enhanced selectivity to cells with elevated lysosomal pH, while the weakly
acidic drugs 5-FU and CBL had no selectivity to cells with elevated lysosomal pH
(Figure 3.9), similar to the control compound GDA.
IDB
se
lectivity
0
5
20
30
GDA 5-FU CBL MTX DNR
*
**
93
3.4. Discussion
The intracellular distribution of drugs is seldom considered in the design of drugs
with optimal activity, yet it is a fundamentally important variable in drug activity, since
drugs must localize in the vicinity of their target in order to achieve their therapeutic
effect. Weakly basic drugs are known to extensively accumulate in acidic lysosomes
[25,26], which can greatly influence their interaction with extra-lysosomal drug targets
and influence activity. Normal cells typically have acidic lysosomes, in which the low pH
is maintained by the activity of the V-ATPase enzyme, which pumps protons into the
lumen of lysosomes against a concentration gradient. The cytosol typically has a pH close
to neutral, creating a lysosome-to-cytosol pH gradient that drives the accumulation of
weak bases into lysosomes. However, defective acidification in some cancer cells
reduces their capacity for lysosomal sequestration of weakly basic drugs, thus increasing
the amount of drug available to interact with extralysosomal targets in cancer cells
relative to normal cells. We hypothesize that these differences in intracellular distribution
of weak bases between normal and cancer cells can be exploited to enhance selectivity to
cancer cells.
In support of this hypothesis, we showed that weakly basic drugs were
significantly less toxic to cells with low lysosomal pH, compared to cells with elevated
lysosomal pH [19]. This intracellular drug distribution-based (IDB) targeting approach to
enhance the selectivity of anticancer drugs represents a paradigm shift from classical
approaches to enhance selectivity, which require that the active anti-cancer agent be
directly targeted to the vicinity of cancer cells while avoiding normal cells. Such ‗magic
bullet‘ targeting approaches have showed some promise, but not a great deal of success
94
particularly due to the difficulty of achieving site-specific localization [1]. The IDB
approach obviates the necessity for tumor specific localization of the drug, since the drug
accumulates to the same extent in both cancer and normal cells, but differences in
intracellular distribution provide selectivity.
In the work outlined in this chapter, we tested whether the IDB targeting approach
could be optimized according to the pKa of the weak base. To carry out our evaluations,
we selected Hsp90 inhibitors as model compounds, since their target – Hsp90 – is
localized in the cytosol [19] therefore their activity should be influenced by the degree of
lysosomal sequestration. The inhibitor geldanamycin (GDA) and its structural analogs
were particularly well-suited for our evaluations since GDA is neutral and therefore non
lysosomotropic, yet is amenable to modification at the 17-position to create analogs with
lysosomotropic properties. We therefore synthesized Hsp90 inhibitors with pKa ranging
from 5.8-12.4 (Figure 3.3) for the selectivity evaluations. The target binding affinity of
the compounds is an important factor to establish, since the binding affinity could
influence the apparent selectivity between compounds. We therefore carried out
competitive Hsp90 binding affinity experiments using a fluorescence polarization assay
that confirmed that these modifications had no significant impact on Hsp90 binding
affinity (see Figure 3.3).
Selectivity was determined as the ratio of anti-proliferative IC50 in normal cells
versus cancer cells. Accordingly, ratios close to one indicate little or no selectivity, while
ratios greater than one indicate a degree of selectivity. Selectivity plotted against the pKa
values of the weakly basic compounds, followed a bell-shaped profile, with maximum
selectivity occurring for compounds with pKa values around 8. GDA, which is neutral
95
and not lysosomotropic, was minimally selective to cancer cells. To establish a rational
explanation for the observed selectivity profile, we evaluated the lysosome-to-cytosol
distribution of weak bases. de Duve and co-workers, published the kinetic principles of
ion trapping [2]. Based on these principles, we derived equation 1, from which we
determined the steady state ratio of a weakly basic drug in lysosomes versus cytosol as a
function of pKa. We assumed a lysosomal pH of 4.2, and a cytosolic pH of 7.4, both of
which are typical of normal cells. For cancer cells, we used a lysosomal pH of 5.6, which
was the lysosomal pH determined for the HL60 cells used in this study. Compounds with
pKa 8 underwent the greatest degree of lysosomal sequestration in both normal and
cancer cells. These results are consistent with similar theoretical simulations published by
Trapp et al., and show that compounds with pKa 8 will have the most extensive
sequestration in lysosomes of normal cells, therefore the least activity in normal cells
resulting in a high selectivity to cancer cells. The observed selectivity profile is therefore
consistent with the differences in intracellular distribution in cells with normal versus
elevated lysosomal pH.
The selectivity results obtained in normal versus cancer cells are consistent with
our hypothesis based on the theoretically determined intracellular distribution profile of
weak bases. However, anticancer drugs typically have intrinsic selectivity to cancer cells
unrelated to their intracellular distribution, due to factors such as metabolic/biochemical
differences between the cell types [27]. For this reason, to explicitly determine the role of
pKa-influenced intracellular drug distribution on selectivity, we also evaluated selectivity
in a pair of cancer cell lines that were otherwise identical, but differed in lysosomal pH.
In our evaluations of lysosomal pH outlined in Chapter 2, we found that some cancer
96
cells maintain a normal lysosomal pH, an example being the MDA-MB-231 cell line. We
reasoned that disrupting lysosomal acidification in this cell line using a genetic
engineering approach would create a corresponding cell line with defective lysosomal
acidification. It is well established that the key regulator of lysosomal pH is the V-
ATPase enzyme, which pumps protons into lysosomes against a concentration gradient
[21]. Lu and co-workers have shown that targeting the V-ATPase for knockdown in
highly metastatic human hepatocellular carcinoma cells reduced the metastatic potential
of the tumors, presumably due to a disruption of the proton pumping activity of the V-
ATPase [19]. We hypothesized that targeting the V-ATPase subunit in MDA MB 231
cancer cells would likewise disrupt the pumping of protons into lysosomes in this cell
line resulting in elevation of lysosomal pH. Using the lysosomal pH determination assay
described in Chapter 2, we confirmed that knockdown of the VIEI subunit of V-ATPase
in MDA MB 231 cells resulted in elevation of lysosomal pH. This procedure had no
discernible effect on the growth of the cells and provided an appropriate model with
which to test the influence of pKa on intracellular distribution and selectivity.
Selectivity evaluations in this pair of cell lines were consistent with the selectivity
profile observed in cancer versus normal cells. As before, maximum selectivity was
observed for weak base pKa values around 8, while selectivity tapered for inhibitors with
pKa values greater than or less than 8. However, the shape of the bell shape curve was
different in the normal/cancer selectivity evaluation compared to the evaluation in
identical cell lines with varying lysosomal pH. This may be due to the fact that normal
cells may differ from cancer cells in the intracellular drug concentration and time to reach
steady state both of which are influenced by membrane permeability. Nevertheless the
97
similarity in shape of the selectivity profile of the two selectivity evaluations, and the fact
that both evaluations identified weak bases with pKa 8, which undergo the greatest
degree of lysosomal sequestration as having optimal selectivity point to intracellular drug
distribution differences in the observed selectivity. GDA did not show selectivity, as
expected since it is not a substrate for lysosomal trapping. The lack of sensitivity of GDA
to the changes in lysosomal pH also provide an appropriate control against the possibility
that the knockdown of V-ATPase through virus mediated shRNA delivery sensitizes cells
to drug treatments through mechanisms unrelated to the impact of knockdown on
lysosomal pH and the corresponding change in drug distribution.
To establish the applicability of the IDB targeting approach towards enhancing
the selectivity of a wide spectrum of anticancer drugs, we broadened our selectivity
evaluations to include additional classes of anticancer drugs. Two weakly basic drugs
with optimal pKa for selectivity, and two weakly acidic drugs were selected. GDA was
employed as a control, since we have shown that its selectivity is not influenced by
changes in lysosomal pH. The weakly basic drugs, mitoxantrone and daunorubicin have
pKa values of 8.1 [19] and 8 [19], respectively. The anti-metabolite 5-FU has a pKa of
8.2 [23], while chlorambucil has a pKa of 5.8 [24]. All of these drugs have DNA as their
target, therefore differences in lysosome-to-cytosol concentrations between cells with low
versus elevated lysosomal pH, or lack thereof, should influence selectivity (or for acidic
drugs, show no difference in selectivity). Consistent with the previous results, both
weakly basic drugs were significantly more selective to cells with elevated lysosomal pH
compared to the control (GDA). Interestingly, despite having close to the same pKa as
DNR, MTX had a much lower selectivity enhancement in comparison to DNR. This may
98
be attributed to the fact that biotransformation of MTX has been shown to involve
oxidative enzymatic intramolecular cyclization of the phenelenediamine structure, which
would result in a product with a much reduced pKa. In this form, the compound would no
longer be an ideal lysosomotropic compound, which would lower its selectivity on the
basis of intracellular distribution. In addition, the lysosome-to-cytosol distribution ratio,
which is influenced by other factors besides pKa (such as the permeability ratio of the
ionized versus the unionized species), may be lower for MTX than DNR. As expected,
the weakly acidic drugs were not selective to cells with elevated lysosomal pH, and were
not different from the GDA control.
It is clear that the physicochemical properties of drugs can have profound effects
on drug distribution and activity. The current results illustrate that optimizing the
physicochemical properties of lysosomotropic anti-cancer drugs can result in compounds
with optimal selectivity to cancer cells with defective lysosomal acidification. These
results provide additional support for the feasibility of the IDB selectivity approach, and
provide a rationale for identifying physicochemical properties of compounds that can
maximize IDB selectivity.
99
3.5. References
1. Stella VJ, Himmelstein KJ (1980) Prodrugs and site-specific drug delivery. J Med
Chem 23: 1275-1282.
2. de Duve C, de Barsy T, Trouet A, Tulkens P, van Hoof F (1974) Lysosomotropic
agents. Biochem Pharmacol 23: 2495 - 2531.
3. Duvvuri M, Konkar S, Funk RS, Krise JM, Krise JP (2005) A chemical strategy to
manipulate the intracellular localization of drugs in resistant cancer
cells. Biochemistry 44: 15743-15749.
4. Stebbins CE, Russo AA, Schneider C, Rosen N, Hartl FU, et al. (1997) Crystal
structure of an Hsp90-geldanamycin complex: targeting of a protein chaperone by
an antitumor agent. Cell 89: 239-250.
5. Tian Z-Q, Liu Y, Zhang D, Wang Z, Dong SD, et al. (2004) Synthesis and biological
activities of novel 17-aminogeldanamycin derivatives. Bioorg Med Chem 12:
5317-5329.
6. Llauger-Bufi L, Felts SJ, Huezo H, Rosen N, Chiosis G (2003) Synthesis of novel
fluorescent probes for the molecular chaperone Hsp90. Bioorg Med Chem Letters
13: 3975-3978.
7. Ndolo RA LY, Duan S, Forrest ML and Krise JP (2011) The pKa of weakly basic
anticancer agents correlates with the degree of differential selectivity to cancer
cells. In preparation.
8. Handloser CS, Chakrabarty MR, Mosher MW (1973) Experimental determination of
pKa values by use of NMR chemical shift. J Chem Edu 50: 510
100
9. Grycová L, Dommisse R, Pieters L, Marek R (2009) NMR determination of pKa
values of indoloquinoline alkaloids. Magnetic Resonance in Chemistry 47: 977-
981.
10. Krezel A, Bal W (2004) A formula for correlating pKa values determined in D2O and
H2O. J Inorg Biochemistry 98: 161-166.
11. Nikolovska-Coleska Z, Wang R, Fang X, Pan H, Tomita Y, et al. (2004)
Development and optimization of a binding assay for the XIAP BIR3 domain
using fluorescence polarization. Anal Biochem 332: 261-273.
12. Ohkuma S, B P (1978) Fluorescence probe measurement of the intralysosomal pH in
living cells and the perturbation of pH by various agents. P Natl Acad Sci USA
75: 3327-3331.
13. Christensen KA, Myers JT, Swanson JA (2002) pH-dependent regulation of
lysosomal calcium in macrophages. J Cell Sci 115: 599-607.
14. Gong Y, Duvvuri M, Krise JP (2003) Separate roles for the Golgi apparatus and
lysosomes in the sequestration of drugs in the multi-drug resistant human
leukemic cell line HL-60. J Biol Chem 278: 50234-50239
15. Bach G, Chen C-S, Pagano RE (1999) Elevated lysosomal pH in Mucolipidosis type
IV cells. Clinica Chimica Acta 280: 173-179.
16. Ohkuma S, Poole B (1978) Fluorescence probe measurement of the intralysosomal
pH in living cells and the perturbation of pH by various agents. P Natl Acad Sci
USA 75: 3327-3331.
101
17. Howes R, Barril X, Dymock BW, Grant K, Northfield CJ, et al. (2006) A
fluorescence polarization assay for inhibitors of Hsp90. Anal Biochem 350: 202-
213.
18. Duvvuri M, Konkar S, Hong KH, Blagg BSJ, Krise JP (2006) A new approach for
enhancing differential selectivity of drugs to cancer Cells. ACS Chem Biol 1:
309-315.
19. Young JC, Moarefi I, Hartl FU (2001) Hsp90: a specialized but essential protein-
folding tool. J Cell Biol 154: 267-274.
20. Lu X, Qin W, Li J, Tan N, Pan D, et al. (2005) The growth and metastasis of human
hepatocellular carcinoma xenografts are inhibited by small interfering RNA
targeting to the subunit ATP6L of proton pump. Cancer Res 65: 6843-6849.
21. Weisz OA (2003) Organelle acidification and disease. Traffic 4: 57-64.
22. Mahoney BP, Raghunand N, Baggett B, Gillies RJ (2003) Tumor acidity, ion trapping
and chemotherapeutics: I. Acid pH affects the distribution of chemotherapeutic
agents in vitro. Biochem Pharmacol 66: 1207-1218.
23. Milano G, Thyss A, Santini J, Frenay M, Francois E, et al. (1989) Salivary passage of
5-fluorouracil during continuous infusion. Cancer Chemother Pharmacol 24: 197-
199.
24. Adair CG, McElnay JC (1986) Studies on the mechanism of gastrointestinal
absorption of melphalan and chlorambucil. Cancer Chemother Pharmacol 17: 95-
98.
25. Anna C. Macintrye DJC (1988) Role of lysosomes in hepatic accumulation of
chloroquine. J Pharm Sci 77: 196-199.
102
26. Daniel WA, Wójcikowski J (1999) Lysosomal trapping as an important mechanism
involved in the cellular distribution of perazine and in pharmacokinetic interaction
with antidepressants. Eur Neuropsychopharm 9: 483-491.
27. Kroemer G, Pouyssegur J (2008) Tumor cell metabolism: Cancer's achilles' heel. 13:
472-482.
103
Chapter 4: The role of lysosomes in limiting drug toxicity in vivo1
1 Reprinted with permission of the American Society for Pharmacology and Experimental Therapeutics.
Copyright © 2010 by The American Society for Pharmacology and Experimental Therapeutics
104
4.1. Introduction
In Chapter 1, the intracellular drug distribution based (IDB) targeting approach to
enhance the selectivity of drugs to cancer cells was introduced and discussed in detail.
Evaluation of the IDB targeting strategy in vitro, using cultured cells, showed that drugs
with lysosomotropic properties were significantly more selective to cells with elevated
lysosomal pH [1]. These studies suggest that design or modifications of cancer drugs to
impart lysosomotropic properties should be beneficial in promoting IDB drug selectivity.
Furthermore, evaluation of lysosomal pH in a variety of cancer cells showed that many
cancer cells were characterized by elevation in lysosomal pH, therefore IDB selectivity
would be applicable to a variety of cancer types.
However, a significant concern remains regarding whether or not purposefully
targeting toxic anticancer agents to lysosomes imparts a degree of safety in vivo. In the
current study, we specifically tested whether sequestration of anticancer drugs in
lysosomes can reduce drug-induced toxicity in vivo. Our hypothesis predicts that control
mice (normal lysosomal pH) will have a high degree of lysosomal sequestration of a
lysosomotropic drug, thus limiting the interaction of extra-lysosomal targets with the
drug. This model also predicts that in experimental mice (with elevated lysosomal pH),
lysosomal sequestration will be reduced, thus increasing drug-target interactions and
toxicity.
We therefore evaluated this drug selectivity platform in vivo using Hsp90
inhibitors with or without lysosomotropic properties. Specifically, we examined if
lysosomotropic anticancer agents were relatively less toxic to mice with normal
lysosomal pH, compared to mice with elevated lysosomal pH, due to changes in
105
intracellular distribution. If this is the case then raising the lysosomal pH of mice should
cause a redistribution of a lysosomotropic drug from lysosomes, which would allow the
drug to interact with the intended target molecules and exert its toxic effects to a greater
degree. Conversely, since the intracellular distribution of non-lysosomotropic
compounds is not influenced by the lysosome-to-cytosol pH gradient, the toxicity of such
drugs should not be affected by changes in lysosomal pH.
To elevate lysosomal pH in mice, we used chloroquine, which has been shown to
raise lysosomal pH in cultured cells [2] and developed an assay to determine the impact
of chloroquine treatments on lysosomal pH in mice. Toxicity of Hsp90 inhibitors was
evaluated by assessing morbidity, and by utilizing biochemical assays to diagnose hepatic
and renal toxicity. Consistent with previous in vitro results, toxicity of the lysosomotropic
inhibitor 17-DMAG was significantly enhanced in mice with elevated lysosomal pH
relative to mice with normal lysosomal pH. Conversely, elevation of lysosomal pH had
no significant impact on toxicity of the non-lysosomotropic inhibitor, geldanamycin
(GDA). The fact that CQ treatment had no impact on GDA toxicity serves as an
important control, since it shows that CQ treatment does not enhance the toxicity of
Hsp90 inhibitors in general, but only that of inhibitors with lysosomotropic properties.
Therefore, our results support the notion that the low lysosomal pH of normal cells plays
an important role in protecting normal tissues from the toxic effects of anticancer agents
with lysosomotropic properties. These results have implications for the design/selection
of anticancer drugs with improved safety and differential selectivity.
106
4.2. Materials and Methods
4.2.1. Animals
The present study was performed with approval from the University of Kansas
Institutional Animal Care and Use Committee (IACUC). Male Balb/C mice (10-12 weeks
old) were obtained from the Charles River Laboratories (Wilmington, MA). Animals
were housed under standard conditions in a 12-h light/dark cycle and with free access to
commercial food pellets and water.
4.2.2. Chemicals
Geldanamycin (GDA) was obtained from LC Laboratories (Woburn, MA), and
17-dimethylaminoethylamino-17-demethoxy-geldanamycin (17-DMAG) was synthesized
and characterized by Dr. Laird Forrest according to a previously published method [3].
All other reagents were obtained from Sigma (St. Louis, MO), unless otherwise stated.
4.2.3. Drug treatments and morbidity evaluations in mice
Dosing protocols for the Hsp90 inhibitors, GDA and 17-DMAG, were
experimentally arrived at by determining a regimen that resulted in symptoms of acute
toxicity (morbidity) in approximately 20% of animals in a treatment group (n = 10).
Accordingly, 17-DMAG was administered i.p. at a dose of 75 mg/kg on days 1-2, and 30
mg/kg on day 3. GDA was administered i.p. at a dose of 3.5 mg/kg on days 1-4 and 7
mg/kg on days 5-9. To elevate lysosomal pH in mice, indicated groups of mice were
pretreated with 50 mg/kg/day chloroquine [4] by i.p. administration for 5 days prior to,
and concurrent with, dosing of the Hsp90 inhibitors at the aforementioned doses. During
107
concurrent dosing of CQ and Hsp90 inhibitors, CQ was administered 2-3 hours prior to
Hsp90 inhibitor treatment. CQ and 17-DMAG were reconstituted in normal saline (200
µL) and GDA was dissolved in neat DMSO (30 µL/dose) for i.p. administrations. The
day after completion of dosing, the presence of morbid symptoms was determined by an
experienced blinded observer. Animals were considered morbid if they were severely
immobile, hunched in posture, experiencing severe diarrhea, hypothermic, not eating
and/or if they were unresponsive to noise. At the conclusion of treatments (days 4 and 10
for 17-DMAG and GDA, respectively), or after signs of morbidity were detected, mice
were euthanized via cardiac puncture and exsanguinations.
4.2.4. Elevation and measurement of lysosomal pH in mice
To elevate lysosomal pH in mice, i.p. injections of 50 mg/kg/day CQ diphosphate
were given for five days (untreated group received i.p injections of saline). To evaluate
the effect of CQ treatment on lysosomal pH, mice were dosed via tail vein injection with
100 μL of a 5 mg/ml solution of the pH responsive dye, Oregon Green 488 conjugated to
70,000 MW dextran (Invitrogen, CA). Dextran polymers of this molecular size are
known to extensively localize in the liver shortly after administration [5]. Whole livers
were imaged using the Maestro In Vivo Imaging System (Woburn, MA) to confirm
fluorescence probe localization in the liver. To determine lysosomal pH, hepatocytes
were isolated from mice dosed with Oregon Green dextran 6h after dosing (to allow
Oregon Green dextran to localize in lysosomes), using a previously published technique
[6], with modifications. Following sacrifice via cardiac puncture and exsanguination,
mouse organs were perfused through an incision in the left ventricle at a flow rate of 7
108
mL/min using the following buffers and times of perfusion: i) perfusion buffer A,
containing 142 mM NaCl, 6.7 mM KCl, 25 mM NaHCO3 (adjusted to pH 7.4 with 1N
HCl) for 5 min; ii) perfusion buffer A to which 0.5mM EGTA was added, for 5 min; iii)
perfusion buffer A for 3 min and; iv) perfusion buffer A containing 0.05%
collagenase/dispase (Roche Diagnostics, Indianapolis, IN) and 5mM CaCl2 for 5 min.
During the procedure, perfusate was drained via an incision in the right atrium of the
heart. Livers were excised and collected into the solution containing perfusion buffer A
with 0.05% collagenase and 5 mM CaCl2. Livers were subsequently minced under sterile
conditions using a scalpel and incubated at 37°C for 10 min with occasional agitation.
The cell suspension was filtered through a 100 µM cell strainer (Fisher, Woburn, MA).
The filtrate was then centrifuged at 50g for 5min and the pellet washed twice in buffer B
containing 142 mM NaCl, 6.7mM KCl, 1.2 mM CaCl2, 10 mM Hepes, pH 7.4.
Lysosomal pH was then measured using a previously published technique [7,8,9].
Briefly, freshly isolated hepatocytes were re-suspended in pH 7.4 buffer containing
150mM NaCl, 20mM Mes, 5mM KCl, and 1mM MgSO4. Cells were placed onto a
microscope slide, sealed with a cover slip and the ratio of Oregon Green emission at 495
and 450 nm excitation measured through a 525/10 nm band pass filter using a microscope
adapted Ratiomaster spectrofluorimeter (PTI, Trenton, NJ), equipped with a
photomultiplier tube detector. To create a calibration curve for pH determination
isolated hepatocytes were separately resuspended in pH 4, 5, 5.5, 6 or 7 buffers
containing the ionophores nigericin (10 μM) and monensin (20 μM) as previously
described [7,10].
109
4.2.5. Fluorescence microscopy
To confirm whether the Oregon Green-labeled dextran administered to mice was
localized in lysosomes 6 hours after i.v. injection in mice, freshly isolated hepatocytes
were incubated with 50-100 nM LysoTracker Red (Invitrogen, CA), for 30 min at 37 °C,
washed twice with PBS and viewed with an Olympus spinning disk confocal microscope
using the appropriate filter sets to visualize Oregon Green 488 and LysoTracker (LTR)
Red. To visualize colocalization, images obtained by the respective filters were overlaid
using Metamorph Software (Version 7.0). To evaluate the influence of CQ-induced
elevation of lysosomal pH on intracellular distribution of LTR, normal skin fibroblasts
(CRL-2076, ATCC, Manassas, VA) were plated on coverslips sterilized with 90%
ethanol followed by irradiation with UV light for 1h, and allowed to adhere overnight.
Labeling of cells with LTR was then carried out as described above. Cells pre-treated
with CQ were labeled with 100µM CQ for 30 min, prior to co-incubation for a further
30min with LTR. HL60 cells (suspension) were labeled by replacing growth media with
media containing 100nM LTR after centrifugation at 1200g using an Eppendorf
microcentrifuge. After rinsing X3 with PBS, adherent cells on coverslips were inverted
onto microscope slides, and sealed. Suspension cells were pipetted onto slides, coverslips
placed over them, sealed and imaged. Images were acquired using a Hamamatsu Orca-ER
camera mounted on a Nikon 80i upright epifluorescence microscope, through a Cy3
filter.
110
4.2.6. Biochemical assays of serum arginase activity and serum creatinine
At the time of euthanasia, blood was collected into heparinized microcentrifuge
tubes and centrifuged in a Mini Spin Plus Eppendorf Centrifuge (Hamburg, Germany) for
10 min at 4000 rpm. Plasma was immediately collected and stored at -80°C until assays
to evaluate hepatic and renal toxicity were performed. To comparatively assess hepatic
toxicity, a commercially available colorimetric arginase activity kit (BioAssay systems,
Hayward, CA) was utilized according to the manufacturer‘s instructions. Samples were
desalted prior to analysis using desalting spin columns (Pierce, Rockford, IL). To assess
renal toxicity, a commercial creatinine assay kit (BioVision, Mountain View, CA) was
utilized according to manufacturer‘s instructions. Prior to analysis, samples were depleted
of protein using a 10,000 MW cut-off filter (Millipore, MA).
4.2.7. Analysis of tissue/plasma drug concentrations
4.2.7.1. Drug treatments
To determine drug concentrations in tissue and plasma, mice were dosed twice
with 50mg/kg/day 17-DMAG and 15 mg/kg/day GDA. Mice pre-treated with
chloroquine to elevate lysosomal pH received 50 mg/kg chloroquine diphosphate for 5
days prior to, and concurrent with dosing with Hsp90 inhibitors. Mice were sacrificed via
cardiac puncture and exsanguination 15 min and 3h, respectively, after administration of
the second dose of Hsp90 inhibitors. Plasma samples were collected as described
previously and stored at -80°C until analysis of drug concentration was performed. Prior
to organ collection, organs were perfused, as described previously, with PBS at a flow
111
rate of 8 mL/min for 5min. Liver, kidneys, heart, lungs and spleen were harvested and
stored at -80°C.
4.2.7.2. Sample preparation and HPLC analysis
N-phenyl-1-naphthylamine was used as an internal standard (IS). Prior to drug
extraction, tissue samples were weighed and homogenized in 0.5 -1mL PBS containing
IS using a Sonic Dismembrator Model 500 (Fisher Scientific, Pittsburg, PA) tissue
homogenizer. Samples were mixed with acetonitrile or ethyl acetate (1:1 v/v) for
extraction of 17-DMAG and GDA, respectively. Samples were vortexed for 15s each,
then centrifuged at 16100g for 10min. The organic phases were removed and evaporated
to dryness under vacuum centrifugation. Samples were reconstituted in initial mobile
phase and analyzed using an Agilent Series 1200 HPLC system equipped with a binary
pump, autosampler and variable wavelength detector. For analysis of 17-DMAG, mobile
phase A consisted of 50mM acetic acid containing 10mM triethylamine [11] and B
consisted of methanol containing 10mM TEA. UV absorbance was monitored at 332 nm.
A step gradient elution method was employed as follows: 70-90 % B in 10min, 90-70%B
in 1min and maintained at 70% B for 3 min. For analysis of GDA, mobile phase A
consisted of 2% methanol in 0.1% formic acid in H2O and B consisted of 95% methanol
in 0.1% formic acid in H2O. An isocratic elution method using 85% B was employed. UV
absorbance was monitored at 308 nm. Standard curves were constructed by plotting the
peak area ratio of 17-DMAG and GDA to that of the internal standard against
concentration, and were linear in the range studied. Linear regression was used to
112
determine the equation of line of best fit. The result of the regression analysis was used to
determine analyte concentrations in tissue and plasma samples.
4.2.8. Histopathology.
Tissue samples from euthanized mice were preserved in 10% neutral buffered
formalin at the time of sacrifice. Samples were processed for routine automated paraffin
infiltration and embedding. Paraffin blocks were sectioned at 5µm and stained with
hematoxylin and eosin. Sections were processed and evaluated by a board certified
veterinary pathologist who interpreted the specimens without information regarding
treatment protocol (i.e. a blinded study). Histological changes were scored for severity
of injury on a scale of 1 to 5 (5 being most severe), after a preliminary review of all slides
to determine the range of lesions. Microscopic descriptions and diagnoses were then
determined.
4.2.9. Statistical Analysis.
Data presentation and statistical analysis was carried out using Sigma Plot 10.0
(SPSS, Chicago, IL). Data is represented as means with standard deviation where
applicable. Statistical analyses of significance (p values) were derived from one-tailed t-
tests.
113
4.3. Results
4.3.1. Lysosomal pH elevation in mice
According to our proposed drug selectivity platform, the low lysosomal pH of
normal cells plays an important role in protecting tissues from the harmful effects of
anticancer agents with lysosomotropic properties due to their extensive sequestration in
this compartment. To test this theory in vivo requires a procedure to significantly raise
the lysosomal pH in the cells of mice to levels that have been previously observed for
cancer cells with defective acidification in vitro (~ pH 6), such as was measured for the
MCF-7 cell line [12]. Elevating lysosomal pH in cultured cells is routinely done using a
number of different approaches but, to our knowledge, such approaches have not been
previously established in vivo. Inhibitors of the vacuolar-HP
+P-ATPase, such as
concanamycin A, are effective agents in raising lysosomal pH [13]; however, their use in
animals has not been previously established. Alternatively, the anti-malarial drug
chloroquine [4] is known to be very well tolerated in both humans and animals and is
known to raise lysosomal pH in cultured cells. To examine if this compound altered
lysosomal pH in vivo, we utilized the pH sensitive dye (Oregon Green) attached to high
molecular weight dextran polymers to determine lysosomal pH. Mehvar and coworkers
have previously shown that 70,000 MW dextran polymers localize predominantly in the
liver shortly after a tail vein injection in mice and their concentration in this organ
remains virtually unchanged for up to 48 hours afterwards [5]. We therefore injected
70,000 MW Oregon Green-labeled dextran into the tail vein of mice and visualized
dextran localization in livers by extracting and imaging the organ. In both treatment
groups, dextran was significantly associated with the liver (Figure 4.1). In the
114
immunolocalization studies described in Chapter 2 to evaluate the time-dependent
localization of high-molecular weight dextran in lysosomes, we found that 6h was
sufficient amount of time for endocytosed dextran molecules to traverse through the early
and late endocytic compartments and predominantly localize within lysosomes. We
therefore waited 6 hours to allow the dextran that accumulated in the liver to reach
terminal lysosomes. To confirm whether the Oregon Green labeled dextran was localized
in lysosomes prior to determination of lysosomal pH; isolated hepatocytes were labeled
with the lysosomal vital stain, LysoTracker Red. Oregon Green dextran was found to
significantly colocalize with LysoTracker Red, which suggests that the dextran was
predominantly localized within lysosomes (Figure 4.2). Evaluating ratios of the
fluorescence intensities at different wavelengths allowed us to estimate liver cell
lysosomal pH in untreated mice to be 4.2 ± 0.2 (n=3), which is in close agreement with
previous reports on normal lysosomal pH [10,14]. Dosing mice with CQ i.p. (50
mg/kg/day for 5 days) resulted in a significant elevation in lysosomal pH to a value of 5.6
± 0.3 (n=3). Although these treatments with CQ are higher than typical therapeutic doses
administered to mice, which is typically 10mg/kg i.p. for 3-4 days [15], there were no
visible side effects or toxicities in mice (data not shown). CQ was subsequently used to
examine the influence of elevated lysosomal pH on anticancer drug toxicity in mice in the
remainder of the studies.
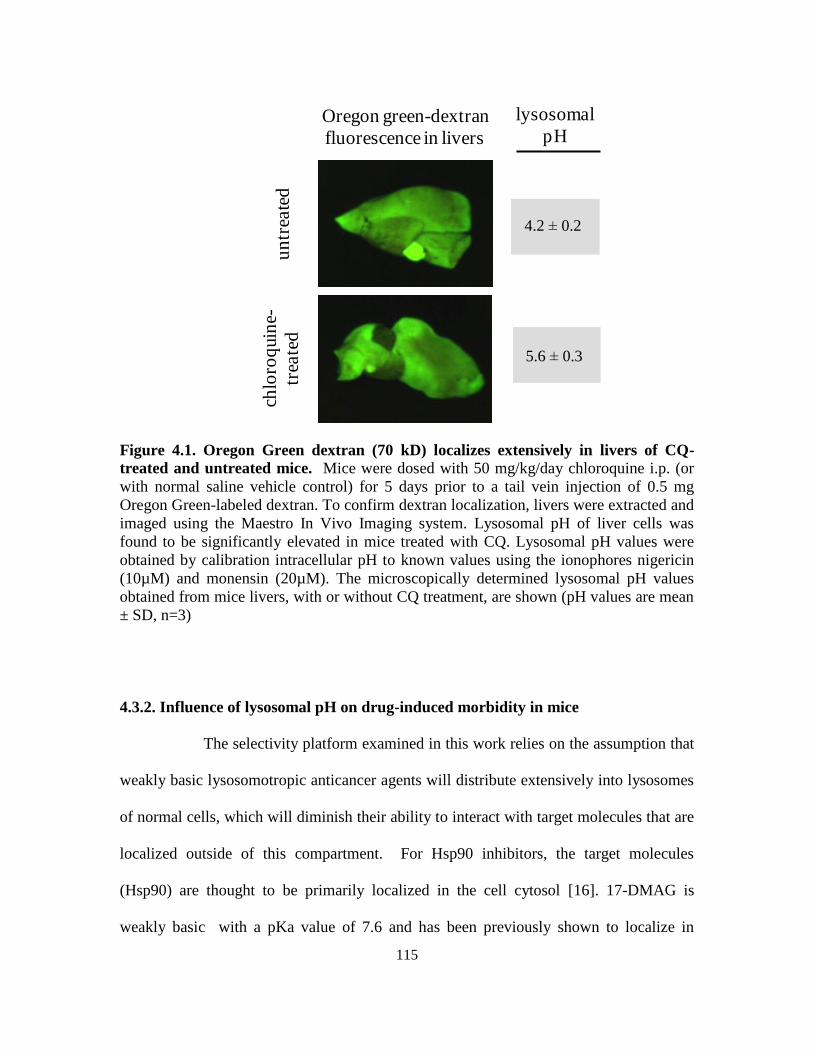
115
chlo
roq
uin
e-
trea
ted
un
trea
ted
lysosomal
pH
4.2 0.2
5.6 0.3
Oregon green-dextran
fluorescence in livers
Figure 4.1. Oregon Green dextran (70 kD) localizes extensively in livers of CQ-
treated and untreated mice. Mice were dosed with 50 mg/kg/day chloroquine i.p. (or
with normal saline vehicle control) for 5 days prior to a tail vein injection of 0.5 mg
Oregon Green-labeled dextran. To confirm dextran localization, livers were extracted and
imaged using the Maestro In Vivo Imaging system. Lysosomal pH of liver cells was
found to be significantly elevated in mice treated with CQ. Lysosomal pH values were
obtained by calibration intracellular pH to known values using the ionophores nigericin
(10µM) and monensin (20µM). The microscopically determined lysosomal pH values
obtained from mice livers, with or without CQ treatment, are shown (pH values are mean
± SD, n=3)
4.3.2. Influence of lysosomal pH on drug-induced morbidity in mice
The selectivity platform examined in this work relies on the assumption that
weakly basic lysosomotropic anticancer agents will distribute extensively into lysosomes
of normal cells, which will diminish their ability to interact with target molecules that are
localized outside of this compartment. For Hsp90 inhibitors, the target molecules
(Hsp90) are thought to be primarily localized in the cell cytosol [16]. 17-DMAG is
weakly basic with a pKa value of 7.6 and has been previously shown to localize in
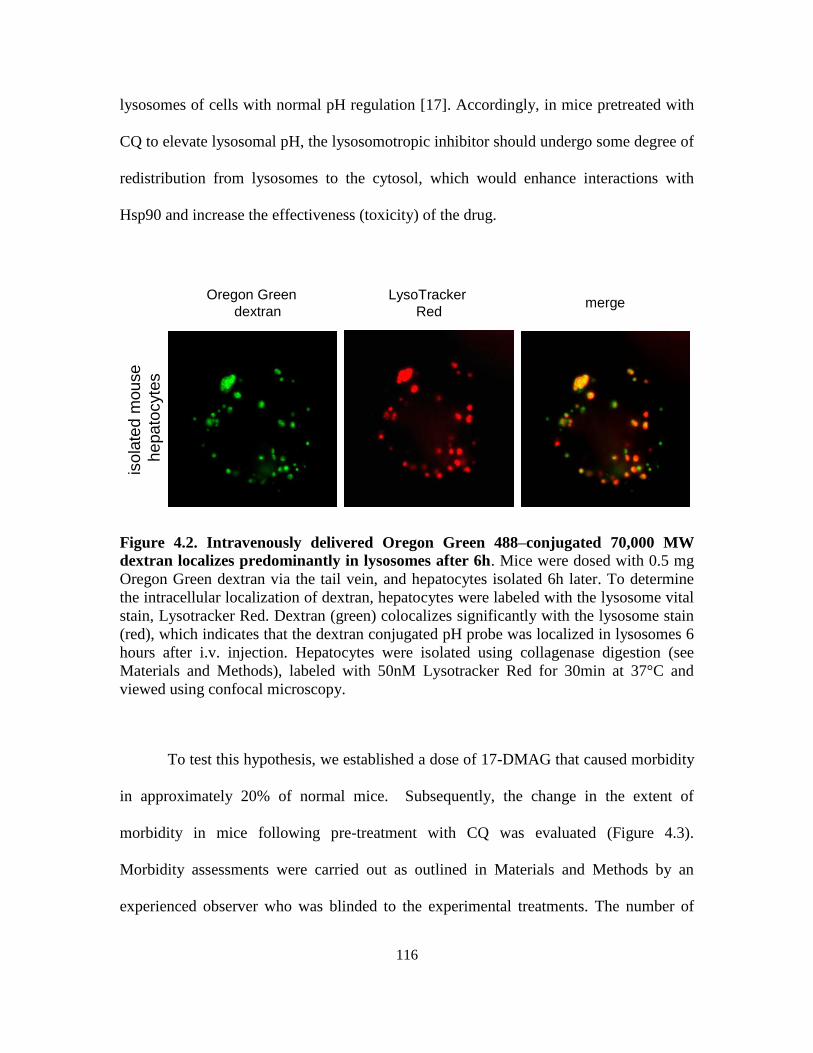
116
lysosomes of cells with normal pH regulation [17]. Accordingly, in mice pretreated with
CQ to elevate lysosomal pH, the lysosomotropic inhibitor should undergo some degree of
redistribution from lysosomes to the cytosol, which would enhance interactions with
Hsp90 and increase the effectiveness (toxicity) of the drug.
Figure 4.2. Intravenously delivered Oregon Green 488–conjugated 70,000 MW
dextran localizes predominantly in lysosomes after 6h. Mice were dosed with 0.5 mg
Oregon Green dextran via the tail vein, and hepatocytes isolated 6h later. To determine
the intracellular localization of dextran, hepatocytes were labeled with the lysosome vital
stain, Lysotracker Red. Dextran (green) colocalizes significantly with the lysosome stain
(red), which indicates that the dextran conjugated pH probe was localized in lysosomes 6
hours after i.v. injection. Hepatocytes were isolated using collagenase digestion (see
Materials and Methods), labeled with 50nM Lysotracker Red for 30min at 37°C and
viewed using confocal microscopy.
To test this hypothesis, we established a dose of 17-DMAG that caused morbidity
in approximately 20% of normal mice. Subsequently, the change in the extent of
morbidity in mice following pre-treatment with CQ was evaluated (Figure 4.3).
Morbidity assessments were carried out as outlined in Materials and Methods by an
experienced observer who was blinded to the experimental treatments. The number of
Oregon Green
dextran
LysoTracker
Redmerge
Oregon Green
dextran
LysoTracker
Redmerge
Oregon Green
dextran
LysoTracker
Redmerge
iso
late
d m
ou
se
he
pa
tocyte
s
117
morbid animals in each group were counted and represented as a percentage of the total
number of mice per treatment group. Consistent with our hypothesis, mice with elevated
lysosomal pH experienced significantly greater morbidity compared to those with normal
lysosomal pH that received the same dose drug.
Despite the fact that neither the drug vehicles (normal saline or DMSO) nor CQ
treatment alone resulted in any morbidity to mice at the doses employed (0/10 morbid), it
is possible that the CQ treatment could cause some additive toxicity unrelated to the
changes in lysosomal pH when co-administered with 17-DMAG. To address this we
additionally examined the impact of CQ pretreatment on morbidity in mice dosed with
the neutral, non-lysosomotropic inhibitor GDA. CQ pretreatment had no impact on
morbidity in mice dosed with the neutral, non-lysosomotropic inhibitor GDA. As with
17-DMAG, we arrived at a dosing regimen of GDA that caused approximately 20% of
the group to show signs of morbidity and subsequently examined the influence of CQ
pretreatment on GDA-induced toxicity. CQ-pretreated mice experienced no significant
increase in morbidity when dosed with GDA (Figure 4.3).
4.3.3. Influence of lysosomal pH on drug-induced changes in liver and kidney
function
To quantitatively assess the trends observed with the previously described
morbidity evaluations, biochemical assays of liver and kidney function were performed
on plasma samples from mice in all treatment groups. The toxicity of Hsp90 inhibitors
has previously been shown to be primarily associated with liver and kidneys [18].
Therefore, the effect of treatment on the function or integrity of these organs was
118
comparatively assessed for each drug treatment with or without CQ pretreatment. Serum
arginase levels were measured as a specific diagnostic of liver integrity. Arginase I has
been evaluated as a Arginase I has been evaluated as a highly-specific hepatotoxicity
marker, and its activity is found to be elevated in the serum of animals as a result of liver
damage or injury [19]. Consistent with previous morbidity results, mice treated with 17-
DMAG alone had relatively low serum arginase activities, while CQ pre-treatment prior
to 17-DMAG treatment resulted in significantly elevated arginase activity levels
consistent with increased liver damage (Figure 4.4). Conversely, the CQ pre-treatments
resulted in no significant change in serum arginase levels (p>0.01) in mice treated with
the non-lysosomotropic inhibitor GDA (Figure 4.4). Creatinine levels in serum are
routinely used as an indicator of renal function. An increase in serum creatinine indicates
defective renal function that may be caused by drug toxicity. We therefore measured the
levels of creatinine in plasma of all drug treatment and control groups. We observed no
statistically significant differences in serum creatinine levels between control and CQ
pre-treated mice receiving 17-DMAG, which could be attributed to high levels of animal-
to-animal variability in creatinine levels (Figure 4.5). Serum creatinine levels in GDA
treated mice were significantly higher than control (p<0.01), but as expected, there was
no difference in serum creatinine levels with or without CQ pre-treatment. Compared to
control mice, there was no significant change in serum arginase activity and creatinine
levels (p>0.01) in mice dosed with CQ alone, GDA vehicle (DMSO) alone or CQ and
DMSO together (Figures 4.4 and 4.5).
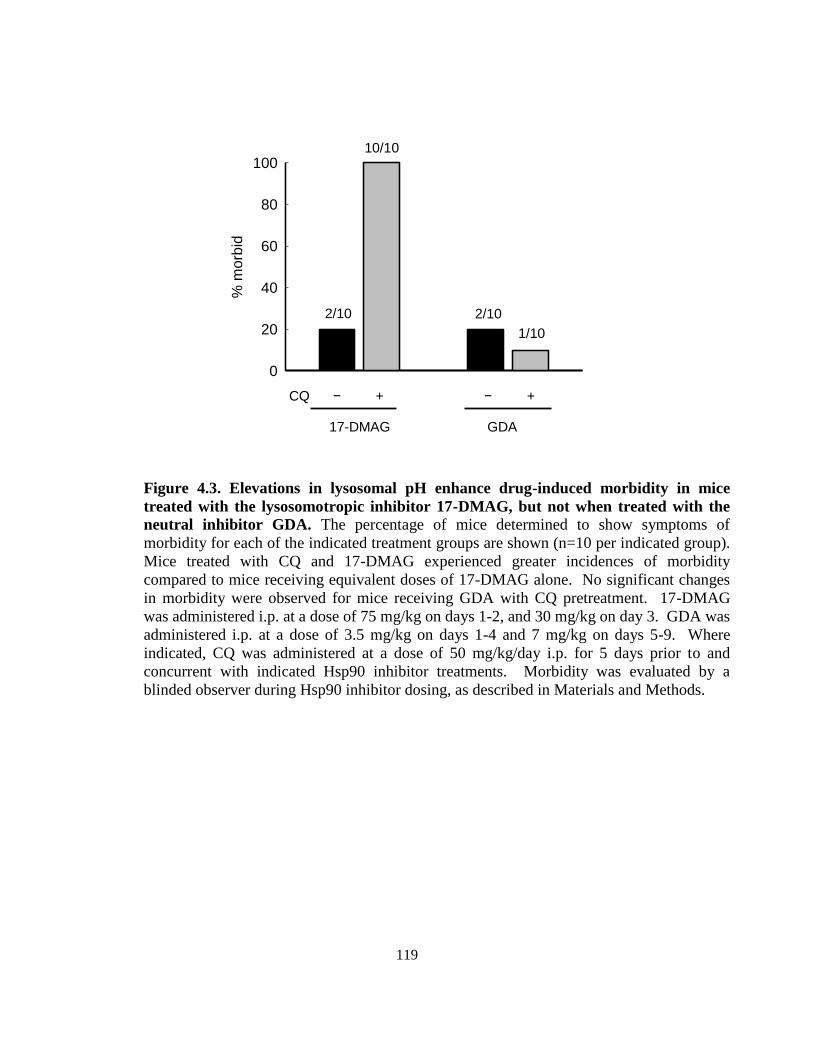
119
Figure 4.3. Elevations in lysosomal pH enhance drug-induced morbidity in mice
treated with the lysosomotropic inhibitor 17-DMAG, but not when treated with the
neutral inhibitor GDA. The percentage of mice determined to show symptoms of
morbidity for each of the indicated treatment groups are shown (n=10 per indicated group).
Mice treated with CQ and 17-DMAG experienced greater incidences of morbidity
compared to mice receiving equivalent doses of 17-DMAG alone. No significant changes
in morbidity were observed for mice receiving GDA with CQ pretreatment. 17-DMAG
was administered i.p. at a dose of 75 mg/kg on days 1-2, and 30 mg/kg on day 3. GDA was
administered i.p. at a dose of 3.5 mg/kg on days 1-4 and 7 mg/kg on days 5-9. Where
indicated, CQ was administered at a dose of 50 mg/kg/day i.p. for 5 days prior to and
concurrent with indicated Hsp90 inhibitor treatments. Morbidity was evaluated by a
blinded observer during Hsp90 inhibitor dosing, as described in Materials and Methods.
% m
orb
id
0
20
40
60
80
100
CQ − + − +
GDA17-DMAG
2/10
10/10
2/10
1/10
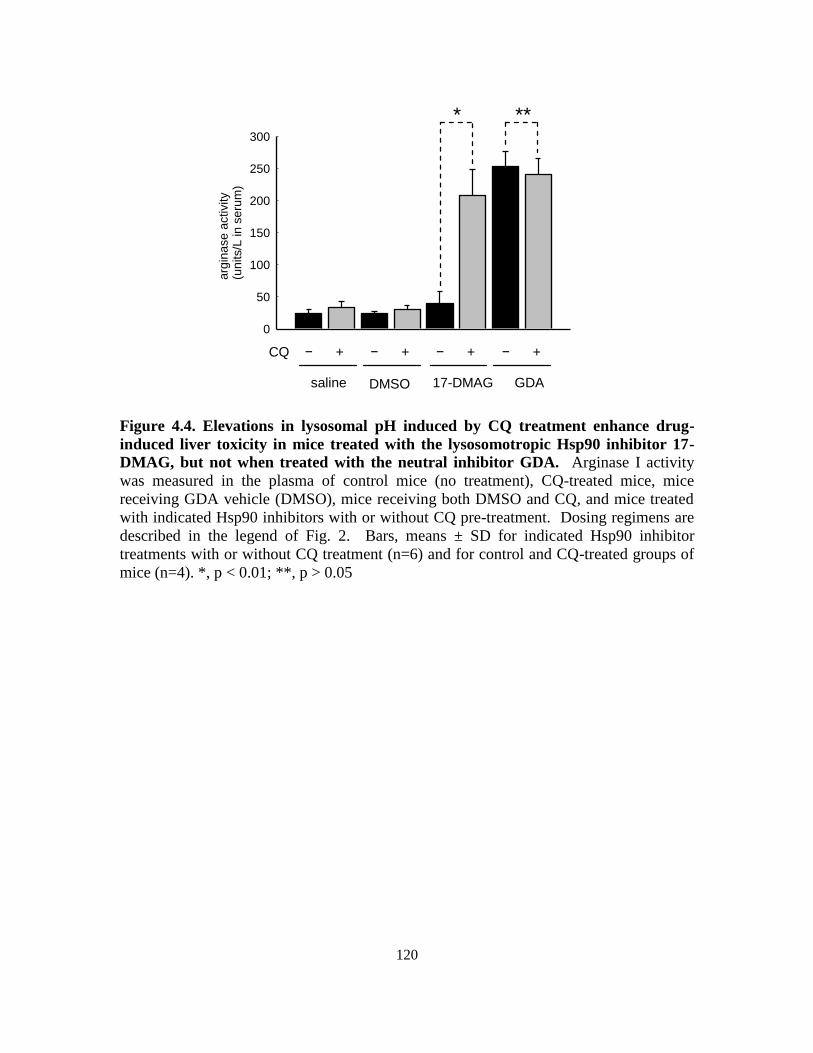
120
Figure 4.4. Elevations in lysosomal pH induced by CQ treatment enhance drug-
induced liver toxicity in mice treated with the lysosomotropic Hsp90 inhibitor 17-
DMAG, but not when treated with the neutral inhibitor GDA. Arginase I activity
was measured in the plasma of control mice (no treatment), CQ-treated mice, mice
receiving GDA vehicle (DMSO), mice receiving both DMSO and CQ, and mice treated
with indicated Hsp90 inhibitors with or without CQ pre-treatment. Dosing regimens are
described in the legend of Fig. 2. Bars, means ± SD for indicated Hsp90 inhibitor
treatments with or without CQ treatment (n=6) and for control and CQ-treated groups of
mice (n=4). *, p < 0.01; **, p > 0.05
arg
inase a
ctivity
(units/L
in
se
rum
)
0
50
100
150
200
250
300
CQ − + − + − + − +
GDA17-DMAGDMSOsaline
* **
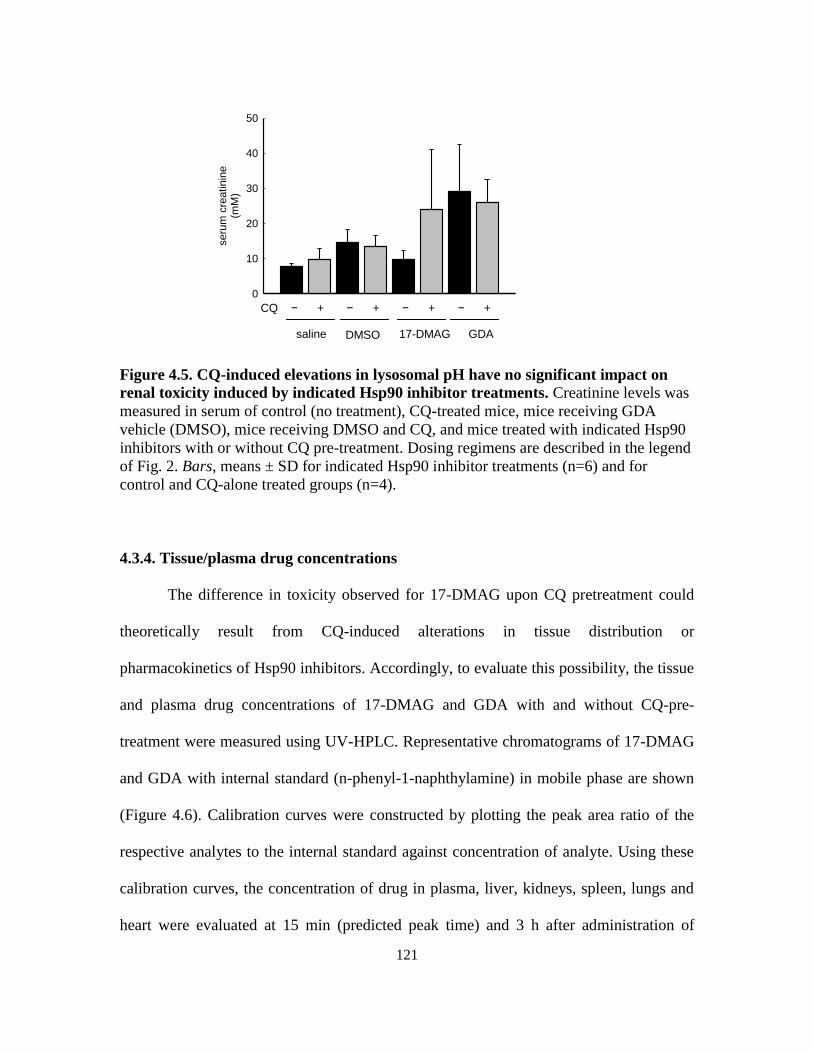
121
Figure 4.5. CQ-induced elevations in lysosomal pH have no significant impact on
renal toxicity induced by indicated Hsp90 inhibitor treatments. Creatinine levels was
measured in serum of control (no treatment), CQ-treated mice, mice receiving GDA
vehicle (DMSO), mice receiving DMSO and CQ, and mice treated with indicated Hsp90
inhibitors with or without CQ pre-treatment. Dosing regimens are described in the legend
of Fig. 2. Bars, means ± SD for indicated Hsp90 inhibitor treatments (n=6) and for
control and CQ-alone treated groups (n=4).
4.3.4. Tissue/plasma drug concentrations
The difference in toxicity observed for 17-DMAG upon CQ pretreatment could
theoretically result from CQ-induced alterations in tissue distribution or
pharmacokinetics of Hsp90 inhibitors. Accordingly, to evaluate this possibility, the tissue
and plasma drug concentrations of 17-DMAG and GDA with and without CQ-pre-
treatment were measured using UV-HPLC. Representative chromatograms of 17-DMAG
and GDA with internal standard (n-phenyl-1-naphthylamine) in mobile phase are shown
(Figure 4.6). Calibration curves were constructed by plotting the peak area ratio of the
respective analytes to the internal standard against concentration of analyte. Using these
calibration curves, the concentration of drug in plasma, liver, kidneys, spleen, lungs and
heart were evaluated at 15 min (predicted peak time) and 3 h after administration of
seru
m c
reatinin
e
(
mM
)
0
10
20
30
40
50
CQ − + − + − + − +
GDA17-DMAGDMSOsaline
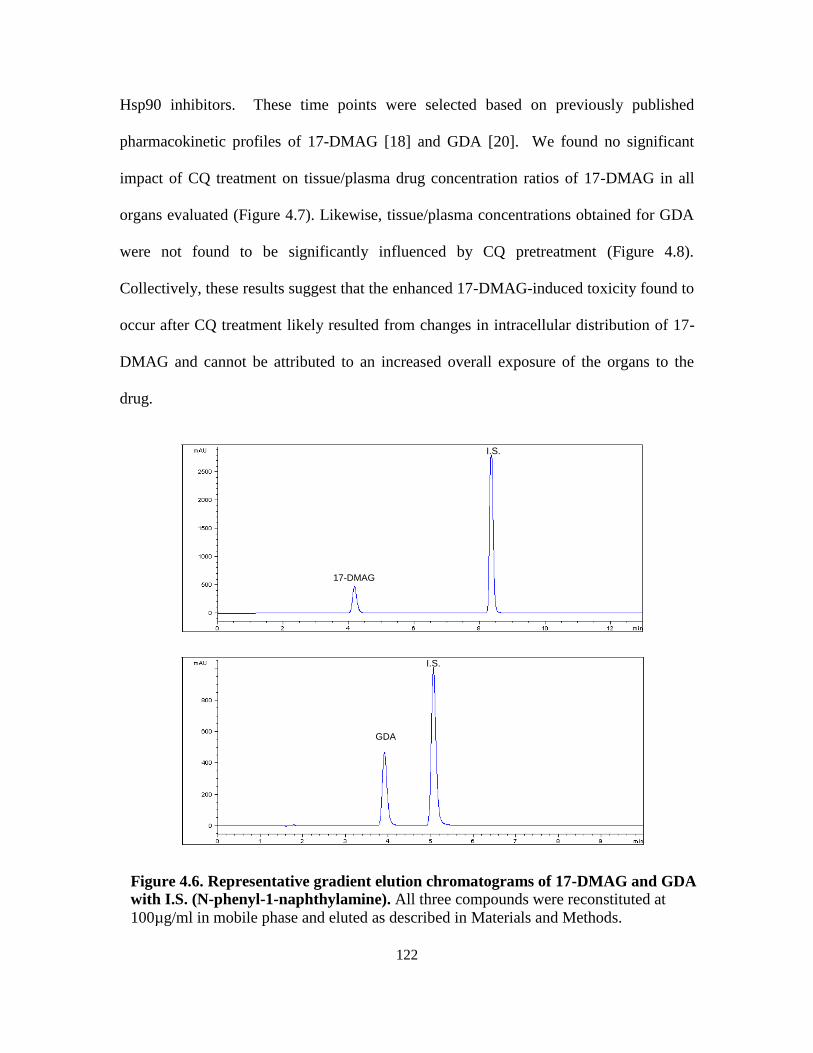
122
Hsp90 inhibitors. These time points were selected based on previously published
pharmacokinetic profiles of 17-DMAG [18] and GDA [20]. We found no significant
impact of CQ treatment on tissue/plasma drug concentration ratios of 17-DMAG in all
organs evaluated (Figure 4.7). Likewise, tissue/plasma concentrations obtained for GDA
were not found to be significantly influenced by CQ pretreatment (Figure 4.8).
Collectively, these results suggest that the enhanced 17-DMAG-induced toxicity found to
occur after CQ treatment likely resulted from changes in intracellular distribution of 17-
DMAG and cannot be attributed to an increased overall exposure of the organs to the
drug.
17-DMAG
I.S.
GDA
I.S.
Figure 4.6. Representative gradient elution chromatograms of 17-DMAG and GDA
with I.S. (N-phenyl-1-naphthylamine). All three compounds were reconstituted at
100µg/ml in mobile phase and eluted as described in Materials and Methods.
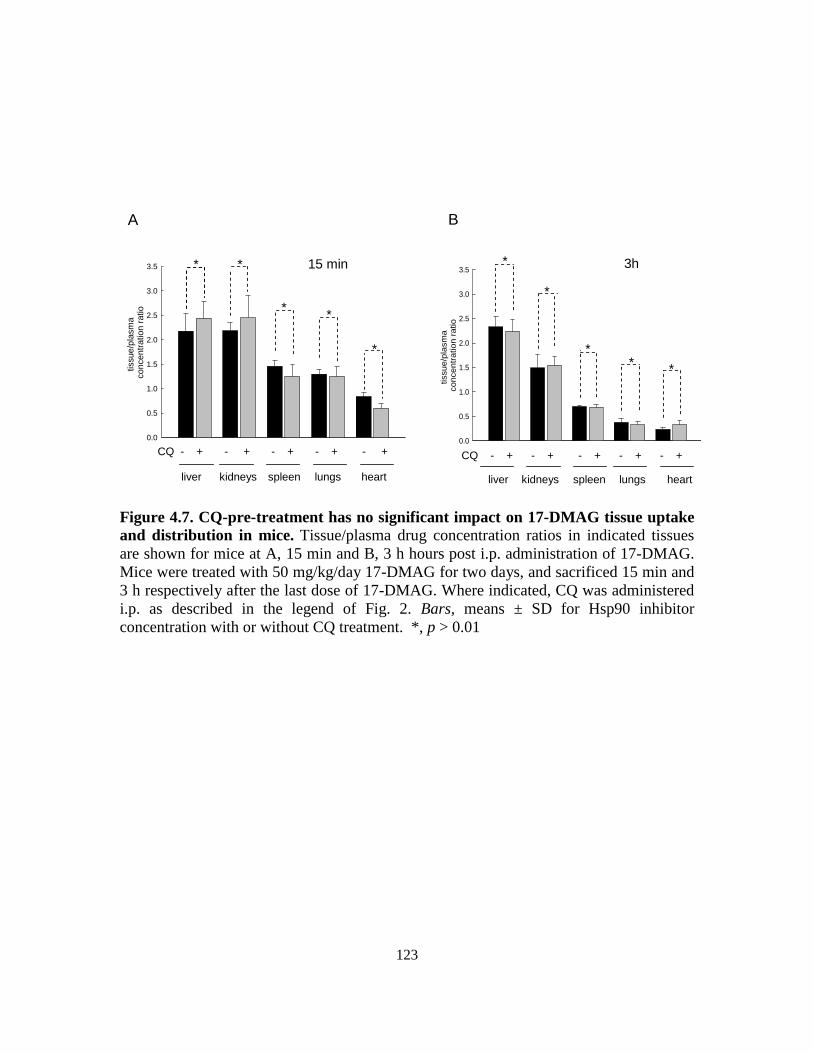
123
Figure 4.7. CQ-pre-treatment has no significant impact on 17-DMAG tissue uptake
and distribution in mice. Tissue/plasma drug concentration ratios in indicated tissues
are shown for mice at A, 15 min and B, 3 h hours post i.p. administration of 17-DMAG.
Mice were treated with 50 mg/kg/day 17-DMAG for two days, and sacrificed 15 min and
3 h respectively after the last dose of 17-DMAG. Where indicated, CQ was administered
i.p. as described in the legend of Fig. 2. Bars, means ± SD for Hsp90 inhibitor
concentration with or without CQ treatment. *, p > 0.01
tis
su
e/p
lasm
a
con
cen
tration r
atio
0.0
0.5
1.0
1.5
2.0
2.5
3.0
3.5
CQ - + - + - + - + - +
liver spleen lungs heartkidneys
A
* *
*
**
tis
su
e/p
lasm
a
co
nce
ntr
atio
n r
atio
0.0
0.5
1.0
1.5
2.0
2.5
3.0
3.5
CQ - + - + - + - + - +
**
*
*
*
liver spleen lungs heartkidneys
B
15 min 3h
A B
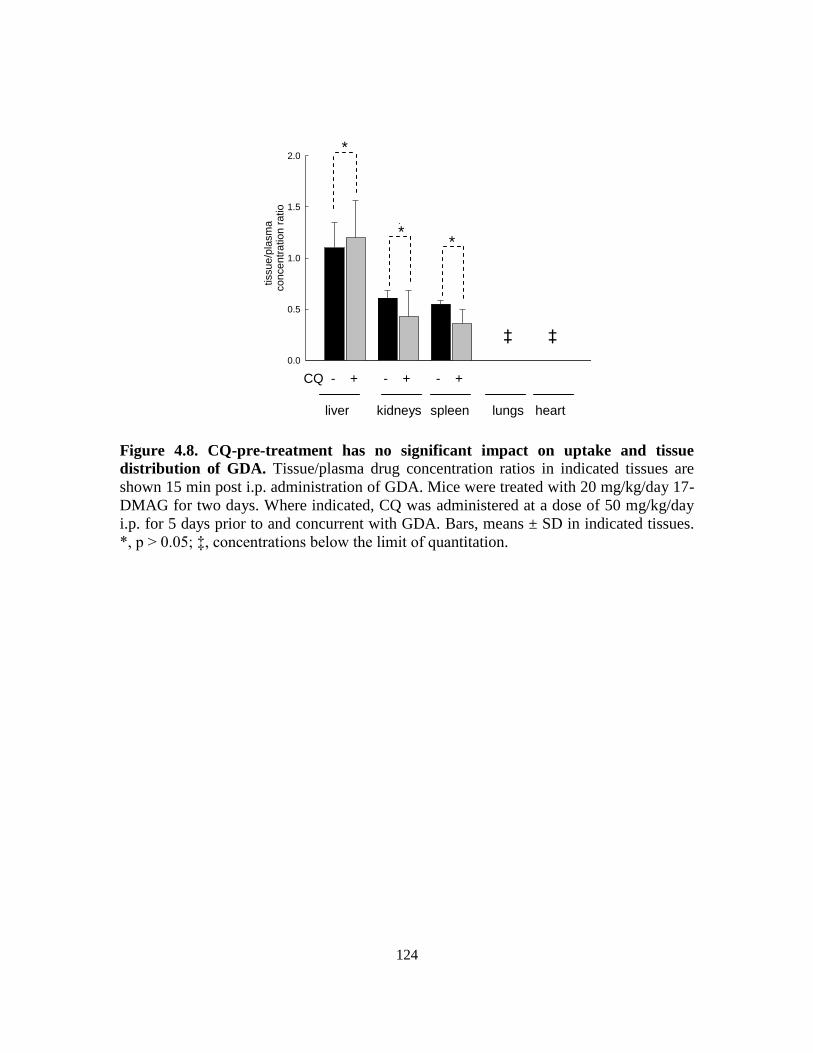
124
Figure 4.8. CQ-pre-treatment has no significant impact on uptake and tissue
distribution of GDA. Tissue/plasma drug concentration ratios in indicated tissues are
shown 15 min post i.p. administration of GDA. Mice were treated with 20 mg/kg/day 17-
DMAG for two days. Where indicated, CQ was administered at a dose of 50 mg/kg/day
i.p. for 5 days prior to and concurrent with GDA. Bars, means ± SD in indicated tissues.
*, p > 0.05; ‡, concentrations below the limit of quantitation.
tis
su
e/p
lasm
a
c
on
ce
ntr
atio
n r
atio
0.0
0.5
1.0
1.5
2.0
liver spleen lungs heartkidneys
*
*
*
‡ ‡
CQ - + - + - +
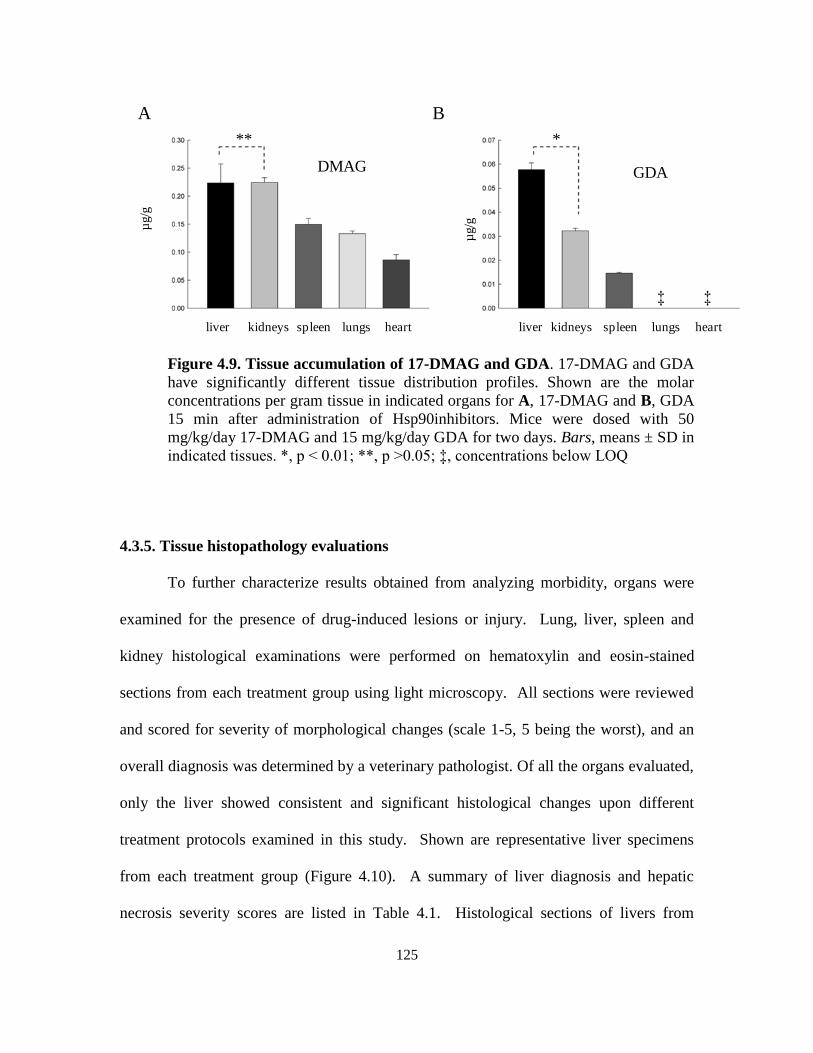
125
liver kidneys spleen lungs heart liver kidneys spleen lungs heart
µg/g
µg/g
** *
‡ ‡
A B
DMAG GDA
Figure 4.9. Tissue accumulation of 17-DMAG and GDA. 17-DMAG and GDA
have significantly different tissue distribution profiles. Shown are the molar
concentrations per gram tissue in indicated organs for A, 17-DMAG and B, GDA
15 min after administration of Hsp90inhibitors. Mice were dosed with 50
mg/kg/day 17-DMAG and 15 mg/kg/day GDA for two days. Bars, means ± SD in
indicated tissues. *, p < 0.01; **, p >0.05; ‡, concentrations below LOQ
4.3.5. Tissue histopathology evaluations
To further characterize results obtained from analyzing morbidity, organs were
examined for the presence of drug-induced lesions or injury. Lung, liver, spleen and
kidney histological examinations were performed on hematoxylin and eosin-stained
sections from each treatment group using light microscopy. All sections were reviewed
and scored for severity of morphological changes (scale 1-5, 5 being the worst), and an
overall diagnosis was determined by a veterinary pathologist. Of all the organs evaluated,
only the liver showed consistent and significant histological changes upon different
treatment protocols examined in this study. Shown are representative liver specimens
from each treatment group (Figure 4.10). A summary of liver diagnosis and hepatic
necrosis severity scores are listed in Table 4.1. Histological sections of livers from
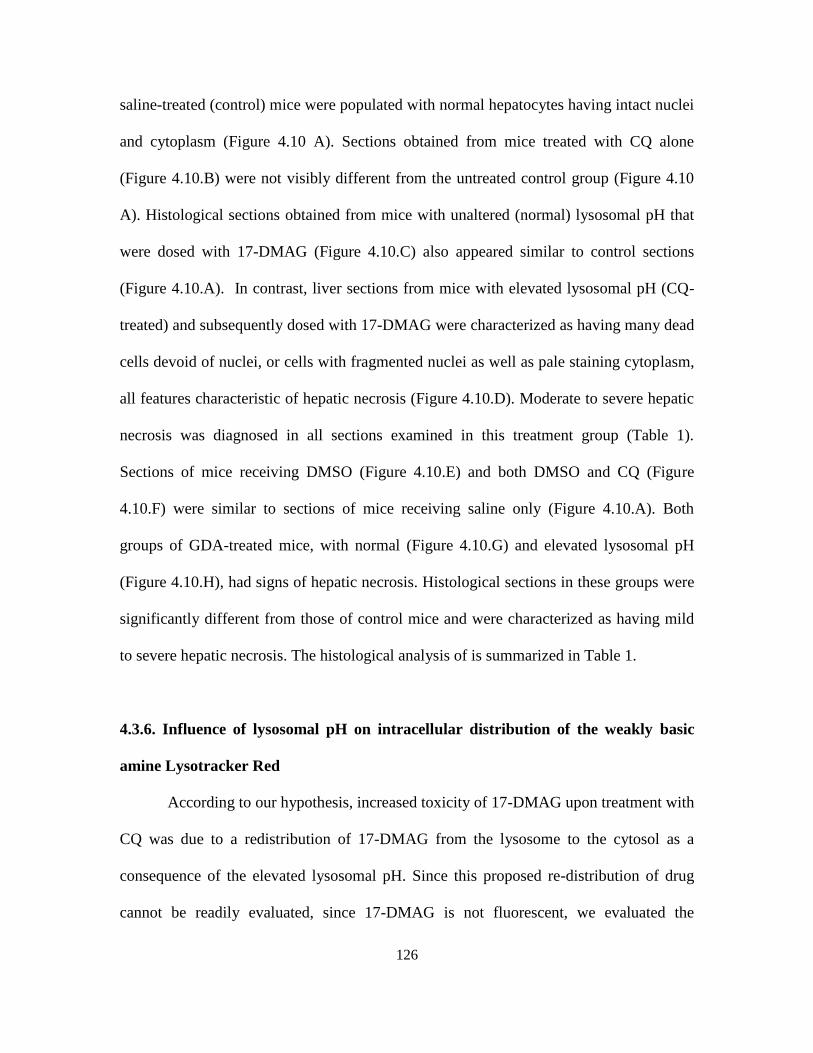
126
saline-treated (control) mice were populated with normal hepatocytes having intact nuclei
and cytoplasm (Figure 4.10 A). Sections obtained from mice treated with CQ alone
(Figure 4.10.B) were not visibly different from the untreated control group (Figure 4.10
A). Histological sections obtained from mice with unaltered (normal) lysosomal pH that
were dosed with 17-DMAG (Figure 4.10.C) also appeared similar to control sections
(Figure 4.10.A). In contrast, liver sections from mice with elevated lysosomal pH (CQ-
treated) and subsequently dosed with 17-DMAG were characterized as having many dead
cells devoid of nuclei, or cells with fragmented nuclei as well as pale staining cytoplasm,
all features characteristic of hepatic necrosis (Figure 4.10.D). Moderate to severe hepatic
necrosis was diagnosed in all sections examined in this treatment group (Table 1).
Sections of mice receiving DMSO (Figure 4.10.E) and both DMSO and CQ (Figure
4.10.F) were similar to sections of mice receiving saline only (Figure 4.10.A). Both
groups of GDA-treated mice, with normal (Figure 4.10.G) and elevated lysosomal pH
(Figure 4.10.H), had signs of hepatic necrosis. Histological sections in these groups were
significantly different from those of control mice and were characterized as having mild
to severe hepatic necrosis. The histological analysis of is summarized in Table 1.
4.3.6. Influence of lysosomal pH on intracellular distribution of the weakly basic
amine Lysotracker Red
According to our hypothesis, increased toxicity of 17-DMAG upon treatment with
CQ was due to a redistribution of 17-DMAG from the lysosome to the cytosol as a
consequence of the elevated lysosomal pH. Since this proposed re-distribution of drug
cannot be readily evaluated, since 17-DMAG is not fluorescent, we evaluated the
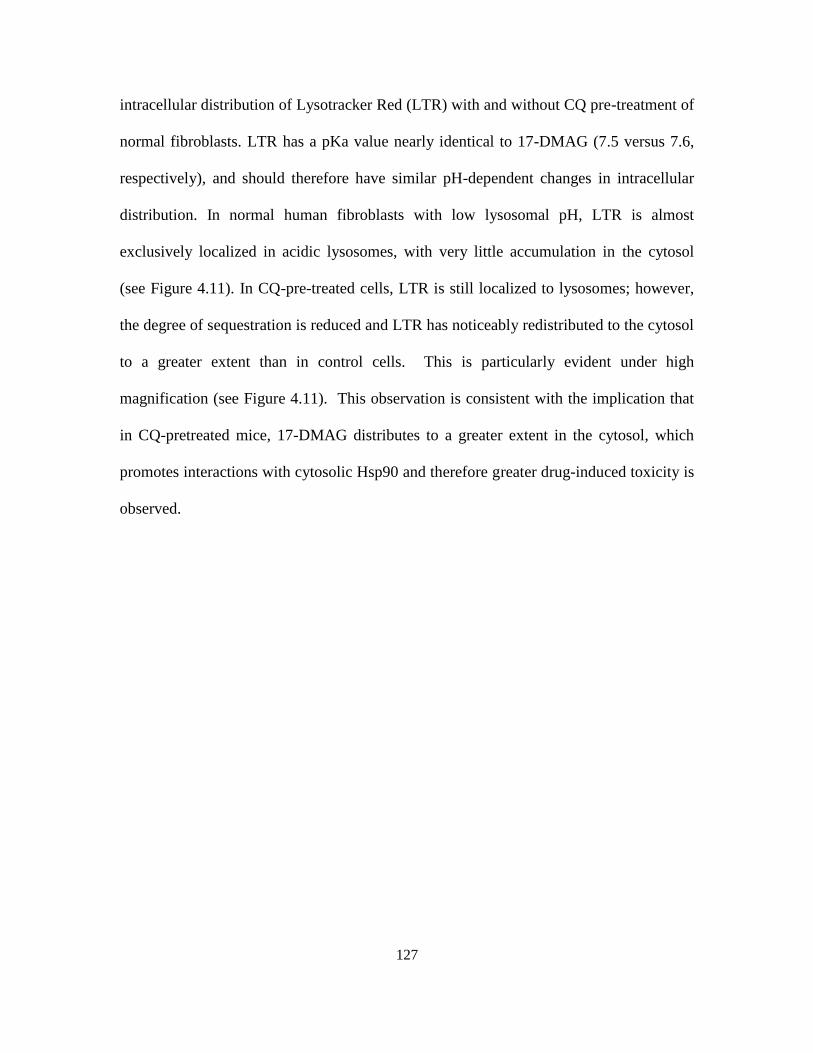
127
intracellular distribution of Lysotracker Red (LTR) with and without CQ pre-treatment of
normal fibroblasts. LTR has a pKa value nearly identical to 17-DMAG (7.5 versus 7.6,
respectively), and should therefore have similar pH-dependent changes in intracellular
distribution. In normal human fibroblasts with low lysosomal pH, LTR is almost
exclusively localized in acidic lysosomes, with very little accumulation in the cytosol
(see Figure 4.11). In CQ-pre-treated cells, LTR is still localized to lysosomes; however,
the degree of sequestration is reduced and LTR has noticeably redistributed to the cytosol
to a greater extent than in control cells. This is particularly evident under high
magnification (see Figure 4.11). This observation is consistent with the implication that
in CQ-pretreated mice, 17-DMAG distributes to a greater extent in the cytosol, which
promotes interactions with cytosolic Hsp90 and therefore greater drug-induced toxicity is
observed.
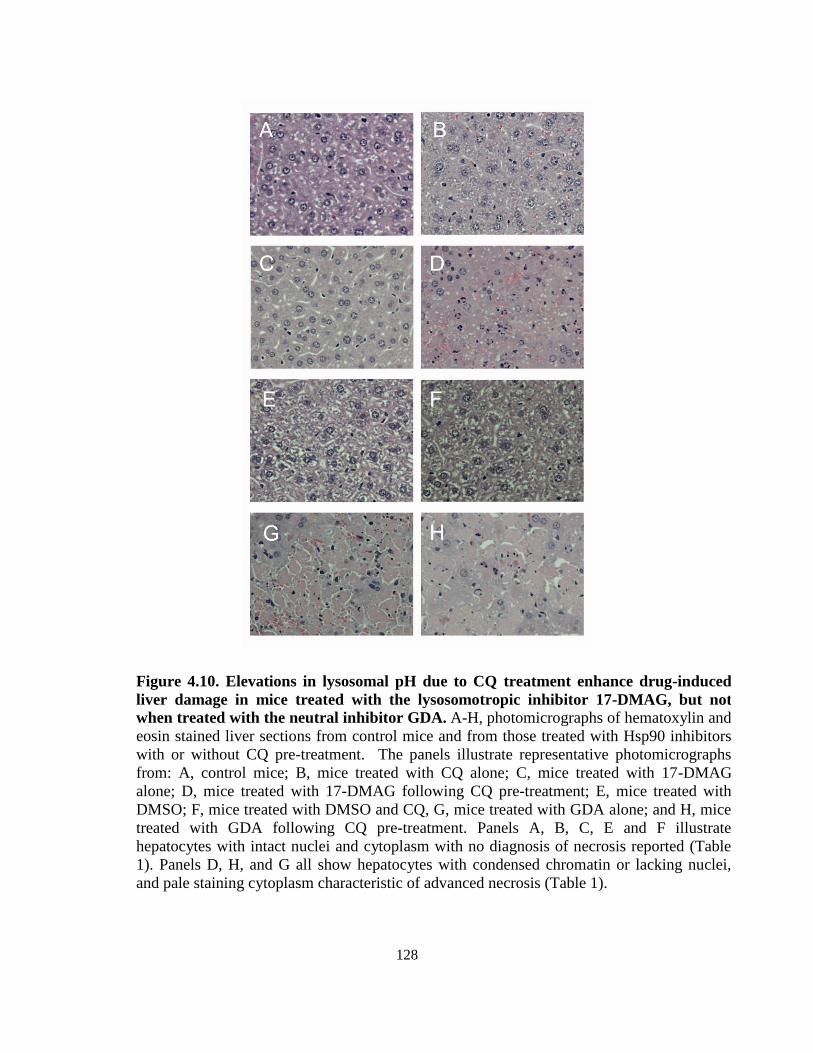
128
Figure 4.10. Elevations in lysosomal pH due to CQ treatment enhance drug-induced
liver damage in mice treated with the lysosomotropic inhibitor 17-DMAG, but not
when treated with the neutral inhibitor GDA. A-H, photomicrographs of hematoxylin and
eosin stained liver sections from control mice and from those treated with Hsp90 inhibitors
with or without CQ pre-treatment. The panels illustrate representative photomicrographs
from: A, control mice; B, mice treated with CQ alone; C, mice treated with 17-DMAG
alone; D, mice treated with 17-DMAG following CQ pre-treatment; E, mice treated with
DMSO; F, mice treated with DMSO and CQ, G, mice treated with GDA alone; and H, mice
treated with GDA following CQ pre-treatment. Panels A, B, C, E and F illustrate
hepatocytes with intact nuclei and cytoplasm with no diagnosis of necrosis reported (Table
1). Panels D, H, and G all show hepatocytes with condensed chromatin or lacking nuclei,
and pale staining cytoplasm characteristic of advanced necrosis (Table 1).
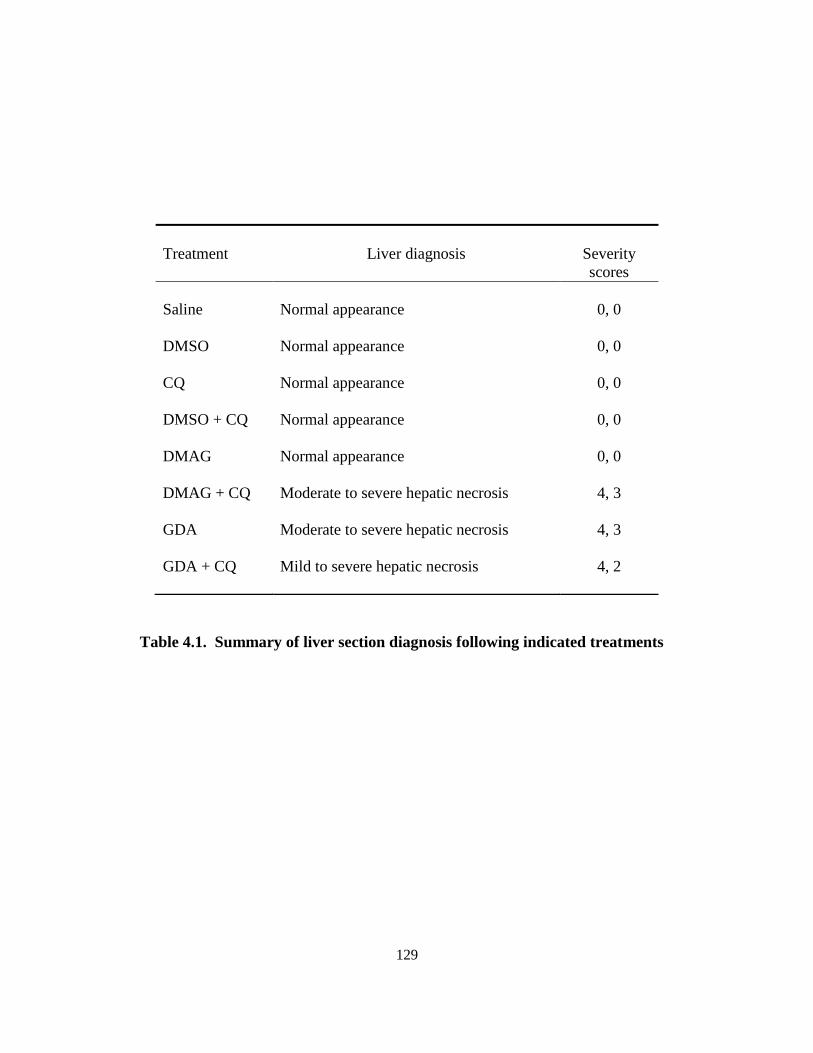
129
Table 4.1. Summary of liver section diagnosis following indicated treatments
Treatment Liver diagnosis Severity
scores
Saline
Normal appearance
0, 0
DMSO Normal appearance 0, 0
CQ Normal appearance 0, 0
DMSO + CQ Normal appearance 0, 0
DMAG Normal appearance 0, 0
DMAG + CQ Moderate to severe hepatic necrosis 4, 3
GDA Moderate to severe hepatic necrosis 4, 3
GDA + CQ Mild to severe hepatic necrosis 4, 2
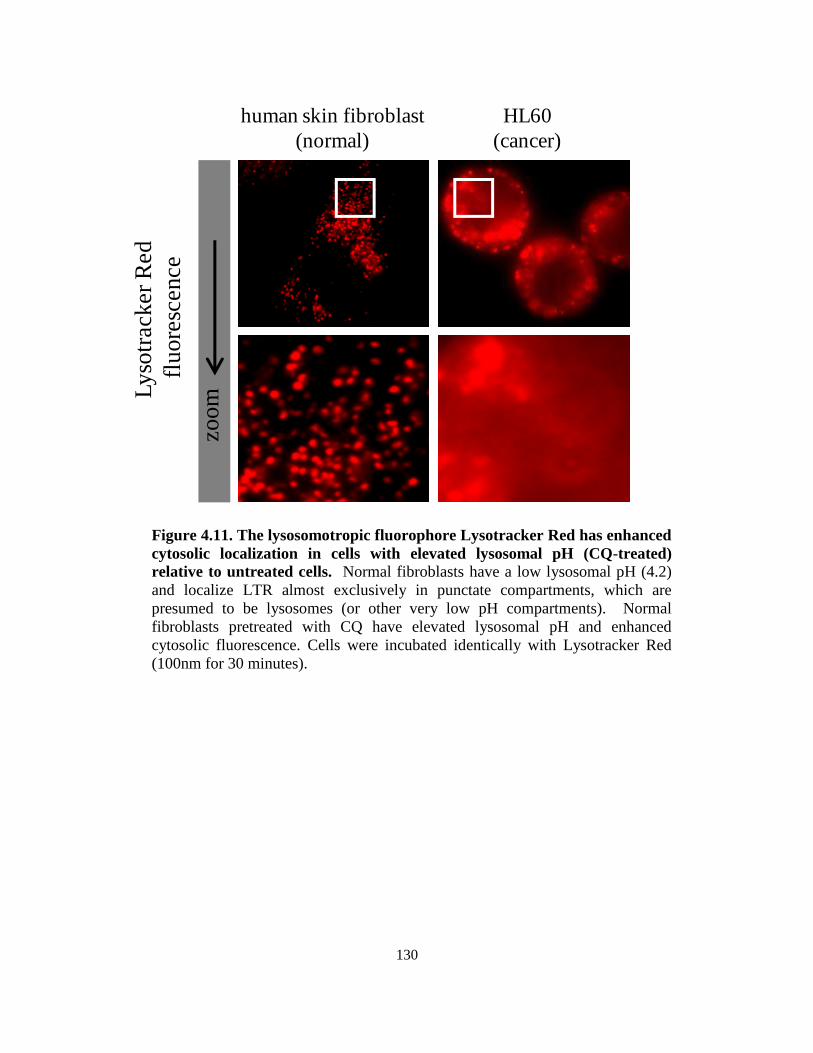
130
human skin fibroblast
(normal)
zoomL
yso
track
er
Red
fluore
scence
HL60
(cancer)
Figure 4.11. The lysosomotropic fluorophore Lysotracker Red has enhanced
cytosolic localization in cells with elevated lysosomal pH (CQ-treated)
relative to untreated cells. Normal fibroblasts have a low lysosomal pH (4.2)
and localize LTR almost exclusively in punctate compartments, which are
presumed to be lysosomes (or other very low pH compartments). Normal
fibroblasts pretreated with CQ have elevated lysosomal pH and enhanced
cytosolic fluorescence. Cells were incubated identically with Lysotracker Red
(100nm for 30 minutes).
131
4.4. Discussion
A great deal of anticancer drug research is directed towards the development of
agents that have increasingly potent cytotoxic or anti-proliferative effects on a wide range
of cancer cells. However, very few studies have focused on systematically evaluating the
factors that can potentially diminish the ―effectiveness‖ of such anticancer agents in
normal cells, which would result in the identification of safer, more selective
chemotherapeutics. Since the overall efficacy of any chemotherapeutic agent is
determined by the difference in the degree of cytotoxicity between normal and
transformed cells, we argue that research in the latter should be viewed as equally
important.
We have previously shown that the sequestration of weakly basic drugs in
lysosomes via ion-trapping can profoundly affect drug activity in cells. In this Chapter,
we tested the hypothesis that sequestration of anticancer drugs in lysosomes of normal
cells plays an important role in limiting their toxic effects in vivo using mice. Our
previous evaluations using cultured cells have shown that anticancer agents with
lysosomotropic properties can distribute differently in normal cells compared to cells
with impaired lysosomal acidification, a trait common to several types of cancer cells
[12,21]. Specifically, our results suggested that anticancer agents with lysosomotropic
properties are extensively compartmentalized in lysosomes of normal cells, thereby
diminishing their availability to interact with extra-lysosomal target sites. Therefore, by
virtue of their compartmentalization in lysosomes, anticancer agents with lysosomotropic
properties should have greater safety in normal tissues, relative to cancer cells with
defective acidification.
132
To test this mechanism in vivo required us to modulate lysosomal pH in mice, and
compare the toxicity of the lysosomotropic Hsp90 inhibitor 17-DMAG. Elevation of
lysosomal pH in the livers of mice was accomplished using multi-day administrations of
CQ as described in Materials and Methods (Figure 4.1). To our knowledge, this work
represents the first time that quantitative elevations of lysosomal pH were evaluated in
animals. Raghunand and co-workers [22] have shown that the addition of NaHCOR3R to
the drinking water of mice for several days increased the extracellular and cytosolic pH
of MCF-7 human breast cancer xenografts in mice; however, the pH of lysosomes was
not measured. Petrangolini and colleagues have previously evaluated an inhibitor of the
vacuolar-HP
+P-ATPase named NiK-12192 in mice [23]. The authors did show, for cells
grown in culture, that this inhibitor altered the fraction of acridine orange that yielded
red versus green intracellular fluorescence, which is used to indicate the degree of acidity
in cells; however, no such confirmation of pH changes were reported when the compound
was administered orally in mice. Interestingly, and relevant to this work, the authors
found that when NiK-12192 was administered with the weakly basic anticancer agent
topotecan, the combination caused enhanced generalized toxicity in mice as was
evidenced by increased weight loss and, in one case, death. Importantly, the weight loss
observed when these compounds were co-administered was significantly greater than the
sum of the values obtained when treatments were administered separately. This
synergistic effect is analogous to the results observed when 17-DMAG and CQ were co-
administered to mice in Figure 4.3.
Consistent with our hypothesis, we have demonstrated that mice with elevated
lysosomal pH experienced a higher incidence of drug-induced morbidity compared to
133
mice with normal lysosomal pH when an anticancer agent with lysosomotropic properties
was administered. Moreover, serum arginase levels (Figure 4.4.) and histological
evaluations of livers (Figure 4.10) both indicate an increase in liver damage when
lysosomotropic inhibitors are administered in mice with elevated lysosomal pH. Such
changes were not observed with the neutral Hsp90 inhibitor GDA.
It is important to point out an apparent discrepancy associated with our findings
that occurs when one attempts to compare GDA and 17-DMAG-induced morbidity
(Figure 4.3) and liver toxicity (Figure 4.4). Specifically, morbidity in mice receiving
GDA (with or without CQ pre-treatment) was found to be relatively low (~20%), yet the
liver toxicity assessments associated with these mice were similar to that of mice treated
with 17-DMAG and CQ that were approximately 100% morbid. This observation
suggests that these two drugs have different organ-associated toxicity profiles that
ultimately lead to signs of morbidity. We hypothesize that this has to do with differences
in the tissue distribution profiles for the two drugs. Using data generated for Figure 4.8,
we have plotted the overall molar accumulation of the two drugs in all organs evaluated
per gram of tissue (see 4.9). From these data one can see that GDA preferentially
accumulates to a significantly greater extent in the liver relative to other organs evaluated
(kidney, spleen, lungs, heart). On the contrary, 17-DMAG accumulates to approximately
the same degree in both liver and kidneys and also has reasonably high levels in the
remaining organs evaluated. Based on these findings it is likely that 17-DMAG-induced
morbidity results from cumulative low-level insult to many organs, whereas GDA has the
majority of its toxic effects associated with the liver, and this alone does not cause overt
signs of morbidity at the doses of GDA examined here. It is not clear what causes GDA
134
to distribute in tissues differently from 17-DMAG. It is possible that factors such as
differences in protein binding could contribute to this difference.
A significant concern with the experimental design of this work stems from the
possibility that CQ treatment enhances the toxic effects of lysosomotropic Hsp90
inhibitors through pathways unrelated to lysosomal pH modulation. Our results that
showed that CQ pretreatment caused no increase in morbidity or organ toxicity of GDA
suggests that CQ does not generally augment the pharmacological activity of all Hsp90
inhibitors, rather it is specific to those with lysosomotropic properties. It is also possible
that CQ pretreatment could selectively promote enhanced tissue uptake and retention of
17-DMAG. This could be the case if CQ inhibited an efflux transporter that was specific
for 17-DMAG but not GDA. If this were the case then we would expect that CQ
pretreatment would cause a significant elevation of the tissue/plasma concentration ratio
of 17-DMAG. This was not found to be the case, for all organs evaluated (see Figure
4.7). Consequently, considering that CQ pretreatment does not appear to have any
significant impact on GDA toxicity, and that CQ pre-treatment did not influence tissue
distribution and pharmacokinetics of 17-DMAG, we concluded that the enhanced toxicity
observed for 17-DMAG in CQ-pretreated mice was due to alterations in the drug‘s
intracellular distribution due to the change in lysosomal pH, and not due to CQ
modulating relevant pathways influencing its in vivo activity.
The proposed changes in intracellular distribution of 17-DMAG as a result of
elevation of lysosomal pH cannot be readily visualized, since this compound is non-
fluorescent. However, we propose that, in principle, other fluorescent weakly basic
amines should have similar intracellular distribution based on ion trapping principles. The
135
amine Lysotracker Red has a pKa value nearly identical to 17-DMAG (7.5 versus 7.6,
respectively), it should have similar pH-dependent changes in intracellular distribution.
Since the fluorescence of LTR makes it readily detectable using fluorescence
microscopy, we evaluated the intracellular distribution of LTR in cells grown in culture
with or without CQ treatment, analogous to what was done in mice. In normal human
fibroblasts with low lysosomal pH, LTR is almost exclusively localized in acidic
lysosomes, with very little accumulation in the cytosol (see Figure 4.11). We pretreated
the same human fibroblasts with CQ in an attempt to mimic the situation with CQ-
pretreated mice. In these cells the LTR is still localized to lysosomes; however, the
degree of sequestration is reduced and LTR has noticeably redistributed to the cytosol to
a greater extent than in control cells. This is particularly evident under high
magnification (see Figure 4.11). This observation is consistent with the implication that
in CQ-pretreated mice, 17-DMAG distributes to a greater extent in the cytosol, which
promotes interactions with cytosolic Hsp90 and therefore greater drug-induced toxicity is
observed.
Taken together, the current results are consistent with the perception that
anticancer agents with optimal lysosomotropic characteristics will be safer in normal
tissues due to their extensive compartmentalization in lysosomes. However, further in
vivo studies using tumor-bearing mice will be required to fully examine the feasibility
and/or limitations of this approach. For example, one significant potential obstacle to the
usefulness of this approach stems from the fact that the microenvironment surrounding
solid tumors is known to be acidic relative to normal tissue. As a result, the pH gradient
existing between the extracellular microenvironment and the cell cytosol is expanded in
136
some solid tumors relative to the pH gradient in normal tissues. According to pH
partitioning theory, the steady state accumulation of weak electrolytes that are membrane
permeable in their unionized state and membrane impermeable in their ionized state will
be determined by differences in the pH gradient existing between the cell cytosol and the
extracellular space. Specifically, the intracellular accumulation of weakly basic drugs is
expected to be impaired relative to acidic or neutral compounds due to the fact that it will
take a significantly longer time for cellular uptake of the drug due to ionization in the
acidic exterior environment. This has been shown to occur both in vitro and in vivo
[24,25]. It is clear that such issues would represent an important consideration when
treating many solid tumors that have acidic extracellular pH; however, it should not be a
concern for all cancer types since many tumors have been shown to have normal
extracellular pH [26]. An obvious example would be hematological cancers. Moreover,
it is possible that the favorable intracellular distribution of weakly basic drugs inside
cancer cells with defective lysosomal acidification could offset the aforementioned
unfavorable accumulation differences that may exist. Further in vivo investigations will
be required to address these questions.
The overall goal of enhancing anticancer drug selectivity is to reduce the systemic
toxicity that results from the indiscriminate toxicity of traditional anticancer drugs, which
limits the anti-tumor efficacy of most currently used anticancer drugs. The results
presented in this Chapter suggest that purposefully targeting drugs to lysosomes of
normal tissues may reduce the systemic toxicity of lysosomotropic anticancer drugs.
Collectively, this work and the work presented in Chapters 2 and 3, provide strong

137
support for exploring IDB selectivity as a rational approach with great promise to
enhance anticancer drug selectivity.
138
4.5. References
1. Duvvuri M, Konkar S, Hong KH, Blagg BSJ, Krise JP (2006) A new approach for
enhancing differential selectivity of drugs to cancer cells. ACS Chem Biol 1: 309-
315.
2. Poole B, Ohkuma S (1981) Effect of weak bases on the intralysosomal pH in mouse
peritoneal macrophages. J Cell Biol 90: 665-669.
3. Tian Z-Q, Liu Y, Zhang D, Wang Z, Dong SD, et al. (2004) Synthesis and biological
activities of novel 17-aminogeldanamycin derivatives. Bioorg Med Chem 12:
5317-5329.
4. Kroemer G, Pouyssegur J (2008) Tumor cell metabolism: Cancer's achilles' heel. Cell
13: 472-482.
5. Mehvar R, Robinson, MA Reynolds JM (1994) Molecular weight dependent tissue
accumulation of dextrans: in vivo studies in rats. J Pharm Sci 83: 1495-1499.
6. Lees DN, Stephen J (1985) Ectromelia virus-induced changes in primary cultures of
mouse hepatocytes. J Gen Virol 66: 2171-2181.
7. Ohkuma S, Poole B (1978) Fluorescence probe measurement of the intralysosomal pH
in living cells and the perturbation of pH by various agents. P Natl Acad Sci USA
75: 3327-3331.
8. Jiang LW, Maher VM, McCormick JJ, Schindler M (1990) Alkalinization of the
lysosomes is correlated with ras transformation of murine and human fibroblasts.
J Biol Chem 265: 4775-4777.
139
9. Gong Y, Duvvuri M, Krise JP (2003) Separate roles for the Golgi apparatus and
lysosomes in the sequestration of drugs in the multi-drug resistant human
leukemic cell line HL-60. J Biol Chem 278: 50234-50239
10. Bach G, Chen C-S, Pagano RE (1999) Elevated lysosomal pH in Mucolipidosis type
IV cells. Clinica Chimica Acta 280: 173-179.
11. Houshmand P, Zlotnik A (2003) Targeting tumor cells. Curr Opin in Cell Biol 15:
640-644.
12. Altan N, Chen Y, Schindler M, Simon SM (1998) Defective acidification in human
breast tumor cells and implications for chemotherapy. J Exp Med 187: 1583-
1598.
13. Temesvari LA, Rodriguez-Paris JM, Bush JM, Zhang L, Cardelli JA (1996)
Involvement of the vacuolar proton-translocating ATPase in multiple steps of the
endo-lysosomal system and in the contractile vacuole system of Dictyostelium
discoideum. J Cell Sci 109: 1479-1495.
14. Nilsson C, Kågedal K, Johansson U, Öllinger K (2004) Analysis of cytosolic and
lysosomal pH in apoptotic cells by flow cytometry. Meth Cel Sci 25: 185-194.
15. Falanga P, Franco Da Silveira JF, Pereira Da Silva L (1984) Protective immune
response to Plasmodium chabaudi developed by mice after drug controlled
infection or vaccination with parasite extracts: analysis of stage specific antigens
from the asexual blood cycle. Parasite Immunol 6: 529-543.
16. Young JC, Moarefi I, Hartl FU (2001) Hsp90: a specialized but essential protein-
folding tool. J Cell Biol 154: 267-274.
140
17. Duvvuri M, Konkar S, Hong KH, Blagg BSJ, Krise JP (2006) A new approach for
enhancing differential selectivity of drugs to cancer cells. ACS Chem Biol 1: 309-
315.
18. Glaze E, Lambert A, Smith A, Page J, Johnson W, et al. (2005) Preclinical toxicity of
a geldanamycin analog, 17-(dimethylaminoethylamino)-17-
demethoxygeldanamycin (17-DMAG), in rats and dogs: potential clinical
relevance. Cancer Chemother Pharmacol 56: 637-647.
19. Ozer J, Ratner M, Shaw M, Bailey W, Schomaker S (2008) The current state of
serum biomarkers of hepatotoxicity. Toxicology 245: 194-205.
20. Supko JG, Hickman RL, Grever MR, Malspeis L (1995) Preclinical pharmacologic
evaluation of geldanamycin as an antitumor agent. Cancer Chemother Pharmacol
36: 305-315.
21. Belhoussine R, Morjani H, Sharonov S, Ploton D, Manfait M (1999) Characterization
of intracellular pH gradients in human multidrug-resistant tumor cells by means
of scanning microspectrofluorometry and dual-emission-ratio probes. Int J Cancer
81: 81-89.
22. Raghunand N, Mahoney BP, Gillies RJ (2003) Tumor acidity, ion trapping and
chemotherapeutics: II. pH-dependent partition coefficients predict importance of
ion trapping on pharmacokinetics of weakly basic chemotherapeutic agents.
Biochem Pharmacol 66: 1219-1229.
23. Supino R, Petrangolini G, Pratesi G, Tortoreto M, Favini E, et al. (2008)
Antimetastatic effect of a small-molecule vacuolar H+-ATPase inhibitor in in
vitro and in vivo preclinical studies. J Pharmacol Exp Ther 324: 15-22.
141
24. Gerweck LE, Vijayappa S, Kozin S (2006) Tumor pH controls the in vivo efficacy of
weak acid and base chemotherapeutics. Mol Cancer Ther 5: 1275-1279.
25. Mahoney BP, Raghunand N, Baggett B, Gillies RJ (2003) Tumor acidity, ion trapping
and chemotherapeutics: I. Acid pH affects the distribution of chemotherapeutic
agents in vitro. Biochem Pharmacol 66: 1207-1218.
26. Ng TC, Majors AW, Vijayakumar S, Baldwin NJ, Thomas FJ, et al. (1989) Human
neoplasm pH and response to radiation therapy: P-31 MR spectroscopy studies in
situ. Radiology 170: 875-878.

142
Chapter 5: Research summary and future directions
143
5.1. Summary and conclusions
The lack of selectivity and resultant toxicity of anticancer drugs to normal cells
and tissues is perhaps the most prohibitive factor to the success of chemotherapeutics. For
this reason, continued research efforts into identifying new, rational approaches to
enhance the selectivity of existing and future anticancer drugs are warranted. Much
research has focused on the discovery or design of anticancer agents that have optimized
potency against a variety of cancer cell types, while much less effort is spent on the
design of drugs that are potent yet minimally toxic to normal cells. Using this model, a
number of compounds are identified are not therapeutically utilizable due to unacceptable
toxicity in vivo. However, even drugs that are developed and approved for chemotherapy
continue to have toxicity that significantly limits their dose and efficacy.
Much effort has been made to improve the selectivity of anticancer drugs.
Classical efforts to enhance the selectivity of anticancer drugs have focused on the so-
called ‗magic bullet‘ approach, first proposed by Paul Ehrlich [1]. These approaches
share a common feature, which is the attempt to enhance the delivery of active drug to
the tumor site, while reducing the accumulation of around normal cells. Such approaches
were reviewed in Chapter 1.
In spite of its conceptual appeal, the magic bullet, or directed targeting approach
has not been very successful in enhancing anticancer drug selectivity [2]. Achieving truly
site specific delivery of a drug is in reality, very challenging, since the properties that
make traditional anticancer drugs excellent candidates for delivery to tumors and to
intracellular targets, also allow them to escape the site of interest after site-specific
accumulation is achieved.
144
A rarely considered option in enhancing differential selectivity of anticancer
drugs to cancer cells is optimizing their physicochemical features to influence their
intracellular distribution. This is a feasible approach, given the fact that drug targets are
often localized in discrete intracellular compartments, and that localization of drugs in
these compartments is influenced by cellular properties that may differ between normal
and transformed cells, thus resulting in differential intracellular drug distribution between
normal and cancer cells.
In this thesis, we have evaluated an intracellular drug distribution based approach
to enhance the selectivity of anticancer drugs. This approach exploits the defective
lysosomal pH associated with some cancer cells to enhance the selectivity of weakly
basic anticancer drugs. Normal cells have lysosomes that are very acidic relative to the
cell cytosol, creating a steep lysosome-to-cytosol pH gradient that facilitates the
sequestration of weakly basic drugs in lysosomes via ion-trapping [3]. However,
defective lysosomal acidification in some cancers [4,5] reduces the lysosome-to-cytosol
pH gradient that provides a driving force for the accumulation of weak bases in
lysosomes via ion trapping. This increases the cytosolic concentration of the drug in
cancer cells, which enhances drug interactions with extra-lysosomal targets. These
differences in intracellular distribution of weakly basic drugs in normal and cancer cells
therefore result in enhanced activity in cancer cells relative to normal cells.
In support of this, we found that anti-cancer drugs with basic properties were
more toxic to cells with elevated lysosomal pH compared to cells with normal lysosomal
pH. Conversely, the toxicity of non-lysosomotropic drugs were not influenced by the
lysosomal pH of cells [6]. A limitation of the IDB targeting approach, however, is that it
145
would only be applicable to cancer types with defective lysosomal acidification.
Therefore, it is important to establish the scope of defective lysosomal acidification of
cancer cells. In Chapter 2 we evaluated the prevalence of defective lysosomal
acidification in cancer cells, as well as the effects of transformation on lysosomal pH.
Prior to our studies, it was unclear whether defective lysosomal acidification was a
phenomenon associated with all cancer cells, or a subset of them. We found that while all
normal cells evaluated had a lysosomal pH around 4, cancer cells ranged in pH from
values close to normal to highly elevated lysosomal pH. From these studies it appears
that although not all cancer types will be candidates for IDB selectivity, a significant
portion of cancer cells exhibit some degree of defective lysosomal acidification that is
sufficient for selectivity enhancement to be achieved based on this approach. It is clear
that our lysosomal pH evaluations are very limited in scope, in part because of the low-
throughput nature of lysosomal pH evaluations. The development of a high-throughput
approach to determine lysosomal pH can greatly advance the identification of cancer cells
with defective lysosomal acidification and application of IDB selectivity. Interestingly, a
method for the high-throughput screening of lysosomal pH in cells has recently been
described [7].
Having established that IDB selectivity has the potential to be applied to a number
of cancer types, we then sought to determine whether IDB selectivity can be optimized
according to physicochemical properties that govern lysosomal sequestration. In
preliminary studies, we had shown that weakly basic drugs were more selective to cells
with elevated lysosomal pH [6]. In the studies outlined in Chapter 3, we investigated
whether IDB selectivity could be optimized according to the pKa of the drug. We
146
evaluated the selectivity of a series of Hsp90 inhibitors with various pKas in cancer cells
with defective lysosomal acidification (HL60 human leukemic cells) in comparison to
normal human fibroblasts with normal (low) lysosomal pH. Hsp90 inhibitors with pKa
around 8, which have optimum lysosomotropic properties, had optimum IDB selectivity.
These results are a key finding of this work, since they suggest that IDB selectivity
arising from differences in lysosomal pH between cancer cells, can be optimized by
rational selection and modification of the physicochemical properties of the drug. It is
therefore possible that drugs that can be deliberately designed to have the most ideal
properties for lysosomal properties could conceivably achieve much greater IDB
selectivity than was achieved using our model Hsp90 inhibitor compounds. For example,
the ratio of the permeability of the ionized form to that of the unionized form (α), is an
additional parameter besides pKa that can be optimized to influence lysosome-to-cytosol
distribution ratio (see equation in Chapter 3). According to de Duve‘s theoretical
principles of lysosomal trapping [3] and confirmed by experimental evaluations in our
lab, the α-value has a dramatic influence on the lysosome-to-cytosol concentration ratio,
i.e. the smaller this value becomes, the greater the ratio. Our model Hsp90 compounds
had α-values around 0.001. It is possible that compounds with a greater α value (reduced
permeability of the ionized species) will have even greater IDB selectivity.
The ultimate goal of an anticancer drug targeting approach is to reduce systemic
toxicity, therefore we further evaluated whether lysosomal trapping reduced toxicity, in
comparison to the case where the drug was localized in the cytosol, which was outlined in
Chapter 4. Specifically, we evaluated the toxicity of the lysosomotropic drug, 17-DMAG
in mice with normal, low lysosomal pH, compared to its toxicity in mice with elevated
147
lysosomal pH. We found that the lysosomotropic inhibitor 17-DMAG was significantly
less toxic to mice with normal, low lysosomal pH, presumably because the drug was
predominantly sequestered in lysosomes. However, when 17-DMAG was administered to
mice with elevated lysosomal pH, it was highly toxic due to decreased trapping in
lysosomes and presumably a higher cytosolic distribution, which would increase the
drug‘s interaction with its target hence its toxicity. On the other hand, the toxicity of the
non-lysosomotropic drug GDA, which is not a candidate for lysosomal trapping, was not
sensitive to changes in lysosomal pH in mice.
The results of the in vivo study suggests that using lysosomotropic analogs of a
drug will significantly improve its therapeutic index, which is the maximum tolerated
dose (MTD) divided by the minimum effective dose (MED). It is not expected that the
MED of a lysosomotropic versus non-lysosomotropic drug will change due to IDB
selectivity. However, the significant increase in MTD for a lysosomotropic drug will
result in a significant increase in the therapeutic index of the lysosomotropic drug. Such
an increase in MTD allows higher doses of the drug to be administered and therefore
increases the chances of success in achieving tumor regression before limiting toxicity is
experienced. A summary of the effect of lysosomotropic properties and lysosomal pH on
the MTD and MED is shown in Table 5.1.
Collectively, the work outlined in this thesis demonstrates that differences in lysosomal
acidification between normal and cancer cells can be exploited to enhance the selectivity
of lysosomotropic anticancer drugs. In addition, the in vivo studies demonstrate that
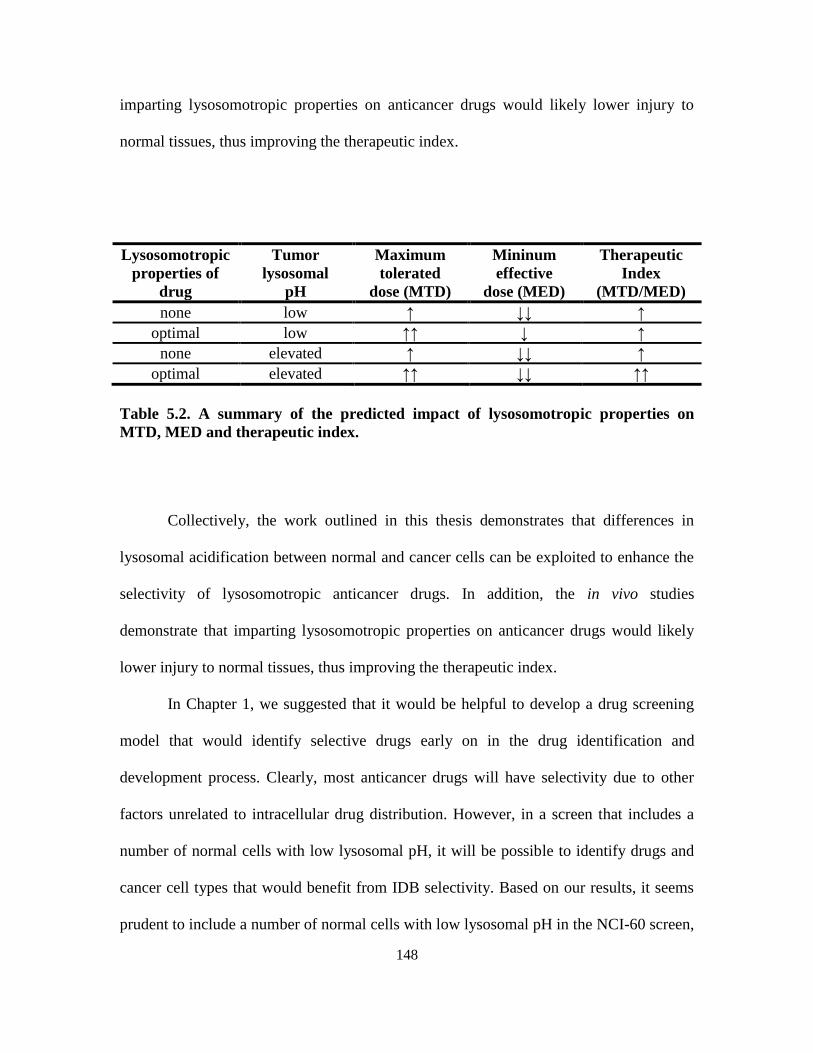
148
imparting lysosomotropic properties on anticancer drugs would likely lower injury to
normal tissues, thus improving the therapeutic index.
Lysosomotropic
properties of
drug
Tumor
lysosomal
pH
Maximum
tolerated
dose (MTD)
Mininum
effective
dose (MED)
Therapeutic
Index
(MTD/MED)
none low ↑ ↓↓ ↑
optimal low ↑↑ ↓ ↑
none elevated ↑ ↓↓ ↑
optimal elevated ↑↑ ↓↓ ↑↑
Table 5.2. A summary of the predicted impact of lysosomotropic properties on
MTD, MED and therapeutic index.
Collectively, the work outlined in this thesis demonstrates that differences in
lysosomal acidification between normal and cancer cells can be exploited to enhance the
selectivity of lysosomotropic anticancer drugs. In addition, the in vivo studies
demonstrate that imparting lysosomotropic properties on anticancer drugs would likely
lower injury to normal tissues, thus improving the therapeutic index.
In Chapter 1, we suggested that it would be helpful to develop a drug screening
model that would identify selective drugs early on in the drug identification and
development process. Clearly, most anticancer drugs will have selectivity due to other
factors unrelated to intracellular drug distribution. However, in a screen that includes a
number of normal cells with low lysosomal pH, it will be possible to identify drugs and
cancer cell types that would benefit from IDB selectivity. Based on our results, it seems
prudent to include a number of normal cells with low lysosomal pH in the NCI-60 screen,
149
which would aid in the identification of cancer cells types that may benefit from IDB
selectivity.
Many current, clinically utilized, anticancer agents possess optimal weakly basic
properties (i.e. weakly basic with pKa around 8) that presumably impart some degree of
IDB selectivity. It is unlikely that these properties were intentionally engineered into the
structures of these compounds, but they nevertheless emerged superior against those
without lysosomotropic properties. It is therefore plausible that such anticancer drugs
have benefited from a previously unrecognized contribution from IDB selectivity, in
addition to the intrinsic selectivity the drug may possess. Table 5.2 shows a summary of
weakly basic drugs and their pKa that may benefit from IDB selectivity. Based on this
observation, and the results presented in this thesis, it is highly likely that drugs with fully
optimized lysosomotropic properties would have an even greater selectivity to cancer
cells.
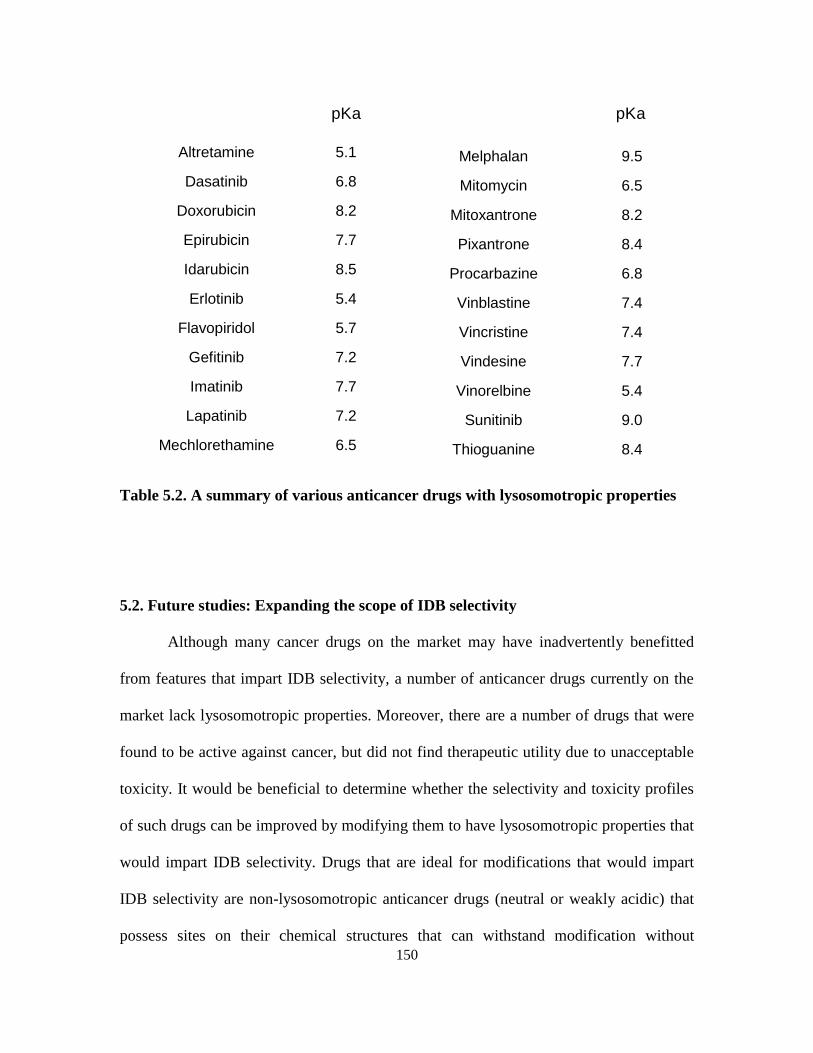
150
6.5 Mechlorethamine
7.2 Lapatinib
7.7 Imatinib
7.2 Gefitinib
5.7 Flavopiridol
5.4 Erlotinib
8.5 Idarubicin
7.7 Epirubicin
8.2 Doxorubicin
6.8 Dasatinib
5.1 Altretamine
8.4 Thioguanine
9.0 Sunitinib
5.4 Vinorelbine
7.7 Vindesine
7.4 Vincristine
7.4 Vinblastine
6.8 Procarbazine
8.4 Pixantrone
8.2 Mitoxantrone
6.5 Mitomycin
9.5 Melphalan
pKa pKa
Table 5.2. A summary of various anticancer drugs with lysosomotropic properties
5.2. Future studies: Expanding the scope of IDB selectivity
Although many cancer drugs on the market may have inadvertently benefitted
from features that impart IDB selectivity, a number of anticancer drugs currently on the
market lack lysosomotropic properties. Moreover, there are a number of drugs that were
found to be active against cancer, but did not find therapeutic utility due to unacceptable
toxicity. It would be beneficial to determine whether the selectivity and toxicity profiles
of such drugs can be improved by modifying them to have lysosomotropic properties that
would impart IDB selectivity. Drugs that are ideal for modifications that would impart
IDB selectivity are non-lysosomotropic anticancer drugs (neutral or weakly acidic) that
possess sites on their chemical structures that can withstand modification without
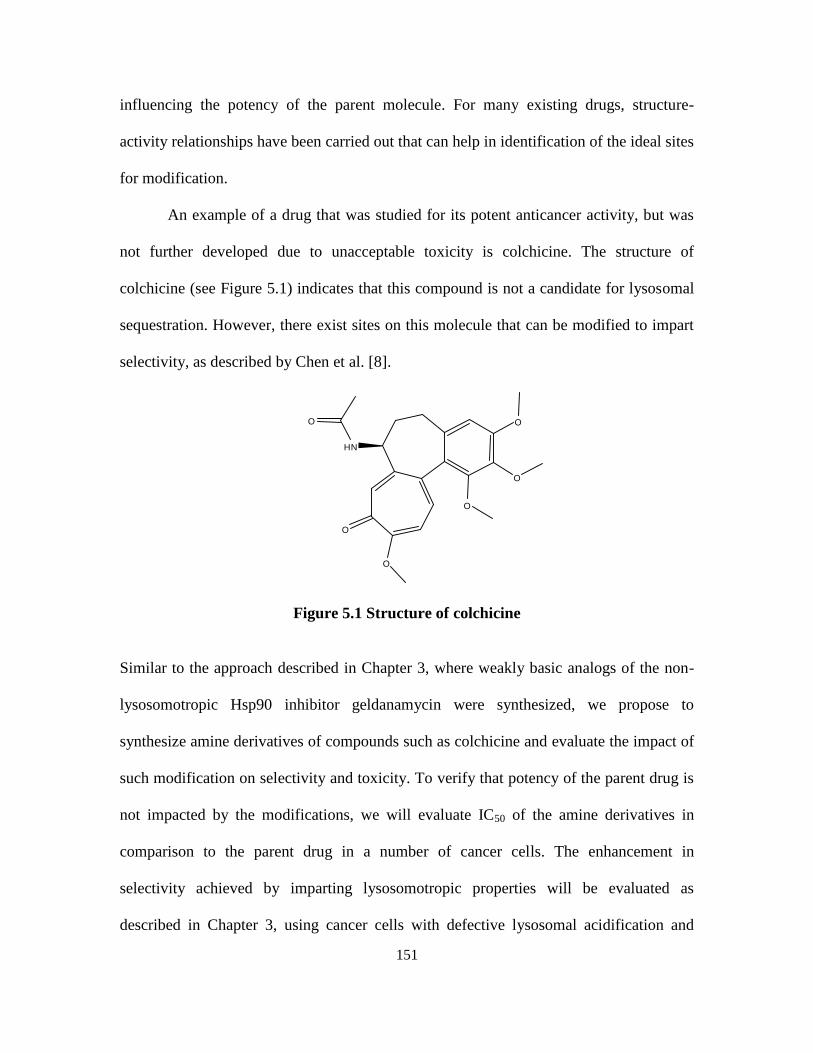
151
influencing the potency of the parent molecule. For many existing drugs, structure-
activity relationships have been carried out that can help in identification of the ideal sites
for modification.
An example of a drug that was studied for its potent anticancer activity, but was
not further developed due to unacceptable toxicity is colchicine. The structure of
colchicine (see Figure 5.1) indicates that this compound is not a candidate for lysosomal
sequestration. However, there exist sites on this molecule that can be modified to impart
selectivity, as described by Chen et al. [8].
O
HN
O
O
O
O
O
Figure 5.1 Structure of colchicine
Similar to the approach described in Chapter 3, where weakly basic analogs of the non-
lysosomotropic Hsp90 inhibitor geldanamycin were synthesized, we propose to
synthesize amine derivatives of compounds such as colchicine and evaluate the impact of
such modification on selectivity and toxicity. To verify that potency of the parent drug is
not impacted by the modifications, we will evaluate IC50 of the amine derivatives in
comparison to the parent drug in a number of cancer cells. The enhancement in
selectivity achieved by imparting lysosomotropic properties will be evaluated as
described in Chapter 3, using cancer cells with defective lysosomal acidification and
152
normal cells with low lysosomal pH. However, to most accurately evaluate the
contribution of intracellular drug distribution on selectivity, it is ideal to evaluate
selectivity in a pair of cell lines that are otherwise identical but differ in lysosomal pH.
Such a model was achieved using a gene silencing approach that reduced the expression
of subunit V1E1 of the V-ATPase resulting in elevated lysosomal pH. Using this model
we can compare the activity (IC50) in the same cell that has normal lysosomal pH and
compare this to the toxicity observed with cells that have elevated lysosomal pH (i.e.,
cancer like). In order to determine whether imparting IDB selectivity on the compounds
has a positive impact on the drug‘s toxicity profile, the maximum tolerated dose (MTD)
of the parent drug and the amine analog will be evaluated. The results of these studies
will reveal whether drugs such as colchicine that were discarded due to unacceptable
toxicity can be reclaimed.
It is important to note that defective acidification of lysosomes in cancer cells is
not the only difference between normal and cancer cells that can be exploited to enhance
selectivity. Mitochondria have recently received a lot of attention as potential targets for
anticancer drugs, particularly due to the fact that they are the center for apoptotic
signaling in the cell [2]. Selective activation of cell death pathways in cancer cells is
therefore a potential therapeutic route for selective anticancer therapy. Interestingly, some
cancer cells have been shown to have hyperpolarized mitochondrial membranes i.e. a
greater membrane potential, than normal cells [9]. For example, it was shown that the
colon carcinoma cell line CX-1 had a 60mV difference in membrane potential compared
to normal kidney epithelial cells [10]. Lipophilic cations with delocalized charges are
known to accumulate in mitochondria due to the negative membrane potential. A strategy
153
for IDB selectivity that exploits the difference in membrane potential in normal versus
cancer cells would be to create mitochondrial drugs with optimal physicochemical
properties for accumulation in mitochondria. Several theoretical models for
physicochemical properties that maximize mitochondrial accumulation have been
proposed [11], and can aid in the design or optimization of drugs with optimal
mitochondriotropic properties. Cancer cells with hyperpolarized mitochondria would be
expected to accumulate a greater amount of such compounds than normal cells with
normal polarization of mitochondrial membranes. Using this approach, higher
concentrations of mitochondrial poisons can be delivered to the cancer cells relative to
normal cells, leading to selective tumor cell killing.
Successful evaluation of this mitochondria-centered approach to IDB selectivity
would likely open up new frontiers into IDB selectivity. For example co-administering
two drugs, one with IDB selectivity that exploits defective lysosomal acidification, and
another with IDB selectivity that exploits mitochondrial hyperpolarization can enhance
the observed selectivity even further. Hopefully, such studies may provide a driving force
for the investigation of further sub-cellular differences in cancer versus normal cells that
could be exploited to develop anticancer agents with enhanced selectivity dues to
differences in influence intracellular distribution of drugs. Such differences could be
identified using a high-throughput evaluation of intracellular drug localization differences
between normal and cancer cells, for example, using fluorescence microscopy to
investigate differences in intracellular localization of fluorophores.
In summary, the work presented in this thesis has shown that intracellular drug
distribution is a feasible avenue to enhancing the selectivity of anticancer drugs. For this
154
reason, research efforts should be made to systematically identify differences in
intracellular properties between normal and cancer cells that can be exploited to enhance
selectivity. Our results show that not only is this possible, but that selectivity can be
optimized further by optimizing the physicochemical properties of drugs that are
candidates for IDB selectivity. It is therefore hoped that the information obtained in this
thesis provides a rationale, and guiding principles for exploration of IDB selectivity as a
viable tumor targeting approach.
155
5.3. References
1. Petrak K (2005) Essential properties of drug-targeting delivery systems. Drug
Discovery Today 10: 1667-1673.
2. Young JC, Moarefi I, Hartl FU (2001) Hsp90: a specialized but essential protein-
folding tool. J Cell Biol 154: 267-274.
3. de Duve C, de Barsy T, Trouet A, Tulkens P, and van Hoof, F (1974) Lysosomotropic
Agents. Biochem Pharmacol 23: 2495 - 2531.
4. Schindler M, Grabski S, Hoff E, Simon SM (1996) Defective pH regulation of acidic
compartments in human breast cancer cells (MCF-7) is normalized in adriamycin-
resistant cells (MCF-7adr). Biochemistry 35: 2811-2817.
5. Altan N, Chen Y, Schindler M, Simon SM (1998) Defective Acidification in Human
Breast Tumor Cells and Implications for Chemotherapy. J Exp Med 187: 1583-
1598.
6. Duvvuri M, Konkar S, Hong KH, Blagg BSJ, Krise JP (2006) A New Approach for
Enhancing Differential Selectivity of Drugs to Cancer Cells. ACS Chemical
Biology 1: 309-315.
7. Liu J, Lu W, Reigada D, Nguyen J, Laties AM, et al. (2008) Restoration of Lysosomal
pH in RPE Cells from Cultured Human and ABCA4-/- Mice: Pharmacologic
Approaches and Functional Recovery. Invest Ophthalmol Vis Sci 49: 772-780.
8. Chen J (2009) Recent development and SAR analysis of colchicine binding site
inhibitors. Mini Rev Med Chem 9: 1174-1190.
9. Johnson LV, Walsh ML, Chen LB (1980) Localization of mitochondria in living cells
with rhodamine 123. P Natl Acad Sci USA 77: 990-994.
156
10. Modica-Napolitano JS, Aprille JR (1987) Basis for the selective cytotoxicity of
rhodamine 123. Cancer Res 47: 4361-4365.
11. Trapp S, Rosania G, Horobin R, Kornhuber J (2008) Quantitative modeling of
selective lysosomal targeting for drug design. Eur Biophys J 37: 1317-1328.