Embed Size (px)
Citation preview
1
Intra-regional credit contagion and global systemic risk in international sovereign debt markets
Elena Kalotychoua, Eli Remolonab and Eliza Wu c,*, #
a Cass Business School, City University London, 106 Bunhill Row, London, UK.
b Bank for International Settlements, Representative office for Asia and the Pacific, 78th Floor, IFC Two, 8 Finance Street, Central, Hong Kong.
c Finance Discipline Group, UTS Business School, University of Technology, Sydney, NSW
2007, Australia.
This version: 25 September 2013
Abstract We examine intra-regional credit contagion and systematic exposures of sovereign credit default swap (CDS) spreads to global sovereign risk as measures of aggregate sovereign credit risk in the international financial system. Based on a relatively large sample of 67 countries with daily sovereign CDS data from 2002-2013 this study documents the dynamic changes in the degree of systemic sovereign credit risk exposure pre- and post the Global Financial Crisis and the European Sovereign Debt Crisis. We find very significant episodes of intra-regional credit contagion concentrating between 2008-2013. Furthermore, we find that systemic risk levels heightened in sovereign credit markets from 2010-2011 coinciding with the peak of the European Debt Crisis. Systemic sovereign credit risk levels have increased largely due to deteriorations in macroeconomic fundamentals, rising government debt levels and the global sensitivity to China’s sovereign risk premia. Sovereign credit events emanating within regions increase global sovereign risk levels but not the systematic risk exposure to global sovereign risks. JEL: G15, F30, F31 Keywords: systemic sovereign credit risk, sovereign ratings, sovereign credit contagion, sovereign debt, credit default swap spreads *Corresponding author Eliza Wu, Tel. +61-295143905; Email [email protected]. # The bulk of this paper was written whilst Wu was visiting the Hong Kong Institute for Monetary Research (HKIMR) at the Hong Kong Monetary Authority (HKMA). Eliza Wu gratefully acknowledges the Research Fellowship offered by the HKIMR. We wish to thank seminar participants at the HKMA, Deakin University, Monash University, University of Technology, Sydney, University of Western Australia and also our discussants and conference participants in the 2013 INFINITI conference in Aix-en-Provence and the Second Annual Conference on Global Financial Stability - Systemic Risk: Liquidity Risk, Governance and Financial Stability in Sydney. All errors remain our own and do not reflect the views of the Bank for International Settlements nor the Hong Kong Institute for Monetary Research.
2
Intra-regional credit contagion and global systemic risk in international sovereign debt markets
Abstract We examine intra-regional credit contagion and systematic exposures of sovereign credit default swap (CDS) spreads to global sovereign risk as measures of aggregate sovereign credit risk in the international financial system. Based on a relatively large sample of 67 countries with daily sovereign CDS data from 2002-2013 this study documents the dynamic changes in the degree of systemic sovereign credit risk exposure pre- and post the Global Financial Crisis and the European Sovereign Debt Crisis. We find very significant episodes of intra-regional credit contagion concentrating between 2008-2013. Furthermore, we find that systemic risk levels heightened in sovereign credit markets from 2010-2011 coinciding with the peak of the European Debt Crisis. Systemic sovereign credit risk levels have increased largely due to deteriorations in macroeconomic fundamentals, rising government debt levels and the global sensitivity to China’s sovereign risk premia. Sovereign credit events emanating within regions increase global sovereign risk levels but not the systematic risk exposure to global sovereign risks. JEL: G15, F30, F31 Keywords: systemic sovereign credit risk, sovereign ratings, sovereign credit contagion, sovereign debt, credit default swap spreads
3
1. Introduction
The recent sovereign debt crisis that emanated from Europe has exerted its adverse impacts
globally highlighting the speed and force with which financial contagion can occur across
national borders in the international financial system. Motivated by these recent
developments this study seeks to examine whether these types of developments within
regions work to increase global sovereign credit risk levels overall and/or they heighten the
sensitivities to global risk factors to rapidly spread throughout the world. The rapid widening
of sovereign credit spreads not only within Europe but in other parts of the world highlights
the importance of reaching a better understanding of the driving forces underlying systemic
sovereign credit risk. According to the ISDA (2013), the top 9 gross positions held in the
credit default swap (CDS) markets amass to a staggering US$12.5 trillion and are all
currently referenced on sovereign debt securities with 4 of those sovereign obligors coming
from the European Union (Italy, Spain, France, Germany) and another that is yet to join
(Turkey).
We focus on assessing systemic sovereign credit risks and regional credit contagion as the
recent European debt crisis has highlighted that governments can be the main source of
systemic risks and the fact that economies are intricately linked in an era of increasing
globalization means that this risk poses a serious threat to the international financial system
and the global economy. Our main contribution is in providing a better understanding on the
mechanics underlying the development of the recent global sovereign debt crisis that
emanated from deteriorating fundamental performance within the European region.
4
We first focus on sovereign credit contagion within regions as intra-regional contagion may
be a prelude to heightened systemic risk levels and ultimately sovereign debt crises.1 Second,
this paper provides a new measure of systemic sovereign credit risk based on a cross-
sectional average of national exposures to aggregate world sovereign credit risk. This is in a
similar spirit to the recent work of Berger and Pukthuanthong (2013) in measuring systemic
risk on international equity markets. We contribute to the literature on systemic risk by
improving the understanding of how systemic risk exposures in the global financial system
can change over time. This extends earlier work by Remolona, Scatigna and Wu (2008) on
the pricing of fundamentals and risk aversion in sovereign CDS markets.
Consistent with the extant literature, we base our empirical analysis on sovereign CDS
spreads as it provides a more direct measure of sovereign credit risk than actual sovereign
debt yield spreads as the latter are influenced by interest rate movements, supply changes in
sovereign bonds, illiquidity and other factors (Ang and Longstaff, 2013; Pan and Singleton,
2008; Remolona, Scatigna and Wu, 2008). A sovereign CDS contract provides insurance
protection against the event of a sovereign debt default. The buyer in exchange for the
payment of an annual spread (market risk premia) is permitted to sell defaulted sovereign
debt to the CDS seller to redeem the par value of the underlying bond in the event of a
sovereign default. The buyer of a sovereign CDS is not necessarily required to have an
underlying exposure to the sovereign bonds – a situation called naked CDS trading which has
allowed speculation on sovereign defaults to enter into sovereign credit markets. As the 5
year maturity segment of the sovereign CDS market is established to be the most liquid, we
also restrict our analyses to this tenor to mitigate problems with illiquidity in sovereign debt
prices. 1 There is a vast literature linking the financial crises that occurred in the 1990s and early 2000s to past episodes of financial contagion. See for example, Bae, Karolyi and Stulz (2003), Dungey et al. (2006), Forbes and Rigobon (2007); Kaminsky and Reinhart (2000) and Kaminsky, Reinhart and Vegh (2003).
5
In recent work on measuring systemic risk within financial systems, Rodriguez-Moreno and
Peria (2013) compare two groups of macro-based and micro-based measures and for both
groups they find that measures based on market-determined credit default swap (CDS)
spreads performed better and are more straightforward to use than alternative measures.
Hence, our measures of systemic sovereign credit risks based on the common pricing of
global risks in national sovereign CDS spreads is well supported by existing studies
measuring systemic risks.
As the concepts of financial contagion and systemic risk are closely related, we formulate our
study around these two issues. Prior research by Ang and Longstaff (2013) on systemic
sovereign credit risk has incorporated these developments within a single framework whereas
we attempt to look at these separately. Financial contagion is usually marked by the
realization of a shock to one country triggering a cascade of falls in other countries (Forbes
and Rigobon, 2007) where systemic risk arises from shared and simultaneous effects across
countries to major shocks (Adrian and Brunnermeir, 2008). Both of these issues are closely
associated with financial crises (Bekaert et al., 2013). Hence, first we investigate credit
contagion within regions and we capture the effects of sovereign credit events on the credit
spreads of other sovereigns within a geographical region and also globally. Second, we study
global systemic risk by estimating the average cross-sectional exposures of national
sovereign obligors to a common global risk factor in a multifactor asset pricing framework
following Berger and Pukthuanthong (2012).
We formulate and test three related hypotheses. First, we hypothesise that there have been
significantly more major episodes of credit contagion within geographic regions since the
6
Global Financial Crisis (GFC) and their effects on other countries have become stronger over
time. Second, these region-specific episodes of sovereign credit contagion work to increase
the global levels of sovereign credit risks. Third, systemic sovereign credit risk has been
driven by common deteriorations in economic fundamentals and changes in global risk
aversion since the onset of the GFC and subsequently the European sovereign debt crisis.
We find evidence of intra-regional credit contagion stemming from large jumps in sovereign
CDS spreads that cause unanticipated changes in the CDS spreads of other sovereigns within
the region. The effects become more pronounced from the 2007-2008 GFC onwards. The
regional credit events are found to be significantly and positively related to global sovereign
credit risk levels. Our separate regression analyses of global sovereign credit risk levels and
the systemic risk exposure to those global risks suggests that common movements in
sovereign credit spreads are related to financial market variables and market risk appetite,
consistent with earlier studies (Dieckmann and Plank, 2012; Remolona, Scatigna and Wu,
2008; Longstaff et al., 2010 and Ang and Longstaff, 2013), but we also find a major role for
China’s sovereign risk premia in driving both aggregate global sovereign credit risks and the
exposure to that over time. The common deteriorations in country economic fundamentals
captured by debt to GDP levels and downgrades in sovereign credit ratings increase the
sensitivity to global sovereign credit risks.
The remainder of the paper is organized as follows. Section 2 reviews the related literature.
Section 3 describes the sovereign CDS data used in this study. Section 4 introduces our
empirical methodologies whilst Section 5 studies the nature of sovereign credit contagion,
global sovereign credit risks and systemic risk exposures. Finally, Section 6 provides
concluding remarks and some policy implications.
7
2. Literature Review
There is a growing empirical literature on the determinants of sovereign credit spreads and
the more recent studies in this strand document that sovereign credit spreads are related to
common global and financial market factors (for example, Geyer, Kossmeier and Pichler,
2004; Remolona, Scatigna and Wu, 2008; Longstaff et al., 2010; Ang and Longstaff, 2013).
This paper is the first to estimate the market-based systemic risk exposure of national
sovereign credit spreads from a cross-section of sovereign CDS spreads.
Hilscher and Nosbusch (2009) show that sovereign default risk is closely related to country
fundamentals, even after controlling for sovereign credit ratings and global factors. Their
default risk implied credit spreads track observed market-based bond spreads fairly
accurately in out of sample tests. However, their tests were restricted to emerging market debt
where the focus on sovereign credit risks traditionally resided.
However, a recent phenomenon noted by Longstaff et al. (2010) and Dieckmann and Plank
(2012) is that the cross-section of sovereign CDS spreads across advanced economies also
exhibits a strong degree of commonality that is not related to the country-specific
fundamentals of sovereign obligors. Longstaff et al. (2010) reveal that sovereign CDS
spreads are explained and predicted by US equity, volatility and bond market risk premia.
Moreover, Dieckman and Planck (2012) provide empirical evidence on the private-to-public
risk transfer phenomena arising from the exposures of the global banking sector and the
government bail-outs that followed.
8
There has been much recent attention focused on contagion in sovereign debt markets
following the degrees of contagion highlighted by Longstaff et al. (2010) ensuing the Sub-
prime debt crisis. Fong and Wong (2012) study sovereign risk contagion in 11 euro area
countries and the US, UK and Japan using the concept of CoVar introduced by Adrian and
Brunnermeier (2008) for measuring systemic risks within banking sectors. Specifically,
CoVar can be used to measure the value-at-risk of a country conditional upon the same of
another country. They find that based on weighted averages of the changes in CoVaR, Greece
is the most vulnerable to sovereign distress within Europe followed by Portugal, Ireland, Italy
and Spain. The Northern European countries like Finland, Germany and the Netherlands were
the least vulnerable. Using a similar framework, Fong and Wong (2011) also assess sovereign
systemic risk based on a small regional sample comprising the 11 largest Asia-Pacific
economies over the 2004-2009 time period.
With the exception of Geyer and Kossmeir’s (2004) study of systematic risk in EMU
government yield spreads, there has been a dearth of attention on the pricing of sovereign
credit risks at the global level. Much focus has been on finding the determinants that explain
credit spreads at the country level but not on the common pricing kernel for sovereign credit
risks.2 Our paper differentiates itself and contributes to the extant sovereign debt literature in
this much needed direction.
2 In a related vein, the commonality in corporate CDS spread returns within Europe has been investigated by Berndt and Obreja (2010) and they find that the first principal component of CDS returns explains 53% of the total variations.
9
3. Data The sovereign CDS data that we use for this study are sourced from the Markit database.3
Specifically, they are daily closing CDS spreads (ask prices) on five-year CDS contracts for
67 individual countries from 5 geographical regions. We use sovereign CDS spreads from the
5-year maturity segment as this is deemed to be the most actively traded of all tenors
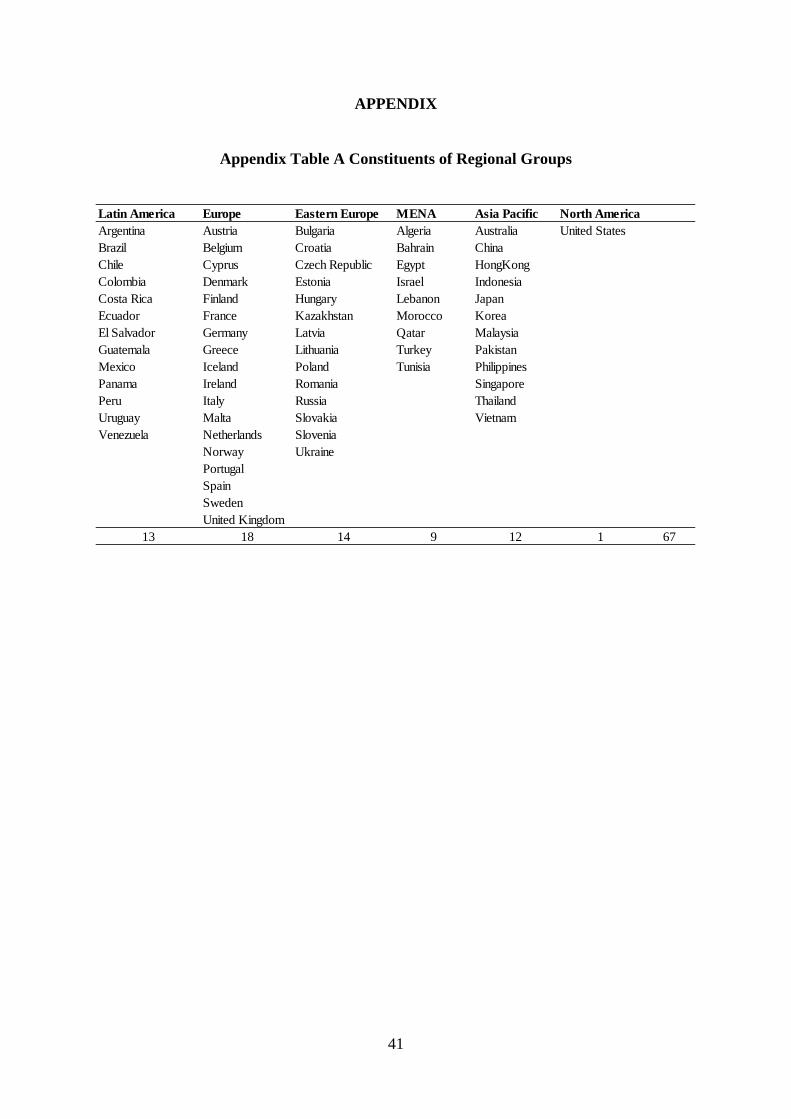
(Longstaff et al., 2010; Pan and Singleton, 2008). The sample countries are shown in
Appendix Table A. All spreads are denominated in basis points and are notionally
denominated in US dollars. The sample studied covers the time period from January 2002 to
March 2013 providing a maximum of 2,934 daily sovereign CDS observations. This is the
longest time period for which we have liquid CDS data for a large cross-section of countries.
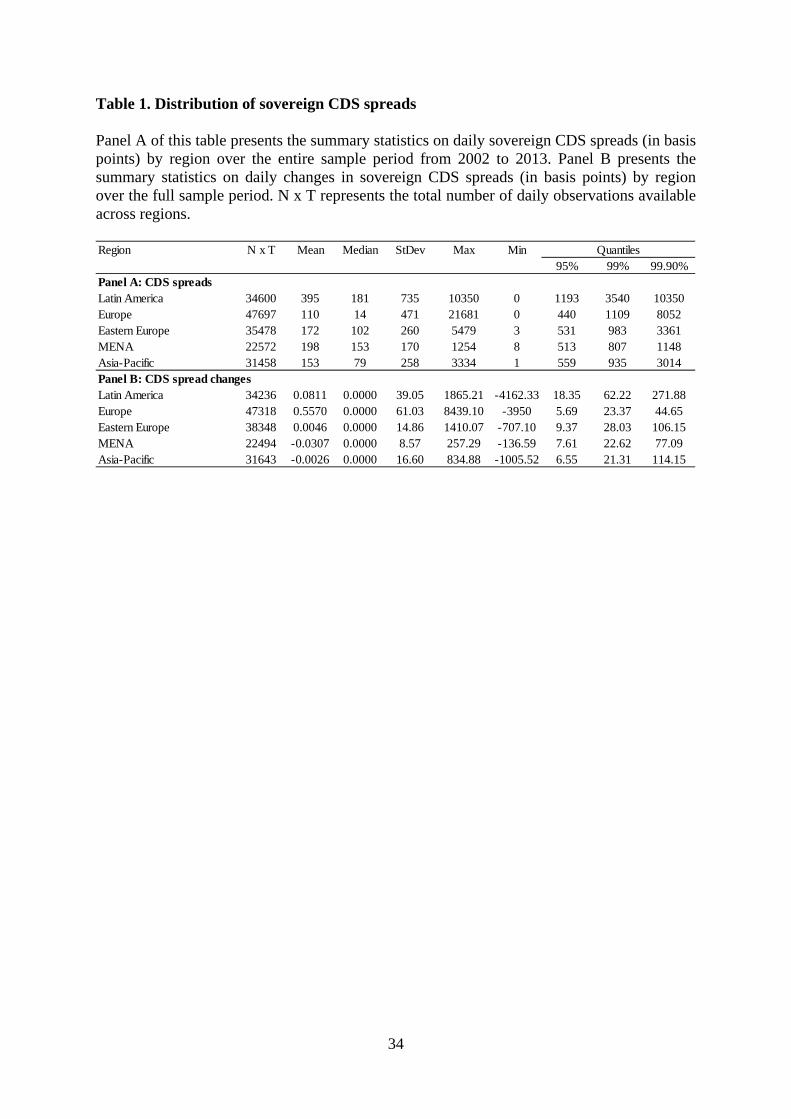
Table 1 provides summary statistics for the set of five-year sovereign CDS spreads examined.
Panel A reports the summary statistics for the levels in sovereign CDS spreads whilst Panel B
reports the same for daily changes in sovereign CDS spreads. In Panel A, the average values
of all national sovereign CDS spreads vary widely across sovereign obligors over the full
sample period. The average CDS spreads range from 395 basis points (bps) for Latin
America, 198 bps for Middle East and North Africa (MENA), 172 bps for Eastern Europe
EEU), 153 bps for the Asia-Pacific (AP) and 110 bps for the rest of Europe (EU). Latin
America (LA) has the highest mean and standard deviation of spreads (735 bps) consistent
with the chequered debt history of this entire region and especially the painful effects of the
Argentinean debt crises for the region. On the other hand, Western and Southern Europe has
experienced the lowest levels of sovereign risk premia on average but with considerable
volatility with a standard deviation of 471 bps mainly due to the turmoil in the last two years 3 Another data source for sovereign CDS spreads is Thomson Reuters but these are available for a much shorter time period. For instance, Fong and Wong (2012) were only able to get data for their sample of eurozone countries and the US, UK and Japan starting from 14 December 2007. We find that there is a large correspondence in the brief time period over which the various data sources overlap.
10
of the sample. The volatility in sovereign CDS spreads is similar in Eastern Europe and the
Asia-Pacific region with a standard deviation of around 260 bps, while MENA exhibits the
least volatile spreads. Interestingly, daily spread changes in Panel B have been largest on
average in Europe with a mean of 0.5570 bps and by far the most volatile with a standard
deviation at 61.03 bps. The Asia-Pacific and Eastern Europe have also experienced small
daily changes in sovereign CDS spreads on average across the full sample period – 0.0026
and 0.0046 basis points respectively and relatively low volatility. The CDS spread changes at
the lower tail of the distribution bear out that Latin America experienced the most adverse
99.9% spread change quantile at 271.88 bps , which represents the effects of the 2002 crisis,
while on the other hand, European CDS spreads exhibit the lowest 99.9% quantile at 44.65
bps.
[Insert Table 1 here]
4. Empirical Methodology
4.1 Intra-regional and global sovereign credit contagion
The first part of our analysis focuses on measuring the degree of sovereign credit contagion
within each of the five geographic regions and across the globe via an event study on all
sovereign credit events over our full sample period. Hence, we first define the sovereign
credit events that may have triggered credit contagion within respective regions. We
essentially follow the empirical framework of Jorion and Zhang (2009) in measuring credit
contagion for US corporate debt issuers and rely on abnormal jumps in sovereign CDS
spreads to identify credit events in the sovereign CDS market.
11
We define a regional sovereign credit event when
∆Si,t ≥ k (1)
where ∆S is the daily change in sovereign CDS spreads for sovereign i on day t and threshold
k is the 99.9% region-specific quantile of the historical sovereign CDS spread change
distribution reported in Table 1.
In order to pinpoint the exact onset of the credit event, all consecutive events within each
region were identified but only the first observation within a 5-trading-day window was kept.
Our approach identifies 89 credit events, arising from 20 individual countries over the full
sample period from 2002-2013.
To assess the contagion effects of sovereign credit events at a regional level, for each event
we construct an equally weighted portfolio of CDS Spreads (we call this regional CDS spread
index CDX) that contains all sovereigns in the region except the one that triggers the event.
At the global level, we measure the effect on a global credit portfolio comprising the US and
all the countries in the sample except the event-triggering country.
The reaction of the region surrounding the credit event from day t=0 up to 2 post-event days
and –2 pre-event days is evaluated by means of the change in the CDS spread of the
respective regional portfolio (CDXC). First, for each day t in the event window [t1, t2] we
construct the cross-sectional Average CDS Spread Change as
𝐴𝐶𝐷𝑋𝐶𝑡 = 1𝑁∑ 𝐶𝐷𝑋𝐶𝑁𝑖=1 𝑖𝑡
(2)
12
where CDXC is the change in the regional CDS portfolio spreads and N = 89 credit events.
We then compute the Cumulative Average CDXC over the event window as
𝐶𝐴𝐶𝐷𝑋𝐶[𝑡1, 𝑡2] = ∑ 𝐴𝐶𝐷𝑋𝐶𝑡2𝑡1 𝑡
(3)
In order to circumvent biases in the variance estimation caused by ignoring cross-section-
dependence we adopt the portfolio time series approach advocated by Brown and Warner
(1980). Thus, we control for cross-section dependence induced by possible event clustering
by computing the variance of the average CDS spread change across events, 𝑉𝑎𝑟(𝐴𝐶𝐷𝑋𝐶0),
over the 60-day pre-event window [-70, -11]. In this framework, the event-day corrected (for
cross-section dependence) t-statistic is
𝐴𝐶𝐷𝑋𝐶𝑡�𝑉𝑎𝑟(𝐴𝐶𝐷𝑋𝐶0)
, 𝑡 = −2, … ,0, … ,2 (4)
and the corresponding t-statistic for the Cumulative Average CDXC over [t1, t2] is
𝐶𝐴𝐶𝐷𝑋𝐶[𝑡1,𝑡2]�(𝑡2−𝑡1+1)𝑉𝑎𝑟(𝐴𝐶𝐷𝑋𝐶0)
(5)
4.2 Measuring systemic sovereign credit risk
The second part of our analysis focuses on measuring systemic risk across international debt
markets. We first compute an underlying world market factor based on a principal component
analysis (PCA) and then estimate the cross-sectional average loadings on this global risk
factor over time to create a measure of time-varying systemic sovereign credit risk.
13
Our approach captures the average exposure to world sovereign credit risks in international
sovereign credit markets and we consider the exposures above a 99% threshold as being
indicative of high systemic risk levels. This works in the same spirit as Berger and
Pukthuanthong’s (2012) ‘fragility index’ for equity markets. Their study finds evidence that
in periods that countries share a high risk exposure to a common factor, they are more likely
to experience simultaneous market crashes. Our measure provides a different perspective to
the systemic risk measure based on default intensities implied from a term structure of
sovereign CDS spreads recently introduced by Ang and Longstaff (2013). However, unlike
Ang and Longstaff (2013), our measure is not benchmarked on individual major world
economies like the U.S. and Germany but rather assesses the time-varying exposure of
national credit spreads to the global sovereign credit risk factor. That is, rather than focusing
on systemic default risk, we are more interested in the systemic aspect of the market pricing
of sovereign credit risk as reflected in sovereign CDS spreads.
To compute the global risk factor, we follow a similar PCA to Berger and Pukthuanthong
(2012) and Pukthuanthong and Roll (2009). We estimate out-of-sample principal components
based on the covariance matrix in the previous calendar year computed with the returns from
16 major countries comprising Brazil, Venezuela, Mexico, Turkey, Colombia, Philippines,
Malaysia, Russia, Thailand, Korea, Panama, Bulgaria, Poland, Qatar, Peru and Croatia. These
are the countries for which we have the longest history of sovereign CDS spreads and the
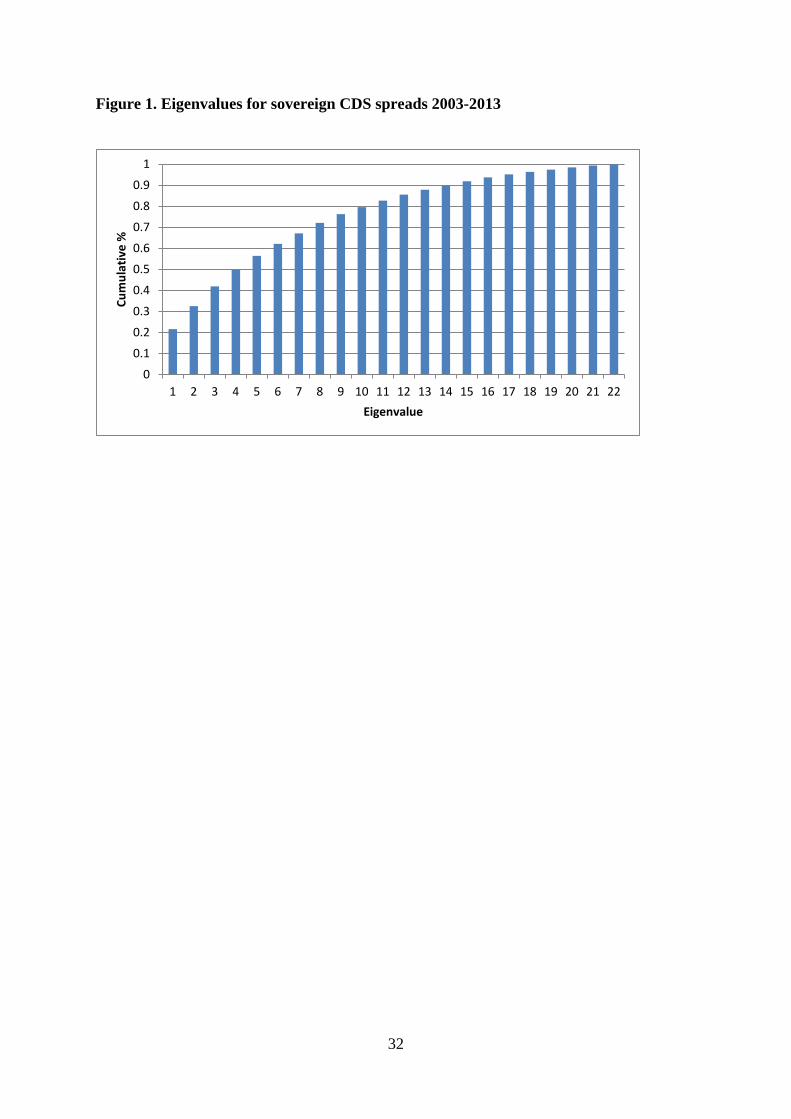
least number of missing observations. The eigenvalues from our initial PCA is illustrated in
Figure 1. It can be seen that the first ten principal components explain 80% of the variations
in national sovereign CDS spreads which indicates that we can capture a large proportion of
the common risks across our global sample of sovereign CDS with these principal
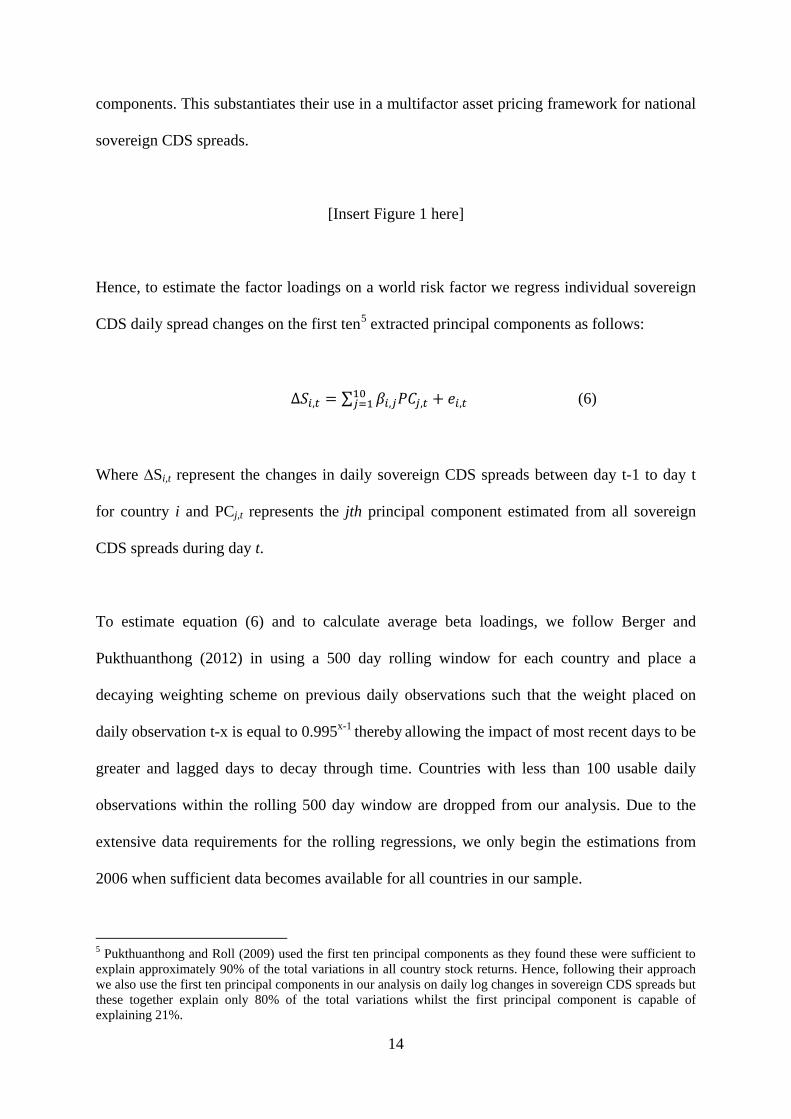
14
components. This substantiates their use in a multifactor asset pricing framework for national
sovereign CDS spreads.
[Insert Figure 1 here]
Hence, to estimate the factor loadings on a world risk factor we regress individual sovereign
CDS daily spread changes on the first ten5 extracted principal components as follows:
∆𝑆𝑖,𝑡 = ∑ 𝛽𝑖,𝑗𝑃𝐶𝑗,𝑡 + 𝑒𝑖,𝑡10𝑗=1 (6)
Where ∆Si,t represent the changes in daily sovereign CDS spreads between day t-1 to day t
for country i and PCj,t represents the jth principal component estimated from all sovereign
CDS spreads during day t.
To estimate equation (6) and to calculate average beta loadings, we follow Berger and
Pukthuanthong (2012) in using a 500 day rolling window for each country and place a
decaying weighting scheme on previous daily observations such that the weight placed on
daily observation t-x is equal to 0.995x-1 thereby allowing the impact of most recent days to be
greater and lagged days to decay through time. Countries with less than 100 usable daily
observations within the rolling 500 day window are dropped from our analysis. Due to the
extensive data requirements for the rolling regressions, we only begin the estimations from
2006 when sufficient data becomes available for all countries in our sample.
5 Pukthuanthong and Roll (2009) used the first ten principal components as they found these were sufficient to explain approximately 90% of the total variations in all country stock returns. Hence, following their approach we also use the first ten principal components in our analysis on daily log changes in sovereign CDS spreads but these together explain only 80% of the total variations whilst the first principal component is capable of explaining 21%.
15
Anecdotal evidence from the European sovereign debt crisis suggests that international
sovereign credit markets have become more closely interconnected on a global level since
2009-2010 with the revelation of budgetary problems in Greece and subsequently other
peripheral neighbours in Southern Europe creating fast and furious contagion throughout
international debt markets (Beirne and Fratzscher, 2013; Kalbaska and Gatkowski, 2012).
However, the downside to rising international comovements in sovereign CDS spread
changes is that the sensitivities to global risks also heighten across countries within the global
financial system. Hence, it is important for us to focus on the commonalities in global
sovereign credit risk exposures across countries as indicators of global systemic risk in the
sovereign debt markets.
Our systemic risk measure is computed by taking the cross-sectional average of the betas
associated with the first principal component (primary global risk factor) of the sovereign
CDS spread changes as follows:
𝑆𝑦𝑠𝑅𝑖𝑠𝑘𝑡 = ∑ 𝛽𝑖,𝑃𝐶1,𝑡𝑁𝑖=1
𝑁 (7)
where SysRiskt is the aggregate systemic risk measure for all countries i = 1,…, N in a given
regional grouping at time t . The beta loadings are estimated over a 500 day rolling window
[t-1, t-500].
4.3 Determinants of systemic sovereign credit risk
In the final part of our empirical analyses, we explore the determinants of global sovereign
credit risk and the systematic risk exposure of national sovereign credits to the predominant
16
global sovereign risk factor in the international financial system. Interdependence between
asset price changes may change over time either from changing volatility in the underlying
risk factor which is priced or time variations in the beta loading on that risk factor (Bekaert,
Hodrick and Zhang, 2009). Hence, it is important to examine the determinants of both to
comprehensively understand the systematic pricing of sovereign credit risk. There are many
variables that could be potentially related to sovereign credit risk so we are guided by prior
research on sovereign credit risk in our selection of determinants (Ang and Longstaff, 2013;
Longstaff et al., 2010). We focus on a set of market-based and fundamental variables for
explaining the global risk factor itself and its time-varying beta loading.
Our main variable of interest is a credit event indicator (Reg_Creditevent) that takes a value
of one when there is a regional sovereign credit event defined above by equation (1). Our a
priori is that episodes of intra-regional credit contagion are expected to heighten global
sovereign credit risks and potentially, the systematic risk exposures to global risks. For
understanding the transmission of sovereign credit contagion within and beyond regions, we
also examine an alternative indicator denoting when there is a credit contagion event taking
place outside of a particular region (Other_Reg_Creditevent). We expect the
Other_Reg_Creditevents variable to be generally less important than the region-specific ones
in affecting individual region’s exposure to global sovereign credit risk.
For control variables, we use stock market returns on the S&P 500 index or the German DAX
index; the change in the VIX implied volatility index on the S&P 500 or the change in the
VDAX implied volatility index on the DAX (Implied_Vol) to proxy global risk appetite; the
CDX North American Investment Grade index of CDS spreads or the European iTraxx index
of CDS spreads (Itrx_Corporate) to capture corporate credit conditions; and the change in
17
China’s sovereign credit default swap spreads (China) to account for the influence of China’s
sovereign credit risks.
To capture key aspects of a country’s macroeconomic fundamentals that are likely to affect
the ability and willingness of sovereigns to service or repay their debts, we compute an
average of the credit quality assessments provided by the three major international credit
rating agencies – Standard and Poors, Moodys Investor Services and Fitch and account for
the changes in sovereign re-rating activity (Sov_Rating_Chg). The sovereign credit ratings
are first converted into linear scores following the approach of Gande and Parsley (2005).
Ismailescu and Kazemi (2010) have previously documented that sovereign CDS spreads react
significantly to changes in sovereign credit ratings provided by credit rating agencies. The
ratio of Debt to GDP (Debt_GDP) was also included as a fundamental variable as there is a
clear relationship between a country’s level of indebtedness relative to the size of its
economy and its future ability to servicing its financial liabilities (Reinhart and Rogoff,
2010).
The data for all these control variables used are obtained from the Bloomberg system and
Thomson Reuters Datastream with the single exception of the gross levels of general
government debt to Gross Domestic Product being sourced from the International Monetary
Fund’s World Economic Outlook database.
5. Main Findings
5.1 Intra-regional and global sovereign credit contagion 2002-2013
18
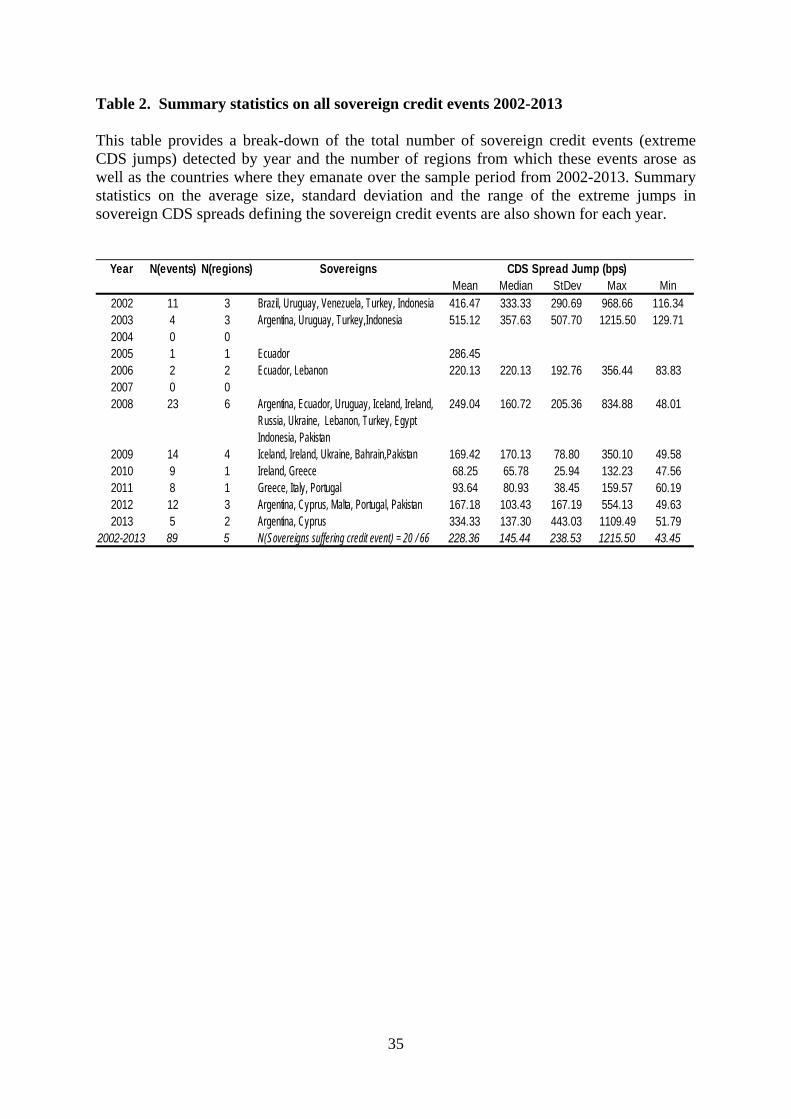
The sovereign credit events detected in each sample year based on significantly large jumps
in sovereign CDS spreads are shown in Table 2. Over the full sample period there were 89
credit events arising from 20 sample countries. The average size of all the extreme sovereign
CDS spread jumps (at the threshold level k = 99.9%) were 228.36 basis points with the
maximum spread jump being up to 1215.50 basis points (in LA) and the smallest sovereign
credit event was a jump of 43.45 basis points (in EU). Sovereign credit events occurred in all
regions and they emanated from a large cross-section of countries indicating that sovereign
credit problems are not confined to only one or two sovereign obligors in the world. Within
Europe, the sovereign credit events pertained to Icelandic, Irish, Greek, Portuguese, Italian
and Cypriot sovereign credits and within Emerging Europe the credit events were restricted
to Russia and Ukraine. For Latin America, the sovereign credit events arose from Argentina,
Brazil, Ecuador, Venezuela and Uruguay. For Middle East and North Africa, sovereign credit
events were limited to come from Lebanon, Bahrain and Turkey whilst in the Asia-Pacific
region, they emanated from Indonesia and Pakistan.
We can make several interesting observations. First, whilst extreme jumps in sovereign CDS
spreads marking credit events used to be larger in magnitude and were confined to a handful
of emerging countries from LA, AP and MENA since the GFC, there have been a larger
number of credit events of a smaller magnitude. The critical difference is that those smaller
credit events have emanated from advanced as well as emerging countries since the GFC.
Second, the distribution of sovereign credit events has indeed changed tremendously over
time. It can be seen that 71 of the 89 total credit events detected (80%) were concentrated
within the 2008-2013 period. There were no sovereign credit events during 2004 and 2007
and only one event occurred during 2005 in Ecuador. In all other years, there were multiple
sovereign credit events. The number of sovereign credit events peaked in 2008 at 23 during
19
the Global Financial Crisis (GFC) when credit events emanated from all regions in that
specific year. This corroborates with the dramatic global reach of the GFC. The fallout from
the sub-prime debt crisis continued into 2009-2010 with major sovereign credit events arising
from Iceland and Ireland with their banking sectors’ heavy exposures to sub-prime debt and
the subsequent private to public transfer of risks when national governments stepped in to
provide massive bailouts for troubled banks as highlighted by Dieckmann and Plank (2012).
Subsequently, sovereign credit events occurred for Greece, Italy, Portugal and Cyprus over
the most recent European Debt Crisis spanning 2010-2013.
[Insert Table 2 here]
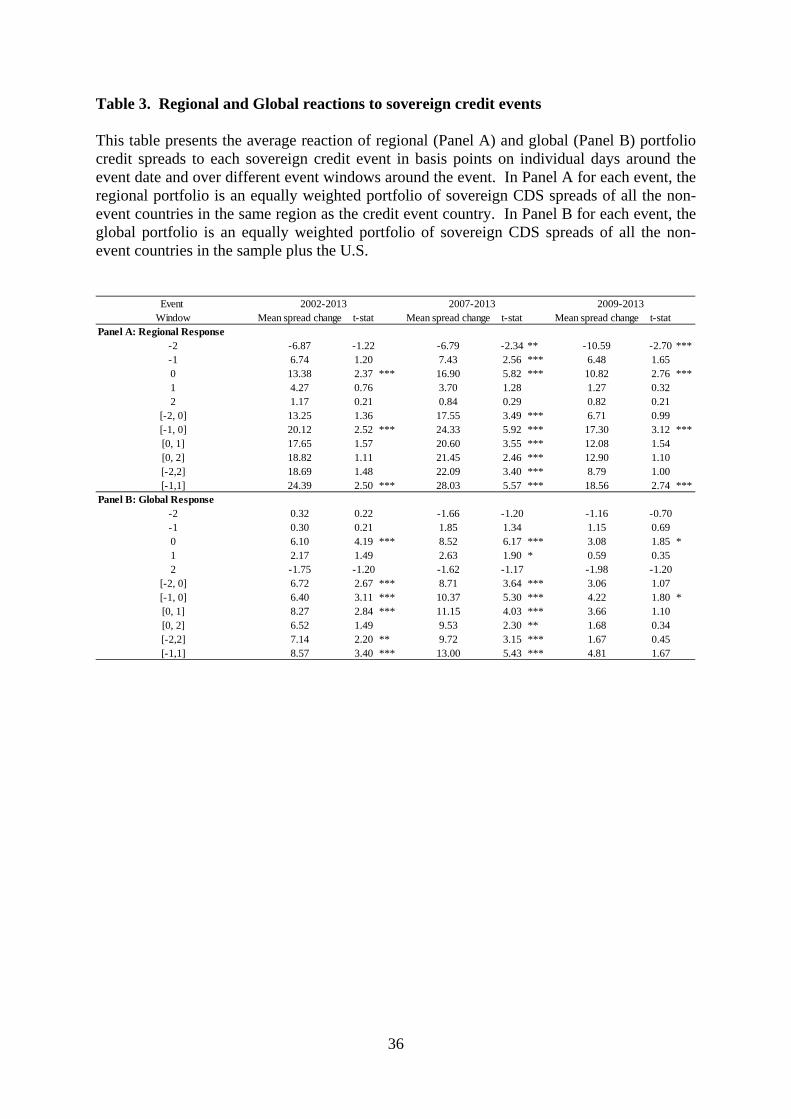
The event study results on the impact of all sovereign credit events on regional and global
sovereign credit portfolios are presented in Table 3 for the full sample period and two sub-
sample periods post-GFC and post-European debt crisis. The event study results clearly
indicate that sovereign credit events have immediate and significant effects on neighbouring
sovereigns within the same geographical region. The intra-regional impacts are both
statistically and economically significant. On average, over 2002-2013 a sovereign credit
event increased daily sovereign CDS spread changes for other sovereign obligors in the
region on the same day (t=0) by 13.38 basis points (significant at the 1% level). However,
there was also a significant cumulative impact of 20.12 bps over the two days window [-1, 0]
and an even greater cumulative impact over the three days window [-1,1] at 24.39 bps. These
regional credit portfolio reactions are all highly significant at the 1% level. This suggests that
sovereign credit events on average are anticipated and work to increase the borrowing costs
of the entire region surrounding the event country during the three days window around a
sovereign credit event. There were no significant effects beyond the [-1, 1] event window
20
corroborating with the fast and furious spread of contagion documented by Kaminsky,
Reinhart and Vegh (2003).
Interestingly, sovereign credit contagion is evident on the event day irrespective of the sub
period analysed but it has been the strongest in the sub-sample (2007-2013) with the regional
portfolio response being more economically significant than for the full sample. For instance,
the portfolio cumulative mean spread change for sovereign credit events in the [-1,1] event
window is 24.39 basis points for the full sample period but 28.03 basis points for the 2007-
2013 GFC sub-sample and the significance of the reaction is strengthened. Similar evidence
is borne out for the day-0 regional credit spread change which increases from 13.38 bps to
16.90. In the 2007-2012 sub-sample period, the impacts of sovereign CDS jumps in
individual countries had pervasive and prolonged effects on regional portfolios consistent
with heightened levels of risk aversion across all financial markets at the time. The two sub-
sample period results also indicate that sovereign credit events have been anticipated and
already affected regional sovereign credit portfolios even two days prior to the event day. The
day-0 response remains strongly significant after 2009, and the results imply spread changes
of 10.82 for the post-European debt crisis period. While the cumulative regional effects
during the 2009-2013 post-European debt crisis sub-sample remain present for windows [1,
1] and [-1, 0] and fairly consistent with the full-sample results, the regional response is not as
strong as for the 2007-2013 post-GFC sub-sample. The results suggest that the credit events
of 2008 triggered by the credit crunch had the most notable impact on the default riskiness of
the neighbouring countries. It should also be noted that the number of credit events peaks in
2008.
[Insert Table 3 here]
21
Panel B of Table 3 presents the reaction of the global credit portfolio to sovereign credit
events. The results suggest that credit contagion is also present at the global level but the
impact of the events is dampened (roughly half of that in the regional portfolios). The
significant effects appear in days 0 and day +1, which implies that there is no anticipation at
the global level as opposed to the case of the regional portfolios where the credit events seem
to be anticipated a priori and fully reflected in the credit spreads of the region by the end of
day 0. Interestingly, the post-European debt crisis sub-sample shows very weak response, for
day 0 and cumulatively for [0,1] significance drops to the 10% level and is economically
insignificant.
5.2 Time-varying systemic sovereign credit risks
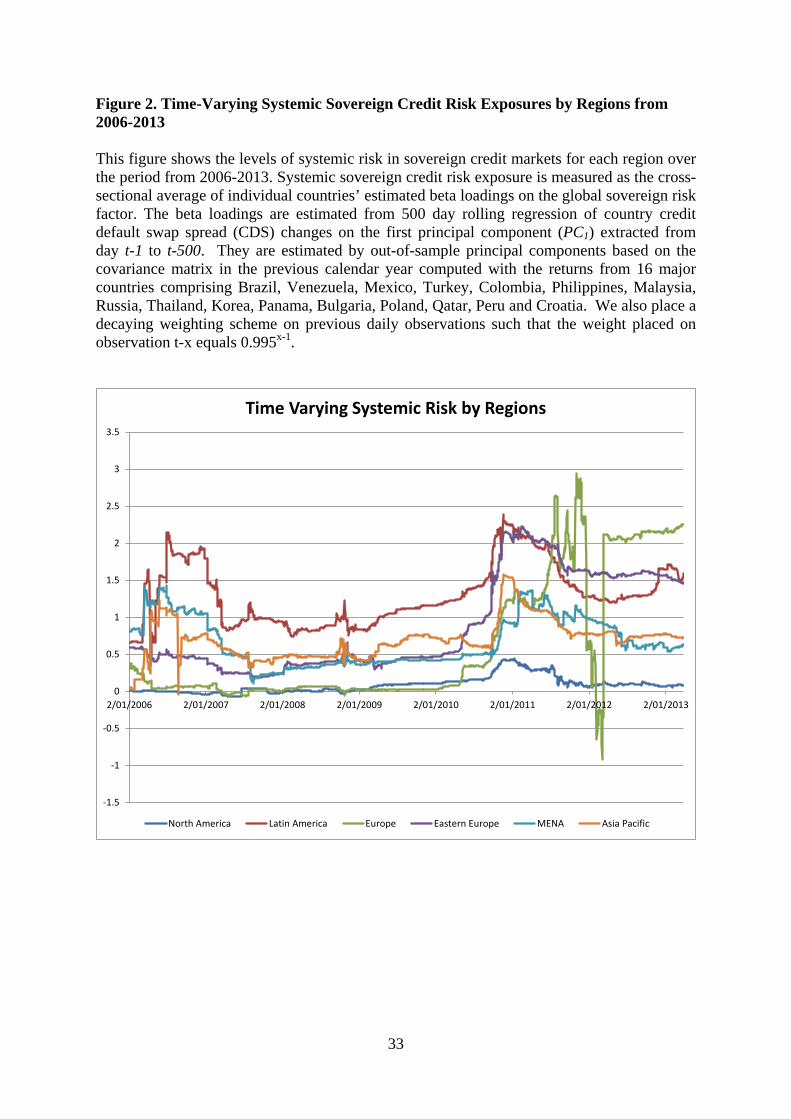
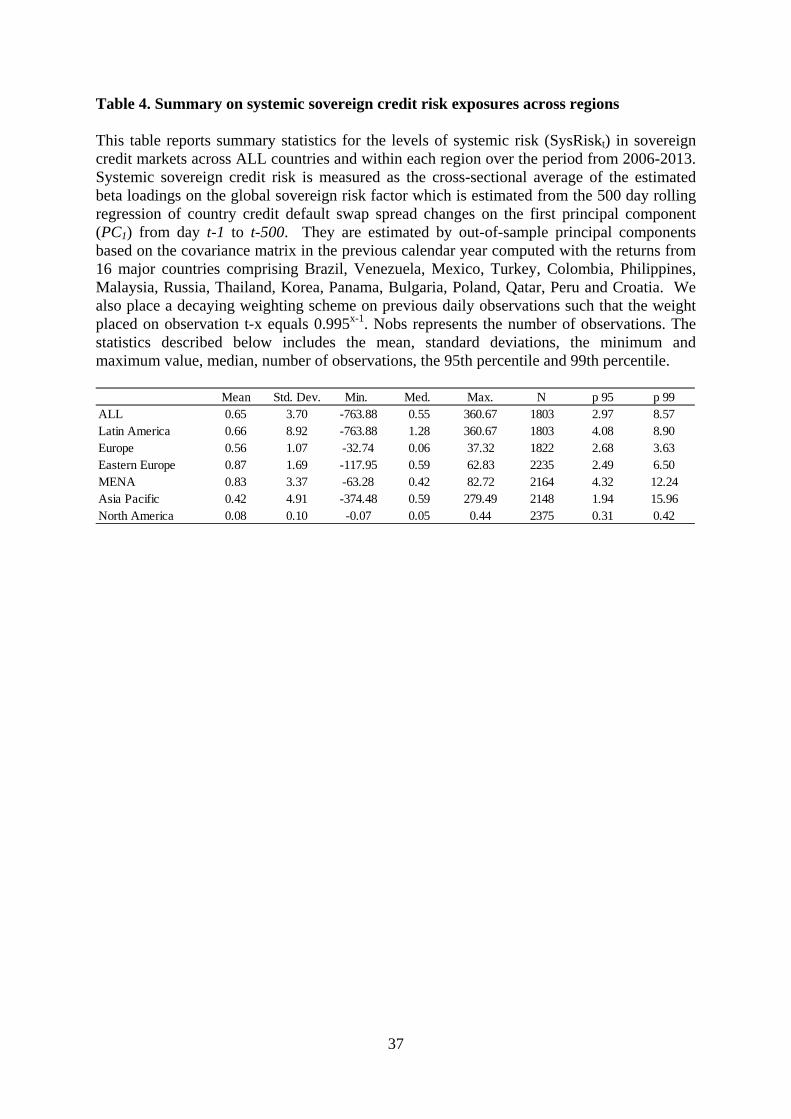
The dynamics of estimated beta loadings (systemic risk exposures) on the primary global risk
factor in our multi-factor global asset pricing model is illustrated in Figure 2 and the
summary statistics are provided in Table 4.
[Insert Figure 2 & Table 4]
In Table 4, systemic risk levels measured by the cross-sectional average of these beta
loadings are highest on average for Eastern Europe and MENA (average betas of 0.87 and
0.83 respectively) and the lowest for North America’s sole representative country, the United
States (beta of 0.08). Outside of North America, the Asia Pacific displays the lowest levels of
systemic risk exposures (average beta of 0.42). However, it is also evident in Figure 2 that
systemic risk exposures to global sovereign credit risk varies dramatically over time. Latin
American sovereigns have typically been the most variable in their systemic risk exposures
22
(with a standard deviation of 8.92) followed by the group of Asia Pacific nations (with a
standard deviation of 4.91). Whilst Europe and Eastern European sovereigns have
traditionally been the least volatile in their systemic risk exposures (standard deviations of
1.07 and 1.69 respectively), since late 2010, the systemic risk levels of sovereigns in Europe
have surpassed those of all other regions. Despite having declined rapidly in late 2012 the
systemic risk levels have rebounded to remain largely above those of other regions
suggesting that the European Debt Crisis continues to make European sovereign debt markets
systemically fragile. The periods of highest systemic risk were concentrated from late 2010 to
mid-2011 for all regions except Europe which became systemically fragile later on in the
escalation of the European Debt Crisis. These highest levels of systemic risk coincided with
the sovereign credit jumps from Portugal, Iceland, Italy and Ireland and Greece (PIIIG) over
2009-2011.
In Figure 2, we illustrate that there are indeed significant variations in systemic sovereign
credit risk over time. Systemic risk has built up significantly post-GFC as evidenced by the
significant jump in the common sensitivity to global risk (captured by the cross-sectional
average of beta loadings) at the end of 2010 through to the end of 2011. Systemic risk levels
have reached historical highs and are economically significant with a 1% jump in global
sovereign credit risk leading to at least a 3.63% increase in all national sovereign CDS
spreads at its fragile height (99th percentile). In fact, there was a major jump in systemic risk
levels for all regions in late in 2010 when debt concerns arose for Greece and again in 2011
when the concerns spread to Portugal then Italy.7 The European (EU) region’s systemic
exposure to global sovereign credit risks were initially at the lowest levels of all regions but
from early 2010 EU’s systemic risk levels rapidly climbed to its peak in late 2011 to be the
7 The BIS (2011) dates the beginning of the European Debt Crisis to the first signs of Greece’s budgetary problems revealed in 2009.
23
highest across all regions. However, it is apparent in Figure 2 that when the European
sovereign credit markets were most fragile, their systemic risk levels plummeted when the
new governor of the European Central Bank (ECB), Mario Draghi, introduced the €489
billion, Long-Term Refinancing Operations program from December 2011 to ease the
European Debt Crisis. Through this program, the ECB gave almost €1 trillion in 3 year loans
to European banks and pushed down money market interest rates across the EU. This
provision helped to reduce fears in global financial markets that banks might collapse and
bring down the public finances of peripheral countries in the EU like Italy and Spain. In
contrast to the EU, the systemic risk levels for non-European regions plateaued from the end
of 2011. Nonetheless, the dynamics of systemic sovereign credit risk have been fairly
consistent across all non-EU regions throughout the period from 2006-2013 with the heights
of systemic risk levels being reached in late 2010-2011.
5.3 Determinants of global sovereign credit risk and systemic sovereign risk exposures
To understand the effects of sovereign credit contagion on the build-up of systemic sovereign
credit risks we first examine the determinants of global sovereign credit risk levels
(underlying factor volatility) and then the exposures (beta loadings) to that common risk
factor over time. Bekaert, Hodrick and Zhang (2009) highlight that both channels can
contribute to the overall convergence in asset prices. Hence, we compare a common set of
market-based and fundamental-based determinants for both the global risk factor and the beta
loading on that factor to understand what matters for all countries and also variations across
geographical regions.
24
In Table 5, we report the time series regression results for explaining the underlying global
sovereign credit risk factor (estimated as the first principal component from the initial
principal component analysis). We uncover three main results regarding the variations in the
global sovereign credit risk factor. First, in model specifications 1 to 5 we establish that
sovereign credit risk is indeed significantly related to episodes of sovereign credit contagion.
The positive relation in all model specifications indicates that when there is a sovereign credit
event, global sovereign credit risk increases by between 6.683 - 7.756 basis points (depending
on the mix of control variables) and this is statistically significant at the 5% level. Model 5
indicates that sovereign credit contagion from MENA and Europe is the most significant both
statistically and economically with a credit event in these regions increasing daily global
sovereign credit risk by 3.254 and 62.65 basis points respectively. In our sample period over
2006-2013, of all regions, Latin America is the only one which has jumps in sovereign CDS
spreads that have not led to a heightening in global sovereign risks. This is not surprising
given that most of the sovereign troubles in LA occurred in the early 2000s when the pricing
of sovereign credit risks were largely segmented and not as globalized as in the post-GFC era
in which episodes of sovereign credit contagion have been concentrated in the MENA and
EU nations. Second, global sovereign credit risk is predominantly influenced by US market
variables as it is completely insensitive to European financial market developments (in model
specification 2). The effects of the control variables are largely as expected. There is a
significant positive relation between global sovereign credit risk and US stock market returns
and the VIX but a negative relation with corporate credit spreads. Third, there is strong
evidence to suggest that the global sovereign risk factor is not driven by fundamentals. The
average fundamentals in models 1 and 2 across all sample countries as well as the regional
contributions for sovereign credit rating changes and Debt to GDP levels in models 3 and 4
respectively are all insignificant suggesting that common (global) movements in sovereign
25
credit spreads are predominantly driven by global market forces and not country-specific
fundamentals corroborating with the findings of Ang and Longstaff (2013) and Longstaff et
al. (2010). Global sovereign credit risk is positively tied with the perceived default risk of
China suggesting that there is a significant influence exerted by the economic performance of
China globally.
[Insert Table 5]
In Table 6, we report the time series regression results for explaining the common sensitivity
to global sovereign credit risks captured by the cross-sectional averages of estimated beta
loadings (SysRiskt) for ALL countries and for individual regions. We reveal a stark difference
in the determinants of the beta loadings versus the underlying global sovereign credit risk
factor. Fundamental variables are actually significant in driving countries’ common exposure
to global sovereign credit risk whilst they do not affect the underlying world risk level. There
is a negative relation between sovereign credit rating changes and systemic risk exposure in
most cases indicating that sovereign credit rating downgrades tend to heighten the sensitivity
to global sovereign credit risks as expected. The LA region is unique as downgrades also
reduce their exposure to global risk consistent with the perception that LA sovereigns are
treated as a different segment in sovereign credit markets compared to other geographic
regions given their unique chequered debt history. The positive relation with debt to GDP
levels for all countries and specifically the Latin American and European regions suggest that
market participants are highly sensitive to fiscal positions in those regions that are either
historically or currently plagued by debt troubles. This corroborates with the recent
affirmation of the importance of countries’ debt history by Reinhart and Rogoff (2010).
26
Market variables are also significant for explaining the systemic exposures to global
sovereign credit risk and the signs are largely as expected and consistent with prior studies
assessing the explanatory power of market-based variables for sovereign CDS spreads (Ang
and Longstaff, 2013, Longstaff et al., 2010 and Dieckmann and Plank, 2012). Our results
corroborate strongly with those of Beirne and Fratzscher (2013) as they show that a sharp rise
in the sensitivity of financial markets to economic fundamentals has been the main cause of
rising sovereign yield spreads and sovereign CDS spreads globally.
Interestingly, we find that episodes of credit contagion are negatively related to the systemic
risk exposures to global sovereign credit risk indicating that whilst they significantly increase
underlying global risk levels on average, the risk exposure is actually dampened. This is an
important result as it suggests that systemic risk is not increased by sovereign credit
contagion in international debt markets. As expected, regional credit events have the most
influence on the region’s own systematic risk exposure to global sovereign credit risks
especially within Europe and MENA.
There is a variation in the risk exposures across regions but the Asia-pacific region is by far
the least sensitive to all market and fundamental determinants. Besides being positively
affected by the sovereign credit risks of China and revisions in its own sovereign credit
ratings, there are not other significant influences on the risk exposure of countries in the Asia-
pacific. This indicates that the Asia-pacific region’s systemic risk is purely based on the
region’s average fundamental performance and the economies in these regions are highly
dependent on the continuation of China’s growth story.
[Insert Table 6]
27
In sum, we find that sovereign credit risks at the global level are driven by largely
international market developements but the systemic risk exposure to global sovereign credit
risk is largely driven by a mix of fundamental and market based variables. We conjecture that
the sensitivity to international market conditions in sovereign credit markets is perhaps
related to the fact that there is no standard legal process for dealing with the fallout from
sovereign defaults unlike for corporate bankruptcy and credit defaults. Whilst international
organisations like the International Monetary Fund (IMF) have helped countries to work out
repudiations and debt restructuring in the past, there exists to date, no international
bankruptcy regime for restructuring defaulted sovereign debt. This unique element of
sovereign credit may induce market participants to panic more collectively in times of
sovereign distress as evidenced by the heightened levels of systemic risk and the fragility of
sovereign credit markets in the past few years.
6. Conclusions
In this study, we have examined aggregate sovereign credit risk in the international financial
system at both a regional and global level. We first utilise an event study approach to gauge
the economic impact of extreme jumps in sovereign credit spreads (which we define as
sovereign credit contagion events) first on neighbouring countries’ sovereign credit risk
premia within the same geographical region and second on all other countries in the rest of
the world (including the U.S.). We subsequently study the time-variations in the degree of
systemic sovereign credit risks based on their common sensitivities to a global sovereign
credit risk factor generated from principal component analysis. Finally, to understand the
flow-on effects of sovereign credit contagion onto global systemic sovereign credit risks, we
28
examine the determinants of both the underlying global sovereign credit risk factor itself as
well as the beta loading on the global risk factor (systemic risk exposure).
We find there are immediate intra-regional impacts from sovereign credit events and most
episodes of sovereign credit contagion have concentrated within the period after the Global
Financial Crisis (from 2008-2013). We are able to document that this concentration of
sovereign credit contagion within regions also had immediate global effects outside of the
affected regions and ultimately escalated to heighten global sovereign credit risk levels.
However, in separately analysing the determinants of global sovereign credit risks and
countries’ common exposures to that risk we uncover that systemic sovereign credit risk
exposure is actually not increased by episodes of sovereign credit contagion in international
debt markets. Whilst sovereign credit contagion increases the levels of sovereign credit risk
globally and has adverse spillover effects on other sovereigns’ credit spreads both intra-
regionally and globally, it does not increase the systemic exposure to heightened global risk
meaning that market participants view these sovereign credit deteriorations as largely
regional problems when pricing sovereign credit risks. There are clear implications of our
findings from this research for policymakers in having a better understanding of the nature of
build ups in systemic sovereign credit risks.
Overall, we extend the literature focusing on the international propagation of sovereign credit
shocks and provide new evidence on its transmission mechanism via changes to global
sovereign credit risks and the exposure to that global risk factor over time. We contribute an
improved understanding of the common (global) pricing mechanism for sovereign credit risk
and a new time-varying measure of systemic sovereign credit risk which is a useful metric for
29
monitoring the build-up of aggregate risks in sovereign debt markets over time. Our analysis
is able to pinpoint the credit contagion events that led to rising global sovereign credit risks in
the international financial system in recent years but at the same time highlight that these did
not make international sovereign credit markets systemically more fragile. Moreover, our
systemic risk measure can be used in real-time so that policy makers are aware when shocks
are likely to have the greatest impact and they can time regulatory reforms and bailout
announcements accordingly.
Whilst international banking exposures act as an important channel of contagion, we leave
the investigation of the influence of sovereign debt holdings by the financial sector on
sovereign credit contagion and systemic risks for future research.

30
REFERENCES Adrian, T., Brunnermeier, M.K., 2008. CoVar. Federal Reserve Bank of New York Staff Report 348, September, Federal Reserve Bank, New York. Ang, A., Longstaff, F.A., 2013. Systemic sovereign credit risk: Lessons from the U.S. and Europe. Journal of Monetary Economics, 60, 493-510 . Bae, K-H., Karolyi, A., Stulz, R., 2003. A new approach to measuring financial contagion. Review of Financial Studies 16, 717-763. Bank for International Settlements (BIS) Committee on the Global Financial System, 2011. The impact of sovereign credit risk on bank funding conditions. Bank for International Settlements CGFS Papers No. 43. (Available at: http://www.bis.org/publ/cgfs43.pdf) Beirne, J., Fratzscher, M., 2013. The pricing of sovereign risk and contagion during the European sovereign debt crisis. Journal of International Money and Finance, 34, 60-82. Bekaert, G., Ehrmann, M., Fratzscher, M., Mehl, A., 2013. Global crises and equity market contagion. NBER Working Paper No. 17121. Berger, D., Pukthuanthong, K., 2012. Market fragility and international market crashes. Journal of Financial Economics 105, 565-580. Berndt, A., Obreja, I., 2010. Decomposing European CDS returns. Review of Finance 14, 189-233. Bekaert, G., Hodrick, R.J., Zhang, X., 2009. International stock return comovements. Journal of Finance 64, 2591-2626. Brown, P., Warner, J., 1980. Measuring security price performance. Journal of Financial Economics 8, 205-258. Dieckmann, S., Plank, T., 2012. Default risk of advance economies: an empirical analysis of credit default swaps during the financial crisis. Review of Finance 16, 903-934. Dungey, M., Fry, R., Gonzalez-Hermosillo, B., Martin, V.L., 2006. Contagion in International Bond Markets During the Russian and LTCM Crises. Journal of Financial Stability, 2, 1-27. Fong, T., Wong, A., 2012. Gauging potential sovereign risk contagion in Europe. Economics Letters 115, 496-499. Fong, T., Wong, A., 2011. Analysing interconnectivity among economies. Emerging Markets Review 12, 432-442. Forbes, K.J., Rigobon, R., 2002. No contagion, only interdependence: measuring stock market comovements. Journal of Finance 57, 2223–2261.
31
Gande, A., Parsley, D.C., 2005. News spillovers in the sovereign debt market. Journal of Financial Economics 75, 691-734. Geyer, A., Kossmeier, S., Pichler, S., 2004. Measuring systematic risk in EMU government yield spreads. Review of Finance 8, 171-197. Hilscher, J., Nosbusch, Y., 2010. Determinants of sovereign risk: Macroeconomic fundamentals and the pricing of sovereign debt. Review of Finance 14, 235-262. International Swaps and Derivatives Association (ISDA) (2013), ISDA CDS Marketplace [Online]. New York: ISDA. Available at: http://www.isdacdsmarketplace.com/ Ismailescu, I., Kazemi, H., 2010.The reaction of emerging market credit default swap spreads to sovereign credit rating changes. Journal of Banking and Finance 34(12), December 2010, 2861-2873. Jorion, P., Zhang, G., 2010. Good and bad credit contagion: Evidence from credit default swaps. Journal of Financial Economics 84, 860-881. Kalbaska, A., Gatkowski, M., 2012. Eurozone sovereign contagion: Evidence from the CDS market. Journal of Economic Behaviour and Organization 83, 657-673. Kaminsky, G., Reinhart, G., 2000. On crises, contagion and confusion. Journal of International Economics 51, 145-168. Kaminsky, G., Reinhart, G., Vegh, C., 2003. The unholy trinity of financial contagion. Journal of Economic Perspectives 17, 51-74. Longstaff, F.A., 2010. The subprime credit crisis and contagion in financial markets. Journal of Financial Economics 97, 436-450. Longstaff, F.A., Pan, J., Pedersen, L.H., Singleton, K.J., 2010. How sovereign is sovereign credit risk? American Economic Journal: Macroeconomics 3(2), 75-103. Pan, J., Singleton, K., 2008. Default and recovery implicit in the term structure of sovereign CDS spreads. Journal of Finance 63(5), 2345-2384. Pukthuanthong, K., Roll, R., 2009. Global market integration: An alternative measure and its application. Journal of Financial Economics 94, 214-232. Reinhart, C.M., Rogoff, K.S., 2010. Growth in a time of debt. American Economic Review 100, 573-578. Remolona, E., Scatigna, M., Wu, E., 2008. The dynamic pricing of sovereign risk in emerging markets: Fundamentals and risk aversion. Journal of Fixed Income, 17(4) (Spring), 57-71. Rodriguez-Moreno, M., Peria, J., 2013. Systemic risk measures: The simpler the better? Journal of Banking and Finance 37(6), 1817-1831.
32
Figure 1. Eigenvalues for sovereign CDS spreads 2003-2013
0
0.1
0.2
0.3
0.4
0.5
0.6
0.7
0.8
0.9
1
1 2 3 4 5 6 7 8 9 10 11 12 13 14 15 16 17 18 19 20 21 22
Cum
ulat
ive
%
Eigenvalue
33
Figure 2. Time-Varying Systemic Sovereign Credit Risk Exposures by Regions from 2006-2013 This figure shows the levels of systemic risk in sovereign credit markets for each region over the period from 2006-2013. Systemic sovereign credit risk exposure is measured as the cross-sectional average of individual countries’ estimated beta loadings on the global sovereign risk factor. The beta loadings are estimated from 500 day rolling regression of country credit default swap spread (CDS) changes on the first principal component (PC1) extracted from day t-1 to t-500. They are estimated by out-of-sample principal components based on the covariance matrix in the previous calendar year computed with the returns from 16 major countries comprising Brazil, Venezuela, Mexico, Turkey, Colombia, Philippines, Malaysia, Russia, Thailand, Korea, Panama, Bulgaria, Poland, Qatar, Peru and Croatia. We also place a decaying weighting scheme on previous daily observations such that the weight placed on observation t-x equals 0.995x-1.
-1.5
-1
-0.5
0
0.5
1
1.5
2
2.5
3
3.5
2/01/2006 2/01/2007 2/01/2008 2/01/2009 2/01/2010 2/01/2011 2/01/2012 2/01/2013
Time Varying Systemic Risk by Regions
North America Latin America Europe Eastern Europe MENA Asia Pacific
34
Table 1. Distribution of sovereign CDS spreads Panel A of this table presents the summary statistics on daily sovereign CDS spreads (in basis points) by region over the entire sample period from 2002 to 2013. Panel B presents the summary statistics on daily changes in sovereign CDS spreads (in basis points) by region over the full sample period. N x T represents the total number of daily observations available across regions.
Region N x T Mean Median StDev Max Min95% 99% 99.90%
Panel A: CDS spreadsLatin America 34600 395 181 735 10350 0 1193 3540 10350Europe 47697 110 14 471 21681 0 440 1109 8052Eastern Europe 35478 172 102 260 5479 3 531 983 3361MENA 22572 198 153 170 1254 8 513 807 1148Asia-Pacific 31458 153 79 258 3334 1 559 935 3014Panel B: CDS spread changesLatin America 34236 0.0811 0.0000 39.05 1865.21 -4162.33 18.35 62.22 271.88Europe 47318 0.5570 0.0000 61.03 8439.10 -3950 5.69 23.37 44.65Eastern Europe 38348 0.0046 0.0000 14.86 1410.07 -707.10 9.37 28.03 106.15MENA 22494 -0.0307 0.0000 8.57 257.29 -136.59 7.61 22.62 77.09Asia-Pacific 31643 -0.0026 0.0000 16.60 834.88 -1005.52 6.55 21.31 114.15
Quantiles
35
Table 2. Summary statistics on all sovereign credit events 2002-2013 This table provides a break-down of the total number of sovereign credit events (extreme CDS jumps) detected by year and the number of regions from which these events arose as well as the countries where they emanate over the sample period from 2002-2013. Summary statistics on the average size, standard deviation and the range of the extreme jumps in sovereign CDS spreads defining the sovereign credit events are also shown for each year.
Year N(events) N(regions) SovereignsMean Median StDev Max Min
2002 11 3 Brazil, Uruguay, Venezuela, Turkey, Indonesia 416.47 333.33 290.69 968.66 116.342003 4 3 Argentina, Uruguay, Turkey,Indonesia 515.12 357.63 507.70 1215.50 129.712004 0 02005 1 1 Ecuador 286.452006 2 2 Ecuador, Lebanon 220.13 220.13 192.76 356.44 83.832007 0 02008 23 6 Argentina, Ecuador, Uruguay, Iceland, Ireland, 249.04 160.72 205.36 834.88 48.01
Russia, Ukraine, Lebanon, Turkey, EgyptIndonesia, Pakistan
2009 14 4 Iceland, Ireland, Ukraine, Bahrain,Pakistan 169.42 170.13 78.80 350.10 49.582010 9 1 Ireland, Greece 68.25 65.78 25.94 132.23 47.562011 8 1 Greece, Italy, Portugal 93.64 80.93 38.45 159.57 60.192012 12 3 Argentina, Cyprus, Malta, Portugal, Pakistan 167.18 103.43 167.19 554.13 49.632013 5 2 Argentina, Cyprus 334.33 137.30 443.03 1109.49 51.79
2002-2013 89 5 N(Sovereigns suffering credit event) = 20 / 66 228.36 145.44 238.53 1215.50 43.45
CDS Spread Jump (bps)
36
Table 3. Regional and Global reactions to sovereign credit events This table presents the average reaction of regional (Panel A) and global (Panel B) portfolio credit spreads to each sovereign credit event in basis points on individual days around the event date and over different event windows around the event. In Panel A for each event, the regional portfolio is an equally weighted portfolio of sovereign CDS spreads of all the non-event countries in the same region as the credit event country. In Panel B for each event, the global portfolio is an equally weighted portfolio of sovereign CDS spreads of all the non-event countries in the sample plus the U.S.
Event Window Mean spread change t-stat Mean spread change t-stat Mean spread change t-stat
Panel A: Regional Response-2 -6.87 -1.22 -6.79 -2.34 ** -10.59 -2.70 ***-1 6.74 1.20 7.43 2.56 *** 6.48 1.650 13.38 2.37 *** 16.90 5.82 *** 10.82 2.76 ***1 4.27 0.76 3.70 1.28 1.27 0.322 1.17 0.21 0.84 0.29 0.82 0.21
[-2, 0] 13.25 1.36 17.55 3.49 *** 6.71 0.99[-1, 0] 20.12 2.52 *** 24.33 5.92 *** 17.30 3.12 ***[0, 1] 17.65 1.57 20.60 3.55 *** 12.08 1.54[0, 2] 18.82 1.11 21.45 2.46 *** 12.90 1.10[-2,2] 18.69 1.48 22.09 3.40 *** 8.79 1.00[-1,1] 24.39 2.50 *** 28.03 5.57 *** 18.56 2.74 ***
Panel B: Global Response-2 0.32 0.22 -1.66 -1.20 -1.16 -0.70-1 0.30 0.21 1.85 1.34 1.15 0.690 6.10 4.19 *** 8.52 6.17 *** 3.08 1.85 *1 2.17 1.49 2.63 1.90 * 0.59 0.352 -1.75 -1.20 -1.62 -1.17 -1.98 -1.20
[-2, 0] 6.72 2.67 *** 8.71 3.64 *** 3.06 1.07[-1, 0] 6.40 3.11 *** 10.37 5.30 *** 4.22 1.80 *[0, 1] 8.27 2.84 *** 11.15 4.03 *** 3.66 1.10[0, 2] 6.52 1.49 9.53 2.30 ** 1.68 0.34[-2,2] 7.14 2.20 ** 9.72 3.15 *** 1.67 0.45[-1,1] 8.57 3.40 *** 13.00 5.43 *** 4.81 1.67
2002-2013 2007-2013 2009-2013
37
Table 4. Summary on systemic sovereign credit risk exposures across regions This table reports summary statistics for the levels of systemic risk (SysRiskt) in sovereign credit markets across ALL countries and within each region over the period from 2006-2013. Systemic sovereign credit risk is measured as the cross-sectional average of the estimated beta loadings on the global sovereign risk factor which is estimated from the 500 day rolling regression of country credit default swap spread changes on the first principal component (PC1) from day t-1 to t-500. They are estimated by out-of-sample principal components based on the covariance matrix in the previous calendar year computed with the returns from 16 major countries comprising Brazil, Venezuela, Mexico, Turkey, Colombia, Philippines, Malaysia, Russia, Thailand, Korea, Panama, Bulgaria, Poland, Qatar, Peru and Croatia. We also place a decaying weighting scheme on previous daily observations such that the weight placed on observation t-x equals 0.995x-1. Nobs represents the number of observations. The statistics described below includes the mean, standard deviations, the minimum and maximum value, median, number of observations, the 95th percentile and 99th percentile.
Mean Std. Dev. Min. Med. Max. N p 95 p 99ALL 0.65 3.70 -763.88 0.55 360.67 1803 2.97 8.57Latin America 0.66 8.92 -763.88 1.28 360.67 1803 4.08 8.90Europe 0.56 1.07 -32.74 0.06 37.32 1822 2.68 3.63Eastern Europe 0.87 1.69 -117.95 0.59 62.83 2235 2.49 6.50MENA 0.83 3.37 -63.28 0.42 82.72 2164 4.32 12.24Asia Pacific 0.42 4.91 -374.48 0.59 279.49 2148 1.94 15.96North America 0.08 0.10 -0.07 0.05 0.44 2375 0.31 0.42
38
Table 5. Determinants of global sovereign credit risk over 2006-2013 This table reports the estimated coefficients and other summary statistics from the regression of the global sovereign credit risk factor (PC1) on the indicated variables. In Columns 1 and 3-5, Stock market return denotes the return on the S&P500 stock market index and in column 2 it is the DAX stock market index return. In column 1 and 3-5, Implied_Vol denotes the daily change in the VIX volatility index and in column 2 it is the daily change in the VDAX volatility index. In column 1 and 3-5, Itrx_Corporate denotes the daily change in the CDX IG index and in column 2 it is the daily change in the ITraxx index for Europe. China denotes the daily changes in the sovereign CDS spreads for China. Sov_Rating_Chg are the changes in sovereign credit rating assessments made by Standard and Poors, Moodys and Fitch averaged across all countries (and this is also constructed by regions – LA=Latin America, EU=Europe, EEU=Eastern Europe, MENA=Middle East and North Africa, AP=Asia-Pacific). Debt_GDP is the average ratio of each country’s general government gross debt to Gross Domestic Product (and this is also constructed by regions). ALL_Creditevent is an indicator variable that is equal to one when there is a credit contagion event within any sample country (and this is also constructed by region). Adj. R-sq are the adjusted R-squared values for the time series regressions. Nobs denotes the number of days used in the regressions. P-values are reported in parentheses (*, **, *** denote significance at the 10, 5 and 1% respectively).
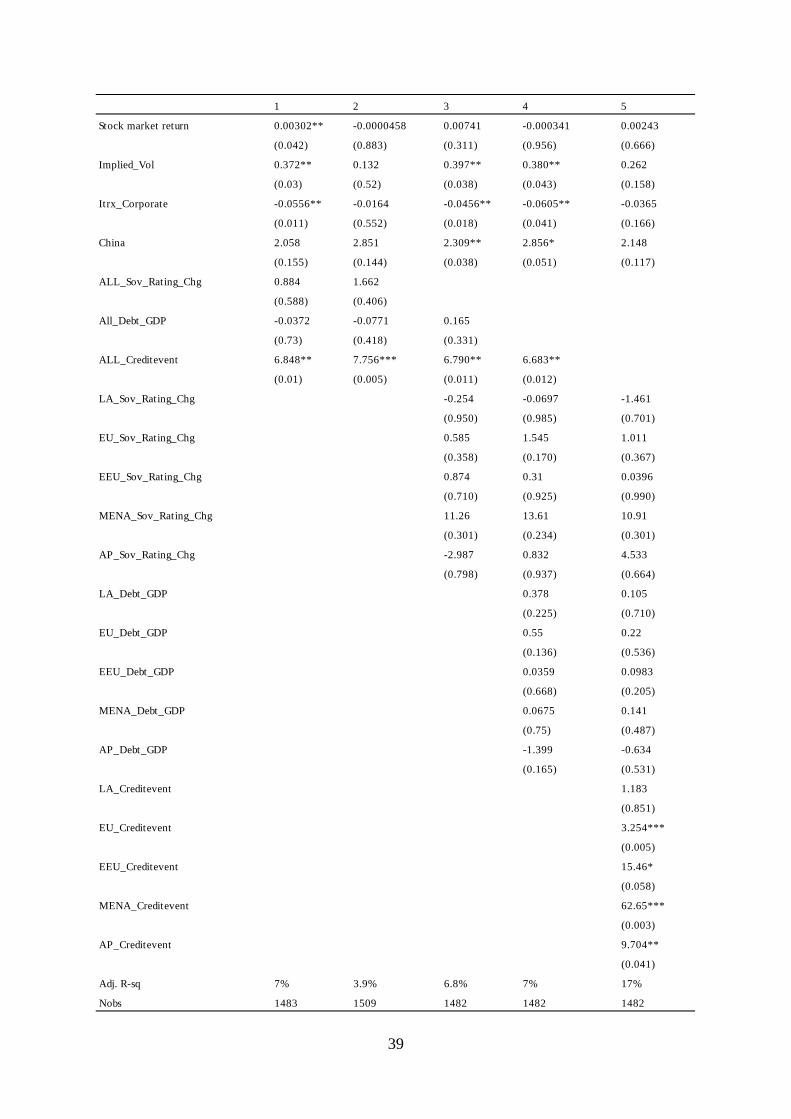
39
1 2 3 4 5
Stock market return 0.00302** -0.0000458 0.00741 -0.000341 0.00243
(0.042) (0.883) (0.311) (0.956) (0.666)
Implied_Vol 0.372** 0.132 0.397** 0.380** 0.262
(0.03) (0.52) (0.038) (0.043) (0.158)
Itrx_Corporate -0.0556** -0.0164 -0.0456** -0.0605** -0.0365
(0.011) (0.552) (0.018) (0.041) (0.166)
China 2.058 2.851 2.309** 2.856* 2.148
(0.155) (0.144) (0.038) (0.051) (0.117)
ALL_Sov_Rating_Chg 0.884 1.662
(0.588) (0.406)
All_Debt_GDP -0.0372 -0.0771 0.165
(0.73) (0.418) (0.331)
ALL_Creditevent 6.848** 7.756*** 6.790** 6.683**
(0.01) (0.005) (0.011) (0.012)
LA_Sov_Rating_Chg -0.254 -0.0697 -1.461
(0.950) (0.985) (0.701)
EU_Sov_Rating_Chg 0.585 1.545 1.011
(0.358) (0.170) (0.367)
EEU_Sov_Rating_Chg 0.874 0.31 0.0396
(0.710) (0.925) (0.990)
MENA_Sov_Rating_Chg 11.26 13.61 10.91
(0.301) (0.234) (0.301)
AP_Sov_Rating_Chg -2.987 0.832 4.533
(0.798) (0.937) (0.664)
LA_Debt_GDP 0.378 0.105
(0.225) (0.710)
EU_Debt_GDP 0.55 0.22
(0.136) (0.536)
EEU_Debt_GDP 0.0359 0.0983
(0.668) (0.205)
MENA_Debt_GDP 0.0675 0.141
(0.75) (0.487)
AP_Debt_GDP -1.399 -0.634
(0.165) (0.531)
LA_Creditevent 1.183
(0.851)
EU_Creditevent 3.254***
(0.005)
EEU_Creditevent 15.46*
(0.058)
MENA_Creditevent 62.65***
(0.003)
AP_Creditevent 9.704**
(0.041)
Adj. R-sq 7% 3.9% 6.8% 7% 17%
Nobs 1483 1509 1482 1482 1482

40
Table 6. Determinants of systemic sovereign credit risk exposures over 2006-2013 This table reports the estimated coefficients and other summary statistics from the regression of daily systemic risk measures (cross-sectionally averaged beta loadings, SysRiskt) on the indicated variables. Stock market return denotes the return on the S&P500 stock market index for ALL countries, Latin America, MENA (Middle East and North Africa) and the Asia-Pacific region and the DAX stock market index return for Europe and Eastern Europe. Implied_Vol denotes the daily change in the VIX volatility index for ALL countries, Latin America, MENA and the Asia-Pacific regions and the daily change in the VDAX volatility index for Europe and Eastern Europe. Itrx_Corporate denotes the daily change in the CDX IG index for ALL countries, Latin America, MENA and the Asia-Pacific region, and the daily change in the ITraxx index for Europe and Eastern Europe respectively. China denotes the daily changes in the sovereign CDS spreads for China. Sov_Rating_Chg are the changes in the regional average sovereign credit rating assessments made by Standard and Poors, Moodys and Fitch. Debt_GDP is the average ratio of each country’s general government gross debt to Gross Domestic Product. Reg_Creditevent (Other_Reg_Creditevent) is an indicator variable that is equal to one when there is a credit contagion event within (outside of) the respective region. Adj. R-sq are the adjusted R-squared values for the time series regressions. Nobs denotes the number of days used in the regional regressions. P-values are reported in parentheses (*, **, *** denote significance at the 10, 5 and 1% respectively).
ALL Latin America Europe Eastern Europe MENA Asia-PacificStock market return 0.00602** -0.00289*** -0.000525** 0.000244*** -0.00298*** 0.00127
(0.024) (0.000) (0.029) (0.000) (0.000) (0.593)Implied_Vol 0.0598* -0.0501*** 0.312** 0.0102** 0.0350*** 0.0178
(0.095) (0.000) (0.041) (0.013) (0.000) (0.343)Itrx_Corporate 0.0175** -0.00125 -0.0669** 0.00604*** -0.0178*** 0.00722
(0.018) (0.721) (0.030) (0.000) (0.000) (0.112)China -0.649 0.478*** -5.481*** -1.042*** -0.502*** 2.710*
(0.253) (0.000) (0.008) (0.000) (0.005) (0.085)Sov_Rating_Chg -5.971** 1.114*** -7.428*** -1.961*** 24.56 -4.238**
(0.011) (0.000) (0.007) (0.000) (0.527) (0.038)Debt_GDP 0.138** 0.124*** 0.122** -0.00953 -0.00376 -0.0375
(0.047) (0.000) (0.014) (0.478) (0.839) (0.673)Reg_Creditevent -1.465** 0.208 -7.162** 0.0811 -0.807** 0.0241
(0.016) (0.754) (0.028) (0.807) (0.016) (0.969)Other_Reg_Creditevent -0.385 -4.664** -0.0923 -0.216 0.0173
(0.600) (0.029) (0.452) (0.444) (0.936)
Adj. R-sq 1.2% 3.2% 1.2% 19.1% 2.9% 0.2%Nobs 2151 2100 2125 2147 2130 2133
41
APPENDIX
Appendix Table A Constituents of Regional Groups
Latin America Europe Eastern Europe MENA Asia Pacific North AmericaArgentina Austria Bulgaria Algeria Australia United StatesBrazil Belgium Croatia Bahrain ChinaChile Cyprus Czech Republic Egypt HongKongColombia Denmark Estonia Israel IndonesiaCosta Rica Finland Hungary Lebanon JapanEcuador France Kazakhstan Morocco KoreaEl Salvador Germany Latvia Qatar MalaysiaGuatemala Greece Lithuania Turkey PakistanMexico Iceland Poland Tunisia PhilippinesPanama Ireland Romania SingaporePeru Italy Russia ThailandUruguay Malta Slovakia VietnamVenezuela Netherlands Slovenia
Norway UkrainePortugalSpainSwedenUnited Kingdom
13 18 14 9 12 1 67