Embed Size (px)
Citation preview
Intra-Industry Trade in a Rapidly Globalizing
Industry: The Case of Wine
Kym Anderson, Joseph Francois, Douglas Nelson and Glyn Wittwer
March 2016
© Kym Anderson, Joseph Francois, Douglas Nelson and Glyn Wittwer
Wine Economics Research Centre
Working Papers
Working Paper No. 0316 ISSN 1837-9397
www.adelaide.edu.au/wine-econ

WINE ECONOMICS RESEARCH CENTRE The Wine Economics Research Centre was established in 2010 by the School of Economics and the Wine 2030 Research Network of the University of Adelaide, having been previously a program in the University's Centre for International Economic Studies. The Centre’s purpose is to promote and foster its growing research strength in the area of wine economics research, and to complement the University's long-established strength in viticulture and oenology. The key objectives for the Wine Economics Research Centre are to:
• publish wine economics research outputs and disseminate them to academia, industry and government
• contribute to economics journals, wine industry journals and related publications • promote collaboration and sharing of information, statistics and analyses between industry,
government agencies and research institutions • sponsor wine economics seminars, workshops and conferences and contribute to other
grape and wine events
Contact details: Wine Economics Research Centre School of Economics University of Adelaide SA 5005 AUSTRALIA Email: [email protected] Centre publications can be downloaded at: 30Twww.adelaide.edu.au/wine-econ/30 T
The University of Adelaide
Intra-Industry Trade in a Rapidly Globalizing Industry:
The Case of WineP0F
1
Kym Anderson
Wine Economics Research Centre, University of Adelaide
Joseph Francois
World Trade Institute, University of Bern
Douglas NelsonP1F
2
Murphy Institute, Tulane University
Glyn Wittwer Centre of Policy Studies,
Victoria University
March 2016
Abstract: This paper overviews the current structure and dynamics of international trade in wine with an emphasis on its intra-industry features. Using network analytic methods, we illustrate developments in the world’s wine markets since the mid-1960s around a relatively stable core of countries. Those developments include both evolving demands for wine and, on the supply side, a rapidly emerging group of countries entering the core without displacing the original members. Not surprisingly, given that the analysis is based on bilateral trade in a single product, the developing patterns of intra-industry trade are quite consistent with the patterns revealed in the network analysis.
JEL classifications: F1, L7
Key words: International intra-industry trade, wine trade, network methods
1 We dedicate this paper to David Greenaway: scholar of intra-industry trade, lover of wine. Forthcoming in the Review of International Economics Vol. 24, 2016. 2 Corresponding author: Murphy Institute, Tulane University, New Orleans, LA 70118, USA. [email protected].
1
Intra-Industry Trade in a Rapidly Globalizing Industry:
The Case of Wine
1. Introduction
Wine is one of the oldest products to be traded over long distances (Johnson, 1989,
Lukacs, 2012, Pellechia, 2006, Simpson, 2011, Unwin, 1991). Indeed, there is
evidence of Bronze Age trade not only in wine but also in the paraphernalia needed to
store, process, and drink wine (Piggott, 1959). At the same time, wine is an
archetypal differentiated product. In addition to red, white, rosé, various fortifieds and
sparkling, there is differentiation by grape variety, terroir, technology, and, of course,
by quality. While the data do not exist to tap these dimensions of differentiation over
a significant time period, it would be surprising if there were not extensive trade
between wine-producing countries. As with Staffan Linder’s (1961) classic account of
intra-industry trade, which provided inspiration for theoretical work rooted in
monopolistic competition models (Helpman and Krugman, 1985) and systematic
empirical work on intra-industry trade (Grubel and Lloyd, 1975, Greenaway and
Milner, 1986), we expect wine varieties to reflect local preferences and production
conditions. As consumers in other countries develop more-sophisticated palates, we
expect to see the development of a preference for variety in wine which, in turn,
produces intra-industry trade. With newer wine-producing countries, we might
expect to observe the development of this pattern directly in the data. Thus, in this
paper, we use some basic network topological measures, along with standard intra-
industry trade measures, to characterize the evolution of trade in wine—the “world
wine web”.
The viability of this study is underwritten to some extent by the dramatic growth
in wine trade in the post-War period on both the intensive and extensive margins. We
are able to take advantage of data collection efforts that provide relatively long series
of data on trade, production and consumption (e.g., Anderson and Nelgen, 2011). In
this paper we characterize and explore a number of facts about the growth of the
global wine industry, leaving theoretical development for later work. We begin with
2
a narrative of recent developments in the world’s wine markets. In subsequent
sections we apply basic network measures to characterize the structure and dynamics
of the product’s international trade before providing a more-detailed analysis of intra-
industry trade in wine. Finally, we conclude with some projection analysis of future
trends in global wine trade.
2. Recent trends in the world’s wine markets
The past two decades have seen globalization of the world's wine markets proceed
like never before, in both speed and breadth. There was a degree of trade expansion in
the five decades to World War I, but that was mostly in response to the outbreak of
Phylloxera that destroyed the majority of vines in Europe and saw French wineries
invest in huge plantings in North Africa (Meloni and Swinnen, 2014). Until the late
20P
thP century, interactions between continents involved little more than the exporting
of vine cuttings and of traditional production expertise. Indeed prior to 1990, most
wine was consumed in the country of production (if one considers the French-owned
vineyards in nearby French colonies of North Africa as part of France),P2F
3P and those
countries were mostly on or near the Mediterranean Sea.
The fall in transport and communication costs since the 1980s is largely
responsible for the recent globalization of the industry. On the demand side, as
incomes grew and access to television and the internet spread, so tastes broadened and
an ever-greater variety of products has been sought by consumers, including for
beverages.
On the supply side, the fall in travel and communication costs has made it
more affordable for producers to consider exporting, for flying viticulturalists and
winemakers to spread new technologies rapidly, and for some large wineries to also
engage in cross-border mergers or acquisitions. Falling international trade costs plus
de-regulation of liquor retailing from the 1980s also allowed large supermarket chains
3 If Algeria etc. are treated as separate countries, then France switched from being a net exporter of wine up to 1880 to being a net importer for the next 100 years, with a considerable degree of intra-industry trade during that period (Anderson and Pinilla 2016), importing low-quality wine from North Africa and to a lesser extent southern European countries, and exporting mainly high-quality wines from Champagne, Bordeaux and Burgundy.
3
to become the major buyers not only of branded bottled or bag-in-box wines but also
of bulk wine for building their own house brands.
Retailing through such chain stores requires large quantities of homogenous
wine year after year to justify national advertising campaigns. Producers in the New
World were more adept at initially responding to that new demand, creating a huge
new category of robust, fruity ‘commercial premium’ wines that fall between
expensive fine wines and cheap non-premium (or ‘table’) wines.
The share of global wine production exported, which had always been below
15 percent and mostly Mediterranean or intra-European, grew dramatically from the
late 1980s. By 2012 it exceeded 40 per cent. The New World was the main
contributor, with its share of global wine exports rising from 3 per cent in the late
1980s to 25 percent (if sparkling wine is excluded) by 2004 (Anderson et al., 2003).
Recognizing their relatively poor performance, Europe's wine producers
during the past decade have been adapting their practices to compete. The three
leading European wine-exporting countries as a group now export almost half their
production, up from just one-fifth a generation ago.
Simultaneously, New World producers are seeking to expand their exports of
more-expensive wines to complement their lower-end products. The next phase of
wine's globalization therefore may involve a convergence whereby both groups
produce terroir-driven super-premium wines alongside more-affordable ‘commercial
premium’ branded wines. Meanwhile, cheap basic non-premium wines are continuing
their demise in both Europe and the New World.
Technological developments are rapidly altering the means of exporting
commercial premium wines. In the past decade or so the share of wine that is
exported from the New World in bulk shipping containers has risen from less than 15
to more than 40 percent (and to 57 percent for Australia by 2014). Bottling in the
country of destination is sometimes cheaper, and it lowers the cost and carbon
footprint of shipping. By shipping in 24,000-litre bladders to fit 20-foot containers,
this new shipping technology offers greater opportunities for buyers to blend wines
from any region of the world as relative prices alter – and to meet changing retail
demands in the destination country more rapidly.
Greater openness to trade means winemakers and hence grape growers are far
more exposed now than pre-1990 to exchange rate volatility, and also to greater
import competition in their domestic market as consumers are better able to choose
4
from an ever-broader range of wines (Anderson and Wittwer, 2013). The share of
imports in domestic consumption in Australia, for example, rose from an average of 3
percent in 2000-04 to 15 percent by 2013 in volume terms, and around 20 percent in
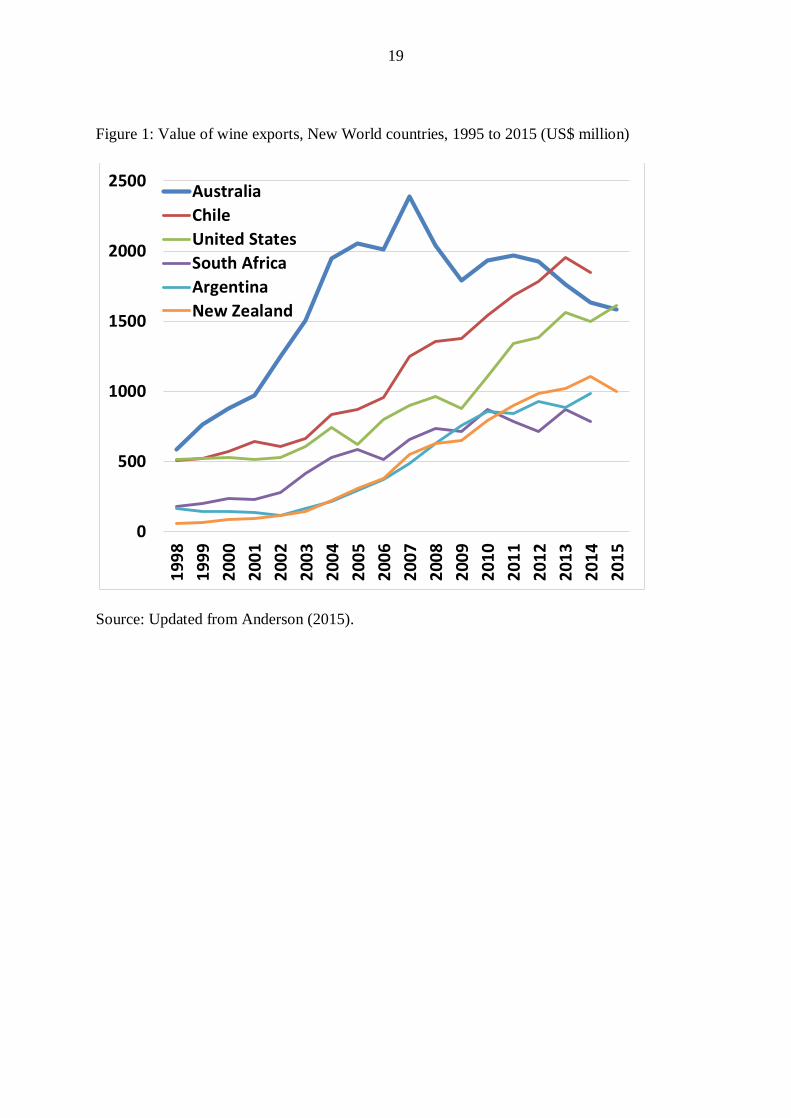
value terms (Anderson and Aryal, 2015). Wide fluctuations in exchange rates since
the global financial crisis began in 2008 have substantially altered national rankings
of New World wine-exporting countries (Figure 1).
--Figure 1 about here--
Increased openness and international travel have also altered tastes and
preferences not only on both sides of the North Atlantic but also in Asia. Nowhere has
this been more obvious in the case of wine than in China. Chinese wine imports grew
more than 50 percent per year during 2006-12. With the number of middle class in
China currently around 250 million and growing at around 10 million per year, and
with grape wine accounting for less than 5 percent of alcohol consumption, further
large increases in wine consumption are expected. How much of that Chinese demand
will be supplied by domestic producers is difficult to guess. While import growth is
likely to continue for the foreseeable future (Anderson and Wittwer, 2015), some
exports also might begin to emerge from China in the future if there turns out to be a
miss-match between the qualities of the wines produced and demanded domestically.
3. Structure of the world wine web
In this section, we apply tools of network analysis to data on global wine trade. We
focus specifically on two interesting facts about the structure of the global wine
economy: the overall growth in the breadth and depth of those markets, and the
stability of the core of that economy.
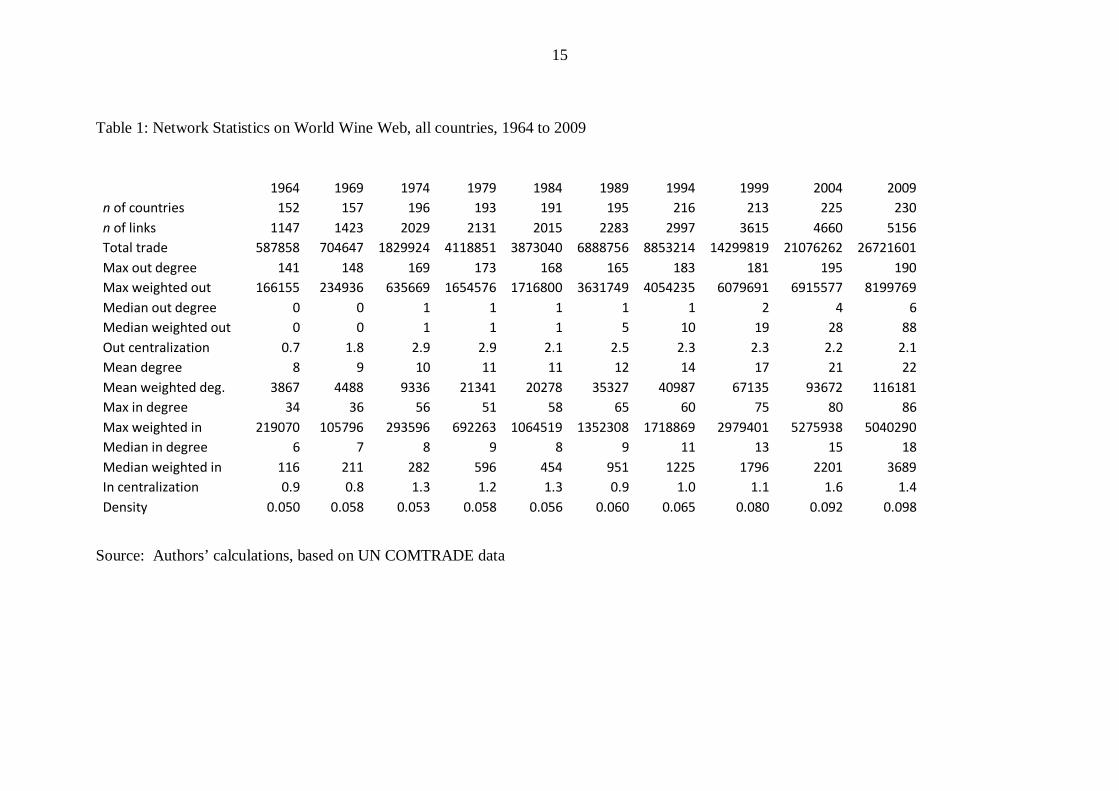
Table 1 shows the evolution of total trade from 1964 through 2009. It is clear
that the global wine economy expanded dramatically over this period. Even though
the number of wine-trading countries increased by 50 percent (much of this being new
countries, formed in a variety of ways, but some being new importing or exporting
countries), the number of links between countries increased by 450 percent and the
volume of trade increased more than 45 fold! This suggests that not only are more
countries involved in importing and/or exporting wine, but these countries are trading
5
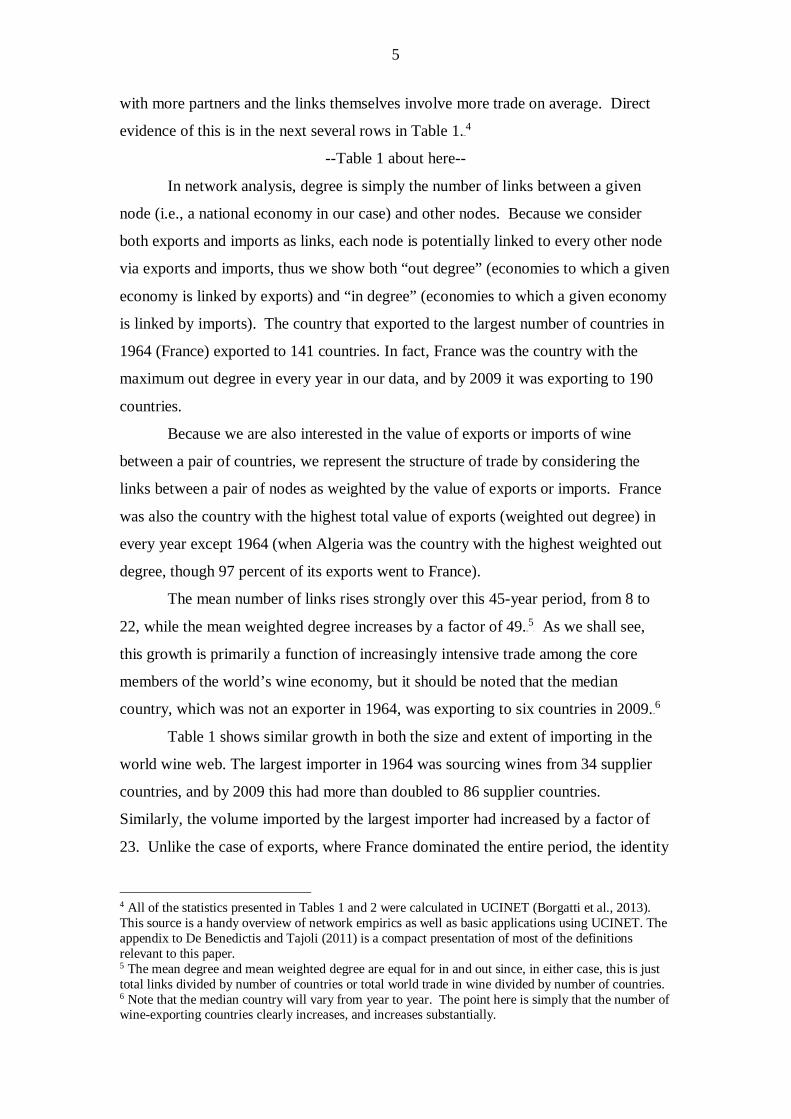
with more partners and the links themselves involve more trade on average. Direct
evidence of this is in the next several rows in Table 1.P3F
4
--Table 1 about here--
In network analysis, degree is simply the number of links between a given
node (i.e., a national economy in our case) and other nodes. Because we consider
both exports and imports as links, each node is potentially linked to every other node
via exports and imports, thus we show both “out degree” (economies to which a given
economy is linked by exports) and “in degree” (economies to which a given economy
is linked by imports). The country that exported to the largest number of countries in
1964 (France) exported to 141 countries. In fact, France was the country with the
maximum out degree in every year in our data, and by 2009 it was exporting to 190
countries.
Because we are also interested in the value of exports or imports of wine
between a pair of countries, we represent the structure of trade by considering the
links between a pair of nodes as weighted by the value of exports or imports. France
was also the country with the highest total value of exports (weighted out degree) in
every year except 1964 (when Algeria was the country with the highest weighted out
degree, though 97 percent of its exports went to France).
The mean number of links rises strongly over this 45-year period, from 8 to
22, while the mean weighted degree increases by a factor of 49.P4F
5P As we shall see,
this growth is primarily a function of increasingly intensive trade among the core
members of the world’s wine economy, but it should be noted that the median
country, which was not an exporter in 1964, was exporting to six countries in 2009.P5F
6
Table 1 shows similar growth in both the size and extent of importing in the
world wine web. The largest importer in 1964 was sourcing wines from 34 supplier
countries, and by 2009 this had more than doubled to 86 supplier countries.
Similarly, the volume imported by the largest importer had increased by a factor of
23. Unlike the case of exports, where France dominated the entire period, the identity
4 All of the statistics presented in Tables 1 and 2 were calculated in UCINET (Borgatti et al., 2013). This source is a handy overview of network empirics as well as basic applications using UCINET. The appendix to De Benedictis and Tajoli (2011) is a compact presentation of most of the definitions relevant to this paper. 5 The mean degree and mean weighted degree are equal for in and out since, in either case, this is just total links divided by number of countries or total world trade in wine divided by number of countries. 6 Note that the median country will vary from year to year. The point here is simply that the number of wine-exporting countries clearly increases, and increases substantially.
6
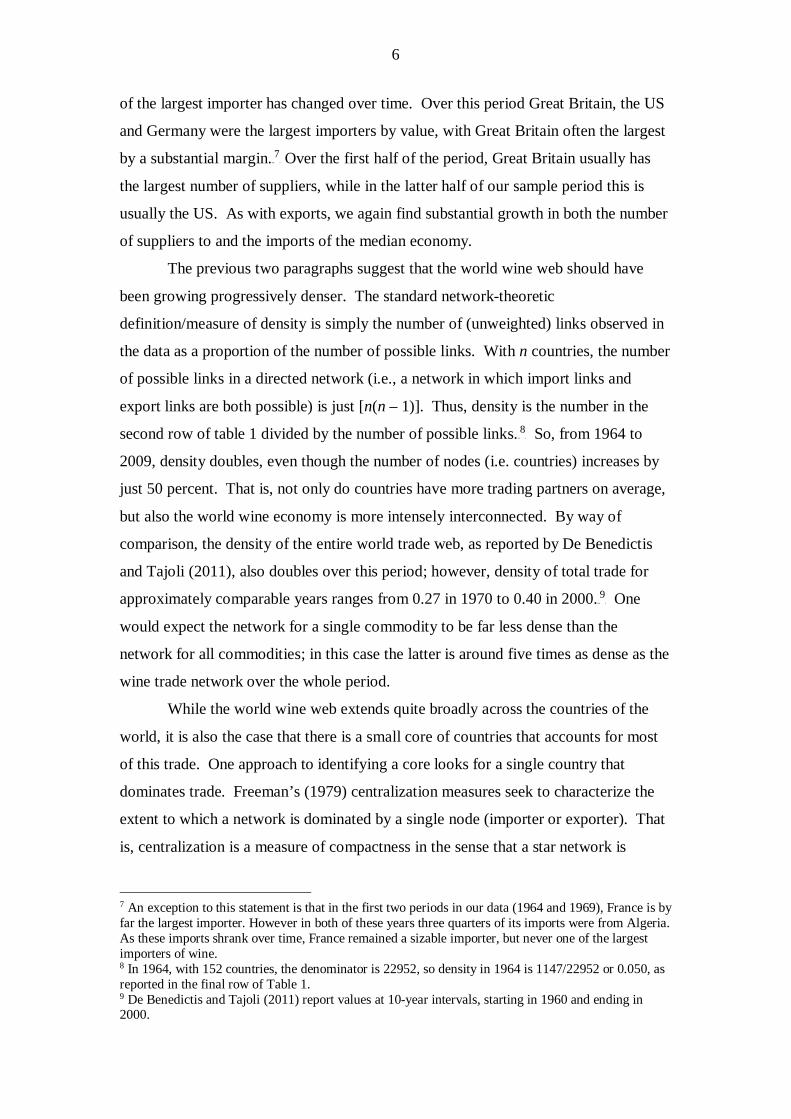
of the largest importer has changed over time. Over this period Great Britain, the US
and Germany were the largest importers by value, with Great Britain often the largest
by a substantial margin.P6F
7P Over the first half of the period, Great Britain usually has
the largest number of suppliers, while in the latter half of our sample period this is
usually the US. As with exports, we again find substantial growth in both the number
of suppliers to and the imports of the median economy.
The previous two paragraphs suggest that the world wine web should have
been growing progressively denser. The standard network-theoretic
definition/measure of density is simply the number of (unweighted) links observed in
the data as a proportion of the number of possible links. With n countries, the number
of possible links in a directed network (i.e., a network in which import links and
export links are both possible) is just [n(n – 1)]. Thus, density is the number in the
second row of table 1 divided by the number of possible links.P7F
8P So, from 1964 to
2009, density doubles, even though the number of nodes (i.e. countries) increases by
just 50 percent. That is, not only do countries have more trading partners on average,
but also the world wine economy is more intensely interconnected. By way of
comparison, the density of the entire world trade web, as reported by De Benedictis
and Tajoli (2011), also doubles over this period; however, density of total trade for
approximately comparable years ranges from 0.27 in 1970 to 0.40 in 2000.P8F
9P One
would expect the network for a single commodity to be far less dense than the
network for all commodities; in this case the latter is around five times as dense as the
wine trade network over the whole period.
While the world wine web extends quite broadly across the countries of the
world, it is also the case that there is a small core of countries that accounts for most
of this trade. One approach to identifying a core looks for a single country that
dominates trade. Freeman’s (1979) centralization measures seek to characterize the
extent to which a network is dominated by a single node (importer or exporter). That
is, centralization is a measure of compactness in the sense that a star network is
7 An exception to this statement is that in the first two periods in our data (1964 and 1969), France is by far the largest importer. However in both of these years three quarters of its imports were from Algeria. As these imports shrank over time, France remained a sizable importer, but never one of the largest importers of wine. 8 In 1964, with 152 countries, the denominator is 22952, so density in 1964 is 1147/22952 or 0.050, as reported in the final row of Table 1. 9 De Benedictis and Tajoli (2011) report values at 10-year intervals, starting in 1960 and ending in 2000.
7
maximally centralized (in a star network, every node except the center has degree one,
while the center has degree n - 1). The centralization measures the extent to which
the world wine web deviates from the star network. Thus, UCINET calculates the sum
of the differences between the degree of the most central node and all other nodes, as
a fraction of the maximum possible sum of differences in a network with n nodes.
While the world wine web extends quite broadly across the countries of the world, it
is also the case that there is a small core of countries that accounts for most of this
trade. On the one hand, unsurprisingly given what we have just seen in Table 1, the
level of concentration is quite low. However, we observe an interesting pattern of
increasing concentration up to around 1979 and then a decline, which is especially
pronounced for exports. This reflects the dominance early in our data period of
traditional exporters (especially France), and then the rise of new exporters.
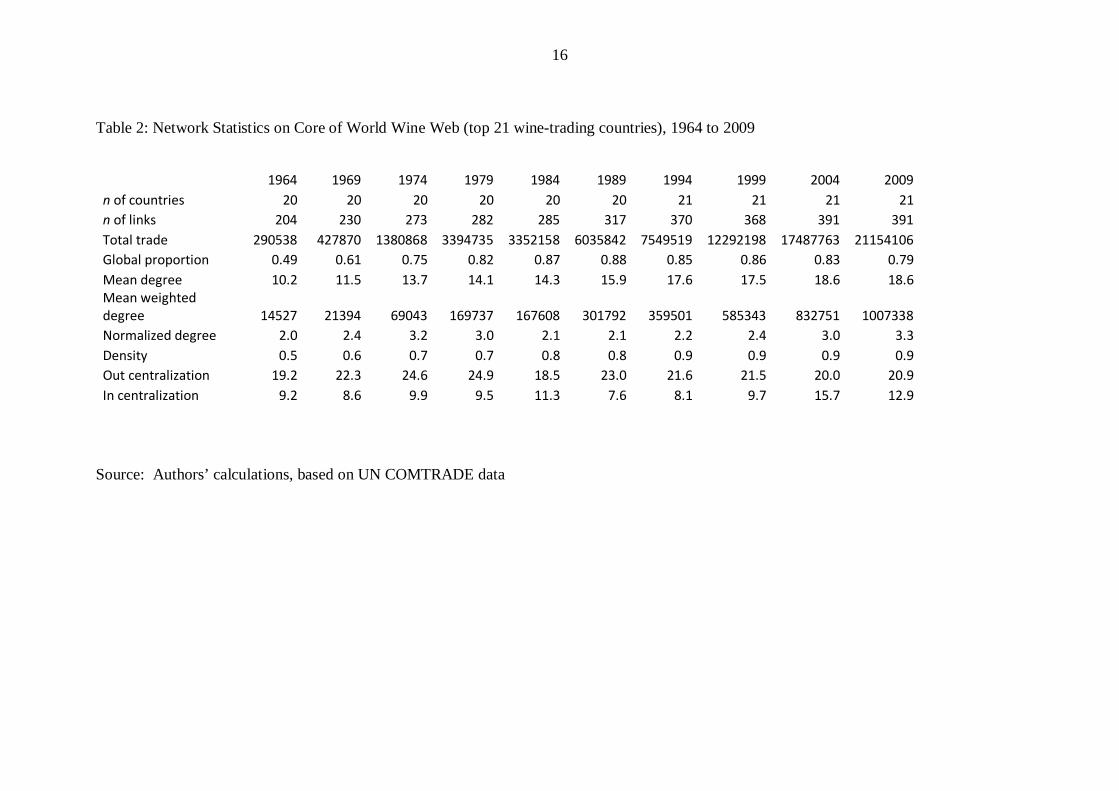
The low centralization reflects the existence of a number of sizable exporters
and importers. Thus, we might be interested in the importance of a core set of
countries. We can construct the core in a rough-and-ready way by considering the top
dozen wine producers, exporters and importers in 2009.P9F
10P Table 2 shows data
illustrating the evolution of this core from 1964. The first thing to notice is that trade
within this core rises from about half of world trade to nearly 90 percent before falling
back to 80 percent.P10F
11P As with the world wine web as a whole, the density of trade in
the core nearly doubles over the period covered by our data. However, trade in the
core is ten times as dense as in the global wine economy as a whole. Centralization of
this core is on the order of 10 to 20 times greater than that of the world economy as a
whole, but still shows the same pattern of rising, then declining centralization.
--Table 2 about here—
10 The top 12 producers in 2009 were: Italy, France, Spain, the US, Argentina, Chile, China, Australia, South Africa, Germany and Portugal. The top 12 exporters were: France, Italy, Spain, Australia, Chile, Germany the USA, Portugal, South Africa, New Zealand, Argentina, and Great Britain. The top 12 importers were: Great Britain, the US, Germany, Canada, Belgium-Luxembourg, Netherlands, Japan, Switzerland, Sweden, Denmark, France, and Russia. The union of these three lists gives a 21-country core as of 2009: France, Italy, Spain, the USA, Argentina, Australia, South Africa, Germany, Chile, China, Portugal, Great Britain, Canada, Belgium-Luxembourg, Netherlands, Japan, Switzerland, Sweden, Denmark, Russia, and New Zealand. It should be noted that Russia does not enter our data until 1994, and that for consistency we work with Russia combined with other former Soviet republics. 11 The 12 top exporters as of 2009 account for well over 90 percent of world trade in wine in every year in our sample, even though a number of these countries exported no wine, or very little wine, in the early years of our sample period. In fact, France, Italy, Spain, and Portugal account for around 90 percent of world trade in wine in 1964 and 1969. Germany plays an increasing role, especially from 1979, and from 1999 Australia becomes a major world exporter of wine.
8
4. Intra-Industry Trade in Wine
We now turn to analysis of the pattern of trade in wine based on the Grubel and Lloyd
index of intra-industry trade. What we mean by intra-industry trade is the case where
partners both import to and export from each other (aka two-way trade) (Greenaway
and Milner, 1986, Grubel and Lloyd, 1975). Two-way trade in wine can reflect, for
example, consumer interest in final wine varieties that differ by country of origin,
such as trade in different wine varieties for final consumption between France and
Spain. However, a great deal of wine is traded in bulk and then mixed with domestic
wine, or with wine imported from other countries, before packaging for final
consumers (COGEA.S.r.l., 2014). In this sense, two-way trade in wine reflects
demand at both the final and intermediate product levels.
On a bilateral basis, we define the intra-industry trade index (in this case for
wine) IITRi,jR between countries i and j as a function of imports by country j from i (MRi,jR)
and imports by country i from country j (MRj,iR) as follows:
(1) 𝐼𝐼𝐼𝐼𝐼𝐼𝑖𝑖,𝑗𝑗 = 1 − � |𝑀𝑀𝑖𝑖,𝑗𝑗−𝑀𝑀𝑗𝑗,𝑖𝑖|𝑀𝑀𝑖𝑖,𝑗𝑗+𝑀𝑀𝑗𝑗,𝑖𝑖
�
In equation (1), the main term in square brackets represents the share of bilateral
trade that is classified as net trade, or as reflecting inter-industry trade. The remaining
share is then the share of trade that is intra-industry or two-way, meaning it reflects
trade that is balanced in both directions (where country i imports from country j and
country j imports from country I to the same extent). Note there is symmetry with the
definition in (1), where IITRi,jR =IITRj,iR.
Starting from equation (1) we can also define an intra-industry trade index for
country j trade with the world as a whole (where we take all trading partners of j
collectively). In formal terms, we define this aggregate index IITRj,worldR as follows:
(2) 𝐼𝐼𝐼𝐼𝐼𝐼𝑗𝑗,𝑤𝑤𝑤𝑤𝑤𝑤𝑤𝑤𝑤𝑤 = 1 −∑ � |𝑀𝑀𝑖𝑖,𝑗𝑗−𝑀𝑀𝑗𝑗,𝑖𝑖|∑ 𝑀𝑀𝑘𝑘,𝑗𝑗+𝑀𝑀𝑗𝑗,𝑘𝑘𝑘𝑘
�𝑖𝑖
We will work with both bilateral and aggregate IIT indexes as defined in
equations (1) and (2). These are all calculated on the basis of trade data (bilateral
imports) from the UN COMTRADE database.
9
Table 3 below presents the values of index IITRj,worldR for the 21 countries that
account collectively for between 90 and 95 percent of global trade in wine over the
period 1969-2009.P11F
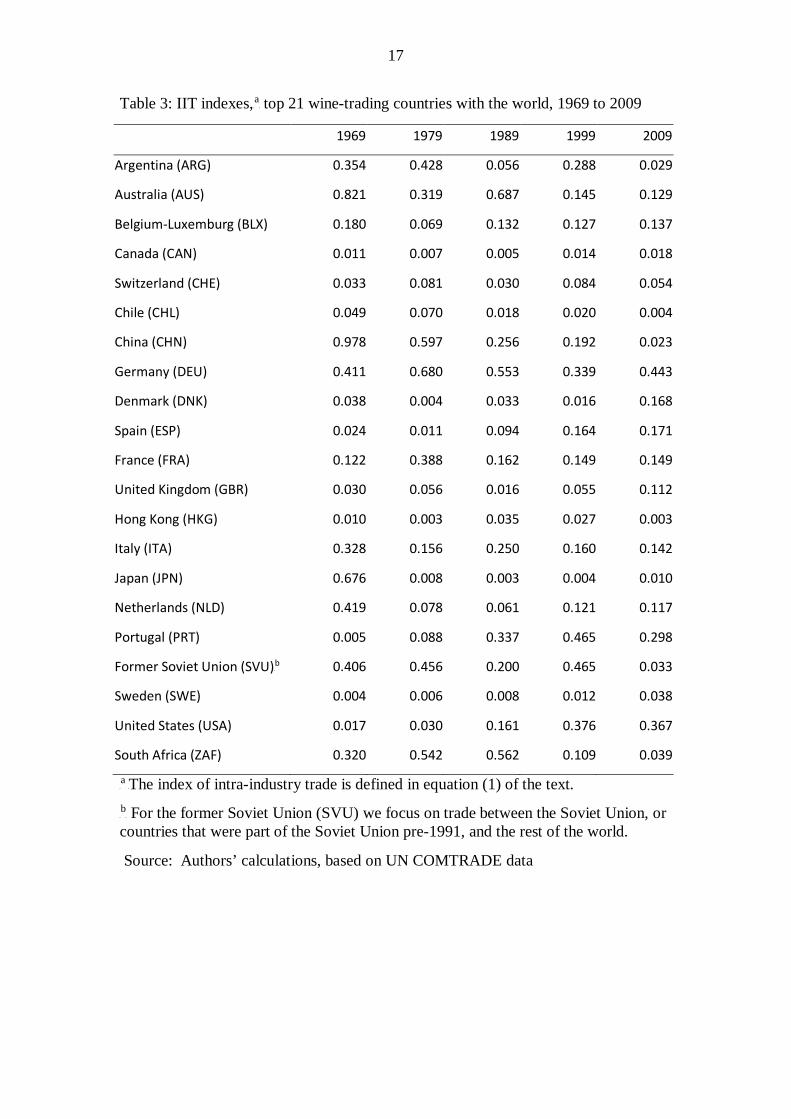
12P There are some significant changes over the 40 years in the
table. For example, we see that for Argentina, Australia and South Africa there is a
discernable drop in the IIT share of trade with the world. In the case of these
countries, and as will become clearer when we turn to bilateral flows below, this
reflects their rise over those four decades as net exporters to the rest of the world. In
contrast, the IIT share of trade also fell dramatically for China, but in this case it is
because of China’s rise as a wine importer.
--Table 3 about here--
Globally, changes in net positions as exporters or importers are reflected in
changes in the aggregate IIT indexes in Table 3. To better understand these changes,
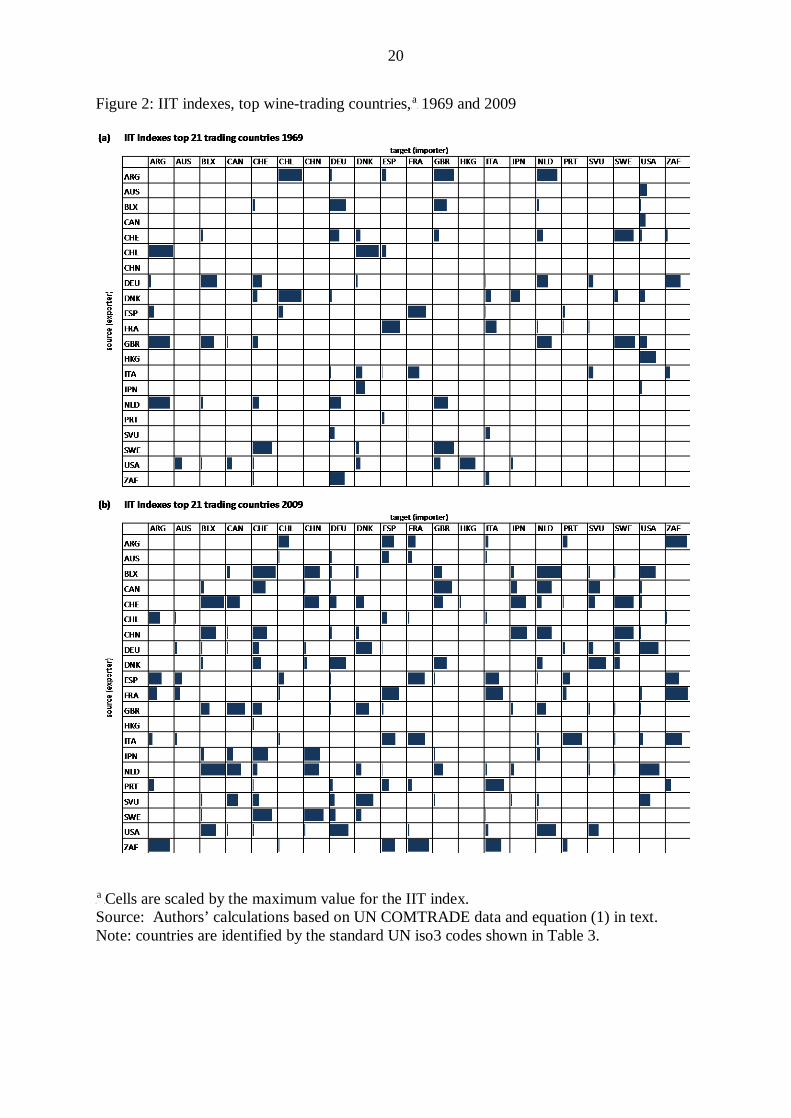
in Figure 2 we provide bilateral IIT indexes as defined in equation (1).P12F
13P In
comparing the pattern in 2009 with 1969, we see an increase in pair-wise
relationships defined by a high share of IIT trade in total pair-wise trade, for example
between Belgium-Luxemburg and Switzerland, South Africa and Argentina, and
South Africa and France.
-- Figure 2 about here--
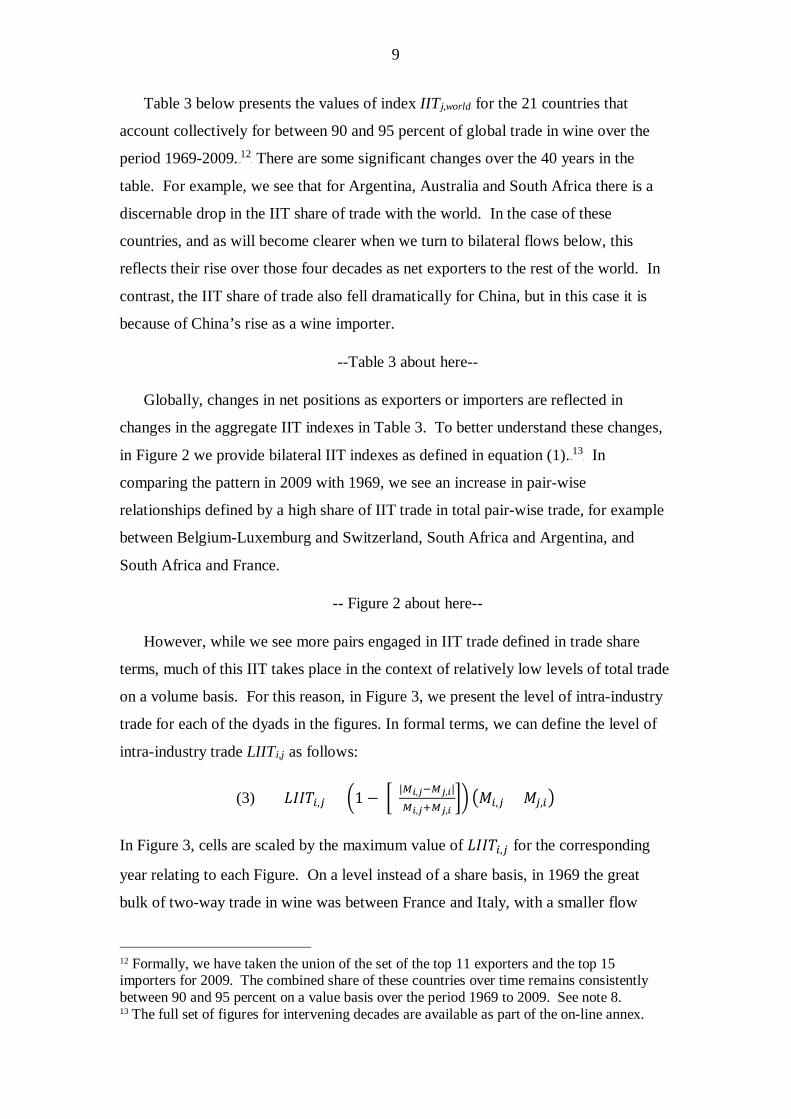
However, while we see more pairs engaged in IIT trade defined in trade share
terms, much of this IIT takes place in the context of relatively low levels of total trade
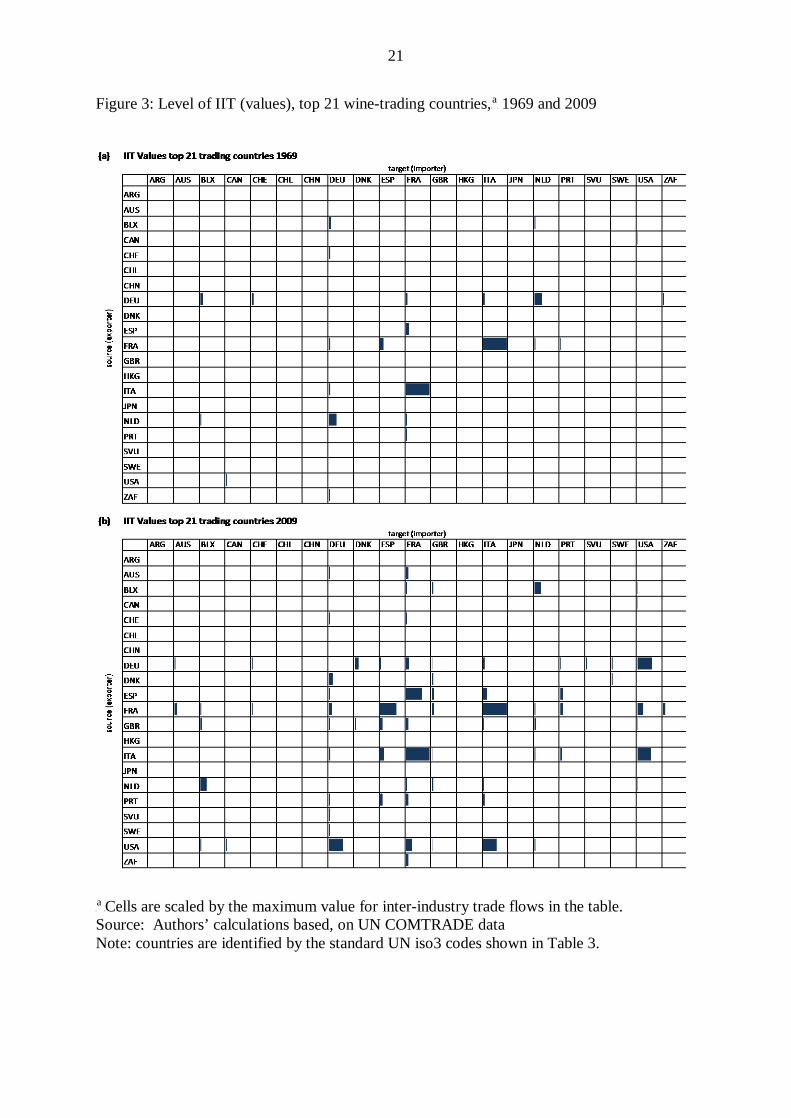
on a volume basis. For this reason, in Figure 3, we present the level of intra-industry
trade for each of the dyads in the figures. In formal terms, we can define the level of
intra-industry trade LIITRi,jR as follows:
(3) 𝐿𝐿𝐼𝐼𝐼𝐼𝐼𝐼𝑖𝑖,𝑗𝑗 = �1− � |𝑀𝑀𝑖𝑖,𝑗𝑗−𝑀𝑀𝑗𝑗,𝑖𝑖|𝑀𝑀𝑖𝑖,𝑗𝑗+𝑀𝑀𝑗𝑗,𝑖𝑖
�� �𝑀𝑀𝑖𝑖,𝑗𝑗 + 𝑀𝑀𝑗𝑗,𝑖𝑖�
In Figure 3, cells are scaled by the maximum value of 𝐿𝐿𝐼𝐼𝐼𝐼𝐼𝐼𝑖𝑖,𝑗𝑗 for the corresponding
year relating to each Figure. On a level instead of a share basis, in 1969 the great
bulk of two-way trade in wine was between France and Italy, with a smaller flow
12 Formally, we have taken the union of the set of the top 11 exporters and the top 15 importers for 2009. The combined share of these countries over time remains consistently between 90 and 95 percent on a value basis over the period 1969 to 2009. See note 8. 13 The full set of figures for intervening decades are available as part of the on-line annex.
10
(approximately 25 percent of the France-Italy trade) between Germany and the
Netherlands. What we see by 2009 is a spread of two-way trade. France and Italy
still show the greatest level of intra-industry trade, reflecting bulk trade and well
established blending patterns (COGEA, 2014). However, we also now have relatively
high volumes of intra-industry trade between France and Spain, Germany and the
United States, and Italy and the United States.
--Figure 3 about here--
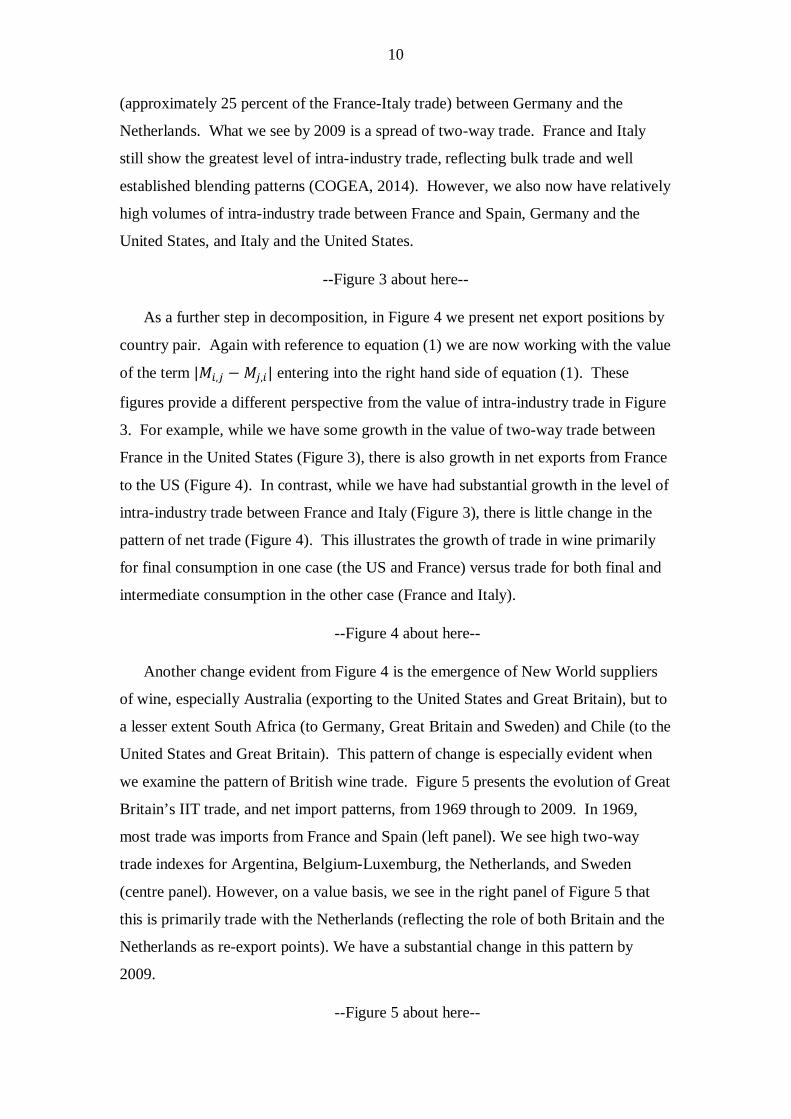
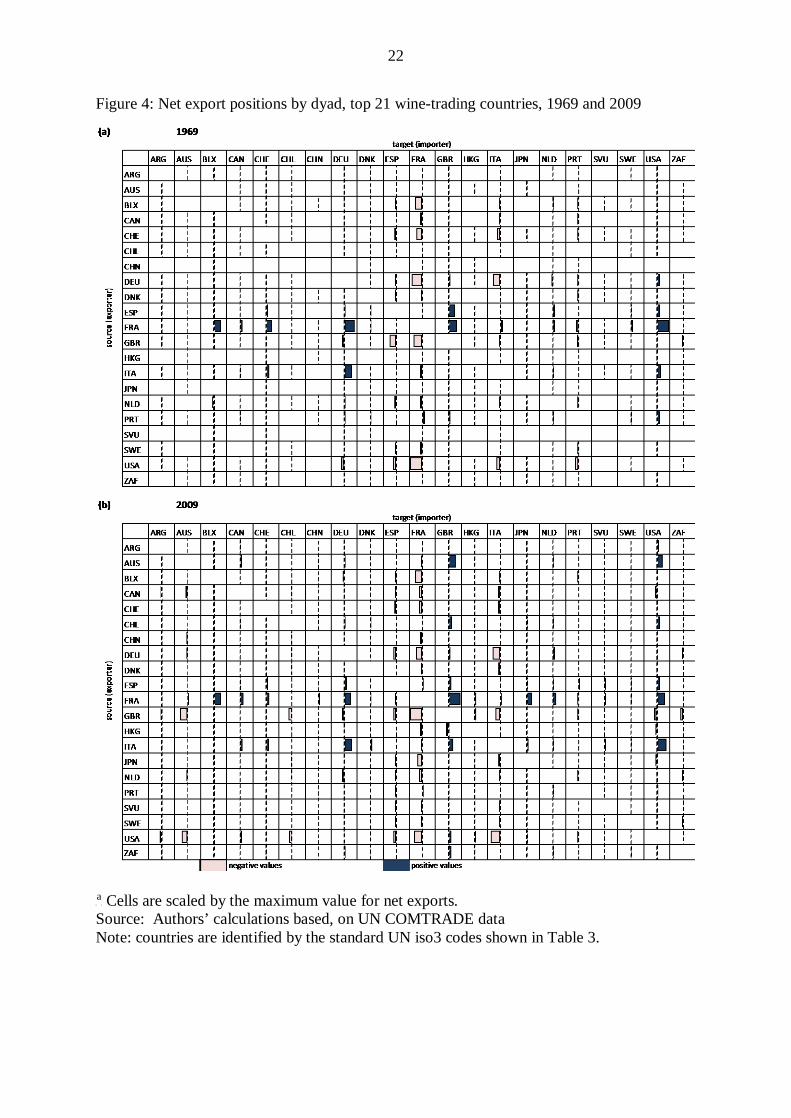
As a further step in decomposition, in Figure 4 we present net export positions by
country pair. Again with reference to equation (1) we are now working with the value
of the term |𝑀𝑀𝑖𝑖,𝑗𝑗 − 𝑀𝑀𝑗𝑗,𝑖𝑖| entering into the right hand side of equation (1). These
figures provide a different perspective from the value of intra-industry trade in Figure
3. For example, while we have some growth in the value of two-way trade between
France in the United States (Figure 3), there is also growth in net exports from France
to the US (Figure 4). In contrast, while we have had substantial growth in the level of
intra-industry trade between France and Italy (Figure 3), there is little change in the
pattern of net trade (Figure 4). This illustrates the growth of trade in wine primarily
for final consumption in one case (the US and France) versus trade for both final and
intermediate consumption in the other case (France and Italy).
--Figure 4 about here--
Another change evident from Figure 4 is the emergence of New World suppliers
of wine, especially Australia (exporting to the United States and Great Britain), but to
a lesser extent South Africa (to Germany, Great Britain and Sweden) and Chile (to the
United States and Great Britain). This pattern of change is especially evident when
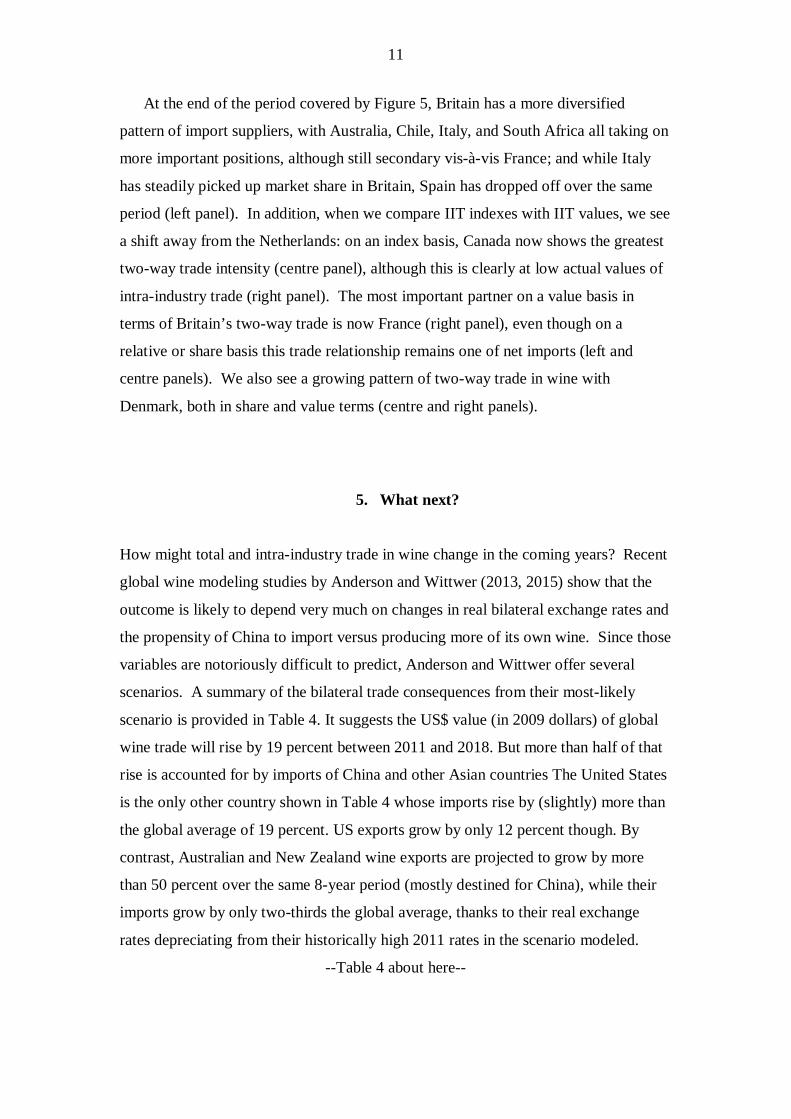
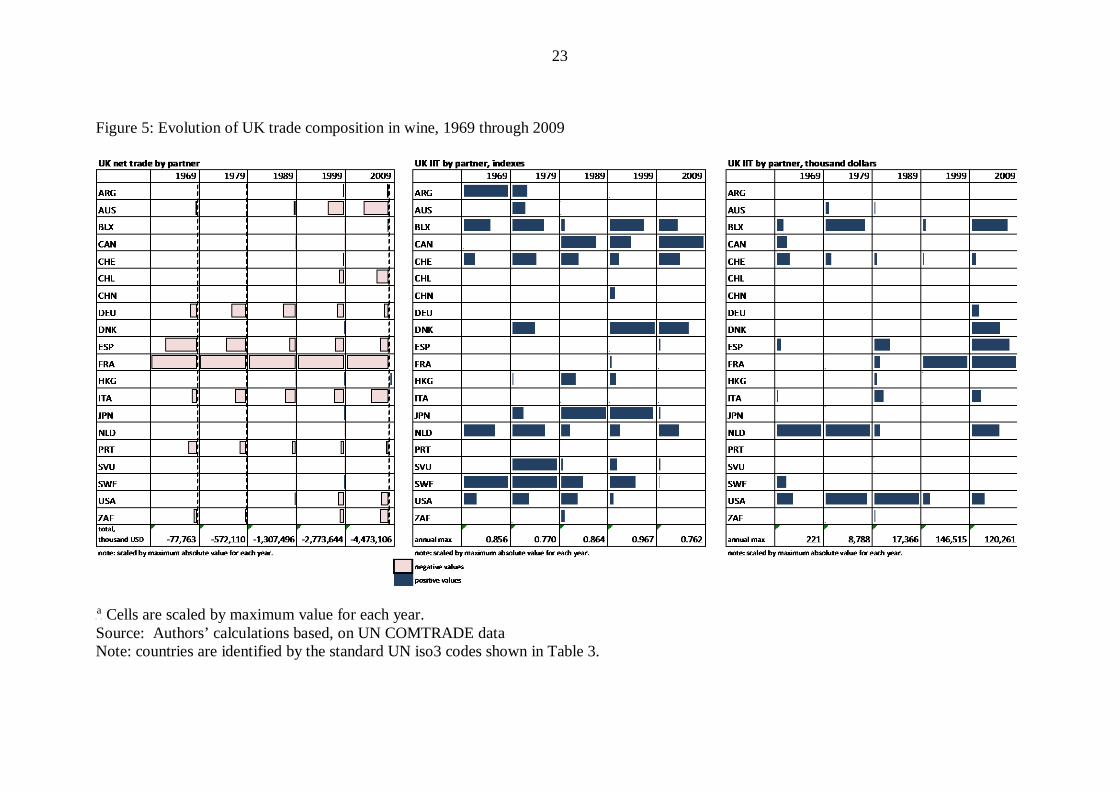
we examine the pattern of British wine trade. Figure 5 presents the evolution of Great
Britain’s IIT trade, and net import patterns, from 1969 through to 2009. In 1969,
most trade was imports from France and Spain (left panel). We see high two-way
trade indexes for Argentina, Belgium-Luxemburg, the Netherlands, and Sweden
(centre panel). However, on a value basis, we see in the right panel of Figure 5 that
this is primarily trade with the Netherlands (reflecting the role of both Britain and the
Netherlands as re-export points). We have a substantial change in this pattern by
2009.
--Figure 5 about here--
11
At the end of the period covered by Figure 5, Britain has a more diversified
pattern of import suppliers, with Australia, Chile, Italy, and South Africa all taking on
more important positions, although still secondary vis-à-vis France; and while Italy
has steadily picked up market share in Britain, Spain has dropped off over the same
period (left panel). In addition, when we compare IIT indexes with IIT values, we see
a shift away from the Netherlands: on an index basis, Canada now shows the greatest
two-way trade intensity (centre panel), although this is clearly at low actual values of
intra-industry trade (right panel). The most important partner on a value basis in
terms of Britain’s two-way trade is now France (right panel), even though on a
relative or share basis this trade relationship remains one of net imports (left and
centre panels). We also see a growing pattern of two-way trade in wine with
Denmark, both in share and value terms (centre and right panels).
5. What next?
How might total and intra-industry trade in wine change in the coming years? Recent
global wine modeling studies by Anderson and Wittwer (2013, 2015) show that the
outcome is likely to depend very much on changes in real bilateral exchange rates and
the propensity of China to import versus producing more of its own wine. Since those
variables are notoriously difficult to predict, Anderson and Wittwer offer several
scenarios. A summary of the bilateral trade consequences from their most-likely
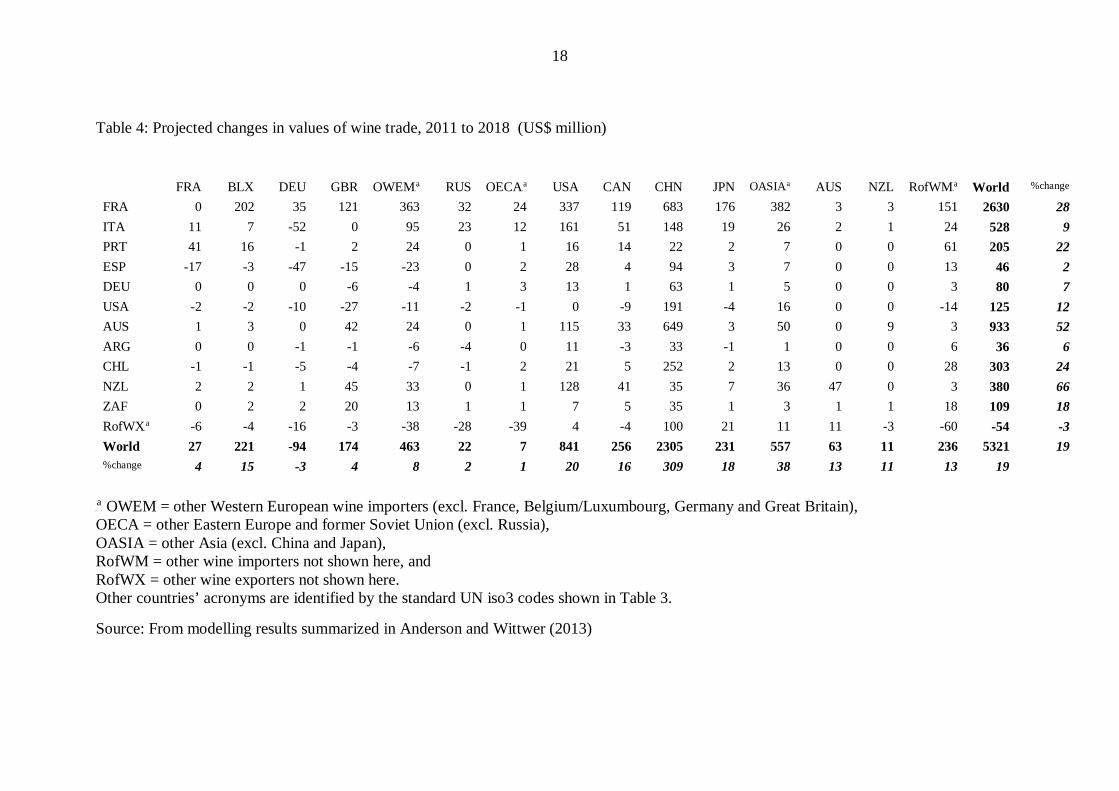
scenario is provided in Table 4. It suggests the US$ value (in 2009 dollars) of global
wine trade will rise by 19 percent between 2011 and 2018. But more than half of that
rise is accounted for by imports of China and other Asian countries The United States
is the only other country shown in Table 4 whose imports rise by (slightly) more than
the global average of 19 percent. US exports grow by only 12 percent though. By
contrast, Australian and New Zealand wine exports are projected to grow by more
than 50 percent over the same 8-year period (mostly destined for China), while their
imports grow by only two-thirds the global average, thanks to their real exchange
rates depreciating from their historically high 2011 rates in the scenario modeled.
--Table 4 about here--
12
6. Conclusions
This paper illustrates the benefits of network methods to the study of trade in a sector
characterized by dynamic evolution of both production and consumption of a
differentiated product. The takeaway message from this analysis is that the global
wine industry is growing rapidly around a rather stable core of countries that are both
sizable exporters and sizable importers. This trade reflects both trade in intermediate
inputs (bulk wine for blending) and trade at the final product level. The growing
demand for wine is increasingly being served by new wine exporters, without
displacing the historical core of the wine producers. If new Chinese producers are
able to move up market, they could become major participants in this core.
While our trade data do not permit us to distinguish quality at the dyadic level
over the entire period, it is clear from the aggregate data on production and
consumption that countries differ substantially in patterns of consumption, and
production, by quality. By focusing on a single product, especially one characterized
by extensive differentiation, future work should be able to provide more extensive
analysis of the foundations of intra-industry trade and its evolution. In particular, the
co-evolution of production and consumption has long been recognized as a
phenomenon that is characteristic of sophisticated differentiated products.P13F
14P Network
methods provide an effective body of tools for characterizing and measuring precisely
this sort of phenomenon. We have only scratched the surface of what is possible
using these methods.
In addition, the close link between network methods and gravity modeling of
trade provides a bridge between the sort of analysis presented in this paper and the
most common approach to empirical research on international trade in current trade
research (Ward et al., 2013, Fagiolo, 2010, Duenas and Fagiolo, 2013). By matching
production, consumption and trade data over time (Anderson and Nelgen, 2011,
Anderson and Pinilla 2016), there is ample scope to examine in future work the causal
relationships between these factors.
14 In addition to Linder’s (1961) work, mentioned in the introduction, this has long been part of the product life cycle analysis of the evolution of trade relations (Vernon, 1966, Hufbauer, 1966).
13
References
Anderson K. and Aryal N. R. (2015), Growth and Cycles in Australia's Wine Industry
: A Statistical Compendium, 1843 to 2013, (University of Adelaide Press,
Adelaide, SA).
Anderson K. and Nelgen S. (2011), Global Wine Markets, 1961 to 2009: A Statistical
Compendium, (University of Adelaide Press, Adelaide).
Anderson K., Norman D. and Wittwer G. (2003), 'Globalisation of the World's Wine
Markets', World Economy, 26, 5, 659-87.
Anderson K. and V. Pinilla (2016), 16TGlobal Wine Markets, 1860 to 2015: A Statistical
Compendium, 16TAdelaide: University of Adelaide Press (forthcoming).
Anderson K. and Wittwer G. (2013), 'Modeling Global Wine Markets to 2018:
Exchange Rates, Taste Changes, and China's Import Growth', Journal of Wine
Economics, 8, 02, 131-58.
Anderson K. and Wittwer G. (2015), 'Asia's Evolving Role in Global Wine Markets',
China Economic Review, 35, 1-14.
Borgatti S. P., Everett M. G. and Johnson J. C. (2013), Analyzing Social Networks,
(Sage Publications, Thousand Oaks, CA).
COGEA.S.r.l. (2014), 'Study on the Competitiveness of European Wines: Final
Report', doi: 10.2762/56910, (Luxembourg: European Commission,
Luxembourg Publications Office of the European Union).
De Benedictis L. and Tajoli L. (2011), 'The World Trade Network', The World
Economy, 34, 8, 1417-54.
Duenas M. and Fagiolo G. (2013), 'Modeling the International Trade Network: A
Gravity Approach', Journal of Economic Interaction and Coordination, 8, 1,
155-78.
Fagiolo G. (2010), 'The International-Trade Network: Gravity Equations and
Topological Properties', Journal of Economic Interaction and Coordination, 5,
1, 1-25.
Freeman L. C. (1979), 'Centrality in Social Networks' Conceptual Clarification',
Social Networks, 1, 3, 215-39.
Greenaway D. and Milner C. (1986), The Economics of Intra-Industry Trade, (Basil
Blackwell, Oxford).
14
Grubel H. G. and Lloyd P. J. (1975), Intra-Industry Trade: The Theory and
Measurement of International Trade in Differentiated Products, (Wiley, New
York,).
Helpman E. and Krugman P. R. (1985), Market Structure and Foreign Trade:
Increasing Returns, Imperfect Competition, and the International Economy,
(MIT Press, Cambridge, MA).
Hufbauer G. C. (1966), Synthetic Materials and the Theory of International Trade,
(Duckworth, London).
Johnson H. (1989), Vintage: The Story of Wine, (Simon and Schuster, New York).
Linder S. B. (1961), An Essay on Trade and Transformation, (Almqvist & Wiksell,
Stockholm).
Lukacs P. (2012), Inventing Wine: A New History of One of the World's Most Ancient
Pleasures, (W.W. Norton & Co., New York).
Meloni G. and Swinnen J. (2014), 'The Rise and Fall of the World's Largest Wine
Exporter—and Its Institutional Legacy', Journal of Wine Economics, 9, 01, 3-
33.
Pellechia T. (2006), Wine: The 8,000-Year-Old Story of the Wine Trade, (Thunder's
Mouth Press, New York).
Piggott S. (1959), 'A Late Bronze Age Wine Trade?', Antiquity, 33, 130, 122-23.
Simpson J. (2011), Creating Wine: The Emergence of a World Industry, 1840-1914,
(Princeton University Press, Princeton NJ).
Unwin T. (1991), Wine and the Vine: An Historical Geography of Viticulture and the
Wine Trade, (Routledge, London and New York).
Vernon R. (1966), 'International Investment and International Trade in the Product
Cycle', Quarterly Journal of Economics, 80, 2, 190-207.
Ward M. D., Ahlquist J. S. and Rozenas A. (2013), 'Gravity's Rainbow: A Dynamic
Latent Space Model for the World Trade Network', Network Science, 1, 01,
95-118.
15
Table 1: Network Statistics on World Wine Web, all countries, 1964 to 2009
1964 1969 1974 1979 1984 1989 1994 1999 2004 2009 n of countries 152 157 196 193 191 195 216 213 225 230 n of links 1147 1423 2029 2131 2015 2283 2997 3615 4660 5156 Total trade 587858 704647 1829924 4118851 3873040 6888756 8853214 14299819 21076262 26721601 Max out degree 141 148 169 173 168 165 183 181 195 190 Max weighted out 166155 234936 635669 1654576 1716800 3631749 4054235 6079691 6915577 8199769 Median out degree 0 0 1 1 1 1 1 2 4 6 Median weighted out 0 0 1 1 1 5 10 19 28 88 Out centralization 0.7 1.8 2.9 2.9 2.1 2.5 2.3 2.3 2.2 2.1 Mean degree 8 9 10 11 11 12 14 17 21 22 Mean weighted deg. 3867 4488 9336 21341 20278 35327 40987 67135 93672 116181 Max in degree 34 36 56 51 58 65 60 75 80 86 Max weighted in 219070 105796 293596 692263 1064519 1352308 1718869 2979401 5275938 5040290 Median in degree 6 7 8 9 8 9 11 13 15 18 Median weighted in 116 211 282 596 454 951 1225 1796 2201 3689 In centralization 0.9 0.8 1.3 1.2 1.3 0.9 1.0 1.1 1.6 1.4 Density 0.050 0.058 0.053 0.058 0.056 0.060 0.065 0.080 0.092 0.098
Source: Authors’ calculations, based on UN COMTRADE data
16
Table 2: Network Statistics on Core of World Wine Web (top 21 wine-trading countries), 1964 to 2009
1964 1969 1974 1979 1984 1989 1994 1999 2004 2009 n of countries 20 20 20 20 20 20 21 21 21 21 n of links 204 230 273 282 285 317 370 368 391 391 Total trade 290538 427870 1380868 3394735 3352158 6035842 7549519 12292198 17487763 21154106 Global proportion 0.49 0.61 0.75 0.82 0.87 0.88 0.85 0.86 0.83 0.79 Mean degree 10.2 11.5 13.7 14.1 14.3 15.9 17.6 17.5 18.6 18.6 Mean weighted degree 14527 21394 69043 169737 167608 301792 359501 585343 832751 1007338 Normalized degree 2.0 2.4 3.2 3.0 2.1 2.1 2.2 2.4 3.0 3.3 Density 0.5 0.6 0.7 0.7 0.8 0.8 0.9 0.9 0.9 0.9 Out centralization 19.2 22.3 24.6 24.9 18.5 23.0 21.6 21.5 20.0 20.9 In centralization 9.2 8.6 9.9 9.5 11.3 7.6 8.1 9.7 15.7 12.9
Source: Authors’ calculations, based on UN COMTRADE data
17
Table 3: IIT indexes,P
aP top 21 wine-trading countries with the world, 1969 to 2009
1969 1979 1989 1999 2009
Argentina (ARG) 0.354 0.428 0.056 0.288 0.029
Australia (AUS) 0.821 0.319 0.687 0.145 0.129
Belgium-Luxemburg (BLX) 0.180 0.069 0.132 0.127 0.137
Canada (CAN) 0.011 0.007 0.005 0.014 0.018
Switzerland (CHE) 0.033 0.081 0.030 0.084 0.054
Chile (CHL) 0.049 0.070 0.018 0.020 0.004
China (CHN) 0.978 0.597 0.256 0.192 0.023
Germany (DEU) 0.411 0.680 0.553 0.339 0.443
Denmark (DNK) 0.038 0.004 0.033 0.016 0.168
Spain (ESP) 0.024 0.011 0.094 0.164 0.171
France (FRA) 0.122 0.388 0.162 0.149 0.149
United Kingdom (GBR) 0.030 0.056 0.016 0.055 0.112
Hong Kong (HKG) 0.010 0.003 0.035 0.027 0.003
Italy (ITA) 0.328 0.156 0.250 0.160 0.142
Japan (JPN) 0.676 0.008 0.003 0.004 0.010
Netherlands (NLD) 0.419 0.078 0.061 0.121 0.117
Portugal (PRT) 0.005 0.088 0.337 0.465 0.298
Former Soviet Union (SVU)P
b 0.406 0.456 0.200 0.465 0.033
Sweden (SWE) 0.004 0.006 0.008 0.012 0.038
United States (USA) 0.017 0.030 0.161 0.376 0.367
South Africa (ZAF) 0.320 0.542 0.562 0.109 0.039
P
a PThe index of intra-industry trade is defined in equation (1) of the text.
P
bP For the former Soviet Union (SVU) we focus on trade between the Soviet Union, or
countries that were part of the Soviet Union pre-1991, and the rest of the world.
Source: Authors’ calculations, based on UN COMTRADE data
18
Table 4: Projected changes in values of wine trade, 2011 to 2018 (US$ million)
FRA BLX DEU GBR OWEMP
a RUS OECAP
a USA CAN CHN JPN OASIAP
a AUS NZL RofWMP
a World %change
FRA 0 202 35 121 363 32 24 337 119 683 176 382 3 3 151 2630 28 ITA 11 7 -52 0 95 23 12 161 51 148 19 26 2 1 24 528 9 PRT 41 16 -1 2 24 0 1 16 14 22 2 7 0 0 61 205 22 ESP -17 -3 -47 -15 -23 0 2 28 4 94 3 7 0 0 13 46 2 DEU 0 0 0 -6 -4 1 3 13 1 63 1 5 0 0 3 80 7 USA -2 -2 -10 -27 -11 -2 -1 0 -9 191 -4 16 0 0 -14 125 12 AUS 1 3 0 42 24 0 1 115 33 649 3 50 0 9 3 933 52 ARG 0 0 -1 -1 -6 -4 0 11 -3 33 -1 1 0 0 6 36 6 CHL -1 -1 -5 -4 -7 -1 2 21 5 252 2 13 0 0 28 303 24 NZL 2 2 1 45 33 0 1 128 41 35 7 36 47 0 3 380 66 ZAF 0 2 2 20 13 1 1 7 5 35 1 3 1 1 18 109 18 RofWXP
a -6 -4 -16 -3 -38 -28 -39 4 -4 100 21 11 11 -3 -60 -54 -3 World 27 221 -94 174 463 22 7 841 256 2305 231 557 63 11 236 5321 19 %change 4 15 -3 4 8 2 1 20 16 309 18 38 13 11 13 19
P
aP OWEM = other Western European wine importers (excl. France, Belgium/Luxumbourg, Germany and Great Britain),
OECA = other Eastern Europe and former Soviet Union (excl. Russia), OASIA = other Asia (excl. China and Japan), RofWM = other wine importers not shown here, and RofWX = other wine exporters not shown here. Other countries’ acronyms are identified by the standard UN iso3 codes shown in Table 3.
Source: From modelling results summarized in Anderson and Wittwer (2013)
19
Figure 1: Value of wine exports, New World countries, 1995 to 2015 (US$ million)
Source: Updated from Anderson (2015).
0
500
1000
1500
2000
250019
9819
9920
0020
0120
0220
0320
0420
0520
0620
0720
0820
0920
1020
1120
1220
1320
1420
15
AustraliaChileUnited StatesSouth AfricaArgentinaNew Zealand
20
Figure 2: IIT indexes, top wine-trading countries,P
aP 1969 and 2009
P
a PCells are scaled by the maximum value for the IIT index.
Source: Authors’ calculations based on UN COMTRADE data and equation (1) in text. Note: countries are identified by the standard UN iso3 codes shown in Table 3.
21
Figure 3: Level of IIT (values), top 21 wine-trading countries,P
aP 1969 and 2009
P
a PCells are scaled by the maximum value for inter-industry trade flows in the table.
Source: Authors’ calculations based, on UN COMTRADE data Note: countries are identified by the standard UN iso3 codes shown in Table 3.
22
Figure 4: Net export positions by dyad, top 21 wine-trading countries, 1969 and 2009
P
aP Cells are scaled by the maximum value for net exports.
Source: Authors’ calculations based, on UN COMTRADE data Note: countries are identified by the standard UN iso3 codes shown in Table 3.
23
Figure 5: Evolution of UK trade composition in wine, 1969 through 2009
P
aP Cells are scaled by maximum value for each year.
Source: Authors’ calculations based, on UN COMTRADE data Note: countries are identified by the standard UN iso3 codes shown in Table 3.