Embed Size (px)
Citation preview
Intra-Day Stock Returns and Close-End Price Manipulation in the Istanbul Stock Exchange
Güray Küçükkocaoğlu• Abstract In this paper, we examine the behavior of the intra-daily stock returns and close-end stock price manipulation in the Istanbul Stock Exchange (ISE). Understanding the price behavior in a given trading day could help investors when they are making their buy and sell decisions. Studies of intra-daily returns have found that stock prices systematically rise near the closing minute and the last trade is more often initiated by a buyer. It is likely that a trader in the ISE with a big net position in a given day will want to enhance his performance by manipulating the closing price, this trader will try to improve his position by placing the last buy order. The possibility to artificially influence stock prices in the ISE is an important issue to everybody who is involved in stock trading securities exchanges, investors, brokers, the largest share holders etc. In order to test for the closing price manipulation by the traders in the ISE, we used a standard OLS regression model, which looks for the effects of the size of the daily traders net position in twenty-three stocks selected from the ISE National-30 index companies. If a trader acquires a large net position in one of these stocks during the trading day, it is possible that he tries to influence the closing price of the stock. We find that, close-end price manipulation through big buyers and big sellers is possible in the ISE. Keywords: Stock market returns; Closing Price; Manipulation; Istanbul Stock Exchange JEL classification: G1; G14; G15; G24 ; C22
• Baskent University, Faculty of Economics and Administrative Sciences, Ankara, Turkey, Tel : +90 312 234 10 10/1728, Fax : +90 312 234 10 43, e-mail : [email protected]
G Küçükkocaoğlu – Intra-Day Stock Returns and Close-End Price Manipulation in the Istanbul Stock Exchange – Frontiers in Finance and Economics – Vol. 5 No.1 – April 2008,
2
Intra-Day Stock Returns and Close-End Price Manipulation in the Istanbul Stock Exchange
1 - Introduction
Extensive research has shown that stock markets are more active at the beginning and the ending of the trading session. Trading volume, price volatility and the number of buy and sell orders, are higher at the open and close for different stock exchanges. The intra-daily volatility exhibits a U-shaped pattern associated with the opening and closing of the trading sessions. This pattern has been identified in a number of studies including Wood, Mc Inish and Ord (1985), Harris (1986, 1989), Smirlock and Starks (1986), Jain and Joh (1988), McInish and Wood (1990a), Lockwood and Linn (1990), Gerethy and Mulherin (1991), Wei (1992), Foster and Viswanathan (1993), Jang and Lee (1993), Berry and Howe (1994), Chan et. al. (1996) in the New York Stock Exchange, Chan, Christie and Schultz (1995) in NASDAQ, McInish and Wood (1990b) in the Toronto Stock Exchange, Chang et. al. (1993), Andersen, Bollerslev and Cai (2000) in the Japanese Stock Market, Choe and Shin (1993) in the Korean Stock Exchange, Cheung (1995) in the Hong Kong Equity Market, Norden (1993) in the Swedish Stock Market, Lowengrub and Melvin (2002) in the German Stock Market, Yadav and Pope (1992) in the UK Market, Hillion and Suominen (1998) in the Paris Bourse, and Bildik (2001) in the Turkish Stock Market.
In terms of Turkish Stock Market, Bildik (2001) examines the intra-daily seasonalities of the Istanbul Stock Exchange (ISE) using the ISE National-100 index data between January 2, 1996 and January 15, 1999. He finds that stock returns follow a U-shaped pattern (open to close) in both of the separate morning and afternoon trading sessions, with opening and closing returns being large and positive. Volatility is higher at the open and follows an L-shape pattern during the morning and afternoon sessions.
When stock prices systematically increase prior to the close, there is the possibility that these prices are artificially influenced by the activities of brokerage houses, stockbrokers, fund managers, speculators and daily traders with large amounts of money to change closing prices. For example, if a fund manager takes a big net position

G Küçükkocaoğlu – Intra-Day Stock Returns and Close-End Price Manipulation in the Istanbul Stock Exchange – Frontiers in Finance and Economics – Vol. 5 No.1 – April 2008,
3
for his client over the trading day, there is a possibility that he will attempt to change the closing price in his client’s favor. He could place a buy order at seconds before close to increase the closing price of a stock. This attempt to change the closing price is manipulation, and this kind of activity at close is expected to last for a short period until the opening of the next trading day.
The Capital Markets Board of Turkey (2002) defines two types of manipulation: Rule 47/A-2 prohibits Trade-based manipulation where a trader affects prices by significantly changing his order, like buying at low and selling at high; Rule 47/A-3 prohibits Action-based manipulation where the manipulator issues a false statement or an insider tip, when the traders in the market rely on his information, they could drive up or down the stock price, thus the manipulator can profit by selling high or buying low to make trading profits.
When Jarrow (1992) defines trade-based manipulation, he identifies the trader as a wealthy person who can affect prices by significantly changing the order flow to the market maker. This definition could be very useful when this wealthy trader wants to take control of a stock, because he would enhance and empower his position by manipulating the stock price by buying large amounts of shares. But to be a trade-based manipulator, this person would not have to be wealthy necessarily. According to the Capital Markets Board of Turkey (2002), a trader with a purchasing power of buying a minimum of one lot could set the closing price by buying shares just prior to close.
Either wealthy or not traders would try to influence the closing prices because stock price manipulation at close would benefit stockholders since it artificially increases the prices at which they can sell their shares at a higher price at the opening of the next trading day. Further, closing prices are important indicators of stock market performance. They are used in a variety of contexts such as a benchmark of stocks, traders and market performance.
Stock price manipulation has received a lot of attention in the literature. Researchers and academicians have widely studied the different characteristics of manipulation practices. Allen and Gorton (1992), and Allen and Gale (1992) present models of trade-based manipulation in which uninformed and informed traders’ success through trading strategies. Jarrow (1992) presents a model in which market manipulation trading strategies exists under reasonable
G Küçükkocaoğlu – Intra-Day Stock Returns and Close-End Price Manipulation in the Istanbul Stock Exchange – Frontiers in Finance and Economics – Vol. 5 No.1 – April 2008,
4
hypotheses with the existence of large traders. Kyle (1984), Jarrow (1994), and Kumar and Seppi (1992) study manipulation in derivative security markets, investigating the relationship between prices, trading strategies, and their possible effects to traders and markets. Benabou and Laroque (1992), and Bagnoli and Lipman (1996) study action-based manipulation through insider trading and takeover bids. Chatterjea and Joseph (1993) examine the actions undertaken by corporations to prevent its shares from being manipulated by others. Fried (2000) discusses the economic consequences, the motive and the effect of high closing prices.
When Felixson and Pelli (1999) studied the manipulation of closing prices by the traders in an organized exchange, they raised a question about a different type of manipulator, they define this person as a trader who acquires a large net position in a stock during the trading day and tries to improve his position by manipulating the closing prices. This person could be a broker or a fund manager. The broker is a representative of a brokerage house on the trading floor and is directed by his brokerage house to buy and sell shares for his customer. If the broker makes wrong moves and buys when the price is high and sells when the price is low, he will likely try to manipulate the stock price to keep his client satisfied with his performance. Fund managers report their activities to a third party, and they are expected to be a profit generator all the time.
Using the insights developed in Felixson and Pelli (1999) we use their model to test whether the largest traders in the ISE manipulate the close-end prices of the selected stocks.
The paper is structured in six sections, Section 2 describes the setting of the Istanbul Stock Exchange, the data set and the companies used in this study. Section 3 documents the intra-day patterns of the ISE National 30 index companies between 1st January 2000 – 29th March 2002 where there are some major changes in terms of order palacement. Section 4 discusses manipulation and why traders attempt to manipulate the close-end prices. Section 5 discusses the model and the results, to observe whether traders influence the closing prices. Section 6 concludes the paper with a brief summary of our results and discussion of our conclusions.
G Küçükkocaoğlu – Intra-Day Stock Returns and Close-End Price Manipulation in the Istanbul Stock Exchange – Frontiers in Finance and Economics – Vol. 5 No.1 – April 2008,
5
2 - The Istanbul Stock Exchange, Data Set, Companies and Brokerage Houses
2.1. The Istanbul Stock Exchange (ISE) The ISE is a continuous market with no market professionals.
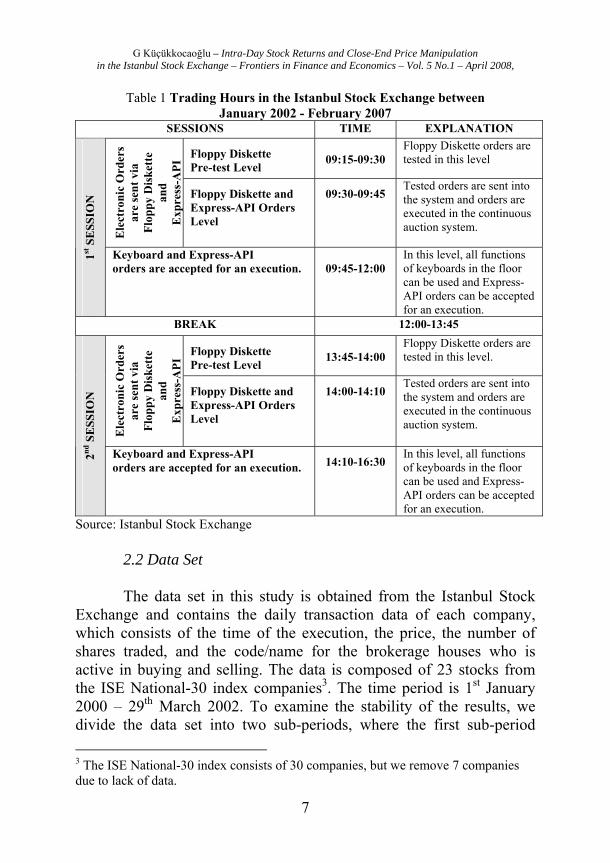
The trading system is fully computerized which enables the ISE members to trade in stocks. The stock trading activities are carried out in two separate sessions, where the first session opens at 09.15 a.m. and ends at 12.00 a.m., and the second session opens at 13:45 p.m., and ends at 16.30 p.m (Table 1)1. Session hours were 10:00 a.m. to 12:00 a.m., and 14:00 p.m. to 16:00 p.m., but fully changed into new hours after August 13, 2001. After the change in session hours, the members of the stock market were given the ability to send their orders directly to the trading system of the ISE by using their own computer systems and get responses immediately. This feature is being used together with the manual order entry through workstations and order transfers via floppy diskettes and aims to prevent time losses in the transfer of customer orders collected via the internet and/or other order collecting systems.
Morning orders received by the ISE members by electronic means prior to the first session are entered into the trading system via floppy diskettes through trading terminals and matched in a continuous auction system according to time and priority as in a normal session. The ISE accepts floppy diskette orders between 09:15 a.m. to 9:45 a.m. as part of the first session. Floppy diskette orders are tested between 9:15 a.m. and 9:30 a.m. and the tested orders are sent into the system for an execution in the continuous auction system between 9:30 a.m. to 9:45 a.m. After 9:45 a.m. all functions of keyboards in the floor can be used and Express-API orders can be accepted for an execution until the 1 In February 2007, Istanbul Stock Exchange Board has changed the opening procedure of the trading system and adopted a call market procedure before the normal session where the Keyboard and Express-API orders are accepted for an execution, however, there are no signs of adopting a call procedure to the market closing. As this study was conducted before February 2007 and mainly focused on the close end price manipulation, this section of the study explains the trading hours and the trading activities of the Istanbul Stock Exchange prior to February 2007 implementation.
G Küçükkocaoğlu – Intra-Day Stock Returns and Close-End Price Manipulation in the Istanbul Stock Exchange – Frontiers in Finance and Economics – Vol. 5 No.1 – April 2008,
6
end of the first session. Express-API order executions gives ability to the members of the stock market to send their orders directly to the trading system of the ISE by using their own computer systems and get responses immediately2.
Afternoon orders received by the ISE members by electronic means prior to the second session are again entered to the trading system via floppy diskettes through trading terminals and floppy diskette orders are tested between 13:45 p.m. and 14:00 p.m. Tested orders are sent into the system for an execution in the continuous auction system between 14:00 p.m. to 14:10 p.m. and matched in a continuous auction system according to time and priority as in a normal session. After 14:10 p.m. all functions of the workstations’ keyboards in the floor can be used and Express-API orders can be accepted for an execution until the end of the second session.
The order entrance procedure via floppy diskettes is subject to trading rules and only available for “limit orders”. Prices are determined on a “multiple price-continuous auction” method, utilizing a computerized system that automatically matches buy and sell orders on a price and time priority basis. The buyers and sellers enter the orders into the computer system through their workstations located at the ISE.
2 Electronic Orders sent via Express-API started January 4th 2002.
G Küçükkocaoğlu – Intra-Day Stock Returns and Close-End Price Manipulation in the Istanbul Stock Exchange – Frontiers in Finance and Economics – Vol. 5 No.1 – April 2008,
7
Table 1 Trading Hours in the Istanbul Stock Exchange between January 2002 - February 2007
SESSIONS TIME EXPLANATION
Floppy Diskette Pre-test Level
09:15-09:30
Floppy Diskette orders are tested in this level
Ele
ctro
nic
Ord
ers
are
sent
via
Fl
oppy
Dis
kett
e an
d
Exp
ress
-API
Floppy Diskette and Express-API Orders Level
09:30-09:45 Tested orders are sent into the system and orders are executed in the continuous auction system.
1st S
ESS
ION
Keyboard and Express-API orders are accepted for an execution.
09:45-12:00
In this level, all functions of keyboards in the floor can be used and Express-API orders can be accepted for an execution.
BREAK 12:00-13:45
Floppy Diskette Pre-test Level
13:45-14:00
Floppy Diskette orders are tested in this level.
Ele
ctro
nic
Ord
ers
are
sent
via
Fl
oppy
Dis
kett
e an
d
Exp
ress
-API
Floppy Diskette and Express-API Orders Level
14:00-14:10 Tested orders are sent into the system and orders are executed in the continuous auction system.
2nd S
ESS
ION
Keyboard and Express-API orders are accepted for an execution. 14:10-16:30
In this level, all functions of keyboards in the floor can be used and Express-API orders can be accepted for an execution.
Source: Istanbul Stock Exchange
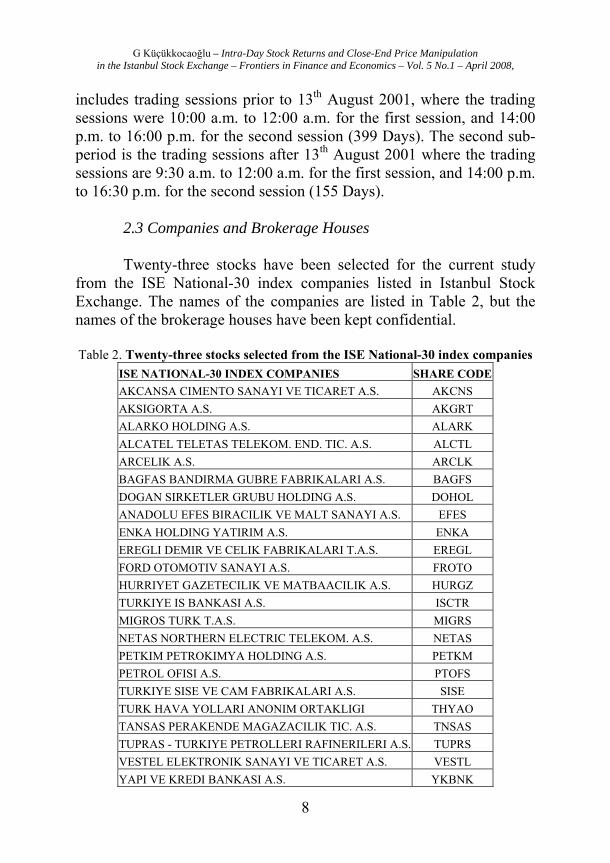
2.2 Data Set The data set in this study is obtained from the Istanbul Stock
Exchange and contains the daily transaction data of each company, which consists of the time of the execution, the price, the number of shares traded, and the code/name for the brokerage houses who is active in buying and selling. The data is composed of 23 stocks from the ISE National-30 index companies3. The time period is 1st January 2000 – 29th March 2002. To examine the stability of the results, we divide the data set into two sub-periods, where the first sub-period 3 The ISE National-30 index consists of 30 companies, but we remove 7 companies due to lack of data.
G Küçükkocaoğlu – Intra-Day Stock Returns and Close-End Price Manipulation in the Istanbul Stock Exchange – Frontiers in Finance and Economics – Vol. 5 No.1 – April 2008,
8
includes trading sessions prior to 13th August 2001, where the trading sessions were 10:00 a.m. to 12:00 a.m. for the first session, and 14:00 p.m. to 16:00 p.m. for the second session (399 Days). The second sub-period is the trading sessions after 13th August 2001 where the trading sessions are 9:30 a.m. to 12:00 a.m. for the first session, and 14:00 p.m. to 16:30 p.m. for the second session (155 Days).
2.3 Companies and Brokerage Houses Twenty-three stocks have been selected for the current study
from the ISE National-30 index companies listed in Istanbul Stock Exchange. The names of the companies are listed in Table 2, but the names of the brokerage houses have been kept confidential.
Table 2. Twenty-three stocks selected from the ISE National-30 index companies
ISE NATIONAL-30 INDEX COMPANIES SHARE CODE AKCANSA CIMENTO SANAYI VE TICARET A.S. AKCNS AKSIGORTA A.S. AKGRT ALARKO HOLDING A.S. ALARK ALCATEL TELETAS TELEKOM. END. TIC. A.S. ALCTL ARCELIK A.S. ARCLK BAGFAS BANDIRMA GUBRE FABRIKALARI A.S. BAGFS DOGAN SIRKETLER GRUBU HOLDING A.S. DOHOL ANADOLU EFES BIRACILIK VE MALT SANAYI A.S. EFES ENKA HOLDING YATIRIM A.S. ENKA EREGLI DEMIR VE CELIK FABRIKALARI T.A.S. EREGL FORD OTOMOTIV SANAYI A.S. FROTO HURRIYET GAZETECILIK VE MATBAACILIK A.S. HURGZ TURKIYE IS BANKASI A.S. ISCTR MIGROS TURK T.A.S. MIGRS NETAS NORTHERN ELECTRIC TELEKOM. A.S. NETAS PETKIM PETROKIMYA HOLDING A.S. PETKM PETROL OFISI A.S. PTOFS TURKIYE SISE VE CAM FABRIKALARI A.S. SISE TURK HAVA YOLLARI ANONIM ORTAKLIGI THYAO TANSAS PERAKENDE MAGAZACILIK TIC. A.S. TNSAS TUPRAS - TURKIYE PETROLLERI RAFINERILERI A.S. TUPRS VESTEL ELEKTRONIK SANAYI VE TICARET A.S. VESTL YAPI VE KREDI BANKASI A.S. YKBNK
G Küçükkocaoğlu – Intra-Day Stock Returns and Close-End Price Manipulation in the Istanbul Stock Exchange – Frontiers in Finance and Economics – Vol. 5 No.1 – April 2008,
9
3 - Intra-Day Patterns 3.1 Data Description In this section, we examine the intra-day patterns of the selected
stocks listed in the ISE. Before proceeding to the manipulation analysis, we observe the day-end returns of the selected companies. If these returns are large and positive (negative), we infer that traders who buy (sell) large sum of shares over the trading day may be attempting to influence the closing price.
All stock prices are the actual transaction values and their returns are computed as the percentage change in the value of a company over 15-minute intervals.
Re,t = (pricet+15 – pricet)/ pricet (1) Thus, stock returns for the trading sessions prior to 13th August
2001 are computed in the following order: 10:15 a.m., 10:30 a.m., 10:45 a.m., 11:00 a.m., 11:15 a.m., 11:30 a.m., 11:45 a.m., 12:00 a.m., 14:15 p.m., 14:30 p.m., 14:45 p.m., 15:00 p.m., 15:15 p.m., 15:30 p.m., 15:45 p.m., 16:00 p.m. The 15-minute interval data prior to August 13th, 2001 results in 16 return observations per day for each stock. All stock returns for the trading sessions after 13th August 2001 are computed in the following order: 9:45 a.m., 10:00 a.m., 10:15 a.m., 10:30 a.m., 10:45 a.m., 11:00 a.m., 11:15 a.m., 11:30 a.m., 11:45 a.m., 12:00 a.m., 14:15 p.m., 14:30 p.m., 14:45 p.m., 15:00 p.m., 15:15 p.m., 15:30 p.m., 15:45 p.m., 16:00 p.m. 16:15 p.m., 16:30 p.m. The 15-minute interval data after August 13th, 2001 results in 20 return observations per day for each stock.
We also compute close-to-open returns by using the prior day-end price of the company on price interval pricet with the first 15-minute interval of the current day’s price on price interval pricet+15.
3.2. Empirical Evidence In this section, we examine whether the return and standard
deviation patterns documented by Bildik (2001) exists in the individual stocks rather than the collective ISE National-100 index.
G Küçükkocaoğlu – Intra-Day Stock Returns and Close-End Price Manipulation in the Istanbul Stock Exchange – Frontiers in Finance and Economics – Vol. 5 No.1 – April 2008,
10
The following tables and figures set out the results of the analysis of return and standard deviation for the twenty-three stocks before and after the change in the trading hours and the trading method.
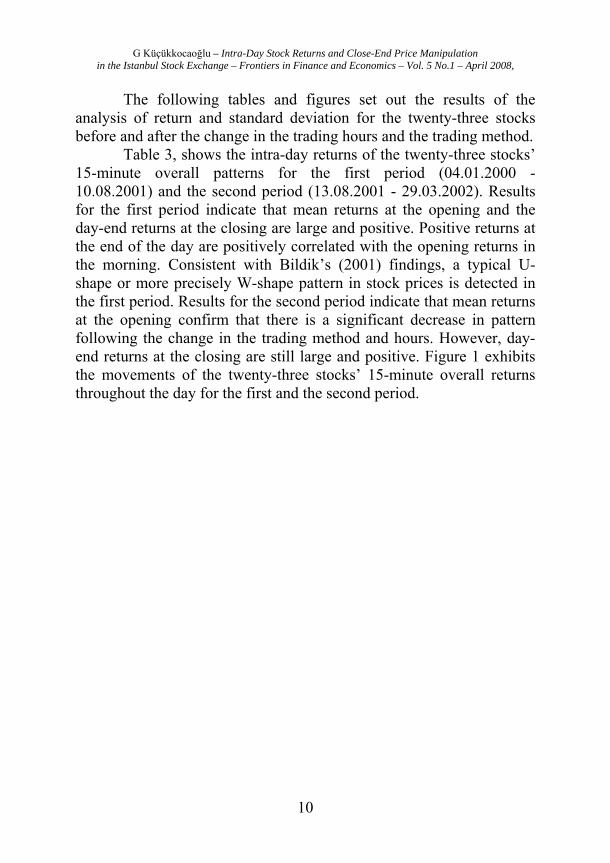
Table 3, shows the intra-day returns of the twenty-three stocks’ 15-minute overall patterns for the first period (04.01.2000 - 10.08.2001) and the second period (13.08.2001 - 29.03.2002). Results for the first period indicate that mean returns at the opening and the day-end returns at the closing are large and positive. Positive returns at the end of the day are positively correlated with the opening returns in the morning. Consistent with Bildik’s (2001) findings, a typical U-shape or more precisely W-shape pattern in stock prices is detected in the first period. Results for the second period indicate that mean returns at the opening confirm that there is a significant decrease in pattern following the change in the trading method and hours. However, day-end returns at the closing are still large and positive. Figure 1 exhibits the movements of the twenty-three stocks’ 15-minute overall returns throughout the day for the first and the second period.

G Küçükkocaoğlu – Intra-Day Stock Returns and Close-End Price Manipulation in the Istanbul Stock Exchange – Frontiers in Finance and Economics – Vol. 5 No.1 – April 2008,
11
Table 3 Intra-day Stock Returns for the First (04.01.2000 - 10.08.2001) and the Second (13.08.2001 - 29.03.2002) Period
Time First Period (04.01.2000 - 10.08.2001)
Second Period (13.08.2001 - 29.03.2002)
09:45 -0,00003 10:00 -0,00045 10:15 0,00119 -0,00130 10:30 -0,00014 -0,00063 10:45 -0,00039 -0,00006 11:00 -0,00045 0,00000 11:15 -0,00085 -0,00027 11:30 -0,00001 0,00045 11:45 -0,00087 0,00010 12:00 0,00010 0,00138 14:15 -0,00189 -0,00223 14:30 0,00034 -0,00012 14:45 -0,00038 -0,00018 15:00 -0,00001 0,00036 15:15 0,00035 -0,00008 15:30 -0,00019 0,00091 15:45 -0,00044 0,00127 16:00 0,00338 0,00006 16:15 -0,00082 16:30 0,00468
G Küçükkocaoğlu – Intra-Day Stock Returns and Close-End Price Manipulation in the Istanbul Stock Exchange – Frontiers in Finance and Economics – Vol. 5 No.1 – April 2008,
12
Figure 1 Intra-day Stock Returns for the First (04.01.2000 - 10.08.2001) and the Second (13.08.2001 - 29.03.2002) Period
Intra-Day Stock Returns (04.01.2000 - 10.08.2001) and (13.08.2001 - 29.3.2002)
-0,00300
-0,00200
-0,00100
0,00000
0,00100
0,00200
0,00300
0,00400
0,00500
0,0060009
:45
10:0
0
10:1
5
10:3
0
10:4
5
11:0
0
11:1
5
11:3
0
11:4
5
12:0
0
14:1
5
14:3
0
14:4
5
15:0
0
15:1
5
15:3
0
15:4
5
16:0
0
16:1
5
16:3
0
Time
Ret
urn
First Period (4.1.2000 - 10.8.2001) Second Period (13.8.2001 - 29.3.2002)
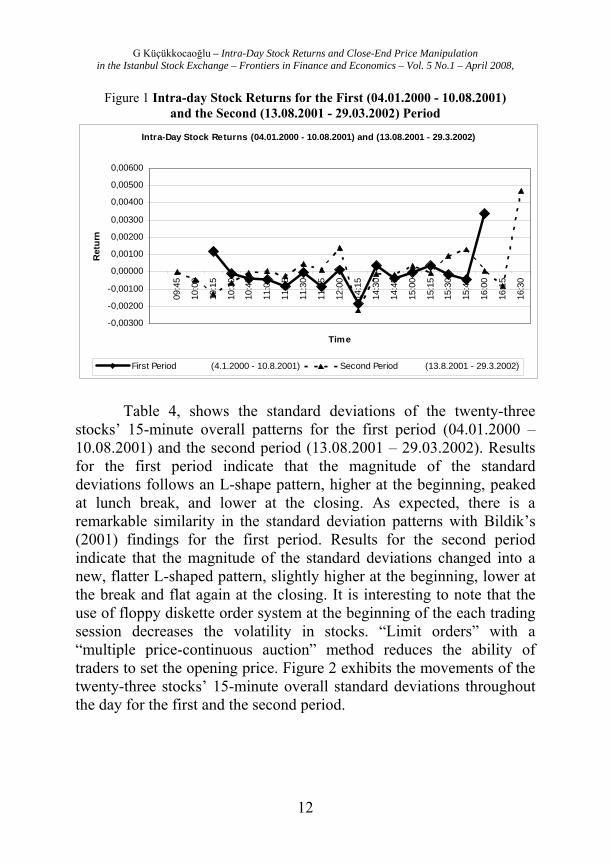
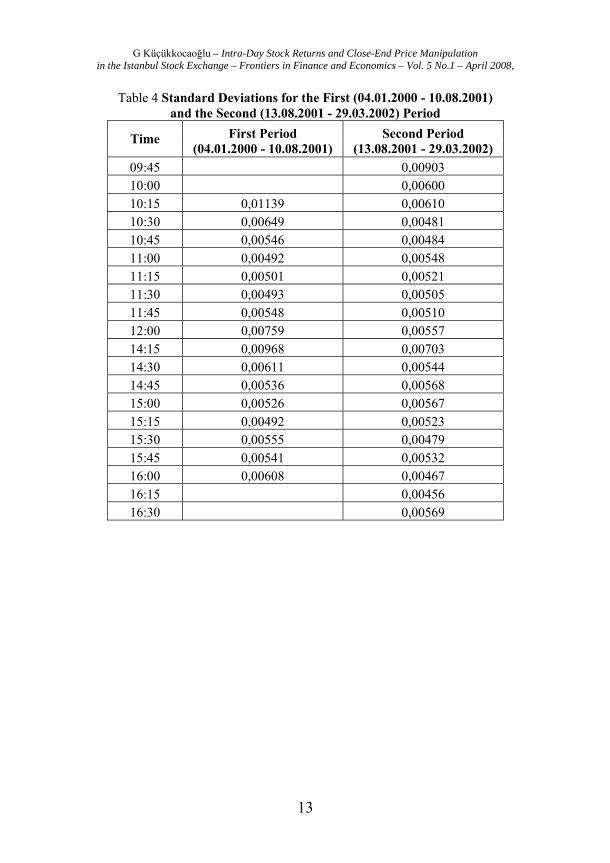
Table 4, shows the standard deviations of the twenty-three
stocks’ 15-minute overall patterns for the first period (04.01.2000 – 10.08.2001) and the second period (13.08.2001 – 29.03.2002). Results for the first period indicate that the magnitude of the standard deviations follows an L-shape pattern, higher at the beginning, peaked at lunch break, and lower at the closing. As expected, there is a remarkable similarity in the standard deviation patterns with Bildik’s (2001) findings for the first period. Results for the second period indicate that the magnitude of the standard deviations changed into a new, flatter L-shaped pattern, slightly higher at the beginning, lower at the break and flat again at the closing. It is interesting to note that the use of floppy diskette order system at the beginning of the each trading session decreases the volatility in stocks. “Limit orders” with a “multiple price-continuous auction” method reduces the ability of traders to set the opening price. Figure 2 exhibits the movements of the twenty-three stocks’ 15-minute overall standard deviations throughout the day for the first and the second period.
G Küçükkocaoğlu – Intra-Day Stock Returns and Close-End Price Manipulation in the Istanbul Stock Exchange – Frontiers in Finance and Economics – Vol. 5 No.1 – April 2008,
13
Table 4 Standard Deviations for the First (04.01.2000 - 10.08.2001) and the Second (13.08.2001 - 29.03.2002) Period
Time First Period (04.01.2000 - 10.08.2001)
Second Period (13.08.2001 - 29.03.2002)
09:45 0,00903 10:00 0,00600 10:15 0,01139 0,00610 10:30 0,00649 0,00481 10:45 0,00546 0,00484 11:00 0,00492 0,00548 11:15 0,00501 0,00521 11:30 0,00493 0,00505 11:45 0,00548 0,00510 12:00 0,00759 0,00557 14:15 0,00968 0,00703 14:30 0,00611 0,00544 14:45 0,00536 0,00568 15:00 0,00526 0,00567 15:15 0,00492 0,00523 15:30 0,00555 0,00479 15:45 0,00541 0,00532 16:00 0,00608 0,00467 16:15 0,00456 16:30 0,00569
G Küçükkocaoğlu – Intra-Day Stock Returns and Close-End Price Manipulation in the Istanbul Stock Exchange – Frontiers in Finance and Economics – Vol. 5 No.1 – April 2008,
14
Figure 2 Standard Deviations for the First (04.01.2000 - 10.08.2001) and the Second (13.08.2001 - 29.03.2002) Period
Standard Deviations (4.1.2000 - 10.8.2001) and (13.8.2001 - 29.3.2002)
0,00000
0,00200
0,00400
0,00600
0,00800
0,01000
0,01200
09:45
10:00
10:15
10:30
10:45
11:00
11:15
11:30
11:45
12:00
14:15
14:30
14:45
15:00
15:15
15:30
15:45
16:00
16:15
16:30
Time
Stan
dard
Dev
iatio
n
First Period (4.1.2000 - 10.8.2001) Second Period (13.8.2001 - 29.3.2002)
The new trading system at the ISE shows that the large and
positive day-end returns are corrected by the multiple price-continuous auction method at the opening transaction of the next trading day. Positive returns at the end of the day are still correlated but not highly with the opening returns in the morning. The magnitude of the standard deviations declined on average.
Before proceeding to the manipulation analysis, it is useful to establish that there is, in conjunction with Bildik’s (2001) findings, a U-shaped pattern of stock returns and L-shaped pattern of volatility observed in the selected stocks between January 4th, 2000 –August 10th, 2001. This was expected since the trading hours of the Bildik’s (2001) data were the same with our data prior to August 13th, 2001.
However, after the change in trading hours and system in August 13th, 2001, traders start sending their limit orders electronically via floppy diskettes into the continuous auction system at the beginning of the each trading session. The auction system automatically matches buy and sell orders on a price and time priority basis and decreases the power of traders influence on stock prices. Under this system the morning volatility peak in returns and standard deviation observed before August 13th, 2001 significantly decreased. Our final observation on intra-day patterns of stocks for both periods is, the day-end closing
G Küçükkocaoğlu – Intra-Day Stock Returns and Close-End Price Manipulation in the Istanbul Stock Exchange – Frontiers in Finance and Economics – Vol. 5 No.1 – April 2008,
15
returns are still large and positive. In the next section, we explore one of the causes of this systematic increase in closing prices. We try to answer whether these prices are artificially influenced by the activities of brokerage houses or the traders with large positions over the trading day.
4 - Close-End Price Manipulation Stock price manipulation associated with day-end returns is
studied by Felixson and Pelli (1999) in Helsinki Stock Exchange. Felixson and Pelli (1999) build a regression model to test for closing price manipulation by daily traders in the Finnish stock market. They examine whether closing prices are manipulated by these traders who buy (sell) large sum of shares throughout the trading day. Their results show that there is weak evidence that these traders manipulate closing prices. Using the insights developed in Felixson and Pelli (1999), we test whether the largest traders in the ISE manipulate close-end prices.
The intuition behind the big buyer (seller) to manipulate the closing price is to increase his overall wealth by the end of the day. If the big buyer (seller) decides to improve his daily performance he will try to move up (down) the closing to a higher (lower) level. However, he would try to do so if the expected cost of buying more shares at close is minimal (i.e., the benefits of manipulation outweigh the expected costs).
An example can be shown with real data from the ISE in Tables 5a and 5b. The stock price for Company A opens at 2,400 Turkish Lira (TL) when the trading starts at 09:30:00. At 09:34:31, Broker 1 makes the first trade of the day and buys 2 lots (1 Lot =1000 Shares) at 2,400 TL per share (Table 5a), then at 09:46:07, Broker 10 (or a trader acting through Broker 10), the big buyer of the day, makes his first buy and pays 2,375 TL per share, a total of 3,882,000 shares with a total market value of 9.219 Billion TL (Table 5a).
G Küçükkocaoğlu – Intra-Day Stock Returns and Close-End Price Manipulation in the Istanbul Stock Exchange – Frontiers in Finance and Economics – Vol. 5 No.1 – April 2008,
16
Table 5a. Time and Trade Log for Company A (1st Session) TIME PRICE LOT BUYER SELLER PRICE*LOT TOTAL VALUE
09:34:31 2400 2 BROKER 1 BROKER 2 4,800 4,800,000
09:35:35 2375 700 BROKER 1 BROKER 3 1,662,500 1,662,500,000
09:36:38 2400 53 BROKER 1 BROKER 2 127,200 127,200,000
09:37:44 2400 200 BROKER 4 BROKER 2 480,000 480,000,000
09:37:54 2375 42 BROKER 1 BROKER 5 99,750 99,750,000
09:43:58 2400 25 BROKER 1 BROKER 2 60,000 60,000,000
09:45:05 2375 1500 BROKER 1 BROKER 4 3,562,500 3,562,500,000
09:45:37 2400 25 BROKER 1 BROKER 2 60,000 60,000,000
09:45:53 2375 65 BROKER 8 BROKER 1 154,375 154,375,000
09:45:53 2375 66 BROKER 1 BROKER 1 156,750 156,750,000
09:46:06 2375 500 BROKER 8 BROKER 4 1,187,500 1,187,500,000
09:46:07 2375 3882 BROKER 10 BROKER 1 9,219,750 9,219,750,000
In the 1st session, Broker 10 makes most of his buys between
09:46:40 to 10:32:42 and paid an average price of 2,386 TL per share (Figure 3). In the 2nd session, he makes most of his buys between 15:47:25 to 16:14:43 and paid an average price of 2,500 TL per share (Figure 3).
Figure 3 Trading times and prices of Broker 10
2300
2350
2400
2450
2500
2550
09:46
:07
09:46
:40
09:46
:40
09:46
:40
09:46
:40
10:07
:48
10:08
:50
10:09
:30
10:12
:12
10:15
:06
10:17
:13
10:32
:42
11:55
:12
14:40
:49
15:49
:42
15:51
:57
16:14
:43
16:14
:43
16:29
:59
Time
Pric
e
G Küçükkocaoğlu – Intra-Day Stock Returns and Close-End Price Manipulation in the Istanbul Stock Exchange – Frontiers in Finance and Economics – Vol. 5 No.1 – April 2008,
17
At 16:15:00, fifteen minutes before the official close and right before he starts to manipulate the closing price, he has bought a total of 161,601 lots and paid an average price of 2,417 TL with a total value 395.348 Billion TL. His shares’ total market value with a market price of 2,500 TL is 404.003 Billion TL. If the session closes with this price, he could be better off than with an average price of 2,417 TL, and could make a profit of 404.003 – 395.348 = 8.655 Billion TL, but right before the official close he makes his last move to set the closing price to a higher level. He puts a buy order at 16:29:31 and has bought 300 lots at a price of 2,500 (Table 5b), then at 16:29:34 he has bought another 300 lots at a price of 2,525 TL (this price could make him better off than the 2,500 TL per share price), but 1 second before close Broker 16 places 4,590 lots to sell at 2,500 TL and moves down the price from 2,525 TL, in any order Broker 10, who is eager to close the official price at 2,525 TL buys all the shares and empties the sell orders of Broker 16, and Broker 74 at 2,500 TL, and makes the last buy at 2,525 TL from Broker 25. Only 1 lot would be enough for him to close the stock price at 2,525 TL (Table 5b).
At close (16:30:00), Broker 10 has accumulated a total of 166,793 lots and paid a total market value of 408.335 Billion TL, the average price for the shares he has bought over the trading day is 2,422 TL. But now, the official closing price is 2,525 TL and at this price his shares’ total market value is 421.153 Billion TL. By setting the closing price at 2,525 TL, he has gained 421.153 – 408.335 = 12.818 Billion TL, which is 4.163 Billion TL higher than the 16:15:00’s accumulated profit of 8.655 Billion TL. If the price were to close at 2,500 TL and if he does not make the buys after 16:15:00, he could end up with a profit of 8.655 Billion TL, but now at 16:30:00, after setting the closing price at 2,525 TL, his total wealth is equal to 421.153 Billion TL with a total profit of 12.818 Billion TL.
G Küçükkocaoğlu – Intra-Day Stock Returns and Close-End Price Manipulation in the Istanbul Stock Exchange – Frontiers in Finance and Economics – Vol. 5 No.1 – April 2008,
18
Table 5b Time and Trade Log for Company A (2nd Session) TIME PRICE LOT BUYER SELLER PRICE*LOT TOTAL VALUE
16:29:31 2500 300 BROKER 10 BROKER 29 750,000 750,000,000
16:29:34 2525 300 BROKER 10 BROKER 4 757,500 757,500,000
16:29:59 2525 5000 BROKER 6 BROKER 25 12,625,000 12,625,000,000
16:29:59 2525 5000 BROKER 6 BROKER 25 12,625,000 12,625,000,000
16:29:59 2525 658 BROKER 6 BROKER 25 1,661,450 1,661,450,000
16:29:59 2500 4590 BROKER 10 BROKER 16 11,475,000 11,475,000,000
16:29:59 2500 1 BROKER 10 BROKER 74 2,500 2,500,000
16:29:59 2525 1 BROKER 10 BROKER 25 2,525 2,525,000
Broker 10’s attempt to manipulate the closing price succeeded
at close but this price could not hold for a long time. According to Fischel and Ross (1991) any manipulation attempt by traders can not succeed by making trades unless they use false statements and/or fictitious trades.
5 - Model and Results
5.1 Model The model we use in this study is a replication of the Felixson
and Pelli’s (1999) first model. When they build their model: 1) They use two different sets of variables to measure the buyer
and the seller side of manipulation. Returni,close-t = Normal Returni, close-t ± Manipulation Effecti,close-t + ei, close-t (2) The big buyer and the big seller of the trading day could be on
the manipulator side in this equation, where the buyer will try to influence the closing price by adding extra return to the normal return, and the seller will try to influence the closing price by decreasing the normal return. They will more likely attempt to change the closing price in the last 15-minutes of the trading day. We assume that these traders have no insider information.
2) If the buyer’s (seller’s) attempt to manipulate the closing price succeeds by increasing (decreasing) the price to a desired level, he will have no incentive to keep it at that level. The artificial price at the
G Küçükkocaoğlu – Intra-Day Stock Returns and Close-End Price Manipulation in the Istanbul Stock Exchange – Frontiers in Finance and Economics – Vol. 5 No.1 – April 2008,
19
close will return to its true market value after the close, which will likely happen in the first 15-minutes of the next trading day.
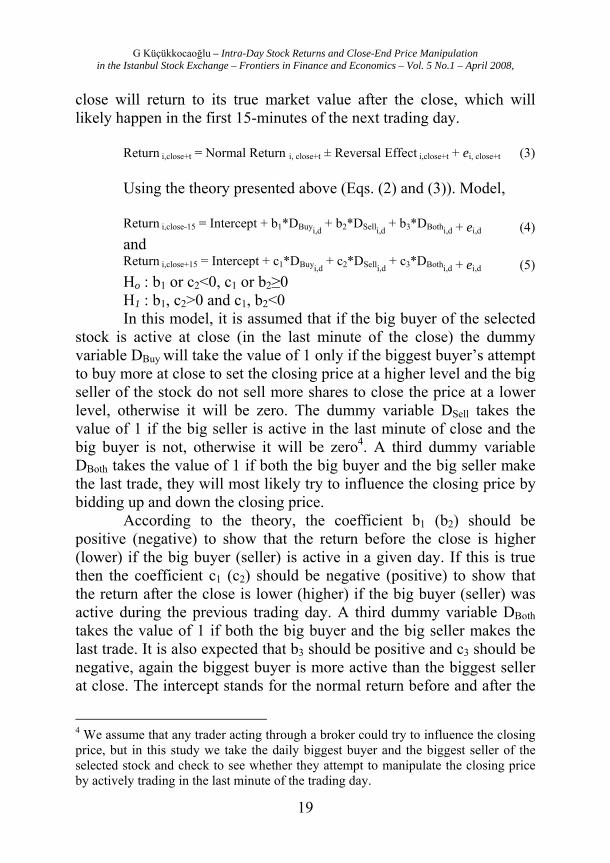
Return i,close+t = Normal Return i, close+t ± Reversal Effect i,close+t + ei, close+t (3) Using the theory presented above (Eqs. (2) and (3)). Model, Return i,close-15 = Intercept + b1*DBuyi,d
+ b2*DSelli,d + b3*DBothi,d + ei,d (4)
and Return i,close+15 = Intercept + c1*DBuyi,d
+ c2*DSelli,d + c3*DBothi,d + ei,d (5)
Ho : b1 or c2<0, c1 or b2≥0 H1 : b1, c2>0 and c1, b2<0 In this model, it is assumed that if the big buyer of the selected
stock is active at close (in the last minute of the close) the dummy variable DBuy will take the value of 1 only if the biggest buyer’s attempt to buy more at close to set the closing price at a higher level and the big seller of the stock do not sell more shares to close the price at a lower level, otherwise it will be zero. The dummy variable DSell takes the value of 1 if the big seller is active in the last minute of close and the big buyer is not, otherwise it will be zero4. A third dummy variable DBoth takes the value of 1 if both the big buyer and the big seller make the last trade, they will most likely try to influence the closing price by bidding up and down the closing price.
According to the theory, the coefficient b1 (b2) should be positive (negative) to show that the return before the close is higher (lower) if the big buyer (seller) is active in a given day. If this is true then the coefficient c1 (c2) should be negative (positive) to show that the return after the close is lower (higher) if the big buyer (seller) was active during the previous trading day. A third dummy variable DBoth takes the value of 1 if both the big buyer and the big seller makes the last trade. It is also expected that b3 should be positive and c3 should be negative, again the biggest buyer is more active than the biggest seller at close. The intercept stands for the normal return before and after the
4 We assume that any trader acting through a broker could try to influence the closing price, but in this study we take the daily biggest buyer and the biggest seller of the selected stock and check to see whether they attempt to manipulate the closing price by actively trading in the last minute of the trading day.
G Küçükkocaoğlu – Intra-Day Stock Returns and Close-End Price Manipulation in the Istanbul Stock Exchange – Frontiers in Finance and Economics – Vol. 5 No.1 – April 2008,
20
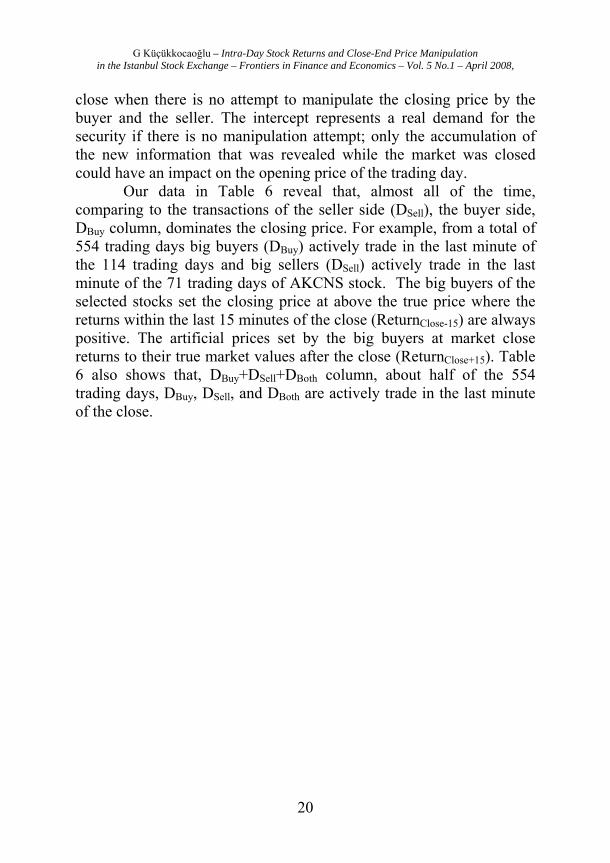
close when there is no attempt to manipulate the closing price by the buyer and the seller. The intercept represents a real demand for the security if there is no manipulation attempt; only the accumulation of the new information that was revealed while the market was closed could have an impact on the opening price of the trading day.
Our data in Table 6 reveal that, almost all of the time, comparing to the transactions of the seller side (DSell), the buyer side, DBuy column, dominates the closing price. For example, from a total of 554 trading days big buyers (DBuy) actively trade in the last minute of the 114 trading days and big sellers (DSell) actively trade in the last minute of the 71 trading days of AKCNS stock. The big buyers of the selected stocks set the closing price at above the true price where the returns within the last 15 minutes of the close (ReturnClose-15) are always positive. The artificial prices set by the big buyers at market close returns to their true market values after the close (ReturnClose+15). Table 6 also shows that, DBuy+DSell+DBoth column, about half of the 554 trading days, DBuy, DSell, and DBoth are actively trade in the last minute of the close.
G Küçükkocaoğlu – Intra-Day Stock Returns and Close-End Price Manipulation in the Istanbul Stock Exchange – Frontiers in Finance and Economics – Vol. 5 No.1 – April 2008,
21
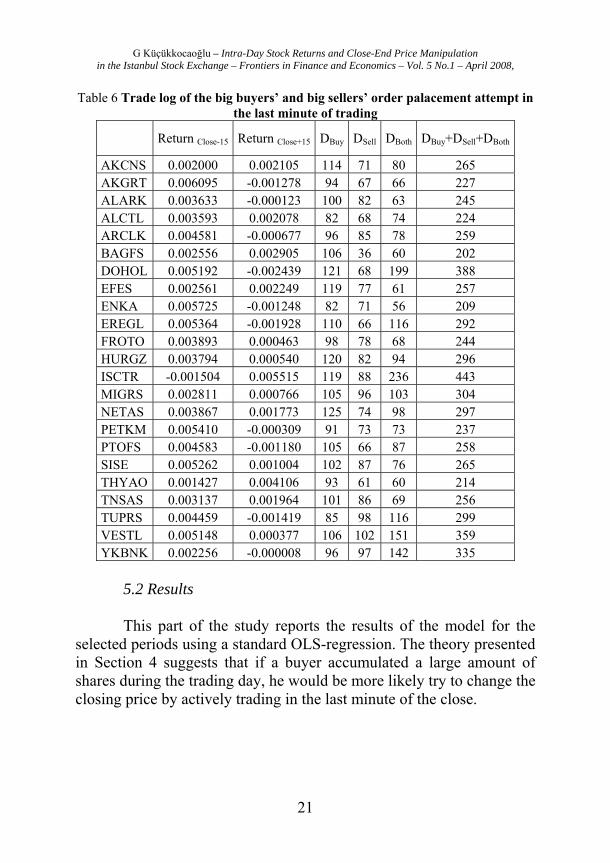
Table 6 Trade log of the big buyers’ and big sellers’ order palacement attempt in the last minute of trading
Return Close-15 Return Close+15 DBuy DSell DBoth DBuy+DSell+DBoth
AKCNS 0.002000 0.002105 114 71 80 265 AKGRT 0.006095 -0.001278 94 67 66 227 ALARK 0.003633 -0.000123 100 82 63 245 ALCTL 0.003593 0.002078 82 68 74 224 ARCLK 0.004581 -0.000677 96 85 78 259 BAGFS 0.002556 0.002905 106 36 60 202 DOHOL 0.005192 -0.002439 121 68 199 388 EFES 0.002561 0.002249 119 77 61 257 ENKA 0.005725 -0.001248 82 71 56 209 EREGL 0.005364 -0.001928 110 66 116 292 FROTO 0.003893 0.000463 98 78 68 244 HURGZ 0.003794 0.000540 120 82 94 296 ISCTR -0.001504 0.005515 119 88 236 443 MIGRS 0.002811 0.000766 105 96 103 304 NETAS 0.003867 0.001773 125 74 98 297 PETKM 0.005410 -0.000309 91 73 73 237 PTOFS 0.004583 -0.001180 105 66 87 258 SISE 0.005262 0.001004 102 87 76 265 THYAO 0.001427 0.004106 93 61 60 214 TNSAS 0.003137 0.001964 101 86 69 256 TUPRS 0.004459 -0.001419 85 98 116 299 VESTL 0.005148 0.000377 106 102 151 359 YKBNK 0.002256 -0.000008 96 97 142 335
5.2 Results This part of the study reports the results of the model for the
selected periods using a standard OLS-regression. The theory presented in Section 4 suggests that if a buyer accumulated a large amount of shares during the trading day, he would be more likely try to change the closing price by actively trading in the last minute of the close.
G Küçükkocaoğlu – Intra-Day Stock Returns and Close-End Price Manipulation in the Istanbul Stock Exchange – Frontiers in Finance and Economics – Vol. 5 No.1 – April 2008,
22
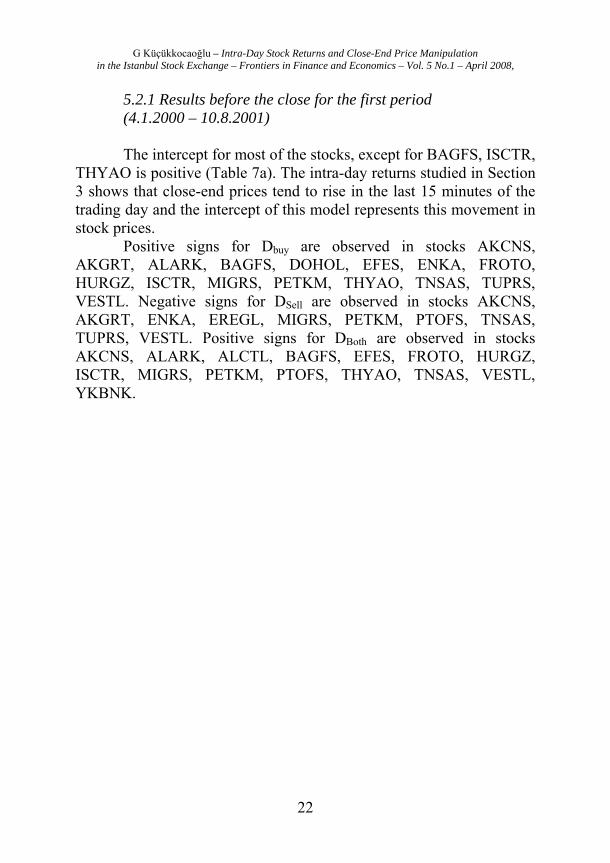
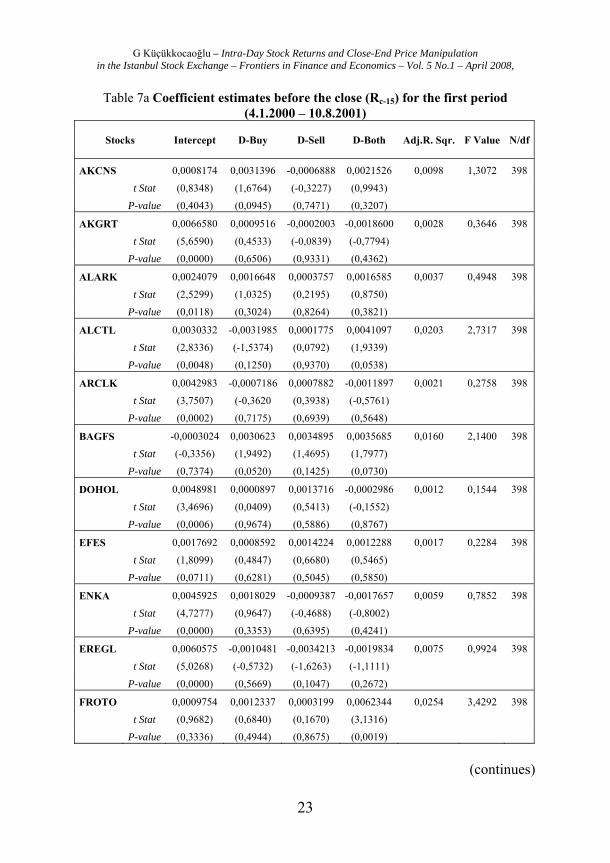
5.2.1 Results before the close for the first period (4.1.2000 – 10.8.2001) The intercept for most of the stocks, except for BAGFS, ISCTR,
THYAO is positive (Table 7a). The intra-day returns studied in Section 3 shows that close-end prices tend to rise in the last 15 minutes of the trading day and the intercept of this model represents this movement in stock prices.
Positive signs for Dbuy are observed in stocks AKCNS, AKGRT, ALARK, BAGFS, DOHOL, EFES, ENKA, FROTO, HURGZ, ISCTR, MIGRS, PETKM, THYAO, TNSAS, TUPRS, VESTL. Negative signs for DSell are observed in stocks AKCNS, AKGRT, ENKA, EREGL, MIGRS, PETKM, PTOFS, TNSAS, TUPRS, VESTL. Positive signs for DBoth are observed in stocks AKCNS, ALARK, ALCTL, BAGFS, EFES, FROTO, HURGZ, ISCTR, MIGRS, PETKM, PTOFS, THYAO, TNSAS, VESTL, YKBNK.
G Küçükkocaoğlu – Intra-Day Stock Returns and Close-End Price Manipulation in the Istanbul Stock Exchange – Frontiers in Finance and Economics – Vol. 5 No.1 – April 2008,
23
Table 7a Coefficient estimates before the close (Rc-15) for the first period (4.1.2000 – 10.8.2001)
Stocks Intercept D-Buy D-Sell D-Both Adj.R. Sqr. F Value N/df
AKCNS 0,0008174 0,0031396 -0,0006888 0,0021526 0,0098 1,3072 398
t Stat (0,8348) (1,6764) (-0,3227) (0,9943)
P-value (0,4043) (0,0945) (0,7471) (0,3207)
AKGRT 0,0066580 0,0009516 -0,0002003 -0,0018600 0,0028 0,3646 398
t Stat (5,6590) (0,4533) (-0,0839) (-0,7794)
P-value (0,0000) (0,6506) (0,9331) (0,4362)
ALARK 0,0024079 0,0016648 0,0003757 0,0016585 0,0037 0,4948 398
t Stat (2,5299) (1,0325) (0,2195) (0,8750)
P-value (0,0118) (0,3024) (0,8264) (0,3821)
ALCTL 0,0030332 -0,0031985 0,0001775 0,0041097 0,0203 2,7317 398
t Stat (2,8336) (-1,5374) (0,0792) (1,9339)
P-value (0,0048) (0,1250) (0,9370) (0,0538)
ARCLK 0,0042983 -0,0007186 0,0007882 -0,0011897 0,0021 0,2758 398
t Stat (3,7507) (-0,3620 (0,3938) (-0,5761)
P-value (0,0002) (0,7175) (0,6939) (0,5648)
BAGFS -0,0003024 0,0030623 0,0034895 0,0035685 0,0160 2,1400 398
t Stat (-0,3356) (1,9492) (1,4695) (1,7977)
P-value (0,7374) (0,0520) (0,1425) (0,0730)
DOHOL 0,0048981 0,0000897 0,0013716 -0,0002986 0,0012 0,1544 398
t Stat (3,4696) (0,0409) (0,5413) (-0,1552)
P-value (0,0006) (0,9674) (0,5886) (0,8767)
EFES 0,0017692 0,0008592 0,0014224 0,0012288 0,0017 0,2284 398
t Stat (1,8099) (0,4847) (0,6680) (0,5465)
P-value (0,0711) (0,6281) (0,5045) (0,5850)
ENKA 0,0045925 0,0018029 -0,0009387 -0,0017657 0,0059 0,7852 398
t Stat (4,7277) (0,9647) (-0,4688) (-0,8002)
P-value (0,0000) (0,3353) (0,6395) (0,4241)
EREGL 0,0060575 -0,0010481 -0,0034213 -0,0019834 0,0075 0,9924 398
t Stat (5,0268) (-0,5732) (-1,6263) (-1,1111)
P-value (0,0000) (0,5669) (0,1047) (0,2672)
FROTO 0,0009754 0,0012337 0,0003199 0,0062344 0,0254 3,4292 398
t Stat (0,9682) (0,6840) (0,1670) (3,1316)
P-value (0,3336) (0,4944) (0,8675) (0,0019)
(continues)
G Küçükkocaoğlu – Intra-Day Stock Returns and Close-End Price Manipulation in the Istanbul Stock Exchange – Frontiers in Finance and Economics – Vol. 5 No.1 – April 2008,
24
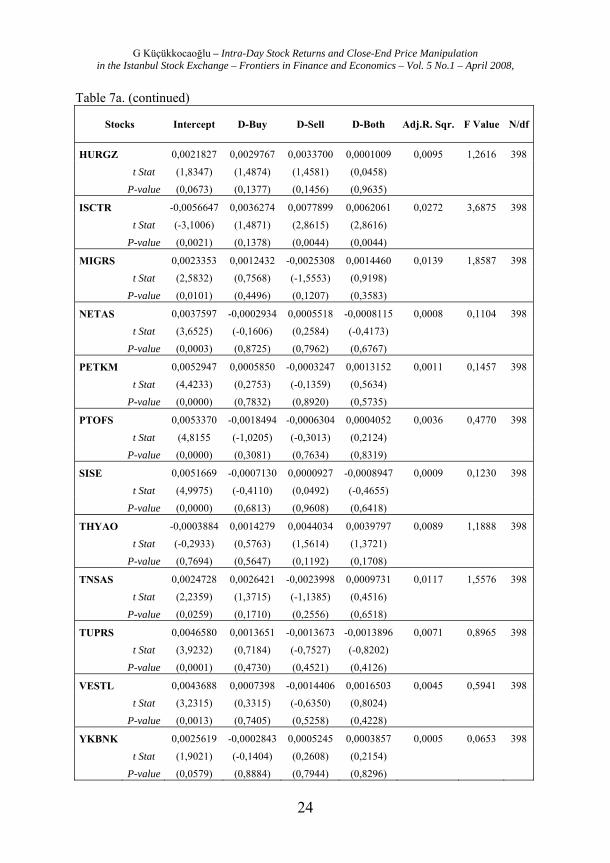
Table 7a. (continued)
Stocks Intercept D-Buy D-Sell D-Both Adj.R. Sqr. F Value N/df
HURGZ 0,0021827 0,0029767 0,0033700 0,0001009 0,0095 1,2616 398
t Stat (1,8347) (1,4874) (1,4581) (0,0458)
P-value (0,0673) (0,1377) (0,1456) (0,9635)
ISCTR -0,0056647 0,0036274 0,0077899 0,0062061 0,0272 3,6875 398
t Stat (-3,1006) (1,4871) (2,8615) (2,8616)
P-value (0,0021) (0,1378) (0,0044) (0,0044)
MIGRS 0,0023353 0,0012432 -0,0025308 0,0014460 0,0139 1,8587 398
t Stat (2,5832) (0,7568) (-1,5553) (0,9198)
P-value (0,0101) (0,4496) (0,1207) (0,3583)
NETAS 0,0037597 -0,0002934 0,0005518 -0,0008115 0,0008 0,1104 398
t Stat (3,6525) (-0,1606) (0,2584) (-0,4173)
P-value (0,0003) (0,8725) (0,7962) (0,6767)
PETKM 0,0052947 0,0005850 -0,0003247 0,0013152 0,0011 0,1457 398
t Stat (4,4233) (0,2753) (-0,1359) (0,5634)
P-value (0,0000) (0,7832) (0,8920) (0,5735)
PTOFS 0,0053370 -0,0018494 -0,0006304 0,0004052 0,0036 0,4770 398
t Stat (4,8155 (-1,0205) (-0,3013) (0,2124)
P-value (0,0000) (0,3081) (0,7634) (0,8319)
SISE 0,0051669 -0,0007130 0,0000927 -0,0008947 0,0009 0,1230 398
t Stat (4,9975) (-0,4110) (0,0492) (-0,4655)
P-value (0,0000) (0,6813) (0,9608) (0,6418)
THYAO -0,0003884 0,0014279 0,0044034 0,0039797 0,0089 1,1888 398
t Stat (-0,2933) (0,5763) (1,5614) (1,3721)
P-value (0,7694) (0,5647) (0,1192) (0,1708)
TNSAS 0,0024728 0,0026421 -0,0023998 0,0009731 0,0117 1,5576 398
t Stat (2,2359) (1,3715) (-1,1385) (0,4516)
P-value (0,0259) (0,1710) (0,2556) (0,6518)
TUPRS 0,0046580 0,0013651 -0,0013673 -0,0013896 0,0071 0,8965 398
t Stat (3,9232) (0,7184) (-0,7527) (-0,8202)
P-value (0,0001) (0,4730) (0,4521) (0,4126)
VESTL 0,0043688 0,0007398 -0,0014406 0,0016503 0,0045 0,5941 398
t Stat (3,2315) (0,3315) (-0,6350) (0,8024)
P-value (0,0013) (0,7405) (0,5258) (0,4228)
YKBNK 0,0025619 -0,0002843 0,0005245 0,0003857 0,0005 0,0653 398
t Stat (1,9021) (-0,1404) (0,2608) (0,2154)
P-value (0,0579) (0,8884) (0,7944) (0,8296)
G Küçükkocaoğlu – Intra-Day Stock Returns and Close-End Price Manipulation in the Istanbul Stock Exchange – Frontiers in Finance and Economics – Vol. 5 No.1 – April 2008,
25
a The null hypothesis can not be rejected at α= %5 significance level. T-stats and P-values are reported under the coefficient estimates in paranthesis. Also reported are the adjusted R-square, the F-statistics, the number of observations and the degrees of freedom.
5.2.2 Results after the close for the first period (4.1.2000 – 10.8.2001) The intercept of the stocks after the close is expected to be
negative for the model presented in Equation 5, however large and positive returns at the first 15 minutes of the next trading day opening observed in Section 3 change these expected negative signs into positive signs (Table 7b).
Stocks that have positive coefficients for Dbuy at Rc-15 should have negative coefficients at Rc+15. We find this in stocks AKCNS, AKGRT, ALARK, BAGFS, ENKA, HURGZ, ISCTR, PETKM, TNSAS, TUPRS, VESTL. Negative signs of Dsell observed in stocks at Rc-15 is expected to be positive at Rc+15. Change in signs is observed in stocks AKCNS, EREGL, MIGRS, PETKM, PTOFS, TNSAS, TUPRS. Positive signs of Dboth observed in stocks at Rc-15 is expected to be negative at Rc+15. Change in signs is observed in stocks AKCNS, BAGFS, FROTO, HURGZ, ISCTR, MIGRS, PETKM, PTOFS, THYAO, VESTL, YKBNK.
G Küçükkocaoğlu – Intra-Day Stock Returns and Close-End Price Manipulation in the Istanbul Stock Exchange – Frontiers in Finance and Economics – Vol. 5 No.1 – April 2008,
26
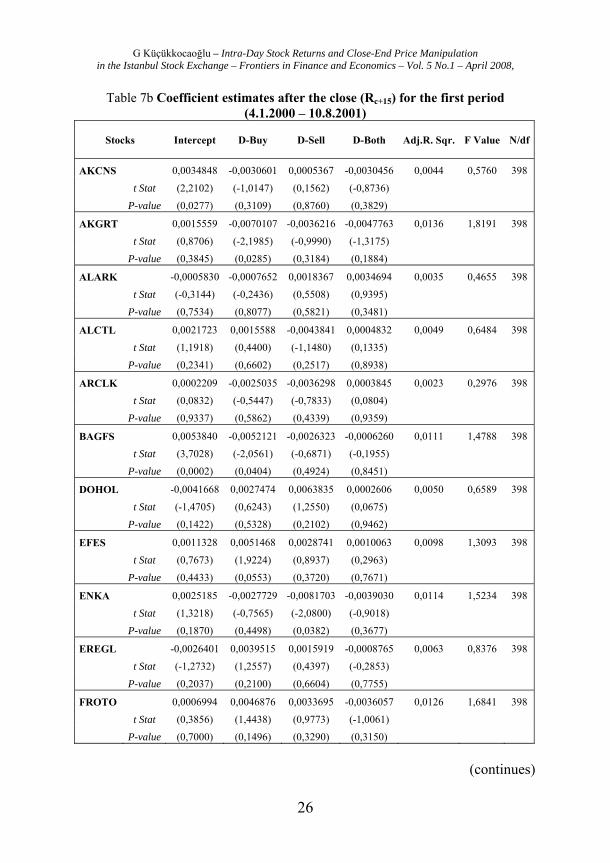
Table 7b Coefficient estimates after the close (Rc+15) for the first period (4.1.2000 – 10.8.2001)
Stocks Intercept D-Buy D-Sell D-Both Adj.R. Sqr. F Value N/df
AKCNS 0,0034848 -0,0030601 0,0005367 -0,0030456 0,0044 0,5760 398
t Stat (2,2102) (-1,0147) (0,1562) (-0,8736)
P-value (0,0277) (0,3109) (0,8760) (0,3829)
AKGRT 0,0015559 -0,0070107 -0,0036216 -0,0047763 0,0136 1,8191 398
t Stat (0,8706) (-2,1985) (-0,9990) (-1,3175)
P-value (0,3845) (0,0285) (0,3184) (0,1884)
ALARK -0,0005830 -0,0007652 0,0018367 0,0034694 0,0035 0,4655 398
t Stat (-0,3144) (-0,2436) (0,5508) (0,9395)
P-value (0,7534) (0,8077) (0,5821) (0,3481)
ALCTL 0,0021723 0,0015588 -0,0043841 0,0004832 0,0049 0,6484 398
t Stat (1,1918) (0,4400) (-1,1480) (0,1335)
P-value (0,2341) (0,6602) (0,2517) (0,8938)
ARCLK 0,0002209 -0,0025035 -0,0036298 0,0003845 0,0023 0,2976 398
t Stat (0,0832) (-0,5447) (-0,7833) (0,0804)
P-value (0,9337) (0,5862) (0,4339) (0,9359)
BAGFS 0,0053840 -0,0052121 -0,0026323 -0,0006260 0,0111 1,4788 398
t Stat (3,7028) (-2,0561) (-0,6871) (-0,1955)
P-value (0,0002) (0,0404) (0,4924) (0,8451)
DOHOL -0,0041668 0,0027474 0,0063835 0,0002606 0,0050 0,6589 398
t Stat (-1,4705) (0,6243) (1,2550) (0,0675)
P-value (0,1422) (0,5328) (0,2102) (0,9462)
EFES 0,0011328 0,0051468 0,0028741 0,0010063 0,0098 1,3093 398
t Stat (0,7673) (1,9224) (0,8937) (0,2963)
P-value (0,4433) (0,0553) (0,3720) (0,7671)
ENKA 0,0025185 -0,0027729 -0,0081703 -0,0039030 0,0114 1,5234 398
t Stat (1,3218) (-0,7565) (-2,0800) (-0,9018)
P-value (0,1870) (0,4498) (0,0382) (0,3677)
EREGL -0,0026401 0,0039515 0,0015919 -0,0008765 0,0063 0,8376 398
t Stat (-1,2732) (1,2557) (0,4397) (-0,2853)
P-value (0,2037) (0,2100) (0,6604) (0,7755)
FROTO 0,0006994 0,0046876 0,0033695 -0,0036057 0,0126 1,6841 398
t Stat (0,3856) (1,4438) (0,9773) (-1,0061)
P-value (0,7000) (0,1496) (0,3290) (0,3150)
(continues)

G Küçükkocaoğlu – Intra-Day Stock Returns and Close-End Price Manipulation in the Istanbul Stock Exchange – Frontiers in Finance and Economics – Vol. 5 No.1 – April 2008,
27
Table 7b. (continued)
Stocks Intercept D-Buy D-Sell D-Both Adj.R. Sqr. F Value N/df
HURGZ 0,0004986 -0,0016813 0,0025274 -0,0000519 0,0021 0,2755 398
t Stat (0,2311) (-0,4632) (0,6029) (-0,0130)
P-value (0,8174) (0,6435) (0,5469) (0,9896)
ISCTR 0,0073023 -0,0010291 -0,0081328 -0,0018386 0,0075 0,9995 398
t Stat (2,1151) (-0,2233) (-1,5809) (-0,4486)
P-value (0,0350) (0,8234) (0,1147) (0,6539)
MIGRS 0,0001388 0,0037862 0,0020458 -0,0005977 0,0016 0,2099 398
t Stat (0,0445) (0,6685) (0,3646) (-0,1103)
P-value (0,9645) (0,5042) (0,7156) (0,9123)
NETAS 0,0030764 -0,0030335 -0,0014501 -0,0002909 0,0021 0,2810 398
t Stat (1,5885) (-0,8824) (-0,3609) (-0,0795)
P-value (0,1130) (0,3781) (0,7184) (0,9367)
PETKM 0,0003410 -0,0024120 0,0007130 -0,0029719 0,0026 0,3419 398
t Stat (0,1670) (-0,6655) (0,1750) (-0,7464)
P-value (0,8675) (0,5061) (0,8612) (0,4559)
PTOFS -0,0021814 0,0015531 0,0019877 -0,0018206 0,0029 0,3868 398
t Stat (-1,1165) (0,4862) (0,5389) (-0,5414)
P-value (0,2649) (0,6271) (0,5903) (0,5886)
SISE -0,0001080 0,0003576 0,0065225 0,0048665 0,0095 1,2604 398
t Stat (-0,0500) (0,0987) (1,6579) (1,2123)
P-value (0,9601) (0,9214) (0,0981) (0,2261)
THYAO 0,0035609 0,0029087 0,0052921 -0,0016637 0,0053 0,6982 398
t Stat (1,6721) (0,7301) (1,1670) (-0,3567)
P-value (0,0953) (0,4658) (0,2439) (0,7215)
TNSAS 0,0019742 -0,0012939 0,0010316 0,0005945 0,0007 0,0933 398
t Stat (0,8980) (-0,3379) (0,2462) (0,1388)
P-value (0,3698) (0,7356) (0,8056) (0,8897)
TUPRS -0,0029402 -0,0029880 0,0039802 0,0029176 0,0086 1,0883 398
t Stat (-1,1518) (-0,7313) (1,0190) (0,8010)
P-value (0,2501) (0,4650) (0,3088) (0,4237)
VESTL 0,0027876 -0,0032909 -0,0003247 -0,0040194 0,0047 0,6168 398
t Stat (1,2320) (-0,8811) (-0,0855) (-1,1677)
P-value (0,2187) (0,3788) (0,9319) (0,2436)
YKBNK 0,0001969 -0,0048000 0,0020298 -0,0012357 0,0049 0,6535 398
t Stat (0,0617) (-0,9997) (0,4256) (-0,2910)
P-value (0,9509) (0,3181) (0,6706) (0,7712)
G Küçükkocaoğlu – Intra-Day Stock Returns and Close-End Price Manipulation in the Istanbul Stock Exchange – Frontiers in Finance and Economics – Vol. 5 No.1 – April 2008,
28
a The null hypothesis can not be rejected at α= %5 significance level. T-stats and P-values are reported under the coefficient estimates in paranthesis. Also reported are the adjusted R-square, the F-statistics, the number of observations and the degrees of freedom.
Consistent with Felixson and Pelli (1999) the power of the
model for the first period is null, low adjusted R-square, low F-values and high P-values are observed in this period.
However, using the coefficients of the variables for some stocks presented in Tables 7a and 7b, we can comment on possible indications of close-end price manipulation. Expected positive signs of Dbuy before the close and negative signs of Dbuy after the close, expected negative signs of Dsell before the close and positive signs of Dsell after the close, expected positive signs of Dboth before the close and negative signs of Dboth after the close largely observed in the ISE National-30 Index Stocks.
We assume that, using the signs of the coefficients of the variables, close-end prices of the selected stocks are manipulated in the ISE between 4.1.2000 – 10.8.2001 and mostly by the largest buyers.
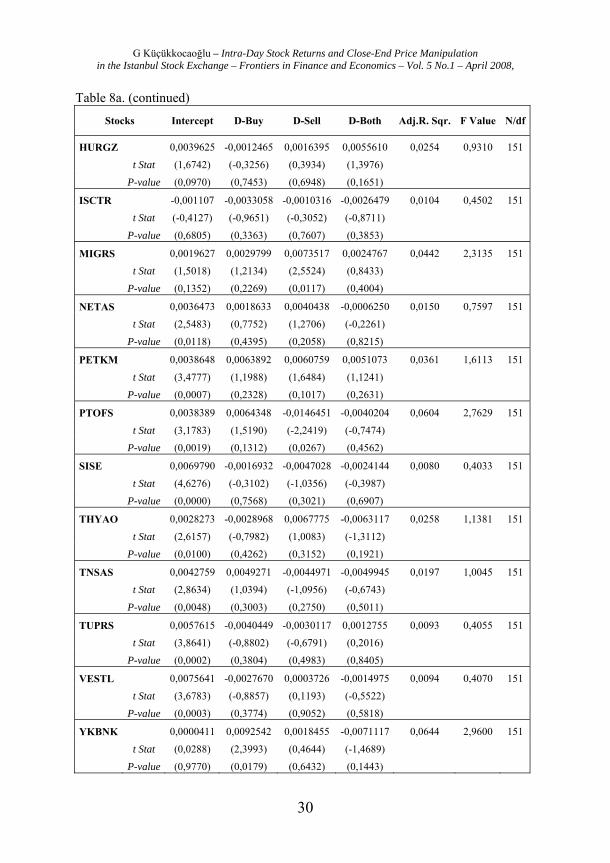
5.2.3 Results before the close for the second period (13.8.2001 – 29.3.2002) These results appear in Table 8a. The intercept for most of the
stocks, except for ISCTR, is positive. The intra-day returns studied in Section 3 shows that close-end prices tend to rise in the last 15 minutes of the trading day and the intercept of this model represents this movement in stock prices.
Positive signs Dbuy is observed in stocks AKCNS, ALARK, DOHOL, EFES, FROTO, MIGRS, NETAS, PETKM, PTOFS, TNSAS, YKBNK. Negative signs of DSell is observed in stocks AKCNS, ALCTL, ARCLK, BAGFS, EFES, ENKA, EREGL, FROTO, ISCTR, PTOFS, SISE, TNSAS, TUPRS. Positive signs of DBoth is observed in stocks AKCNS, AKGRT, ARCLK, DOHOL, EREGL, HURGZ, MIGRS, PETKM, TUPRS.

G Küçükkocaoğlu – Intra-Day Stock Returns and Close-End Price Manipulation in the Istanbul Stock Exchange – Frontiers in Finance and Economics – Vol. 5 No.1 – April 2008,
29
Table 8a Coefficient estimates before the close (Rc-15) for the second period (13.8.2001 – 29.3.2002)
Stocks Intercept D-Buy D-Sell D-Both Adj.R. Sqr. F Value N/df
AKCNS 0,0018911 0,0034350 -0,0008716 0,0021385 0,0229 1,1579 151
t Stat (1,5996) (1,6315) (-0,2993) (0,9132)
P-value (0,1118) (0,1049) (0,7651) (0,3626)
AKGRT 0,0047483 -0,0033307 0,0030010 0,0059339 0,0181 0,9151 151
t Stat (5,2441) (-0,8167) (0,6837) (1,2385)
P-value (0,0000) (0,4154) (0,4952) (0,2175)
ALARK 0,0052206 0,0025218 0,0030156 -0,0137961 0,0476 2,4983 151
t Stat (5,1668) (0,5883) (0,5620) (-2,5712)
P-value (0,0000) (0,5572) (0,5749) (0,0111)
ALCTL 0,0051137 -0,0030401 -0,0043541 -0,0001375 0,0088 0,4443 151
t Stat (4,4122) (-0,7035) (-0,9594) (-0,0250)
P-value (0,0000) (0,4828) (0,3389) (0,9801)
ARCLK 0,0061763 -0,0048500 -0,0113705 0,0149554 0,0577 3,0589 151
t Stat (4,6799) (-1,1459) (-1,6581) (2,1808)
P-value (0,0000) (0,2537) (0,0994) (0,0308)
BAGFS 0,0066170 -0,0004866 -0,0066170 -0,0030572 0,0062 0,2679 151
t Stat (6,7092) (-0,0879) (-0,6049) (-0,6711)
P-value (0,0000) (0,9301) (0,5463) (0,5033)
DOHOL 0,0036471 0,0041061 0,0019158 0,0017569 0,0082 0,3474 151
t Stat (1,0908) (0,9760) (0,3624) (0,4512)
P-value (0,2774) (0,3309) (0,7177) (0,6526)
EFES 0,0038468 0,0005385 -0,0021976 -0,0029340 0,0092 0,4027 151
t Stat (2,5726) (0,1949) (-0,7187) (-0,7766)
P-value (0,0112) (0,8458) (0,4736) (0,4388)
ENKA 0,0090298 -0,0021402 -0,0050302 -0,0002669 0,0068 0,3408 151
t Stat (7,8113) (-0,3486) (-0,9627) (-0,0475)
P-value (0,0000) (0,7278) (0,3372) (0,9622)
EREGL 0,0071821 -0,0001279 -0,0002979 0,0021567 0,0018 0,0791 151
t Stat (6,1471) (-0,0329) (-0,0414) (0,4786)
P-value (0,0000) (0,9738) (0,9671) (0,6330)
FROTO 0,0083260 0,0006234 -0,0042845 -0,0022304 0,0074 0,3731 151
t Stat (7,6037) (0,1857) (-0,9561) (-0,3979)
P-value (0,0000) (0,8529) (0,3406) (0,6912)
(continues)
G Küçükkocaoğlu – Intra-Day Stock Returns and Close-End Price Manipulation in the Istanbul Stock Exchange – Frontiers in Finance and Economics – Vol. 5 No.1 – April 2008,
30
Table 8a. (continued)
Stocks Intercept D-Buy D-Sell D-Both Adj.R. Sqr. F Value N/df
HURGZ 0,0039625 -0,0012465 0,0016395 0,0055610 0,0254 0,9310 151
t Stat (1,6742) (-0,3256) (0,3934) (1,3976)
P-value (0,0970) (0,7453) (0,6948) (0,1651)
ISCTR -0,001107 -0,0033058 -0,0010316 -0,0026479 0,0104 0,4502 151
t Stat (-0,4127) (-0,9651) (-0,3052) (-0,8711)
P-value (0,6805) (0,3363) (0,7607) (0,3853)
MIGRS 0,0019627 0,0029799 0,0073517 0,0024767 0,0442 2,3135 151
t Stat (1,5018) (1,2134) (2,5524) (0,8433)
P-value (0,1352) (0,2269) (0,0117) (0,4004)
NETAS 0,0036473 0,0018633 0,0040438 -0,0006250 0,0150 0,7597 151
t Stat (2,5483) (0,7752) (1,2706) (-0,2261)
P-value (0,0118) (0,4395) (0,2058) (0,8215)
PETKM 0,0038648 0,0063892 0,0060759 0,0051073 0,0361 1,6113 151
t Stat (3,4777) (1,1988) (1,6484) (1,1241)
P-value (0,0007) (0,2328) (0,1017) (0,2631)
PTOFS 0,0038389 0,0064348 -0,0146451 -0,0040204 0,0604 2,7629 151
t Stat (3,1783) (1,5190) (-2,2419) (-0,7474)
P-value (0,0019) (0,1312) (0,0267) (0,4562)
SISE 0,0069790 -0,0016932 -0,0047028 -0,0024144 0,0080 0,4033 151
t Stat (4,6276) (-0,3102) (-1,0356) (-0,3987)
P-value (0,0000) (0,7568) (0,3021) (0,6907)
THYAO 0,0028273 -0,0028968 0,0067775 -0,0063117 0,0258 1,1381 151
t Stat (2,6157) (-0,7982) (1,0083) (-1,3112)
P-value (0,0100) (0,4262) (0,3152) (0,1921)
TNSAS 0,0042759 0,0049271 -0,0044971 -0,0049945 0,0197 1,0045 151
t Stat (2,8634) (1,0394) (-1,0956) (-0,6743)
P-value (0,0048) (0,3003) (0,2750) (0,5011)
TUPRS 0,0057615 -0,0040449 -0,0030117 0,0012755 0,0093 0,4055 151
t Stat (3,8641) (-0,8802) (-0,6791) (0,2016)
P-value (0,0002) (0,3804) (0,4983) (0,8405)
VESTL 0,0075641 -0,0027670 0,0003726 -0,0014975 0,0094 0,4070 151
t Stat (3,6783) (-0,8857) (0,1193) (-0,5522)
P-value (0,0003) (0,3774) (0,9052) (0,5818)
YKBNK 0,0000411 0,0092542 0,0018455 -0,0071117 0,0644 2,9600 151
t Stat (0,0288) (2,3993) (0,4644) (-1,4689)
P-value (0,9770) (0,0179) (0,6432) (0,1443)
G Küçükkocaoğlu – Intra-Day Stock Returns and Close-End Price Manipulation in the Istanbul Stock Exchange – Frontiers in Finance and Economics – Vol. 5 No.1 – April 2008,
31
a The null hypothesis can not be rejected at α= %5 significance level. T-stats and P-values are reported under the coefficient estimates in paranthesis. Also reported are the adjusted R-square, the F-statistics, the number of observations and the degrees of freedom.
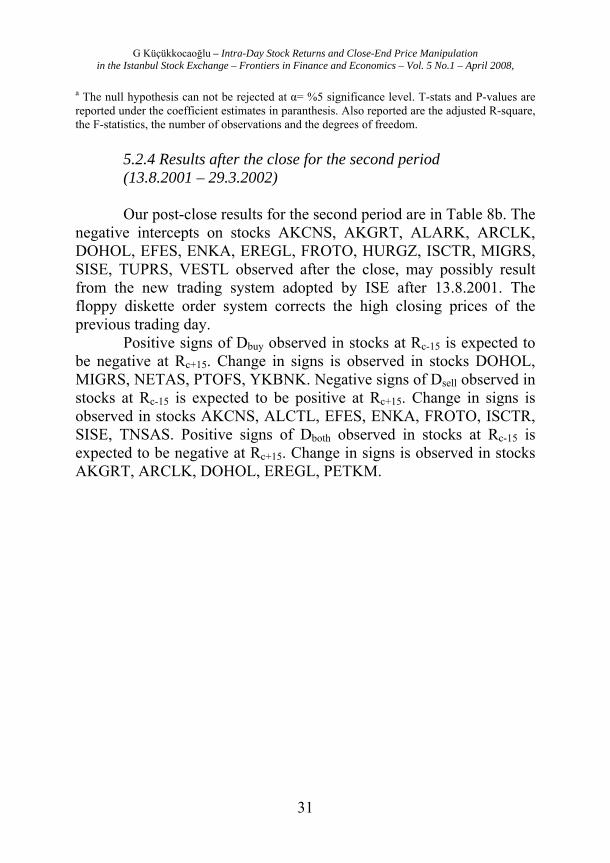
5.2.4 Results after the close for the second period (13.8.2001 – 29.3.2002) Our post-close results for the second period are in Table 8b. The
negative intercepts on stocks AKCNS, AKGRT, ALARK, ARCLK, DOHOL, EFES, ENKA, EREGL, FROTO, HURGZ, ISCTR, MIGRS, SISE, TUPRS, VESTL observed after the close, may possibly result from the new trading system adopted by ISE after 13.8.2001. The floppy diskette order system corrects the high closing prices of the previous trading day.
Positive signs of Dbuy observed in stocks at Rc-15 is expected to be negative at Rc+15. Change in signs is observed in stocks DOHOL, MIGRS, NETAS, PTOFS, YKBNK. Negative signs of Dsell observed in stocks at Rc-15 is expected to be positive at Rc+15. Change in signs is observed in stocks AKCNS, ALCTL, EFES, ENKA, FROTO, ISCTR, SISE, TNSAS. Positive signs of Dboth observed in stocks at Rc-15 is expected to be negative at Rc+15. Change in signs is observed in stocks AKGRT, ARCLK, DOHOL, EREGL, PETKM.
G Küçükkocaoğlu – Intra-Day Stock Returns and Close-End Price Manipulation in the Istanbul Stock Exchange – Frontiers in Finance and Economics – Vol. 5 No.1 – April 2008,
32
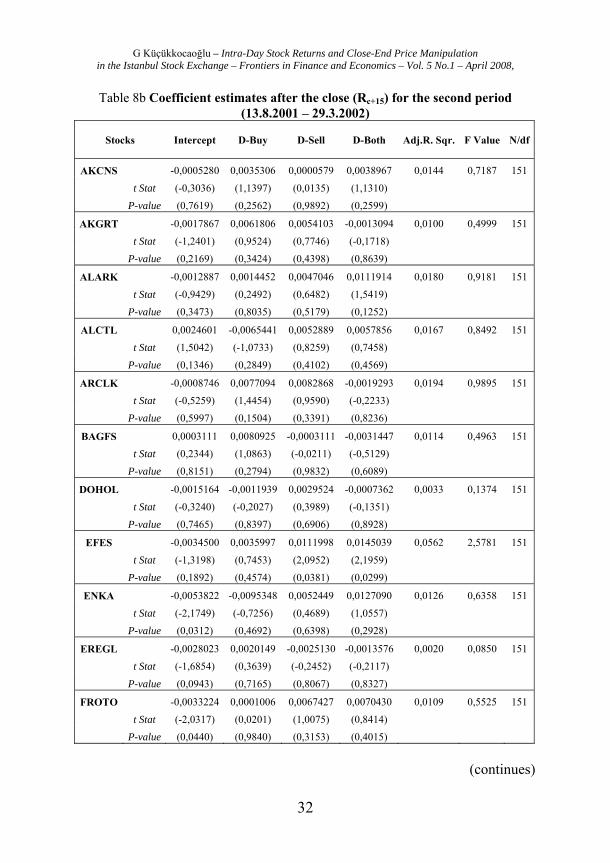
Table 8b Coefficient estimates after the close (Rc+15) for the second period (13.8.2001 – 29.3.2002)
Stocks Intercept D-Buy D-Sell D-Both Adj.R. Sqr. F Value N/df
AKCNS -0,0005280 0,0035306 0,0000579 0,0038967 0,0144 0,7187 151
t Stat (-0,3036) (1,1397) (0,0135) (1,1310)
P-value (0,7619) (0,2562) (0,9892) (0,2599)
AKGRT -0,0017867 0,0061806 0,0054103 -0,0013094 0,0100 0,4999 151
t Stat (-1,2401) (0,9524) (0,7746) (-0,1718)
P-value (0,2169) (0,3424) (0,4398) (0,8639)
ALARK -0,0012887 0,0014452 0,0047046 0,0111914 0,0180 0,9181 151
t Stat (-0,9429) (0,2492) (0,6482) (1,5419)
P-value (0,3473) (0,8035) (0,5179) (0,1252)
ALCTL 0,0024601 -0,0065441 0,0052889 0,0057856 0,0167 0,8492 151
t Stat (1,5042) (-1,0733) (0,8259) (0,7458)
P-value (0,1346) (0,2849) (0,4102) (0,4569)
ARCLK -0,0008746 0,0077094 0,0082868 -0,0019293 0,0194 0,9895 151
t Stat (-0,5259) (1,4454) (0,9590) (-0,2233)
P-value (0,5997) (0,1504) (0,3391) (0,8236)
BAGFS 0,0003111 0,0080925 -0,0003111 -0,0031447 0,0114 0,4963 151
t Stat (0,2344) (1,0863) (-0,0211) (-0,5129)
P-value (0,8151) (0,2794) (0,9832) (0,6089)
DOHOL -0,0015164 -0,0011939 0,0029524 -0,0007362 0,0033 0,1374 151
t Stat (-0,3240) (-0,2027) (0,3989) (-0,1351)
P-value (0,7465) (0,8397) (0,6906) (0,8928)
EFES -0,0034500 0,0035997 0,0111998 0,0145039 0,0562 2,5781 151
t Stat (-1,3198) (0,7453) (2,0952) (2,1959)
P-value (0,1892) (0,4574) (0,0381) (0,0299)
ENKA -0,0053822 -0,0095348 0,0052449 0,0127090 0,0126 0,6358 151
t Stat (-2,1749) (-0,7256) (0,4689) (1,0557)
P-value (0,0312) (0,4692) (0,6398) (0,2928)
EREGL -0,0028023 0,0020149 -0,0025130 -0,0013576 0,0020 0,0850 151
t Stat (-1,6854) (0,3639) (-0,2452) (-0,2117)
P-value (0,0943) (0,7165) (0,8067) (0,8327)
FROTO -0,0033224 0,0001006 0,0067427 0,0070430 0,0109 0,5525 151
t Stat (-2,0317) (0,0201) (1,0075) (0,8414)
P-value (0,0440) (0,9840) (0,3153) (0,4015)
(continues)

G Küçükkocaoğlu – Intra-Day Stock Returns and Close-End Price Manipulation in the Istanbul Stock Exchange – Frontiers in Finance and Economics – Vol. 5 No.1 – April 2008,
33
Table 8b. (continued)
Stocks Intercept D-Buy D-Sell D-Both Adj.R. Sqr. F Value N/df
HURGZ -0,0001842 0,0027169 -0,0000281 0,0013856 0,0046 0,1653 151 t Stat (-0,0704) (0,6424) (-0,0061) (0,3152) P-value (0,9440) (0,5220) (0,9951) (0,7532)
ISCTR -0,0046592 0,0100609 0,0115164 0,0155401 0,0527 2,3909 151 t Stat (-0,8979) (1,5189) (1,7623) (2,6437) P-value (0,3709) (0,1312) (0,0804) (0,0092)
MIGRS -0,0007061 -0,0003824 0,0017836 0,0035826 0,0074 0,3745 151 t Stat (-0,4120) (-0,1187) (0,4722) (0,9302) P-value (0,6809) (0,9056) (0,6374) (0,3537)
NETAS 0,0030942 -0,0060236 -0,0000494 -0,0047859 0,0282 1,4490 151 t Stat (1,5906) (-1,8438) (-0,0114) (-1,2737) P-value (0,1138) (0,0672) (0,9909) (0,2047)
PETKM 0,0002787 0,0002444 0,0024063 -0,0008393 0,0017 0,0743 151 t Stat (0,1708) (0,0312) (0,4446) (-0,1258) P-value (0,8647) (0,9751) (0,6574) (0,9001)
PTOFS 0,0019516 -0,0109617 -0,0068156 -0,0009187 0,0337 1,5016 151 t Stat (1,2504) (-2,0026) (-0,8074) (-0,1322) P-value (0,2134) (0,0473) (0,4209) (0,8951)
SISE -0,0029209 0,0049900 0,0084466 0,0047898 0,0169 0,8579 151 t Stat (-1,4863) (0,7015) (1,4273) (0,6069) P-value (0,1393) (0,4841) (0,1556) (0,5448)
THYAO 0,0013639 0,0044690 -0,0010281 0,0133947 0,0250 1,1048 151 t Stat (0,7686) (0,7501) (-0,0932) (1,6951) P-value (0,4435) (0,4545) (0,9259) (0,0925)
TNSAS 0,0005219 0,0065129 0,0059101 0,0064937 0,0038 0,1897 151 t Stat (0,1309) (0,5148) (0,5395) (0,3285) P-value (0,8960) (0,6075) (0,5904) (0,7430)
TUPRS -0,0001771 0,0027066 -0,0059749 0,0033680 0,0138 0,5996 151 t Stat (-0,0967) (0,4795) (-1,0970) (0,4335) P-value (0,9231) (0,6324) (0,2747) (0,6654)
VESTL -0,0032548 0,0034757 -0,0004692 0,0032431 0,0091 0,3933 151 t Stat (-1,0156) (0,7139) (-0,0964) (0,7674) P-value (0,3117) (0,4766) (0,9234) (0,4443)
YKBNK 0,0026344 -0,0123075 0,0047813 0,0076603 0,0521 2,3646 151 t Stat (1,2278) (-2,1182) (0,7986) (1,0503) P-value (0,2218) (0,0361) (0,4260) (0,2956)
G Küçükkocaoğlu – Intra-Day Stock Returns and Close-End Price Manipulation in the Istanbul Stock Exchange – Frontiers in Finance and Economics – Vol. 5 No.1 – April 2008,
34
a The null hypothesis can not be rejected at α= %5 significance level. T-stats and P-values are reported under the coefficient estimates in paranthesis. Also reported are the adjusted R-square, the F-statistics, the number of observations and the degrees of freedom.
Again, consistent with Felixson and Pelli’s (1999) findings the
power of the model for the second period is null, low adjusted R-square, low F-values and insignificant coefficients are observed in this period.
However, using the coefficients of the variables of some stocks presented in Tables 8a and 8b. we would like to comment on the possible signs of close-end price manipulation. Expected positive sings of Dbuy before the close and negative signs of Dbuy after the close, expected negative sings of Dsell before the close and positive signs of Dsell after the close, expected positive sings of Dboth before the close and negative signs of Dboth after the close largely observed in the ISE National-30 Index Stocks.
We assume that, using the signs of the coefficients of the variables, close-end prices of the selected stocks are manipulated in the ISE between 13.8.2001 – 29.3.2002, but in this period manipulation appears to occur on the sell side. One of the reasonable explanation of this change could be the Financial Crisis of November, 2000 and February, 2001 in the Turkish Economy, where the speculative attacks on listed shares with in this crisis period decrease the percentage of shares owned by foreigners in the ISE. Furthermore, the general index of stock market prices lost more than half of its value in a very short time. Hot money outflows plummeted the share prices and sudden capital outflow that creates financial crisis, which results in a part of the macroeconomic crisis.
6. Conclusion In this paper, we examine the behavior of the intra-daily stock
returns and close-end stock prices in the Istanbul Stock Exchange (ISE). Several results are found in this study.
Day-end prices of the selected stocks increase at close in the ISE. Mean returns at close started to reverse after the change in the trading system of the ISE, floppy diskette orders corrects the large and positive close-end returns in the first 15-minutes of the next trading
G Küçükkocaoğlu – Intra-Day Stock Returns and Close-End Price Manipulation in the Istanbul Stock Exchange – Frontiers in Finance and Economics – Vol. 5 No.1 – April 2008,
35
day. The morning volatility peak in returns and standard deviations observed before August 13th, 2001 significantly decrease after the change in the trading system. Our final observation on intra-day patterns of stocks for both periods is the day-end closing returns are still large and positive even after the trading system change.
This is the first close-end price manipulation study in the ISE. We also try to find out whether the daily largest traders in the ISE attempt to manipulate the closing prices in the last minute of trade. We use the daily transaction data of all stocks without removing high volume and block trades and the possible effects of short selling activities at close. In future studies these facts should be considered.
Even though the statistical results are weak and insignificant in many stocks, close-end price manipulation through big buyers and big sellers appears possible in the ISE. High close-end returns, some significant signs of the coefficients of the variables, high closing at ask prices increases the possibility of close-end stock price manipulation in the ISE. It is useful to keep in mind that close-end price manipulation by the largest buyers and sellers is not expected to happen everyday. Plus, manipulation attempts at the close could be masked by the large volumes of buy and sell orders effected by firm specific and macro-economic news. We also see some affirmative signs of close-end price manipulation by the largest buyers and the largest sellers in selected stocks.
There may also be some other explanations rather than close-end price manipulation for this price movement, according to Madhavan, Richardson and Roomans (1997), the reasons for the increase in prices at the end of the day; may be the announcement of new information to public, information based order flow, accumulated orders during the day, market makers effort to control the price of the stocks they posses, insider information, arrival of date of maturity for time deposits and cancellation of contracts, concentration of brokers on buy-sell transaction at the closing time of the market.
According to Block, French and Maberly (2000) institutional investors are the reason for the high return at the start and close of the market. Institutional investors give their orders more frequently in the following 30 minutes after the open and 30 minutes before the close of the market.
G Küçükkocaoğlu – Intra-Day Stock Returns and Close-End Price Manipulation in the Istanbul Stock Exchange – Frontiers in Finance and Economics – Vol. 5 No.1 – April 2008,
36
As mentioned in Section 5, some trading investors in the ISE try to manipulate movements on closing price by using brokers or through their mediation. As long as the closing price is used as a performance measure, the continuation of such movements is inevitable.
In order to prevent the realized unsystematic and extreme price movements in closing sessions and decrease the volatility supporting these increases when considering the above mentioned findings it is beneficial to go through how closing price mechanism is needed to be arranged in the ISE. In this subject the most suitable and radical solution method would be to put a closing session method into action that arrange closing price formation.
Acknowledgements We gratefully acknowledge the helpful comments on earlier
drafts provided by two anonymous referees, R. Best, A. Kiracı, T. Erol, R. Bildik, K. Felixson and participants in the VIth International Conference in Economics, Metu, Ankara, Turkey, data support from the ISE and database management support from A. Varol. We retain responsibility for any errors. References Allen, F., Gale, D., Stock Price Manipulation, Review of Financial Studies,
Vol. 5, (1992), pp. 503-529. Allen, F., Gorton, G., Stock price manipulation, market microstructure and
asymmetric information, European Economic Review, Vol.36, (1992), pp. 624-630.
Andersen, T.G., Bollerslev, T., Cai, J., Intraday and interday volatility in the Japanese stock market, Journal of International Financial Markets, Vol. 10, (2000), pp. 107-130.
Bagnoli, M. And Lipman, B.L., Stock Price Manipulation Through Takeover Bids, RAND Journal Of Economics, Vol. 27, (1996), pp. 124-147.
Benabou, R. and Laroque,G., Using Privileged Information to Manipulate Markets: Insiders, Gurus, and Credibility, Quarterly Journal of Economics, Vol. 107 (1992), pp. 921-958.
G Küçükkocaoğlu – Intra-Day Stock Returns and Close-End Price Manipulation in the Istanbul Stock Exchange – Frontiers in Finance and Economics – Vol. 5 No.1 – April 2008,
37
Berry, T.D., Howe, K.M., Public Information Arrival, Journal of Finance, Vol. 49, (1994), pp. 1331-1346.
Bildik, R. Intra-day seasonalities on stock returns : evidence from the Turkish stock market, Emerging Market Review, Vol. 2, (2001), pp. 387-417.
Block, S., French, D.W., Maberly, E.D., The pattern of intraday portfolio management decisions: A case study of intraday security return patterns, Journal of Business Research, Vol. 50,
(2000), p. 321-326. Capital Markets Board of Turkey, Capital Market Law, No. 2499, Ankara,
Turkey, (2002). Chan, K.C., Christie, W.G., Schultz, P.H., Market structure and the
intraday pattern of bid-ask spreads for NASDAQ securities, Journal of Business, Vol. 68, (1995), pp. 35-60.
Chan, K.C., Fong, W., Kho, B., Stulz, R.M., Information, trading and stock returns: Lessons from dually-listed securities, Journal of Banking and Finance, Vol. 20, (1996), pp. 1161-1187.
Chang, R.P., Fukuda, T., Rhee, S. G., Taakano, M., Intraday and interday behavior of the TOPIX, Pasific-Basin Finance Journal, Vol. 1, (March, 1993), pp. 67-95.
Chatterjea, A., Cherian, J. A., Market manipulation and corporate finance: A new perspective, Financial Management, Vol. 22, (1993), pp. 200-209.
Cheung, Y., Intraday returns and the day-end effect: evidence from the Hong Kong Equity Market, Journal of Business Finance and Accounting. Vol. 22, (1995), pp. 1023-1034.
Choe, H., Shin, H., An analysis of interday and intraday return volatility _ evidence from the Korean Stock Exchange, Pacific-Basin Finance Journal. (1993), pp. 175-188.
Felixson, K. Pelli, A., Day-end returns – stock price manipulation, Journal of Multinational Financial Management, Vol. 9, (1999), pp. 95-127.
Fischel, D.R., Ross, D.J., Should the law prohibit “manipulation” in financial markets, Harvard Law Review, Vol. 105, (1991), pp.503-553.
Fried, J., High Closing, Canadian Public Policy, Vol. 28, (2002), pp. 17-37. Foster, F.D., Viswanathan, S., Variations in trading volume, return volatility,
and trading costs: evidence on recent price formation models, J. of Finance, Vol. 48, (1993), pp.187-211.
Gerethy, M.S., Mulherin, J.H., Patterns in intraday stock market volatility, past and present, Financial Analysts Journal, (September - October, 1991), pp. 71-79.
G Küçükkocaoğlu – Intra-Day Stock Returns and Close-End Price Manipulation in the Istanbul Stock Exchange – Frontiers in Finance and Economics – Vol. 5 No.1 – April 2008,
38
Harris, L., A transactions data study of weekly and intradaily patterns in stock returns, Journal of Financial Economics, Vol. 16, (1986), pp. 99-117.
Harris, L., A Day-end transaction price anomaly, Journal of Financial and Quantitative Analysis, Vol.24, (1989), pp. 29-45.
Hillion, P., Suominen, M., Broker Manipulation, Working Paper, INSEAD, (1998).
ISE, Sermaye Piyasası ve Borsa Temel Bilgiler Kilavuzu, 16. Baski, IMKB, Istanbul, Turkey, (2001).
Jain, P.C., Joh, G.H., The dependence between hourly prices and trading volume, Journal of Financial and Quantitative Analysis, Vol.23, (1988), pp. 269-283.
Jang, H., Lee, J. Intraday behavior of the bid-ask spread and related trading variables, Working Paper, University of Oklahoma, U.S.A. (1993).
Jarrow, R.A. Market Manipulation, Bubles, Corners, and Short Squeezes, Journal of Financial and Quantitative Analysis, Vol. 27 (1992), pp. 311-336.
Jarrow, R.A., Derivative security markets, market manipulation, and option pricing, Journal of Financial and Quantitative Analysis, Vol. 29, (1994), pp. 241-261.
Kumar, P and Seppi, D.J. Futures Manipulation with ‘Cash Settlement’, Journal of Finance, Vol. 47, (1992), pp. 1485-1502.
Kyle, A.S. A Theory of Futures Market Manipulations, In R.W. Anderson, ed., The Industrial Organization of Futures Markets. Lexington, Mass.: Lexington Books, 1984.
Lockwood, L.J., Linn, S.C., An examination of stock market return volatility during overnight and intraday periods, Journal of Finance, Vol. 45, (1990), pp. 591-601.
Lowengrub, P., Melvin, M., Before and after international cross-listing: an intraday examination of volume and volatility, Journal of International Financial Markets, Vol.12, (2002), pp.139-155.
Madhavan, A., Richardson, M., Roomans, M., Why do security prices fluctuate? A transaction-level analysis of the NYSE stocks, Review of Financial Studies, Vol. 10, (1997), p. 1035-1064.
McInish, T.H., Wood, R.A., A Transaction Data Analysis of the Variability of Common Stock Returns During 1980-1984, Journal of Banking and Finance, Vol. 14, (1990a), pp. 113-129.
McInish, T.H., Wood, R.A., An analysis of transactions data for the Toronto Stock Exchange, Journal of Banking and Finance, Vol. 14, (1990b), pp. 441-458.
G Küçükkocaoğlu – Intra-Day Stock Returns and Close-End Price Manipulation in the Istanbul Stock Exchange – Frontiers in Finance and Economics – Vol. 5 No.1 – April 2008,
39
Norden,L., An investigation of intradaily regularities in Swedish stock market returns, Working Paper, University of Lund, Sweden, (1993).
Smirlock,M., Starks, L., Day of the week and intraday effects in stock returns, Journal of Financial Economics, Vol.17, (1986), pp197-210.
Wei, P.H., Intraday variations in trading activity, price variability, and the bid-ask spread, Journal of Financial Research, Vol. 15, (Autumn, 1992), pp. 265-276.
Wood, R.A., McInish, T.H., Ord, J.K., An ivestigation of transaction data for NYSE stocks, Journal of Finance, Vol. 40, (1985), pp.723-741.
Yadav, P.K., Pope, P.F., Intraweek and intraday seasonalities in stock market risk premia: cash and futures, Journal of Banking and Finance, Vol.16, (1992), pp.233-270.