Embed Size (px)
Citation preview

Intra-brand competition in a differentiated oligopoly
Michele Breton1 • Lucia Sbragia2
Received: 22 December 2019 / Accepted: 16 July 2020 / Published online: 16 August 2020� The Author(s) 2020
AbstractIn this paper we consider a differentiated oligopoly with two product varieties that
are supplied by two groups of firms. After computing the Cournot solution of the
game, we study its sensitivity to different sources of competition, namely the degree
of product substitutability and market composition. Market composition can change
either via new firms entering one industry or via firms switching production tech-
niques, thus modifying the intensity of intra-brand competition. After studying the
welfare consequences of an intensification of competition, we identify the equi-
librium market composition when firms are driven by profit considerations. All the
results are expressed in terms of the degree of product substitutability and of what
we define ‘‘weighted relative efficiency’’ (WRE), which is a parameter combining
both firm characteristics and market conditions.
Keywords Differentiated oligopoly � Cournot solution � Intra-brandcompetition � Equilibrium
JEL Classification C72 � L13
Research supported by NSERC (Canada).
& Lucia Sbragia
Michele Breton
1 Department of Decision Sciences, HEC Montreal, Montreal, Canada
2 Department of Economics and Finance, Durham University Business School, Durham, UK
123
Journal of Economics (2021) 132:1–40https://doi.org/10.1007/s00712-020-00712-w(0123456789().,-volV)(0123456789().,-volV)

1 Introduction
In response to consumers’ increasing concern for the environment and interest in
making greener choices,1 firms have started investing in production practices that
allow them to receive a label certifying their compliance with certain set standards
(e.g. organic, bio, sustainable, fair trade). Firms that earn a ‘‘green’’ label diversify
their product offering from a conventional one. For example, in the fishery industry,
when a company adopting a specific production technique receives the Marine
Stewardship Council (MSC) label following a certification process, it diversifies its
product offering and competes against companies selling non MSC-certified products.
Moreover, certified firms may also compete against each other. In this paper, we use
the term inter-brand competition to designate competition among firms selling
different but interchangeable products (substitute goods), and intra-brand competitionto designate competition among firms selling the same (homogenous) product.
Inter-brand and intra-brand competition have been mainly studied in the contexts
of vertical agreements or of supply channels. In the legal literature, issues consist of
assessing whether vertical agreements (e.g. between manufacturers and retailers)
may prevent or restrict competition. In the economics literature, vertical agreements
in oligopolistic markets have been analyzed under a strategic perspective, for
instance to determine the equilibrium contract offered by the upstream firms and the
resulting impact on downstream competition (see for instance Saggi and Vettas
2002), or to examine whether cooperation or collusion among competitors may be
beneficial (see for instance Kawasaki et al. 2019). A large body of papers in the
marketing-channel literature define intra-brand competition as the competition
between retailers of the same product, while inter-brand competition occurs
between manufacturers of substitutable products. This literature is primarily
concerned with the coordination of marketing channels, using pricing and/or
marketing mix variables (see Cai et al. 2019 for a survey).
Unlike the above-cited literature, we do not assume coordination, integration or
agreements between firms. Using the emergence of green production practices as a
motivating example, the objective of this paper is to analyze various sources of
competition in a differentiated oligopoly. For instance, the introduction of green
products in an oligopolistic market corresponds to introducing inter-brand compe-
tition in a context where intra-brand competition is present. On the other hand,
moving from a differentiated duopoly to a differentiated oligopoly corresponds to
introducing intra-brand competition in a context with inter-brand competition.
We extend the duopoly model of Singh and Vives (1984) by assuming that two
varieties of a product are supplied by two groups of homogeneous firms that
compete in quantity. This is different than having N firms producing one variety
each, as in Vives (1985), Hackner (2000) or Amir and Jin (2001), since it accounts
1 https://www.nielsen.com/eu/en/insights/article/2018/global-consumers-seek-companies-that-care-
about-environmental-issues/; https://www.forbes.com/sites/forbesnycouncil/2018/11/21/do-customers-
really-care-about-your-environmental-impact/#6a24ad41240d; https://www.unilever.com/news/press-
releases/2017/report-shows-a-third-of-consumers-prefer-sustainable-brands.html; https://www.
independent.co.uk/life-style/food-and-drink/environment-meat-bottled-drinks-plastic-waste-consumer-
customer-buy-spend-money-a9099446.html.equilibrium output of the oligopoly.
123
2 M. Breton et al.
for both inter-brand competition and intra-brand competition. Furthermore, in our
model, each firm pays a fixed cost related to the product variety supplied, which is a
sine qua non condition to access different markets. Finally, for a given industry size,
we allow firms to revise their decision about which product variety they will supply.
This decision is based on the different groups’ relative economic performance.
We first analyze the differentiated oligopoly model for the Cournot solution
corresponding to a given industry size and composition. We then investigate the
impact of changes in three different sources of competition, that is, in the degree of
product substitutability, in the total number of firms, and in the industry configuration,
specifically examining the consequences of such changes on equilibrium quantities
and social welfare. We also characterize the equilibrium industry configuration when
firms can change their decision about which product variety to supply. Finally, to
derive further insights, we perform some numerical simulations in which, rather than
adopting simplifying assumptions on the parameter values, we make conjectures
about their relative values, based on what we would see in an industry providing a
certified ‘‘green’’ product and a conventional ‘‘brown’’ one.
The first part of our analysis is related to what is done in Saggi and Vettas (2002)
and Dou and Ye (2017). Both papers use a special case of the differentiated duopoly
model where the two markets for the substitutable varieties are identical. In Dou and
Ye (2017), the cost structure of the firms is absent, so that the two groups of firms
only differ in terms of size, and results are expressed in terms of market composition
only. In Saggi and Vettas (2002), the costs (fixed and variable) and group sizes
result from upstream decisions.
In our model we adopt an asymmetric context that encompasses both the Dou and
Ye (2017) and Saggi and Vettas (2002) models: firms sustain different production
costs, and markets exhibit different features, so that all the model parameters are
asymmetric. This allows us to express our results not only in terms of market
composition, but also of market conditions and firms’ characteristics. This broad
asymmetric context is encapsulated in one parameter called ‘‘weighted relative
efficiency’’ (WRE), expressed as the two types of firms showing different WRE
levels (e.g. small and large). Symmetric results can be retrieved from ours as a very
special case, when firms in both groups have the same WRE, which can still be
replicated in our model by firms and markets characterized by different parameter
values. This is because, in our differentiated oligopoly, it is the relationship among
the parameters that matters rather than their individual values.
In terms of findings, one of our main contributions regards the impact of product
substitutability on the individual equilibrium quantities. We find that a stronger
horizontal product competition can have a positive effect on a firm’s output in the
presence of intra-brand competition, which is not possible in a simple differentiated
duopoly. This beneficial effect on a firm’s output is related to the interaction
between the degree of product substitutability and the (negative) variation of the
other product-type quantity. We identify the market conditions, firms’ character-
123
Intra-brand competition in a differentiated oligopoly 3

istics, and industry composition that result in a positive impact of product
substitutability on the individual equilibrium quantities.
A second main result comes from the analysis of the social welfare impact of
changes in the market composition due to either firm entry or to firms switching
from one group to the other. We find that positive impacts are driven by two facets:
an increase in the overall industry efficiency, and/or an increase in intra-brand
competition.
A third main result concerns the impact of intra-brand competition on the
equilibrium supply of individual firms when the size of the industry is fixed, that is,
when firms switch from one group to the other. An intensification of intra-brand
competition in the smaller group always has a negative effect on the individual
quantity produced in this group, no matter its WRE. However, an intensification of
intra-brand competition in the larger group can have positive consequences on the
individual quantities produced by its members, due to the interplay between the
degree of product substitutability and the (positive) impact of inter-brand
competition.
When we turn to the equilibrium analysis of the industry composition for a fixed
overall industry size, we find that all configurations are possible (single-variety
market of any type or market with two varieties), according to the values of the
model parameters. Comparing the equilibrium market composition to the social
optimum configuration, we obtain that social welfare is always maximized when the
majority of firms pertains to the group with the highest WRE, while the equilibrium
industry composition rather depends on the relative importance of fixed (e.g.
certification) costs.
The paper is organized as follows. Section 2 presents the differentiated oligopoly
model with two varieties produced by N firms. Section 3 analyzes the impact of
product substitutability on the equilibrium solution of the game. Sections 4 and 5
investigate the consequences of intra-brand competition, resulting from changes in
the size or composition of the industry, on firms’ equilibrium output and on social
welfare, while Sect. 6 characterizes the equilibrium market composition arising
when firms can switch from one group to the other. Finally, Sect. 7 presents some
numerical illustrations and Sect. 8 concludes the paper.
2 A general oligopoly with intra- and inter-brand competition
Consider an industry populated by N firms. Producers are divided into two groups of
similar types, and members of the same group use the same technology to produce a
homogeneous product (e.g. with ‘‘high’’ and ‘‘low’’ ecological footprint). Let k 2H; Lf g index the product type and nk denote the number of producers within group
k, with nH þ nL ¼ N. Accordingly, assuming a linear cost function, the total
production cost of a quantity qki of product k 2 H; Lf g by producer i 2 1; :::; nkf g is
given by
123
4 M. Breton et al.

Cki ¼ fk þ mkqki
where mk � 0 and fk � 0 are, respectively, the marginal and fixed production costs.
Since goods produced by firms of a given type are homogeneous, consumers are
offered two product varieties. Following Singh and Vives (1984), we assume that
the representative consumer has a taste for variety, and that her quadratic utility
function is strictly concave and described by
U QH ;QLð Þ ¼ AHQH þ ALQL �1
2FHQ
2H þ 2SQHQL þ FLQ
2L
� �,
where QH and QL are the total production of the firms of type H and L, respectively,and where Fk [ 0, Ak [ 0 and S� 0 for k 2 H; Lf g. In the same way as in Hackner
(2000), the parameters Ak can be interpreted as the quality (vertical) differentiation
between product varieties. The parameter S� 0 is the symmetric degree of substi-
tutability between any pair of varieties. When S ¼ 0, products H and L are com-
pletely independent, and each group of producers of a given type becomes an
independent oligopoly selling a homogeneous product (pure intra-brand competi-
tion). The strict concavity of the representative consumer’s utility function
assumption implies that
S2\FHFL. ð1Þ
In addition, we assume that the maximum utility of the consumer is achieved in the
positive quadrant, which corresponds to
S\min FHAL
AH;FL
AH
AL
� �. ð2Þ
The inverse demand functions faced by producers of each type are obtained by
maximizing the consumers’ surplus
max CS ¼ U QH ;QLð Þ � PHQH þ PLQLð Þf g;
yielding, for j; k 2 H; Lf g and j 6¼ k
Pk ¼ Ak � FkQk � SQj.
We denote by Ek, with k 2 H; Lf g, the quantity Ak � mk; which is assumed to be
strictly positive. The parameter Ek depends on quality and cost parameters and can
be interpreted as an indicator of efficiency. For example, if Ek [Ej, then type-
k firms are more efficient than type-j firms; this greater efficiency can result from a
better quality and/or from a production cost advantage. Producers compete in
quantities, both within each group, by selling a homogeneous product (intra-brand
competition), and with producers of the other group, by offering a different variety
(inter-brand competition).
123
Intra-brand competition in a differentiated oligopoly 5
The optimization problem of a single representative producer i of group k with
k 2 H; Lf g is given by
maxqki � 0
pki � Pkqki � Ckif g.
Since producers in the same group have identical parameters, we can derive, from
the first-order conditions, the reaction functions of each type of producer as
qk ¼Ek
Fk nk þ 1ð Þ �Snj
Fk nk þ 1ð Þ qj with j; k 2 H; Lf g, j 6¼ k.
The equilibrium output of the oligopoly game is then given by
qH ¼ FLEH nL þ 1ð Þ � SELnLX
ð3Þ
qL ¼ FHEL nH þ 1ð Þ � SEHnHX
ð4Þ
X ¼ FHFL N þ 1ð Þ þ nHnL FHFL � S2� �
. ð5Þ
The corresponding equilibrium price for a producer of type k 2 H; Lf g is given by
Pk ¼ Fkqk þ mk
and the equilibrium profit is
pk ¼ Fkq2k � fk.
Finally, the producers’ surplus, consumers’ surplus and total welfare at equilibrium
depend on the industry size and composition and are respectively
PS ¼ FHQ2
H
nHþ FL
Q2L
nL
CS ¼ 1
2FHQ
2H þ 2SQHQL þ FLQ
2L
� �
W ¼ 1
2FHQ
2H
nH þ 2
nHþ 2SQHQL þ FLQ
2L
nL þ 2
nL
� �:
For j; k 2 H; Lf g, j 6¼ k, define the ratio
ck � FjEk
Ej¼ Fj
Ak � mk
Aj � mj:
The ratio ck is a weighted relative efficiency (WRE) parameter, where the weight is
given by the other variety’s price sensitivity to supply.
The WRE parameters summarize the impact of six parameters that affect firms
profits in both groups, that is, for k 2 H; Lf g, parameters Ak and Fk, which
characterize consumer’s demand for product k, and parameter mk, which is its
variable cost of production. Thus, the WRE of firms in group k is increasing with
123
6 M. Breton et al.
their efficiency Ek ¼ Ak � mk, decreasing with the efficiency Ej of firms in the rival
group j, and increasing with the price sensitivity Fj of the firms in group j. Without
loss of generality, we assume in the sequel that cL � cH , so that a type-L firm is
associated with the smallest WRE and a type-H firm is associated with the largest
WRE. The ratio c � cHcL
characterizes the ‘‘distance’’ between type-L and type-H
firms in terms of efficiency and price sensitivity. A large c indicates that H-typefirms are much more efficient than type-L firms, given market demand conditions.
Finally, to alleviate notation, we normalize the value of cL to 1, so that cH ¼ c� 1:The equilibrium output of the oligopoly game is then, for j; k 2 L;Hf g; j 6¼ k,
qk ¼ Ej
ck nj þ 1� �
� Snj
XX ¼ c N þ 1ð Þ þ njnk c� S2
� �:
We assume that
S\1� c; ð6Þ
which ensures that qk [ 0 for k 2 H; Lf g and for any possible value of the number
of producers in each group, and implies Condition (1). Finally, we assume that
fk\Fkq2k for k 2 H; Lf g, which ensures that both types of producers participate in
the market at equilibrium.
Note thatwhen both types of firms have the sameWRE c ¼ 1ð Þ, production and profitsin the two groups may still differ, as they depend on the values of nk and Ek, k 2 H; Lf g:
3 Impact of product substitutability
In this section, we investigate the relationship between the degree of substitutabilityS and the individual equilibrium quantities (and, consequently, the individual profits).
An increase in S, that is, an increase in the degree of the products’ substitutability, can
be interpreted as a more intense horizontal (inter-brand) product competition. The
following proposition shows that the impact of an increase in S on individual quantities
depends on market conditions, firms characteristics, and industry composition.
Proposition 1
(i) If c[ nHnLnH�1ð Þ nLþ1ð Þ, then
oqLoS \0, and there exists an admissible SH 2 0; 1ð Þ
such that
oqHoS
� 0 for S 2 ½0; SH �
oqHoS
[ 0 for S 2 SH ; 1ð Þ:
123
Intra-brand competition in a differentiated oligopoly 7

(ii) If c\ nL nHþ2ð ÞnHþ1ð Þ nLþ1ð Þ ; then
oqHoS \0, and there exists an admissible SL 2 0; 1ð Þ
such that
oqLoS
� 0 for S 2 ½0; SL�
oqLoS
[ 0 for S 2 SL; 1ð Þ:
(iii) In all other cases, oqLoS � 0 and oqH
oS � 0.
Proof See Appendix 9.1. h
Proposition 1 states that, under certain conditions, an increase in the degree of
product substitutability has a positive impact on the equilibrium quantities produced
by individual firms, and consequently on their profit. Results are illustrated in
Figs. 1 and 2 for N ¼ 20:In Fig. 1, when c is in Region 1, Condition (i) of Proposition 1 is satisfied. In that
region, oqLoS \0 and oqH
oS [ 0 for sufficiently large S. When c is in Region 2, Condition
(ii) of Proposition 1 is satisfied. In that region, oqHoS \0 and oqL
oS [ 0 for sufficiently
large S. Finally, when c is in Region 3, both oqHoS and oqH
oS are negative for all S. Region
2 vanishes when nH � nL � 1 ¼ 14, and Region 3 vanishes when nH � nL þ 1 ¼ 16.
The case where both groups have the same WRE is retrieved on the boundary c ¼ 1:
Fig. 1 Illustrative example of regions where the substitutability parameter has a positive impact on
individual quantities for N ¼ 20. In Region 1, oqHoS [ 0 for sufficiently large S. In Region 2, oqL
oS [ 0 for
sufficiently large S. In Region 3, both oqHoS and oqH
oS are negative for all S
123
8 M. Breton et al.

Figure 2 illustrates the range of values for S where substitutability has a positive
impact on individual quantities for nL ¼ 15 and nH ¼ 5. For small values of c
(Region 2), oqLoS [ 0 in the dark grey area. For large values of c (Region 1), oqH
oS [ 0
in the pale grey area. Elsewhere, both oqLoS and oqH
oS are negative.
A first insight from Proposition 1 is that the possibility of a stronger horizontal
product competition having a positive effect on the individual equilibrium quantities
and profit is the specific contribution of intra-brand competition. Indeed, if the
model is simplified to a differentiated duopoly (pure inter-brand competition) with
nH ¼ nL ¼ 1, then Conditions i and ii of Proposition 1 reduce to c[ 10and c\ 3
4
respectively, so that the impact of product substitutability on the equilibrium
quantities can never be positive.
A second insight from Proposition 1 relates to the importance of the parameter c,which characterizes the WRE advantage of H-type firms. When both groups have
the same WRE (c ¼ 1), the impact of an increase in horizontal composition is
positive for the largest group. As the value of c increases, the required group size
where an increase in S can have a positive impact increases for type-H firms and
decreases for type-L firms. Moreover, for a given industry composition satisfying
Condition i, the lower bound SH is decreasing with c, while the lower bound SL is
increasing with c for any industry composition.
Finally, note that Conditions i and ii Proposition 1 are mutually exclusive, so that
a positive impact of S can not be observed in both groups.
The positive impact of a greater horizontal product competition on the
equilibrium quantity of a firm is due to the interplay between the degree of product
substitutability and the negative impact it has on the market size of each type of
firm. In particular, an increase in S reduces the market size of each type of firm and
so does each individual quantity (oqkoS \0 for k ¼ H; L). However, if this increase
Fig. 2 Regions where the substitutability parameter has a positive impact on individual quantities.
Parameter values are nL ¼ 15 and nH ¼ 5. In the dark grey region, where c is small and S[ SL,dqLdS [ 0.
In the pale grey region, where c is large and S[ SH ,dqHdS [ 0. In all other regions, dqH
dS \0 and dqLdS \0:
123
Intra-brand competition in a differentiated oligopoly 9

occurs at high enough levels of product substitutability, the reduction of the rival
firm’s quantity can outweigh the negative impact that a greater substitutability has on
the firm’s market, so that the firm experiences an increase in its equilibrium output.
4 Impact of firm entry
Wenowassess how the equilibriumquantities and corresponding socialwelfare respond
to an intensification of competition.Wefirst focus on the case of an unilateral increase in
the number of firms in one group, so that the total number of firms in the industry
increases. This scenario can be assimilated to long-term structural changes in the
industry size leading to an increase of both inter-brand and intra-brand competition.
It is straightforward to check that a unilateral increase in the number of firms in a
given grouphas a negative impact on the individual output of all thefirms in the industry:
dqkdnk
¼ �qkc� S2ð Þnj þ c
X� 0
dqjdnk
¼ �ScjEk
XEjqk � 0:
This is due to a general intensification of the competition, specifically intra-brand
competition in the expanding group and inter-brand competition with firms in the
rival group.
However, the impact of a unilateral increase in the number of firms in a given
group on the total output in each market is different: the total equilibrium quantity
of the group that experiences a growth in size increases (due to the greater size), but
the total equilibrium quantity of the competing group decreases (due to increased
inter-brand competition).
dQk
dnk¼ c
nj þ 1
Xqk [ 0
dQj
dnk¼ �S
cjEknj
XEjqk\0:
It is easy to show that the impact of a unilateral increase in the size of group k 2 H; Lf gon the consumers’ surplus is positive for all feasible values ofS (seeAppendix 9.2). This
result is expected, since an increase in the number of firms represents a general inten-
sification in competition, which is beneficial to the consumers.2
The following proposition gives sufficient conditions for the impact of an
increase in the size of the industry to be welfare enhancing.
Proposition 2 If S ¼ 0 (independent products), or if N ¼ 2 (differentiatedduopoly), the impact of an increase in the size of group k 2 H; Lf g on the thetotal welfare is always positive.
Otherwise, if
2 Given the result of firm’s entry on the total equilibrium quantities, the impact on the producers’ surplus
is ambiguous.
123
10 M. Breton et al.
(i) ck ¼ 1\c (Group k has the lowest WRE, or, equivalently, k ¼ L andcL\cH), the impact of an increase in nk on the welfare is positive for S 2½0; 1Þ if
c\4nk nj þ 1
� �2
nj N þ 2ð Þ2
or2nk
N þ 2� c� njnk
njnk � 1:
(ii) c ¼ 1 (both groups have the same WRE), the impact of an increase in nk onthe welfare is positive for S 2 ½0; 1Þ if
nk\nj þ 2� �2
nj:
(iii) ck ¼ c[ 1 (Group k has the highest WRE, or, equivalently, k ¼ H andcL\cH), the impact of an increase in nk on the welfare is positive for S 2½0; 1Þ if
nk\nj þ 2� �2
nj
or c[nj N þ 2ð Þ2
4nk nj þ 1� �2 :
Proof See Appendix 9.3. h
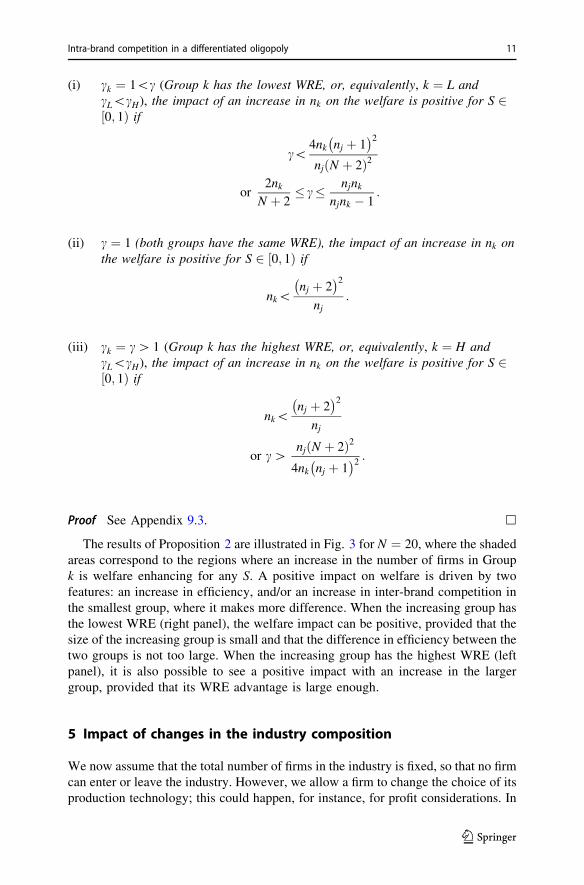
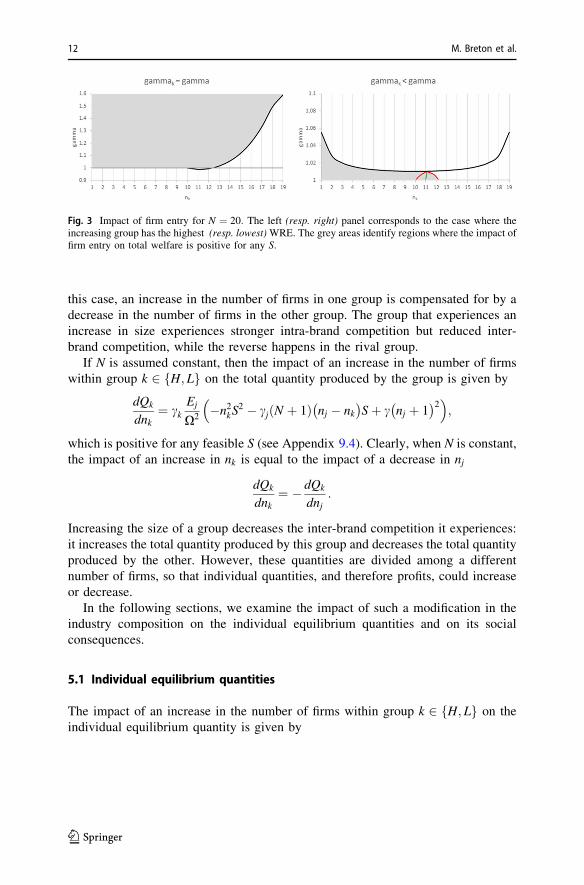
The results of Proposition 2 are illustrated in Fig. 3 for N ¼ 20, where the shaded
areas correspond to the regions where an increase in the number of firms in Group
k is welfare enhancing for any S. A positive impact on welfare is driven by two
features: an increase in efficiency, and/or an increase in inter-brand competition in
the smallest group, where it makes more difference. When the increasing group has
the lowest WRE (right panel), the welfare impact can be positive, provided that the
size of the increasing group is small and that the difference in efficiency between the
two groups is not too large. When the increasing group has the highest WRE (left
panel), it is also possible to see a positive impact with an increase in the larger
group, provided that its WRE advantage is large enough.
5 Impact of changes in the industry composition
We now assume that the total number of firms in the industry is fixed, so that no firm
can enter or leave the industry. However, we allow a firm to change the choice of its
production technology; this could happen, for instance, for profit considerations. In
123
Intra-brand competition in a differentiated oligopoly 11
this case, an increase in the number of firms in one group is compensated for by a
decrease in the number of firms in the other group. The group that experiences an
increase in size experiences stronger intra-brand competition but reduced inter-
brand competition, while the reverse happens in the rival group.
If N is assumed constant, then the impact of an increase in the number of firms
within group k 2 H; Lf g on the total quantity produced by the group is given by
dQk
dnk¼ ck
Ej
X2�n2kS
2 � cj N þ 1ð Þ nj � nk� �
Sþ c nj þ 1� �2�
;
which is positive for any feasible S (see Appendix 9.4). Clearly, when N is constant,
the impact of an increase in nk is equal to the impact of a decrease in nj
dQk
dnk¼ � dQk
dnj:
Increasing the size of a group decreases the inter-brand competition it experiences:
it increases the total quantity produced by this group and decreases the total quantity
produced by the other. However, these quantities are divided among a different
number of firms, so that individual quantities, and therefore profits, could increase
or decrease.
In the following sections, we examine the impact of such a modification in the
industry composition on the individual equilibrium quantities and on its social
consequences.
5.1 Individual equilibrium quantities
The impact of an increase in the number of firms within group k 2 H; Lf g on the
individual equilibrium quantity is given by
Fig. 3 Impact of firm entry for N ¼ 20: The left (resp. right) panel corresponds to the case where theincreasing group has the highest (resp. lowest)WRE. The grey areas identify regions where the impact offirm entry on total welfare is positive for any S.
123
12 M. Breton et al.
dqkdnk
¼ � dqkdnj
¼ oqkonk
� oqkonj
with j; k 2 H; Lf g and j 6¼ k;
where oqkonk
represents the marginal impact of an increase in intra-brand competition
and oqkonj
represents the marginal impact of an increase of inter-brand competition.
Proposition 3
(i) If nk � nj,
dqkdnk
� 0 for S 2 ½0; 1Þ:
(ii) If c ¼ 1 and nk [ 3Nþ14
, then there exists a Sk 2 ð0; 1Þ such that
dqkdnk
[ 0 for S 2 Sk; 1ð Þ:
(iii) If ck ¼ 1\c and nk [ nj, then there exists a S 2 ½0; 1Þ such that
dqkdnk
[ 0 for S 2 S; 1� �
:
(iv) If nk [ 3Nþ14
and 1\c\ 3n2L3nL nLþ1ð Þ�nHþ1
; then, if c is sufficiently small and nk is
sufficiently large, there exists an admissible range S1; S2ð Þ 2 ½0; 1Þ such that
dqkdnk
[ 0 for S1\S\S2:
(v) In all other cases, dqkdnk
\0 for all S 2 ½0; 1Þ and k 2 L;Hf g.
Proof See Appendix 9.5. h
A first result following from Proposition 3 is that, regardless of the market
conditions and the firms’ characteristics, a positive impact on the individual
equilibrium quantities can only be observed when the group that increases in size is
the largest one. This is due to a reduction of the negative impact of inter-brand
competition.
It is also important to note that, whenever dqkdnk
[ 0 for a given k 2 H; Lf g; it isalso the case that
dqjdnk
[ 0 for j 6¼ k. This is due to the fact that dqkdnk
[ 0 implies
123
Intra-brand competition in a differentiated oligopoly 13

nk [ nj, and thereforedqjdnj
¼ � dqjdnk
\0. This means that the sign of the marginal
impact of a change in the industry composition is the same in both groups.
From Proposition 3 we gather that the impact is positive in both groups when
• the increasing group is much larger than the other, the two groups have the same
WRE and products are highly substitutable (Case ii);• the increasing group is the largest, its WRE is the lowest and products are highly
substitutable (Case iii);• the increasing group is much larger than the other, its WRE is slightly higher
than the other and S is inside a range of feasible values (neither high nor low)
(Case iv).
Figures 4, 5, 6 illustrate the results of Proposition 3 for N ¼ 20. The shaded regions
are those where a shift from the smaller to the larger group has a positive impact on
the individual quantities in both groups. Elsewhere, any change in the industry
composition has a negative impact on the individual quantities in both groups.
Figure 4 illustrates Case i of Proposition 3: when both groups have the same
WRE, a positive impact on quantities can only happen when the increasing group is
much larger than the decreasing one (nk [ 3Nþ14
). In that case, the impact of the
increase in intra-brand competition in the larger group is compensated by the
decrease in inter-brand competition. This mechanism increases with S and with the
discrepancy in group sizes, as can be observed in Fig. 4.
Figures. 5 and 6 show how these areas are affected when the WRE of the two
groups are increasingly different. When the largest group is the least efficient
(nL [ nH), the area where an increase in group size has a positive impact on the
firms’ output enlarges: less firms are required, and the lower bound S shifts
downward from SL with increasing c. When however the largest group is the most
efficient (nH [ 3Nþ14
[ nL), the area where an increase in group size has a positive
Fig. 4 Range of values for S and nL where the impact of a change in the industry composition onindividual quantities is positive for N ¼ 20 and c ¼ 1. In the left shaded area, an increase in nH (i.e. in thelarger group) has a positive impact on quantities in both groups. In the right shaded area, an increase in nLhas a positive impact on quantities in both groups. For nL 2 5; 15½ �, the impact of any shift in thecomposition of the industry on individual quantities is negative for both groups
123
14 M. Breton et al.

impact on the firms’ output shrinks: more firms are required, the lower bound S1shifts upwards from SH and the upper bound S2 shifts downward from 1 with
increasing c. When c is sufficiently high, the left area vanishes and it is no longer
possible to obtain a positive impact of an increase in the number of H-type firms.
5.2 Social welfare
The following proposition characterizes the impact of a change in the industry
composition on consumers’ surplus and total welfare.
Fig. 5 Range of values for S and nL where the impact of a change in the industry composition onindividual quantities is positive. Parameter values are N ¼ 20 and c ¼ 1:1. In the left shaded area, anincrease in nH , the larger group, has a positive impact on quantities in both groups. In the right shadedarea, an increase in nL has a positive impact on quantities in both groups. For nL 2 3; 10½ �, the impact ofany shift in the composition of the industry on individual quantities is negative for all feasible S
Fig. 6 Range of values for S and nL where the impact of a change in the industry composition onindividual quantities is positive. Parameter values are N ¼ 20 and cH ¼ 1:5. In the interval between thetwo dots, an increase in nH , the larger group, has a positive impact on quantities in both groups. In theright shaded area, an increase in nLhas a positive impact on quantities in both groups. For nL 2 2; 10½ �, theimpact of any shift in the composition of the industry on individual quantities is negative for all feasible S
123
Intra-brand competition in a differentiated oligopoly 15
Proposition 4 The impact of an increase (resp. decrease) in the number of firms ingroup H (resp. L) on the consumers’ surplus and on the total welfare is positive forany admissible S when nH � nL.
The total welfare admits a unique maximum at enH 2 N=2;N½ �. The value of enH isincreasing in c.
Proof See Appendix 9.6. h
The results of Proposition 4 indicate that an intensification of intra-brand
competition has a positive impact on the consumers’ surplus and total welfare when
the increasing group is both the smallest and the most efficient. When firms have the
same WRE, the welfare maximizing industry composition is at enH ¼ N2. As c
increases, the welfare maximizing composition contains increasingly more H-typefirms. For very high values of c, it may be the case that total welfare is maximized
when the industry contains only H-type firms.
6 Market equilibrium
In this section, we investigate the equilibrium composition of the industry when the
total number of firms is fixed, assuming that producers switch from making one
variety to the other because of the relative profits of both industries.
Note that when the fixed cost does not differ across producer types, the highest
profit in the Cournot competition is achieved by the players with the highest Fkq2k .
This is no longer the case when the production of different varieties generates
different fixed production costs; then, comparing the profits of the groups of players
is a more complex problem.
The equilibrium quantities and, therefore, the profit of both kinds of producers
depend on the composition of the industry, which, for a fixed N, can be
characterized by n � nH .We define the continuous extensions pk : 0;N½ � ! R; k 2 H; Lf g of the
equilibrium profit of both kinds of producers as a function of n. An equilibrium
market composition is a number n� such that
pHðn�Þ ¼ pLðn�Þ. ð7Þ
The equilibrium condition (7) can be rewritten as
Lðn�Þ ¼ Rðn�Þ ð8Þ
where
LðnÞ ¼ cþ N � nð Þ c� Sð Þð Þ2�c 1þ n 1� Sð Þð Þ2 ð9Þ
123
16 M. Breton et al.

RðnÞ ¼ X2 fH � fLELEH
¼ d c N þ 1ð Þ þ n c� S2� �
N � nð Þ� �2
:
ð10Þ
The parameter d � fH�fLELEH
measures the fixed-cost difference between the two types of
technologies, normalized with respect to efficiency values.
We analytically derive conditions on the parameter d under which different
compositions of the industry arise in equilibrium, as stated in the following
proposition.
Proposition 5 Define
k1 �c� N 1� Sð Þ þ 1ð Þ2
c N þ 1ð Þ2
¼ LðNÞc N þ 1ð Þ2
k2 ��cþ N c� Sð Þ þ cð Þ2
c2 N þ 1ð Þ2
¼ Lð0Þc N þ 1ð Þ2
.
At equilibrium,
(i) if 0\k2 � d, then the industry consists only of type-L firms;(ii) if k1\d\k2, then the two types of firms coexist in the industry;(iii) otherwise, d� k1 and the industry consists only of type-H firms.
Proof See Appendix 9.7. h
Note that the equilibrium solution when the industry is populated by a single type
of firm is readily obtained by setting nL ¼ 0 in (3) or nH ¼ 0 in (4). Using
R 0ð Þ ¼ RðNÞ ¼ dc2 N þ 1ð Þ2, Condition (i) of Proposition 5 implies that
0\L0 �R0, Condition (ii) implies that LðNÞ\RðNÞ and Rð0Þ\Lð0Þ, while
Condition (iii) implies that RðNÞ� LðNÞ: As indicated in the proof of Proposition 5,
the monotonicity and convexity properties of functions L and R allow to obtain the
location of their intersection point according to the position of d, as illustrated in
Fig. 7.
Fig. 7 Illustration of the three cases in Proposition 5. Parameter values are N ¼ 20, S ¼ 0:98, c ¼ 2:
123
Intra-brand competition in a differentiated oligopoly 17

Accordingly, when d� k2, that is, when the fixed cost for H-type firms is
relatively high, the profit of L-type firms is higher than that of H-type firms for all
possible industry configuration. As a consequence, it is profitable for firms to adopt
the L technology, and at equilibrium the industry is populated by L firms only. The
reverse is true when d� k1, that is, when the fixed cost for H -type firms is relatively
low. When k1\d\k2, then there exists an equilibrium configuration n� where bothtypes of firms coexist and have equal profits. Figure 8 shows how the bounds k1 andk2 vary with S and c.
To conclude, it may be interesting to identify policy measures that could lead to a
change in the industry composition; in particular, we can identify from the results of
Proposition 5 how changes in some parameter values could allow the entry of a new
technology, or a change in the proportion of type-L and type-H firms (see
Appendix 9.8). Appropriate policies could be used, for instance, to bring the
equilibrium composition closer to the social welfare optimizing composition, as
indicated in Proposition 4.
P1 Starting from an industry with only type-L firms, type-H firms appear with
increases in k2 and decreases in d, that is :
1. Decreases in S (less substitutable products);
2. Increases in FL
FH(higher (resp. lower) price sensitivity for L (resp. H) products;
3. Smaller (resp. larger) fixed cost for producers of type H ( resp. of type L).
P2 Starting from an industry with only type-H firms, type-L firms appear with
decreases in k1 and increases in d, that is:
1. Decreases in S (less substitutable products);
2. Decreases in FL
FH(higher (resp. lower) price sensitivity for H (resp.
L) products).3. Larger (resp. smaller) fixed cost producers of type H ( resp. of type L).
P3 Starting from a mixed industry, more type-H firms appear with decreases in
fH or increases in fL:
Fig. 8 This graph shows the behaviour of k1 and k2 as a function of S and c for N ¼ 20:
123
18 M. Breton et al.

7 Application: green and brown products
In this section, we investigate whether or not the results found for the general
oligopoly with two varieties can be further refined. Instead of adopting simplifying
assumptions on the parameters, we make conjectures about their relative values, and
our assumptions are inspired by what we would expect in an industry with a certified
‘‘green’’ product and a conventional ‘‘brown’’ one. Examples of such green products
are those accredited by Fairtrade, the Rainforest Alliance, the Forest Stewardship
Council (FSC) and the Marine Stewardship Council (MSC).
The adoption of a production practice adequate for green certification is captured
by the marginal cost mG and the fixed cost fG: We assume that
mG [mB,
that is, that the technology implemented to produce a certified green product is more
expensive than the one adopted to make a conventional one. Moreover, the certi-
fication process generates a fixed cost that adds up to any other fixed cost borne by a
conventional brown producer; so we assume that
fG [ fB.
On the demand side, we make no prior assumptions on the relative sensitivity of
consumers to the price of each product variety, that is,
FG\ ¼ [FB.
However, we assume that consumers are willing to pay a premium price for a
labelled green product. We model this green premium by assuming that when a
quantity QG þ QB is produced, the price of the green variety product is higher, for
any feasible QG and QB:
AG � FGQG � SQB [AB � FBQB � SQG,
which translates into a higher choke price, that is,
AG [AB,
with the additional condition
AGFB [ABFG,
which is always satisfied if FB �FG. The green premium is then defined as the
difference AG � AB.
Given these assumptions on the parameters, the stability condition (8) and the
comparative statics results remain valid, and we can find numerical examples
satisfying all three possibilities listed in Proposition 5 for the steady-state industry
composition.
We now provide some numerical illustrations that represent various industry
compositions. For comparison purposes, we normalize the values of parameters AB;
123
Intra-brand competition in a differentiated oligopoly 19
FB and fB in all numerical experiments to AB ¼ 200, FB ¼ 1 and fB ¼ 0, so that cL isno longer necessarily equal to 1.
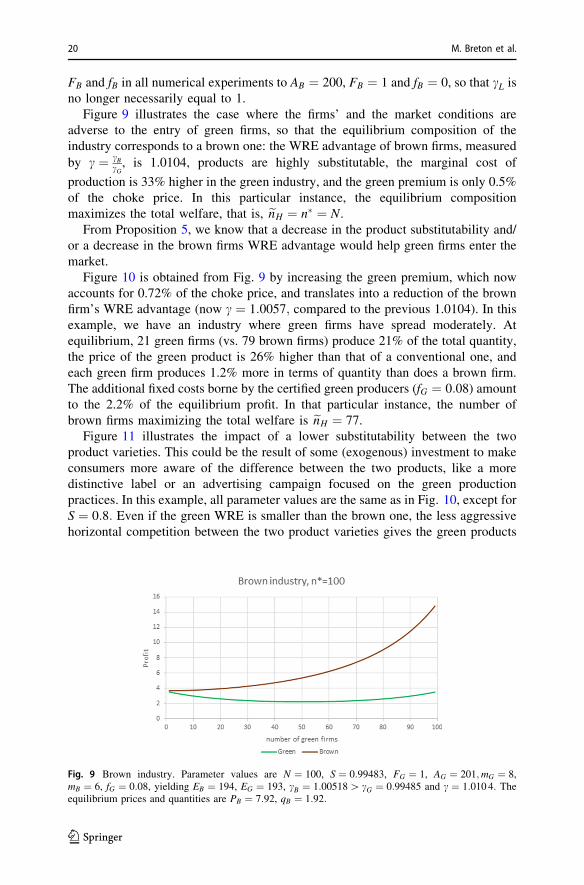
Figure 9 illustrates the case where the firms’ and the market conditions are
adverse to the entry of green firms, so that the equilibrium composition of the
industry corresponds to a brown one: the WRE advantage of brown firms, measured
by c ¼ cBcG, is 1.0104, products are highly substitutable, the marginal cost of
production is 33% higher in the green industry, and the green premium is only 0.5%
of the choke price. In this particular instance, the equilibrium composition
maximizes the total welfare, that is, enH ¼ n� ¼ N.From Proposition 5, we know that a decrease in the product substitutability and/
or a decrease in the brown firms WRE advantage would help green firms enter the
market.
Figure 10 is obtained from Fig. 9 by increasing the green premium, which now
accounts for 0.72% of the choke price, and translates into a reduction of the brown
firm’s WRE advantage (now c ¼ 1:0057; compared to the previous 1.0104). In this
example, we have an industry where green firms have spread moderately. At
equilibrium, 21 green firms (vs. 79 brown firms) produce 21% of the total quantity,
the price of the green product is 26% higher than that of a conventional one, and
each green firm produces 1.2% more in terms of quantity than does a brown firm.
The additional fixed costs borne by the certified green producers (fG ¼ 0:08) amount
to the 2.2% of the equilibrium profit. In that particular instance, the number of
brown firms maximizing the total welfare is enH ¼ 77.
Figure 11 illustrates the impact of a lower substitutability between the two
product varieties. This could be the result of some (exogenous) investment to make
consumers more aware of the difference between the two products, like a more
distinctive label or an advertising campaign focused on the green production
practices. In this example, all parameter values are the same as in Fig. 10, except for
S ¼ 0:8: Even if the green WRE is smaller than the brown one, the less aggressive
horizontal competition between the two product varieties gives the green products
Fig. 9 Brown industry. Parameter values are N ¼ 100, S ¼ 0:99483, FG ¼ 1, AG ¼ 201;mG ¼ 8,mB ¼ 6, fG ¼ 0:08, yielding EB ¼ 194, EG ¼ 193, cB ¼ 1:00518[ cG ¼ 0:99485 and c ¼ 1:010 4: Theequilibrium prices and quantities are PB ¼ 7:92, qB ¼ 1:92:
123
20 M. Breton et al.

more room in the market. This results in a larger number (49) of green firms as well
as a higher profit, selling price and production quantity for both kinds of producers.
In this industry, green firms produce 49.3% of the total quantity, the price of the
green product is 25% higher than that of the conventional one, and each green firm
produces 1.3% more in terms of quantity than does a brown firm. The fixed green
certification cost accounts for 1.8% of the equilibrium profit. Note that the number
of brown firms that maximizes total welfare in this case is enH ¼ 51, so that the
equilibrium market composition is optimal.
To have a more substantial presence of green firms in the industry, reducing the
fixed cost is not enough; we need the green WRE to be higher than the brown one.
This is shown by the next two numerical examples where a high green penetration
occurs, regardless of the level of horizontal product competition.
Fig. 10 Mixed industry. Parameter values are N ¼ 100, S ¼ 0:99483, FG ¼ 1, AG ¼ 201:45;mG ¼ 8,mB ¼ 6, fG ¼ 0:08, yielding EB ¼ 194, EG ¼ 193:45, cB ¼ 1:00284[ cG ¼ 0:99716 and c ¼ 1: 005 7:The equilibrium prices and quantities are PG ¼ 9:94, PB ¼ 7:92, qG ¼ 1:94, qB ¼ 1:92:
Fig. 11 Mixed industry. Parameter values are N ¼ 100, S ¼ 0:8, FG ¼ 1, AG ¼ 201:45;mG ¼ 8, mB ¼ 6,fG ¼ 0:08, yielding EB ¼ 194, EG ¼ 193:45, cB ¼ 1:00284[ cG ¼ 0:99716 and c ¼ 1: 005 7: Theequilibrium prices and quantities are PG ¼ 10:14, PB ¼ 8:12, qG ¼ 2:143, qB ¼ 2:115:
123
Intra-brand competition in a differentiated oligopoly 21
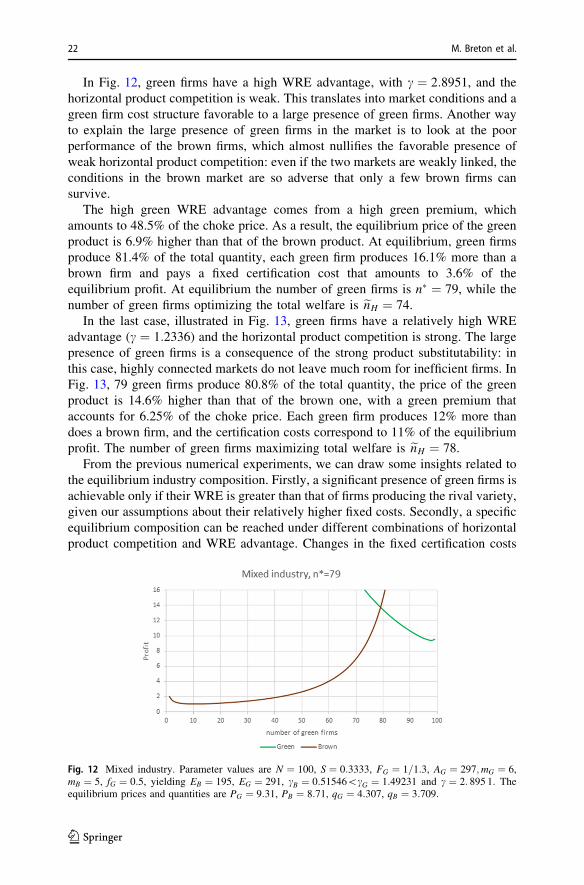
In Fig. 12, green firms have a high WRE advantage, with c ¼ 2:8951, and the
horizontal product competition is weak. This translates into market conditions and a
green firm cost structure favorable to a large presence of green firms. Another way
to explain the large presence of green firms in the market is to look at the poor
performance of the brown firms, which almost nullifies the favorable presence of
weak horizontal product competition: even if the two markets are weakly linked, the
conditions in the brown market are so adverse that only a few brown firms can
survive.
The high green WRE advantage comes from a high green premium, which
amounts to 48.5% of the choke price. As a result, the equilibrium price of the green
product is 6.9% higher than that of the brown product. At equilibrium, green firms
produce 81.4% of the total quantity, each green firm produces 16.1% more than a
brown firm and pays a fixed certification cost that amounts to 3.6% of the
equilibrium profit. At equilibrium the number of green firms is n� ¼ 79, while the
number of green firms optimizing the total welfare is enH ¼ 74.
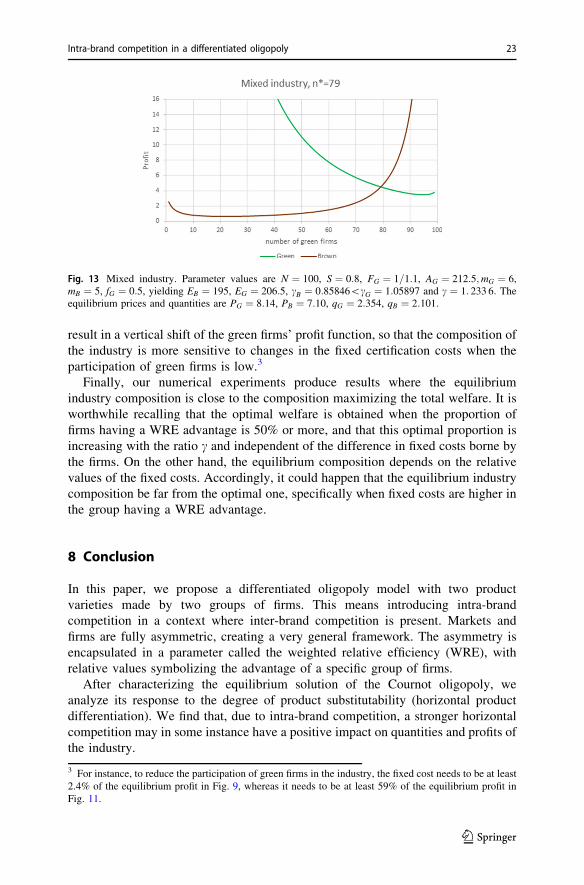
In the last case, illustrated in Fig. 13, green firms have a relatively high WRE
advantage (c ¼ 1:2336) and the horizontal product competition is strong. The large
presence of green firms is a consequence of the strong product substitutability: in
this case, highly connected markets do not leave much room for inefficient firms. In
Fig. 13, 79 green firms produce 80.8% of the total quantity, the price of the green
product is 14.6% higher than that of the brown one, with a green premium that
accounts for 6.25% of the choke price. Each green firm produces 12% more than
does a brown firm, and the certification costs correspond to 11% of the equilibrium
profit. The number of green firms maximizing total welfare is enH ¼ 78.
From the previous numerical experiments, we can draw some insights related to
the equilibrium industry composition. Firstly, a significant presence of green firms is
achievable only if their WRE is greater than that of firms producing the rival variety,
given our assumptions about their relatively higher fixed costs. Secondly, a specific
equilibrium composition can be reached under different combinations of horizontal
product competition and WRE advantage. Changes in the fixed certification costs
Fig. 12 Mixed industry. Parameter values are N ¼ 100, S ¼ 0:3333, FG ¼ 1=1:3, AG ¼ 297;mG ¼ 6,mB ¼ 5, fG ¼ 0:5, yielding EB ¼ 195, EG ¼ 291, cB ¼ 0:51546\cG ¼ 1:49231 and c ¼ 2: 895 1: Theequilibrium prices and quantities are PG ¼ 9:31, PB ¼ 8:71, qG ¼ 4:307, qB ¼ 3:709:
123
22 M. Breton et al.
result in a vertical shift of the green firms’ profit function, so that the composition of
the industry is more sensitive to changes in the fixed certification costs when the
participation of green firms is low.3
Finally, our numerical experiments produce results where the equilibrium
industry composition is close to the composition maximizing the total welfare. It is
worthwhile recalling that the optimal welfare is obtained when the proportion of
firms having a WRE advantage is 50% or more, and that this optimal proportion is
increasing with the ratio c and independent of the difference in fixed costs borne by
the firms. On the other hand, the equilibrium composition depends on the relative
values of the fixed costs. Accordingly, it could happen that the equilibrium industry
composition be far from the optimal one, specifically when fixed costs are higher in
the group having a WRE advantage.
8 Conclusion
In this paper, we propose a differentiated oligopoly model with two product
varieties made by two groups of firms. This means introducing intra-brand
competition in a context where inter-brand competition is present. Markets and
firms are fully asymmetric, creating a very general framework. The asymmetry is
encapsulated in a parameter called the weighted relative efficiency (WRE), with
relative values symbolizing the advantage of a specific group of firms.
After characterizing the equilibrium solution of the Cournot oligopoly, we
analyze its response to the degree of product substitutability (horizontal product
differentiation). We find that, due to intra-brand competition, a stronger horizontal
competition may in some instance have a positive impact on quantities and profits of
the industry.
3 For instance, to reduce the participation of green firms in the industry, the fixed cost needs to be at least
2.4% of the equilibrium profit in Fig. 9, whereas it needs to be at least 59% of the equilibrium profit in
Fig. 11.
Fig. 13 Mixed industry. Parameter values are N ¼ 100, S ¼ 0:8, FG ¼ 1=1:1, AG ¼ 212:5;mG ¼ 6,mB ¼ 5, fG ¼ 0:5, yielding EB ¼ 195, EG ¼ 206:5, cB ¼ 0:85846\cG ¼ 1:05897 and c ¼ 1: 233 6: Theequilibrium prices and quantities are PG ¼ 8:14, PB ¼ 7:10, qG ¼ 2:354, qB ¼ 2:101:
123
Intra-brand competition in a differentiated oligopoly 23

We also study the consequences and welfare impacts of changes in the industry
composition. We analyze both unilateral (long-term) changes and changes resulting
from industries switching from one group to the other. Such changes are to be
understood as the possibility for a firm to adjust its production practice and join the
group producing the alternative product variety when the total number of players in
the industry is fixed. Assuming that such behavior is driven by profit considerations,
we further characterize the equilibrium composition of the market.
Our results depend on the relative WRE of the two types of firms, as well as on
the market composition, making them very general and encompassing previous
developments found in the literature. Finally, numerical simulations are provided in
the context of brown and green production processes, and are used to illustrate
theoretical results.
Open Access This article is licensed under a Creative Commons Attribution 4.0 International License,
which permits use, sharing, adaptation, distribution and reproduction in any medium or format, as long as
you give appropriate credit to the original author(s) and the source, provide a link to the Creative
Commons licence, and indicate if changes were made. The images or other third party material in this
article are included in the article’s Creative Commons licence, unless indicated otherwise in a credit line
to the material. If material is not included in the article’s Creative Commons licence and your intended
use is not permitted by statutory regulation or exceeds the permitted use, you will need to obtain
permission directly from the copyright holder. To view a copy of this licence, visit http://
creativecommons.org/licenses/by/4.0/.
Appendix
Proof of Proposition 1
The impact of S on the equilibrium quantity of a firm in group k is
dqkdS
¼ Ejnj
X2�S2njnk þ 2Scknk nj þ 1
� �� c nk þ 1ð Þ nj þ 1
� �� �; k; j 2 L;Hf g; k 6¼ j
¼ Ejnj
X2UkðSÞ:
To ease notation, define ak � nkþ1nk
, k 2 H; Lf g. UkðSÞ is a concave parabola with a
negative intercept and roots
ckaj ffiffiffiffiffiffiDk
p
Dk ¼ ckaj ckaj � cjak� �
; k; j 2 L;Hf g; k 6¼ j;
where ckaj [ 1. This means that UkðSÞ can only be positive if Dk � 0 and if the
smallest root ajck �ffiffiffiffiffiffiDk
pis an interior feasible value for S, that is,
0\ajck �ffiffiffiffiffiffiDk
p\1:
1. When S vanishes (products are independent), UkðSÞ\0 for k 2 L;Hf g.2. For S[ 0, if caL ¼ aH , then DH ¼ DL ¼ 0 and UkðSÞ\0 for k 2 L;Hf g and
S 2 0; 1ð Þ.3. For S[ 0 and caL 6¼ aH , we will consider two distinct cases.
123
24 M. Breton et al.

(a) caL [ aHIn that case, DH [ 0 and DL\0. We then have ULðSÞ \0 and UHðSÞ70,
depending on the value of S. The smallest root of UHðSÞ is
SH � aLc�ffiffiffiffiffiffiffiffiffiffiffiffiffiffiffiffiffiffiffiffiffiffiffiffiffiffiffiffiaLc aLc� aHð Þ
p[ 0:
Assume that c[ nLnHnLþ1ð Þ nH�1ð Þ, which satisfies the assumption caL [ aH :
caL � aH [nLnH
nL þ 1ð Þ nH � 1ð Þ aL � aH
¼ 1
nH nH � 1ð Þ [ 0:
Note that this condition is always satisfied for nH [ nL þ 1:The condition
c[nLnH
nL þ 1ð Þ nH � 1ð Þ
is equivalent to
aLc� 1ð Þ2\aLc aLc� aHð Þ:
Taking positive roots on both sides yields
aLc� 1\ffiffiffiffiffiffiffiffiffiffiffiffiffiffiffiffiffiffiffiffiffiffiffiffiffiffiffiffiaLc aLc� aHð Þ
p:
Therefore, the root SH is strictly inside the feasible interval, 0\SH\1,
and UH [ 0 for S 2 SH ; 1ð Þ.When c ¼ 1; condition c[ nLnH
nLþ1ð Þ nH�1ð Þ reduces to nH [ nL þ 1: In that
case, UHðSÞ[ 0 if nH [ nL þ 1.
(b) caL\aHIn that case, DH\0 and DL [ 0. We then have UHðSÞ \0 and ULðSÞ70,
depending on the value of S. The smallest root of ULðSÞ is
SL � aH �ffiffiffiffiffiffiffiffiffiffiffiffiffiffiffiffiffiffiffiffiffiffiffiffiffiffiffiaH aH � aLcð Þ
p[ 0:
Assume that c\ nL nHþ2ð ÞnLþ1ð Þ nHþ1ð Þ, which satisfies the assumption caL\aH :
caL � aH\nL nH þ 2ð Þ
nL þ 1ð Þ nH þ 1ð Þ aL � aH
¼ � 1
nH nH þ 1ð Þ\0:
Note that this condition can only be satisfied for nH\nL � 1.
The condition
c\nL nH þ 2ð Þ
nL þ 1ð Þ nH þ 1ð Þ
is equivalent to
123
Intra-brand competition in a differentiated oligopoly 25

aH � 1ð Þ2\aH aH � aLcð Þ:
Taking positive roots on both sides yields
aH � 1\ffiffiffiffiffiffiffiffiffiffiffiffiffiffiffiffiffiffiffiffiffiffiffiffiffiffiffiaH aH � aLcð Þ
p:
Therefore, the root SL is strictly inside the feasible interval, 0\SL\1,
and UL [ 0 for S 2 SL; 1ð Þ.When c ¼ 1; condition c[ nLnH
nLþ1ð Þ nH�1ð Þ reduces to nL [ nH þ 1: In that
case, ULðSÞ[ 0 if nL [ nH þ 1.
Impact of firm entry on consumers’ surplus
The consumers’ surplus is
CS ¼ 1
2
EH
ELQ2
H þ SQHQL þc2
EL
EHQ2
L:
We then have
dCS
dnk¼ oCS
oQk
dQk
dnkþ oCS
oQj
dQj
dnk
¼ SQj þcjEk
EjQk
� �cnj þ 1
Xqk � SQk þ
ckEj
EkQj
� �ScjEknj
XEjqk
¼ qkScEjQj þ cjEkQk cþ nj c� S2ð Þ
� �
XEj;
which is strictly positive for S\c:
Proof of Proposition 2
The impact on total welfare is
dW
dnk¼ dCS
dnkþ dPS
dnk
¼ cqkXEj
cjEkqk nj þ 1� �
� SEjnjqj� �
¼ EkcqkX2
UðSÞ
where
123
26 M. Breton et al.

UðSÞ � njnkS2 � Scjnj N þ 2ð Þ þ c nj þ 1
� �2:
When S ¼ 0; Uð0Þ ¼ c nj þ 1� �2 [ 0. When N ¼ 2;UðSÞ ¼ 4 c� Scj
� �þ S2 [ 0:
Note that UðSÞ is a convex quadratic function, positive and decreasing at S ¼ 0,
with a minimum at 12cj
Nþ2nk
[ 0:
The function UðSÞ is positive on [0, 1) if it has no roots, that is if
c2j nj N þ 2ð Þ2�4nkc nj þ 1� �2\0; ð11Þ
or if it is non-negative and non-increasing at S ¼ 1, that is if
njnk � cjnj N þ 2ð Þ þ c nj þ 1� �2 � 0 ð12Þ
2nk � cj N þ 2ð Þ� 0: ð13Þ
We will consider three cases.
(i) ck\c (the increasing group has the smallest WRE). Conditions (11)-(13)
become respectively
c\4nk nj þ 1
� �2
nj N þ 2ð Þ2
c� njnknjnk � 1
c� 2nkN þ 2
where the lower bound 2nkNþ2
� 1 for nk � nj þ 2 and is larger than the upper
boundnjnk
njnk�1when nk [ nj þ 2þ 2=nj:
(ii) c ¼ 1 (both groups have the same WRE). Conditions (11)-(13) become
respectively
4nj þ nj nj � nk� �
þ 4� �
nj � nk� �
\0
njnk � nj N þ 2ð Þ þ nj þ 1� �2 ¼ 1[ 0
nk � nj þ 2:
Note that Condition (11) is equivalent to nj\ nk\njþ2ð Þ2nj
and that
nj þ 2\njþ2ð Þ2nj
, so that Conditions (11)-(13) reduce to
nk\nj þ 2� �2
nj:
123
Intra-brand competition in a differentiated oligopoly 27

(iii) ck ¼ c[ 1 (the increasing group has higher WRE). Conditions (11)-(13)
become respectively
c[nj N þ 2ð Þ2
4nk nj þ 1� �2
njnk � nj N þ 2ð Þ þ c nj þ 1� �2 [ 1[ 0
nk � nj þ 2:
Note thatnj Nþ2ð Þ2
4nk njþ1ð Þ2 ¼ 1þ 14
4njþn2j �njnkþ4ð Þ nj�nkð Þnk njþ1ð Þ2 , so that Condition ( 11) is
always satisfied if nj\nk\njþ2ð Þ2nj
.
Impact of intra-brand competition on total quantities in each group
The total quantity produced by group k is given by
Qk ¼ Ejnkck N � nk þ 1ð Þ � S N � nkð Þ
c N � nk þ 1ð Þ nk þ 1ð Þ � S2 N � nkð Þnk.
The impact of an intensification of intra-brand competition on the total quantity
produced by the group is then
dQk
dnk¼ ckEj
�S2n2k � Scj nj � nk� �
N þ 1ð Þ þ c nj þ 1� �2
X2:
We will consider two distinct cases.
(i) nj � nk We then have
dQk
dnk[ ckEj
�cn2k � c nj � nk� �
N þ 1ð Þ þ c nj þ 1� �2
X2
¼ cckEjN þ 1
X2[ 0:
(ii) nj\nkWe then have
dQk
dnk[ ckEj
�S2n2k þ S2 nk � nj� �
N þ 1ð Þ þ S2 nj þ 1� �2
X2
¼ S2ckEjN þ 1
X2[ 0:
123
28 M. Breton et al.

Proof of Proposition 3
For k; j 2 H; Lf g and k 6¼ j;
dqkdnk
¼ � dqkdnj
¼ Ej
X2UkðSÞ
where
UkðSÞ � �n2j S3 þ ck nj � nk þ n2j
� S2 þ c nj þ nk þ n2j þ 1
� S� ckc nj þ 1
� �2:
Uk is a third-degree polynomial of S, negative and increasing in S at S ¼ 0, which
admits two or no positive roots by Descartes’ rule of sign.
1. Assume nk � nj. We then have
ck nj � nk þ n2j
� � Sn2j � n2j ck � Sð Þ[ 0;
so that, using S2\c,
UkðSÞ ¼ S2 ck nj � nk þ n2j
� � Sn2j
� þ Sc N þ n2j þ 1
� � ckc nj þ 1
� �2
\c ck nj � nk þ n2j
� � Sn2j
� þ Sc N þ n2j þ 1
� � ckc nj þ 1
� �2
¼ �c N þ 1ð Þ ck � Sð Þ\0:
We conclude that UkðSÞ\0 for all feasible S when nk � nj .
2. Assume nk [ nj. We will distinguish three cases according to the value of ck.
(a) ck ¼ cj ¼ 1
In the symmetric case,
UkðSÞ ¼ 1� Sð Þ S2n2j � S nj � nk� �
� nj þ 1� �2�
:
This polynomial has two positive roots, 1 and
Sk ¼1
2n2jnj � nk þ
ffiffiffiffiffiffiffiffiffiffiffiffiffiffiffiffiffiffiffiffiffiffiffiffiffiffiffiffiffiffiffiffiffiffiffiffiffiffiffiffiffiffiffiffiffiffiffiffiffi4n2j nj þ 1
� �2þ nj � nk� �2
q� �[ 0:
At S ¼ 1;
dUk
dS¼ 3nj � nk þ 1 ¼ 3N þ 1� 4nk:
If 3N þ 1� 4nk � 0, then Uk is non-decreasing in S at S ¼ 1 , and
therefore Sk � 1 and UkðSÞ\0 for all S 2 ½0; 1Þ:Otherwise, nk [ 3Nþ1
4, Sk\1 and UkðSÞ[ 0 for S 2 Sk; 1ð Þ:
Therefore UkðSÞ[ 0 for S 2 Sk; 1ð Þ when nk [ 3Nþ14
[ nj:
(b) ck ¼ 1\cAt S ¼ 1;
123
Intra-brand competition in a differentiated oligopoly 29

Ukð1Þ ¼ �n2j þ nj � nk þ n2j
� þ c N þ n2j þ 1
� � c nj þ 1
� �2
¼ c� 1ð Þ nk � nj� �
[ 0:
Therefore Uk [ 0 when S is large enough.
(c) ck ¼ c[ 1
At S ¼ 1;
Ukð1Þ ¼ �n2j þ c nj � nk þ n2j
� þ c N þ n2j þ 1
� � c2 nj þ 1
� �2
¼ � c� 1ð Þ cþ 2cnj þ n2j c� 1ð Þ�
\0
and
U0kð1Þ ¼ �3n2j þ 2c nj � nk þ n2j
� þ c N þ n2j þ 1
�
¼ c 3nj nj þ 1� �
� nk þ 1� �
� 3n2j :
If c� 3n2j
3nj njþ1ð Þ�nkþ1ð Þ, U0Hð1Þ� 0 and therefore UHðSÞ\0 for all
S 2 ½0; 1Þ.Otherwise 1\c\
3n2j
3nj njþ1ð Þ�nkþ1ð Þ ; which can only happen if nk [ 3Nþ14
:
In that case, UkðSÞ has either no roots or two positive roots in [0, 1). SinceUkðSÞ has two positive roots at c ¼ 1 for nk [ 3Nþ1
4, UkðSÞ has two
positive roots that are smaller than 1 if c is sufficiently small and nk is
sufficiently large.
Welfare impact of a change in industry composition
Clearly, since the total number of firms is constant, the impact of an increase in nkon global quantities (consumers’ surplus and total welfare) is equal to the impact of
a decrease in nj. Without loss of generality, in this proof we will assume that k ¼ H
and j ¼ L, so that ck ¼ c� 1 and cj ¼ 1.
To alleviate notation, define for k 2 H; Lf g
Zk � ck nj þ 1� �
� Snj
¼ qkEj
X[ 0:
Consumers’ surplus
The impact of an increase in the number of firms in group k on the consumers’
surplus is given by
123
30 M. Breton et al.

dCS
dnk¼ oCS
onk� oCS
onj
¼ qkScEjQj þ EkQk cþ nj c� S2ð Þ
� �
XEj
� qjScEkQk þ cEjQj cþ nk c� S2ð Þð Þ
XEk
¼ EjEk
X3WC cð Þ
where
WC cð Þ ¼ c Z2k nk � cZ2
j nj
� þ njnk c� S2
� �Z2k � cZ2
j
� þ ScZjZk nj � nk
� �:
(i) nj ¼ nk:
In that case,
WC cð Þ ¼ n Z2k � cZ2
j
� cþ n c� S2
� �� �
¼ n c� 1ð Þ cþ 2ncþ n2 c� S2� �� �
cþ n c� S2� �� �
;
so that WC is null at c ¼ 1 and strictly positive for c[ 1:(ii) c ¼ 1; nj 6¼ nk:
In that case,
WCð1Þ ¼ Z2k nk � Z2
j nj
� þ njnk 1� S2
� �Z2k � Z2
j
� þ SZjZk nj � nk
� �
¼ nj � nk� �
1� Sð Þ njnk N 1� Sð Þ þ 3ð Þ 1� S2� �
þ SN � 1� �
where, using njnk ¼ nk N � nkð Þ� N � 1ð Þ and N � 2;
njnk N 1� Sð Þ þ 3ð Þ 1� S2� �
þ SN � 1
� N � 1ð Þ N 1� Sð Þ þ 3ð Þ 1� S2� �
þ SN � 1
¼ 1� S2� �
1� Sð ÞN2 þ N 2S 1� Sð Þ þ 2� S3� �
þ 3S2 � 4
� 4 1� S2� �
1� Sð Þ þ 2 2S 1� Sð Þ þ 2� S3� �
þ 3S2 � 4
¼ 2� Sð Þ Sþ 2 1� S2� �� �
[ 0:
We conclude that WCð1Þ is strictly positive if nj [ nk and strictly negative if
nk [ nj.
123
Intra-brand competition in a differentiated oligopoly 31

(iii) c[ 1; nj [ nk:
We will show that WC is increasing in c when nj [ nk. Since WCð1Þ[ 0 for
nj [ nk, this implies that WCðcÞ[ 0 for c� 1.
WC cð Þ ¼ c3nk nj þ 1� �3�c2nj nk þ 1ð Þ3
þ c2S2nk N � nj 3nj þ n2j þ n2k þ 3� �
þ c2S nj � nk� �
N � njnk 2N þ 3ð Þ þ 1� �
þ cS3 Snjn3k þ njnk nj � nk
� �2N þ 3ð Þ
� �
þ cS2nj �N þ nk 3nk þ n2j þ n2k þ 3� �
� S4n3j nk:
WC is a third-degree polynomial in c. It is increasing in c for c[ 1 if it is
increasing and convex at c ¼ 1:
1. WC is increasing at c ¼ 1:
W0Cð1Þ ¼ S4njn
3k þ S3njnk nj � nk
� �2N þ 3ð Þ
� S2 3njnk 2nj � nk� �
þ nj nj þ n2j nk þ n3k
� þ 2nk nj � nk
� ��
� 2S nj � nk� �
�N � 1þ njnk 2N þ 3ð Þ� �
� 2nj þ 3nk þ njnk 3 3nj � 2nk þ 1� �
þ 3n2j � 2n2k
�
� UC1ðSÞ:
UC1ðSÞ is positive on 0; 1½ � if it is positive at S ¼ 1 and decreasing on 0; 1½ �: It isdecreasing on 0; 1½ � if U0
C1ð0Þ\0, U0C1ð1Þ\0 and U000
C1ðSÞ� 0:
UC1ð1Þ[ 0
UC1ð1Þ ¼ nk þ n2j þ njnk [ 0:
U0C1ð0Þ\0
U0C1ð0Þ ¼ �2 nj � nk
� ��N � 1þ njnk 2N þ 3ð Þ� �
\� 2 nj � nk� �
�N � 1þ N � 1ð Þ 2N þ 3ð Þð Þ¼ �4 nj � nk
� �N2 � 2� �
\0:
U0C1ð1Þ\0
123
32 M. Breton et al.

U0C1ð1Þ ¼ 4njn
3k þ 3njnk nj � nk
� �2N þ 3ð Þ
� 2 3njnk 2nj � nk� �
þ nj nj þ n2j nk þ n3k
� þ 2nk nj � nk
� ��
� 2 nj � nk� �
�N þ njnk 2N þ 3ð Þ � 1� �
¼ 2 nj � nk� �
� 2nk 2nj � nk� �
� 3njnk 3nj � nk� �
¼ \� 2 nk � 1ð Þ nj � nk� �
� 3njnk 3nj � nk� �
\0:
U000C1ðSÞ� 0
U000C1ðSÞ ¼ 24Snjn
3k þ 6njnk nj � nk
� �2N þ 3ð Þ[ 0:
We conclude that WC is increasing at c ¼ 1:
2. WC is convex. Now, to show that WC cð Þ is convex at 1,
W00Cð1Þ ¼ 6nk nj þ 1
� �3�2nj nk þ 1ð Þ3
� 2S2nk 2nj � nk þ njn2k þ 3n2j þ n3j
�
þ 2S nj � nk� �
N þ 1� njnk 2N þ 3ð Þ� �
�UC2ðSÞ:
UC2ðSÞ is positive on 0; 1½ � if UC2ð0Þ[ 0; UC2ð1Þ[ 0 and U00C2ðSÞ� 0:
UC2ð0Þ[ 0
UC2ð0Þ ¼ 2 3nk � nj þ njnk 9nj � 3nk þ 3n2j � n2k þ 6� �
[ 2 3nk � N � 1ð Þ þ N � 1ð Þ 9nj � 3nk þ 3n2j � n2k þ 6� �
¼ 2 3nk þ N � 1ð Þ 9nj � 3nk þ 3n2j � n2k þ 5� �
[ 0:
UC2ð1Þ[ 0
UC2ð1Þ ¼ 2 2nk þ 3n2j nk þ n2j þ 4njnk
� [ 0:
U00C2ðSÞ� 0
U00C2ðSÞ ¼ �4nk 2nj � nk þ njn
2k þ 3n2j þ n3j
� \0:
123
Intra-brand competition in a differentiated oligopoly 33

We conclude that the impact on the consumers’ surplus is strictly positive when
nj [ nk for c[ 1.
(iv) c[ 1; nj\nkWe have shown that WCðcÞ is strictly positive at nj ¼ nk for c[ 1. Since WC
is a third degree polynomial in c3 and its third derivative is positive,
WCðcÞ[ 0 for all nk when c is sufficiently large. For intermediate values of c,WCðcÞ may be negative for nj\nk.
Total welfare
The impact of an increase in the number of firms in group k ¼ H on the total welfare
is
dW
dnk¼ EjEk
X3cWWðcÞ
where
WWðcÞ ¼ Z2k nj þ 1� �
� cZ2j nk þ 1ð Þ � SZjZk nj � nk
� �:
(i) nk ¼ njIn that case,
WWðcÞ ¼ Z2k � cZ2
j
� nþ 1ð Þ
¼ nþ 1ð Þ c� 1ð Þ c nþ 1ð Þ2�S2n2�
� 0;
with WWðcÞ[ 0 for c[ 1:(ii) c ¼ 1; nk 6¼ nj
In that case,
WWð1Þ ¼ 1� Sð Þ nj � nk� �
UW1ðSÞ
where
UW1ðSÞ � N N 1� Sð Þ � 2Sþ 3ð Þ þ 3� njnk 1� S2� �
:
Using njnk\ N2
4;
UW1ðSÞ[N N 1� Sð Þ � 2Sþ 3ð Þ þ 3� N2
41� S2� �
¼ 1
4N 3� Sð Þ þ 6ð Þ N 1� Sð Þ þ 2ð Þ[ 0:
We conclude that, when c ¼ 1;the impact on total welfare is strictly positive
if nj [ nk and strictly negative if nj\nk.
123
34 M. Breton et al.

(iii) c[ 1; nj [ nkWe will show that WWðcÞ is increasing in c for nj [ nk:
WWðcÞ ¼ c2 nj þ 1� �3
þ c S2nk nj � nk� �
N þ 1ð Þ � nk nj þ 1� �� �
� nk þ 1ð Þ3�
� cS nj � nk� �
5N þ 2N2 � njnk þ 3� �
þ S2nj N � Snk þ 1ð Þ nj � nk� �
þ nj nk þ 1ð Þ� �
WWðcÞ is a convex quadratic function. It is increasing on ½1;1Þ if
W0Wð1Þ[ 0: It comes
W0Wð1Þ ¼ 2 nj þ 1
� �3� nk þ 1ð Þ3
þ S2nk nj � nk� �
N þ 1ð Þ � nk nj þ 1� �� �
� S nj � nk� �
5N þ 2N2 � njnk þ 3� �
� UW2ðSÞ:
Note that UW2ðSÞ is a quadratic function of S, with
UW2ð0Þ ¼ 2 nj þ 1� �3� nk þ 1ð Þ3 [ 0
and
UW2ð1Þ ¼ 3nj þ n2j þ njnk þ 1[ 0;
Therefore UW2ðSÞ[ 0 for all S 2 ½0; 1Þ if U0W2ðSÞ\0 on [0, 1).
U0W2ðSÞ ¼ 2Snk nj � nk
� �N þ 1ð Þ � nk nj þ 1
� �� �
� nj � nk� �
5N þ 2N2 � njnk þ 3� �
:
If
nj � nk� �
N þ 1ð Þ � nk nj þ 1� �
� 0;
then U0W2ðSÞ\0. Otherwise,
U0W2ðSÞ\2nk nj � nk
� �N þ 1ð Þ � nk nj þ 1
� �� �
� nj � nk� �
5N þ 2N2 � njnk þ 3� �
¼ �nj 2nj þ 3� �
nj þ 1� �
þ njnk nj � nk þ 2� �
þ nk nk þ 3ð Þ:
123
Intra-brand competition in a differentiated oligopoly 35

Using nj [ N2; njnk\ N2
4, nj � nk\N � 2 and nk\ N
2; we get
U0W2ðSÞ\� 1
4N N þ 2ð Þ N þ 3ð Þ
þ 1
4N3 þ 1
4N N þ 6ð Þ
¼ �N2\0:
We conclude that WWðcÞ is increasing in c for nj [ nk. Since it is strictly
positive at c ¼ 1, we can conclude that the impact of an increase in nk is
welfare enhancing in this case.
(iv) c[ 1; nj\nk. We have shown that WWðcÞ is strictly positive on ð1;1Þ forany admissible S when nj ¼ nk. Now we show that for a given c and S, WW is
decreasing in nk onN2;N
� �:
dWW
dnk¼ �3n2k c� S2
� �c� Sþ 1� Sð Þ
þ 6nk c� S2� �
c� 1þ N c� Sð Þð Þ� N2 3c� S Sþ 2ð Þð Þ c� Sð Þþ N 2c 5S� 3cð Þ þ S2 c� 5ð Þ
� �þ 3c 2S� c� 1ð Þ:
This is a second degree polynomial in nk, maximized at nk ¼ c�1þN c�Sð Þcþ1�2S
� ,
so that
dWW
dnk� 3 c� S2
� � c� 1þ N c� Sð Þð Þ2
cþ 1� 2S
� N2 3c� S Sþ 2ð Þð Þ c� Sð Þþ N 2c 5S� 3cð Þ þ S2 c� 5ð Þ
� �þ 3c 2S� c� 1ð Þ
¼ S N 1� Sð Þ þ 1ð Þ
� c N 1� Sð Þ þ 2� Sð ÞN 1� Sð Þ c� Sð Þ þ N þ 3ð Þ c� Sþ c 1� Sð Þð Þcþ 1� 2S
\S N 1� Sð Þ þ 1ð Þ
� N 1� Sð Þ þ 2� Sð ÞN 1� Sð Þ c� Sð Þ þ N þ 3ð Þ c� Sþ c 1� Sð Þð Þcþ 1� 2S
¼ � 1� Sð Þ N 1� Sð Þ þ 2ð ÞN 1� Sð Þ c� Sð Þ þ N þ 3ð Þ c� Sþ c 1� Sð Þð Þc� Sð Þ þ 1� Sð Þ
\0:
Therefore, WW changes sign at most once on N2;N
� �, which implies that there is a
unique value enH 2 N2;N
� �maximizing the total welfare, and that the impact of an
increase in increase in the number of firms in group k ¼ H on the total welfare is
positive when nH\enH and negative when nH [ enH .
123
36 M. Breton et al.

Proof of Proposition5
We first show that k2 [ 0 and k2 [ k1:
k2 ¼�cþ c N þ 1ð Þ � NSð Þ2
c2 N þ 1ð Þ2
� �cþ cþ N 1� Sð Þð Þ2
c2 N þ 1ð Þ2
[c c� 1ð Þ
c2 N þ 1ð Þ2� 0:
k2 � k1 ¼N
c2 N þ 1ð Þ2hðSÞ;
where
hðSÞ ¼ S2N cþ 1ð Þ � 4Sc N þ 1ð Þ þ c cþ 1ð Þ N þ 2ð Þ
is a quadratic convex function of S, minimized at
S� ¼ 2cN þ 1
N cþ 1ð Þ [ 1:
Therefore, for S\1;
hðSÞ[ hð1Þ¼ c� 1ð Þ 2cþ N c� 1ð Þð Þ
� 0
and k2 [ k1.Compute
Rð0Þ ¼ RðNÞ ¼ dc2 N þ 1ð Þ2
R0ðnÞ ¼ 2d N � 2nð Þ c� S2� �
n N � nð Þ c� S2� �
þ c N þ 1ð Þ� �
:
If d 6¼ 0; according to the sign of d, the function R(n) is a strictly positive (resp.
negative) fourth-degree polynomial, symmetric w.r.t. N2, increasing (resp. decreas-
ing) over ½0; N2Þ and decreasing (resp. increasing) over ðN
2;N�:
The function L(n) is a quadratic function of n, with Lð0Þ[ 0. Compute
L0ðnÞ ¼ � 2 N � nð Þ c� Sð Þ2þ2nc 1� Sð Þ2þ2c cþ 1� 2Sð Þ�
\0
L00ðnÞ ¼ 2 c� S2� �
c� 1ð Þ� 0:
This shows that L is a convex, strictly decreasing function of n, with Lð0Þ[ LðNÞ.An equilibrium market composition n� is defined by the intersection of a strictly
decreasing function with the symmetric function R(n). Compute
123
Intra-brand competition in a differentiated oligopoly 37

LðNÞ � RðNÞ ¼ c2 � c 1þ N 1� Sð Þð Þ2�
� dc2 N þ 1ð Þ2
¼ c2 N þ 1ð Þ2 k1 � dð Þ
Lð0Þ � Rð0Þ ¼ cþ N c� Sð Þð Þ2�c�
� dc2 N þ 1ð Þ2
¼ c2 N þ 1ð Þ2 k2 � dð Þ
We distinguish the following four cases.
Case 1: 0\k2 � dIn this case, Lð0Þ � Rð0Þ� 0. Since LðnÞ\Lð0Þ�Rð0Þ\RðnÞ for all n 2 ð0;NÞ,
the profit of firms of type H is smaller than that of type-L firms for any industry
composition, so that there are only firms of type L in the industry at equilibrium.
Case 2: k1\d\k2In this case, Lð0Þ[Rð0Þ and LðNÞ\RðNÞ. Since L and R are continuous
functions, there exists at least one n� 2 0;Nð Þ where Lðn�Þ ¼ Rðn�Þ; since L is
strictly decreasing, if d ¼ 0 , the intersection point is unique. Otherwise, there are at
most two intersection points, and at most one in the region where R is increasing.
This implies that if d[ 0, since LðNÞ\RðNÞ, it is not possible to have two
intersection points in 0;Nð Þ. This is also the case if d\0, since Lð0Þ[Rð0Þ.Consequently, there is a unique equilibrium market composition value n� where
both types of firms coexist.
Case 3: d� k1 and d� 0
In this case, LðNÞ�RðNÞ and RðnÞ\RðNÞ� LðNÞ\LðnÞ for all n 2 0;Nð Þ: Theprofit of firms of type H is larger than that of type-L firms for any industry
composition, so that there are only firms of type H in the industry at equilibrium.
Case 4: 0\d� k1In this case, LðNÞ � RðNÞ� 0. We will show that LðnÞ � RðnÞ is strictly
decreasing on 0;N½ �, which implies that LðnÞ � RðnÞ[ 0 for all n 2 ½0;NÞ and,
consequently, there are only firms of type H in the industry at equilibrium.
We have
L0ðnÞ � R0ðnÞ ¼ �2 N � nð Þ c� Sð Þ2þnc 1� Sð Þ2þc cþ 1� 2Sð Þ�
� 2d N � 2nð Þ c� S2� �
n N � nð Þ c� S2� �
þ c N þ 1ð Þ� �
:
(i) If N � 2n � 0, then L0ðnÞ � R0ðnÞ\0:
123
38 M. Breton et al.

(ii) Assume N � 2n \0, so that
L0ðnÞ � R0ðnÞ ¼ �2 N � nð Þ c� Sð Þ2þnc 1� Sð Þ2þc cþ 1� 2Sð Þ�
þ 2d 2n� Nð Þ c� S2� �
n N � nð Þ c� S2� �
þ c N þ 1ð Þ� �
� � 2 N � nð Þ c� Sð Þ2þnc 1� Sð Þ2þc cþ 1� 2Sð Þ�
þ 2k1 2n� Nð Þ c� S2� �
n N � nð Þ c� S2� �
þ c N þ 1ð Þ� �
:
Using
k1 ¼c� N 1� Sð Þ þ 1ð Þ2
c N þ 1ð Þ2
\c� 1
c N þ 1ð Þ2;
L0ðnÞ � R0ðnÞ2
\� N � nð Þ c� Sð Þ2þnc 1� Sð Þ2þc cþ 1� 2Sð Þ�
þ 2n� Nð Þ c� S2ð Þ c� 1ð Þc N þ 1ð Þ2
n N � nð Þ c� S2� �
þ c N þ 1ð Þ� �
¼ WðnÞ:
Note that W is increasing in n :
dW
dn¼ c� S2ð Þ c� 1ð Þ
c N þ 1ð Þ26n c� S2
� �N � nð Þ þ S2N2 þ c 4N þ 3ð Þ
� �[ 0;
so that
WðnÞ\WðNÞ
¼ � Nc 1� Sð Þ2þc cþ 1� 2Sð Þ�
þ N c� S2ð Þ c� 1ð Þc N þ 1ð Þ2
c N þ 1ð Þ
¼ �N2c 1� Sð Þ2þN c 1� Sð Þ 3� Sð Þ þ S2 c� 1ð Þð Þ þ c cþ 1� 2Sð ÞN þ 1
\0;
which shows that LðnÞ � RðnÞ is strictly decreasing.
123
Intra-brand competition in a differentiated oligopoly 39

Comparative statics
Compute
dk1dc
¼ N 1� Sð Þ þ 1ð Þ2
c2 N þ 1ð Þ2[ 0
dk1dS
¼ 2N1þ N 1� Sð Þc N þ 1ð Þ2
[ 0;
showing that the value of k1 increases with S and with c, where c ¼ FLE2H
FHE2L
: If the ratio
E2H
E2L
is kept constant, then k1 increases with FL
FH.
In the same way, compute
dk2dc
¼ cþ 2NS cþ N c� Sð Þð Þc3 N þ 1ð Þ2
[ 0
dk2dS
¼ �2Ncþ N c� Sð Þc2 N þ 1ð Þ2
\0;
so that the value of k2 decreases with S and increases with c.Finally, note that a change in d has no impact on the function L, while an increase
in d shifts the function R nð Þ upwards for all n; as a result, the intersection of the two
functions happens at a smaller value of n (more L firms).
References
Amir R, Jin JY (2001) Cournot and Bertrand equilibria compared: substitutability, complementarity and
concavity. Int J Ind Organ 19(3–4):303–317
Cai GG, Dai Y, Zhang W (2019) Modeling multichannel supply chain management with marketing
mixes: a survey. In: Handbook of Research on Distribution Channels. Edward Elgar Publishing
Dou J, Ye B (2017) A note on cournot competition in differentiated oligopolies. BE J Theor Econ
18(1):92
Hackner J (2000) A note on price and quantity competition in differentiated oligopolies. J Econ Theory
93(2):233–239
Kawasaki A, Ohkawa T, Okamura M (2019) Inter-group competition through joint marketing efforts and
intra-group Cournot competition. J Econ 128(3):203–224
Okuguchi K (1987) Equilibrium prices in the Bertrand and Cournot oligopolies. J Econ Theory
42(1):128–139
Saggi K, Vettas N (2002) On intrabrand and interbrand competition: the strategic role of fees and
royalties. Eur Econ Rev 46(1):189–200
Singh N, Vives X (1984) Price and quantity competition in a differentiated duopoly. RAND J Econ
5:546–554
Vives X (1985) On the efficiency of Bertrand and Cournot equilibria with product differentiation. J Econ
Theory 36(1):166–175
Zanchettin P (2006) Differentiated duopoly with asymmetric costs. J Econ Manag Strat 15(4):999–1015
Publisher’s Note Springer Nature remains neutral with regard to jurisdictional claims in published maps
and institutional affiliations.
123
40 M. Breton et al.