Embed Size (px)
Citation preview

Early Human Development 56 (1999) 151–165www.elsevier.com/ locate /earlhumdev
Intra-arterial blood pressure reference ranges,death and morbidity in very low birthweight
infants during the first seven days of life
a a bSteven Cunningham , Andrew G. Symon , Robert A. Elton ,b ,1 a ,*Changqing Zhu , Neil McIntosh
aDepartment of Child Life and Health, University of Edinburgh, 20 Sylvan Place,Edinburgh EH9 1UW, UK
bMedical Statistics Unit, University of Edinburgh, Teviot Place, Edinburgh EH8 9AG, UK
Received 21 April 1999; received in revised form 10 July 1999; accepted 13 July 1999
Abstract
Objectives: We aimed to: (1) assess the association of average, low, high and variable meanblood pressure (mbp) on death and the common morbidities of very low birthweight infants,and in doing so, (2) to derive representative reference ranges for mbp in very low birthweightinfants. Study design: This five year retrospective study assessed 1 min computer recordings ofintra-arterial mbp in 232 very low birthweight infants over the first 7 days of life in a tertiaryNICU. Four measures of mbp were assessed: average, variability, maximum (per time period),and percentage of time with a mean blood pressure less than the infant’s gestation. Correlationwas made with death and the development of intraventricular haemorrhage (IVH), periven-tricular leukomalacia (PVL) and retinopathy of prematurity (ROP). Results: The mbp increasedwith increasing birthweight and postnatal age (though with a slight decrease on days 6 and 7).Birthweight, gestation and colloid support (adjusted for birthweight and gestation) were theonly factors significantly associated with mbp. IVH was predominantly associated with a lowand variable mbp on the day IVH was noted or the day before. PVL and ROP were notassociated with blood pressure. Conclusions: These reference ranges include more infants anddata than previously published and relate mbp in this cohort to morbidity and mortality. They
*Corresponding author. Tel.: 1 44-131-536-0801; fax: 1 44-131-536-0821.E-mail address: [email protected] (N. McIntosh)1We have included this author, but she has not signed the usual declaration as she was uncontactable at
the time of publication.
0378-3782/99/$ – see front matter 1999 Elsevier Science Ireland Ltd. All rights reserved.PI I : S0378-3782( 99 )00038-9

152 S. Cunningham et al. / Early Human Development 56 (1999) 151 –165
could assist clinicians in judging appropriate mbp for birthweight. 1999 Elsevier ScienceIreland Ltd. All rights reserved.
Keywords: Mean blood pressure; Periventricular leukomalacia; Preterm; Intraventricular haemorrhage;Retinopathy of prematurity
1. Introduction
The very low birthweight (vlbw) newborn infant is poorly prepared for thecardiovascular demands of extrauterine life [1]. The immature myocardium andcardiovascular control may limit the ability of such infants to provide adequateperfusion to tissues which in utero, would not have had such a high demand. Clinicalsigns of reduced organ perfusion may be difficult to ascertain when associated withimmaturity and disease: the heart rate has a limited ability to increase cardiac outputby increasing rate [2]; autonomic immaturity may limit peripheral vasoconstriction[3]; and vasopressin may produce oliguria in infants with respiratory distresssyndrome, independent of renal perfusion [4]. In addition, preferential blood flowwithin some organs may produce local watershed ischaemia even when overallperfusion to the organ appears to be adequate. It is therefore important to haveadequate reference blood pressure values in vlbw infants.
There are problems in deriving ‘normal’ blood pressure data in very preterminfants: A significant majority will have disease as a result of their immaturity – theseare usually closely monitored. Less sick individuals do not have such frequent orprecise measurements. Reference blood pressure ranges so far provided for the vlbwinfant have usually been based on small numbers of infants [5–7] or infrequentlycollected data [8–11] and have mostly been limited to the first 24 to 48 hours of life.The majority of problematic vlbw infants who require blood pressure support have alonger period of critical illness.
Our aim was to create easy to use reference ranges for mean blood pressure in verylow birth weight infants based on 5 years of minute by minute intra-arterial bloodpressure data stored on a computerised data monitoring system. We included allinfants admitted to our 12 bed neonatal intensive care unit during that period. Datawere incorporated from the first seven days of life so as to cover the most criticalperiod of illness for the majority of infants. In addition, we have assessed theinfluence of perinatal factors on blood pressure and the association between bloodpressure and infant morbidity and mortality.
2. Methods
2.1. Unit
This study retrospectively assessed infants admitted to our unit between October1989 and January 1995 for medical neonatal intensive care. This is the regional

S. Cunningham et al. / Early Human Development 56 (1999) 151 –165 153
medical intensive care neonatal unit for Southeast Scotland and carries out all medicalintensive care except ECMO. Surgical problems are managed in a nearby neonatalsurgical unit.
2.2. Infants
Infants whose birthweight were # 1500 g and who had more than 24 h ofintra-arterial blood pressure monitoring in the first 7 days of life were included in thestudy. Infants with serious congenital malformation were excluded.
2.3. Clinical monitoring
The decision to monitor intra-arterial blood pressure was a clinical one, usuallybecause of the need for frequent arterial sampling or because it was expected that theinfant would require ventilation for greater than 24 h. Intra-arterial blood pressuremonitoring was our method of choice in vlbw intensive care infants. Umbilical(3.5 /5.0 french gauge) or peripheral (24 gauge) arterial catheters were used, throughwhich 0.9% saline (heparinised with 1 unit per ml) was infused at a rate of 1 ml perhour. Arterial pressure monitoring was by pressure dome transducer using a Hewlett-Packard Neonatal Monitor (78834A). The pressure transducer was placed at theheight of the infants’ mid chest and calibrated to atmospheric pressure every 24 h.The dynamics of this monitoring circuit have been demonstrated to have anacceptably small effect on blood pressure [14]. Mean blood pressure was calculatedby the Hewlett-Packard monitor from the area under the pulse pressure curve.‘Damping’ of the arterial pressure trace by small bubbles or blood clot, reduces theaccuracy of directly measured systolic and diastolic blood pressures, whereas themean blood pressure continues to be accurate [15]. As a consequence, we havepresented only the more reliable mean blood pressure data, which is a good marker ofoverall perfusion. Trained observers (SC, AGS) removed artifact to ensure data ofhigh quality: this involved a manual assessment of data quality and removal of dataduring those times when damping or clot diminished trace reliability.
Indirect blood pressure monitoring is discontinuous and we believe it to be lessaccurate. Cuff inflation with oscillometry and percutaneous sampling disturb theinfant and give inaccurate results [13]. Blood pressure values obtained in this wayhave been excluded from this study.
2.4. Data collection
Since October 1989, a network of cotside computers have continuously collectedphysiological information from standard neonatal bedside patient monitors (Hewlett-Packard 78834A) [12]. Data are downloaded each second via an A–D board. Thedata are displayed as trend graphs, in time periods that can vary from 7 min to 3 days.Any monitored parameter can be collected by the computer system and reviewed atany time. Information is stored permanently on a central server as the minute mean ofthe collected one second values.

154 S. Cunningham et al. / Early Human Development 56 (1999) 151 –165
Trend data for each infant was assessed in 12 h periods for the first 48 h andthereafter in 24 h periods until 7 days of age (i.e. 9 periods); shorter periods werechosen during the first 2 days as previous reports have demonstrated a rapid change inblood pressure during this time. All time periods related to time of birth. In thoseinfants who died, the trend data for the 4 h before death was excluded. A maximumof 720 one minute mean blood pressure values were recorded in each 12 h timeperiod, and up to 1440 one minute data points in each 24 h period, for each infant.
2.5. Data manipulation
Data files from the computer were placed onto ASCII files and transferred to SPSSfor statistical assessment. Artifact removal and preparation of the ASCII files wereperformed by two trained observers (AGS and SC), with definitions of artifact agreedto prior to the start of the study.
Following the removal of artifact [16] the computer system calculated thefollowing values to give four measures of mean blood pressure:
• The average of all one minute mean blood pressure values for each infant in eachtime period.
• The standard deviation (variability) of the one minute mean blood pressure valuesfor each infant in each time period.
• The maximum single one minute data point during each time period, summarisedas the mean for all patients in each birthweight group.
• The number of minutes that the mean blood pressure fell to less than each infant’sgestational age (in completed weeks). This data from a separate study has beenderived for the first 141 patients in this study.
2.6. Construction of centile charts
Centile charts were created after certain data had been excluded:
1. artifact2. values recorded in infants with intraventricular haemorrhage, and3. values recorded during time periods that infants received inotropes.
We regard the remaining data to be as representative as possible of reference bloodpressure data in vlbw newborns (Note reference data – not normal data). Approxi-mate centiles for average mbp over the first week were calculated by fitting aquadratic regression to all data points and plotting 10th, 50th and 90th centiles.
2.7. Statistics
Non-parametric tests (Mann–Whitney U, Kruskal–Wallis or Spearman rankcorrelation as appropriate) were used to examine associations between daily bloodpressure values and other factors recorded at birth or measured daily during the first

S. Cunningham et al. / Early Human Development 56 (1999) 151 –165 155
week. Multiple linear regression was used to test whether sets of factors significantlypredicted daily blood pressure when adjusted for one another. Trends in bloodpressure over the week were examined by unbalanced mixed model analysis ofcovariance, using BMDP 5V software. This test allowed incorporation of factors onlymeasured at birth and factors which changed from day to day. Logistic regression wasused to investigate the association between the development of ROP and mean bloodpressure values in the first week.
2.8. Death and morbidity
Perinatal factors that might influence mean blood pressure were assessed retrospec-tively from casenotes (Table 1). Of 26 factors considered, 19 were individual factorsof infant, maternal and perinatal care, and a further 7 factors were assessedtemporally in relation to the 9 blood pressure time periods, (ventilation, dopamine,colloid support, blood transfusion, pancuronium, dobutamine, IVH). Daily cranialultrasound scans were performed for the first seven days (Papille grading [18]) and atdischarge (for PVL). In assessing colloid usage, we only considered values $ 10ml /kg per time period as significant, as studies have consistently shown that smalleraliquots have little if any effect on blood pressure [19–21]. The decision to giveblood pressure support was a clinical one. Mean blood pressure below an infant’sgestational age was considered an absolute indication for support, however acombination of ‘low’ blood pressure, poor perfusion and acidosis would also beindications. Inotropes (primarily dopamine) were commenced after unsuccessfulresult from colloid infusion.
We have recently demonstrated that retinopathy of prematurity (ROP) is associatedwith an increased variability of transcutaneous oxygen, most significantly in the firstweek of life [22]. To test the hypothesis that this variability may just reflectcardiovascular instability, we also assessed the ability of both mean blood pressureand heart rate (average and variability) in the first week of life to predict severe ROP.
Table 1Infants details. Numbers in table represent the numbers of infants with factor during any time period andare either shown as mean (sd) or as number of infants (percentage)
Birthweight groups (g) # 750 751–1000 1001–1250 1251–1500
N 5 47 79 57 49Birthweight (g) – mean (sd) 645 (81) 8 76 (73) 1118 (8 6) 1380 (76)Gestation (weeks)) – mean (sd) 26 (1.8) 27 (1.7) 28 (1.9) 29 (1.2)Antenatal Steroids – n [%] 26 [55] 38 [48] 31 [54] 24 [49]Maternal antihypertensives–n [%] 11 [23] 17 [22] 10 [18] 8 [16]
aUmbilical artery catheter –n [%] 41 [87] 61 [77] 44 [77] 39 [80]aDopamine –n [%] 12 [26] 22 [28] 9 [16] 6 [12]
aDobutamine –n [%] 0 [0] 8 [10] 0 [0] 3 [6]aColloid support . 10 ml /kg –n [%] 39 [83] 58 [73] 33 [58] 24 [49]
aVentilation –n [%] 47 [100] 78 [99] 54 [95] 45 [92]Neonatal death–n [%] 22 [47] 15 [19] 9 [16] 2 [4]
a Number receiving intervention or treatment during any of the time periods.

156 S. Cunningham et al. / Early Human Development 56 (1999) 151 –165
Infants were assessed as having none or mild (stage 1 or 2) retinopathy or severeretinopathy ( $ stage 3). The current study incorporated 83% of infants in theprevious published study [22].
2.9. Ethics
Collection of data by computer monitoring was approved by the Lothian HealthBoard Ethics Committee. As it was viewed as a clinical routine, parental consent wasnot required.
3. Results
3.1. Infants
Of 440 infants with a birthweight , 1500 g admitted during the period in question,62 infants # 1000 g and 144 infants 1001–1500 g were excluded because they diedwithin 24 h of admission or had less than 24 h of data collected. Two further infantswere excluded because of significant congenital abnormalities (vein of Galenaneurysm and truncus arteriosus). Of the remaining infants, 232 infants had sufficientblood pressure data. A median of 7 time periods were assessed per infant (inter-quartile range 5–9). The amount of data removed as artifact from blood pressuretrends was not determined in this study, though we have previously shown this to beapproximately 6.5% of data [16]. The infants were stratified to four birthweightgroups ( # 750 g, 751–1000 g, 1001–1250 g, 1251–1500 g) and a comparison of thegroups is shown in Table 1.
The mean blood pressure for each of the four birthweight groups is shown in Fig.1. The data shown is for infants who had no grade of IVH and also excludes thosetime periods during which dopamine or dobutamine (n 5 137) and colloid $ 10ml /kg (n 5 174) were given. Mean blood pressure increased over the seven dayperiod. In general this increase was greater in infants of higher birthweight (theapparent marginally higher BP on days 1 and 2 in the infants 750–1000 g comparedto 1000–1250 is not significant). As has previously been observed in term infants,mean blood pressure frequently reaches a plateau between days 4 to 6, and may evenshow a small decrease on day 7 [6]. The four graphs demonstrate a progressiveincrease in mean blood pressure with increasing birthweight, most marked in infantswith birthweight 1251–1500 g.
Seven factors were significantly associated with the level of mean blood pressure ina univariate analysis; birthweight ( p , 0.001), gestation ( p , 0.001), and the firsthaematocrit ( p , 0.01) were directly associated whereas colloid support ( p , 0.01),dopamine ( p , 0.001), morphine ( p , 0.05), and surfactant therapy ( p , 0.05) wereall inversely associated with blood pressure. When these were assessed in amultivariate analysis only birthweight, gestation and colloid support continued to besignificant. Interestingly, antenatal steroids (at least one dose given to 51% ofmothers) did not significantly affect the mean blood pressure of our infants [23]. The

S. Cunningham et al. / Early Human Development 56 (1999) 151 –165 157
Fig. 1. Mean blood pressure reference ranges for infants in the four birthweight groups during the firstseven days of life. Inclusion and exclusion criteria are given in the text. Centiles displayed are 10th, 50thand 90th.
univariate analysis assessed all time periods in all infants. Time periods were onlyexcluded in calculating reference values.
We also assessed whether our four measures of mean blood pressure (Fig. 1,Tables 2 and 3) were associated with four measures of outcome (death, IVH, PVL orROP).
3.2. Neonatal death
The only measurement of blood pressure which significantly predicted neonataldeath was an increased mbp variability on day 7 ( p , 0.05): as part of multipletesting this association may have arisen by chance. Although an association wasfound between death and the percentage of time that the mean blood pressure wasless than infant’s gestation, this was not significant when adjusted for birthweight,gestation and IVH.
3.3. Intraventricular haemorrhage – all grades
• Low mean blood pressure: There was a significant association between a low

158 S. Cunningham et al. / Early Human Development 56 (1999) 151 –165
Table 2Mean blood pressure and heart rate variables in four birthweight cohorts. Mean blood pressure data is
agiven in Fig. 1
Time period
1(a) 1(b) 2(a) 2(b) 3 4 5 6 7
# 751 g mbp 4.6 4.9 4.0 4.6 5.6 5.4 6.9 4.6 4.6sdmbp 47 51 47 49 57 56 58 59 58Max
751–1000 g mbp 4.2 4.3 4.1 4.6 5.6 4.3 4.3 6.6 5.9sdmbp 49 48 48 50 56 55 56 56 55Max
1001–1250 g mbp 5.4 5.1 4.0 4.3 4.0 4.6 4.9 6.6 4.6sdmbp 50 50 50 53 57 57 58 60 57Max
1251–1500 g mbp 3.7 4.0 4.5 5.4 6.0 5.7 8.5 5.9 2.8sdmbp 50 51 51 53 59 63 66 59 62Max
a This table shows the variability (sd) of 1 min mbp data points (mbp sd: mmHg), the maximum mbpattained in each time period (mbp Max: mmHg).
mean blood pressure and IVH. This was shown by a low mean mean bloodpressure on day 1 and 3, and IVH occurring on day 2 and 4, respectively (bothp , 0.05).
• Variability of mean blood pressure: An increased sd of mean bp on day 1 (mbpvariability) was associated with IVH on day 2 ( p , 0.05) and 3 ( p , 0.01); Day 2mbp variability was associated with IVH on days Ito 7 (all p , 0.01, except day 2,p , 0.05); Day 3 mbp variability was associated with IVH on days 3, 4 and 5 (allp , 0.05); Day 4 mbp variability was associated IVH on days 2, 3, 4 and 5 (allp , 0.05).
• Maximum mean blood pressure: A high maximum mbp (as a single point per timeperiod) on day 2 was associated with IVH occurring on day 3 ( p , 0.05).
• Mean blood pressure less than gestation: Table 3 demonstrates how long infants
Table 3Incidence of IVH and death with the percentage of time that mbp was less than the infant’s gestation (incompleted weeks) on a subset of 141 infants
Percentage of time Number Death IVH (grade)mbp was less than ofinfant’s gestation infants 0 1 2 3 4
, 5% 108 19 56 7 21 10 145–10% 11 3 6 3 0 1 1. 10% 22 9 14 1 7 0 0

S. Cunningham et al. / Early Human Development 56 (1999) 151 –165 159
spent with a mean blood pressure less than their gestational age (despite this beinga criterion for support). There was no association between severe grades ofintraventricular haemorrhage and a long period of time with a mean blood pressurebelow this predetermined limit; no infant with grade 3 or 4 intraventricularhaemorrhage had more than 10% of mean blood pressure observations below theirgestation level.
3.4. Periventricular leukomalacia
The incidence of cystic PVL in our study was 5% (11 infants). No significantassociation was found between the development of PVL and any of the four measuresof blood pressure we assessed. 10 infants with cystic PVL had , 5% of mean bloodpressure observations less than their gestational age and one infant . 10% ofobservation less than this limit.
3.5. Retinopathy of prematurity
One hundred and fifty four of the 232 infants were assessed for ROP by indirectophthalmoscopic examination at our hospital. Of these 118 had mild disease (no ROP,stage 1, stage 2: 55%, 10% and 12% respectively) and 36 had severe disease( $ stage 3: 23% of infants). In a multiple logistic regression model, severe ROP(when adjusted for birthweight and gestation) was not associated with the averageweekly values of mean blood pressure (mean and standard deviation), heart rate(mean and standard deviation), volume of colloid or use of dopamine or dobutamine.
3.6. Centile construction
Of the 232 infants (97% ventilated) included in this study, 99 were excludedbecause they developed IVH (any grade). The total number of time periods availablefor study in these remaining 133 babies was therefore potentially 1197 (of a possible2088). A further 137 periods were excluded because infants were on dopamine, and174 for treatment with colloid. The centiles shown in Fig. 1 were constructed fromthe remaining periods.
4. Discussion
The very low birthweight infant has limited ability to cope with the cardiovasculardemands of immature birth and its associated illness. In particular, hypoperfusion hasbeen associated not only with the gross pathology of immaturity (IVH and PVL), butit may also be responsible for the more subtle neurodevelopmental disabilities nowevident in our preterm ‘successes’. Utilising blood pressure standards for these verylow birthweight infants that have been obtained by using a regression of bloodpressure values from ‘well’ infants of higher gestations extrapolated back to moreimmature gestations has been found to be inaccurate [7]. Reference data ideally
160 S. Cunningham et al. / Early Human Development 56 (1999) 151 –165
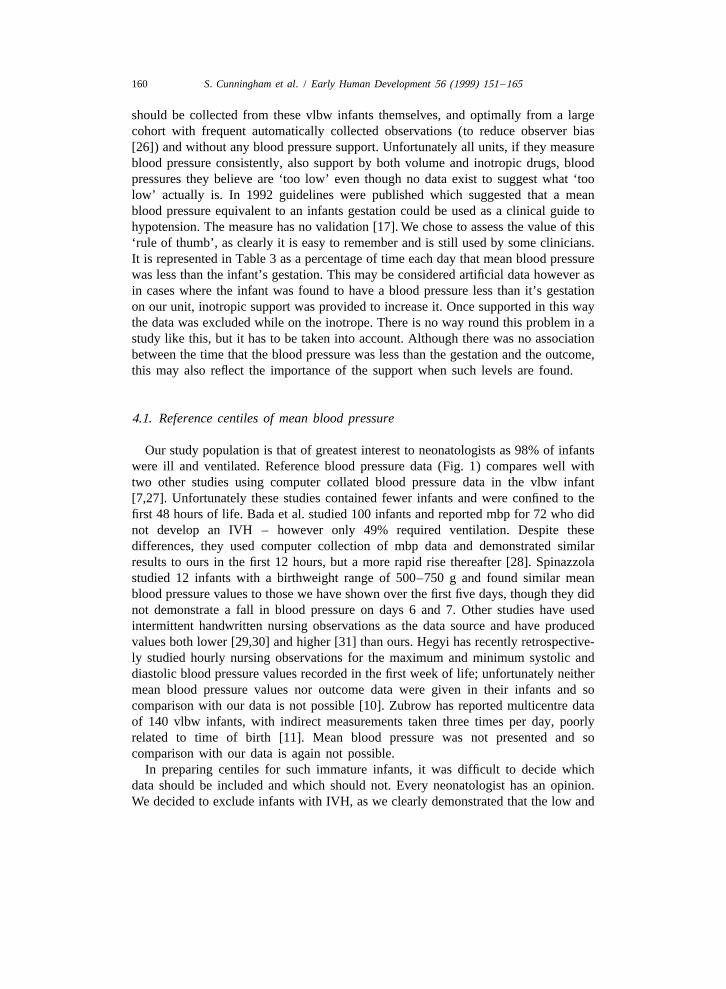
should be collected from these vlbw infants themselves, and optimally from a largecohort with frequent automatically collected observations (to reduce observer bias[26]) and without any blood pressure support. Unfortunately all units, if they measureblood pressure consistently, also support by both volume and inotropic drugs, bloodpressures they believe are ‘too low’ even though no data exist to suggest what ‘toolow’ actually is. In 1992 guidelines were published which suggested that a meanblood pressure equivalent to an infants gestation could be used as a clinical guide tohypotension. The measure has no validation [17]. We chose to assess the value of this‘rule of thumb’, as clearly it is easy to remember and is still used by some clinicians.It is represented in Table 3 as a percentage of time each day that mean blood pressurewas less than the infant’s gestation. This may be considered artificial data however asin cases where the infant was found to have a blood pressure less than it’s gestationon our unit, inotropic support was provided to increase it. Once supported in this waythe data was excluded while on the inotrope. There is no way round this problem in astudy like this, but it has to be taken into account. Although there was no associationbetween the time that the blood pressure was less than the gestation and the outcome,this may also reflect the importance of the support when such levels are found.
4.1. Reference centiles of mean blood pressure
Our study population is that of greatest interest to neonatologists as 98% of infantswere ill and ventilated. Reference blood pressure data (Fig. 1) compares well withtwo other studies using computer collated blood pressure data in the vlbw infant[7,27]. Unfortunately these studies contained fewer infants and were confined to thefirst 48 hours of life. Bada et al. studied 100 infants and reported mbp for 72 who didnot develop an IVH – however only 49% required ventilation. Despite thesedifferences, they used computer collection of mbp data and demonstrated similarresults to ours in the first 12 hours, but a more rapid rise thereafter [28]. Spinazzolastudied 12 infants with a birthweight range of 500–750 g and found similar meanblood pressure values to those we have shown over the first five days, though they didnot demonstrate a fall in blood pressure on days 6 and 7. Other studies have usedintermittent handwritten nursing observations as the data source and have producedvalues both lower [29,30] and higher [31] than ours. Hegyi has recently retrospective-ly studied hourly nursing observations for the maximum and minimum systolic anddiastolic blood pressure values recorded in the first week of life; unfortunately neithermean blood pressure values nor outcome data were given in their infants and socomparison with our data is not possible [10]. Zubrow has reported multicentre dataof 140 vlbw infants, with indirect measurements taken three times per day, poorlyrelated to time of birth [11]. Mean blood pressure was not presented and socomparison with our data is again not possible.
In preparing centiles for such immature infants, it was difficult to decide whichdata should be included and which should not. Every neonatologist has an opinion.We decided to exclude infants with IVH, as we clearly demonstrated that the low and

S. Cunningham et al. / Early Human Development 56 (1999) 151 –165 161
variable mbp were associated with this pathology. Periods during which inotropeswere given were also excluded, as they are able to influence blood pressure. Thisleaves us with a representative group for this cohort of well patients and not an idealgroup. The exclusion of those receiving support may skew the results to give slightlyhigh centiles but as only 26% of patients had data excluded, this is unlikely to begreat. Our data, though, have been completely cleared of artifact, following which thestudy still contains significantly more data points than any other previous study (over12 million data points).
4.2. Intraventricular haemorrhage
High, low, average and variable mean blood pressure have previously all beenassociated with the development of intraventricular haemorrhage. We have not beenable to find a previous simultaneous assessment of all four factors in a single study.An association between hypertensive peaks of blood pressure and IVH has beendemonstrated in two studies [32,33], though in both, only small numbers of infantswere studied and there was limited ability to measure long term blood pressurevariability in addition to the instantaneous peaks in blood pressure. A high maximummbp was associated with the development of IVH on just one occasion in our study(this could easily have been a chance finding). We could demonstrate no associationbetween the development of IVH and infants having a prolonged period of time witha mbp less than their gestational age. Miall-Allen et al. found a positive associationbetween the development of IVH and the length of time that mbp was below 30mmHg for all infants , 31 weeks gestation [34] but we are aware of no publisheddata specifically related to the 1992 recommendations related to the gestation of theinfants. The most consistent message from our data was that a generally low (but notacutely so) and variable mean blood pressure are the features associated with thedevelopment of IVH.
Intraventricular haemorrhage was predominantly associated with changes in mbpthe previous day. In 3 patients IVH occurred prior to, and may have been responsiblefor, mbp variability. Four previous studies have demonstrated an association betweenthe development of IVH and blood pressure variability [28,35–37]. As in our study,two of these papers also noted hypotension was important. Perlman also demonstratedthat stabilising blood pressure by paralysis could reduce the incidence of IVH [38].These results were contradicted in a study by Miall-Allen et al. [39], thoughimportantly this group attempted to maintain mbp | 30 mmHg in all infants # 31weeks gestation (a relatively high mbp for infants of , 750 g).
The development of IVH has been demonstrated following hypoperfusion / reperfu-sion injury in animals [40]. Our group has previously demonstrated that bloodpressure variability can be associated with a requirement for colloid support [41].Rennie has also demonstrated that variability of cerebral blood flow in preterm infantscan be reduced by giving colloid support: this occurred with no alteration in cardiacoutput or heart rate. Rennie went on to postulate that the low central venous pressure

162 S. Cunningham et al. / Early Human Development 56 (1999) 151 –165
could manifest as fluctuation in systemic arterial blood pressure (as in adults), withouthypotension being evident [42].
4.3. Periventricular leukomalacia
The incidence of cystic PVL in our study was 5%: previous studies have noted anincidence of between 2 and 8% in vlbw infants [24,25]. As it is relatively uncommonit has been difficult to study in the clinical setting. Traditionally, its development hasbeen associated with hypoperfusion of cerebral ‘watershed’ areas [43]. Miall-Allendemonstrated that both infants with cystic PVL in their study, spent more than 1 hwith a mbp # 30 mmHg [34] and as a consequence recommended this as the lowestthat a blood pressure should be allowed. Watkins demonstrated that of ten infants withcystic PVL, only four had demonstrable hypotensive episodes [31]. We havedemonstrated no clear association between any of our blood pressure measures (inparticular hypotension) and the occurrence of cystic PVL. Recent evidence suggeststhat the role of hypoperfusion may have been overstated and that venous congestion(with relative hypoxia) of the richly vascularised watershed area [44] may produceexcitatory amino acids which lead to neuronal damage [45].
4.4. Retinopathy of prematurity
The development of ROP is currently considered to be multifactorial, and over 20factors of neonatal intensive care have been associated with its development [46]. Theinitial insult to the retinal vasculature probably occurs within the first few days of life[47,48]. We have recently demonstrated that changes in transcutaneous oxygen aresignificantly associated with the development of the disease, though these changesmight possibly represent cardiovascular instability [22]. It is possible that retinalischaemia could occur if unstable systemic blood pressure was relayed to the pressurepassive retinal circulation in preterm infants [49]. Our results do not confirm thishypothesis as we have not demonstrated any changes in cardiovascular status duringthe first week of life that could predict the development of ROP.
The effect of a patent ductus arteriosus on blood pressure was not assessed as partof this study, as clinical signs may be poorly representative of the haemodynamicsignificance of any shunt in the vlbw infant [50,51], and we did not have access todaily echocardiography. A recent longitudinal study of patent ductus arteriosus insuch infants however demonstrated that the majority of ductus’ either closecompletely in the first 48 h without clinical significance, or are constricted followingbirth and only become haemodynamically significant after 7 days of age [52].
We have provided representative reference ranges for mean blood pressure in fourvery low birthweight groups over the first seven days of life. The ranges incorporatemore data than any previous study at this birthweight and represents the largest groupstudied in such detail. The reference ranges should assist the neonatologist to identifythose infants with hypotension and earlier intervention may help to reduce subsequentmorbidity.

S. Cunningham et al. / Early Human Development 56 (1999) 151 –165 163
Nomenclature
hr heart rateIVH intraventricular haemorrhageROP retinopathy of prematuritymbp mean blood pressurePVL penventricular leukomalacia
Acknowledgements
Dr Cunningham and S.M. Symon were supported by a grant from the ScottishHome and Health Department. We would also like to thank the nursing, medical andparaclinical staff of the Neonatal Intensive Care Unit, Simpson Memorial MaternityPavilion, Edinburgh, for their help during this project.
References
[1] Cunningham S. What is an adequate blood pressure in the newborn. In: Hansen TN, McIntosh N,editors, Current topics in neonatology, Vol. 3, London: Saunders, 1999.
[2] Rudolph AM. Organisation and control of the fetal circulation. In: Jones CT, Nathanielsz PW, editors,The physiological development of the fetus and newborn, London: Academic Press, 1985, pp.343–53.
[3] Lyon AJ, Pikaar MS, Badger P, Mclntosh N. Temperature control in very low birthweight infantsduring the first five days of life. Arch Dis Child 1997;76:F47–50.
[4] Spitzer AR, Fox WW, DelivoriaPapadopoulos M. Maximum diuresis – a factor in predicting recoveryfrom respiratory distress syndrome and the development of bronchopulmonary dysplasia. J Pediatr1981;98:476–9.
[5] Powell PJ, Assassa P, Ellis A, Hollis S, Robinson MJ. Normal blood pressure measurements in verylow birthweight babies. Early Hum Devel 1992;30:84, (Abs).
[6] Tan KL. Blood pressure in very low birth weight infants in the first 70 days of life. J Pediatr1988;112:266–70.
[7] Versmold HT, Kitterman JA, Phibbs RH et al. Aortic blood pressure during the first 12 hours of life ininfants with birth weight 610 to 4220 grams. Pediatrics 1981;67:607–13.
[8] Greenough A, Emery EF. Systolic blood pressure levels of ventilated, very preterm infants. Br J IntenCare 1993;:130–6.
[9] Bucci G, Scalamandre A, Savignoni PG, Mendicini M, Bucci SP. The systemic systolic bloodpressure of newborns with low weight: a multiple regression analysis. Acta Paediatrica Scand1972;229(Suppl.):1–22.
[10] Hegyi T, Anwar M, Carbone MT et al. Blood pressure ranges in premature infants: II. The first weekof life. Pediatrics 1996;97:336–42.
[11] Zubrow AB, Hulman S, Kushner H, Flakner B. Determinants of blood pressure in infants admitted toNeonatal Intensive Care Units: A prospective multicenter study. J Perinatol 1995;15(6):470–9.
[12] Cunningham S, Deere S, Elton RA, McIntosh N. Neonatal physiological trend monitoring bycomputer. Int J Clin Mon Comput 1992;9:221–7.
[13] Diprose GK, Evans DH, Archer LNJ, Levene MI. Dinamap fails to detect hypotension in very lowbirthweight infants. Arch Dis Child 1986;61:771–3.

164 S. Cunningham et al. / Early Human Development 56 (1999) 151 –165
[14] Evans DH, Lark GM, Archer LNJ, Levene MI. The continuous measurement of intra-arterial pressurein the neonate: Method and accuracy. Clinical Physics and Physiological Measurement 1986;7:179–84.
[15] Weindling AM. Blood pressure monitoring in the newborn. Arch Dis Child 1989;64:444–7.[16] Cunningham S, Symon AG, McIntosh N. The practical management of artifact in computerised
physiological data. Int J Clin Mon Comput 1994;11:211–6.[17] Levene M, Chiswick M, Field D et al. Development of audit measures and guidelines for good
practice in the management of neonatal respiratory distress syndrome. Arch Dis Child 1992;67:1221–7.
[18] Papille LA, Burnstein J, Burnstein R, Koffler H. Incidence and evolution of subependymal andintraventricular haemorrhage: study of infants with birthweight less than 1500 grams. Journal ofPediatrics 1978;92:529–34.
[19] Bignall S, Bailey PC, Bass CA, Cramb R, Rivers RPA, Wadsworth J. The cardiovascular and oncoticeffects of albumin infusion in premature infants. Early Hum Develop 1989;20:191–201.
[20] Barr PA, Bailey PE, Sumners J, Cassady G. Relation between arterial blood pressure and bloodvolume and effect of infused albumin in sick preterm infants. Pediatrics 1977;60:282–9.
[21] Gill AB, Weindling AM. Randomised controlled trial of plasma protein fraction versus dopamine inhypotensive very low birthweight infants. Arch Dis Child 1993;69:284–7.
[22] Cunningham S, Fleck BW, Elton RA, McIntosh N. Transcutaneous oxygen levels in retinopathy ofprematurity. Lancet 1995;346:1464–5.
[23] Moise AA, Wearden ME, Kozinetz CA, Gest AL, Welty SE, Hansen TN. Antenatal steroids areassociated with less need for blood pressure support in extremely premature infants. Pediatrics1995;95:845–50.
[24] Bozynski MEA, Nelson MN, Genaze D, RosatiSketich C, Matalon TAS, Vasan U. Cranialultrasonography and the prediction of cerebral palsy in infants weighing less than 1200 g at birth.Developmental Medicine and Child Neurology 1998;30:342–8.
[25] Graham M, Levene MI, Trounce JQ, Rutter N. Prediction of cerebral palsy in very low birthweightinfants: prospective ultrasound study. Lancet 1987;ii:593–6.
[26] Gardner RM, Shabot MM. Computerised ICU data management: pitfalls and promises. InternationalJournal of Clinical Monitoring and Computing 1990;7:99–105.
[27] Adams MA, Pasternak JF, Kupfer BM, Gardner TH. A computerized system for continuousphysiologic data collection and analysis: Initial report on mean arterial blood pressure in verylowbirth-weight infants. Pediatrics 1983;71:23–30.
[28] Bada HS, Korones SB, Perry EH et al. Mean arterial blood pressure changes in premature infants andthose at risk for intraventricular hemorrhage. J Pediatr 1990;117:607–14.
[29] Cabal LA, Larrazabal C, Siassi B. Hemodynamic variables in infants weighing less than 1000 grams.Clin Perinatol 1986;13:327–38.
[30] Moscoso P, Goldberg RN, Jamieson J, Bancalari E. Spontaneous elevation in arterial blood pressureduring the first hours of life in the very-low-birth-weight infant. J Pediatr 1983;103:114–7.
[31] Watkins AMC, West CR, Cooke RWI. Blood pressure and cerebral haemorrhage and ischaemia invery low birthweight infants. Early Hum Develop 1989;19:103–10.
[32] Gronlund JU, Korvenranta H, Kero P, Jalonen J, Valimaki IAT. Elevated arterial blood pressure isassociated with peri-intraventricular haemorrhagee. Eur J Pediatr 1994;153:836–41.
[33] Wimberley PD, Lou HC, Pedersen H et al. Hypertensive peaks in the pathogenesis of intraventricularhemorrhage in the newborn. Abolition by phenobarbitone sedation. Acta Paediatrica Scand1982;71:537–42.
[34] MiallAllen VM, De Vries LS, Whitelaw AGL. Mean arterial blood pressure and neonatal cerebrallesions. Arch Dis Child 1987;62:1068–9.
[35] D’Souza SW, Janakova H, Minors D et al. Blood pressure, heart rate, and skin temperature in preterminfants: Associations with periventricular haemorrhage. Arch Dis Child 1995;72:F162–7.
[36] Perlman JM, McMenamin JB, Volpe JJ. Fluctuating cerebral blood-flow velocity in respiratory-distress syndrome. Relation to the development of intraventricular hemorrhage. New Eng J Med1983;309:204–9.

S. Cunningham et al. / Early Human Development 56 (1999) 151 –165 165
[37] Fujimura M, Salisbury DM, Robinson RO. Clinical events relating to intraventricular haemorrhage inthe newborn. Archives of Disease in Childhood 1979;54:409–14.
[38] Perlman JM, Goodman S, Kreusser KL, Volpe JJ. Reduction in intraventricular hemorrhage byelimination of fluctuating cerebral blood-flow velocity in preterm infants with respiratory distresssyndrome. New Eng J Med 1985;312:1353–7.
[39] MiallAllen VM, De Vries LS, Dubowitz LMS, Whitelaw AGL. Blood pressure fluctuation andintraventricular hemorrhage in the preterm infant of less than 31 weeks’ gestation. Pediatrics1989;83:657–61.
[40] Goddard Finegold J, Armstrong D, Zeller RS. Intraventricular hemorrhage following volumeexpansion after hypotension in the newborn beagle. J Pediatr 1982;100:796–9.
[41] Cunningham S, Deere S, McIntosh N. Cyclical variation of blood pressure and heart rate in neonates.Arch Dis Child 1993;69:64–7.
[42] Rennie JM. Cerebral blood flow velocity variability after cardiovascular support in premature babies.Arch Dis Child 1989;64:897–901.
[43] Tamisari L, Vigi V, Fortini C, Scarpa P. Neonatal periventricular leukomalacia: diagnosis andevolution evaluated by real time ultrasound. Helv Paediatrica Acta 1986;41:399–407.
[44] Nakamura Y, Okudera T, Hashimoto T. Vascular architecture in white matter of neonates: Itsrelationship to periventricular leukomalacia. J Neuropath Exper Neurol 1994;19:103–10.
[45] De Vries LS, Levene MI. Cerebral ischaemic lesions. In: Levene MI, Lifford RJ, editors, Fetal andneonatal neurology and neurosurgery, Edinburgh: Churchill Livingstone, 1995.
[46] Watts JL. Retinopathy of prematurity. In: Sinclair JC, Bracken MB, editors, Effective care of thenewborn, Oxford: Oxford University Press, 1992, pp. 615–39.
[47] Ashton N. Cook, C., Direct observation of the effect of oxygen on developing vessels: preliminaryreport. Br J Ophthalmol 1954;38:433–40.
[48] Kretzer FL, Hittuer HM. Retinopathy of prematurity: clinical implications of retinal development.Arch Dis Child 1988;63:1151–67.
[49] Yuguchi M, Majima A, Iwasawa A, Kuwayama M. Retinal blood flow in oxygen-induced retinopathy(I). Folia Ophthalmologica Japonica 1990;41:1233–6.
[50] Evans N. Diagnosis of patent ductus arteriosus in the preterm newborn. Arch Dis Child 1993;68:58–61.
[51] Skelton R, Evans N, Smythe J. A blinded comparison of clinical and echocardiographic evaluation ofthe preterm infant for patent ductus arteriosus. J Ped Child Health 1994;30:406–11.
[52] Evans N, Iyer P. Longitudinal changes in the diameter of the ductus arteriosus in ventilated preterminfants: Correlation with respiratory outcomes. Arch Dis Child 1995;72:F156–61.


![Intra-Arterial Hepatic Perfusion for Metastatic Melanoma ... · procedural morbidity and mortality remain. The phase III trial by Hughes . et al. [5] suggests that adverse events](https://img.pdfslide.us/doc/110x75/600e5404c6c05c7ec9487c89/intra-arterial-hepatic-perfusion-for-metastatic-melanoma-procedural-morbidity.jpg)