Embed Size (px)
Citation preview

Into the Storm The Twin Challenges of
Peak Oil & Global WarmingLarry Shirley
State Energy Office

Special Thanks to Phillip Fairey
Florida Solar Energy Center

Into the Storm
Any Questions?
Who is captain of the ship? If it were you, what would you
want to know?• How bad is the storm? • How fast are we closing on the
storm?• How strong is the ship?• How large is the ship and . . .• How quickly can she be turned?• What is Plan B?

What is “Peak Oil”?
Peak Oil IS NOT:• The end of oil• An energy crisis
Peak Oil IS:• A liquid fuel crisis• A potential economic, political and
social crisis
The point at which we reach maximum global oil
production

Peak Oil Facts All oil fields peak All oil regions peak World oil production will peak (or
perhaps already has…) The really big fields get discovered
early in the game – “low hanging fruit” Depletion is a fact of life in the oil
business We cannot make more oil!

North Sea “Forties”
A “Giant” Oil Field (>10 billion bbl)
Peak (1979)
“Brent light sweet crude”

The Experts on When?
Forecast Source2006-2007 Bakhtiari (Iran)
2007-2009 Simmons (U.S.)
After 2007 Skrebowski (U.K.)
2008 Campbell (Ireland)
Before 2009 Deffeyes (U.S.)
Before 2010 Goodstein (U.S.)
After 2010 World Energy Council
2012 Weng (China)
2016 Doug-Westwood (U.K.)
After 2020 CERA (U.S.)
2031 or later EIA (U.S.)
< 5 years
5-10 years
> 15 years

World Oil – In Perspective
You
YourChildren
YourGrand
Children
YourGrand
Parents

The Underlying Facts We are consuming 3-4 barrels of oil for
each barrel that is being discovered World oil discovery peaked in 1964 World oil production is declining while
world oil demand is rising China and India (over half the world’s
population) are very rapidly expanding their economies and their transportation fuel use (~8% growth per year)!

0
20
40
60
80
100
120
140
EmergingAsia
EmergingAsia
By Region
MBD
North AmericaNorth America
EuropeEurope
Japan/Aus/NZJapan/Aus/NZ
LALA
ME/AFME/AF
0
20
40
60
80
100
120
140
By Sector
MBD
Res/CommRes/Comm
IndustrialIndustrial
PowerPower
Russia/CaspianRussia/Caspian
TransportationTransportation
80 90 00 10 20 30 80 90 00 10 20 30
World Oil Demand
The “China” Factor
Why it Matters Oil and gas now dominate our lives 40% of all traded energy is oil More than 90% of all transportation
fuel is oil• Trade depends on transport• Fuels much electricity generation
Critical for agriculture• Fuels the tractor, transports the produce• Basis for synthetic fertilizer and
pesticides

Oil Production and Use 2005 world oil use = 84 million barrels
per day (Mbpd) Over 75% of world’s production comes
from fields 25 years old and in decline Experts believe world production will
decline between 2-8% --- next 5 years World demand will increase by
2% per year over the same period, and… World oil production may have already
peaked!
What Every beer drinker knows: The faster you drink it . . .!

The “Super Straw” Effect
We are getting better at extracting oil---• Better geology – we know where it is• Better production technology – we
know how to get it out quicker The problem – the speed of
production does not improve our ability to ultimately produce more oil.
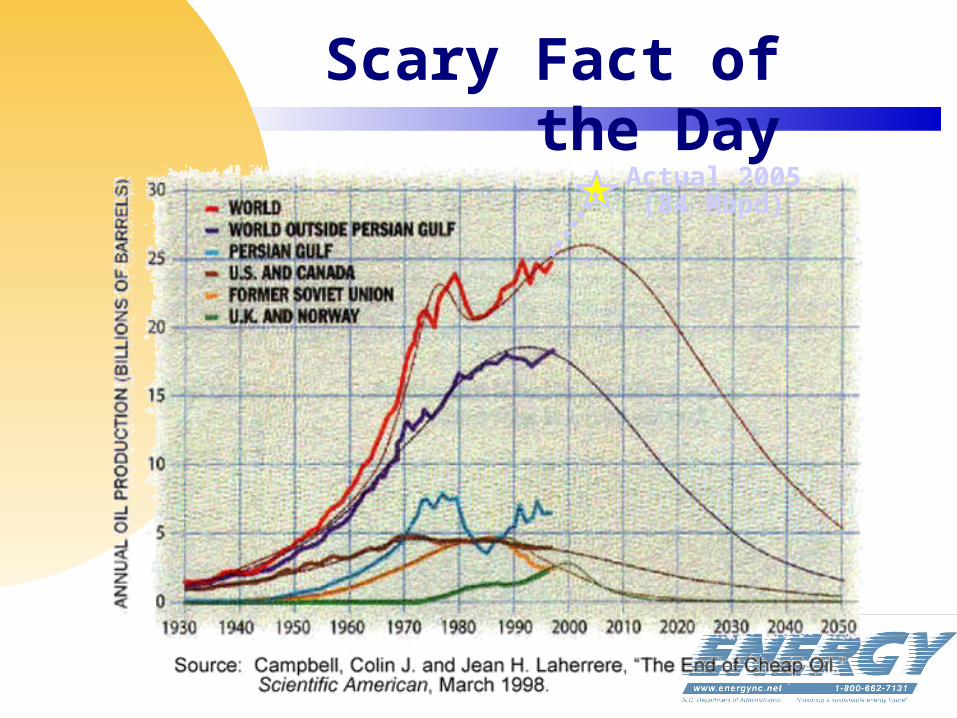
Scary Fact of the Day
Actual 2005(84 Mbpd)

Where The Oil Is

Saudi Oil One “super giant” field
(Ghawar) contains 50% of all Saudi oil
4 other super giant oilfields make up an additional 40%
And 3 others are another 8% All fields are between 40 and
60 years old All are reaching point of
decline Half of “proven reserves” are
questionable Remaining oil is increasingly
difficult to produce.

Saudi Importance Can produce about 10-12 Mbpd or
about 12% of current world oil demand Has more than 22% of reported
“proven” reserves worldwide Will become the sole arbiter of price
when remainder of world oil peaks – this is coming soon, if not here already
Using advanced injection techniques and horizontal “fishbone” drilling technology – no secondary oil recovery

Questions for the Saudis Why did Saudi Arabia stop reporting
field-by-field production in 1982? Is there sufficient reason to believe
that the Saudis really have 260 billion barrels of “proven” reserves, as they claim?
What discoveries followed Aramco’s take over by the Saudi government that allowed proven reserves to be revised up from 170 billion barrels in 1989 to 260 billion barrels in 1990?
Why no independent verification? Why is it a State secret!

OPEC Reserve Reporting Reported 1990 oil
reserves are 178% of 1985 reserves!
Based on what?OPEC oil discovery peaked in 1970’s
Are they competing for OPEC Quota?
How can we accept these reports?
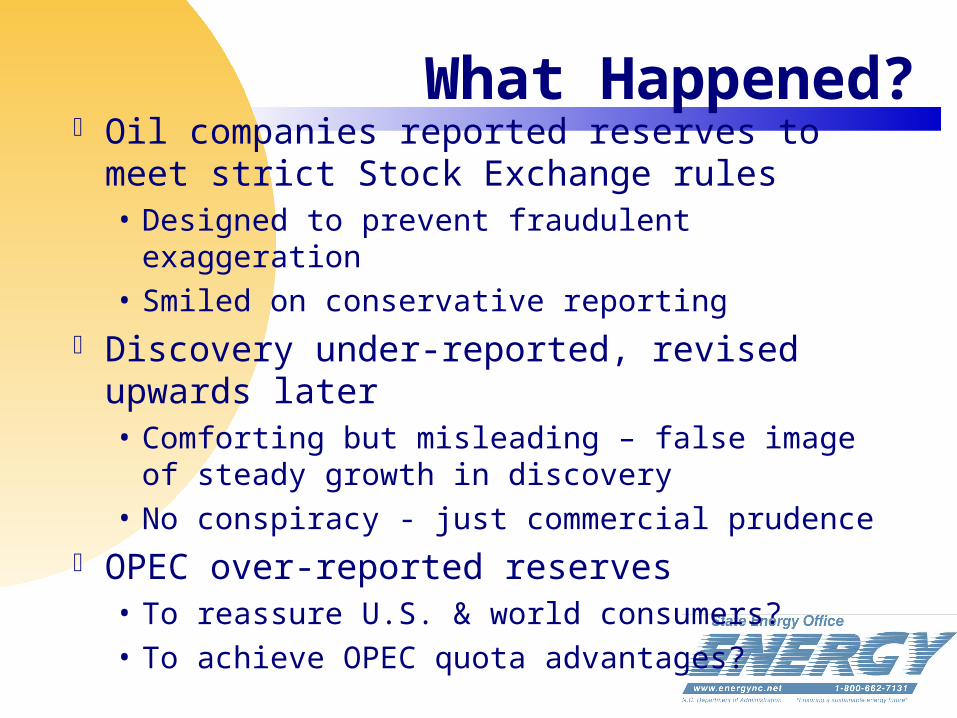
What Happened? Oil companies reported reserves to meet
strict Stock Exchange rules• Designed to prevent fraudulent exaggeration• Smiled on conservative reporting
Discovery under-reported, revised upwards later• Comforting but misleading – false image of
steady growth in discovery• No conspiracy - just commercial prudence
OPEC over-reported reserves• To reassure U.S. & world consumers?• To achieve OPEC quota advantages?
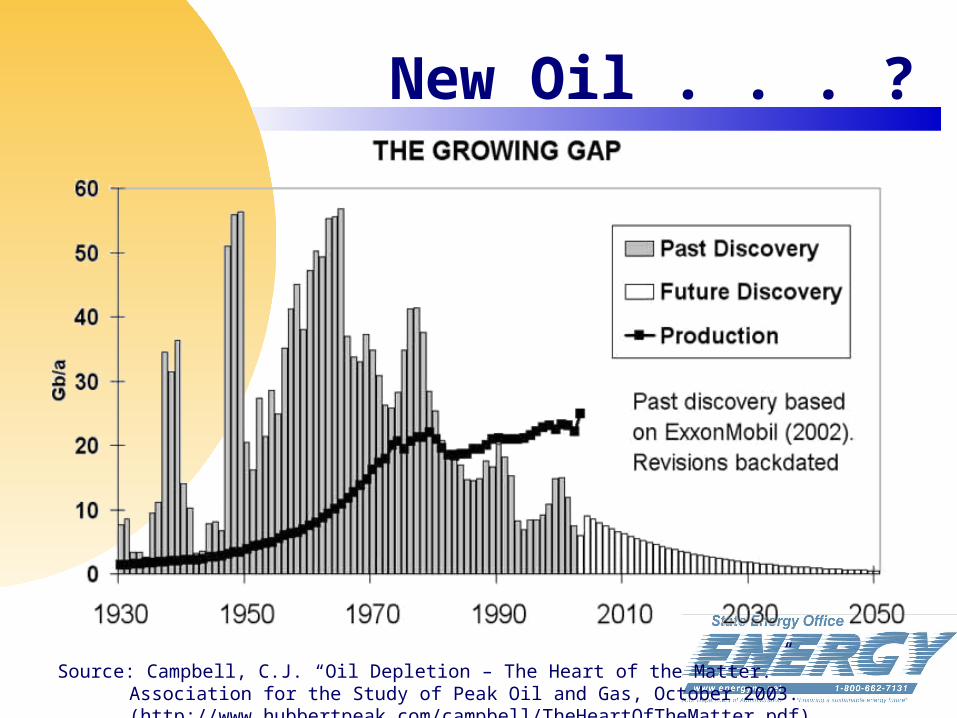
New Oil . . . ?
Source: Campbell, C.J. “Oil Depletion – The Heart of the Matter.” Association for the Study of Peak Oil and Gas, October 2003. (http://www.hubbertpeak.com/campbell/TheHeartOfTheMatter.pdf)
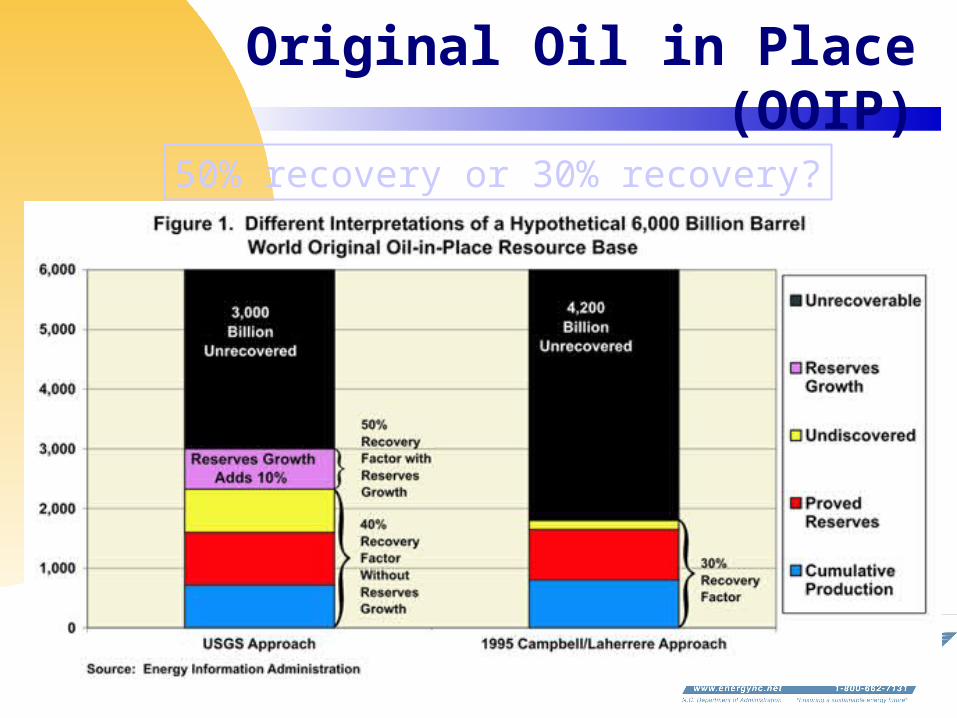
Original Oil in Place (OOIP)
50% recovery or 30% recovery?
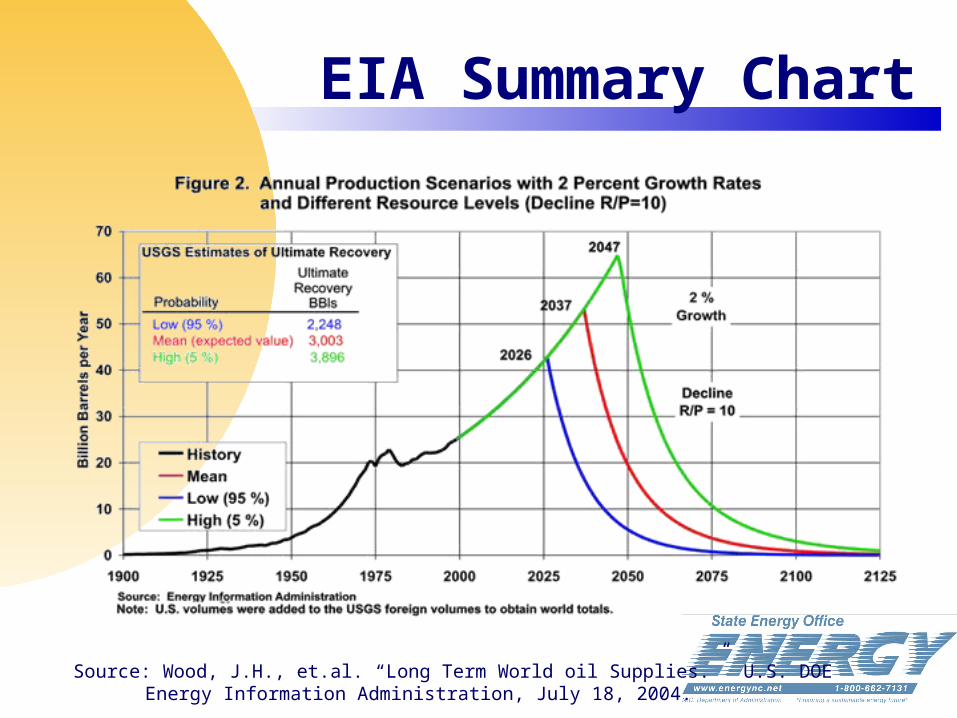
EIA Summary Chart
Source: Wood, J.H., et.al. “Long Term World oil Supplies.” U.S. DOE Energy Information Administration, July 18, 2004.
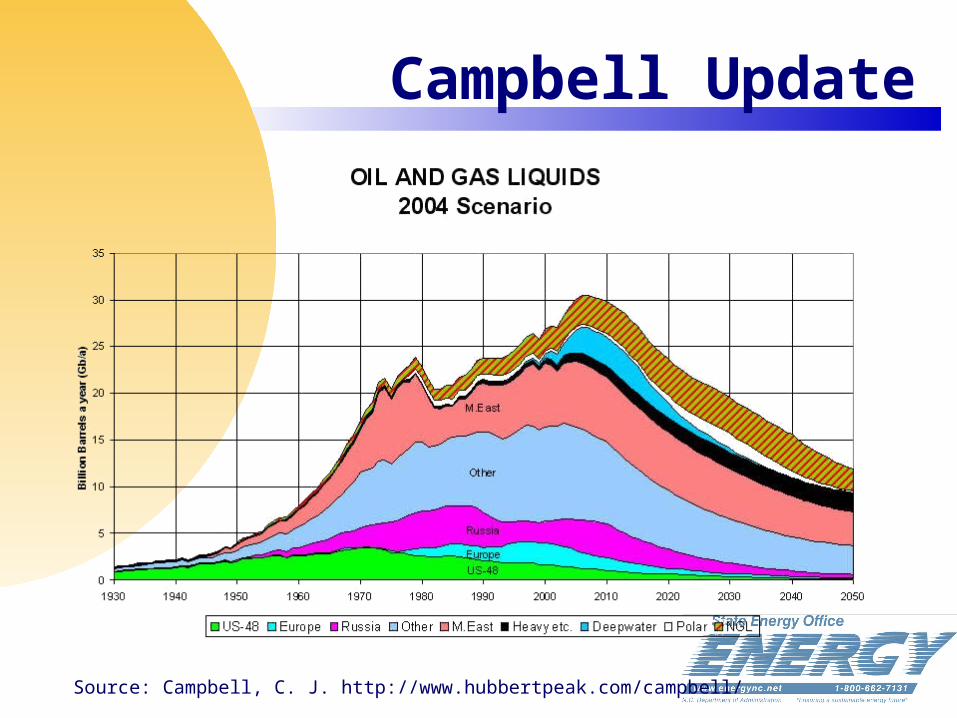
Campbell Update
Source: Campbell, C. J. http://www.hubbertpeak.com/campbell/
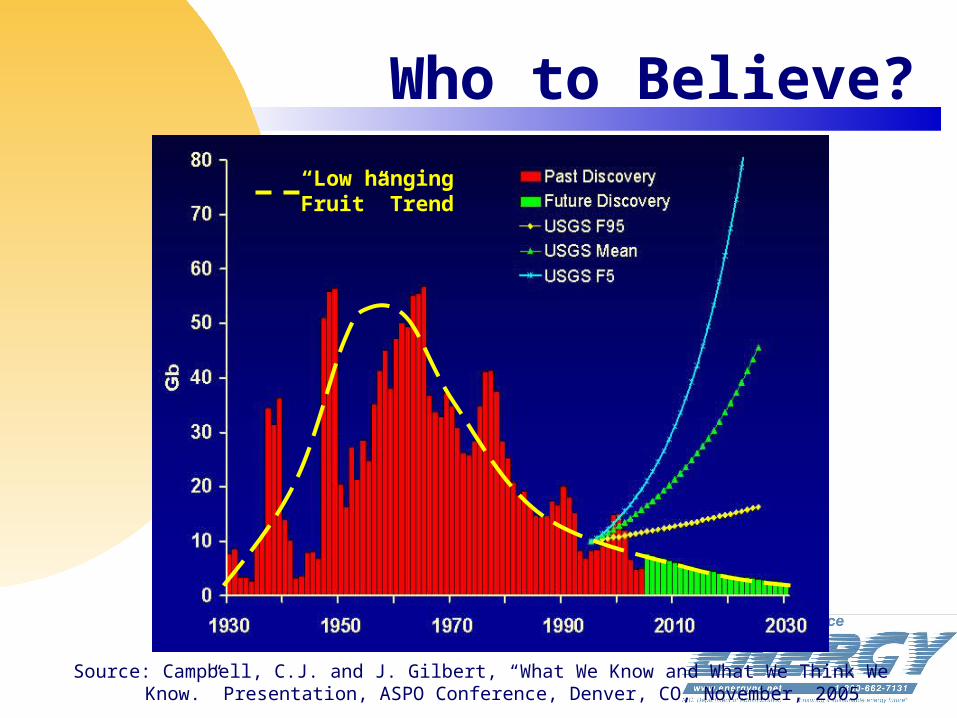
Who to Believe?
Source: Campbell, C.J. and J. Gilbert, “What We Know and What We Think We Know.” Presentation, ASPO Conference, Denver, CO, November, 2005
“Low hangingFruit” Trend

Macro Economics Demand is inelastic – small changes in
supply yield large changes in price Immediate alternatives don’t exist Make it personal – what would would
you be willing to pay:• If your spouse or child was deathly ill and
you needed to get them to a hospital?• To maintain employment and provide for
your family? “Demand destruction” (outlandish
prices, rationing, etc) coming?
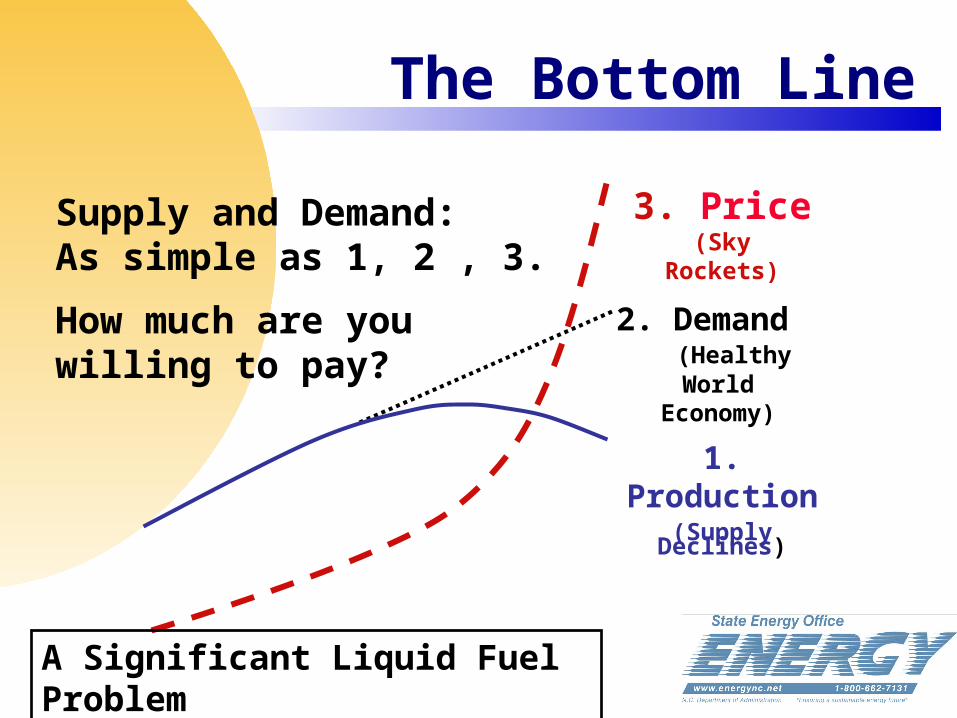
The Bottom Line
2. Demand (Healthy
WorldEconomy)
1. Production
(Supply Declines)
3. Price(Sky
Rockets)
A Significant Liquid Fuel Problem
Supply and Demand: As simple as 1, 2 , 3.
How much are you willing to pay?

“Flat Earth” Economics
The “invisible hand” of the free marketplace will always meet demand
But . . .• At what price and who will be able to pay?• The marketplace cannot make more oil?• The “sunk” capital costs (stranded assets)
are huge, the lead time for mitigation is extensive, and there is no “Plan B” on the table!
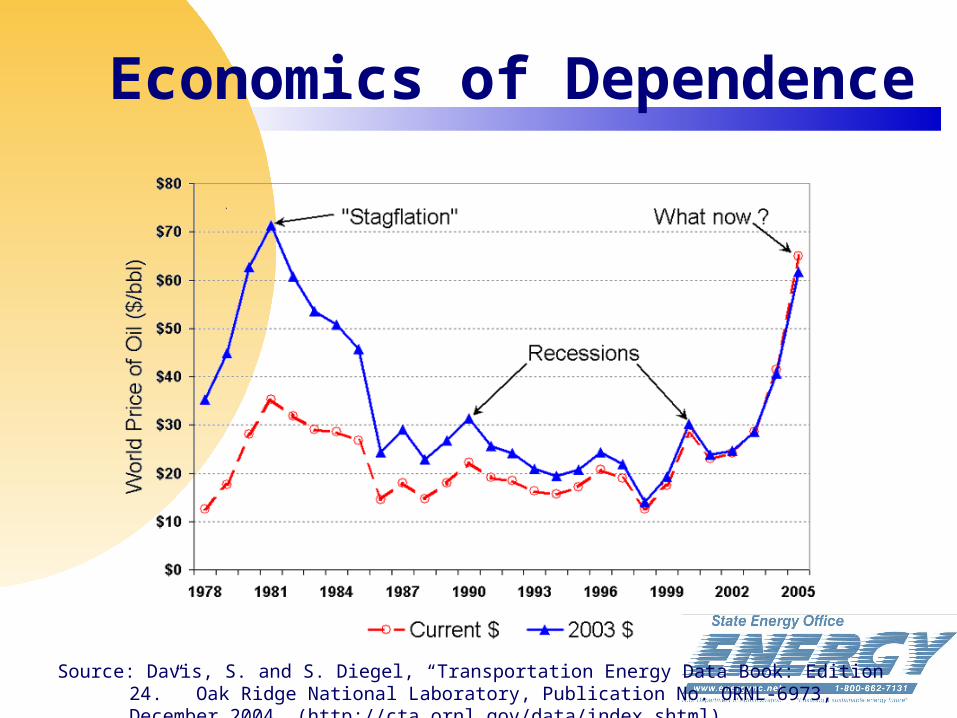
Economics of Dependence
Source: Davis, S. and S. Diegel, “Transportation Energy Data Book: Edition 24.” Oak Ridge National Laboratory, Publication No. ORNL-6973, December 2004. (http://cta.ornl.gov/data/index.shtml)

Cost of Dependence
Source: Green, D. and S. Ahmed, “Cost of U.S. Oil Dependence: 2005 Update.” Oak Ridge National Laboratory, Publication No. ORNL/TM-05/45, January 2005

What Americans Can Do“… half to two thirds (of the economic gains) resulted from greater energy efficiency. Technological improvements in energy efficiency allow consumers to enjoy more energy services without commensurate increases in energy demand.”
Source: “National Energy Policy.” Report of the National Energy Policy Development Group, Office of the President of the United States.
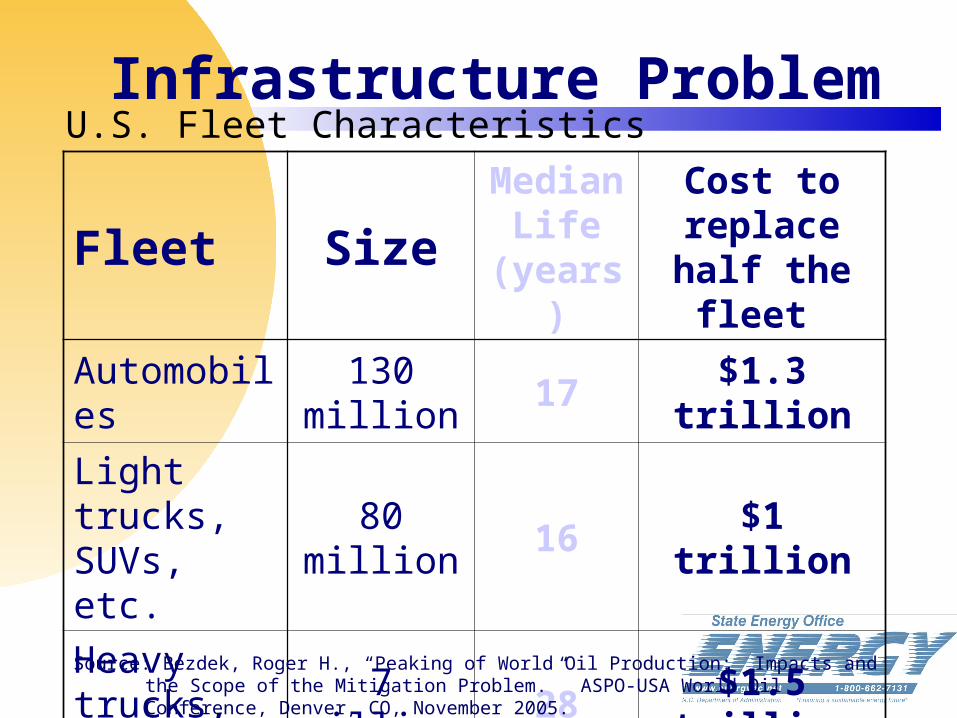
Infrastructure Problem
Fleet Size
Median Life(years
)
Cost to replace half the
fleet
Automobiles
130 million
17$1.3
trillion
Light trucks, SUVs, etc.
80 million
16 $1 trillion
Heavy trucks, buses
7 million 28$1.5
trillion
Aircraft 8,500 22$0.25 trillion
Source: Bezdek, Roger H., “Peaking of World Oil Production: Impacts and the Scope of the Mitigation Problem.” ASPO-USA World Oil Conference, Denver, CO, November 2005.
U.S. Fleet Characteristics

Scenario I – No action until peaking
Scenario II – Mitigation started 10 years before peaking
Scenario III – Mitigation started 20 years before peaking
All mitigation initiated immediately Crash program implementation
Optimistic limiting case
Mitigation Scenarios
Source: Bezdek, Roger H., “Peaking of World Oil Production: Impacts and the Scope of the Mitigation Problem.” ASPO-USA World Oil Conference, Denver, CO, November 2005.

0
20
40
60
80
100
-20 -10 0 +10 +20
YEARS BEFORE / AFTER OIL PEAK
PRODUCTION(Mbpd)
120
Mitigation
Oil Peaking Further
Delayed Start
Mitigate 20 Years Prior
Source: Bezdek, Roger H., “Peaking of World Oil Production: Impacts and the Scope of the Mitigation Problem.” ASPO-USA World Oil Conference, Denver, CO, November 2005.

0
20
40
60
80
100
-20 -10 0 +10 +20
YEARS BEFORE / AFTER OIL PEAK
PRODUCTION(Mbpd)
120 Mitigation
Shortage
Oil Decline Delayed
Start
Mitigate 10 Years Prior
Source: Bezdek, Roger H., “Peaking of World Oil Production: Impacts and the Scope of the Mitigation Problem.” ASPO-USA World Oil Conference, Denver, CO, November 2005.
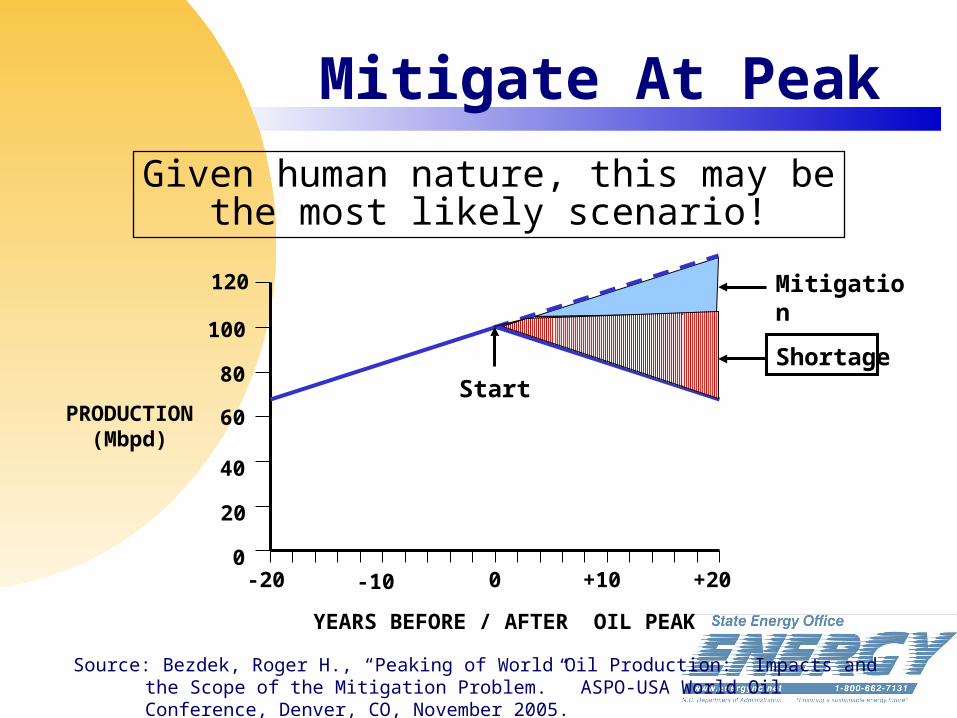
Mitigate At Peak
0
20
40
60
80
100
-20 -10 0 +10 +20
YEARS BEFORE / AFTER OIL PEAK
PRODUCTION(Mbpd)
120 Mitigation
ShortageStart
Source: Bezdek, Roger H., “Peaking of World Oil Production: Impacts and the Scope of the Mitigation Problem.” ASPO-USA World Oil Conference, Denver, CO, November 2005.
Given human nature, this may bethe most likely scenario!
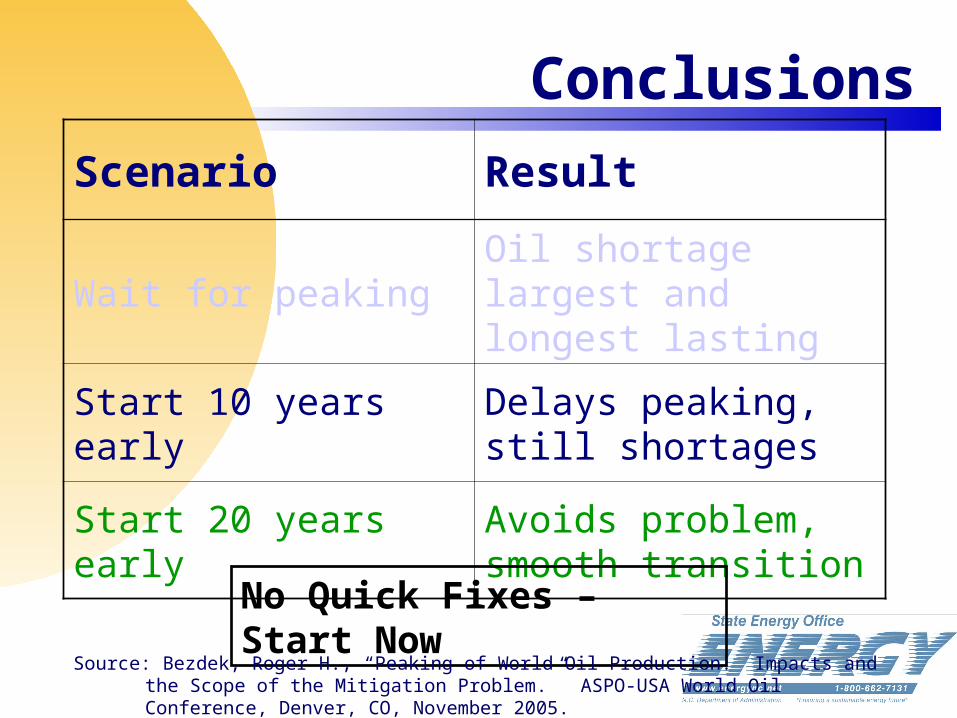
Conclusions
Scenario Result
Wait for peakingOil shortage largest and longest lasting
Start 10 years earlyDelays peaking, still shortages
Start 20 years earlyAvoids problem, smooth transition
No Quick Fixes – Start Now
Source: Bezdek, Roger H., “Peaking of World Oil Production: Impacts and the Scope of the Mitigation Problem.” ASPO-USA World Oil Conference, Denver, CO, November 2005.

But Not To Worry . . . The world is blessed by much coal At the current U.S. demand for
energy, we have 250 years worth left in coal – just dig!• Do as the Germans had to in WWII –
make transportation fuels from coal• Convert electric generation plants from
oil and natural gas to coal and nuclear (but coal is already 50% of U.S. electric generation?)
And this brings us to . . .
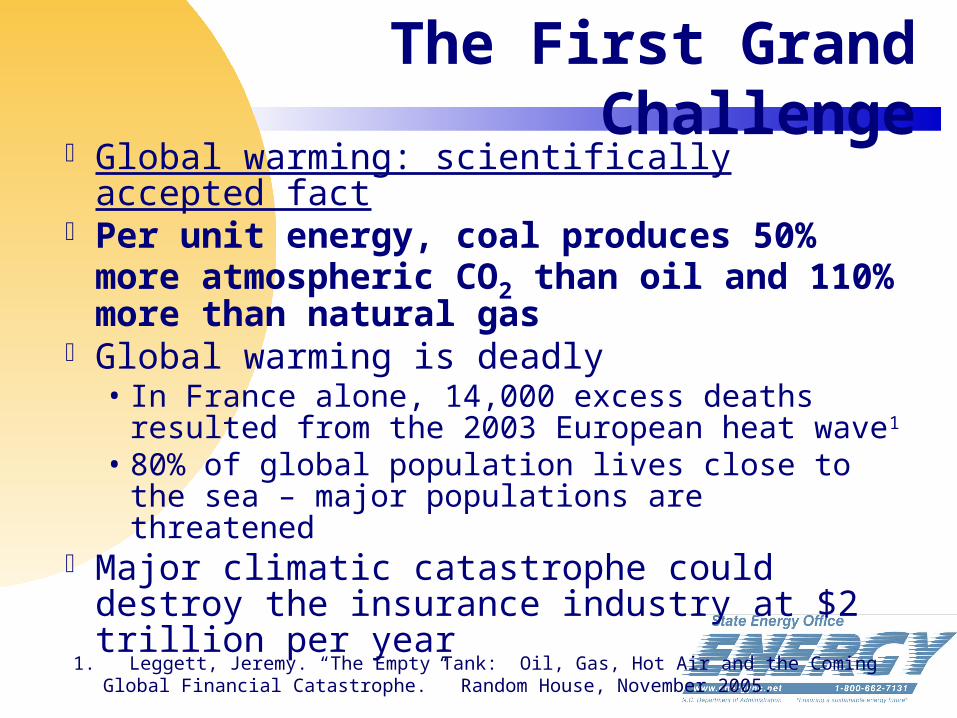
The First Grand Challenge
Global warming: scientifically accepted fact
Per unit energy, coal produces 50% more atmospheric CO2 than oil and 110% more than natural gas
Global warming is deadly• In France alone, 14,000 excess deaths
resulted from the 2003 European heat wave1
• 80% of global population lives close to the sea – major populations are threatened
Major climatic catastrophe could destroy the insurance industry at $2 trillion per year1. Leggett, Jeremy. “The Empty Tank: Oil, Gas, Hot Air and the Coming Global Financial Catastrophe.” Random House, November 2005.

Watching Their Losses
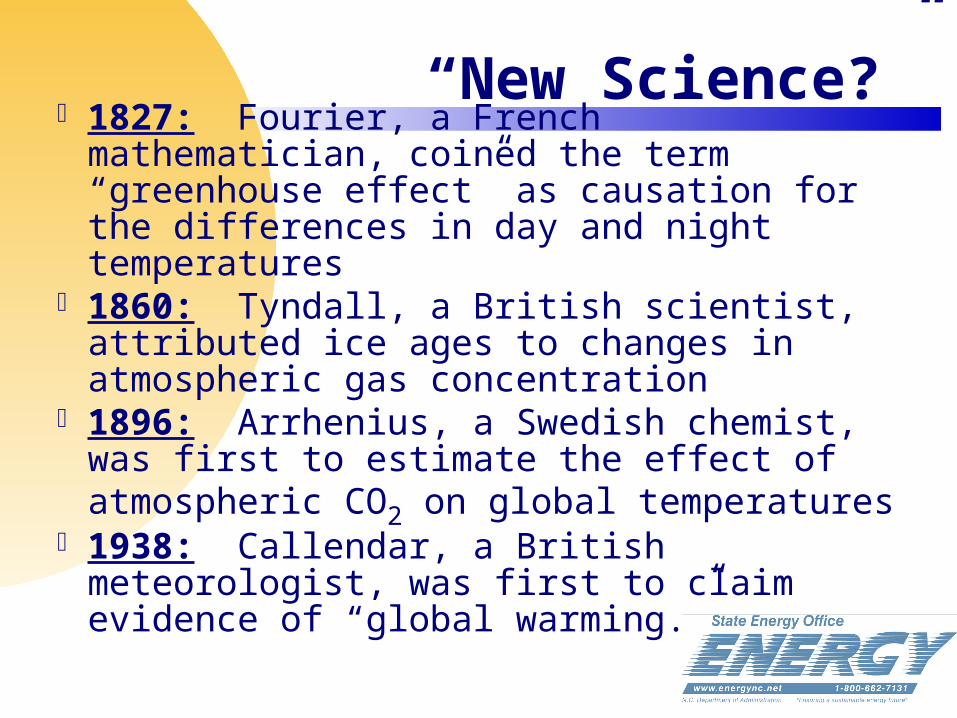
“New Science?” 1827: Fourier, a French mathematician,
coined the term “greenhouse effect” as causation for the differences in day and night temperatures
1860: Tyndall, a British scientist, attributed ice ages to changes in atmospheric gas concentration
1896: Arrhenius, a Swedish chemist, was first to estimate the effect of atmospheric CO2 on global temperatures
1938: Callendar, a British meteorologist, was first to claim evidence of “global warming.”

New? Well, Not Exactly 1958: Charles Keeling, American scientist,
began keeping CO2 records on the peak of Mauna Loa in Hawaii
1988: James Hansen, Chief NASA Scientist, told U.S. Senate committee he was “99% certain” that global warming was occurring and that is was linked to fossil fuel burning
1990: First consensus international report concludes there is a causal relationship between human activities and global warming.
Source: King, Sir David (Chief Scientific Advisor to UK Government), “The Science of Climate Change: Adapt, Mitigate or Ignore?” The Ninth Zuckerman Lecture, October 31, 2002.

The “Keeling Curve”
The sensitivity of these measurement is corroborated by the fact that peaks and valleys correspond to winter and summer in the northern hemisphere.
Mauna Loa, Hawaii (through 2004)
Source: Keeling, C.D. and T.P. Whorf, Carbon Dioxide Research Group, Scripps Institution of Oceanography, University of California, La Jolla, CA (http://cdiac.esd.ornl.gov/ftp/trends/co2/maunaloa.co2.)

Model vs. Observation
Keeling CO2
Data Set
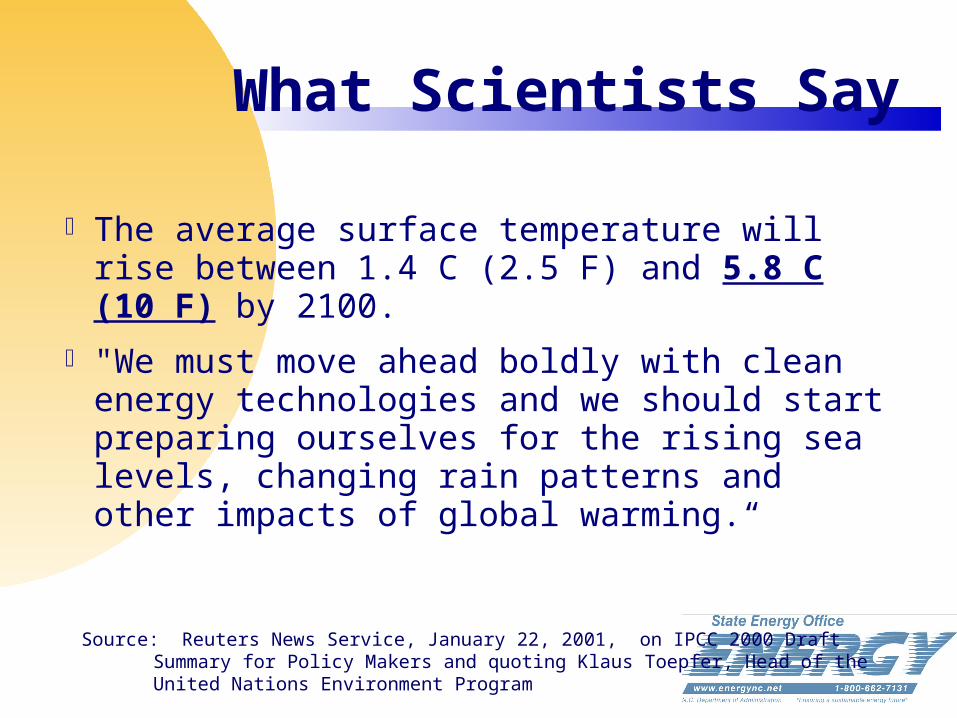
What Scientists Say
The average surface temperature will rise between 1.4 C (2.5 F) and 5.8 C (10 F) by 2100.
"We must move ahead boldly with clean energy technologies and we should start preparing ourselves for the rising sea levels, changing rain patterns and other impacts of global warming.“
Source: Reuters News Service, January 22, 2001, on IPCC 2000 Draft Summary for Policy Makers and quoting Klaus Toepfer, Head of the United Nations Environment Program
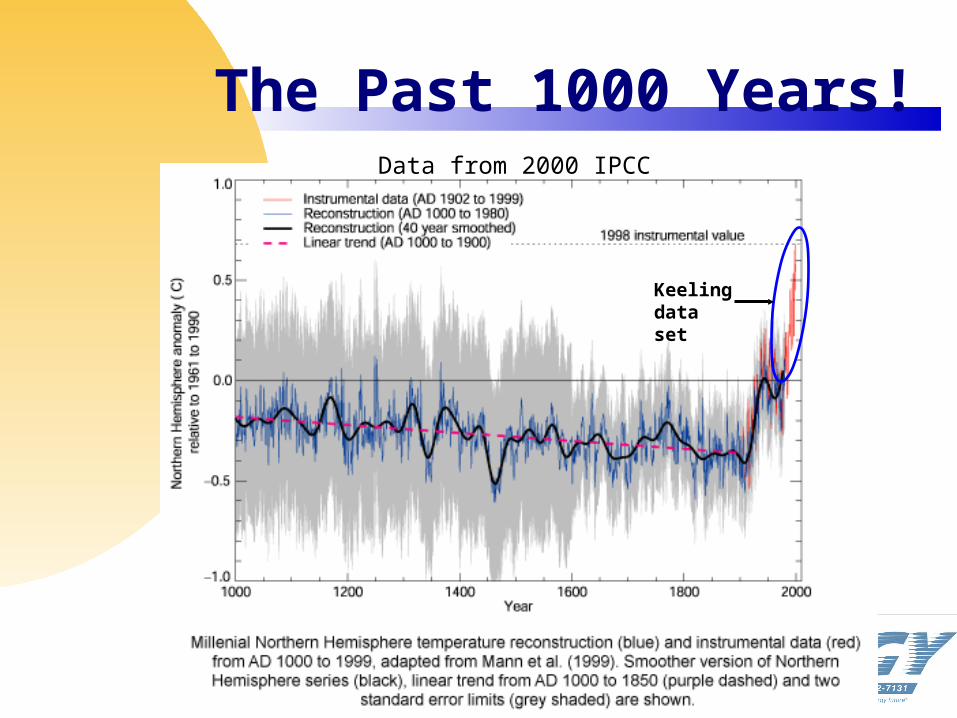
The Past 1000 Years!Data from 2000 IPCC
Keelingdata set
What’s a Degree or So?
“The typical temperature difference for the whole world between an ice age and an interglacial interval is only 3o to 6o
C. This should set the alarm bells ringing: A temperature change of only a few degrees can be serious business.”Carl Sagan,
Billions & Billions, 1997.
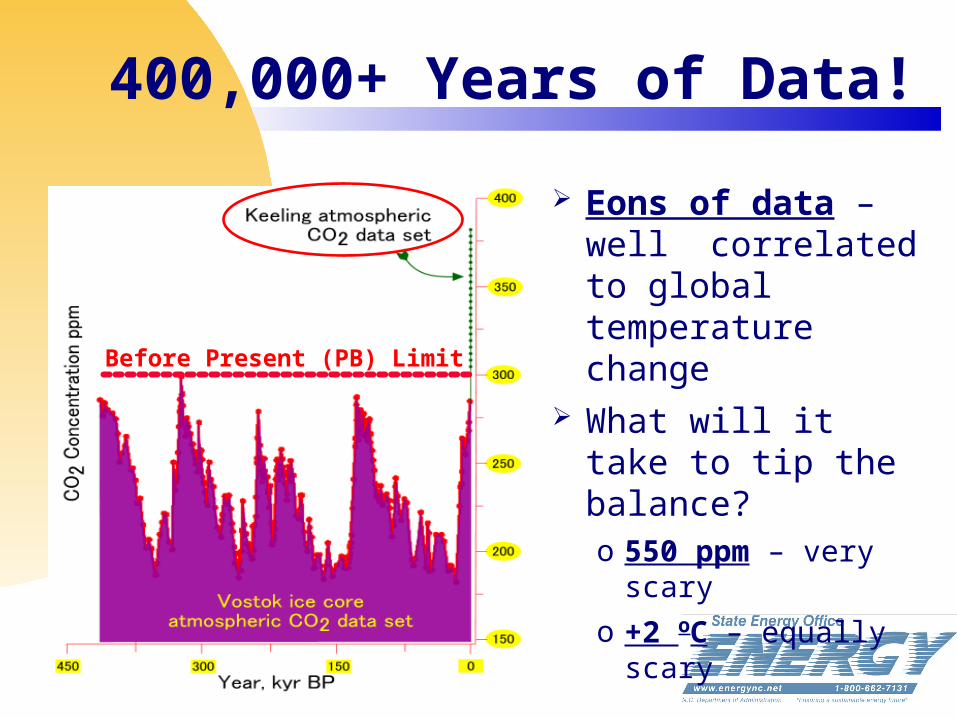
400,000+ Years of Data!
Eons of data – well correlated to global temperature change
What will it take to tip the balance?o 550 ppm – very
scary
o +2 oC – equally scary
Before Present (PB) Limit
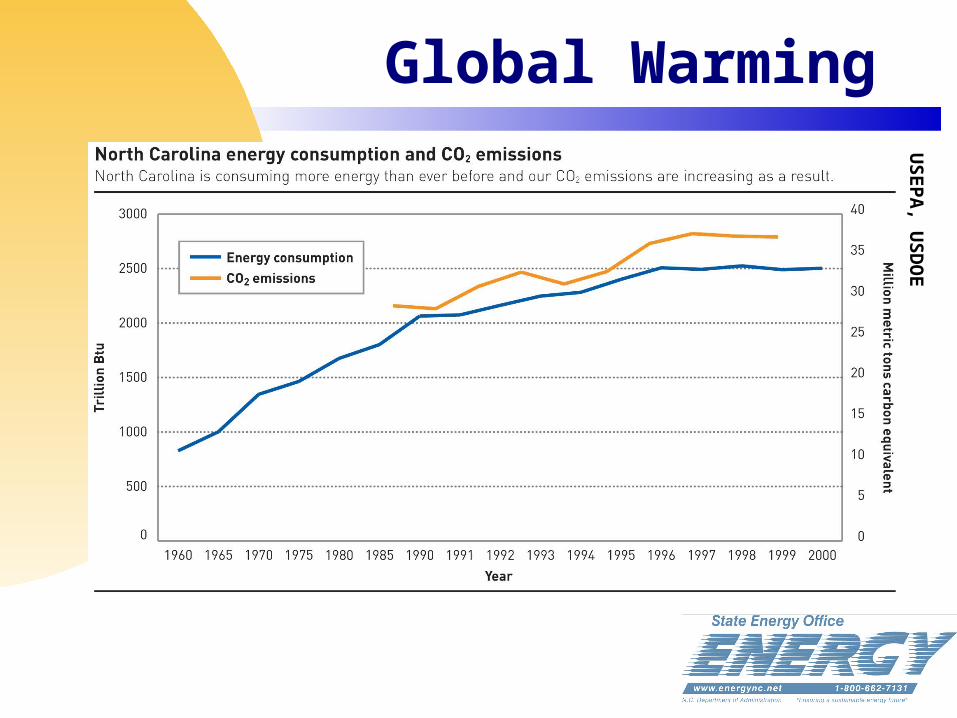
Global WarmingU
SEPA, U
SDO
E


Sea Level Rise –Climate Change
Ben Poulter, D
uke University; Sam
Pearsall, The Nature
Conservancy

“Big Bang” TheoryIt is at least possible, because
the earth has never experienced greenhouse gas and temperature
regimes like this, that we may exceed some stable state threshold and
“jump” to a completely new and very different state. This would only make matters worse… One thing we know
for certain – we have entered new and
uncharted waters!

Quiz Answers:Q.Who is Captain of this ship?A.There is no captain – and worse yet,
the crew is misinformed about the dangers of the storm.
Q.How bad is the storm?A.Answer is uncertain – much of the
Peak Oil data are highly questionable.
Q.How fast are we closing on the storm?A.Closing speed is contentious – often
argued using sophisticated disinformation

Quiz Answers:Q.How strong is the ship?A.She may not be strong enough –
economic and political systems may not be up to this task.
Q.How large is the ship and how quickly can she be turned?
A.She is extremely large and it will take literally decades to bring her about.
Q.What is Plan B?A.There is no Plan B!

Grand Challenges Where great challenges are understood,
humanity has proven very adaptable and innovative but there remains . . .• Great Need for better and more reliable
data • Urgent Need for frank, factual public
discourse But . . . It’s Political Suicide –
• So who will step up to the plate?• Probably no one until too late in the game!
Thus, you are Plan B!