Embed Size (px)
Citation preview
Requisition #:
Patient Name:
Physician:
Date of Collection:
Patient Age:
F
52
Patient Sex:
Time of Collection:
Print Date:
4/21/2015
04:30 AM
04/29/2015
Metabolic Markers in Urine Reference Population - Females Age 13 and Over (mmol/mol creatinine)
Patient Value
Reference Range
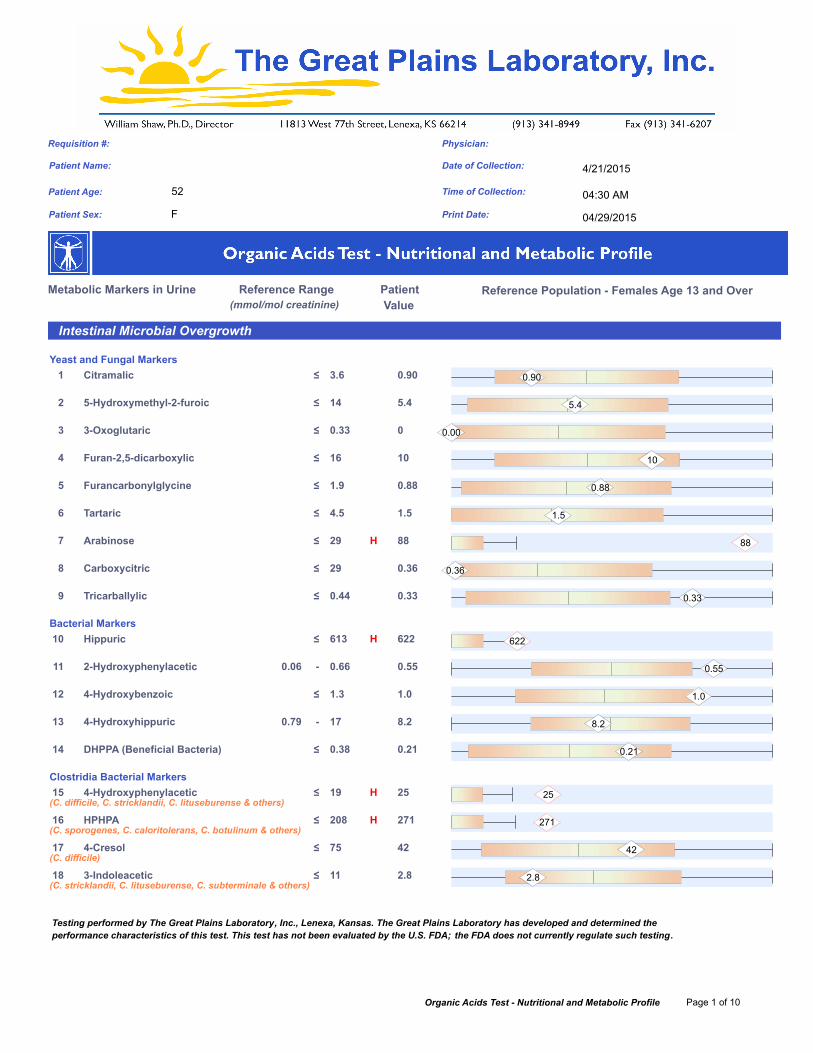
Intestinal Microbial Overgrowth
Yeast and Fungal Markers0.90≤1 3.6 0.90Citramalic
5.4≤2 14 5.45-Hydroxymethyl-2-furoic
0≤3 0.33 0.003-Oxoglutaric
10≤4 16 10Furan-2,5-dicarboxylic
0.88≤5 1.9 0.88Furancarbonylglycine
1.5≤6 4.5 1.5Tartaric
88≤ H7 29 88Arabinose
0.36≤8 29 0.36Carboxycitric
0.33≤9 0.44 0.33Tricarballylic
Bacterial Markers622≤ H10 613 622Hippuric
0.55-11 0.660.06 0.552-Hydroxyphenylacetic
1.0≤12 1.3 1.04-Hydroxybenzoic
8.2-13 170.79 8.24-Hydroxyhippuric
0.21≤14 0.38 0.21DHPPA (Beneficial Bacteria)
Clostridia Bacterial Markers25≤ H15 19
(C. difficile, C. stricklandii, C. lituseburense & others)254-Hydroxyphenylacetic
271≤ H16 208(C. sporogenes, C. caloritolerans, C. botulinum & others)
271HPHPA
42≤17 75(C. difficile)
424-Cresol
2.8≤18 11(C. stricklandii, C. lituseburense, C. subterminale & others)
2.83-Indoleacetic
Testing performed by The Great Plains Laboratory, Inc., Lenexa, Kansas. The Great Plains Laboratory has developed and determined the performance characteristics of this test. This test has not been evaluated by the U.S. FDA; the FDA does not currently regulate such testing.
Organic Acids Test - Nutritional and Metabolic Profile Page 1 of 10

The Great Plains Laboratory, Inc.Requisition #:
Patient Name:
Physician:
Date of Collection:
4/21/2015
Metabolic Markers in Urine Reference Population - Females Age 13 and Over (mmol/mol creatinine)
Patient Value
Reference Range
Oxalate Metabolites
4.6-19 7.00.77 4.6Glyceric
46-20 11716 46Glycolic
69-21 1016.8 69Oxalic
Glycolytic Cycle Metabolites
12≤22 48 12Lactic
4.4≤23 9.1 4.4Pyruvic
Mitochondrial Markers - Krebs Cycle Metabolites
5.3≤24 9.3 5.3Succinic
0.51≤25 0.94 0.51Fumaric
0.95-26 1.80.06 0.95Malic
49≤ H27 35 492-Oxoglutaric
18-28 286.8 18Aconitic
706≤ H29 507 706Citric
Mitochondrial Markers - Amino Acid Metabolites
0.35≤30 0.76 0.353-Methylglutaric
8.8≤ H31 6.2 8.83-Hydroxyglutaric
2.2≤32 4.5 2.23-Methylglutaconic
Neurotransmitter Metabolites
Phenylalanine and Tyrosine Metabolites3.3-33 3.60.80
(dopamine)3.3Homovanillic (HVA)
2.0-34 3.70.46(norepinephrine, epinephrine)
2.0Vanillylmandelic (VMA)
1.6-35 1.80.16 1.6HVA / VMA Ratio
Tryptophan Metabolites1.5≤36 4.3
(serotonin)1.55-Hydroxyindoleacetic (5-HIAA)
2.4-37 3.90.85 2.4Quinolinic
1.4-38 2.20.17 1.4Kynurenic
1.6-39 2.00.42 1.6Quinolinic / 5-HIAA Ratio
Organic Acids Test - Nutritional and Metabolic Profile Page 2 of 10

The Great Plains Laboratory, Inc.
Requisition #:
Patient Name:
Physician:
Date of Collection: 4/21/2015
Metabolic Markers in Urine Reference Population - Females Age 13 and Over (mmol/mol creatinine)
Patient Value
Reference Range
Pyrimidine Metabolites - Folate Metabolism
5.1≤40 9.7 5.1Uracil
0.22≤41 0.56 0.22Thymine
Ketone and Fatty Acid Oxidation
19≤ H42 3.1 193-Hydroxybutyric
9.5≤43 10 9.5Acetoacetic
0.34≤44 4.8 0.344-Hydroxybutyric
1.4-45 2.80.44 1.4Ethylmalonic
2.1-46 2.20.10 2.1Methylsuccinic
2.0-47 3.80.04 2.0Adipic
0.80-48 2.20.18 0.80Suberic
0.19≤49 0.24 0.19Sebacic
Nutritional Markers
Vitamin B122.0≤50 2.3 2.0Methylmalonic ä
Vitamin B65.1≤51 34 5.1Pyridoxic (B6)
Vitamin B51.3≤52 10 1.3Pantothenic (B5)
Vitamin B2 (Riboflavin)0.29-53 0.360.04 0.29Glutaric ä
Vitamin C0.44- L54 20010 0.44Ascorbic
Vitamin Q10 (CoQ10)22-55 390.17 223-Hydroxy-3-methylglutaric ä
Glutathione Precursor and Chelating Agent0.17≤56 0.28 0.17N-Acetylcysteine (NAC)
Biotin (Vitamin H)1.9-57 2.70.19 1.9Methylcitric ä
ä A high value for this marker may indicate a deficiency of this vitamin.
Organic Acids Test - Nutritional and Metabolic Profile Page 3 of 10

The Great Plains Laboratory, Inc.Requisition #:
Patient Name:
Physician:
Date of Collection: 4/21/2015
Metabolic Markers in Urine Reference Population - Females Age 13 and Over (mmol/mol creatinine)
Patient Value
Reference Range
Indicators of Detoxification
Glutathione23-58 3310 23Pyroglutamic ä
3.0- H59 1.80.03 3.02-Hydroxybutyric ä
Ammonia Excess0.33-60 0.540.06 0.33Orotic
Aspartame, salicylates, or GI bacteria1.5≤ H61 1.3 1.52-Hydroxyhippuric
ä A high value for this marker may indicate a Glutathione deficiency.
Amino Acid Metabolites
0≤62 0.42 0.002-Hydroxyisovaleric
0.40≤63 2.1 0.402-Oxoisovaleric
0.49≤64 0.87 0.493-Methyl-2-oxovaleric
0≤65 0.48 0.002-Hydroxyisocaproic
0.47≤ H66 0.37 0.472-Oxoisocaproic
0.10≤67 0.16 0.102-Oxo-4-methiolbutyric
0.18≤68 0.21 0.18Mandelic
0.17≤69 0.20 0.17Phenyllactic
0.48-70 1.90.20 0.48Phenylpyruvic
0.04≤71 0.36 0.04Homogentisic
0.72≤72 0.80 0.724-Hydroxyphenyllactic
1.5≤73 3.0 1.5N-Acetylaspartic
3.0≤74 9.7 3.0Malonic
Mineral Metabolism
2 638-75 5 0001 000 2638Phosphoric
Organic Acids Test - Nutritional and Metabolic Profile Page 4 of 10

The Great Plains Laboratory, Inc.Requisition #:
Patient Name:
Physician:
Date of Collection: 4/21/2015
Indicator of Fluid Intake
8976 mg/dL *Creatinine
*The creatinine test is performed to adjust metabolic marker results for differences in fluid intake. Urinary creatinine haslimited diagnostic value due to variability as a result of recent fluid intake. Samples are rejected if creatinine is below 20mg/dL unless the client requests results knowing of our rejection criteria.
Example of Elevated Value
Explanation of Report Format
The reference ranges for organic acids were established using samples collected from typical individuals of all ages with no known physiological or psychological disorders. The ranges were determined by calculating the mean and standard deviation (SD) and are defined as + 2SD of the mean. Reference ranges are age and gender specific, consisting of Male Adult (>13 years), Female Adult (>13 years), Male Child (<13 years), and Female Child (<13 years).
There are two types of graphical representations of patient values found in the new report format of both the standard Organic Acids Test and the Microbial Organic Acids Test.
The first graph will occur when the value of the patient is within the reference (normal) range, defined as the mean plus or minus two standard deviations.
The second graph will occur when the value of the patient exceeds the upper limit of normal. In such cases, the graphical reference range is “shrunk” so that the degree of abnormality can be appreciated at a glance. In this case, the lower limits of normal are not shown, only the upper limit of normal is shown.
In both cases, the value of the patient is given to the left of the graph and is repeated on the graph inside a diamond. If the value is within the normal range, the diamond will be outlined in black. If the value is high or low, the diamond will be outlined in red.
Example of Value Within Reference Range
Organic Acids Test - Nutritional and Metabolic Profile Page 5 of 10