Embed Size (px)
Citation preview
RSoft Design UK, Ltd.11 Swinborne DriveSpringwood Industrial EstateBraintree, Essex CM7 2YP
PHONE: +44 (0)1376 528556E-MAIL: [email protected]: www.rsoftdesign.co.uk
UNITED STATES Corporate headquarters
JAPAN EUROPE
90-degree Hybrid Device Design forCoherent Optical Communication Systems.
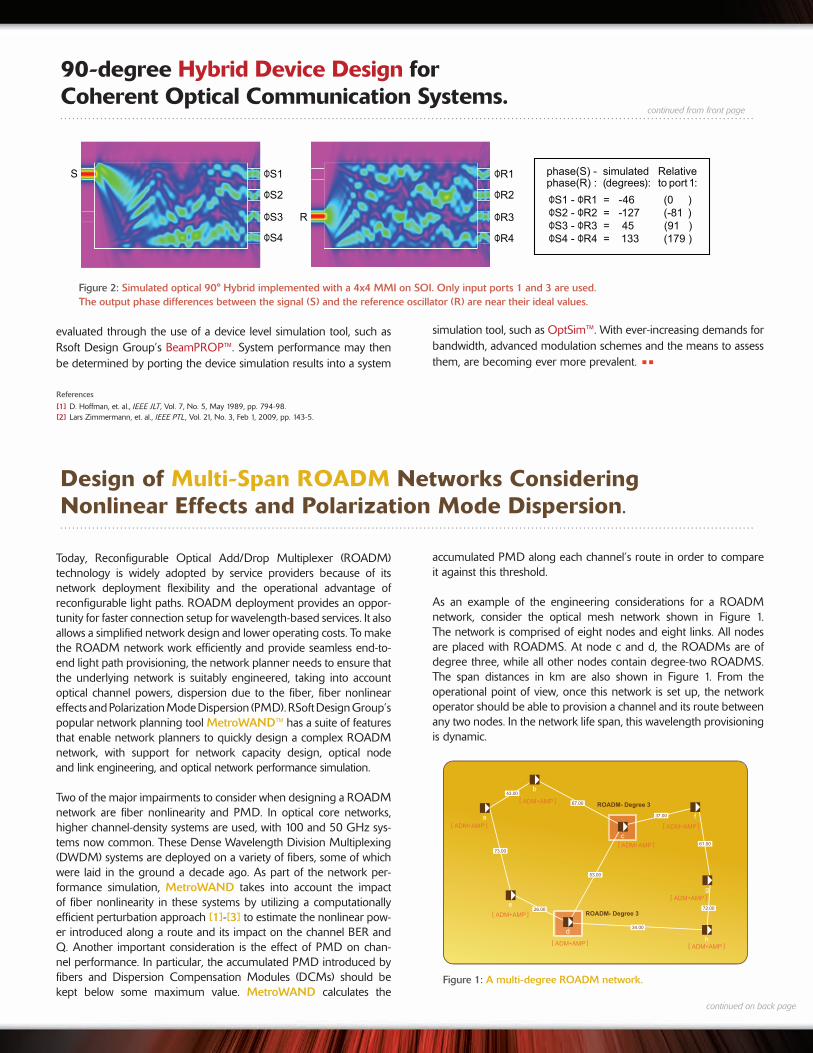
4 µm thick on the ridge and 2 µm thick off the ridge. Only input waveguide ports 1 and 3 are used, yielding relative phase differ-ences between signal (S) and oscillator (R) of; -45°, -135°, 45°, and 135° at output ports 1, 2, 3, and 4, respectively. Simulations were performed at 1.55 µm using BPM (Beam Propagation Method) and resulting phase differences at each port, shown in Figure 2 (inside cover), are nearly ideal.
Rigorous simulation of these devices is important in order to assess the performance criteria necessary to maintain low system BER. For example, changes in phase difference, excess loss, or imbalance, as functions of wavelength, may prevent the device from meet-ing design specifi cations over the band [2]. These criteria may be
JANUARY - JUNE 2011VOLUME 10 NUMBER 1
When an optical signal travels through fi ber it experience chromatic dispersion, and system performance will be affected if the total accumulated dispersion of the sig-nal is greater than the allowable dispersion limit. Planners need to place DCMs at dif-ferent locations in the network in order to nullify the effect of chromatic dispersion. Consider three wavelengths with paths 1) b-c-f, 2) b-c-d, and 3) a-b-c-f-g. These light paths are independent of each other. Therefore, determining how to compensate for chromatic dispersion for each wavelength and providing a single compensation modulein each node is diffi cult. There is also a need to provide suitable compensation for future wavelengths, which are not known at the time of deployment. Network planners utilize different engineering techniques to tackle this issue. In MetroWAND, dispersion compensation is managed by simulating the dispersion effect for a given span and providing a compensation module at the start/end node. The simulation of all the wavelengths used in the network identifi es the maximum positive dispersion and maximum negative disper-sion for a span. The tool then places a DCM within the tolerance limit of the transponder.
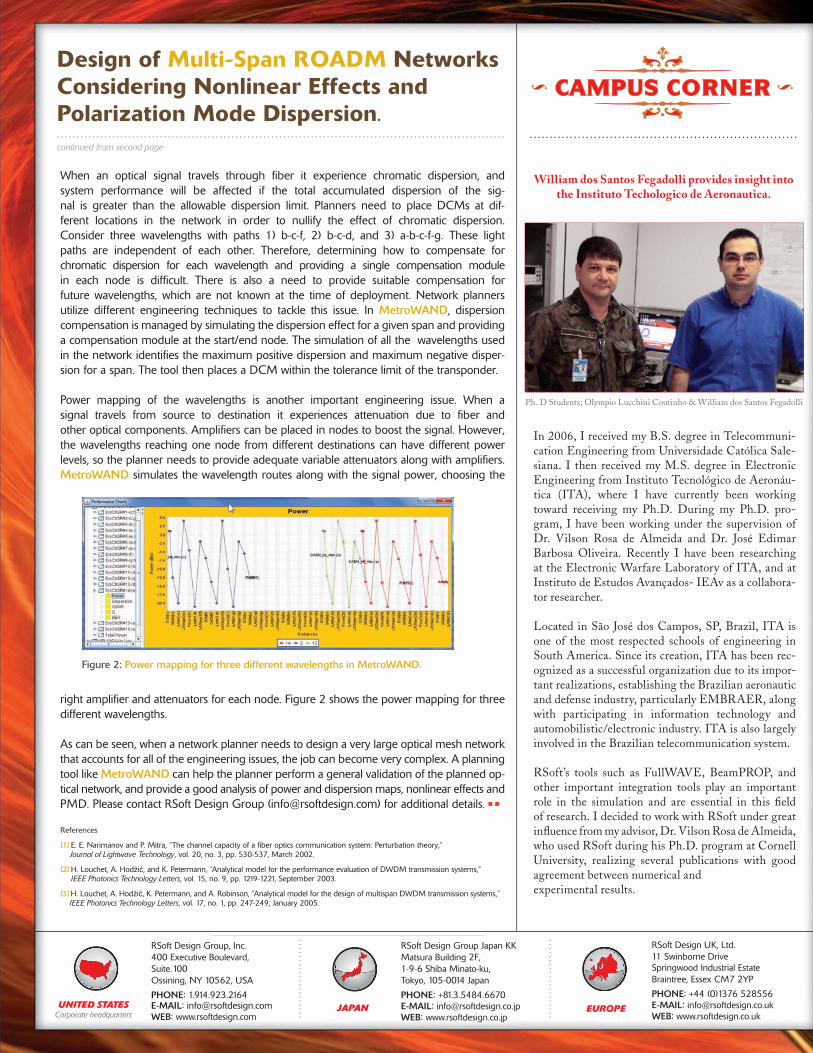
Power mapping of the wavelengths is another important engineering issue. When a signal travels from source to destination it experiences attenuation due to fi ber and other optical components. Amplifi ers can be placed in nodes to boost the signal. However, the wavelengths reaching one node from different destinations can have different power levels, so the planner needs to provide adequate variable attenuators along with amplifi ers. MetroWAND simulates the wavelength routes along with the signal power, choosing the
right amplifi er and attenuators for each node. Figure 2 shows the power mapping for three different wavelengths.
As can be seen, when a network planner needs to design a very large optical mesh network that accounts for all of the engineering issues, the job can become very complex. A planning tool like MetroWAND can help the planner perform a general validation of the planned op-tical network, and provide a good analysis of power and dispersion maps, nonlinear effects and PMD. Please contact RSoft Design Group ([email protected]) for additional details.
RSoft: Please give us a brief history of your education and work experience.After getting a MS (1987) and a PhD (1990) in radiophysics from the Moscow Physics and Technology Institute (MPTI), I worked as a Research Fellow at the Prokhorov General Physics Institute (GPI) of Russian Academy of Sciences (RAS). In 1992-3 I spent a couple of years as a Staff Associate in Columbia University (New York, USA), and subsequently worked at the Institutes of Applied/Experimental Physics at the Johannes Kepler University (JKU Linz, Austria) as Visiting Professor and Research Scientist. In 2004-2010 I made several research visits to Computer Science and Mathematics Division of the Oak Ridge National Laboratory (ORNL) in Tennessee, USA. My memberships include Material Research Society and New York Academy of Sciences.
RSoft: Please tell us about the Applied Physics Institute and JKU Linz.
Dr. Arnold: JKU is a mid-size state university in a dynamic region of Upper Austria. Department of Natural Sciences includes several Physics Institutes with joint emphasis on nanoscience (photonics and semiconductors), material science and biophysics. They collaborate and share experimental and computational facilities. External funding comes from the Austrian Science Fund (FWF), EU grants, as well as industrial collaboration with global and local companies.
RSoft: Can you tell us about your current research?
Dr. Arnold: We study laser-assisted nano-structuring of materials using self-assembling arrays of colloidal microspheres. This requiresunderstanding of light focusing by such microspheres and their arrays. For laser-induced forward transfer (LIFT) they are covered with silicon and metals, which raises the question about the role of surface plasmons. Optical properties of such hybrid 2D photonic crystals are also studied. Currently we are moving into active nano-plasmonics, which uses media with optical gain to compensate losses in metals and improve quality factors of plasmonic nano-devices. This increases spatial localization and fi eld enhancement, which paves the way for substantially improved nano-sensors, frequency converters, and sub-wavelength lasing.
RSoft: What kinds of challenges do you face in your research?
Dr. Arnold: Non-conventional curvilinear, inherently 3D geometries; combination of dispersive lossy metals with saturating lasing media (both are notoriously prone to numerical instabilities), metamaterials; numerical verifi cation of analytical results obtained for large structures; instruc-tive visualization of results. In nano-photonics and metamaterials many proofs of principle, such as negative index at optical frequencies, perfect lens, cloaking devices, plasmonic nano-lasers, plasmon-assisted SERS, have already been demonstrated. The transformation of these ideas into real applications requires combined modeling that includes thermal, non-linear optics, and lasing effects with realistic material properties.
RSoft: How has RSoft’s Software assisted in this effort?
Dr. Arnold: It allowed to model and visualize unusual geometries, for example the infl uence of capillary condensation between the silica microspheres and the substrate, which leads to defocusing of light under the particles or coupling of light into the propagating modes of photonic slab formed by the hexagonal lattice of Si coated silica microspheres. Over the last years RSoft improved the treatment of dispersive absorbing and amplifying media, included metamaterials and provided multi-physics tools. Ability to treat anisotropy and non-linear optics is also of importance for us.
RSoft: Why did you decide to work with RSoft for design and simulation software?
Dr. Arnold: RSoft runs on 64 bit Linux machines, which fi ts well to our confi guration (SGI Altix 4700). We mainly perform 3D Finite-Difference -Time-Domain(FDTD) calculations, which require large memory and, when possible, parallelization, which is handled well in latest releases. Advantageous is also the modular structure of RSoft under the common CAD interface. In our case FullWAVE™, BandSOLVE™, as well as MOST™ utility were often used on the same structure to discern different aspects of the underlying physics.
RSoft: How do you see the need and demand for photonic modeling software in the next generation applications?
Dr. Arnold: The trend goes into the direction of multiphysics simulations. Not only the variety of built-in models, but also the convenience of incorporating one’s own physical processes/equations will be expected. Therefore, such modules as Multi-Physics Utility™, FemSIM™ and LaserMOD™ and their integration into the common framework will play increasing role. Modeling of biological applications, such as plasmonic sensing, SERS, micro- and tiling arrays, lab on a chip microfl uidics will grow in importance. With increasing computing power and memory, the ease of usage, visualization and parallelization will move to the forefront in the choice of simulation software.
RSoft: Thank you. We wish you the best of luck in your research.
with Dr. Nikita Arnold of Johannes Kepler University
RSoft Design Group, Inc.400 Executive Boulevard,Suite. 100Ossining, NY 10562, USA
PHONE: 1.914.923.2164E-MAIL: [email protected]: www.rsoftdesign.com
RSoft Design Group Japan KKMatsura Building 2F,1-9-6 Shiba Minato-ku,Tokyo, 105-0014 Japan
PHONE: +81.3.5484.6670E-MAIL: [email protected]: www.rsoftdesign.co.jp
William dos Santos Fegadolli provides insight into the Instituto Techologico de Aeronautica.
Ph. D Students; Olympio Lucchini Coutinho & William dos Santos Fegadolli
In 2006, I received my B.S. degree in Telecommuni-cation Engineering from Universidade Católica Sale-siana. I then received my M.S. degree in Electronic Engineering from Instituto Tecnológico de Aeronáu-tica (ITA), where I have currently been working toward receiving my Ph.D. During my Ph.D. pro-gram, I have been working under the supervision of Dr. Vilson Rosa de Almeida and Dr. José Edimar Barbosa Oliveira. Recently I have been researching at the Electronic Warfare Laboratory of ITA, and at Instituto de Estudos Avançados- IEAv as a collabora-tor researcher.
Located in São José dos Campos, SP, Brazil, ITA is one of the most respected schools of engineering in South America. Since its creation, ITA has been rec-ognized as a successful organization due to its impor-tant realizations, establishing the Brazilian aeronautic and defense industry, particularly EMBRAER, along with participating in information technology and automobilistic/electronic industry. ITA is also largely involved in the Brazilian telecommunication system.
RSoft’s tools such as FullWAVE, BeamPROP, and other important integration tools play an important role in the simulation and are essential in this fi eld of research. I decided to work with RSoft under great infl uence from my advisor, Dr. Vilson Rosa de Almeida, who used RSoft during his Ph.D. program at Cornell University, realizing several publications with good agreement between numerical and experimental results.
Coherent modulation schemes have become of great interest in recent years due to their ability to compact parallel data streams into a single polarization-wavelength channel. Additional advantages include; detection of quadrature and polarization modulated formats, linear impairment correction, ability to receive OFDM, near ideal fi ltering, increased reach and receiver sensitivity, and no need forlocking of the LO (local oscillator) between receiver and transmitter.
While a variety of formats have been explored, QPSK (quadra-ture phase shift keying) and QAM (quadrature amplitude modulation) have found wide acceptance in polarization mul-tiplexed systems. Both modula-tion and demodulation of data in these formats may be performed effi ciently using optical compo-nents combined with electronic DSP (digital signal processing).
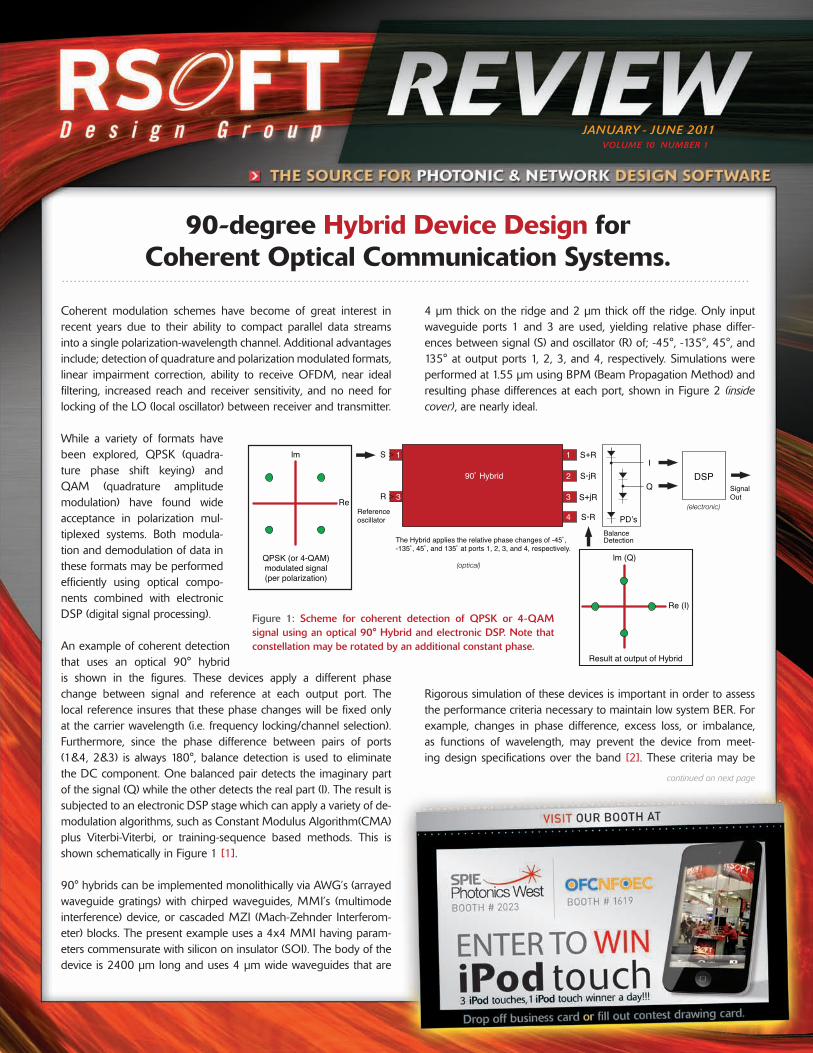
An example of coherent detection that uses an optical 90° hybrid is shown in the fi gures. These devices apply a different phase change between signal and reference at each output port. The local reference insures that these phase changes will be fi xed only at the carrier wavelength (i.e. frequency locking/channel selection). Furthermore, since the phase difference between pairs of ports (1&4, 2&3) is always 180°, balance detection is used to eliminate the DC component. One balanced pair detects the imaginary part of the signal (Q) while the other detects the real part (I). The result is subjected to an electronic DSP stage which can apply a variety of de-modulation algorithms, such as Constant Modulus Algorithm(CMA) plus Viterbi-Viterbi, or training-sequence based methods. This is shown schematically in Figure 1 [1].
90° hybrids can be implemented monolithically via AWG’s (arrayed waveguide gratings) with chirped waveguides, MMI’s (multimode interference) device, or cascaded MZI (Mach-Zehnder Interferom-eter) blocks. The present example uses a 4x4 MMI having param-eters commensurate with silicon on insulator (SOI). The body of the device is 2400 µm long and uses 4 µm wide waveguides that are
Interview
continued on next page
Dr. Nikita Arnold
Design of Multi-Span ROADM Networks Considering Nonlinear Effects and Polarization Mode Dispersion.
continued from second page
DSP
PD’s
lm (Q)
Re (I)
lm
Re
Result at output of Hybrid
The Hybrid applies the relative phase changes of -45˚, -135˚, 45˚, and 135˚ at ports 1, 2, 3, and 4, respectively.
QPSK (or 4-QAM)modulated signal(per polarization)
Referenceoscillator
R
S
SignalOut
Balance Detection
I
Q
S+R
90˚ Hybrid
11
3
2
3
4 S-R
S-jR
S+jR(electronic)
(optical)
>
>
Figure 1: Scheme for coherent detection of QPSK or 4-QAM signal using an optical 90° Hybrid and electronic DSP. Note that constellation may be rotated by an additional constant phase.
References
[1] E. E. Narimanov and P. Mitra, “The channel capacity of a fi ber optics communication system: Perturbation theory,” Journal of Lightwave Technology, vol. 20, no. 3, pp. 530-537, March 2002.
[2] H. Louchet, A. Hodžić, and K. Petermann, “Analytical model for the performance evaluation of DWDM transmission systems,” IEEE Photonics Technology Letters, vol. 15, no. 9, pp. 1219-1221, September 2003.
[3] H. Louchet, A. Hodžić, K. Petermann, and A. Robinson, “Analytical model for the design of multispan DWDM transmission systems,” IEEE Photonics Technology Letters, vol. 17, no. 1, pp. 247-249, January 2005.
Figure 2: Power mapping for three different wavelengths in MetroWAND.
evaluated through the use of a device level simulation tool, such as Rsoft Design Group’s BeamPROP™. System performance may then be determined by porting the device simulation results into a system
Today, Reconfi gurable Optical Add/Drop Multiplexer (ROADM) technology is widely adopted by service providers because of its network deployment fl exibility and the operational advantage of reconfi gurable light paths. ROADM deployment provides an oppor-tunity for faster connection setup for wavelength-based services. It also allows a simplifi ed network design and lower operating costs. To make the ROADM network work effi ciently and provide seamless end-to-end light path provisioning, the network planner needs to ensure that the underlying network is suitably engineered, taking into account optical channel powers, dispersion due to the fi ber, fi ber nonlinear effects and Polarization Mode Dispersion (PMD). RSoft Design Group’s popular network planning tool MetroWAND™ has a suite of features that enable network planners to quickly design a complex ROADM network, with support for network capacity design, optical nodeand link engineering, and optical network performance simulation.
Two of the major impairments to consider when designing a ROADM network are fi ber nonlinearity and PMD. In optical core networks, higher channel-density systems are used, with 100 and 50 GHz sys-tems now common. These Dense Wavelength Division Multiplexing (DWDM) systems are deployed on a variety of fi bers, some of which were laid in the ground a decade ago. As part of the network per-formance simulation, MetroWAND takes into account the impact of fi ber nonlinearity in these systems by utilizing a computationally effi cient perturbation approach [1]-[3] to estimate the nonlinear pow-er introduced along a route and its impact on the channel BER and Q. Another important consideration is the effect of PMD on chan-nel performance. In particular, the accumulated PMD introduced by fi bers and Dispersion Compensation Modules (DCMs) should be kept below some maximum value. MetroWAND calculates the
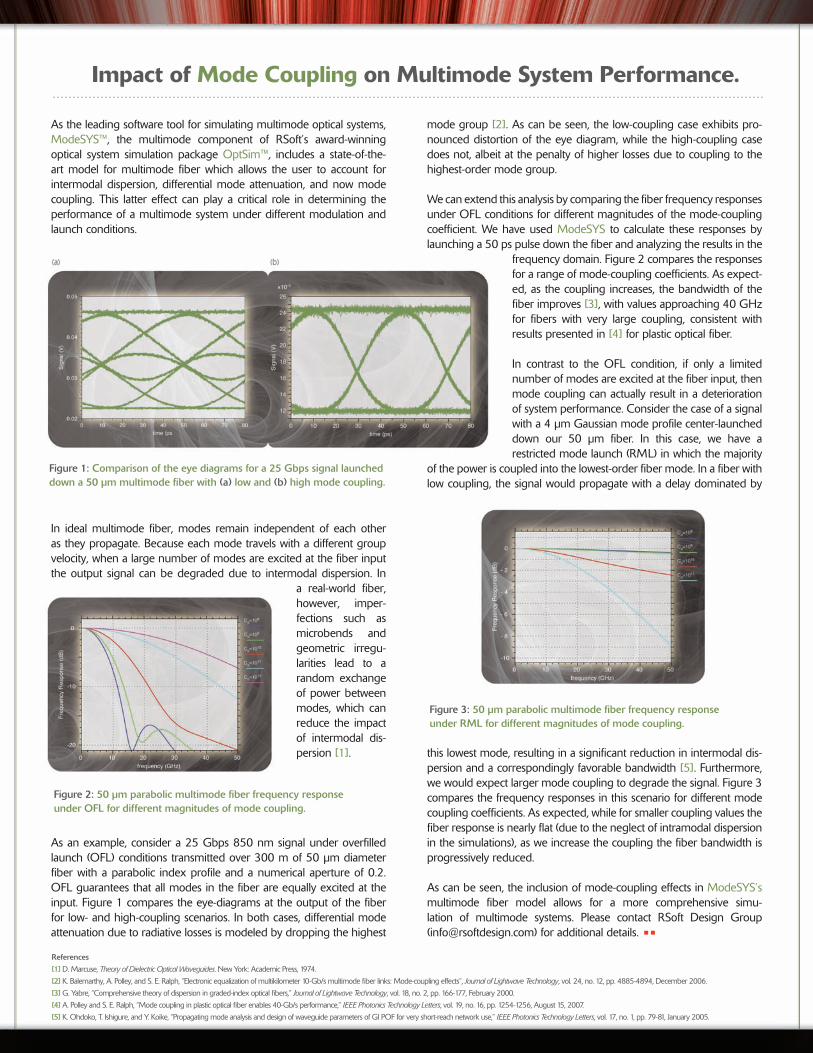
mode group [2]. As can be seen, the low-coupling case exhibits pro-nounced distortion of the eye diagram, while the high-coupling case does not, albeit at the penalty of higher losses due to coupling to the highest-order mode group.
We can extend this analysis by comparing the fi ber frequency responses under OFL conditions for different magnitudes of the mode-coupling coeffi cient. We have used ModeSYS to calculate these responses by launching a 50 ps pulse down the fi ber and analyzing the results in the
frequency domain. Figure 2 compares the responses for a range of mode-coupling coeffi cients. As expect-ed, as the coupling increases, the bandwidth of the fi ber improves [3], with values approaching 40 GHz for fi bers with very large coupling, consistent with results presented in [4] for plastic optical fi ber.
In contrast to the OFL condition, if only a limited number of modes are excited at the fi ber input, then mode coupling can actually result in a deterioration of system performance. Consider the case of a signal with a 4 µm Gaussian mode profi le center-launched down our 50 µm fi ber. In this case, we have a restricted mode launch (RML) in which the majority
of the power is coupled into the lowest-order fi ber mode. In a fi ber with low coupling, the signal would propagate with a delay dominated by
this lowest mode, resulting in a signifi cant reduction in intermodal dis-persion and a correspondingly favorable bandwidth [5]. Furthermore, we would expect larger mode coupling to degrade the signal. Figure 3 compares the frequency responses in this scenario for different mode coupling coeffi cients. As expected, while for smaller coupling values the fi ber response is nearly fl at (due to the neglect of intramodal dispersion in the simulations), as we increase the coupling the fi ber bandwidth is progressively reduced.
As can be seen, the inclusion of mode-coupling effects in ModeSYS’s multimode fi ber model allows for a more comprehensive simu-lation of multimode systems. Please contact RSoft Design Group ([email protected]) for additional details.
As the leading software tool for simulating multimode optical systems, ModeSYS™, the multimode component of RSoft’s award-winning optical system simulation package OptSim™, includes a state-of-the-art model for multimode fi ber which allows the user to account for intermodal dispersion, differential mode attenuation, and now mode coupling. This latter effect can play a critical role in determining the performance of a multimode system under different modulation and launch conditions.
In ideal multimode fi ber, modes remain independent of each other as they propagate. Because each mode travels with a different group velocity, when a large number of modes are excited at the fi ber input the output signal can be degraded due to intermodal dispersion. In
a real-world fi ber, however, imper-fections such as microbends and geometric irregu-larities lead to a random exchange of power between modes, which can reduce the impact of intermodal dis-persion [1].
As an example, consider a 25 Gbps 850 nm signal under overfi lled launch (OFL) conditions transmitted over 300 m of 50 µm diameter fi ber with a parabolic index profi le and a numerical aperture of 0.2. OFL guarantees that all modes in the fi ber are equally excited at the input. Figure 1 compares the eye-diagrams at the output of the fi ber for low- and high-coupling scenarios. In both cases, differential mode attenuation due to radiative losses is modeled by dropping the highest
One of the biggest challenges an optical designer faces is to couple light on and off an integrated waveguide circuit. Grating assisted cou-plers can effi ciently couple light between optical fi bers and integrated circuits. As such structures increase in complexity, simple design rules may not be suffi cient to satisfy the design goals. For these cases, extensive optical simulations are used to design high-effi ciency couplers for use in high-density integrated optics.
The interaction of light with a device can be investigated by solving Maxwell’s Equations using a specifi c numerical method. For a grat-ing prototype, the refl ection and transmission, as well as the fi eld distribution need to be calculated. RSoft offers several simulation tools that are useful for grating assisted couplers; this article will focus on ModePROP and FullWAVE. ModePROP is an eigenmode prop-agation tool, whereas, FullWAVE is based on the Finite-Difference Time-Domain (FDTD) algorithm. Coupled with RSoft’s scanning and optimization tool MOST, these simulation engines provide a fl exible platform to model grating assisted couplers.
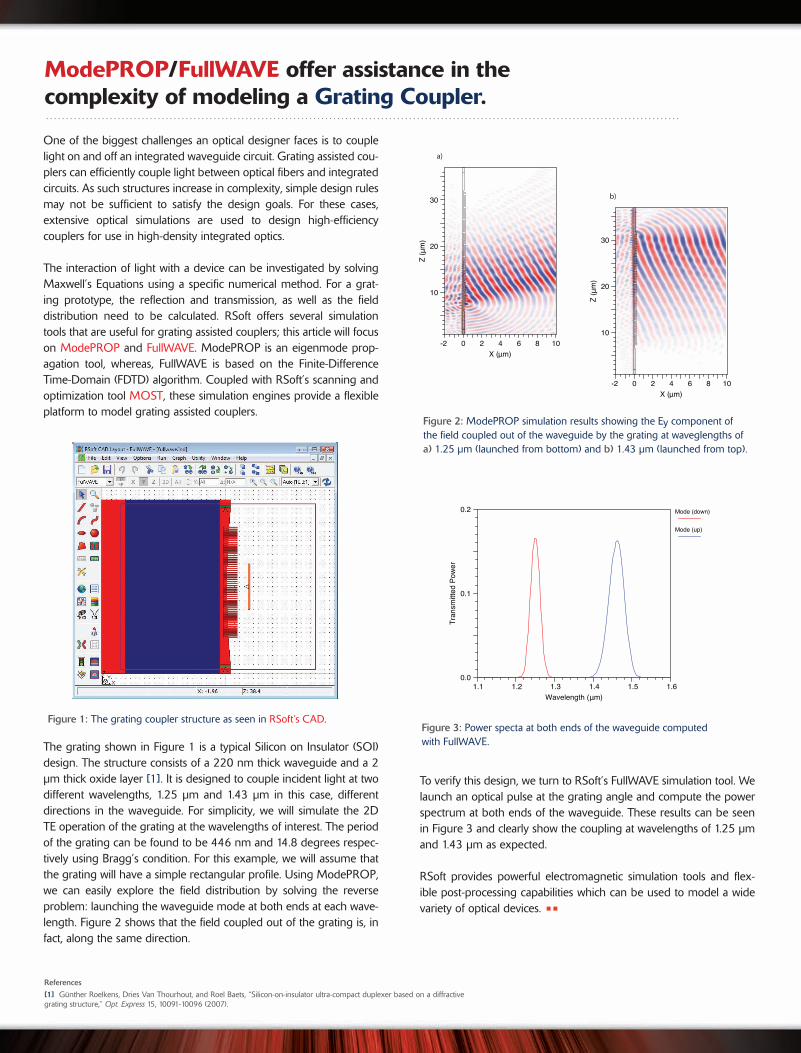
The grating shown in Figure 1 is a typical Silicon on Insulator (SOI) design. The structure consists of a 220 nm thick waveguide and a 2 µm thick oxide layer [1]. It is designed to couple incident light at two different wavelengths, 1.25 µm and 1.43 µm in this case, different directions in the waveguide. For simplicity, we will simulate the 2D TE operation of the grating at the wavelengths of interest. The period of the grating can be found to be 446 nm and 14.8 degrees respec-tively using Bragg’s condition. For this example, we will assume that the grating will have a simple rectangular profi le. Using ModePROP, we can easily explore the fi eld distribution by solving the reverse problem: launching the waveguide mode at both ends at each wave-length. Figure 2 shows that the fi eld coupled out of the grating is, in fact, along the same direction.
To verify this design, we turn to RSoft’s FullWAVE simulation tool. We launch an optical pulse at the grating angle and compute the power spectrum at both ends of the waveguide. These results can be seen in Figure 3 and clearly show the coupling at wavelengths of 1.25 µm and 1.43 µm as expected.
RSoft provides powerful electromagnetic simulation tools and fl ex-ible post-processing capabilities which can be used to model a wide variety of optical devices.
simulation tool, such as OptSim™. With ever-increasing demands for bandwidth, advanced modulation schemes and the means to assess them, are becoming ever more prevalent.
accumulated PMD along each channel’s route in order to compare it against this threshold.
As an example of the engineering considerations for a ROADM network, consider the optical mesh network shown in Figure 1. The network is comprised of eight nodes and eight links. All nodes are placed with ROADMS. At node c and d, the ROADMs are of degree three, while all other nodes contain degree-two ROADMS. The span distances in km are also shown in Figure 1. From the operational point of view, once this network is set up, the network operator should be able to provision a channel and its route between any two nodes. In the network life span, this wavelength provisioning is dynamic.
Figure 1: The grating coupler structure as seen in RSoft’s CAD.
Figure 2: ModePROP simulation results showing the Ey component of the fi eld coupled out of the waveguide by the grating at waveglengths of a) 1.25 µm (launched from bottom) and b) 1.43 µm (launched from top).
Figure 3: Power specta at both ends of the waveguide computed with FullWAVE.
References
[1] D. Marcuse, Theory of Dielectric Optical Waveguides. New York: Academic Press, 1974.
[2] K. Balemarthy, A. Polley, and S. E. Ralph, “Electronic equalization of multikilometer 10-Gb/s multimode fi ber links: Mode-coupling effects”, Journal of Lightwave Technology, vol. 24, no. 12, pp. 4885-4894, December 2006.
[3] G. Yabre, “Comprehensive theory of dispersion in graded-index optical fi bers,” Journal of Lightwave Technology, vol. 18, no. 2, pp. 166-177, February 2000.
[4] A. Polley and S. E. Ralph, “Mode coupling in plastic optical fi ber enables 40-Gb/s performance,” IEEE Photonics Technology Letters, vol. 19, no. 16, pp. 1254-1256, August 15, 2007.
[5] K. Ohdoko, T. Ishigure, and Y. Koike, “Propagating mode analysis and design of waveguide parameters of GI POF for very short-reach network use,” IEEE Photonics Technology Letters, vol. 17, no. 1, pp. 79-81, January 2005.
References
[1] D. Hoffman, et. al., IEEE JLT, Vol. 7, No. 5, May 1989, pp. 794-98.[2] Lars Zimmermann, et. al., IEEE PTL, Vol. 21, No. 3, Feb 1, 2009, pp. 143-5.
References
[1] Günther Roelkens, Dries Van Thourhout, and Roel Baets, “Silicon-on-insulator ultra-compact duplexer based on a diffractive grating structure,” Opt. Express 15, 10091-10096 (2007).
ModePROP/FullWAVE offer assistance in the complexity of modeling a Grating Coupler.
Impact of Mode Coupling on Multimode System Performance.90-degree Hybrid Device Design forCoherent Optical Communication Systems.
Design of Multi-Span ROADM Networks ConsideringNonlinear Effects and Polarization Mode Dispersion.
Figure 1: Comparison of the eye diagrams for a 25 Gbps signal launched down a 50 µm multimode fi ber with (a) low and (b) high mode coupling.
Figure 1: A multi-degree ROADM network.
Figure 2: 50 µm parabolic multimode fi ber frequency response under OFL for different magnitudes of mode coupling.
Figure 3: 50 µm parabolic multimode fi ber frequency response under RML for different magnitudes of mode coupling.
continued from front page
continued on back page
Figure 2: Simulated optical 90° Hybrid implemented with a 4x4 MMI on SOI. Only input ports 1 and 3 are used. The output phase differences between the signal (S) and the reference oscillator (R) are near their ideal values.
S ΦS1 ΦR1
ΦS1 - ΦR1 = -46 (0 )ΦS2 - ΦR2 = -127 (-81 )ΦS3 - ΦR3 = 45 (91 )ΦS4 - ΦR4 = 133 (179 )
phase(S) - simulated Relativephase(R) : (degrees): to port 1:
ΦR2
ΦR3
ΦR4
ΦS2
ΦS3
ΦS4
R
f
c
b
a
g
hd
eROADM- Degree 3
ROADM- Degree 3
[ ADM+AMP ]
[ ADM+AMP ]
[ ADM+AMP ]
[ ADM+AMP ]
[ ADM+AMP ]
[ ADM+AMP ]
[ ADM+AMP ]
[ ADM+AMP ]
43.00
73.00
26.00
53.00
34.00
72.00
61.00
37.00
67.00
X (μm)2- 0 2 4 6 8 10
Z (μm)
10
20
30
X (μm)2- 0 2 4 6 8 10
Z (μm)
10
20
30
a) b)
X (μm)2- 0 2 4 6 8 10
Z (μm)
10
20
30
X (μm)2- 0 2 4 6 8 10
Z (μm)
10
20
30
a) b)
Wavelength (μm)1.1 1.2 1.3 1.4 1.5 1.6
Tran
smitt
ed P
ower
0.0
0.1
0.2 Mode (down)
Mode (up)
evaluated through the use of a device level simulation tool, such as Rsoft Design Group’s BeamPROP™. System performance may then be determined by porting the device simulation results into a system
Today, Reconfi gurable Optical Add/Drop Multiplexer (ROADM) technology is widely adopted by service providers because of its network deployment fl exibility and the operational advantage of reconfi gurable light paths. ROADM deployment provides an oppor-tunity for faster connection setup for wavelength-based services. It also allows a simplifi ed network design and lower operating costs. To make the ROADM network work effi ciently and provide seamless end-to-end light path provisioning, the network planner needs to ensure that the underlying network is suitably engineered, taking into account optical channel powers, dispersion due to the fi ber, fi ber nonlinear effects and Polarization Mode Dispersion (PMD). RSoft Design Group’s popular network planning tool MetroWAND™ has a suite of features that enable network planners to quickly design a complex ROADM network, with support for network capacity design, optical nodeand link engineering, and optical network performance simulation.
Two of the major impairments to consider when designing a ROADM network are fi ber nonlinearity and PMD. In optical core networks, higher channel-density systems are used, with 100 and 50 GHz sys-tems now common. These Dense Wavelength Division Multiplexing (DWDM) systems are deployed on a variety of fi bers, some of which were laid in the ground a decade ago. As part of the network per-formance simulation, MetroWAND takes into account the impact of fi ber nonlinearity in these systems by utilizing a computationally effi cient perturbation approach [1]-[3] to estimate the nonlinear pow-er introduced along a route and its impact on the channel BER and Q. Another important consideration is the effect of PMD on chan-nel performance. In particular, the accumulated PMD introduced by fi bers and Dispersion Compensation Modules (DCMs) should be kept below some maximum value. MetroWAND calculates the
mode group [2]. As can be seen, the low-coupling case exhibits pro-nounced distortion of the eye diagram, while the high-coupling case does not, albeit at the penalty of higher losses due to coupling to the highest-order mode group.
We can extend this analysis by comparing the fi ber frequency responses under OFL conditions for different magnitudes of the mode-coupling coeffi cient. We have used ModeSYS to calculate these responses by launching a 50 ps pulse down the fi ber and analyzing the results in the
frequency domain. Figure 2 compares the responses for a range of mode-coupling coeffi cients. As expect-ed, as the coupling increases, the bandwidth of the fi ber improves [3], with values approaching 40 GHz for fi bers with very large coupling, consistent with results presented in [4] for plastic optical fi ber.
In contrast to the OFL condition, if only a limited number of modes are excited at the fi ber input, then mode coupling can actually result in a deterioration of system performance. Consider the case of a signal with a 4 µm Gaussian mode profi le center-launched down our 50 µm fi ber. In this case, we have a restricted mode launch (RML) in which the majority
of the power is coupled into the lowest-order fi ber mode. In a fi ber with low coupling, the signal would propagate with a delay dominated by
this lowest mode, resulting in a signifi cant reduction in intermodal dis-persion and a correspondingly favorable bandwidth [5]. Furthermore, we would expect larger mode coupling to degrade the signal. Figure 3 compares the frequency responses in this scenario for different mode coupling coeffi cients. As expected, while for smaller coupling values the fi ber response is nearly fl at (due to the neglect of intramodal dispersion in the simulations), as we increase the coupling the fi ber bandwidth is progressively reduced.
As can be seen, the inclusion of mode-coupling effects in ModeSYS’s multimode fi ber model allows for a more comprehensive simu-lation of multimode systems. Please contact RSoft Design Group ([email protected]) for additional details.
As the leading software tool for simulating multimode optical systems, ModeSYS™, the multimode component of RSoft’s award-winning optical system simulation package OptSim™, includes a state-of-the-art model for multimode fi ber which allows the user to account for intermodal dispersion, differential mode attenuation, and now mode coupling. This latter effect can play a critical role in determining the performance of a multimode system under different modulation and launch conditions.
In ideal multimode fi ber, modes remain independent of each other as they propagate. Because each mode travels with a different group velocity, when a large number of modes are excited at the fi ber input the output signal can be degraded due to intermodal dispersion. In
a real-world fi ber, however, imper-fections such as microbends and geometric irregu-larities lead to a random exchange of power between modes, which can reduce the impact of intermodal dis-persion [1].
As an example, consider a 25 Gbps 850 nm signal under overfi lled launch (OFL) conditions transmitted over 300 m of 50 µm diameter fi ber with a parabolic index profi le and a numerical aperture of 0.2. OFL guarantees that all modes in the fi ber are equally excited at the input. Figure 1 compares the eye-diagrams at the output of the fi ber for low- and high-coupling scenarios. In both cases, differential mode attenuation due to radiative losses is modeled by dropping the highest
One of the biggest challenges an optical designer faces is to couple light on and off an integrated waveguide circuit. Grating assisted cou-plers can effi ciently couple light between optical fi bers and integrated circuits. As such structures increase in complexity, simple design rules may not be suffi cient to satisfy the design goals. For these cases, extensive optical simulations are used to design high-effi ciency couplers for use in high-density integrated optics.
The interaction of light with a device can be investigated by solving Maxwell’s Equations using a specifi c numerical method. For a grat-ing prototype, the refl ection and transmission, as well as the fi eld distribution need to be calculated. RSoft offers several simulation tools that are useful for grating assisted couplers; this article will focus on ModePROP and FullWAVE. ModePROP is an eigenmode prop-agation tool, whereas, FullWAVE is based on the Finite-Difference Time-Domain (FDTD) algorithm. Coupled with RSoft’s scanning and optimization tool MOST, these simulation engines provide a fl exible platform to model grating assisted couplers.
The grating shown in Figure 1 is a typical Silicon on Insulator (SOI) design. The structure consists of a 220 nm thick waveguide and a 2 µm thick oxide layer [1]. It is designed to couple incident light at two different wavelengths, 1.25 µm and 1.43 µm in this case, different directions in the waveguide. For simplicity, we will simulate the 2D TE operation of the grating at the wavelengths of interest. The period of the grating can be found to be 446 nm and 14.8 degrees respec-tively using Bragg’s condition. For this example, we will assume that the grating will have a simple rectangular profi le. Using ModePROP, we can easily explore the fi eld distribution by solving the reverse problem: launching the waveguide mode at both ends at each wave-length. Figure 2 shows that the fi eld coupled out of the grating is, in fact, along the same direction.
To verify this design, we turn to RSoft’s FullWAVE simulation tool. We launch an optical pulse at the grating angle and compute the power spectrum at both ends of the waveguide. These results can be seen in Figure 3 and clearly show the coupling at wavelengths of 1.25 µm and 1.43 µm as expected.
RSoft provides powerful electromagnetic simulation tools and fl ex-ible post-processing capabilities which can be used to model a wide variety of optical devices.
simulation tool, such as OptSim™. With ever-increasing demands for bandwidth, advanced modulation schemes and the means to assess them, are becoming ever more prevalent.
accumulated PMD along each channel’s route in order to compare it against this threshold.
As an example of the engineering considerations for a ROADM network, consider the optical mesh network shown in Figure 1. The network is comprised of eight nodes and eight links. All nodes are placed with ROADMS. At node c and d, the ROADMs are of degree three, while all other nodes contain degree-two ROADMS. The span distances in km are also shown in Figure 1. From the operational point of view, once this network is set up, the network operator should be able to provision a channel and its route between any two nodes. In the network life span, this wavelength provisioning is dynamic.
Figure 1: The grating coupler structure as seen in RSoft’s CAD.
Figure 2: ModePROP simulation results showing the Ey component of the fi eld coupled out of the waveguide by the grating at waveglengths of a) 1.25 µm (launched from bottom) and b) 1.43 µm (launched from top).
Figure 3: Power specta at both ends of the waveguide computed with FullWAVE.
References
[1] D. Marcuse, Theory of Dielectric Optical Waveguides. New York: Academic Press, 1974.
[2] K. Balemarthy, A. Polley, and S. E. Ralph, “Electronic equalization of multikilometer 10-Gb/s multimode fi ber links: Mode-coupling effects”, Journal of Lightwave Technology, vol. 24, no. 12, pp. 4885-4894, December 2006.
[3] G. Yabre, “Comprehensive theory of dispersion in graded-index optical fi bers,” Journal of Lightwave Technology, vol. 18, no. 2, pp. 166-177, February 2000.
[4] A. Polley and S. E. Ralph, “Mode coupling in plastic optical fi ber enables 40-Gb/s performance,” IEEE Photonics Technology Letters, vol. 19, no. 16, pp. 1254-1256, August 15, 2007.
[5] K. Ohdoko, T. Ishigure, and Y. Koike, “Propagating mode analysis and design of waveguide parameters of GI POF for very short-reach network use,” IEEE Photonics Technology Letters, vol. 17, no. 1, pp. 79-81, January 2005.
References
[1] D. Hoffman, et. al., IEEE JLT, Vol. 7, No. 5, May 1989, pp. 794-98.[2] Lars Zimmermann, et. al., IEEE PTL, Vol. 21, No. 3, Feb 1, 2009, pp. 143-5.
References
[1] Günther Roelkens, Dries Van Thourhout, and Roel Baets, “Silicon-on-insulator ultra-compact duplexer based on a diffractive grating structure,” Opt. Express 15, 10091-10096 (2007).
ModePROP/FullWAVE offer assistance in the complexity of modeling a Grating Coupler.
Impact of Mode Coupling on Multimode System Performance.90-degree Hybrid Device Design forCoherent Optical Communication Systems.
Design of Multi-Span ROADM Networks ConsideringNonlinear Effects and Polarization Mode Dispersion.
Figure 1: Comparison of the eye diagrams for a 25 Gbps signal launched down a 50 µm multimode fi ber with (a) low and (b) high mode coupling.
Figure 1: A multi-degree ROADM network.
Figure 2: 50 µm parabolic multimode fi ber frequency response under OFL for different magnitudes of mode coupling.
Figure 3: 50 µm parabolic multimode fi ber frequency response under RML for different magnitudes of mode coupling.
continued from front page
continued on back page
Figure 2: Simulated optical 90° Hybrid implemented with a 4x4 MMI on SOI. Only input ports 1 and 3 are used. The output phase differences between the signal (S) and the reference oscillator (R) are near their ideal values.
S ΦS1 ΦR1
ΦS1 - ΦR1 = -46 (0 )ΦS2 - ΦR2 = -127 (-81 )ΦS3 - ΦR3 = 45 (91 )ΦS4 - ΦR4 = 133 (179 )
phase(S) - simulated Relativephase(R) : (degrees): to port 1:
ΦR2
ΦR3
ΦR4
ΦS2
ΦS3
ΦS4
R
f
c
b
a
g
hd
eROADM- Degree 3
ROADM- Degree 3
[ ADM+AMP ]
[ ADM+AMP ]
[ ADM+AMP ]
[ ADM+AMP ]
[ ADM+AMP ]
[ ADM+AMP ]
[ ADM+AMP ]
[ ADM+AMP ]
43.00
73.00
26.00
53.00
34.00
72.00
61.00
37.00
67.00
X (μm)2- 0 2 4 6 8 10
Z (μm)
10
20
30
X (μm)2- 0 2 4 6 8 10
Z (μm)
10
20
30
a) b)
X (μm)2- 0 2 4 6 8 10
Z (μm)
10
20
30
X (μm)2- 0 2 4 6 8 10
Z (μm)
10
20
30
a) b)
Wavelength (μm)1.1 1.2 1.3 1.4 1.5 1.6
Tran
smitt
ed P
ower
0.0
0.1
0.2 Mode (down)
Mode (up)

RSoft Design UK, Ltd.11 Swinborne DriveSpringwood Industrial EstateBraintree, Essex CM7 2YP
PHONE: +44 (0)1376 528556E-MAIL: [email protected]: www.rsoftdesign.co.uk
UNITED STATES Corporate headquarters
JAPAN EUROPE
90-degree Hybrid Device Design forCoherent Optical Communication Systems.
4 µm thick on the ridge and 2 µm thick off the ridge. Only input waveguide ports 1 and 3 are used, yielding relative phase differ-ences between signal (S) and oscillator (R) of; -45°, -135°, 45°, and 135° at output ports 1, 2, 3, and 4, respectively. Simulations were performed at 1.55 µm using BPM (Beam Propagation Method) and resulting phase differences at each port, shown in Figure 2 (inside cover), are nearly ideal.
Rigorous simulation of these devices is important in order to assess the performance criteria necessary to maintain low system BER. For example, changes in phase difference, excess loss, or imbalance, as functions of wavelength, may prevent the device from meet-ing design specifi cations over the band [2]. These criteria may be
JANUARY - JUNE 2011VOLUME 10 NUMBER 1
When an optical signal travels through fi ber it experience chromatic dispersion, and system performance will be affected if the total accumulated dispersion of the sig-nal is greater than the allowable dispersion limit. Planners need to place DCMs at dif-ferent locations in the network in order to nullify the effect of chromatic dispersion. Consider three wavelengths with paths 1) b-c-f, 2) b-c-d, and 3) a-b-c-f-g. These light paths are independent of each other. Therefore, determining how to compensate for chromatic dispersion for each wavelength and providing a single compensation modulein each node is diffi cult. There is also a need to provide suitable compensation for future wavelengths, which are not known at the time of deployment. Network planners utilize different engineering techniques to tackle this issue. In MetroWAND, dispersion compensation is managed by simulating the dispersion effect for a given span and providing a compensation module at the start/end node. The simulation of all the wavelengths used in the network identifi es the maximum positive dispersion and maximum negative disper-sion for a span. The tool then places a DCM within the tolerance limit of the transponder.
Power mapping of the wavelengths is another important engineering issue. When a signal travels from source to destination it experiences attenuation due to fi ber and other optical components. Amplifi ers can be placed in nodes to boost the signal. However, the wavelengths reaching one node from different destinations can have different power levels, so the planner needs to provide adequate variable attenuators along with amplifi ers. MetroWAND simulates the wavelength routes along with the signal power, choosing the
right amplifi er and attenuators for each node. Figure 2 shows the power mapping for three different wavelengths.
As can be seen, when a network planner needs to design a very large optical mesh network that accounts for all of the engineering issues, the job can become very complex. A planning tool like MetroWAND can help the planner perform a general validation of the planned op-tical network, and provide a good analysis of power and dispersion maps, nonlinear effects and PMD. Please contact RSoft Design Group ([email protected]) for additional details.
RSoft: Please give us a brief history of your education and work experience.After getting a MS (1987) and a PhD (1990) in radiophysics from the Moscow Physics and Technology Institute (MPTI), I worked as a Research Fellow at the Prokhorov General Physics Institute (GPI) of Russian Academy of Sciences (RAS). In 1992-3 I spent a couple of years as a Staff Associate in Columbia University (New York, USA), and subsequently worked at the Institutes of Applied/Experimental Physics at the Johannes Kepler University (JKU Linz, Austria) as Visiting Professor and Research Scientist. In 2004-2010 I made several research visits to Computer Science and Mathematics Division of the Oak Ridge National Laboratory (ORNL) in Tennessee, USA. My memberships include Material Research Society and New York Academy of Sciences.
RSoft: Please tell us about the Applied Physics Institute and JKU Linz.
Dr. Arnold: JKU is a mid-size state university in a dynamic region of Upper Austria. Department of Natural Sciences includes several Physics Institutes with joint emphasis on nanoscience (photonics and semiconductors), material science and biophysics. They collaborate and share experimental and computational facilities. External funding comes from the Austrian Science Fund (FWF), EU grants, as well as industrial collaboration with global and local companies.
RSoft: Can you tell us about your current research?
Dr. Arnold: We study laser-assisted nano-structuring of materials using self-assembling arrays of colloidal microspheres. This requiresunderstanding of light focusing by such microspheres and their arrays. For laser-induced forward transfer (LIFT) they are covered with silicon and metals, which raises the question about the role of surface plasmons. Optical properties of such hybrid 2D photonic crystals are also studied. Currently we are moving into active nano-plasmonics, which uses media with optical gain to compensate losses in metals and improve quality factors of plasmonic nano-devices. This increases spatial localization and fi eld enhancement, which paves the way for substantially improved nano-sensors, frequency converters, and sub-wavelength lasing.
RSoft: What kinds of challenges do you face in your research?
Dr. Arnold: Non-conventional curvilinear, inherently 3D geometries; combination of dispersive lossy metals with saturating lasing media (both are notoriously prone to numerical instabilities), metamaterials; numerical verifi cation of analytical results obtained for large structures; instruc-tive visualization of results. In nano-photonics and metamaterials many proofs of principle, such as negative index at optical frequencies, perfect lens, cloaking devices, plasmonic nano-lasers, plasmon-assisted SERS, have already been demonstrated. The transformation of these ideas into real applications requires combined modeling that includes thermal, non-linear optics, and lasing effects with realistic material properties.
RSoft: How has RSoft’s Software assisted in this effort?
Dr. Arnold: It allowed to model and visualize unusual geometries, for example the infl uence of capillary condensation between the silica microspheres and the substrate, which leads to defocusing of light under the particles or coupling of light into the propagating modes of photonic slab formed by the hexagonal lattice of Si coated silica microspheres. Over the last years RSoft improved the treatment of dispersive absorbing and amplifying media, included metamaterials and provided multi-physics tools. Ability to treat anisotropy and non-linear optics is also of importance for us.
RSoft: Why did you decide to work with RSoft for design and simulation software?
Dr. Arnold: RSoft runs on 64 bit Linux machines, which fi ts well to our confi guration (SGI Altix 4700). We mainly perform 3D Finite-Difference -Time-Domain(FDTD) calculations, which require large memory and, when possible, parallelization, which is handled well in latest releases. Advantageous is also the modular structure of RSoft under the common CAD interface. In our case FullWAVE™, BandSOLVE™, as well as MOST™ utility were often used on the same structure to discern different aspects of the underlying physics.
RSoft: How do you see the need and demand for photonic modeling software in the next generation applications?
Dr. Arnold: The trend goes into the direction of multiphysics simulations. Not only the variety of built-in models, but also the convenience of incorporating one’s own physical processes/equations will be expected. Therefore, such modules as Multi-Physics Utility™, FemSIM™ and LaserMOD™ and their integration into the common framework will play increasing role. Modeling of biological applications, such as plasmonic sensing, SERS, micro- and tiling arrays, lab on a chip microfl uidics will grow in importance. With increasing computing power and memory, the ease of usage, visualization and parallelization will move to the forefront in the choice of simulation software.
RSoft: Thank you. We wish you the best of luck in your research.
with Dr. Nikita Arnold of Johannes Kepler University
RSoft Design Group, Inc.400 Executive Boulevard,Suite. 100Ossining, NY 10562, USA
PHONE: 1.914.923.2164E-MAIL: [email protected]: www.rsoftdesign.com
RSoft Design Group Japan KKMatsura Building 2F,1-9-6 Shiba Minato-ku,Tokyo, 105-0014 Japan
PHONE: +81.3.5484.6670E-MAIL: [email protected]: www.rsoftdesign.co.jp
William dos Santos Fegadolli provides insight into the Instituto Techologico de Aeronautica.
Ph. D Students; Olympio Lucchini Coutinho & William dos Santos Fegadolli
In 2006, I received my B.S. degree in Telecommuni-cation Engineering from Universidade Católica Sale-siana. I then received my M.S. degree in Electronic Engineering from Instituto Tecnológico de Aeronáu-tica (ITA), where I have currently been working toward receiving my Ph.D. During my Ph.D. pro-gram, I have been working under the supervision of Dr. Vilson Rosa de Almeida and Dr. José Edimar Barbosa Oliveira. Recently I have been researching at the Electronic Warfare Laboratory of ITA, and at Instituto de Estudos Avançados- IEAv as a collabora-tor researcher.
Located in São José dos Campos, SP, Brazil, ITA is one of the most respected schools of engineering in South America. Since its creation, ITA has been rec-ognized as a successful organization due to its impor-tant realizations, establishing the Brazilian aeronautic and defense industry, particularly EMBRAER, along with participating in information technology and automobilistic/electronic industry. ITA is also largely involved in the Brazilian telecommunication system.
RSoft’s tools such as FullWAVE, BeamPROP, and other important integration tools play an important role in the simulation and are essential in this fi eld of research. I decided to work with RSoft under great infl uence from my advisor, Dr. Vilson Rosa de Almeida, who used RSoft during his Ph.D. program at Cornell University, realizing several publications with good agreement between numerical and experimental results.
Coherent modulation schemes have become of great interest in recent years due to their ability to compact parallel data streams into a single polarization-wavelength channel. Additional advantages include; detection of quadrature and polarization modulated formats, linear impairment correction, ability to receive OFDM, near ideal fi ltering, increased reach and receiver sensitivity, and no need forlocking of the LO (local oscillator) between receiver and transmitter.
While a variety of formats have been explored, QPSK (quadra-ture phase shift keying) and QAM (quadrature amplitude modulation) have found wide acceptance in polarization mul-tiplexed systems. Both modula-tion and demodulation of data in these formats may be performed effi ciently using optical compo-nents combined with electronic DSP (digital signal processing).
An example of coherent detection that uses an optical 90° hybrid is shown in the fi gures. These devices apply a different phase change between signal and reference at each output port. The local reference insures that these phase changes will be fi xed only at the carrier wavelength (i.e. frequency locking/channel selection). Furthermore, since the phase difference between pairs of ports (1&4, 2&3) is always 180°, balance detection is used to eliminate the DC component. One balanced pair detects the imaginary part of the signal (Q) while the other detects the real part (I). The result is subjected to an electronic DSP stage which can apply a variety of de-modulation algorithms, such as Constant Modulus Algorithm(CMA) plus Viterbi-Viterbi, or training-sequence based methods. This is shown schematically in Figure 1 [1].
90° hybrids can be implemented monolithically via AWG’s (arrayed waveguide gratings) with chirped waveguides, MMI’s (multimode interference) device, or cascaded MZI (Mach-Zehnder Interferom-eter) blocks. The present example uses a 4x4 MMI having param-eters commensurate with silicon on insulator (SOI). The body of the device is 2400 µm long and uses 4 µm wide waveguides that are
Interview
continued on next page
Dr. Nikita Arnold
Design of Multi-Span ROADM Networks Considering Nonlinear Effects and Polarization Mode Dispersion.
continued from second page
DSP
PD’s
lm (Q)
Re (I)
lm
Re
Result at output of Hybrid
The Hybrid applies the relative phase changes of -45˚, -135˚, 45˚, and 135˚ at ports 1, 2, 3, and 4, respectively.
QPSK (or 4-QAM)modulated signal(per polarization)
Referenceoscillator
R
S
SignalOut
Balance Detection
I
Q
S+R
90˚ Hybrid
11
3
2
3
4 S-R
S-jR
S+jR(electronic)
(optical)
>
>
Figure 1: Scheme for coherent detection of QPSK or 4-QAM signal using an optical 90° Hybrid and electronic DSP. Note that constellation may be rotated by an additional constant phase.
References
[1] E. E. Narimanov and P. Mitra, “The channel capacity of a fi ber optics communication system: Perturbation theory,” Journal of Lightwave Technology, vol. 20, no. 3, pp. 530-537, March 2002.
[2] H. Louchet, A. Hodžić, and K. Petermann, “Analytical model for the performance evaluation of DWDM transmission systems,” IEEE Photonics Technology Letters, vol. 15, no. 9, pp. 1219-1221, September 2003.
[3] H. Louchet, A. Hodžić, K. Petermann, and A. Robinson, “Analytical model for the design of multispan DWDM transmission systems,” IEEE Photonics Technology Letters, vol. 17, no. 1, pp. 247-249, January 2005.
Figure 2: Power mapping for three different wavelengths in MetroWAND.