Embed Size (px)
Citation preview
Interventions that influence active transportation to and from school among school-aged children
Laura Stasiuk, Public Health Nutritionist Michael Dubinski, Supervisor Linda Pope, Manager Michelle Paterson, Supervisor Chronic Disease and Injury Prevention Region of Peel Public Health
2013

i
Acknowledgements Special thanks to the following members of the Region of Peel Active Living team for their contribution to this report: Shaesta Mitha, Health Promoter; Melanie Vafaie, Health Promoter and Heather Dennis, Public Health Nurse.

ii
Table of Contents
Key Messages.................................................................................................................................. 1
Executive Summary ....................................................................................................................... 2
1 Issue........................................................................................................................................ 5
2 Context.................................................................................................................................... 6
3 Conceptual Model .................................................................................................................. 8
4 Literature Review Question, Literature Search and Relevance Assessment ....................... 8
5 Results of the Search and Critical Appraisal........................................................................ 9
6 Description of Included Studies .......................................................................................... 10
7 Synthesis of Findings........................................................................................................... 14
8 Study Limitations ................................................................................................................. 23
9 Applicability and Transferability......................................................................................... 24
10 Recommendations ............................................................................................................ 26
References .................................................................................................................................... 28
Appendices.................................................................................................................................... 29
Appendix A: Conceptual Model .................................................................................................. 30
Appendix B: Search Strategy....................................................................................................... 31
Appendix C: Literature Search Flowchart ................................................................................. 32
Appendix D: Data Extraction Tables .......................................................................................... 33
Appendix E: Applicability & Transferability Worksheet............................................................ 58

1
Key Messages
1. The evidence from two systematic reviews and one guideline identifies:
• four effective active transportation to school interventions: walking school
bus, safe routes to school, cycling programs and walk to school day
• three interventions with unclear findings: walk to school week, school
travel advisors and classroom programs.
2. To date, active transportation to school research has been designed in different
ways, which requires that the evidence be carefully considered when making
decisions about active transportation to school programming.

2
Executive Summary Issue and Context
Physical inactivity continues to be a problem for children and youth in the Region of
Peel. Active transportation (AT) is one type of physical activity that can be incorporated
into one’s daily activities and if done regularly, can have an impact on one’s overall level
of physical activity and ultimately one’s overall health. About one-third of children and
youth in Peel walk to school yet more than two-thirds live within two kilometers of their
school making them good candidates for AT to school.
In response to low rates of participation among school-aged children and youth in AT to
school, Peel has prioritized AT, created a corresponding plan and started to implement
active-transportation-related programming. In order to support the development and
implementation of AT interventions a rapid review of the evidence was conducted to
determine which interventions influence school-aged children to participate in AT to
school. The findings from this review will be used to improve upon current efforts to
increase AT to and from school among school-aged children within Peel Region.
Research Question
The purpose of this review was to determine which interventions positively or negatively
influence AT to and from school among school-aged children.
3
Search Strategy
Peer-reviewed and grey literature was searched to obtain relevant literature for inclusion
in this review. Key informants were also consulted to identify relevant literature. One
guideline and four systematic reviews met the relevance criteria. Two of the systematic
reviews received a weak rating and were excluded. The two remaining systematic
reviews and the guideline were included in the rapid review. The guideline and one
systematic review received strong ratings and the other systematic review received a
moderate rating. The guideline was based on a number of supporting documents, one
of which was a literature review that was relevant to the research question.
Synthesis of Findings
The evidence from the two systematic reviews and one literature review that informed
the guideline identifies four effective AT interventions: walking school bus, safe routes to
school, cycling programs and walk to school day. Three interventions had unclear
findings due to conflicting or missing results: walk to school week, school travel advisors
and classroom programs.
The guideline also outlines specific recommendations schools can implement in order to
increase participation in AT to school among school-aged children.
There are important limitations in relation to the application of these findings in terms of
the quality and the differences in how the primary studies were conducted.

4
Conclusions and Recommendations
Based on the rapid review findings, Peel Public Health should take the following actions:
1. Develop interventions shown to be effective in increasing AT to school among
school-aged children:
º walking school bus, safe routes to school, cycling programs and walk to school
days
2. Develop the interventions guided by the NICE guideline recommendations:
º Foster a culture that supports physically active travel for journeys to school and
during the school day
º Develop and implement school travel plans with community partners and involve
students
º Map safe routes to school in consultation with the community
º Develop programs to ensure the local environment around schools and nearby
catchment areas provide opportunities for all children to cycle or walk
º Introduce regular 'walking buses' and other activities, such as 'walk once a week'
projects, which support and encourage AT to school
3. Monitor and evaluate current and future Region of Peel AT interventions for
effectiveness.

5
1 Issue
Physical inactivity continues to be a problem for children and youth in the Region of
Peel. The Canadian Community Health Survey shows that approximately 36% of youth
aged 12 to 17 are physically inactive. 1 According to results from the 2011 Peel Student
Health Survey, cardio respiratory fitness (CRF) levels and musculoskeletal scores of
students are poor. More than 30% of males and nearly 50% of females in grade nine in
Peel fail to meet current standards of acceptable CRF levels as indicated in the survey.
Approximately 75% of all grade nine students in Peel have CRF scores that fall within a
range that is associated with health risks such as cardiovascular disease and all-cause
mortality 2.
In Peel, just 33% of children and youth walk to school3 yet 67%* live within two
kilometres of their school making them good candidates for AT initiatives such as
walking and biking to school4. More than 90% of children have access to a bicycle, yet
fewer than 5% cycle to school5.
This review examines active transportation (AT) research to determine which
interventions influence school-aged children to participate in AT to school. The findings
from this review will be used to improve upon current efforts to increase AT to school
within Peel Region.
* Percentage does not account for students who may live within walking distance but are privately bussed. Data not available.

6
2 Context Peel Public Health (PPH) has identified active transportation as a key component in
increasing physical activity and creating supportive environments to reduce childhood
obesity. AT is defined as using human power to move from place to place. Examples
include walking, cycling, in-line skating, skateboarding, non-motorized scooters and
other non-powered wheel transportation6.
PPH is committed to promoting AT as a part of the daily routine of children and families.
PPH supports AT through the Region’s Strategic Plan Goals (2011-2014), Term of
Council Priorities (2011-2014), Official Plan, and the Active Transportation Plan.
Currently, Peel Public Works collaborates with PPH to implement the Region’s Active
Transportation plan and its recommended policies, programs and infrastructure
improvements. Components of this plan include:
• developing new comprehensive policies aimed at making Peel communities more
pedestrian and bicycle friendly,
• enhancing programs to shift travel behaviour through strengthened stakeholder
partnerships, and
• improving AT infrastructure by working with area municipalities to enhance
connections of the existing and planned cycling and pedestrian networks.
The Peel School Travel Planning pilot program aims to encourage students to become
more physically active by promoting AT to and from school. The pilot program works
with selected schools to establish a school committee which gathers data on student

7
travel behaviours, assesses the built environment around the school, determines
actions to address barriers and creates an implementation plan. The process is
facilitated by the PPH Active Living team and the Peel Public Works Sustainable
Transportation team and is supported by the Peel Safe and Active Routes to School
(PSARTS) Regional Committee. Currently there are four schools in Peel participating in
the pilot and all are in the early phases of the program.
PPH also addresses low levels of physical activity among children and youth within Peel
by encouraging AT to and from school through a healthy schools framework. The
foundations for a healthy schools framework include four components: high-quality
instruction and programs, a healthy physical environment, a supportive social
environment, and community partnerships. As part of the framework, School Health
Nurses work with schools that identify physical activity as a priority. The nurse, school
staff and students work together to implement AT options such as themed walk to
school days, walking school bus and AT promotion through newsletters,
announcements and education. In 2012/2013, 65 Peel schools engaged in AT, an
increase from 26 schools in 2011/2012.
Implementing AT to school interventions is a collaborative effort that requires multiple
partners: students, teachers, school administrators, parents and caregivers, and staff
from the Public Works and Public Health departments.

8
3 Conceptual Model The conceptual model for this rapid review was developed in consultation with Region
of Peel staff who work in AT or AT-related programs. The model depicts the health
problem, the public health intervention and the overall goal. The research question fits
into the model at the intervention stage where possible interventions, their influences
and benefits are identified. Refer to Appendix A for the conceptual model.
4 Literature Review Question, Literature Search and Relevance Assessment Literature Review Question
What interventions positively or negatively influence active transportation to and from
school among school-aged children?
The PICO framework was used to develop the research question:
• Population: school-aged children
• Intervention: any intervention that positively or negatively influences active
transportation to school
• Comparison: no intervention
• Outcome: active transportation to and/or from school
Literature Search
A literature search was conducted in September and October 2012 of the following
bibliographic databases: the Cochrane Library (2005 to October 2012), Global Health
(1973 to September 2012) and MEDLINE (1946 to October 2012). The main search
9
concepts were “active travel” or “active transportation” and “school.” The Child
Development and Adolescent Studies database and Health-evidence.ca were also
searched for literature using similar words. Grey literature was identified by searching
several databases during September 2012.
Literature was restricted to publications in the English language. No date limits were
applied to the search beyond those imposed by the individual databases. Key
informants within PPH were also contacted to identify any relevant articles or sources of
information. Refer to Appendix B for the complete search strategy.
Relevance Assessment
Two reviewers independently reviewed titles and abstracts to determine eligibility for
inclusion in the review. Discrepancies were discussed and a mutually agreed decision
was made. Articles that qualified for full review were selected if they consisted of
practice guidelines, systematic reviews and/or meta-analyses and met the following
inclusion criteria: published in English, included school-aged children in the study
population and assessed the effectiveness of AT to school interventions.
5 Results of the Search and Critical Appraisal Results of the Search
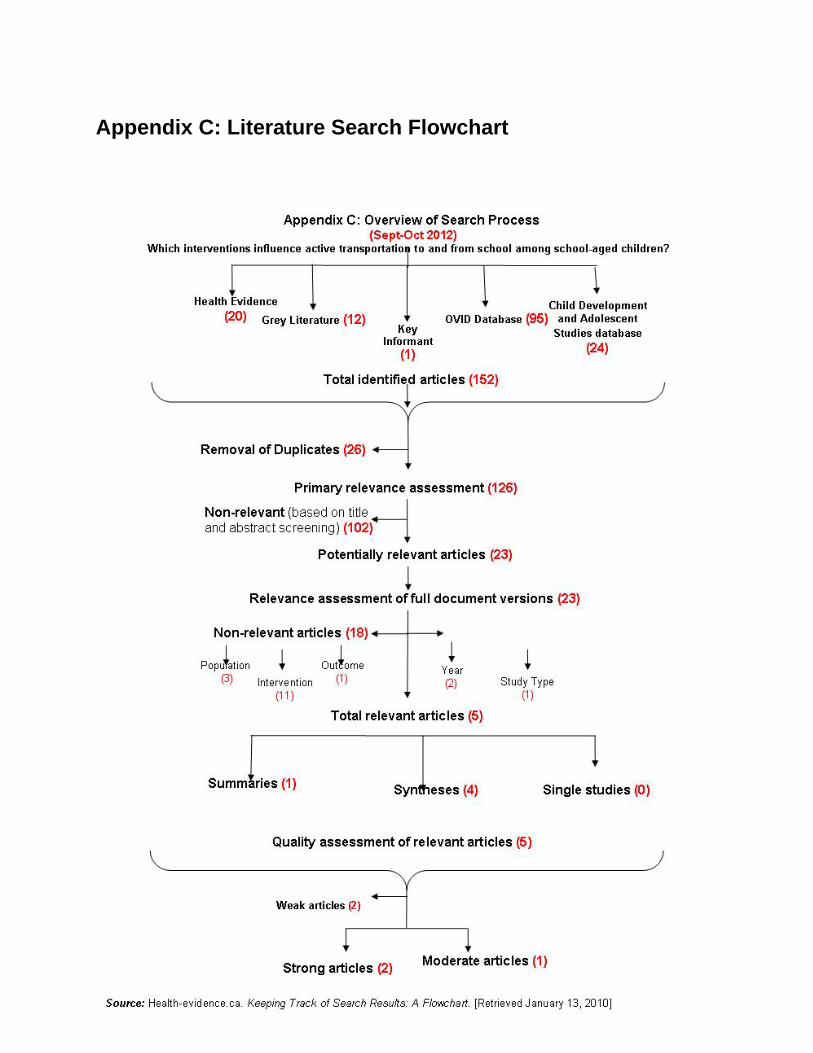
The search identified 152 potentially relevant documents; 26 were excluded as
duplicates leaving 126 for primary relevance assessment. Following primary relevance
assessment, 102 were excluded and 23 were retrieved for full text review. Following full
10
text review, five documents were deemed relevant: one guideline and four systematic
reviews. Refer to Appendix C for the literature search flowchart.
Critical Appraisal
Three reviewers independently appraised the four systematic reviews using the Health
Evidence Quality Assessment Tool and accompanying dictionary. The three reviewers
independently appraised the guideline using the Appraisal of Guidelines for Research
and Evaluation (AGREE II) Instrument. Disagreements were resolved through
discussion. Two of the systematic reviews received a weak rating and were excluded.
The two remaining systematic reviews and the guideline were included in the rapid
review. The guideline and one systematic review received strong ratings and the other
systematic review received a moderate rating.
6 Description of Included Studies
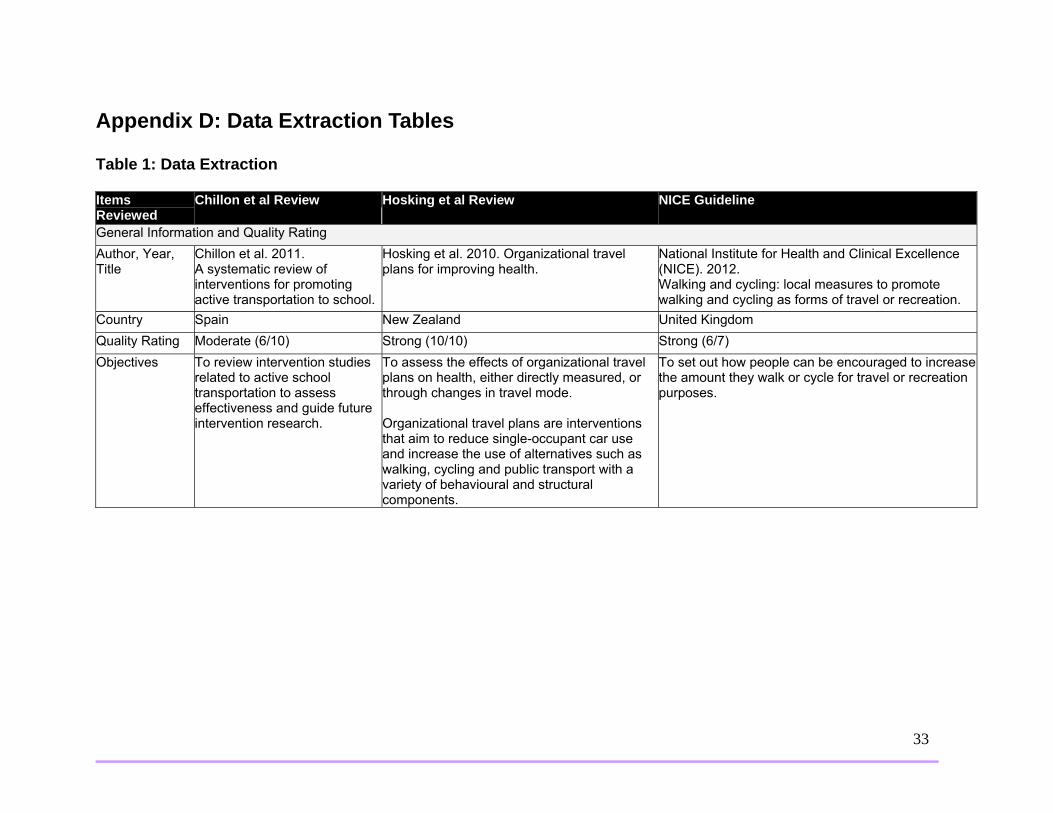
One guideline and two systematic reviews were selected for inclusion in this review:
• NICE guideline (2012) – National guidance on walking and cycling: local
measures to promote walking and cycling as forms of travel or recreation
• Chillon et al (2011) – Systematic review of interventions for promoting active
transportation to school
• Hosking et al (2010) – Systematic review of organizational travel plans for
improving health

11
The research questions, search strategies and inclusion criteria varied across the
documents resulting in an overlap of only eight of the 29 studies included in the three
documents:
• one study was included in the NICE guideline and the Hosking review
• three studies were included in both systematic reviews
• four studies were included in all three documents
Refer to Data Extraction Table 1 in the Appendix for more detailed information on the
included documents.
NICE Guideline (2012)7
This guideline aims to recommend how people can be encouraged to increase the
amount they walk or cycle for travel or recreational purposes. Ten recommendations are
grouped into three categories: policy and planning; local action; and schools,
workplaces and the National Health Service. Recommendation number eight provides
specific guidance for schools on how to encourage school-aged children to increase
their participation in AT to school. The guideline is based on economic modeling, six
expert papers authored by academic and technical experts in the field, and two
literature reviews.
One literature review focused on effectiveness and is relevant to the research question.
This review assessed the effectiveness of local interventions to promote cycling and
walking for recreational and travel purposes in the community, workplace and education
settings8. This review included 118 primary studies consisting of 14 non-randomized
control trials, 37 before-and-after studies, seven interrupted time series studies, three

12
cross-sectional studies and 20 evaluation reports. Of the included studies, 17 were
conducted in school settings and informed the school-related recommendations. The
review authors assessed quality using the NICE methodology checklist which rates
each study with the following grades: ++, +, -.. One study received a strong rating (++),
13 studies received moderate ratings (+) and three studies received weak ratings (-).
The primary study interventions in the review included: walk to school days, walk to
school weeks, walking school bus, safe routes to school, school travel advisors,
classroom programs and cycling programs. Outcome measures included rates of
walking, cycling, or both. Cycling was reported as amount of time spent cycling or
number of cyclists. Walking was reported as minutes walked, distance walked, number
of steps taken or number of walks. Changes in walking and cycling were also recorded
as a shift from one transport mode to another to encompass AT. Refer to Table 2 in the
Appendix for a detailed description of the interventions and outcome measures. For the
purpose of this rapid review, the overall practice recommendations and the results of
the effectiveness review are included.
Chillon et al (2011)9
This systematic review examined the effectiveness of interventions promoting active
transportation to school among children and adolescents, six to 18 years of age. The
review included 14 primary studies in school settings consisting of three randomized
control trials, ten quasi-experimental designs and one observational study. Three of the
14 studies received a strong quality rating by the review authors, eight received a
moderate rating and three received a weak rating.

13
The primary study interventions in the review included: walk to school days, walking
school buses, safe routes to schools programs, school travel advisors and classroom
programs. The primary outcome measure was mode and frequency of transportation to
school. The form of the outcome measure questions and the way of asking the
questions differed for each study. For example, one study recorded daily participation in
AT to school while another study asked parents to estimate how many mornings their
child/children participated in AT during a usual week. Refer to Table 2 in the Appendix
for a detailed description of the interventions and outcome measures.
Hosking et al (2010)10
The purpose of this review was to assess the effectiveness of organizational travel
plans on active travel and on health. Organizational or school travel plans were defined
as interventions that aim to reduce single-occupant car use and increase the use of
alternatives such as walking, cycling and public transport with a variety of behavioural
and structural components. The review included 17 primary studies consisting of four
randomized control trials, two cluster randomized trials and 11 controlled before and
after studies. Ten of the studies were conducted in school settings. The authors
concluded that the overall quality of the studies was low to moderate with only three
studies judged to be at low risk of bias. The populations studied included people in
organizational settings including working age adults, university students and school-
aged children.
The primary study interventions in the review included: walk to school weeks, walking
school bus, school travel advisors, and classroom programs. The outcome measure of

14
interest was change in travel mode. Change in travel mode was measured differently
across the studies however most of the studies measured the proportions of participants
using each different travel mode. The remaining studies measured distance travelled by
different modes and time spent using each mode. Refer to Table 2 in the Appendix for a
detailed description of the interventions and outcome measures.
7 Synthesis of Findings There was significant heterogeneity across the interventions included in the three
effectiveness reviews by Chillon et al, Hosking et al and the review included in the NICE
guideline. For the purposes of this synthesis, the characteristics of the interventions
were examined and grouped into the following categories: walking school bus, safe
routes to school, cycling programs, walk to school day, walk to school week, school
travel advisors, and classroom programs. However, some of the intervention
components overlapped. For example, some safe routes to school interventions also
included a walking school bus. Refer to Table A for a summary of the interventions and
Table 2 in the Appendix for a detailed description of the interventions.
Effective AT Interventions
• Walking school bus
• Safe routes to school
• Cycling programs
• Walk to school day
AT Interventions with Unclear
Findings
• Walk to school week
• School travel advisors
• Classroom programs

15
Table A: Summary of the Interventions and Results included in all three Effectiveness Reviews
Intervention Type Evidence Description of Interventions Included in the Studies* Results* Effective AT Interventions Walking School Bus (WSB)
3 reviews including 9 studies
Coordinator, promotional materials and events, pedestrian safety activities, cycle, pedestrian and volunteer training, curriculum work, school assemblies, newsletters and incentives, park away days, street lighting on routes, info packs for parents, health assessment, police involvement, health theme based discussions, wagon to transport bags and instruments, drop off locations
↑ walking from 8% to 62% (6 studies) Cohen’s d=0.216 to 2.9, small to very large effect (3 studies) ↑ cycling from 0 to 4% (1 study)
Safe Routes to School (SRS)
2 reviews including 6 studies
Travel diaries, classroom activities, weekly newsletters, police involvement. local press, school assembly, WTSD, WSB, Annual Smart Commute Day, community support, education for decision makers, mapping SRS, walk and bike to school days, frequent rider miles content, networking and presentations at state and national level, sidewalk improvements, replacement of four-way stops with traffic signals, crosswalk signal improvements
↑ walking from 3% to 70% (5 studies) Cohen’s d=-0.087 to 0.321, trivial to small effect (5 studies) ↑ cycling from 15 to 114% (2 studies)
Cycling Programs
1 review including 2 studies
Physical infrastructure and promotion or work with schools who want to increase levels of cycling
↑ cycling from 6% to 17% (2 studies)
Walk to School Day (WTSD)
2 reviews including 3 studies
Encouraged walking on 2 d/wk and walking in inclement weather, incentives provided, promotional items and activities started 3 wks prior to WTSD
↑ walking from 6 to 31% (2 studies) Cohen’s d=0.190, trivial effect (1 study) P<0.001 (1 study)
AT Interventions with Unclear Findings Walk to School Week (WTSW)
2 reviews including 2 studies
Info packs for students and parents, promotional material, prizes Conflicting results: No difference (1 study) Significance unclear (1 study)
School Travel Advisors
3 reviews including 5 studies
Developed school travel plans, expert assistance limited to 16 hrs over 1 yr
Conflicting results: No difference for walking or cycling OR=0.98 95%CI 0.61 to1.59 (1 study) Difference in walking or cycling Cohen’s d=0.209, small effect (1 study) Differences not reported (4 studies)
Classroom Programs
3 reviews including 2 studies
Classroom activities, pedometers, Travel Access Guides, newsletters, local council involvement, child and family resource pack
Conflicting results: No difference in mode of transport (1 study) ↑ walking by 10% (1 study) Cohen’s d=0.861, large effect (1 study) Result NA (1 study)
* Refer to Table 2 in the Appendix for a detailed description of the interventions and outcome measures.
16
Effective AT Interventions
Walking School Bus (WSB)
• The effectiveness reviews reported an increase in AT to school among school-aged
children as a result of the WSB interventions assessed in nine studies
• The overall recommendation in the NICE guideline suggested introducing regular
activities that support and encourage walking to school such as the ‘walking school
bus’
The walking school bus (WSB) model establishes a route or set of routes to school
where children walk together and are supervised by adults throughout the journey. Nine
studies included in the effectiveness reviews based their intervention on the WSB model
however, specific design and implementation of the WSB interventions varied across
the studies. Some studies also included curriculum coursework, pedestrian safety
activities, promotion of WSB within the school, police involvement, newsletters and
incentives in their WSB intervention. Refer to Table 2 in the Appendix for a detailed
description of the interventions.
In addition to variations in the design of the WSB interventions, the studies also differed
by how the outcomes were measured and how the results were reported. All nine
studies assessed participation in AT to school, most commonly by assessing frequency
of walking or walking and cycling to school. Results were reported as: small to very
large effects (Cohen’s d, 0.216-2.9), percentage increases in AT to school (8% to 62%),
statement of increase in moderate to vigorous physical activity during the commute time
and/or statements of increases in AT to school with no supporting data. Refer to Table 2
in the Appendix for a detailed description of the outcome measures and the results.
17
Safe Routes to School (SRS)
• The effectiveness reviews reported that AT to school among school-aged children
increased as a result of SRS interventions
• Two recommendations in the NICE guideline support SRS interventions
1. Mapping safe routes to school
2. Developing programs that ensure the local environment around schools and
nearby catchment areas provides opportunities for children to cycle or walk
Safe routes to school (SRS) interventions were included in six of the studies found in
the effectiveness reviews. SRS interventions commonly included the following
characteristics: environmental changes, mapping SRS, walk to school days, a walking
school bus, education and promotion. However, specific design and implementation of
the SRS interventions varied across the studies. Refer to Table 2 in the Appendix for a
detailed description of the interventions.
In addition to variations in the SRS interventions, the studies also differed in how the
outcomes were measured and how the results were reported. All six studies assessed
participation in AT to school, most commonly by assessing frequency of walking or
walking and cycling to school. Results were reported as: trivial to small effects (Cohen’s
d, -0.087 to 0.321), percentage increases in AT to school (3% to 114%) and/or
statements of increases in AT to school with no supporting data. Refer to Table 2 in the
Appendix for a detailed description of the outcome measures and the results.

18
Cycling Programs
• The NICE effectiveness review reported an increase in cycling to school among
school-aged children as a result of the cycling program intervention assessed in two
studies
• One recommendation in the NICE guideline suggested that all children take part in
cycle training ensuring that it is age-appropriate and timed to allow cycling to school
to become a habit
Cycling program interventions included changes to physical infrastructure, AT promotion
and other work with schools who wanted to increase levels of cycling. Two studies in
one effectiveness review included cycling program interventions however, specific
design and implementation of the cycling program interventions varied across the two
studies. Refer to Table 2 in the Appendix for a detailed description of the interventions.
In addition to variations in the cycling program interventions across the two studies in
one effectiveness review, the studies also differed by how the outcomes were measured
and how the results were reported. Both studies assessed participation in AT to school
by assessing frequency of cycling to school. Results were reported as percentage
increase in AT to school (6% to 17%). Refer to Table 2 in the Appendix for a detailed
description of the outcome measures and the results.
Walk to School Day (WTSD)
• The effectiveness reviews reported an increase in AT to school among school-aged
children as a result of the WTSD interventions assessed in three studies

19
• One recommendation in the NICE guideline suggested introducing regular activities
that support and encourage walking to school such as ‘walk once a week’ projects
Walk to school day (WTSD) interventions included encouraging walking to school on
two days per week and walking in inclement weather, or walking activities that occurred
prior to a one time or annual WTSD, and provision of incentives or promotional items.
Three studies in two effectiveness reviews included WTSD interventions however,
specific design and implementation of the WTSD program interventions varied across
the three studies. Refer to Table 2 in the Appendix for a detailed description of the
interventions.
In addition to variations in the WTSD interventions across the three studies in two
effectiveness reviews, the studies also differed by how the outcomes were measured
and how the results were reported. Three studies assessed participation in AT to
school, most commonly by assessing frequency of walking or of walking and cycling to
school. Results were reported as trivial effect (Cohen’s d, 0.190) and percentage
increase in AT to school (6% to 31%). Refer to Table 2 in the Appendix for a detailed
description of the outcome measures and the results.
AT Interventions with Unclear Findings
Walk to School Week (WTSW)
• There was no clear evidence that walk to school week interventions increased AT to
school among school-aged children
Walk to school week (WTSW) interventions included information packs, promotional
material, and prizes for participating in active travel. Two studies in two effectiveness
20
reviews included WTSW interventions however, specific design and implementation of
the WTSW program interventions varied across the two studies. Refer to Table 2 in the
Appendix for a detailed description of the interventions.
In addition to variations in the WTSW interventions across the two studies in two
effectiveness reviews, the studies also differed by how the outcomes were measured
and how the results were reported. Two studies assessed participation in AT to school
by assessing frequency of walking or of walking and cycling to school. One study
reported there was no effect on AT to school and the other reported the effect was
unclear. Refer to Table 2 in the Appendix for a detailed description of the outcome
measures and the results.
School Travel Advisor
• The evidence in the effectiveness reviews for the effect of school travel advisor
interventions on increasing AT to school among school-aged children is unclear
• However, the NICE guideline recommended the identification of a walking or cycling
champion or champions who can liaise with the local authority and other potential
partners to address any environmental or organizational barriers to walking and
cycling to school
The role of the advisor in five studies across the effectiveness reviews was similar: to
work with schools to develop school travel plans. However, specific design and
implementation of school travel advisor interventions varied. Refer to Table 2 in the
Appendix for a detailed description of the interventions.
21
In addition to variations in the school travel advisor interventions across the five studies
in the effectiveness reviews, the studies also differed by how the outcomes were
measured and how the results were reported. All five studies assessed participation in
AT to school, most commonly by assessing frequency of walking or of walking and
cycling to school. Four studies reported that the effect was unclear and the results from
the fifth study were reported differently in two reviews. One review reported a small
effect (Cohen’s d, 0.209) and the other two reported an adjusted odds ratio (0.98,
95%CI 0.61 to 1.59). Refer to Table 2 in the Appendix for a detailed description of the
outcome measures and the results.
Classroom Programs
• The evidence in the effectiveness reviews for the effect of classroom program
interventions on increasing AT to school is unclear
• However, the NICE guideline recommended that schools foster a culture that
supports physically active travel for journeys to school by increasing awareness of
the health benefits among parents and care providers
Two classroom program interventions included in all three effectiveness reviews
consisted of separate activities and/or resources for students, teachers, parents and
council. However, specific design and implementation of classroom program
interventions varied across the two studies. Refer to Table 2 in the Appendix for a
detailed description of the interventions.
In addition to variations in the classroom program interventions across the two studies
in the effectiveness reviews, the studies also differed by how the outcomes were

22
measured and how the results were reported. Both studies assessed participation in AT
to school, one by frequency of walking to school and the other by walking distance to
school. Since one study did not evaluate changes in walking frequency, the results are
not applicable to this review. The results were conflicting in the reviews for the other
study. One review reported no effect, the second review identified that students
reported no difference in walking but parents reported a 9.8% increase in walking to
school and the last review reported a large effect (Cohen’s d, 0.861) on walking to
school. Refer to Table 2 in the Appendix for a detailed description of the outcome
measures and the results.
Overall Findings from the Effectiveness Reviews
o The NICE effectiveness review reported that the majority of evidence showed
positive effects of AT interventions on walking and cycling but that it is not clear what
particular aspects of the interventions had the most effect on their positive
outcomes.
o The Chillon et al review reported that interventions with appropriate school, parent
and community involvement and that work toward a specific goal seemed to be more
effective than interventions that were broader in focus.
o The Hosking et al review reported that there is very limited evidence that school
travel plans influence travel mode.
Overall Recommendations from the NICE Guideline
The overall recommendations from the NICE guideline are as follows:

23
• Foster a culture that supports physically active travel for journeys to school and
during the school day
• Develop and implement school travel plans with community partners and involve
students
• Map safe routes to school in consultation with the community
• Develop programs to ensure the local environment around schools and nearby
catchment areas provide opportunities for all children to cycle or walk
• Introduce regular 'walking buses' and other activities, such as 'Walk once a week'
projects, which support and encourage AT to school
• Set performance targets for school travel plans which are audited annually and
which form part of delivery plans
• Ensure all children can take part in 'Bikeability' training
• Develop parents’ and care providers’ awareness of the benefits of AT to school
• Identify a champion to coordinate AT activities
8 Study Limitations
The overall quality of the evidence included in three systematic effectiveness reviews is
moderate. There is significant heterogeneity among interventions in the included
studies. Interventions varied by duration, the number and type of activities included,
number of different groups targeted and with respect to the outcomes measured. These
variations pose a challenge for combining and comparing results and limit the extent to
which overall conclusions can be made about the effectiveness of specific interventions.

24
9 Applicability and Transferability
Region of Peel staff working in AT to school related areas participated in a facilitated
discussion on May 23, 2013. The purpose of this meeting was to discuss the
applicability and transferability of the findings in this report.
Applicability
Political Acceptability or Leverage
There is regional support for increasing AT to school in Peel. However, it was agreed
that successful AT interventions require partnerships among various stakeholders. This
presents a challenge for implementing AT interventions because:
• Although stakeholders show high interest they are not necessarily aligned in terms
of their readiness to actively engage in AT design and implementation
• AT interventions cross many professions; currently roles for each profession are
unclear and need to be established as AT planning proceeds
• AT interventions also affect many levels of authority; each level needs to be
determined so that the appropriate individuals or groups are involved and roles are
clearly defined
Social Acceptability
AT appears to be socially acceptable however there are limited data on the true
attitudes and perceptions of the target population making it difficult to fully assess social
acceptability. A further assessment of the attitudes and perceptions of the school
community is warranted. For example:
25
• It is a common belief that parents accept the idea of AT to school however are
unable to support the participation of their children in AT due to time constraints
• Safety concerns were noted as a barrier to parental support of child participation in
AT to school: lack of trust in the community in addition to physical safety concerns
such as unsafe crossings or high traffic areas
Available Essential Resources
• Region of Peel staff, particularly Public Health staff and Public Works staff are
available for local implementation
• Training needs of regional staff and of other stakeholders can be identified once
specific AT interventions are selected
• Funding for AT interventions is currently limited but essential; as current and new
partnerships are forged, opportunities for funding should be identified
Organizational Expertise and Capacity
• Peel Public Health and Public Works staff have varying degrees of expertise and
capacity in the area of AT to school
• Continued review of current roles of regional staff and partners will help to identify
areas where expertise requires development and capacity may be limited
Transferability
Magnitude of Reach and Cost Effectiveness of Interventions
• AT to school interventions will reach their target group of school-aged children and
youth in Peel and may also reach parents, caregivers, other members of the school
community and the general population
26
• Cost effectiveness will vary depending on the chosen intervention(s)
Target Population Characteristics
• Most studies included in the review were carried out in developed nations similar to
Canada, e.g. USA, Australia, and UK among school-aged children and youth
• The organizational structure of schools and key partners in the study countries may
differ from organizational structures in Peel
• Increased knowledge of attitudes and perceptions of students, parents/caregivers
and the school community in Peel towards AT to school would help staff assess the
generalizability of the research to the Peel setting
10 Recommendations
Peel Public Health should take the following actions:
1. Develop interventions shown to be effective in increasing AT to school among
school-aged children:
• walking school bus, safe routes to school, cycling programs and walk to school
days
2. Develop these interventions guided by the NICE guideline recommendations:
• Foster a culture that supports physically active travel for journeys to school and
during the school day
• Develop and implement school travel plans with community partners and
students
• Map safe routes to school in consultation with the community

27
• Develop programs to ensure the local environment around schools and nearby
catchment areas provide opportunities for all children to cycle or walk
• Introduce regular 'walking buses' and other activities, such as 'Walk once a week'
projects, which support and encourage AT to school
3. Monitor and evaluate current and future Region of Peel AT interventions for
effectiveness.
28
References 1. Statistics Canada, Share File, Ontario Ministry of Health and Long-Term Care.Canadian Community
Health Survey. (2007-2008).
2. Region of Peel. Student health 2011: Measuring the health of peel's youth. (2011).
3. Metrolinx. Greater Toronto and Hamilton Area School Travel Household Attitudinal Study Report.
(2011).
4. Lundy, V. Active Living Team Personal Communication. October 15, 2012. Student transportation of
peel region.
5. Region of Peel. Comprehensive health status report. (2008).
6. Region of Peel. Active transportation plan. (2011).
7. National Institute for Clinical Excellence. (November 2012). Walking and cycling: Local measures to
promote walking and cycling as forms of travel or recreation.
8. Blank, L., Jones, R., Buckley-Woods, H., & Payne, N. (2011). NICE effectiveness review: Systematic
review and narrative synthesis of the effectiveness of local interventions to promote cycling and
walking for recreational and travel purposes. University of Sheffield, School of Health and Related
Research.
9. Chillon, P., Evenson, K. R., Vaughn, A., & Ward, D. S. (2011). A systematic review of interventions for
promoting active transportation to school. International Journal of Behavioral Nutrition & Physical
Activity, 8, 10.
10. Hosking, J., Macmillan, A., Connor, J., Bullen, C., & Ameratunga, S. (2010). Organisational travel
plans for improving health. Cochrane Database of Systematic Reviews, (3), 005575.

29
Appendices Appendix A: Conceptual Model Appendix B: Search Strategy Appendix C: Literature Search Flowchart Appendix D: Data Extraction Tables Appendix E: Applicability & Transferability Worksheet

30
Appendix A: Conceptual Model

31
Appendix B: Search Strategy Database: EBM Reviews - Cochrane Database of Systematic Reviews <2005 to October 2012>, Global Health <1973 to September 2012>, Ovid MEDLINE(R) <1946 to October Week 4 2012>, Ovid MEDLINE(R) In-Process & Other Non-Indexed Citations <October 31, 2012> Search Strategy: 1 Transportation/ or Walking/ or Bicycling/ (33385) 2 ((travel or transport or commut$ or route$) adj3 (school$ or sustainable or active or planning or mode or choice)).ti,ab. (12745) 3 (bike$ or bicycle$ or cyclist or cycling or bicycling).ti,ab. (46239) 4 ("sustainable mobility" or "complete streets" or "on the move to school").ti,ab. (17) 5 ("car-free school zone" or drop-off point or "walk-a-block").ti,ab. (2) 6 ("safe routes to school" or "school-zone congestion" or "kiss-and-ride" or "light ambulation").ti,ab. (55) 7 (healthy adj3 school$).ti,ab. (1874) 8 ("smart growth" or human-powered or "speed reduction" or "right of way widths").ti,ab. (149) 9 (walk$ or crosswalk$ or sidewalk$ or pedestrian or traffic).ti,ab. (100445) 10 (traffic-calming or anti-idling).ti,ab. (59) 11 exp Schools/ (80846) 12 school*.ti,ab. (219117) 13 11 or 12 (264220) 14 1 or 2 or 3 or 4 or 5 or 6 or 7 or 8 or 9 or 10 (171980) 15 13 and 14 (5636) 16 meta-analysis.mp,pt. (74636) 17 systematic review.tw. (45523) 18 cochrane database of systematic reviews.jn. (16945) 19 16 or 17 or 18 (106349) 20 exp guideline/ (38023) 21 (practice guideline or guideline).pt. (23243) 22 20 or 21 (38023) 23 19 or 22 (143659) 24 (comment or letter or editorial or note or erratum or short survey or news or newspaper article or patient education handout or case report or historical article).pt. (1650958) 25 23 not 24 (137846) 26 15 and 25 (95) 27 remove duplicates from 26 (77)
Grey Literature Databases The Centre for Reviews and Dissemination, Community Guide of the Center for Disease Control and Prevention, Evidence for Policy and Practice Information and Co-ordinating Centre (EPPI), National Collaborating Centre for Methods and Tools, National Guideline Clearinghouse, National Institute for Health and Clinical Excellence (NICE), Public Health Agency of Canada, TRIP database, World Health Organization and Public Health Plus.
32
Appendix C: Literature Search Flowchart
33
Appendix D: Data Extraction Tables Table 1: Data Extraction Items Reviewed
Chillon et al Review Hosking et al Review NICE Guideline
General Information and Quality Rating Author, Year, Title
Chillon et al. 2011. A systematic review of interventions for promoting active transportation to school.
Hosking et al. 2010. Organizational travel plans for improving health.
National Institute for Health and Clinical Excellence (NICE). 2012. Walking and cycling: local measures to promote walking and cycling as forms of travel or recreation.
Country Spain New Zealand United Kingdom Quality Rating Moderate (6/10) Strong (10/10) Strong (6/7) Objectives To review intervention studies
related to active school transportation to assess effectiveness and guide future intervention research.
To assess the effects of organizational travel plans on health, either directly measured, or through changes in travel mode. Organizational travel plans are interventions that aim to reduce single-occupant car use and increase the use of alternatives such as walking, cycling and public transport with a variety of behavioural and structural components.
To set out how people can be encouraged to increase the amount they walk or cycle for travel or recreation purposes.

34
Target Group(s) Children and adolescents School-aged population (Subgroup of larger target group including: working age adults and entire local community.)
Guidance is for: Head teachers and school governors, local authority physical education coordinators, school travel advisors and transport planners, police traffic officers and neighbourhood policing teams, road danger reduction and/or road safety officers. (Larger guidance audience: commissioners, managers and practitioners involved in physical activity promotion or who work in the environment, parks and leisure or transport planning sectors...) Effectiveness Review target group: Students (Subgroup of larger target group including adults and whole community.)
Details of Each Review Number of Primary Studies Included
14 17 Of these, 10 studies were conducted in the school setting.
Recommendation #8: Schools Guidance was based on economic modelling, six expert papers and two literature reviews, one of which was deemed relevant to our research question: Blank et al. 2012. Systematic review and narrative synthesis of the effectiveness of local interventions to promote cycling and walking for recreational and travel purposes. It included 118 primary studies. Of these, 17 were conducted in school settings.
Types of Studies
10 quasi-experimental designs1 observational study 3 RCTs
2 cluster randomized trials 8 controlled before-after studies
From Effectiveness Review: 11 before and after 1 interrupted time series 4 nRCT 2 cluster RCT
35
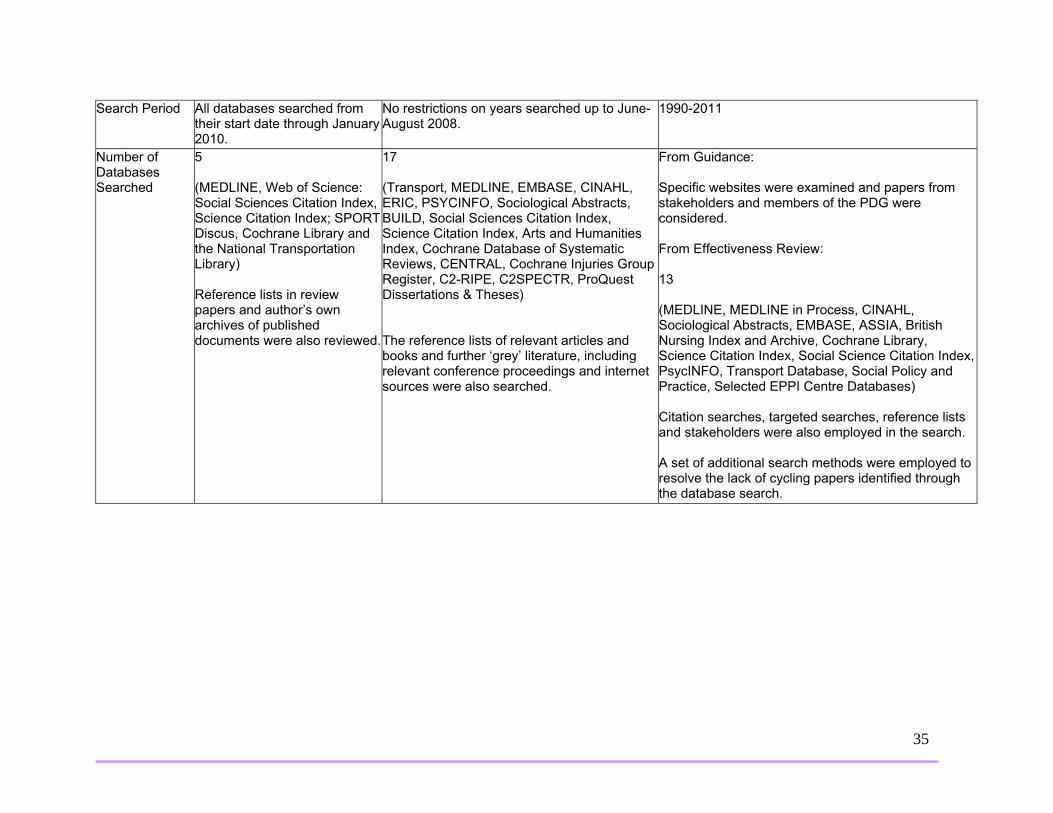
Search Period All databases searched from their start date through January 2010.
No restrictions on years searched up to June-August 2008.
1990-2011
Number of Databases Searched
5 (MEDLINE, Web of Science: Social Sciences Citation Index, Science Citation Index; SPORT Discus, Cochrane Library and the National Transportation Library) Reference lists in review papers and author’s own archives of published documents were also reviewed.
17 (Transport, MEDLINE, EMBASE, CINAHL, ERIC, PSYCINFO, Sociological Abstracts, BUILD, Social Sciences Citation Index, Science Citation Index, Arts and Humanities Index, Cochrane Database of Systematic Reviews, CENTRAL, Cochrane Injuries Group Register, C2-RIPE, C2SPECTR, ProQuest Dissertations & Theses) The reference lists of relevant articles and books and further ‘grey’ literature, including relevant conference proceedings and internet sources were also searched.
From Guidance: Specific websites were examined and papers from stakeholders and members of the PDG were considered. From Effectiveness Review: 13 (MEDLINE, MEDLINE in Process, CINAHL, Sociological Abstracts, EMBASE, ASSIA, British Nursing Index and Archive, Cochrane Library, Science Citation Index, Social Science Citation Index, PsycINFO, Transport Database, Social Policy and Practice, Selected EPPI Centre Databases) Citation searches, targeted searches, reference lists and stakeholders were also employed in the search. A set of additional search methods were employed to resolve the lack of cycling papers identified through the database search.

36
Inclusion and Exclusion Criteria
Inclusion: focus on children and adolescents, address active transportation to school, contain an intervention and include at least one outcome or indicator of active transportation or physical activity.
Inclusion: RCTs and controlled before-after studies of travel behaviour change programmes conducted in an organisational setting, where the measured outcome was change in travel mode or health. Intervention being studied must have been a travel behaviour change programme that aimed to change travel behaviour from relatively inactive transport to active, or to change travel behaviour in a way that aimed to reduce car use. Both positive and negative health effects were included. Organisational settings include school or workplaces but not households or communities. Exclusion: Before-after study with no control group, cross-sectional only with no longitudinal component, not carried out in the organizational setting, did not include a travel behaviour change intervention.
From Effectiveness Review: Inclusion: Everyone including, where evidence permits, specific groups (for instance, those with impaired mobility) or those undertaking particular types of journey (for instance, journeys to work). Exclusion: Disease rehabilitation studies conducted in populations with very specific conditions, which include walking and cycling interventions, but have outcomes related only to improvements in the disease condition.
Details of Interventions included in the Review* Description of Interventions*
Walk to school days, walking school buses, safe routes to schools programs, school travel advisors and classroom interventions.
Walk to school weeks, walking school buses, school travel advisors, and classroom interventions.
From Effectiveness Review: Media campaigns, health information, multi component interventions, walking sessions, pedometer interventions, motivational interventions.
Intervention Settings
Schools Schools (Subgroup of larger target settings: schools or workplaces)
From Effectiveness Review: Schools (Subgroup of larger target settings: community, workplace, education settings)

37
Outcome Measures* Primary Outcomes*
Frequency of active travel to school, participation in walking to school day.
Any health outcomes such as obesity, cardiovascular disease and its risk factors, mental health, respiratory fitness and injury rates.
From Effectiveness Review: Rates of walking, cycling or both.
Secondary Outcomes*
Whether children passed SRS project, child’s physical activity and sedentary habits, BMI, exercise self-efficacy, children’s and parents/relatives satisfaction, parent/relatives perceptions and suggestions, lead walking school bus parent’s perceptions, parents perceptions on safety, child’s stage of behaviour change, benefits , motivations and barriers for active commuting to school, attendance, parent leaders and volunteer’s opinion in face-to-face interviews, involvement in walking, curriculum and activities, attitudes, barriers and awareness toward/of walking to school day, school travel plans implementation, parent’s and child’s opinions about walking school bus, participation in events and programs.
Physical activity, changes in travel mode, distribution of any relevant health effects, e.g. effect on health inequalities.
From Effectiveness Review: Rates of overall physical activity, cardio-respiratory fitness, VO2 max, blood pressure, heart rate, weight, body fat/cholesterol, BMI, waist circumference, hip circumference, wellbeing, quality of life, depression, stress, anxiety, mood, social support, behavioural change outcomes, change in diet, adherence to, participation in or awareness of an intervention.
38
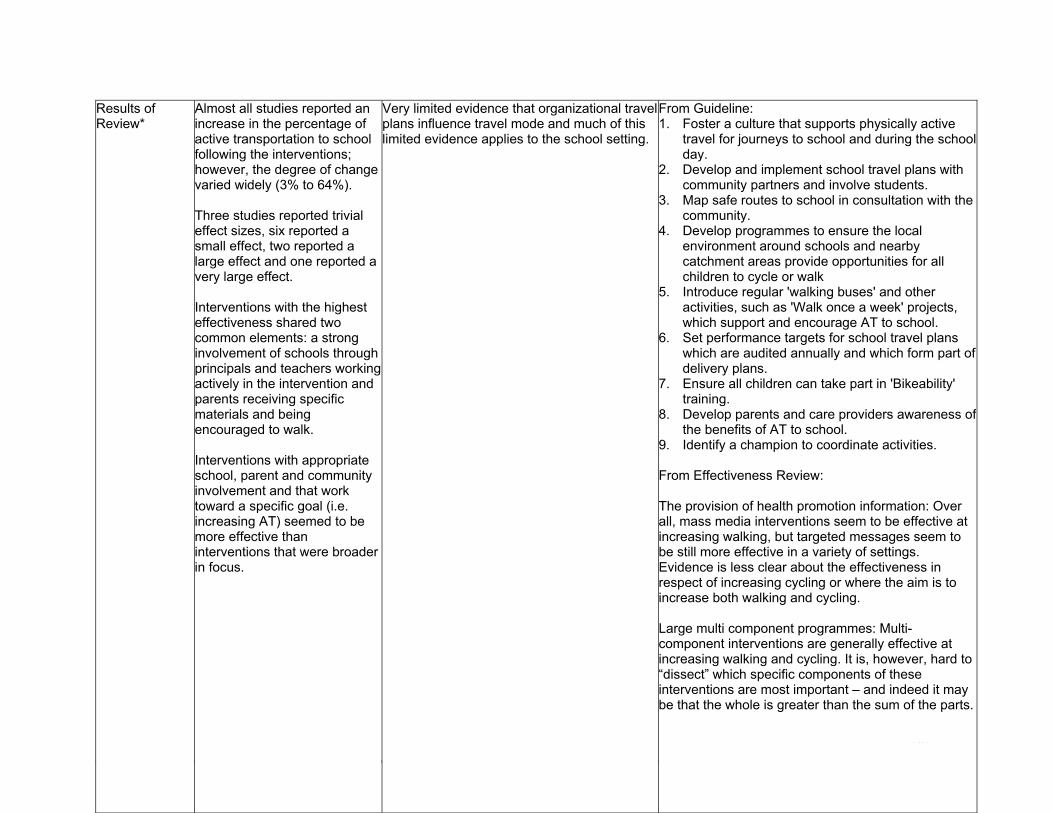
Results of Review*
Almost all studies reported an increase in the percentage of active transportation to school following the interventions; however, the degree of change varied widely (3% to 64%). Three studies reported trivial effect sizes, six reported a small effect, two reported a large effect and one reported a very large effect. Interventions with the highest effectiveness shared two common elements: a strong involvement of schools through principals and teachers working actively in the intervention and parents receiving specific materials and being encouraged to walk. Interventions with appropriate school, parent and community involvement and that work toward a specific goal (i.e. increasing AT) seemed to be more effective than interventions that were broader in focus.
Very limited evidence that organizational travel plans influence travel mode and much of this limited evidence applies to the school setting.
From Guideline: 1. Foster a culture that supports physically active
travel for journeys to school and during the school day.
2. Develop and implement school travel plans with community partners and involve students.
3. Map safe routes to school in consultation with the community.
4. Develop programmes to ensure the local environment around schools and nearby catchment areas provide opportunities for all children to cycle or walk
5. Introduce regular 'walking buses' and other activities, such as 'Walk once a week' projects, which support and encourage AT to school.
6. Set performance targets for school travel plans which are audited annually and which form part of delivery plans.
7. Ensure all children can take part in 'Bikeability' training.
8. Develop parents and care providers awareness of the benefits of AT to school.
9. Identify a champion to coordinate activities. From Effectiveness Review: The provision of health promotion information: Over all, mass media interventions seem to be effective at increasing walking, but targeted messages seem to be still more effective in a variety of settings. Evidence is less clear about the effectiveness in respect of increasing cycling or where the aim is to increase both walking and cycling. Large multi component programmes: Multi-component interventions are generally effective at increasing walking and cycling. It is, however, hard to “dissect” which specific components of these interventions are most important – and indeed it may be that the whole is greater than the sum of the parts.

39
Walking Sessions: These can be broadly divided into those that are not specifically pedometer-based, and those in which the use of a pedometer is a key part of the intervention. Those without a pedometer a broadly effective at increasing walking, but the effectiveness seems to vary by setting (community, workplace, school etc.) Those using a pedometer are more universally effective in all settings, but a key question (not answered by this literature) is how much using a pedometer adds to the basic walking session interventions.
40
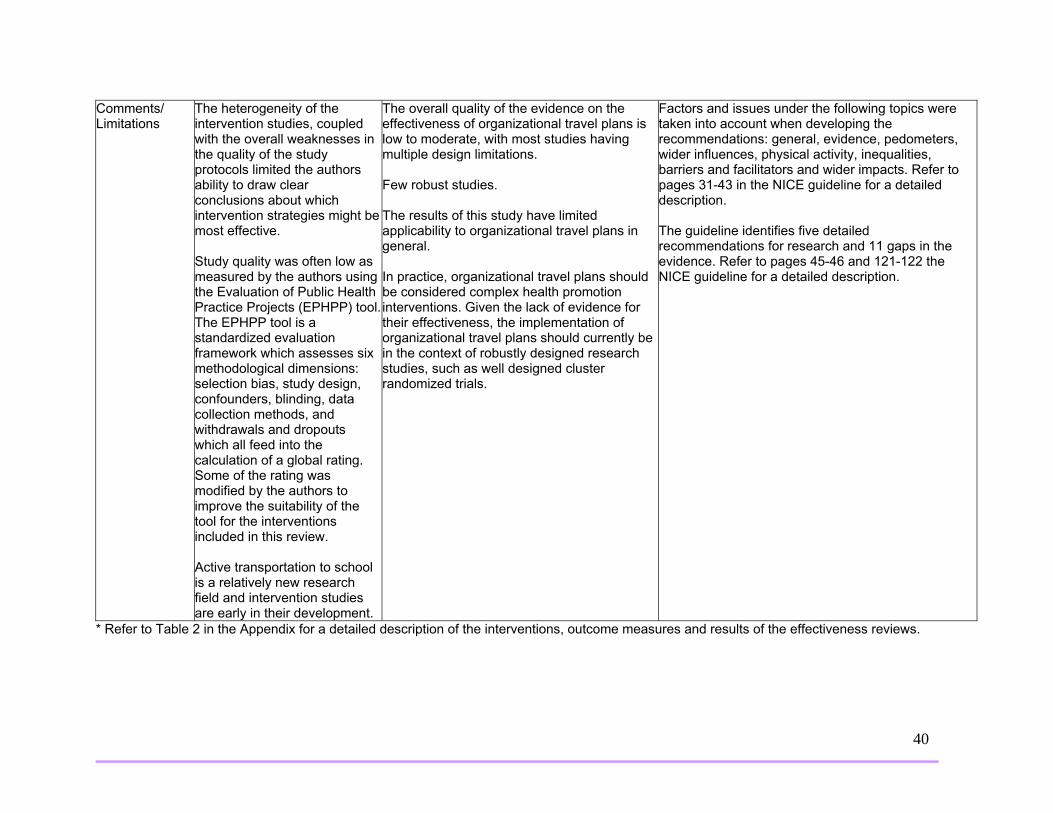
Comments/ Limitations
The heterogeneity of the intervention studies, coupled with the overall weaknesses in the quality of the study protocols limited the authors ability to draw clear conclusions about which intervention strategies might be most effective. Study quality was often low as measured by the authors using the Evaluation of Public Health Practice Projects (EPHPP) tool.The EPHPP tool is a standardized evaluation framework which assesses six methodological dimensions: selection bias, study design, confounders, blinding, data collection methods, and withdrawals and dropouts which all feed into the calculation of a global rating. Some of the rating was modified by the authors to improve the suitability of the tool for the interventions included in this review. Active transportation to school is a relatively new research field and intervention studies are early in their development.
The overall quality of the evidence on the effectiveness of organizational travel plans is low to moderate, with most studies having multiple design limitations. Few robust studies. The results of this study have limited applicability to organizational travel plans in general. In practice, organizational travel plans should be considered complex health promotion interventions. Given the lack of evidence for their effectiveness, the implementation of organizational travel plans should currently be in the context of robustly designed research studies, such as well designed cluster randomized trials.
Factors and issues under the following topics were taken into account when developing the recommendations: general, evidence, pedometers, wider influences, physical activity, inequalities, barriers and facilitators and wider impacts. Refer to pages 31-43 in the NICE guideline for a detailed description. The guideline identifies five detailed recommendations for research and 11 gaps in the evidence. Refer to pages 45-46 and 121-122 the NICE guideline for a detailed description.
* Refer to Table 2 in the Appendix for a detailed description of the interventions, outcome measures and results of the effectiveness reviews.

41
Table 2: Primary Study Characteristics, Interventions, Outcome Measures and Results of the Effectiveness Reviews
Primary Study
Study Characteristics
(Type, Sample Size, Age, School Type, # of Schools Studied,
Duration, Study Location)
Description of Intervention Outcome Measures Results
Walking School Bus 9 studies WSB Studies in all three Reviews
Results from Chillon Review Children at experimental schools walked to school more than children at control schools (p<0.001) Cohen’s d: 0.256 Small effect size for differences between experimental and control group for percentage of children walking to school in the posttest.
Mendoza, 2009
nRCT N=820, age 5-11 Three primary schools (1 intervention, 2 control) 12 months USA
Walking School Bus (WSB) Coordinator and parent volunteers. WSB Coordinator responsibilities: establish WSB routes and recruit adult volunteers and students, implement school-wide activities, distribute materials on walking to school and pedestrian safety materials, provide walk to school materials and WSB information in the school newsletter, arrange for classroom presentations on pedestrian safety, organize “Two-Feet Tuesdays” (a weekly walk to school day), organize walking workshops and the annual walk to school community celebration and conduct an informal evaluation. Schools also received standard information on preferred walking routes from the Seattle Public Schools, access to a district-wide school traffic and safety committee and assistance with school safety
Child-reported frequency of walking and being driven to school on day of survey. Survey conducted when WSB not operating and no other promotional event operating. Did not indicate extent of student participation e.g. # of days per week.
Results from Hosking Review Walking increased significantly more in intervention group. Change in car use not significantly different between intervention and control groups.
42
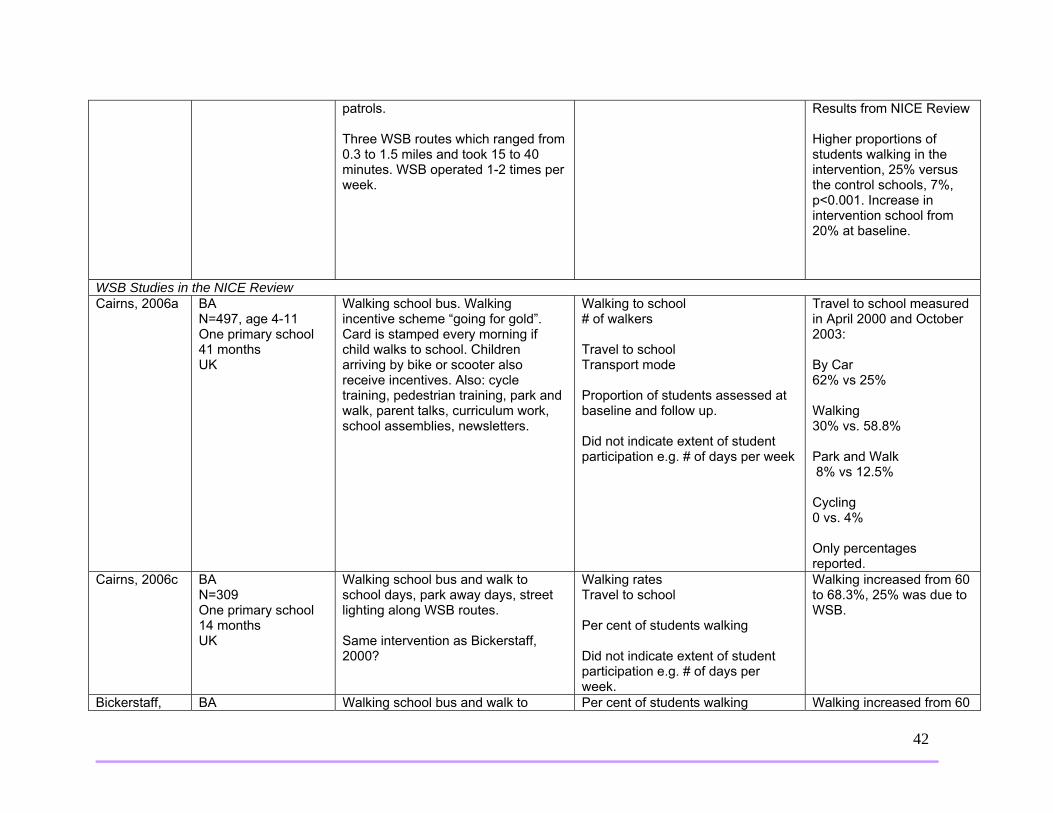
patrols. Three WSB routes which ranged from 0.3 to 1.5 miles and took 15 to 40 minutes. WSB operated 1-2 times per week.
Results from NICE Review Higher proportions of students walking in the intervention, 25% versus the control schools, 7%, p<0.001. Increase in intervention school from 20% at baseline.
WSB Studies in the NICE Review Cairns, 2006a
BA N=497, age 4-11 One primary school 41 months UK
Walking school bus. Walking incentive scheme “going for gold”. Card is stamped every morning if child walks to school. Children arriving by bike or scooter also receive incentives. Also: cycle training, pedestrian training, park and walk, parent talks, curriculum work, school assemblies, newsletters.
Walking to school # of walkers Travel to school Transport mode Proportion of students assessed at baseline and follow up. Did not indicate extent of student participation e.g. # of days per week
Travel to school measured in April 2000 and October 2003: By Car 62% vs 25% Walking 30% vs. 58.8% Park and Walk 8% vs 12.5% Cycling 0 vs. 4% Only percentages reported.
Cairns, 2006c
BA N=309 One primary school 14 months UK
Walking school bus and walk to school days, park away days, street lighting along WSB routes. Same intervention as Bickerstaff, 2000?
Walking rates Travel to school Per cent of students walking Did not indicate extent of student participation e.g. # of days per week.
Walking increased from 60 to 68.3%, 25% was due to WSB.
Bickerstaff, BA Walking school bus and walk to Per cent of students walking Walking increased from 60

43
2000
N=309 One primary/nursery school 14 months UK
school days, park away days, street lighting along WSB routes. Same intervention as Cairns, 2006c?
Did not indicate extent of student participation e.g. # of days per week.
to 68.3% in 14 months.
Mackett, 2005
BA N=101 Five primary schools 18-30 months UK
Walking school bus promoted within school, at meetings and information sent home to parents to encourage participation. Report includes case studies on 5 primary schools as well as general information.
Walking rates Mode of travel to school Did not indicate extent of student participation e.g. # of days per week.
Around 62% of those using the walking school bus had previously travelled by car. On average each child walked for 22 minutes. Overall reduction in the number of children travelling by car was 50%. The number of children using the WSB declined over time at each location.
Johnston, 2006
nRCT N=not given School type=not given Duration unclear USA
Walking school bus. School implemented three routes staffed by parents.
Mode of transport to school Did not indicate extent of student participation e.g. # of days per week.
Number of children who walked to school increased from baseline to follow up by 25%. A decrease in children arriving by private vehicle was also documented (no data).
WSB Studies in the Chillon Review Heelan, 2009
Quasi-experimental N=324, age 7-9 Three schools (1 control, 2 experimental) 2 years USA
Walking School Bus Children walk to school in groups along a set route with adults as supervisors.
Child-reported frequency of walking to and from school by mode of transport. Did not indicate extent of student participation e.g. # of days per week.
Children, in experimental group actively commuted more than children in control group (P<0.05). Cohen’s d: 0.216 Small effect size for differences between experimental and control group for percentage of children who actively commuted to school in the posttest.
Kong, 2009
Quasi-experimental N=22, age 5-11;
Walking School Bus Police department ensured safety of
Parent-reported and child-reported frequency of child walking to school.
Children reported they walked more during the

44
also, 9 parents/relatives, age 20-59 Two schools (both experimental) 10 weeks USA
route. Recruitment started 3 months before intervention and included dissemination of flyers, posters, articles, classroom presentations and morning announcement, a part-time WSB coordinator, lead parent volunteer. All participants and their parents met with health care providers for a physical exam and discussion about obesity prevention before the WSB trial. Two trainings for parent volunteers. During the walks, 4 health themes were emphasized: get up and play hard, for at least 1 hour/day, turn off your tv and watch no more than 2 hours/day, eat 5 servings of fruit or vegetable/day and reduce soda and juice intake to no more than 4 oz/day. Participants were encouraged to talk about personal strategies for making the health behaviour changes on their walks. One health theme introduced every two weeks and motivational incentives were distributed the week after message delivery.
Did not indicate extent of student participation e.g. # of days per week.
intervention. 5/9 parents/relatives rated that WSB increased their children’s walking “a lot”, 4 rated “somewhat”.
Sirard, 2008 RCT N=11, age 8-11 One school (5 students in experimental group and 6 in control group) 2 months USA
Walking School Bus Children walk to school in groups with adults as supervisors. A wagon was pulled by study team member to transport backpacks and instruments. If a student lived more than 1.6km from school, the parent/guardian dropped the student off at one of the other student’s homes (1.1km from school) and he/she walked the remainder of the trip.
Objective measured physical activity during 14 days.
Experimental children increased their moderate to vigorous PA during the commute time 14 min/day more than control children. No significant differences were detected for other weekday periods and no significant differences were detected between groups for PA (P > or equal to 0.40). Cohen’s d: 2.9

45
Very large effect size for differences between experimental and control group for the change in physical activity levels increased between pretest and posttest.
Safe Routes to School 6 studies SRS Studies in the NICE Review Hendricks, 2009
BA N=not given Four elementary schools 12 months USA
Community intervention (schools, worksites and city-wide networks) to increase safe physical activity opportunities and encourage walking and biking for short trips. Safe routes to school and international walk to school day. Modifications were made to the physical environment including more bike lanes and large sidewalks and trail sections.
Number of people walking Active transport Did not indicate extent of student participation e.g. # of days per week.
Number of students walking to school more than doubled at 3 of 4 intervention schools and increased at the other (no statistics given).
SRS Studies in the Chillon Review Boarnet, 2005 2 studies, one intervention, same author
Quasi-experimental Study 1 N=862 parents of children age 8-11 10 schools (experimental/control) 3 years Study 2 N=1778 parents of children age 8-11 10 schools (experimental) 3 years USA
Environmental changes aimed at increasing traffic safety including construction projects as opposed to education or traffic law enforcement: sidewalk improvement projects, replacement of four-way stops with traffic signals, crosswalk and crosswalk signal improvement projects.
Study 1 Parent-reported frequency of child walking and biking to school. Study 2 Parent-reported frequency of child walking and biking to school and on-site observations on counts of walking. Did not indicate extent of student participation e.g. # of days per week.
Study 1 72% of parents stated their children walked/biked the same before and after SRS construction, 18% stated less, 11% stated more. There was a greater increase in walking among those who passed the SRS project (P<0.01) after sidewalk improvements and traffic control projects (primarily traffic signals). 15% of school children walked or cycled more when the SRS project was

46
on their normal route compared to 4% of those whom it was not P<0.01 Cohen’s d: 0.221 Small effect size for differences between those who passed completed SRS projects (experimental group) and those who did not pass by projects (control group), for the percentage of parents reporting that children walked or bicycled to school more after the project construction. Study 2 Children walking increased: ‐ after sidewalk
improvement projects in 5/10 schools (from 10 to 850%) and after traffic signal improvements in 2/10 sites
‐ after crosswalk and crosswalk signal improvement projects in one school site and decreased in another
Three sidewalk gap closure projects showed success: Observed children walking exclusively on the sidewalk increased 30%, 70% and

47
28% after SRS construction in 3 schools. Cohen’s d: -0.087 Trivial effect size for differences in the experimental group for the change in walking to school between pretest and posttest for each school.
SRS Studies in the NICE Review and the Chillon Review Zaccari, 2003 Same study in both reviews
BA N=243, age 5-12 One primary school (experimental) 12 months Australia
Students were given 4 week travel diary to complete. Classroom activities and weekly newsletters during term 1. Involvement of local press and a school assembly on Walk to School. Police enforcement to prevent pavement parking. Mapping routes to school, road safety audit, banner painting, school travel policy, newsletters, media.
Child-reported frequency and mode of travel to/from school Did not indicate extent of student participation e.g. # of days per week.
Results from NICE Review Percentage of car trips decreased by 3.4% and percentage of walking trips increased by 3.4%. Journey to school comparisons between the 1st and 4th week indicated an overall increase of 6% in the number of children walking to school. Results from Chillon Review 3.4% reduction in car trips and 3.4% increase in walking trips. Travel to school: # of children being driven decreased, # walking increased. Travel from school: # of children being driven decreased, number
48
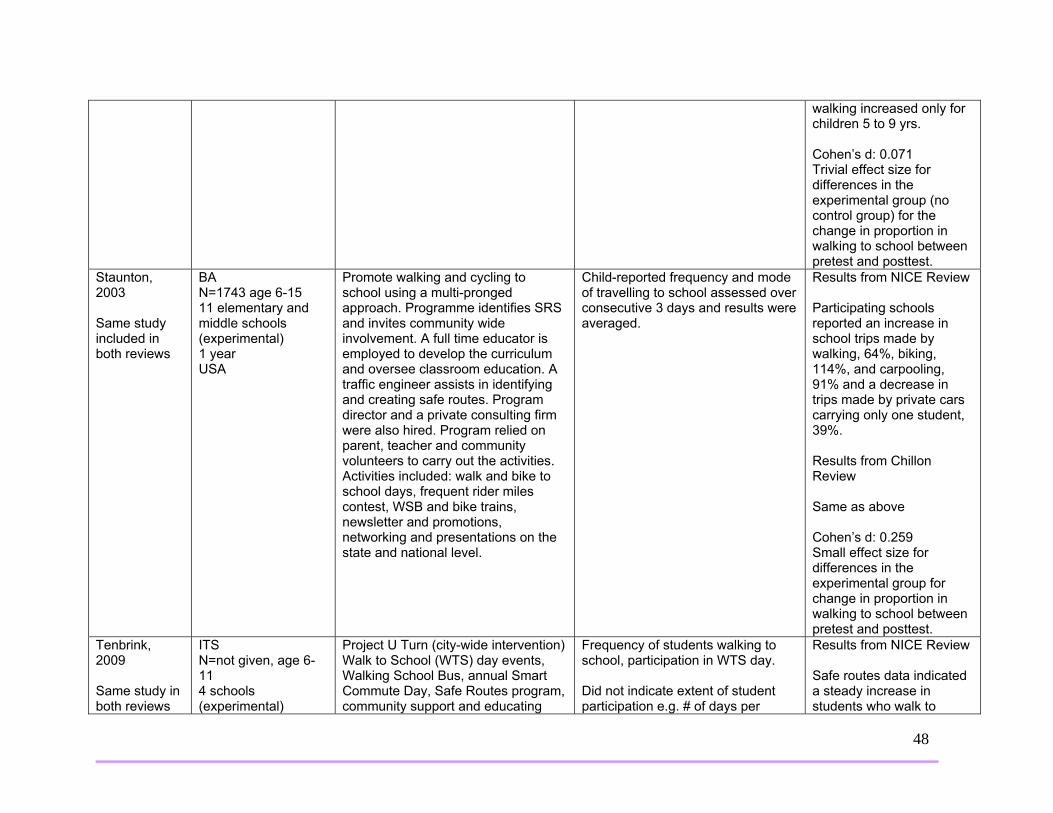
walking increased only for children 5 to 9 yrs. Cohen’s d: 0.071 Trivial effect size for differences in the experimental group (no control group) for the change in proportion in walking to school between pretest and posttest.
Staunton, 2003 Same study included in both reviews
BA N=1743 age 6-15 11 elementary and middle schools (experimental) 1 year USA
Promote walking and cycling to school using a multi-pronged approach. Programme identifies SRS and invites community wide involvement. A full time educator is employed to develop the curriculum and oversee classroom education. A traffic engineer assists in identifying and creating safe routes. Program director and a private consulting firm were also hired. Program relied on parent, teacher and community volunteers to carry out the activities. Activities included: walk and bike to school days, frequent rider miles contest, WSB and bike trains, newsletter and promotions, networking and presentations on the state and national level.
Child-reported frequency and mode of travelling to school assessed over consecutive 3 days and results were averaged.
Results from NICE Review Participating schools reported an increase in school trips made by walking, 64%, biking, 114%, and carpooling, 91% and a decrease in trips made by private cars carrying only one student, 39%. Results from Chillon Review Same as above Cohen’s d: 0.259 Small effect size for differences in the experimental group for change in proportion in walking to school between pretest and posttest.
Tenbrink, 2009 Same study in both reviews
ITS N=not given, age 6-11 4 schools (experimental)
Project U Turn (city-wide intervention) Walk to School (WTS) day events, Walking School Bus, annual Smart Commute Day, Safe Routes program, community support and educating
Frequency of students walking to school, participation in WTS day. Did not indicate extent of student participation e.g. # of days per
Results from NICE Review Safe routes data indicated a steady increase in students who walk to

49
5 years USA
decision makers on the benefits of policy and physical projects to support active transportation, funding was requested by schools for new sidewalks, a study on the financial impact of introducing pedestrian improvements and programs to replace some bus routes and completes streets resolutions were taken at each level (city, county, metropolitan).
week. school (data not given). Participation in walk to school day increase from 600 in 2003 to 1200 in 2008. Results from Chillon Review # of students walking to school increased: 5% walked to school in 2004, 7% in 2005, 11% in 2006 15% in 2007. Participation in WTS day increased from 600 in 2003 to more than 1200 in 2008. Cohen’s d: 0.321 Small effect size (for 1 school with 4 measures) for differences in the experimental group for the change in proportion in walking to school between pretest and posttest.
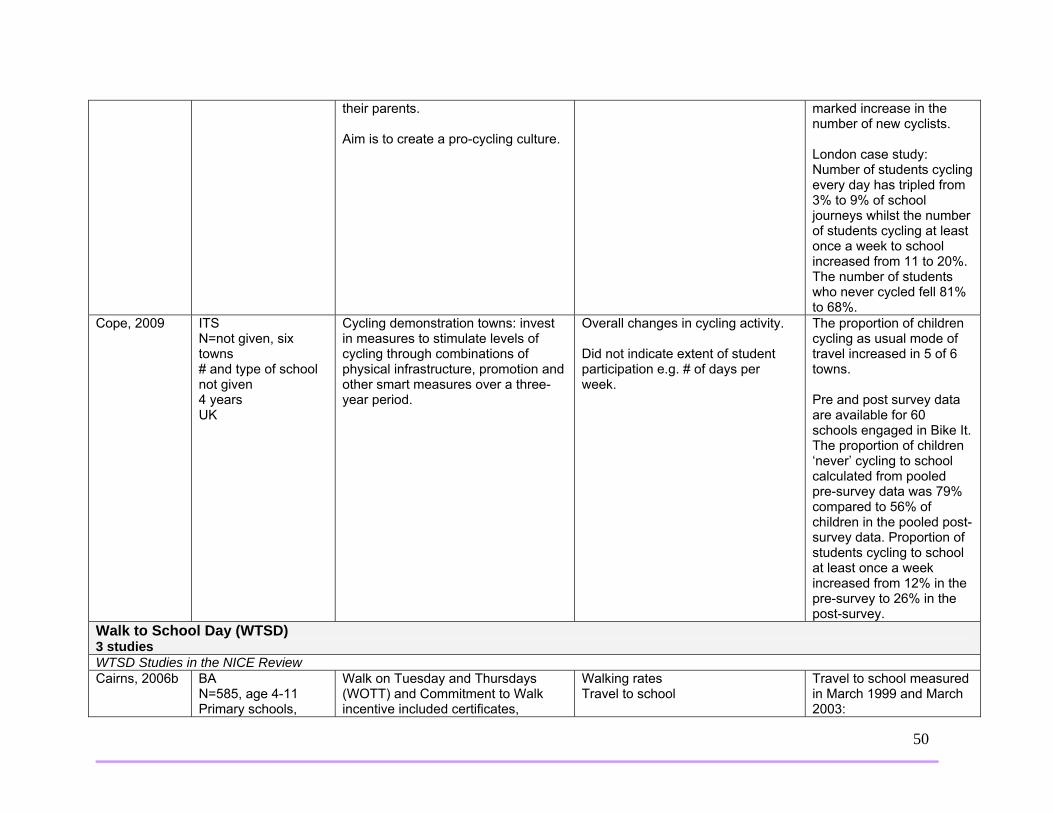
Cycling Programs 2 studies Cycling Studies in the NICE Review Sustrans, 2008
BA N=roughly 11,000 52 schools 1 year UK
Bike It Works directly with schools who want to increase levels of cycling to help schools make the case for cycling in their school travel plans, supporting cycling champions in schools and demonstrating that cycling is a popular choice amongst children and
Cycling rates Extent of student participation given in London case study – see results.
Number of students cycling to school at least once a week increase from 10% to 27%. Number of students who never cycled fell from 89% to 55% representing a
50
their parents. Aim is to create a pro-cycling culture.
marked increase in the number of new cyclists. London case study: Number of students cycling every day has tripled from 3% to 9% of school journeys whilst the number of students cycling at least once a week to school increased from 11 to 20%. The number of students who never cycled fell 81% to 68%.
Cope, 2009
ITS N=not given, six towns # and type of school not given 4 years UK
Cycling demonstration towns: invest in measures to stimulate levels of cycling through combinations of physical infrastructure, promotion and other smart measures over a three-year period.
Overall changes in cycling activity. Did not indicate extent of student participation e.g. # of days per week.
The proportion of children cycling as usual mode of travel increased in 5 of 6 towns. Pre and post survey data are available for 60 schools engaged in Bike It. The proportion of children ‘never’ cycling to school calculated from pooled pre-survey data was 79% compared to 56% of children in the pooled post-survey data. Proportion of students cycling to school at least once a week increased from 12% in the pre-survey to 26% in the post-survey.
Walk to School Day (WTSD) 3 studies WTSD Studies in the NICE Review Cairns, 2006b BA
N=585, age 4-11 Primary schools,
Walk on Tuesday and Thursdays (WOTT) and Commitment to Walk incentive included certificates,
Walking rates Travel to school
Travel to school measured in March 1999 and March 2003:

51
number not given 48 months UK
stickers and trophy incentives. Commitment to walk focused on continuing to walk in inclement weather. On WOTT days record cards signed by parents to confirm walking.
Did not indicate extent of student participation e.g. # of days per week.
Car 36.5% vs. 36.6% Walk 53.3% vs. 58.7% Park and walk 9% vs. 14% Only percentages reported.
WTSD Studies in the Chillon Review Jordan, 2008 Quasi-experimental
N=578 parents, 767 students age 6-11 4 schools (2 control, 2 experimental) 1 year USA
Gold Medal Schools Program Schools were encouraged to promote fruits and vegetables at breakfast and lunch and to participate in physical activity programs e.g. Walk Your Child to School Day, President’s Challenge for physical fitness.
Parent-reported frequency of child walking and biking to school Did not indicate extent of student participation e.g. # of days per week.
Children at experimental schools walked or biked to school more often than control (P<0.001) both at pre and post-test. While children in both conditions increased the days per week they walked or biked between pre and post test, the change was only significant at control schools (P<0.001).
Merom, 2005 Observational N=812 parents of children age 5-12 717 schools 4 years Australia
Walk Safely to School Day (WSTSD) Annual event 2001 to 2004. Paid media advertising three weeks pre-event to increase parents’ awareness of campaign messages, all primary school invited to participate, invitation letter sent to all principals, voluntary registration, registered schools were sent a school kit including sample letter to parents, suggestions for school newsletter, list of road safety activities the school could implement and promotional material (stickers, posters, some t-shirts).
Parent-reported frequency of child modes of commuting to/from school and participation in WSTSD Did not indicate extent of student participation e.g. # of days per week.
31% more children walked to school on WSTSD than a normal Friday. WSTSD increased the prevalence of walking to school by 6.8% at a population level. School-reported prevalence estimate of walking to school of 19%, was similar to rates reported by parents, 21.8%.
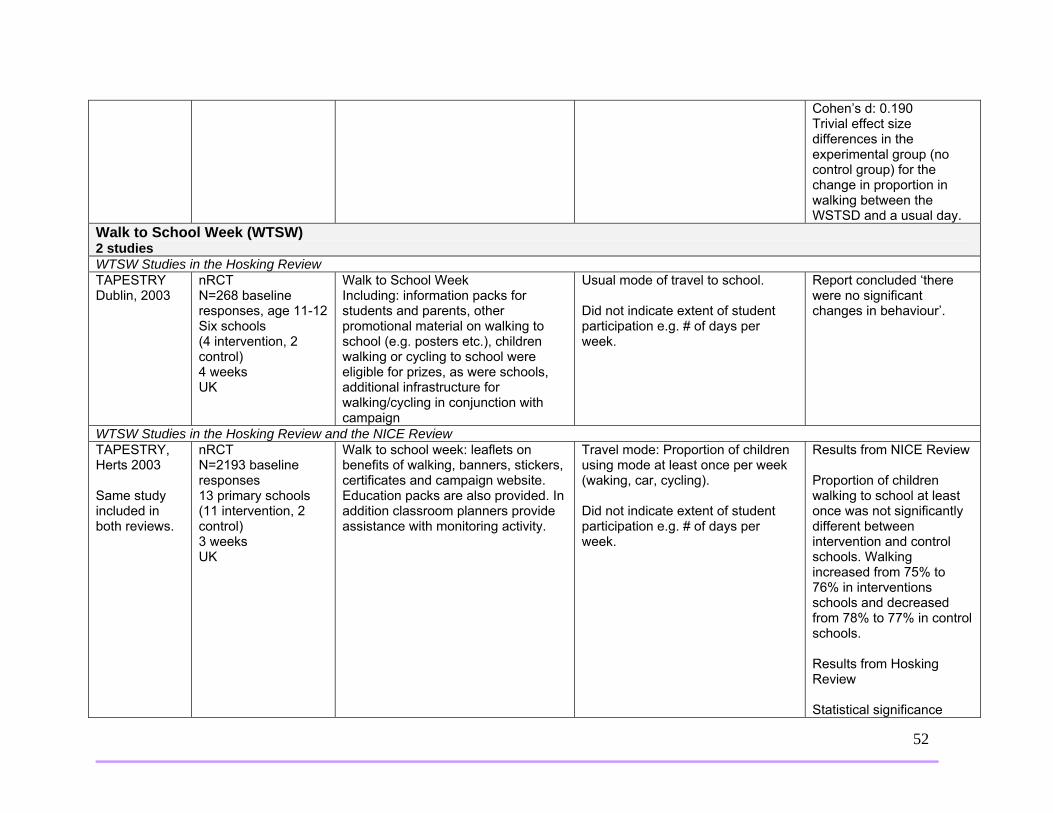
52
Cohen’s d: 0.190 Trivial effect size differences in the experimental group (no control group) for the change in proportion in walking between the WSTSD and a usual day.
Walk to School Week (WTSW) 2 studies WTSW Studies in the Hosking Review TAPESTRY Dublin, 2003
nRCT N=268 baseline responses, age 11-12 Six schools (4 intervention, 2 control) 4 weeks UK
Walk to School Week Including: information packs for students and parents, other promotional material on walking to school (e.g. posters etc.), children walking or cycling to school were eligible for prizes, as were schools, additional infrastructure for walking/cycling in conjunction with campaign
Usual mode of travel to school. Did not indicate extent of student participation e.g. # of days per week.
Report concluded ‘there were no significant changes in behaviour’.
WTSW Studies in the Hosking Review and the NICE Review TAPESTRY, Herts 2003 Same study included in both reviews.
nRCT N=2193 baseline responses 13 primary schools (11 intervention, 2 control) 3 weeks UK
Walk to school week: leaflets on benefits of walking, banners, stickers, certificates and campaign website. Education packs are also provided. In addition classroom planners provide assistance with monitoring activity.
Travel mode: Proportion of children using mode at least once per week (waking, car, cycling). Did not indicate extent of student participation e.g. # of days per week.
Results from NICE Review Proportion of children walking to school at least once was not significantly different between intervention and control schools. Walking increased from 75% to 76% in interventions schools and decreased from 78% to 77% in control schools. Results from Hosking Review Statistical significance

53
unclear. School Travel Advisors 5 studies School Travel Advisor Studies in the three Reviews Rowland, 2003 Same study included in all reviews
Cluster RCT N=1386, age 7-11 21 primary schools (712 students in intervention group, 672 students in control group) 12 months UK
Assistance and advice from a travel coordinator who had formal teaching qualifications and road safety experience for 16 hours. Road safety problems and their solutions identified by meeting with teachers and governors, organizing focus groups of parents and pupils and encouraging the establishment of a school travel working group. Within the working group, specific safety concerns were discussed and advice was given on the development and implementation of a travel plan. The coordinator reviewed draft travel plans and provided advice about how to obtain necessary funding. The coordinator encouraged implementation of the plans by liaison with relevant parties within the local and health authorities.
Proportions of children walking, cycling and using public transport Did not indicate extent of student participation e.g. # of days per week.
Results from NICE Review The proportions of children walking, cycling or using public transport on the school journey were note significantly different between the intervention and control schools. In intervention schools 71% walked, 24% travelled by car and 6% cycled or used public transport. In control schools 71% walked, 23% travelled by car and 7% cycled or used public transport. Adjusted OR=0.98 (95%CI0.61-1.59) for walked, cycled or took public transport. Results from Chillon Review Frequencies of modes of transportation to and from school were similar in both experimental and control groups at pre and post test. In post-test, experimental schools vs. control reported 70% vs 71% of children walking, 24% vs.

54
23% travelling by car and 6% vs 7% cycled or used public transport. Cohen’s d: 0.209 Small effect size for differences between experimental and control group for the change in percentage of children walking to school between pretest and posttest. Results from Hosking Review Adjusted OR for walking, cycling or using public transport in intervention schools compared with control schools 0.98 (95%CI:0.61 to 1.59)
School Travel Advisor Studies included in the Hosking Review Bracknell, 2005
BA N=3871 baseline responses 18 primary schools (3 intervention, 15 control) 6-9 months UK
School travel advisors appointed to work with schools to develop school travel plans and also to do other work that contributes to reducing congestion and increasing sustainable travel.
Travel mode: how students travelled to school every day for one week (averaged). Per cent of students travelling by car, walking, cycling, using other travel mode. Did not indicate extent of student participation e.g. # of days per week.
Statistical significance of differences between intervention and control groups not reported.
Lancashire, 2005
BA N=47,426 baseline responses 237 primary and secondary schools (20 intervention, 217 control)
School travel advisors appointed to work with schools to develop school travel plans and also to do other work that contributes to reducing congestion and increasing sustainable travel.
Travel mode: How students usually travel to school. Per cent of students travelling by walking, car, taxi, cycling, bus, other travel mode. Did not indicate extent of student participation e.g. # of days per
Statistical significance of differences between intervention and control groups not reported.
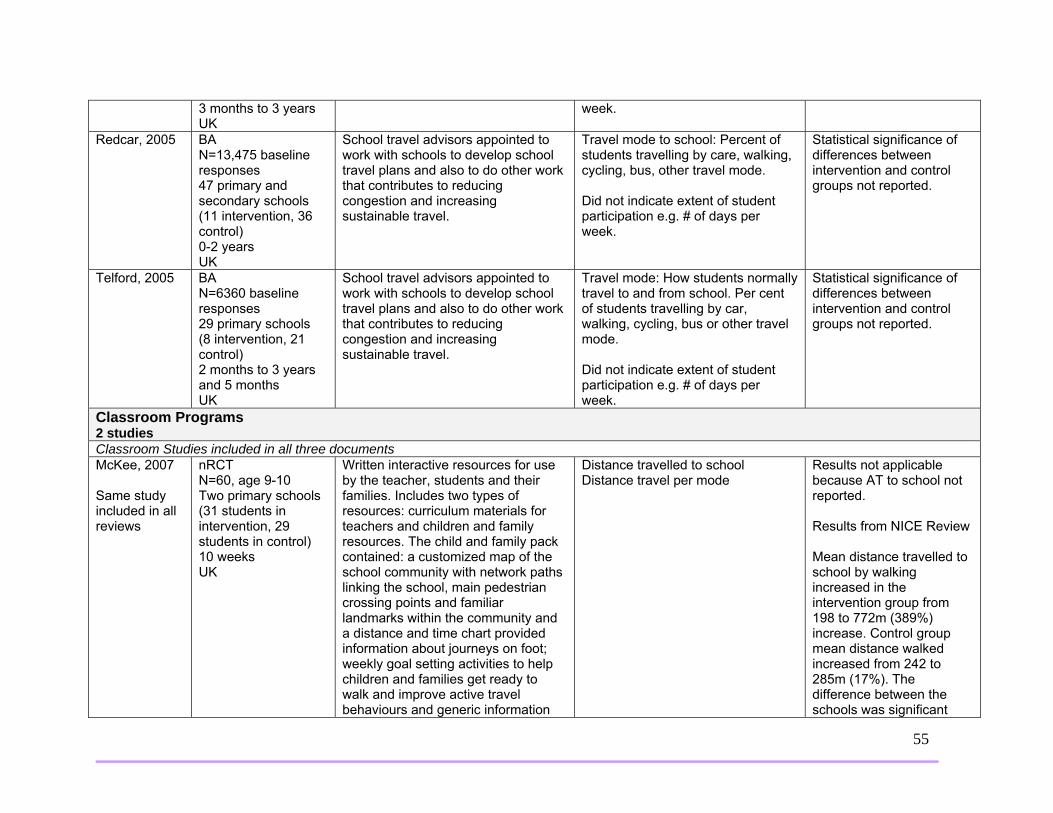
55
3 months to 3 years UK
week.
Redcar, 2005 BA N=13,475 baseline responses 47 primary and secondary schools (11 intervention, 36 control) 0-2 years UK
School travel advisors appointed to work with schools to develop school travel plans and also to do other work that contributes to reducing congestion and increasing sustainable travel.
Travel mode to school: Percent of students travelling by care, walking, cycling, bus, other travel mode. Did not indicate extent of student participation e.g. # of days per week.
Statistical significance of differences between intervention and control groups not reported.
Telford, 2005 BA N=6360 baseline responses 29 primary schools (8 intervention, 21 control) 2 months to 3 years and 5 months UK
School travel advisors appointed to work with schools to develop school travel plans and also to do other work that contributes to reducing congestion and increasing sustainable travel.
Travel mode: How students normally travel to and from school. Per cent of students travelling by car, walking, cycling, bus or other travel mode. Did not indicate extent of student participation e.g. # of days per week.
Statistical significance of differences between intervention and control groups not reported.
Classroom Programs 2 studies Classroom Studies included in all three documents McKee, 2007 Same study included in all reviews
nRCT N=60, age 9-10 Two primary schools (31 students in intervention, 29 students in control) 10 weeks UK
Written interactive resources for use by the teacher, students and their families. Includes two types of resources: curriculum materials for teachers and children and family resources. The child and family pack contained: a customized map of the school community with network paths linking the school, main pedestrian crossing points and familiar landmarks within the community and a distance and time chart provided information about journeys on foot; weekly goal setting activities to help children and families get ready to walk and improve active travel behaviours and generic information
Distance travelled to school Distance travel per mode
Results not applicable because AT to school not reported. Results from NICE Review Mean distance travelled to school by walking increased in the intervention group from 198 to 772m (389%) increase. Control group mean distance walked increased from 242 to 285m (17%). The difference between the schools was significant

56
about walking to school.
p<0.001 (95% CI:-315 to -795m) Results from Chillon Review Children at experimental school increased the walking distance to school 389% and children at control increased 17% (P<0.001). Children at experimental school decreased the car distance to school 57.5% and children at control school increased 1.5% (post inter-group P=0.001). Cohen’s d: 1.214 Large effect size (outcome distance)for differences between experimental and control group for the change in the distance by walking between pretest and posttest. Results from Hosking Review Walking increased significantly more in intervention group.
Wen, 2008 Same study included in all reviews
Cluster RCT N=2258 24 primary schools 2 months Australia
Intervention developed within framework of Health Promoting Schools Policy. Included classroom activities: professional development days for teachers, resources to assist
Mode of travel to and from school over 5 days Travel to and from school in a usual week
Results from NICE Review When data was analyzed by cluster, there were no statistically significant

57
classroom learning, information for students, parents and teachers on preparation for secondary school, pedometer-based walking activities and resources on climate change and the comparative costs of active travel and driving a car; development of school Travel Access Guides; monthly newsletters for parents; and improving environments with local councils: officers assisted in reviewing safety and walkability of the schools and their vicinities and then sought to improve any identified barriers to active and safe travel.
Did not indicate extent of student participation e.g. # of days per week.
differences in mean percentages of change in mode of transport to or from school from baseline to follow up between the intervention and control groups. Results from Chillon Review Students walking to/from school increased in both experimental and control schools but more in experimental, 29% vs 19% p=0.05. Students travelling by car to school decreased more in experimental group (42% vs 32%, p=0.14). Cohen’s d: 0.861 Large effect size for differences between the experimental and control group for the change in percentage of students walking to school between pretest and posttest. Results from Hosking Review Greater increase in walking in intervention group compared with control group as reported
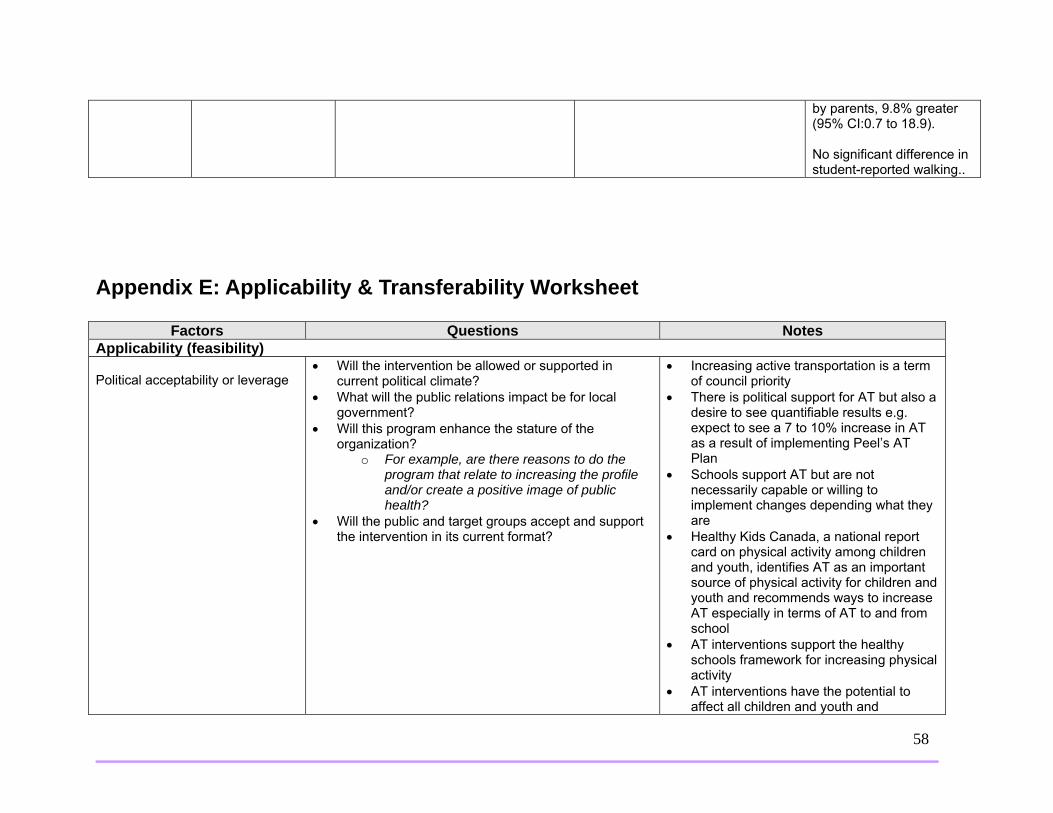
58
by parents, 9.8% greater (95% CI:0.7 to 18.9). No significant difference in student-reported walking..
Appendix E: Applicability & Transferability Worksheet
Factors Questions Notes Applicability (feasibility) Political acceptability or leverage
• Will the intervention be allowed or supported in current political climate?
• What will the public relations impact be for local government?
• Will this program enhance the stature of the organization?
o For example, are there reasons to do the program that relate to increasing the profile and/or create a positive image of public health?
• Will the public and target groups accept and support the intervention in its current format?
• Increasing active transportation is a term of council priority
• There is political support for AT but also a desire to see quantifiable results e.g. expect to see a 7 to 10% increase in AT as a result of implementing Peel’s AT Plan
• Schools support AT but are not necessarily capable or willing to implement changes depending what they are
• Healthy Kids Canada, a national report card on physical activity among children and youth, identifies AT as an important source of physical activity for children and youth and recommends ways to increase AT especially in terms of AT to and from school
• AT interventions support the healthy schools framework for increasing physical activity
• AT interventions have the potential to affect all children and youth and

59
potentially their parents and caregivers should they also choose to participate in AT to school with their kids
• The target group, the school community, should be involved in the AT interventions to encourage acceptance and support of the AT interventions
Social acceptability
• Will the target population find the intervention socially acceptable? Is it ethical?
o Consider how the program would be perceived by the population.
o Consider the language and tone of the key messages.
o Consider any assumptions you might have made about the population. Are they supported by the literature?
o Consider the impact of your program and key messages on non-target groups.
• The interventions will likely be socially acceptable as a whole, however there are other factors that may affect the level of acceptability e.g. concerns about safety and liability, differences in culture, ability of parents to support child participation in AT amidst time constraints,
• The needs of each school community vary and so the interventions should take individual school needs into consideration
• Certain assumptions have been made about why participation in AT is low however issues and barriers have not been specifically studied in Peel
Available essential resources (personnel and financial)
• Who/what is available/essential for the local implementation?
• Are they adequately trained? If not, is training available and affordable?
• What is needed to tailor the intervention locally? • What are the full costs?
o Consider: in-kind staffing, supplies, systems, space requirements for staff, training, and technology/administrative supports.
• Are the incremental health benefits worth the costs of
the intervention? o Consider any available cost-benefit analyses
that could help gauge the health benefits of the intervention.
o Consider the cost of the program relative to the number of people that benefit/receive the intervention.
• Region of Peel staff, particularly Public Health staff and Public Works staff are available for local implementation and should collaborate with school staff and the school community.
• Training will be required for majority of stakeholders.
• School staff, parents and caregivers, including grandparents are essential resources for local implementation
• Authority regarding decisions about the immediate vicinity around schools will help determine what is needed to tailor AT interventions
• Costs and training required will vary depending on chosen AT intervention e.g. costs of a walk to school day would vary from costs of a walking school bus

60
• Eco Schools has chosen active transportation for their theme for the 2013-2014 school year
• AT interventions to school with minimal costs have the potential to be far-reaching e.g. affect all school children and youth
Organizational expertise and capacity
• Is the intervention to be offered in line with Peel Public Health’s 10-Year Strategic Plan (i.e., 2009-2019, ‘Staying Ahead of the Curve’)?
• Does the intervention conform to existing legislation or regulations (either local or provincial)?
• Does the intervention overlap with existing programs or is it symbiotic (i.e., both internally and externally)?
• Does the intervention lend itself to cross-departmental/divisional collaboration?
• Any organizational barriers/structural issues or approval processes to be addressed?
• Is the organization motivated (learning organization)? o Consider organizational capacity/readiness
and internal supports for staff learning.
• AT interventions align with the Supportive Environments for Healthy Living strategic program priority
• Public Works is a very busy department and the Sustainable Transportation team is new
• Staff from multiple areas have high level of interest but other priorities and being in the early stages of this type of work can make collaboration challenging, it is important that all players continue communication in going forward, need to assess capacity in terms of monitoring and evaluation to assess effects of AT interventions
• Opportunities for cross departmental/divisional collaboration need to be explored
• Change management is important as staff collaborate on this new topic area
• Need to better understand our population before design and implementation
• AT interventions overlap with some current initiatives in the community e.g. Mississauga Traffic Safety Council’s walk to school program
• Need to partner in order for AT interventions to be successful
Transferability (generalizability) Magnitude of health issue in local setting
• What is the baseline prevalence of the health issue locally?
• What is the difference in prevalence of the health issue
• 36% of youth aged 12 to 17 are physically inactive1
• Cardio respiratory fitness (CRF) levels
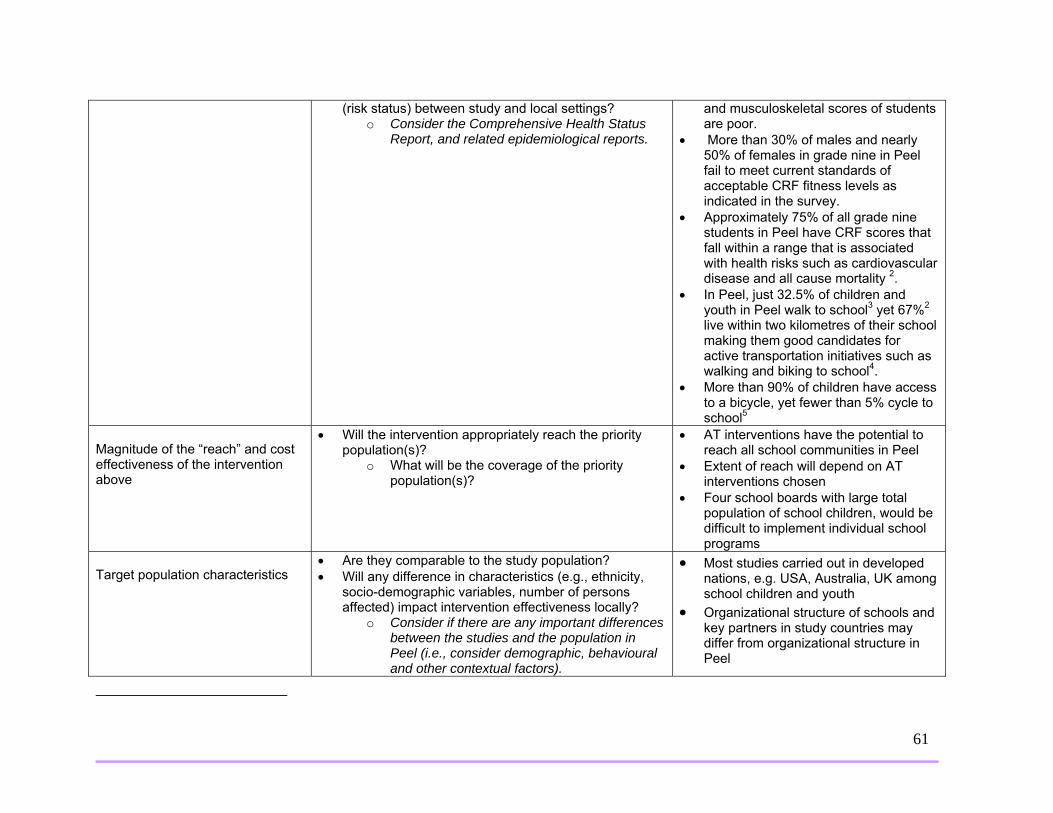
61
(risk status) between study and local settings? o Consider the Comprehensive Health Status
Report, and related epidemiological reports.
and musculoskeletal scores of students are poor.
• More than 30% of males and nearly 50% of females in grade nine in Peel fail to meet current standards of acceptable CRF fitness levels as indicated in the survey.
• Approximately 75% of all grade nine students in Peel have CRF scores that fall within a range that is associated with health risks such as cardiovascular disease and all cause mortality 2.
• In Peel, just 32.5% of children and youth in Peel walk to school3 yet 67%2 live within two kilometres of their school making them good candidates for active transportation initiatives such as walking and biking to school4.
• More than 90% of children have access to a bicycle, yet fewer than 5% cycle to school5
Magnitude of the “reach” and cost effectiveness of the intervention above
• Will the intervention appropriately reach the priority population(s)?
o What will be the coverage of the priority population(s)?
• AT interventions have the potential to reach all school communities in Peel
• Extent of reach will depend on AT interventions chosen
• Four school boards with large total population of school children, would be difficult to implement individual school programs
Target population characteristics
• Are they comparable to the study population? • Will any difference in characteristics (e.g., ethnicity,
socio-demographic variables, number of persons affected) impact intervention effectiveness locally?
o Consider if there are any important differences between the studies and the population in Peel (i.e., consider demographic, behavioural and other contextual factors).
• Most studies carried out in developed nations, e.g. USA, Australia, UK among school children and youth
• Organizational structure of schools and key partners in study countries may differ from organizational structure in Peel
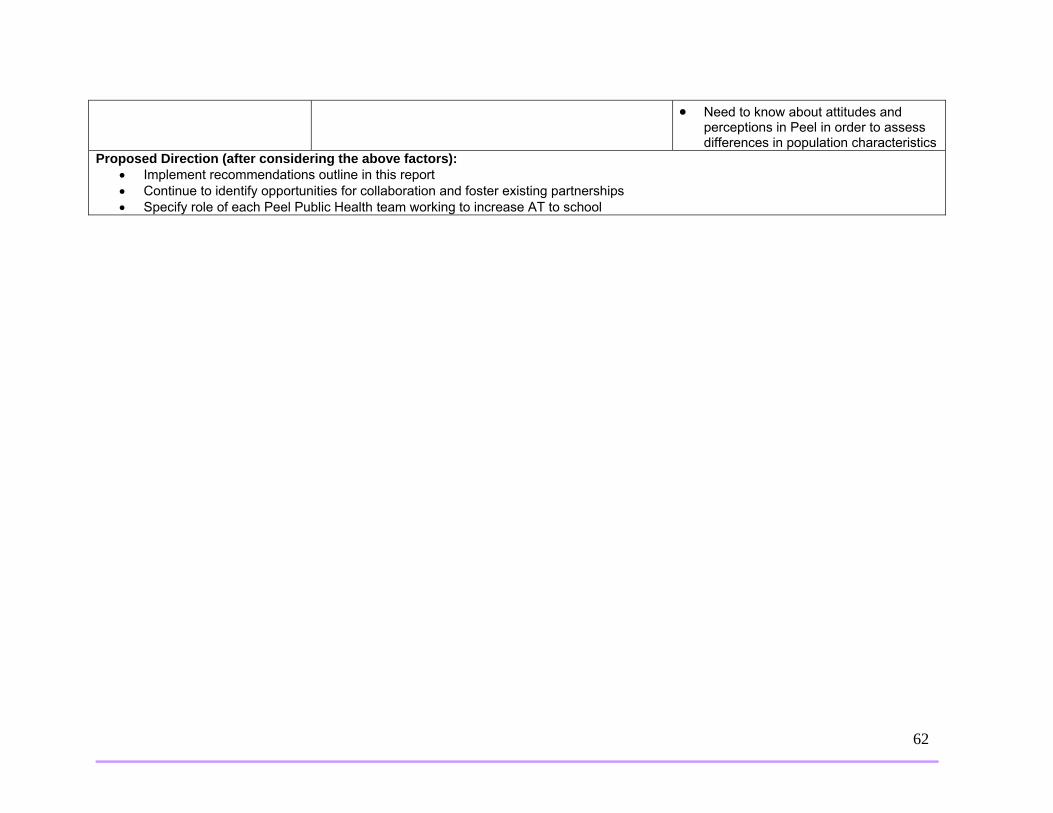
62
• Need to know about attitudes and perceptions in Peel in order to assess differences in population characteristics
Proposed Direction (after considering the above factors): • Implement recommendations outline in this report • Continue to identify opportunities for collaboration and foster existing partnerships • Specify role of each Peel Public Health team working to increase AT to school