Embed Size (px)
Citation preview
INTERSTATE VARIATIONS IN USE OF OPIOIDS,
4TH EDITION
Vennela Thumula
Dongchun Wang
Te-Chun Liu
WC-17-28
June 2017
WORKERS COMPENSATION RESEARCH INSTITUTE CAMBRIDGE, MASSACHUSETTS
copyright © 2017 workers compensation research institute
1
COPYRIGHT © 2017 BY THE WORKERS COMPENSATION RESEARCH INSTITUTE
ALL RIGHTS RESERVED. NO PART OF THIS BOOK MAY BE COPIED OR REPRODUCED IN ANY FORM OR BY ANY MEANS WITHOUT WRITTEN PERMISSION
OF THE WORKERS COMPENSATION RESEARCH INSTITUTE.
ISBN 978-1-61471-702-7
PUBLICATIONS OF THE WORKERS COMPENSATION RESEARCH INSTITUTE DO NOT NECESSARILY REFLECT THE OPINIONS OR POLICIES
OF THE INSTITUTE’S RESEARCH SPONSORS.
copyright © 2017 workers compensation research institute
2
_____________________________________________________________________________________________I N T E R S T A T E V A R I A T I O N S I N U S E O F O P I O I D S , 4 T H E D I T I O N
ACKNOWLEDGMENTS
We would like to thank the technical reviewers of this report, Dr. Jeffrey Harris, Erik Taylor, and David
Feldman. Their thoughtful comments and suggestions not only helped us to improve the accuracy and clarity
of the final report but are also valuable for our future research. Special thanks to Dr. Gary Franklin for his
insightful input on the measurement of chronic opioid use and other aspects of this study. A number of
workers’ compensation practitioners provided valuable comments on this study, including Brendan Sullivan,
Dr. James Melius, John Pedrick, Mark Long, Mark Webb, Dr. Michael Crane, Dr. Richard Johnson, and the
staff at the Minnesota Department of Labor and Industry. We wish to thank them all for their helpful
feedback. This is an update of a previously published study, which reflects the contributions made by many
people, most importantly the coauthors of the previous study—Dr. Kathryn Mueller and Dr. Dean
Hashimoto—and Dr. Rick Victor for his guidance during the early stages of the project. Critical to the study
was the indispensable assistance provided by Dr. Philip Borba and his team at Milliman, Inc., and Eric
Harrison and other colleagues at WCRI. Their contributions, including pharmacy database construction,
programming support, and quality assurance, made this study possible. We also thank Andrew Kenneally, the
communications director at WCRI, for his efforts in disseminating the research findings. Thanks also go to
Sarah Solorzano and Jill McNamee for their superior administrative assistance that helped to improve the
readability and accuracy of the report, and Sarah Solorzano, who expertly managed the review and
publication process.
Finally, our gratitude goes to Ramona Tanabe, executive vice president and counsel of the Institute, and
Dr. John Ruser, president and CEO, for their invaluable input and guidance that shaped this report.
Of course, any errors that remain in the report are the responsibility of the authors.
Vennela Thumula Dongchun Wang
Te-Chun Liu
Cambridge, Massachusetts June 2017
copyright © 2017 workers compensation research institute
3
_____________________________________________________________________________________________I N T E R S T A T E V A R I A T I O N S I N U S E O F O P I O I D S , 4 T H E D I T I O N
TABLE OF CONTENTS
List of Tables 5
List of Figures 7
Executive Summary 8
1. Introduction 19
Scope of this Report 20 Organization of the Report 20
2. Data and Methods 22
Data and Representativeness 22 Identifying and Grouping Opioid Prescriptions 25 Identifying Dispensing Point 27 Measuring Utilization of Opioids 27 Morphine Equivalent Equianalgesic Conversion 30 Sensitivity Analysis for Claim Selection 30 Limitations and Caveats 31
3. Interstate Variations in Use of Opioids 33
4. Temporal Variations in Use of Opioids 43
5. Prescribing Patterns of Opioids 59
6. Implications and Conclusions 71
Statistical Appendix 74
Technical Appendix A: A Brief Summary of Factors That May Influence the Prescribing of Opioids 81
Technical Appendix B: Sensitivity Analysis 94
References 111
copyright © 2017 workers compensation research institute
4
_____________________________________________________________________________________________I N T E R S T A T E V A R I A T I O N S I N U S E O F O P I O I D S , 4 T H E D I T I O N
LIST OF TABLES
2.1 Claims and Prescriptions Included in the Study / 24
2.2 Federal Classification of Controlled Substances / 26
3.1 Interstate Comparisons of Utilization of Opioids, 2013/2015 / 37
3.2 Duration and Average Daily Dose of Opioids for Claims with Opioids, Interstate Comparisons,
2013/2015 / 40
4.1 Changes in Frequency of Use of Opioids, 2010/2012–2013/2015 / 45
4.2 Changes in Utilization of Opioids at Different Percentiles, 2010/2012–2013/2015 / 50
4.3 Changes in Utilization of Opioids, 2010/2012–2013/2015 / 56
4.4 Amount of Opioids per Claim, Overall and by Type of Opioids, 2010/2012–2013/2015 / 57
4.5 Amount of Opioids per Claim, Overall and by Dispensing Point, 2010/2012–2013/2015 / 58
5.1 Prescribing Pattern of Pain Medications, 2013/2015 / 60
5.2 Prescribing Pattern of Pain Medications, 2010/2012–2013/2015 / 63
5.3 Concomitant Use of Opioids and Muscle Relaxants, by Dispensing Point, 2013/2015 / 65
SA.1 Significance Tests for Interstate Comparisons in Utilization of Opioids, 2013/2015 / 74
SA.2 Significance Tests for Changes in Frequency of Use of Opioids, 2010/2012–2013/2015 / 75
SA.3 Interstate Comparisons of Utilization of Opioids, 2013/2015 / 76
SA.4 Duration and Average Daily Dose of Opioids for Claims with Opioids, Interstate Comparisons,
2013/2015 / 77
SA.5 Frequency of Chronic Opioid Use, Interstate Comparisons, 2013/2015 / 78
SA.6 Prescribing Pattern of Pain Medications, 2013/2015 / 79
SA.7 Prevalence of Concomitant Use of Opioids and Other Central Nervous System Drugs among All
Opioid Users and Chronic Opioid Users, 2013/2015 / 80
TA.A1 State Prescription Drug Monitoring Programs / 83
TA.A2 Relationship between Statewide Prescription Drug Monitoring Programs Enrollment, Utilization,
and the Overall Use of Opioids and Schedule II Opioids among the 26 Study States / 86
TA.B1 Odds Ratios from Logistic Regressions Estimating the Likelihood of an Injured Worker with Pain
Medications Receiving Opioids / 98
TA.B2 Odds Ratios from Logistic Regressions Estimating the Likelihood of an Injured Worker with Pain
Medications Receiving Two or More Opioids / 99
TA.B3 Estimates from OLS Regressions for MEA per Claim / 100
TA.B4 Unadjusted and Case-Mix Adjusted Frequency and Amount of Opioid Utilization, Interstate
Comparisons for 2013/2015 / 101
TA.B5 MEA per Claim before and after Excluding Claims with Extreme Values, 2013/2015 / 103
copyright © 2017 workers compensation research institute
5
_____________________________________________________________________________________________I N T E R S T A T E V A R I A T I O N S I N U S E O F O P I O I D S , 4 T H E D I T I O N
TA.B6 Association between MEA per Claim and Percentage of Claims with MEA Greater Than 2,500
Milligrams, 2010/2012–2013/2015 / 107
TA.B7 MEA per Claim at Median and Selected Percentiles after Excluding Claims with Unusually High
Amounts of Opioids, 2013/2015 / 108
TA.B8 Average MEA of Opioids per Claim at Different Maturities, 2013/2015 / 109
TA.B9 Average MEA per Claim with Opioids, by Disability Duration, 2013/2015 / 110
copyright © 2017 workers compensation research institute
6
_____________________________________________________________________________________________I N T E R S T A T E V A R I A T I O N S I N U S E O F O P I O I D S , 4 T H E D I T I O N
LIST OF FIGURES
A Changes in Average MEA per Claim with Opioids, 2010/2012–2013/2015 / 10
B Average MEA per Claim with Opioids, 2013/2015 / 14
3.1 Percentage of Claims with Pain Medications That Had Opioids, 2013/2015 / 34
3.2 Percentage of Claims with Pain Medications That Had Two or More Opioid Prescriptions,
2013/2015 / 34
3.3 Average MEA per Claim with Opioids, 2013/2015 / 36
3.4 Frequency and Amount of Opioid Use, 2013/2015 / 38
4.1 Changes in Average MEA per Claim with Opioids, 2010/2012–2013/2015 / 47
5.1 Percentage of Claims with Opioids That Had Concomitant Use of Central Nervous System
Depressants, 2013/2015 / 66
5.2 Percentage of Claims with Opioids That Had Concomitant Use of Benzodiazepines and Muscle
Relaxants, 2013/2015 / 67
5.3 Change in Percentage of Claims with Opioids That Had Concomitant Use of Central Nervous
System Depressants, 2010/2012 to 2013/2015 / 68
5.4 Percentage of Claims with Opioids That Had Long-Acting Schedule II Opioids, 2013/2015 / 69
5.5 Percentage of Claims with Opioids That Had Long-Acting Schedule II Opioids in the First Three
Months Postinjury, 2013/2015 / 70
TA.B1 Assessing Potential Bias of Selecting Claims with More Than 7 Days of Lost Time / 95
TA.B2 Assessing Potential Bias of Selecting Nonsurgical Claims with More Than 7 Days of Lost Time / 96
TA.B3 Assessing Potential Bias of Selecting Nonsurgical Claims with Opioids / 97
TA.B4 Percentile Distribution of MEA per Claim across 26 Study States, 2013/2015 / 104
TA.B5 Percentage of Claims with Opioid Use with MEA Greater Than 2,500 Milligrams, 2013/2015 / 105
copyright © 2017 workers compensation research institute
7
_____________________________________________________________________________________________I N T E R S T A T E V A R I A T I O N S I N U S E O F O P I O I D S , 4 T H E D I T I O N
EXECUTIVE SUMMARY
The dangers of unnecessary opioid1 prescriptions resulting in overdose deaths and addiction continue to be a
top priority public health problem in the United States. These growing public concerns are shared by the
workers’ compensation community where injured workers are commonly prescribed opioids, despite
guideline recommendations to avoid routine prescriptions and to limit the use of opioids for more severe
pain or pain refractory to other analgesics.2 To address the concerns, numerous legislative and regulatory
changes were implemented at the federal and state levels in recent years.3 This study examines the interstate
variations and trends in the use of opioids and prescribing patterns of pain medications across 26 workers’
compensation jurisdictions covering data from October 2009 through March 2015.4,5 This information
should be useful for (1) state officials who wonder if injured workers in their state are receiving unusual
amounts of opioids, (2) injured workers and worker advocates looking to understand the extent of the
problem in their state, (3) providers who wonder what the prescribing norms in their state may be and if the
state norms are unusual, and (4) payors and managed care companies looking to set priorities for targeting
opioid management programs. This report also serves as a tool to monitor the results of the ongoing policy
changes that have been directed at opioid prescribing and dispensing.
SUMMARY OF MAJOR FINDINGS
In the previous edition of this study, we reported noteworthy reductions in the amount of opioids received by
injured workers across several states.6 With one more year of data, we continued to observe decreases in
opioid utilization in the majority of states. The decreases were substantial in several states, including
Kentucky, Maryland, Michigan, and New York. The sustained reduction in opioid utilization may be
associated with numerous changes in opioid policies in recent years. However, the utilization of opioids
remained higher in several states.
1 The term opioids used in this report refers to prescription opioids for pain relief, including natural (codeine, morphine), semisynthetic (hydrocodone, oxycodone, etc.), and synthetic (tramadol, methadone, fentanyl) opioids. 2 Moreover, there is little evidence about the effectiveness of opioids for the treatment of chronic pain (see Technical Appendix A). 3 See Technical Appendix A for a discussion of the legislative, regulatory, and industry changes that address opioid prescribing and dispensing. 4 The measures are based on nonsurgical claims with more than seven days of lost time with injuries from October 1, 2009, through September 30, 2013, and prescriptions filled through March 31, 2015, which captures an average 24 months of experience. The average 24 months of experience used in this study may not capture the full utilization of opioids, especially for chronic pain cases, because certain types of opioids are typically used more often at a later stage of medical treatment. 5 The 26 states are Arkansas, California, Connecticut, Florida, Georgia, Illinois, Indiana, Iowa, Kansas, Kentucky, Louisiana, Maryland, Massachusetts, Michigan, Minnesota, Missouri, Nevada, New Jersey, New York, North Carolina, Pennsylvania, South Carolina, Tennessee, Texas, Virginia, and Wisconsin. These states represent over two-thirds of the workers’ compensation benefits paid in the United States. 6 The previous edition of this study covered data from October 2009 through March 2014, and we reported substantial reductions in the amount of opioids received by injured workers in several states over the study period. With a few exceptions, the qualitative findings on interstate variations have not changed. See Thumula, Wang, and Liu (2016).
copyright © 2017 workers compensation research institute
8
_____________________________________________________________________________________________I N T E R S T A T E V A R I A T I O N S I N U S E O F O P I O I D S , 4 T H E D I T I O N
TRENDS IN OPIOID USE
Between 2010/2012 and 2013/2015,7 we observed noticeable decreases in opioid utilization among
nonsurgical claims with more than seven days of lost time in the majority of study states. Other studies
outside workers’ compensation also noted a reversal in trends of opioid prescribing over this period, after
a consistent and rapid increase starting in the 1990s.8 This turning point may be associated with the
numerous changes made at the federal, state, and organization levels in recent years to combat opioid
overuse and abuse. While determining key factors attributable to the changes we observed in this study
requires more rigorous analysis, we note major legislative or regulatory policy changes addressing opioid
prescribing and dispensing that occurred over the study period, which provides context to the readers in
interpreting the results.9
The percentage of injured workers receiving opioids for pain relief decreased in half of the study states.
Larger reductions were seen in Kentucky (16 percentage point decrease) and New York (9 percentage
point decrease), two states that implemented major reforms over the study period aimed at reducing
unnecessary opioid prescribing and dispensing. Kentucky’s comprehensive legislation House Bill (HB) 1,
which went into effect in July 2012,10 regulated pain clinics and established standards for the dispensing
and prescribing of opioids, including mandating prescription drug monitoring program (PDMP) use.
The study period also saw several reforms in New York at the state level11 as well as reforms specific to
workers’ compensation.12 Examples include mandatory PDMP use, up-scheduling of hydrocodone-
containing products, and the adoption of medical treatment guidelines. Louisiana, Maryland, Nevada,
New Jersey, and Tennessee had decreases of 5–6 percentage points. Note that there were no material
changes in the percentage of injured workers with a prescription that received pain medications in these
states, indicating that many injured workers continued to receive medications for pain relief, but some
may have received non-opioid pain medications instead of opioids.13
7 2013/2015 refers to nonsurgical claims with more than seven days of lost time with injuries from October 1, 2012, through September 30, 2013, and prescriptions filled through March 31, 2015. Similar notation is used for 2010/2012. 8 Dart et al. (2015) and Ahmedani et al. (2014). 9 This report does not provide a comprehensive listing of all federal, state, and organization efforts addressing prescription opioids. We focus on major state-level legislative and regulatory changes and workers’ compensation-specific reforms because of our focus on workers’ compensation policy issues. Medicaid and group health insurers also implemented programs aimed at reducing opioid prescriptions during this period, which may influence the prescribing practices of some physicians treating workers’ compensation patients. The heightened awareness of the opioid epidemic may have resulted in changes in the practices of various entities in the health care delivery system (e.g., health care groups and pharmacy benefit managers), which may also contribute to the decreasing trend in opioid prescriptions. 10 Kentucky’s HB 1 regulated pain clinics and established professional standards for prescribers and dispensers of controlled substances, including mandating that all prescribers and dispensers register with the state prescription drug monitoring program, the Kentucky All Schedule Prescription Electronic Reporting Program (KASPER), and query KASPER prior to prescribing Schedule II controlled substances and hydrocodone-combination products at specified intervals. 11 In New York, the Internet System for Tracking Over-Prescribing (I-STOP) legislation was passed to mandate that physicians check the PDMP database prior to prescribing opioids starting in August 2013. New York also rescheduled hydrocodone-containing products to Schedule II in February 2013, which led to a decrease in the hydrocodone-acetaminophen prescribing rate, as discussed later in Chapter 5. 12 In 2010, the New York State Workers’ Compensation Board adopted guidelines that include recommendations for opioid use for treating injuries by body part, which contain quantity limits. The Board also adopted non-acute pain medical treatment guidelines effective December 2014. 13 Several guidelines address opioid prescribing for acute, sub-acute, and chronic pain. These guidelines generally recommend non-pharmacologic pain modalities and non-opioid pharmacologic treatment prior to prescribing opioids. See Technical Appendix A.
copyright © 2017 workers compensation research institute
9
_____________________________________________________________________________________________I N T E R S T A T E V A R I A T I O N S I N U S E O F O P I O I D S , 4 T H E D I T I O N
-1,500
-1,000
-500
0
500
1,000
1,500
2,000
2,500
3,000
3,500
4,000
MO IA WI IN NJ AR MN KS IL FL TN VA NV CT MI GA TX NC SC CA KY MA MD PA NY LA
Ave
rag
e M
EA p
er C
laim
wit
h O
pio
ids
(mill
igra
ms)
Average MEA per Claim, 2010/2012 Difference between 2010/2012 and 2013/2015 Claims
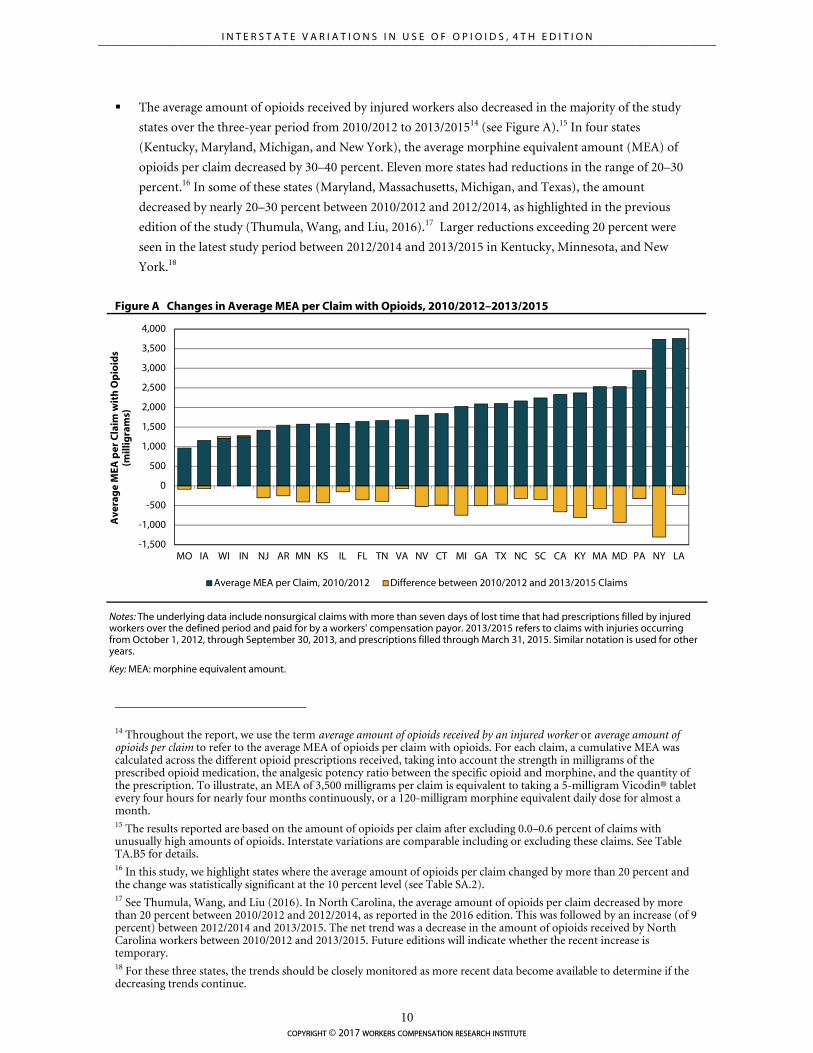
The average amount of opioids received by injured workers also decreased in the majority of the study
states over the three-year period from 2010/2012 to 2013/201514 (see Figure A).15 In four states
(Kentucky, Maryland, Michigan, and New York), the average morphine equivalent amount (MEA) of
opioids per claim decreased by 30–40 percent. Eleven more states had reductions in the range of 20–30
percent.16 In some of these states (Maryland, Massachusetts, Michigan, and Texas), the amount
decreased by nearly 20–30 percent between 2010/2012 and 2012/2014, as highlighted in the previous
edition of the study (Thumula, Wang, and Liu, 2016).17 Larger reductions exceeding 20 percent were
seen in the latest study period between 2012/2014 and 2013/2015 in Kentucky, Minnesota, and New
York.18
Figure A Changes in Average MEA per Claim with Opioids, 2010/2012–2013/2015
Notes: The underlying data include nonsurgical claims with more than seven days of lost time that had prescriptions filled by injured workers over the defined period and paid for by a workers' compensation payor. 2013/2015 refers to claims with injuries occurring from October 1, 2012, through September 30, 2013, and prescriptions filled through March 31, 2015. Similar notation is used for other years.
Key: MEA: morphine equivalent amount.
14 Throughout the report, we use the term average amount of opioids received by an injured worker or average amount of opioids per claim to refer to the average MEA of opioids per claim with opioids. For each claim, a cumulative MEA was calculated across the different opioid prescriptions received, taking into account the strength in milligrams of the prescribed opioid medication, the analgesic potency ratio between the specific opioid and morphine, and the quantity of the prescription. To illustrate, an MEA of 3,500 milligrams per claim is equivalent to taking a 5-milligram Vicodin® tablet every four hours for nearly four months continuously, or a 120-milligram morphine equivalent daily dose for almost a month. 15 The results reported are based on the amount of opioids per claim after excluding 0.0–0.6 percent of claims with unusually high amounts of opioids. Interstate variations are comparable including or excluding these claims. See Table TA.B5 for details. 16 In this study, we highlight states where the average amount of opioids per claim changed by more than 20 percent and the change was statistically significant at the 10 percent level (see Table SA.2). 17 See Thumula, Wang, and Liu (2016). In North Carolina, the average amount of opioids per claim decreased by more than 20 percent between 2010/2012 and 2012/2014, as reported in the 2016 edition. This was followed by an increase (of 9 percent) between 2012/2014 and 2013/2015. The net trend was a decrease in the amount of opioids received by North Carolina workers between 2010/2012 and 2013/2015. Future editions will indicate whether the recent increase is temporary. 18 For these three states, the trends should be closely monitored as more recent data become available to determine if the decreasing trends continue.
copyright © 2017 workers compensation research institute
10
_____________________________________________________________________________________________I N T E R S T A T E V A R I A T I O N S I N U S E O F O P I O I D S , 4 T H E D I T I O N
Kentucky: Between 2010/2012 and 2013/2015, the average amount of opioids dropped by 34 percent
while the median amount decreased by 25 percent. The average amount peaked in 2011/2013 and
decreased over the next two years. The decrease was due to fewer opioid prescriptions dispensed per
claim, whereas the number of pills per prescription remained unchanged. Although physician
dispensing of opioids was infrequent in Kentucky, we observed sizable reductions in opioids
dispensed at physicians’ offices.
The decrease in opioid utilization may be associated with Kentucky implementing the
comprehensive legislation HB 1, effective July 2012.19 HB 1 established mandatory professional
standards for prescribers and dispensers of controlled substances, including requiring all prescribers
and dispensers to register with the state PDMP, the Kentucky All Schedule Prescription Electronic
Reporting Program (KASPER), and query KASPER prior to prescribing Schedule II controlled
substances and hydrocodone-combination products at specified intervals. Other provisions include
limiting routine physician dispensing of Schedule II or Schedule III opioids to a 48-hour supply and
requiring continuing education in pain management, addiction disorders, or electronic monitoring.
The law also set ownership and oversight requirements for pain management facilities with criminal
sanctions for violation of these requirements.
Maryland: We saw a decrease in the average amount of opioids over the three-year period, from
2,532 morphine equivalent milligrams in 2010/2012 to 1,599 milligrams in 2013/2015, a 37 percent
reduction. In the latest study period, between 2012/2014 and 2013/2015, the average and median
amounts decreased by 14 and 11 percent, respectively.20 The downward trend appeared to be
consistent with the implementation of the state PDMP in December 2013 and a subsequent increase
in registration with and use of the PDMP.21
The average amount of opioids also decreased (by 26 percent) between 2010/2012 and
2011/2013, but there was little change in the median amount. These results indicate that the trend
over this period was driven by large reductions among claims receiving higher amounts of opioids.
We are not aware of major policy initiatives that were implemented in the earlier part of the study
period.
Michigan: We found steady decreases in the average and median amounts of opioids per claim (37
percent and 16 percent, respectively) over the three-year period. The 37 percent drop followed an
increase between 2008/2010 and 2010/2012, as reported in the second edition of this study. The
decrease was due to reductions in the average number of prescriptions and pills per claim across
dispensers.
We noted several policy initiatives over the study period that may have contributed to the
decrease. Michigan is the only state that provides private payors, including workers’ compensation
payors, access to the state PDMP for the purpose of ensuring patient safety and investigating fraud
and abuse.22 More recently, the Michigan Workers’ Compensation Agency amended the
19 Kentucky HB 1 can be accessed at http://kbml.ky.gov/hb1/Documents/House-Bill-1.pdf. HB 217, the subsequent clean-up bill, can be accessed http://www.lrc.ky.gov/record/13RS/HB217/bill.doc. 20 We report two sets of measures because the distribution of morphine equivalent amounts per claim is skewed by relatively few claims with very high use of opioids. 21 The Maryland PDMP implementation and operations update can be accessed at http://bha.dhmh.maryland.gov/pdmp/Documents/BHA%20Prescription%20Drug%20Monitoring%20ProgramFinal%20Signed120815OGA1655.pdf. 22 In Michigan, health care payment or benefit providers are allowed to access the state PDMP, as per the public health code, Act 368. Although this provision has been effective since 2002, the use of the state PDMP by workers’ compensation payors and benefit providers may have increased over the study period due to increasing attention to the risks associated
copyright © 2017 workers compensation research institute
11
_____________________________________________________________________________________________I N T E R S T A T E V A R I A T I O N S I N U S E O F O P I O I D S , 4 T H E D I T I O N
reimbursement rules for opioid prescriptions. Effective December 26, 2014, the amended rules
require that opioid treatment beyond 90 days for non-cancer related chronic pain not be reimbursed
unless detailed physician reporting requirements and other processes are met. The new rules also
provide incentives for compliance with the requirement—a provider may bill for the additional
services required for reporting beyond 90 days and for accessing the state PDMP (a.k.a., MAPS) or
other PDMPs in the treating jurisdiction.23
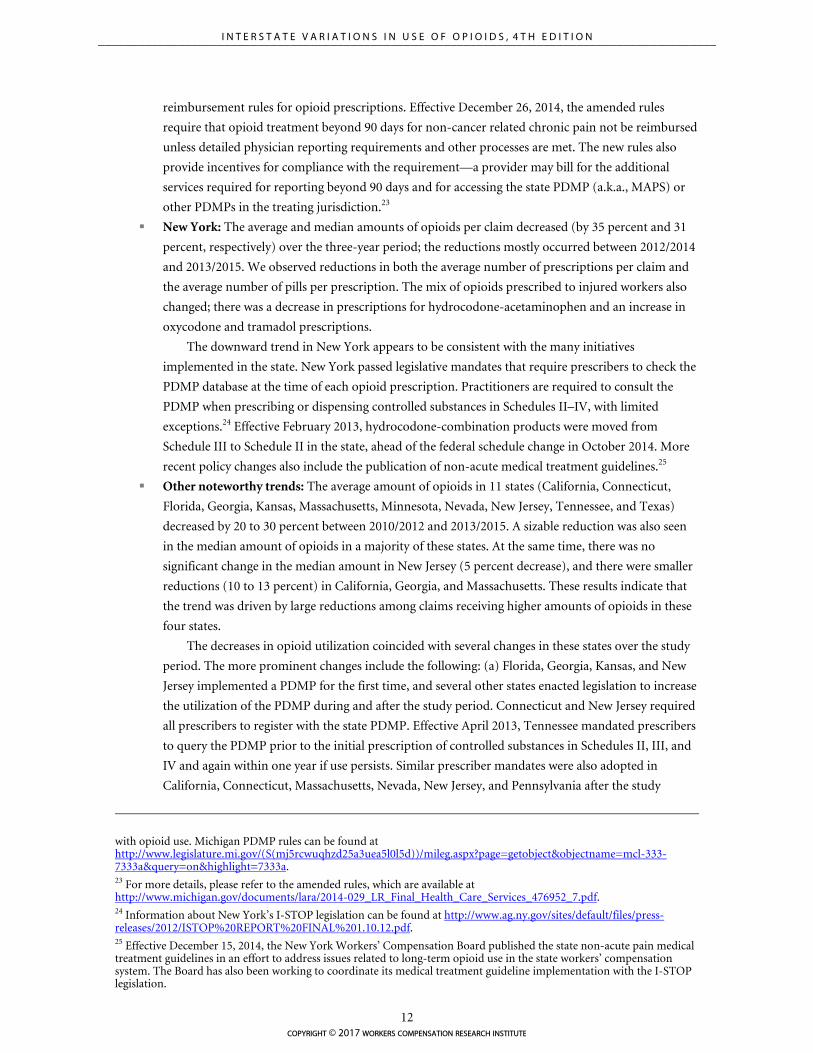
New York: The average and median amounts of opioids per claim decreased (by 35 percent and 31
percent, respectively) over the three-year period; the reductions mostly occurred between 2012/2014
and 2013/2015. We observed reductions in both the average number of prescriptions per claim and
the average number of pills per prescription. The mix of opioids prescribed to injured workers also
changed; there was a decrease in prescriptions for hydrocodone-acetaminophen and an increase in
oxycodone and tramadol prescriptions.
The downward trend in New York appears to be consistent with the many initiatives
implemented in the state. New York passed legislative mandates that require prescribers to check the
PDMP database at the time of each opioid prescription. Practitioners are required to consult the
PDMP when prescribing or dispensing controlled substances in Schedules II–IV, with limited
exceptions.24 Effective February 2013, hydrocodone-combination products were moved from
Schedule III to Schedule II in the state, ahead of the federal schedule change in October 2014. More
recent policy changes also include the publication of non-acute medical treatment guidelines.25
Other noteworthy trends: The average amount of opioids in 11 states (California, Connecticut,
Florida, Georgia, Kansas, Massachusetts, Minnesota, Nevada, New Jersey, Tennessee, and Texas)
decreased by 20 to 30 percent between 2010/2012 and 2013/2015. A sizable reduction was also seen
in the median amount of opioids in a majority of these states. At the same time, there was no
significant change in the median amount in New Jersey (5 percent decrease), and there were smaller
reductions (10 to 13 percent) in California, Georgia, and Massachusetts. These results indicate that
the trend was driven by large reductions among claims receiving higher amounts of opioids in these
four states.
The decreases in opioid utilization coincided with several changes in these states over the study
period. The more prominent changes include the following: (a) Florida, Georgia, Kansas, and New
Jersey implemented a PDMP for the first time, and several other states enacted legislation to increase
the utilization of the PDMP during and after the study period. Connecticut and New Jersey required
all prescribers to register with the state PDMP. Effective April 2013, Tennessee mandated prescribers
to query the PDMP prior to the initial prescription of controlled substances in Schedules II, III, and
IV and again within one year if use persists. Similar prescriber mandates were also adopted in
California, Connecticut, Massachusetts, Nevada, New Jersey, and Pennsylvania after the study
with opioid use. Michigan PDMP rules can be found at http://www.legislature.mi.gov/(S(mj5rcwuqhzd25a3uea5l0l5d))/mileg.aspx?page=getobject&objectname=mcl-333-7333a&query=on&highlight=7333a. 23 For more details, please refer to the amended rules, which are available at http://www.michigan.gov/documents/lara/2014-029_LR_Final_Health_Care_Services_476952_7.pdf. 24 Information about New York’s I-STOP legislation can be found at http://www.ag.ny.gov/sites/default/files/press-releases/2012/ISTOP%20REPORT%20FINAL%201.10.12.pdf. 25 Effective December 15, 2014, the New York Workers’ Compensation Board published the state non-acute pain medical treatment guidelines in an effort to address issues related to long-term opioid use in the state workers’ compensation system. The Board has also been working to coordinate its medical treatment guideline implementation with the I-STOP legislation.
copyright © 2017 workers compensation research institute
12
_____________________________________________________________________________________________I N T E R S T A T E V A R I A T I O N S I N U S E O F O P I O I D S , 4 T H E D I T I O N
period. (b) Massachusetts and Connecticut adopted chronic pain treatment guidelines over the
study period. (c) Kentucky, Massachusetts, New Jersey, and Texas adopted legislation or regulations
mandating continuing education focusing on appropriate opioid prescribing and pain management
for licensees.26 (d) Florida and Texas regulated pain clinics. (e) A state-mandated workers’
compensation drug formulary was implemented in Texas during the study period. An evidence-
based drug formulary was also introduced in Tennessee and Nevada in 2016 and is anticipated to be
implemented in California in January 2018. (f) Florida and Tennessee enacted legislations limiting
the types of prescribers and the length of time, respectively, for certain opioids. (g) In recent years, a
number of states have also made efforts to address the opioid issues in a more comprehensive and
coordinated way. For example, Nevada and Minnesota were among the states that participated in the
National Governors Association (NGA) Prescription Drug Abuse Reductions Policy Academy in
2014.27 Chapter 4 and Technical Appendix A provide additional information about state policies and
initiatives regarding opioids to facilitate the interpretation of the results.
Note that, in the 2016 study, we reported an increase in the average amount of opioids received
by Wisconsin workers. With additional data covering one more year, we found that the increase
observed between 2010/2012 and 2012/2014 was temporary.
INTERSTATE VARIATIONS IN OPIOID USE
Opioid use continued to be prevalent among nonsurgical claims with more than seven days of lost time.
In 2013/2015, about 65 to 75 percent of these injured workers with pain medications received opioids in
most states. The proportion was slightly higher in Arkansas (85 percent), Louisiana (80 percent), and
South Carolina (80 percent). It was high even in states with lower prevalence among the 26 study states:
New Jersey (52 percent) and Illinois (56 percent).
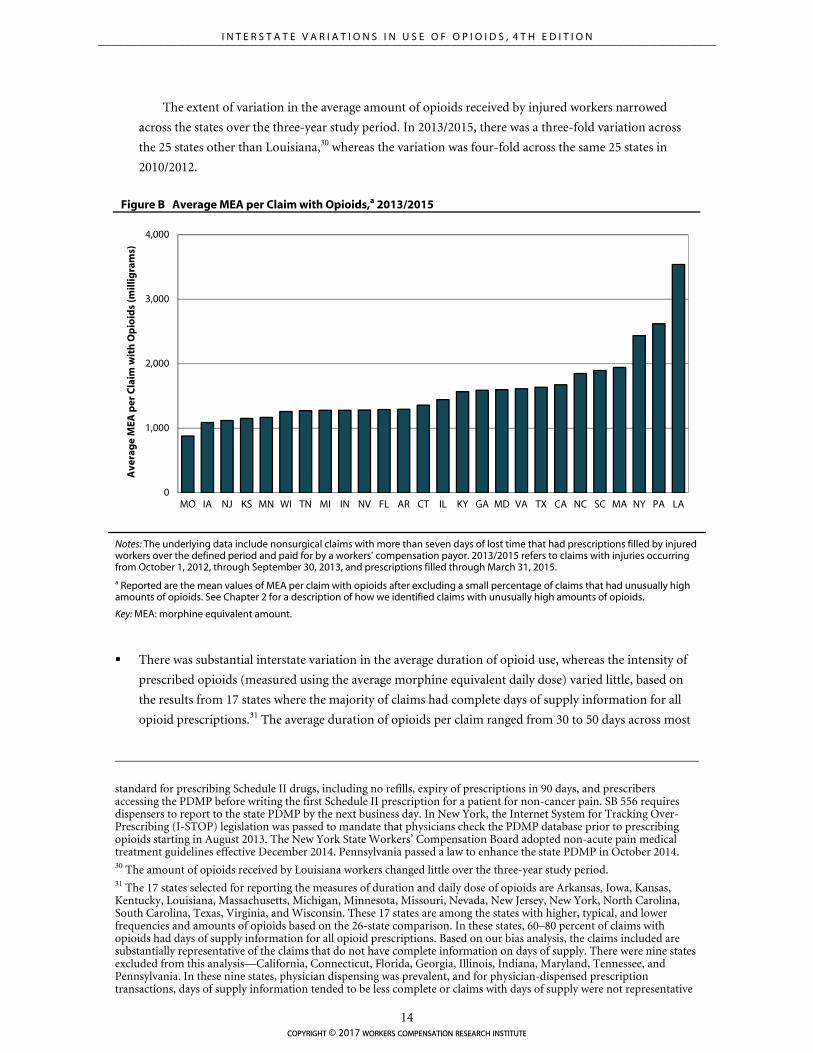
The average amounts of opioids received in Louisiana, New York, and Pennsylvania continued to be the
highest among the 26 study states for 2013/2015 claims with opioids (see Figure B).28 Although New York
is among the states with a higher-than-typical amount, it is important to note the substantial decrease in
both the frequency and amount of opioids in New York over the three-year study period.
In Louisiana, the average MEA per claim was over 3,500 milligrams, which was double that in the
median state and four times that in the state with the lowest use, Missouri. Pennsylvania and New York
also had higher average amounts of opioids of over 2,400 milligrams—74 to 87 percent higher than the
median state. Considering our underlying sample of nonsurgical claims, the amount of opioids dispensed
to the average injured worker in Louisiana, New York, and Pennsylvania is striking.29
26 See the Pain & Policy Study Group (PPSG) report entitled Achieving Balance in State Pain Policy: A Progress Report Card (CY 2013). The report is available at http://www.acscan.org/content/wp-content/uploads/2014/07/PRC-2013.pdf. 27 Seven states participated when the academy was first launched in 2012, including Alabama, Arkansas, Colorado, Kentucky, New Mexico, Oregon, and Virginia. Michigan, Minnesota, Nevada, North Carolina, and Vermont were among the states participating in the academy in 2014. The academy has since published several papers to discuss lessons learned from the participating states and provide strategic action plan recommendations. See Reducing Prescription Drug Abuse: Lessons Learned from an NGA Policy Academy (2014) and Finding Solutions to the Prescription Opioid and Heroin Crisis: A Road Map for States (2016). 28 One may suspect that these states may have more serious injuries or a different mix of cases. However, we did a sensitivity analysis adjusting for differences across states in the case mix and the comparative results did not change. 29 Louisiana, New York, and Pennsylvania adopted reforms addressing opioids in recent years. The data presented in this report are predominantly prior to the effective dates of some of these changes. In Louisiana, the revised Workers’ Compensation Act in 2009 by the state legislature resulted in the creation of medical guidelines, including guidelines for chronic pain disorders, effective January 2011. Louisiana adopted several other changes related to controlled substance use in the 2014 legislature, including Senate Bill (SB) 496 and SB 556, which became effective in August 2014. SB 496 set a
copyright © 2017 workers compensation research institute
13
_____________________________________________________________________________________________I N T E R S T A T E V A R I A T I O N S I N U S E O F O P I O I D S , 4 T H E D I T I O N
0
1,000
2,000
3,000
4,000
MO IA NJ KS MN WI TN MI IN NV FL AR CT IL KY GA MD VA TX CA NC SC MA NY PA LA
Ave
rag
e M
EA p
er C
laim
wit
h O
pio
ids
(mill
igra
ms)
The extent of variation in the average amount of opioids received by injured workers narrowed
across the states over the three-year study period. In 2013/2015, there was a three-fold variation across
the 25 states other than Louisiana,30 whereas the variation was four-fold across the same 25 states in
2010/2012.
Figure B Average MEA per Claim with Opioids,a 2013/2015
Notes: The underlying data include nonsurgical claims with more than seven days of lost time that had prescriptions filled by injured workers over the defined period and paid for by a workers' compensation payor. 2013/2015 refers to claims with injuries occurring from October 1, 2012, through September 30, 2013, and prescriptions filled through March 31, 2015. a Reported are the mean values of MEA per claim with opioids after excluding a small percentage of claims that had unusually high amounts of opioids. See Chapter 2 for a description of how we identified claims with unusually high amounts of opioids.
Key: MEA: morphine equivalent amount.
There was substantial interstate variation in the average duration of opioid use, whereas the intensity of
prescribed opioids (measured using the average morphine equivalent daily dose) varied little, based on
the results from 17 states where the majority of claims had complete days of supply information for all
opioid prescriptions.31 The average duration of opioids per claim ranged from 30 to 50 days across most
standard for prescribing Schedule II drugs, including no refills, expiry of prescriptions in 90 days, and prescribers accessing the PDMP before writing the first Schedule II prescription for a patient for non-cancer pain. SB 556 requires dispensers to report to the state PDMP by the next business day. In New York, the Internet System for Tracking Over-Prescribing (I-STOP) legislation was passed to mandate that physicians check the PDMP database prior to prescribing opioids starting in August 2013. The New York State Workers’ Compensation Board adopted non-acute pain medical treatment guidelines effective December 2014. Pennsylvania passed a law to enhance the state PDMP in October 2014. 30 The amount of opioids received by Louisiana workers changed little over the three-year study period. 31 The 17 states selected for reporting the measures of duration and daily dose of opioids are Arkansas, Iowa, Kansas, Kentucky, Louisiana, Massachusetts, Michigan, Minnesota, Missouri, Nevada, New Jersey, New York, North Carolina, South Carolina, Texas, Virginia, and Wisconsin. These 17 states are among the states with higher, typical, and lower frequencies and amounts of opioids based on the 26-state comparison. In these states, 60–80 percent of claims with opioids had days of supply information for all opioid prescriptions. Based on our bias analysis, the claims included are substantially representative of the claims that do not have complete information on days of supply. There were nine states excluded from this analysis—California, Connecticut, Florida, Georgia, Illinois, Indiana, Maryland, Tennessee, and Pennsylvania. In these nine states, physician dispensing was prevalent, and for physician-dispensed prescription transactions, days of supply information tended to be less complete or claims with days of supply were not representative
copyright © 2017 workers compensation research institute
14
_____________________________________________________________________________________________I N T E R S T A T E V A R I A T I O N S I N U S E O F O P I O I D S , 4 T H E D I T I O N
states.32 Consistent with the finding of a higher average amount of opioids per claim, we found that the
average duration was higher in Louisiana (104 days, on average, compared with 44 days in the 17-state
median). The figure was also higher in New York, South Carolina, and Texas (55–63 days).
Large differences were also seen in the frequency of claims receiving opioids on a chronic basis and
at higher doses.33 For 2013/2015 claims with opioids, 7–13 percent received at least 60 days of opioids
supply over any 90-day period (our measure of chronic opioid use) in 9 of the 17 states. The proportion
was higher in Louisiana (29 percent) and more than one in seven in Kentucky, Massachusetts, Michigan,
New York, North Carolina, South Carolina, and Texas (15–19 percent). Note that some of these injured
workers could have had one such 90-day episode where they received opioids for at least 60 days, while
others could have had multiple episodes.34
A sizable proportion of Louisiana and New York claims received high-dose opioids for at least 60
days during the study period. Among injured workers receiving opioids in these two states, 5–6 percent
had a morphine equivalent daily dose (MED) exceeding 50 milligrams for at least 60 days during the
study period. In New York, 2.3 percent of injured workers had an MED exceeding 90 milligrams for at
least 60 days.35
Many factors may be associated with the interstate variations we observed, including the differences
across states in the mix of cases and injury severity, workers’ compensation policies for pharmaceuticals
(e.g., pharmacy fee schedules, physician dispensing, provider choice, and treatment guidelines for pain
management), policies outside workers’ compensation (e.g., state PDMPs and state pain policies), and
industry practices. While analyzing the impact of these factors is beyond the scope of this study, we
provide some background information that may help the reader interpret the results (see Technical
Appendix A).
NOTEWORTHY PRESCRIBING PATTERNS
There were substantial interstate variations in the type of pain medications that were prescribed across
the 26 study states. Physicians in some states were more likely to prescribe opioids and stronger opioids,
such as oxycodone, compared with their counterparts in other states.36 In 2013/2015, the percentage of
of all claims with opioids. Readers interested in the interstate variations and trends in the use of opioids on a longer-term basis across the 26 states may refer to the study Longer-Term Dispensing of Opioids, 4th Edition (Wang, 2017). 32 Throughout the report, we use the term average duration of opioids per claim or average number of opioid days per claim to refer to the average number of days for which the injured worker was dispensed opioids. 33 The metrics used to characterize chronic opioid use and high-dose opioid use are consistent with the measures proposed by the Washington State Dr. Robert Bree Collaborative and the Washington State Agency Medical Directors’ Group. Chronic opioid use is defined as receiving opioids for at least 60 days over any continuous 90-day period, and high-dose opioid use is defined as receiving an opioid daily dose of more than 50 and 90 morphine equivalent milligrams for at least 60 days during the average 24-month observation period. See Chapter 2 for details. 34 Table SA.5 provides the frequency of injured workers with multiple episodes of chronic opioid therapy. Among injured workers receiving opioids, we observed a relatively smaller interstate variation in those with only one 90-day period with chronic opioid therapy (4–10 percent) compared with those with multiple episodes (2–20 percent). 35 The Centers for Disease Control and Prevention (CDC) guidelines for prescribing opioids for chronic pain caution prescribers to reassess the risks and benefits to the patient when prescribing an MED exceeding 50 milligrams and to avoid an MED exceeding 90 milligrams; they recommend tapering if the dose exceeds 90 milligrams MED. Higher daily dose limits are recommended by some other state guidelines (e.g., the Massachusetts Chronic Pain Treatment Guidelines recommend a maximum daily dose of 120 milligrams MED). Table TA.B1 in Longer-Term Dispensing of Opioids, 4th Edition (Wang, 2017) provides the maximum daily dose recommendations of select guidelines used in and outside workers’ compensation. Higher limits recommended by other guidelines may understate the potential harm of high-dose opioid therapy in our population of injured workers without a major surgery evaluated at an average 24 months’ maturity. 36 We refer to oxycodone as a stronger opioid in this study to convey the relative strength of oxycodone prescriptions compared with other commonly dispensed opioids like hydrocodone-acetaminophen and tramadol. It is possible that
copyright © 2017 workers compensation research institute
15
_____________________________________________________________________________________________I N T E R S T A T E V A R I A T I O N S I N U S E O F O P I O I D S , 4 T H E D I T I O N
all pain medication prescriptions for non-opioid analgesics varied from one-third in Arkansas and
Louisiana to more than 50 percent in California, Florida, Illinois, and New Jersey. On the other hand,
pain medication prescriptions for oxycodone (Percocet® and OxyContin®) varied from 1 to 2 percent in
California, Illinois, and Texas to 30 percent in Massachusetts. These prescribing patterns changed
considerably between 2010/2012 and 2013/2015 in most states.
The percentage of pain medication prescriptions for non-opioid pain medications increased over the
study period, i.e., pain medication prescriptions for opioids decreased in most states. Kentucky and
New York had the highest increases in the share of non-opioid pain medications (12–14 percentage
points). Other states with increases were Arkansas, Connecticut, Maryland, Massachusetts, Nevada,
New Jersey, Pennsylvania, Tennessee, and Virginia (5–8 percentage points).
Over the three-year period, there was a noticeable decrease in the proportion of pain medication
prescriptions for hydrocodone-acetaminophen (Vicodin®) in most study states. There was a notable
drop of 11 percentage points in the proportion of pain medications for hydrocodone-
acetaminophen in Kentucky and New York, both states with an increase in the proportion of non-
opioid pain medications. These changes may be partly associated with the two states mandating
prescribers to query the PDMP prior to prescribing hydrocodone-acetaminophen and other
controlled substances. New York also up-scheduled hydrocodone-acetaminophen from Schedule III
to Schedule II effective February 2013. California, Connecticut, Florida, Minnesota, Nevada, and
Virginia had 5–6 percentage point decreases in the share of pain medication prescriptions for
hydrocodone-acetaminophen. Closer to the end of the study period in October 2014, the Drug
Enforcement Administration (DEA) changed the schedule of hydrocodone-combination products
from III to II. This downward trend may continue in several states when we update this study with
more recent data. Our findings are consistent with other studies that reported a decrease in
prescriptions for hydrocodone-combination products after the federal rescheduling.37
Five states (California, Florida, Iowa, Indiana, and Texas) had 5–7 percentage point increases in the
percentage of pain medication prescriptions for tramadol (Ultram® and Ultracet®). Tramadol was
the only opioid that was not scheduled at the federal level during most of the study period.38 In
August 2014, the DEA classified tramadol as a Schedule IV drug.39
Among injured workers with opioids, we observed concomitant use of other central nervous system
depressant drugs like benzodiazepines (Valium® and Xanax®), centrally acting muscle relaxants (Soma®
and Flexeril®), and sedatives (Ambien®). Concomitant use of opioids and other central nervous
depressants is associated with a heightened risk of respiratory depression and death.40
In 2013/2015, 33 to 45 percent of workers with opioids received at least one other central nervous
depressant prescription dispensed within one week of an opioid prescription fill in most study
some injured workers were prescribed stronger doses and more pills of hydrocodone-acetaminophen and tramadol to achieve the same MEA as oxycodone. However, in our study sample, the average morphine equivalent dose of oxycodone prescriptions was roughly 2–4 times higher than tramadol prescriptions and 1.5–2.5 times higher than hydrocodone prescriptions. 37 See Jones, Lurie, and Throckmorton (2016). 38 Some states proactively classified it as a controlled substance even though it was not controlled at the federal level. 39 See DEA (2013) at http://www.deadiversion.usdoj.gov/fed_regs/rules/2013/fr1104.htm. 40 The Food and Drug Administration (FDA) started requiring boxed warnings on opioids, benzodiazepines, and other central nervous system depressants stating the serious risks when combining these medications. A complete list of these medications is available at http://www.fda.gov/Drugs/DrugSafety/ucm518473.htm. Several medical treatment guidelines, including the CDC opioid guidelines also caution against the combined use of opioids and other central nervous depressants, such as benzodiazepines.
copyright © 2017 workers compensation research institute
16
_____________________________________________________________________________________________I N T E R S T A T E V A R I A T I O N S I N U S E O F O P I O I D S , 4 T H E D I T I O N
states.41 In Louisiana, the rate was one in two.
At least 1 in 15 injured workers with opioids in three states (Louisiana, Massachusetts, and
Wisconsin) filled a benzodiazepine prescription within one week of an opioid fill. The measure was
5–6 percent in 10 other states. By contrast, the rate was less than 1 percent in Texas, where
preauthorization has been required prior to prescribing benzodiazepines since the implementation
of the Texas formulary.
We observed that opioids and centrally acting muscle relaxants were frequently filled concurrently
across study states. Among injured workers with opioids, 28 percent (in Missouri and New Jersey) to
48 percent (in Louisiana) filled a muscle relaxant prescription within one week of filling an opioid
prescription. In seven states with frequent physician dispensing of opioids and muscle relaxants, we
observed that concomitant use of the two classes of drugs was more prevalent when injured workers
were dispensed these medications at both physicians’ offices and pharmacies. Injured workers who
only received their opioid prescriptions at physicians’ offices had a higher rate of concomitant use of
muscle relaxants than injured workers who filled opioids only at pharmacies in many of these states.
For example, in California, 59 percent of claims that received opioid prescriptions from both
physicians’ offices and pharmacies had concomitant use of muscle relaxants. The measure was 39
and 32 percent among workers who only had physician-dispensed opioids and pharmacy-dispensed
opioids, respectively.
Opioids, benzodiazepines, and muscle relaxants were concurrently filled by injured workers less
frequently across the study states. We found that 1 to 2 percent of injured workers filled all three
classes of medications within one week of each other in 2013/2015 in the majority of states.
As expected, concomitant use of opioids and other drugs was more common among claims receiving
opioid prescriptions on a chronic basis. However, claims without chronic opioids represented a
larger absolute number of concomitant users.
We found a downward trend in the concomitant use of opioids and other central nervous system
depressant drugs in half of the study states between 2010/2012 and 2013/2015. Larger reductions were
seen in Kentucky (7 percentage points) and Texas (5 percentage points). Contrary to the general trend,
we found an increase of 7 percentage points in Nevada.
DATA AND APPROACH
This study uses data comprising 432,380 nonsurgical workers’ compensation claims with more than seven
days of lost time that received at least one prescription for pain medications paid under workers’
compensation in 26 states.42 There were more than 2.3 million paid prescriptions for pain medications, which
included both opioid and non-opioid pain relievers, associated with these claims.43 The claims represent
injuries arising from October 1, 2009, to September 30, 2013, with prescriptions filled through March 31,
2015. The underlying data reflect an average 24 months of experience. The data included in this study
41 Central nervous system depressant drugs include the following classes of medications: benzodiazepines (Valium® and Xanax®), centrally acting muscle relaxants (Soma® and Flexeril®), sedatives (Ambien®), and anti-psychotics (Abilify® and Seroquel®). 42 We chose to focus on nonsurgical claims (claims that did not have a major surgery during the study period) and claims with more than seven days of lost time to make sure that the results of the interstate comparisons of the use of opioids are meaningful. See Chapter 2 and Technical Appendix B for a discussion of this choice. 43 Pain medications refers to prescription and over-the-counter strength medications indicated for pain relief, including opioids, non-steroidal anti-inflammatory drugs (NSAIDs), acetaminophen, and corticosteroids.
copyright © 2017 workers compensation research institute
17
_____________________________________________________________________________________________I N T E R S T A T E V A R I A T I O N S I N U S E O F O P I O I D S , 4 T H E D I T I O N
represent 36–69 percent of workers’ compensation claims in each state.
In order to aggregate diverse opioid medications, we converted each opioid to the MEA in milligrams
that it represents. We compared the states based on the average MEA of opioids per claim. We also analyzed a
variety of metrics that signal higher use of opioids per claim, including the average number of opioid
prescriptions per claim, the average number of opioid pills per claim, and the mix of the different types of
opioids prescribed. The utilization metrics also include duration of opioids per claim and average daily dose
of opioids in 17 states with large samples of injured workers with complete days of supply. In these 17 states,
we computed the percentage of injured workers with opioids that received opioids on a chronic basis and at
higher doses, which if disproportionately higher, may serve as potential markers for the likelihood of future
physical dependence, addiction, or diversion.
LIMITATIONS AND CAVEATS
Several limitations should be noted. First, the claims used for this study may not be representative of all
claims in some states. For a few states, we did not obtain data from some payors with relatively large market
shares.44 Second, the data used for this analysis are based on an average 24 months of experience, which is not
necessarily sufficient to capture the full utilization of opioids. Certain types of opioids, especially long-acting
opioids, are typically used more often at a later stage of medical treatment. Because of this, the reported
utilization does not represent the overall utilization of opioids, especially for chronic pain cases. Third, the
reader should be reminded that we report measures for nonsurgical claims with more than seven days of lost
time that had prescriptions paid under workers’ compensation at the time of evaluation.45 These results
cannot be simply extrapolated to all claims in a state because the exclusion of surgical cases may understate,
and the exclusion of less than seven days of lost time claims may overstate, the prevalence of opioid use and
amount of opioid use per claim to some extent. Lastly, the interstate comparisons in this study were not
adjusted for interstate differences in the mix of cases and injury severity. However, the differences in these
factors are unlikely to be large enough to affect the results, based on the findings from the sensitivity analysis
in Technical Appendix B and other Workers Compensation Research Institute studies that adjusted for these
factors.46 A more detailed discussion of these limitations can be found in Chapter 2 of this report.
44 We do not provide more detailed information regarding the states and data sources because of confidentiality concerns. 45 There was substantial variation across states in the percentage of nonsurgical workers’ compensation claims with more than seven days of lost time that received at least one prescription paid under workers’ compensation across the study states, from 28 percent in Massachusetts to 70 percent in California in 2013/2015. See Chapter 2 of this report for a discussion of the reasons underlying this variation and how this measure affects the interstate comparisons of prescription utilization. 46 Adjusting for the mix of cases did not affect the characterization of states as higher, in the middle, or lower. We did not control for medical severity using administrative claims data. However, other WCRI studies reported small differences in injury severity across states.
copyright © 2017 workers compensation research institute
18
_____________________________________________________________________________________________I N T E R S T A T E V A R I A T I O N S I N U S E O F O P I O I D S , 4 T H E D I T I O N
1
INTRODUCTION
The dangers of opioid misuse resulting in death and addiction constitute a top priority public health problem
in the United States. According to a Centers for Disease Control and Prevention (CDC) report, overdose
deaths due to opioid misuse and abuse exceed deaths due to traffic fatalities and non-prescription drug abuse
(CDC, 2010). In 2011, the CDC declared opioid abuse an epidemic.
The growing public concerns regarding overuse and abuse are shared by the workers’ compensation
health care community. Opioids1 have been widely prescribed for and filled by injured workers—about 55–85
percent of injured workers received opioids, despite medical recommendations to avoid routine prescriptions
and to limit the use of opioids for more severe pain or pain refractory to other analgesics.2,3 Moreover, there is
little evidence about the effectiveness of opioids for the treatment of chronic pain.4
These concerns are increasingly important public policy issues. In recent years, an increasing number of
states have made legislative or regulatory changes, within and outside workers’ compensation, to address
issues related to overuse and misuse of opioids; and some policy changes were also made at the federal level
(see Technical Appendix A for a detailed discussion of those changes). Examples of these efforts include the
CDC guidelines for prescribing opioids for chronic pain, mandatory use of state prescription drug
monitoring programs (PDMPs) to enable identification of potential drug abuse, provider education for
controlled substance prescribers, and adoption of treatment guidelines to encourage appropriate use of
controlled substances. This report tracking changes in opioid utilization over time provides an opportunity to
monitor and evaluate these and other changes in policies aimed at controlling opioid prescribing and
dispensing.
1 The term opioids used in this report refers to prescription opioids for pain relief, including natural (codeine, morphine), semisynthetic (hydrocodone, oxycodone, etc.), and synthetic (methadone, fentanyl) opioids. 2 Several guidelines address opioid prescribing for acute, sub-acute, and chronic pain. These guidelines generally recommend non-pharmacologic pain modalities and non-opioid pharmacologic treatment prior to prescribing opioids. See Technical Appendix A. 3 The percentage is for claims with or without surgery as a product of how often injured workers received pain medications (93–97 percent) and how often injured workers received opioids when they were prescribed pain medications (59–87 percent) (Wang and Liu, 2011). 4 Although several studies have documented some benefits of long-term opioid therapy for limited pain relief (see a more detailed discussion in Wang, Mueller, and Hashimoto, 2011), no studies have been published that support chronic opioid use for improved function or rapid return to work. For patients with occupational injuries, several studies found that a higher use of opioids may lead to addiction, increased disability or work loss, and even death (Kidner, Mayer, and Gatchel, 2009; Franklin et al., 2005; and Volinn, Fargo, and Fine, 2009).
copyright © 2017 workers compensation research institute
19
_____________________________________________________________________________________________I N T E R S T A T E V A R I A T I O N S I N U S E O F O P I O I D S , 4 T H E D I T I O N
SCOPE OF THIS REPORT
This study is an update of previous Workers Compensation Research Institute (WCRI) studies, with more
recent pharmacy data and additional measures to characterize opioid utilization patterns of increasing
concern, including chronic opioid use and concomitant use of` opioids and other central nervous system
depressant drugs.5 The report covers 26 states and prescriptions through March 2015.6 In addition to
documenting interstate variations in the frequency and amount of opioids, the study also examines changes
in opioid utilization measures and prescribing patterns of opioids in each state over a three-year period from
2010/2012 to 2013/2015.7 A separate report focuses on workers receiving opioids on a longer-term basis and
discusses compliance with treatment guidelines among these injured workers.8
Several important policy questions are not addressed in the two reports, including the following:
What factors related to policies and practices explain the substantial interstate variations and trends in
the use of opioids (e.g., state PDMPs and pain policies, guidelines for prescribing opioids, and workers’
compensation system features). However, we highlight the changes in opioid policies that occurred in the
states over the study period to help readers assess the possible factors influencing the changes in opioid
utilization.
Whether the interstate differences arise because the prescribing pattern of the typical provider differs
across states, or whether the differences are attributable to a relatively small number of heavy prescribers
that influence the overall use of opioids.
How the use of opioids affects the use of other medical services and return-to-work outcomes.
ORGANIZATION OF THE REPORT
This report is organized into six chapters. Chapter 2 describes the data and methods used in the analysis.
Chapter 3 discusses major findings on the prevalence and overall use of opioids among the 26 states studied,
highlighting the states where injured workers received unusually high amounts of opioids. Also included are
measures of prevalence of chronic opioid use and use exceeding the guideline-recommended daily dose of 50
morphine equivalent milligrams.9 Chapter 4 presents the trends in the use of opioids between 2010/2012 and
2013/2015 and highlights states with rapid growth or decline of opioid use. Over the study period, the average
5 See Wang, Mueller, and Hashimoto (2011); Thumula, Wang, and Liu (2014); and Thumula, Wang, and Liu (2016) for earlier editions of this study. 6 The 26 states are Arkansas, California, Connecticut, Florida, Georgia, Illinois, Indiana, Iowa, Kansas, Kentucky, Louisiana, Maryland, Massachusetts, Michigan, Minnesota, Missouri, Nevada, New Jersey, New York, North Carolina, Pennsylvania, South Carolina, Tennessee, Texas, Virginia, and Wisconsin. These states are geographically diverse and represent a significant share of the U.S. population, a wide range of industries, and a variety of benefit structures and policies for workers’ compensation pharmaceuticals. The 26 states also represent a wide range of states where medical costs per claim were higher, lower, or typical compared with the national average and represent over two-thirds of the workers’ compensation benefits paid in the United States. 7 The underlying data include nonsurgical claims with more than seven days of lost time that had prescriptions filled by injured workers over the defined period and paid for by a workers’ compensation payor. 2013/2015 refers to claims with injuries occurring from October 1, 2012, through September 30, 2013, and prescriptions filled through March 31, 2015. Similar notation is used for other years. 8 See Wang (2017). 9 These measures are reported for 17 of the 26 states in which we have information regarding the number of days for which each opioid prescription was written for a majority of claims in the state. See Chapter 2 for more details.
copyright © 2017 workers compensation research institute
20
_____________________________________________________________________________________________I N T E R S T A T E V A R I A T I O N S I N U S E O F O P I O I D S , 4 T H E D I T I O N
amount of opioids per claim decreased by more than 20 percent in 15 of the 26 study states, with larger
reductions in Kentucky, Maryland, Michigan, and New York. Chapter 5 focuses on the interstate variations
and temporal changes in prescribing patterns of opioid pain medications, focusing on the type of opioids
most frequently prescribed in each study state; the prescribing of long-acting Schedule II opioids; and the
prescribing of benzodiazepines, sedatives, and muscle relaxants along with opioids. Chapter 6 discusses the
implications of the results and the need for future studies. The statistical appendix provides additional data.
There are two technical appendices, which are included in the report as a convenient reference for
methodological issues as well as state policies related to opioid use. Technical Appendix A provides a brief
discussion of some key factors in the public policy environment that might influence the utilization and
prescribing patterns of opioids, including PDMPs, treatment guidelines, and other state workers’
compensation policies such as state mandated drug formularies. This appendix provides background
information on opioid policies that is helpful in interpreting the findings of this study. It is not our intention
to discuss how each of these factors impacts our results. Technical Appendix B provides the updated results
from several sensitivity analyses to address some potential concerns about the validity of the results.
copyright © 2017 workers compensation research institute
21
_____________________________________________________________________________________________I N T E R S T A T E V A R I A T I O N S I N U S E O F O P I O I D S , 4 T H E D I T I O N
2
DATA AND METHODS
This chapter describes the data and methods we used for this study. For the reader who is interested in more
detailed information about some specific aspects associated with our study, the technical appendices provide
more details.
DATA AND REPRESENTATIVENESS
In this study, we include 432,380 nonsurgical claims with more than seven days of lost time that received at
least one prescription for pain medications paid under workers’ compensation and more than 2.3 million
paid pain medication prescriptions associated with those claims.1,2 Those claims are from 26 states: Arkansas,
California, Connecticut, Florida, Georgia, Illinois, Indiana, Iowa, Kansas, Kentucky, Louisiana, Maryland,
Massachusetts, Michigan, Minnesota, Missouri, Nevada, New Jersey, New York, North Carolina,
Pennsylvania, South Carolina, Tennessee, Texas, Virginia, and Wisconsin.
The claims represent injuries occurring in four accident years from 2010 to 2013 (e.g., accident year 2010
covering claims with injuries from October 1, 2009, to September 30, 2010). Corresponding to each accident
year, we included prescriptions filled through March 31 of each year from 2012 to 2015. This provides us with
1 We chose to use claims with more than seven days of lost time for the analysis for several reasons. First, these claims received more prescriptions and experienced a wider range of opioid therapy compared with those that had only seven or fewer days of lost time. Focusing on these claims helped identify more meaningful interstate variations in the utilization and prescribing patterns of opioids. Second, the claims with more than seven days of lost time also accounted for the majority of workers’ compensation medical costs, an area of greater policy implications. Third, because these claims provided a similar set of cases across states in terms of disability for work-related injuries, they helped to make the interstate comparisons of the utilization and prescribing patterns more meaningful. It is possible that selecting claims with more than seven days of lost time may filter in a subset of claims that may be more serious for some states and less serious for others. If that occurs, the results of interstate comparisons of the utilization of opioids may be biased. However, we did not see strong evidence suggesting that this was likely to occur in our data. See Technical Appendix B for a more detailed discussion. 2 In this study, we also focus on nonsurgical claims because opioids may be prescribed to patients with surgery for different reasons, especially for post-surgical care. We defined nonsurgical claims as claims that did not have a major surgery during the study period. Major surgery is a WCRI-defined service group that is a subset of the surgery section of the Current Procedural Terminology (CPT®) manual. This service group includes invasive surgical procedures, as opposed to surgical treatments and pain management injections (which are also included in the surgery section of the CPT manual). The most frequent surgeries in this service group include (but are not limited to) arthroscopic surgeries of the shoulder or knee, laminectomies, laminotomies, discectomies, lumbar fusion, carpal tunnel surgeries, neuroplasty, and hernia repair. Evaluation of opioid use may need to take into account the timing in relation to surgery as well as injury severity and case experience. By focusing on nonsurgical cases, we make sure that the results that describe the use and prescribing of opioids are meaningful. However, in doing this one may be concerned that states with higher surgery rates would have fewer serious cases among nonsurgical claims, thus distorting the comparisons. We assessed the extent of this potential concern and concluded that selecting nonsurgical cases is unlikely to bias the results of interstate comparisons. See Technical Appendix B for a more detailed discussion. Future studies may examine the use of opioids among surgical cases to provide a more complete picture.
copyright © 2017 workers compensation research institute
22
_____________________________________________________________________________________________I N T E R S T A T E V A R I A T I O N S I N U S E O F O P I O I D S , 4 T H E D I T I O N
an average 24 months of experience for each accident year reported.
The analysis data were extracted from the WCRI Detailed Benchmark/Evaluation (DBE) database and
consist of detailed prescription transaction data that were collected from workers’ compensation payors and
their medical bill review and pharmacy benefit management vendors.
Table 2.1 provides the number of claims and prescriptions by state that are included in the study. The
table also shows that the insurance carriers and workers’ compensation payors whose data underlie this study
represent 36–69 percent of workers’ compensation claims in each state.
The data available for each prescription identify the specific medication prescribed, the date on which the
prescription was filled, amounts charged and paid, the number of pills (for orally-administered opioids), the
number of days for which the prescription was written (days of supply), and the strength of the medication in
milligrams. The specific medication prescribed was identified by National Drug Code (NDC). Completeness
of days of supply has improved over the years, especially for pharmacy transactions. However, we continue to
see missing days of supply for physician-dispensed opioid prescriptions. In 17 states with infrequent
physician dispensing of opioids, 59–87 percent of claims with opioids have days of supply information for all
opioid prescriptions, and the claims with complete days of supply are representative of those that do not have
complete days of supply information.
It is also worth noting that there was substantial variation across states in the percentage of nonsurgical
workers’ compensation claims with more than seven days of lost time that received at least one prescription
paid under workers’ compensation (from 28 percent in Massachusetts to 70 percent in California in
2013/2015).3 Several reasons may explain the large proportion of claims without prescriptions across states.
For example, some initial prescriptions may be paid for by non-workers’ compensation payors,4 and some
patients may be using over-the-counter medications that they already have for treating their work injury. We
found that the potential bias introduced by these missing prescriptions was unlikely to be material in how we
characterized a state in this analysis as low, medium, or high on our key measures.5
3 In a majority of the states, we observed no or little change in the percentage of claims receiving a prescription over the study period. In six states (Arkansas, California, Kentucky, Louisiana, South Carolina, and Tennessee) where the measure ranged from 55 to 75 percent in 2010/2012, we observed decreases of more than 5 percentage points. The proportion of claims with a prescription may have decreased over time for several reasons. For example, recent increases in the population with health insurance coverage as a result of the Affordable Care Act may have resulted in more initial prescriptions paid for by other payors. These changes are less likely to be driven by opioid reforms, as explained later in this report. 4 This is consistent with a study of workers’ compensation cases of New York state employees, all of whom were covered by group health insurance that included prescription coverage (Stapleton et al., 2001). By combing the records of the state fund and group health insurer’s interviews with workers, the study found that 21 percent of all drug expenditures for those injured workers were paid by the state fund, 69 percent by group health insurance, and 9 percent by the worker without reimbursement. See a more detailed discussion in Wang and Liu (2011). 5 To test the bias, we assumed that the rate of filling opioid prescriptions among claims without prescriptions was similar to the rate among claims with one prescription. Similar findings were observed when we set the rate of opioid fills to the rate among claims with one or two prescriptions.
copyright © 2017 workers compensation research institute
23
_____________________________________________________________________________________________I N T E R S T A T E V A R I A T I O N S I N U S E O F O P I O I D S , 4 T H E D I T I O N
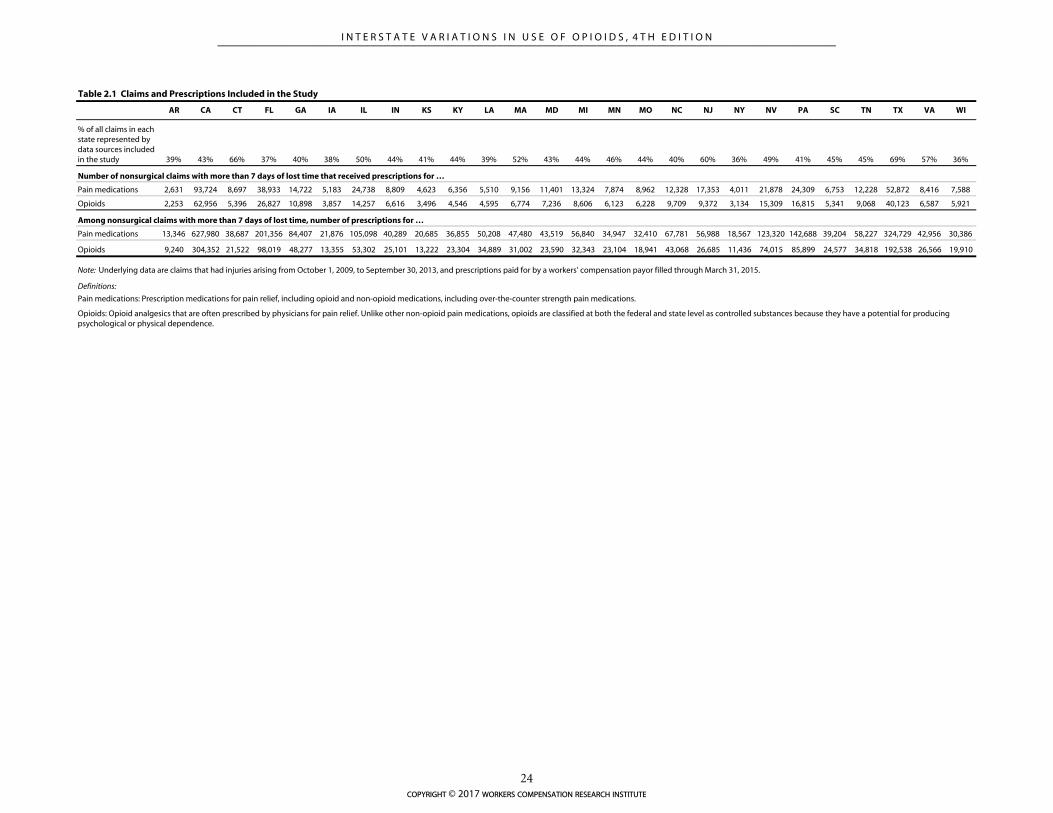
AR CA CT FL GA IA IL IN KS KY LA MA MD MI MN MO NC NJ NY NV PA SC TN TX VA WI
% of all claims in each state represented by data sources included in the study 39% 43% 66% 37% 40% 38% 50% 44% 41% 44% 39% 52% 43% 44% 46% 44% 40% 60% 36% 49% 41% 45% 45% 69% 57% 36%
Pain medications 2,631 93,724 8,697 38,933 14,722 5,183 24,738 8,809 4,623 6,356 5,510 9,156 11,401 13,324 7,874 8,962 12,328 17,353 4,011 21,878 24,309 6,753 12,228 52,872 8,416 7,588
Opioids 2,253 62,956 5,396 26,827 10,898 3,857 14,257 6,616 3,496 4,546 4,595 6,774 7,236 8,606 6,123 6,228 9,709 9,372 3,134 15,309 16,815 5,341 9,068 40,123 6,587 5,921
Pain medications 13,346 627,980 38,687 201,356 84,407 21,876 105,098 40,289 20,685 36,855 50,208 47,480 43,519 56,840 34,947 32,410 67,781 56,988 18,567 123,320 142,688 39,204 58,227 324,729 42,956 30,386
Opioids 9,240 304,352 21,522 98,019 48,277 13,355 53,302 25,101 13,222 23,304 34,889 31,002 23,590 32,343 23,104 18,941 43,068 26,685 11,436 74,015 85,899 24,577 34,818 192,538 26,566 19,910
Pain medications: Prescription medications for pain relief, including opioid and non-opioid medications, including over-the-counter strength pain medications.
Opioids: Opioid analgesics that are often prescribed by physicians for pain relief. Unlike other non-opioid pain medications, opioids are classified at both the federal and state level as controlled substances because they have a potential for producing psychological or physical dependence.
Definitions:
Table 2.1 Claims and Prescriptions Included in the Study
Number of nonsurgical claims with more than 7 days of lost time that received prescriptions for …
Among nonsurgical claims with more than 7 days of lost time, number of prescriptions for …
Note: Underlying data are claims that had injuries arising from October 1, 2009, to September 30, 2013, and prescriptions paid for by a workers' compensation payor filled through March 31, 2015.
copyright © 2017 workers compensation research institute
24
_____________________________________________________________________________________________I N T E R S T A T E V A R I A T I O N S I N U S E O F O P I O I D S , 4 T H E D I T I O N
Unlike other WCRI benchmark reports, the claims included in this study may not necessarily be
representative of the total population of claims in some states. This occurs for two reasons. First, the
reporting of detailed pharmacy data, although improving, was less complete than other benchmarking data
for several data sources in some states, which resulted in additional exclusions of data sources when
constructing benchmark metrics for this study. This occurred when a data source in a state did not have
complete and adequate data on NDCs, quantities, and days of supply for prescriptions—data elements that
are critical for constructing prevalence and amount of opioids metrics. The additional exclusions may affect
the representativeness of the data if the claims from those excluded data sources were very different in some
way. Second, we did not obtain data from one or more important data sources for a few states, which may
affect the representativeness of our data for these states.6
IDENTIFYING AND GROUPING OPIOID PRESCRIPTIONS
We identified opioid prescriptions based on the therapeutic classification scheme developed by Medi-Span®.7
There are five schedules of controlled substances, classified by the Drug Enforcement Administration (DEA)
under federal law, which are based on a drug’s medical usefulness and abuse potential. We identified the
schedules associated with individual opioid prescriptions using an indicator in the Medi-Span® database.
Table 2.2 provides the definitions of the five schedules and examples of specific drugs classified in each
schedule during the study period. For instance, oxycodone (OxyContin®) and oxycodone-acetaminophen
(Percocet®) are classified as Schedule II opioids, and codeine-acetaminophen (Tylenol® with codeine) is
classified as a Schedule III opioid.
Note that the federal classification of two of these drugs changed in recent years. Hydrocodone-
acetaminophen (Vicodin®) was considered a Schedule III opioid during most of the study period. The
legislation, “Safe Prescribing Act of 2013,” reclassified hydrocodone-combination products from Schedule III
to Schedule II at the federal level, effective October 2014.8 At the state level, hydrocodone-combination
products have been considered Schedule II in New York since February 2013, prior to the federal change.
In August 2014, the DEA classified tramadol as a Schedule IV drug.9 Prior to that, tramadol (Ultram®
and Ultracet®) was the only opioid that was not scheduled at the federal level. Some states had proactively
classified it as a controlled substance even though it was not controlled at the federal level. Up-scheduling of
hydrocodone-acetaminophen and tramadol, two of the most frequently prescribed medications to injured
workers, is likely to result in a decrease in prescribing of these medications. Considering the implementation
of these federal rule changes toward the end of the study period, we may observe the full impact of the up-
scheduling of these two drugs on prescribing patterns and utilization when we update the analysis with more
recent data.
6 We do not provide more detailed information regarding the states and data sources due to confidentiality concerns. 7 According to Medi-Span®’s Therapeutic Classification System, a hierarchical classification scheme, the first two digits of the 10-digit Generic Product Identifier classifies general drug products. We identified opioid prescriptions based on drug group 65 for opioid analgesics. See Medi-Span® (2005). 8 Up-scheduling of hydrocodone-combination products to Schedule II would mean the requirement of a written prescription and no refills, which are likely to reduce the use of hydrocodone-combination products. Apart from the federal laws about prescribing Schedule II drugs, several states have additional rules limiting the quantity of Schedule II drugs to a 30-day supply or limiting the prescriptions to a specified period of time after which they expire. 9 See DEA (2013) at http://www.deadiversion.usdoj.gov/fed_regs/rules/2013/fr1104.htm.
copyright © 2017 workers compensation research institute
25
_____________________________________________________________________________________________I N T E R S T A T E V A R I A T I O N S I N U S E O F O P I O I D S , 4 T H E D I T I O N
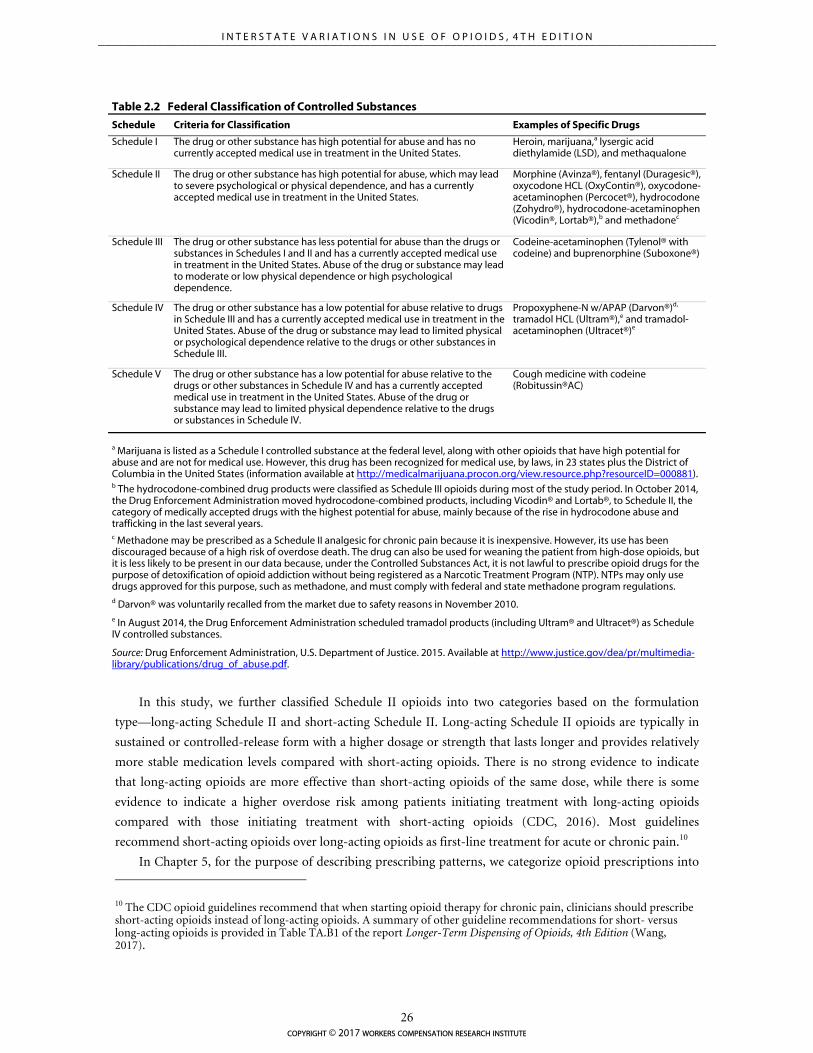
Table 2.2 Federal Classification of Controlled Substances
Schedule Criteria for Classification Examples of Specific Drugs
Schedule I The drug or other substance has high potential for abuse and has no currently accepted medical use in treatment in the United States.
Heroin, marijuana,a lysergic acid diethylamide (LSD), and methaqualone
Schedule II The drug or other substance has high potential for abuse, which may lead to severe psychological or physical dependence, and has a currently accepted medical use in treatment in the United States.
Morphine (Avinza®), fentanyl (Duragesic®), oxycodone HCL (OxyContin®), oxycodone-acetaminophen (Percocet®), hydrocodone (Zohydro®), hydrocodone-acetaminophen (Vicodin®, Lortab®),b and methadonec
Schedule III The drug or other substance has less potential for abuse than the drugs or substances in Schedules I and II and has a currently accepted medical use in treatment in the United States. Abuse of the drug or substance may lead to moderate or low physical dependence or high psychological dependence.
Codeine-acetaminophen (Tylenol® with codeine) and buprenorphine (Suboxone®)
Schedule IV The drug or other substance has a low potential for abuse relative to drugs in Schedule III and has a currently accepted medical use in treatment in the United States. Abuse of the drug or substance may lead to limited physical or psychological dependence relative to the drugs or other substances in Schedule III.
Propoxyphene-N w/APAP (Darvon®)d,
tramadol HCL (Ultram®),e and tramadol-acetaminophen (Ultracet®)e
Schedule V The drug or other substance has a low potential for abuse relative to the drugs or other substances in Schedule IV and has a currently accepted medical use in treatment in the United States. Abuse of the drug or substance may lead to limited physical dependence relative to the drugs or substances in Schedule IV.
Cough medicine with codeine (Robitussin®AC)
a Marijuana is listed as a Schedule I controlled substance at the federal level, along with other opioids that have high potential for abuse and are not for medical use. However, this drug has been recognized for medical use, by laws, in 23 states plus the District of Columbia in the United States (information available at http://medicalmarijuana.procon.org/view.resource.php?resourceID=000881). b The hydrocodone-combined drug products were classified as Schedule III opioids during most of the study period. In October 2014, the Drug Enforcement Administration moved hydrocodone-combined products, including Vicodin® and Lortab®, to Schedule II, the category of medically accepted drugs with the highest potential for abuse, mainly because of the rise in hydrocodone abuse and trafficking in the last several years. c Methadone may be prescribed as a Schedule II analgesic for chronic pain because it is inexpensive. However, its use has been discouraged because of a high risk of overdose death. The drug can also be used for weaning the patient from high-dose opioids, but it is less likely to be present in our data because, under the Controlled Substances Act, it is not lawful to prescribe opioid drugs for the purpose of detoxification of opioid addiction without being registered as a Narcotic Treatment Program (NTP). NTPs may only use drugs approved for this purpose, such as methadone, and must comply with federal and state methadone program regulations. d Darvon® was voluntarily recalled from the market due to safety reasons in November 2010. e In August 2014, the Drug Enforcement Administration scheduled tramadol products (including Ultram® and Ultracet®) as Schedule IV controlled substances.
Source: Drug Enforcement Administration, U.S. Department of Justice. 2015. Available at http://www.justice.gov/dea/pr/multimedia-library/publications/drug_of_abuse.pdf.
In this study, we further classified Schedule II opioids into two categories based on the formulation
type—long-acting Schedule II and short-acting Schedule II. Long-acting Schedule II opioids are typically in
sustained or controlled-release form with a higher dosage or strength that lasts longer and provides relatively
more stable medication levels compared with short-acting opioids. There is no strong evidence to indicate
that long-acting opioids are more effective than short-acting opioids of the same dose, while there is some
evidence to indicate a higher overdose risk among patients initiating treatment with long-acting opioids
compared with those initiating treatment with short-acting opioids (CDC, 2016). Most guidelines
recommend short-acting opioids over long-acting opioids as first-line treatment for acute or chronic pain.10
In Chapter 5, for the purpose of describing prescribing patterns, we categorize opioid prescriptions into 10 The CDC opioid guidelines recommend that when starting opioid therapy for chronic pain, clinicians should prescribe short-acting opioids instead of long-acting opioids. A summary of other guideline recommendations for short- versus long-acting opioids is provided in Table TA.B1 of the report Longer-Term Dispensing of Opioids, 4th Edition (Wang, 2017).
copyright © 2017 workers compensation research institute
26
_____________________________________________________________________________________________I N T E R S T A T E V A R I A T I O N S I N U S E O F O P I O I D S , 4 T H E D I T I O N
the following categories: hydrocodone-acetaminophen (Vicodin®),11 oxycodone-containing products
(OxyContin® and Percocet®), tramadol-containing products (Ultram® and Ultracet®), and all other
opioids.12
IDENTIFYING DISPENSING POINT
Most of the benchmark metrics included in this study measure the utilization of opioids per claim regardless
of who dispensed the opioid prescriptions. For a few metrics that measure the opioid prescriptions dispensed
by physicians or at pharmacies, we rely on the dispensing point identified in our drugs database. Physician-
dispensed prescriptions were defined as those that were filled at the offices of independent practitioners,
physician groups, or medical centers or clinics which may or may not have had an on-site pharmacy. We
consider prescriptions dispensed at and billed for by a medical center or clinic as physician-dispensed
prescriptions. This is because, although the medical center may have an on-site pharmacy that functions like a
retail pharmacy, prescriptions dispensed and billed for by the medical center as a financial entity are often
reimbursed differently compared with retail pharmacies.13,14 Pharmacy-dispensed prescriptions were those
dispensed at retail or mail-order pharmacies.
MEASURING UTILIZATION OF OPIOIDS
We measure the frequency of claims receiving opioids as the percentage of claims with pain medications that
received at least one opioid prescription. By doing this, we focus on injured workers who received opioids
and/or non-opioid pain medications for pain relief.15 We also report the percentage of claims with pain
medications receiving two or more opioid prescriptions.
Among injured workers receiving opioids, the overall utilization of opioids is measured by the average
11 Long-acting hydrocodone-only products like Zohydro® and Hysingla® were not available in the market during the study period. 12 All other opioids include opioids that were infrequently prescribed to injured workers across the study states—propoxyphene, codeine, buprenorphine, fentanyl, morphine sulfate, hydromorphone, oxymorphone, tapentadol, and methadone. We grouped these opioids together in order to highlight trends in the prescribing of the most frequently prescribed drugs. 13 We identified physician-dispensed prescriptions based on several critical data elements, including (1) the information provided by the data sources that indicates if a physician or pharmacy was the provider of the medication; (2) the Medi-Span® indicator that specifies repackaged drugs using the NDCs assigned for a repackaged drug by the Food and Drug Administration; and (3) the place of service. For prescriptions that did not have the above information but a unique provider identifier (tax ID or national provider identification number) was present, we derived the dispensing point based on the data elements above assigned to the same provider. Note that by our definition, prescriptions for repackaged drugs are considered physician-dispensed prescriptions. Based on the evidence we saw in our detailed data review and our understanding of the incentive mechanism in the business process, we believe that retail pharmacies rarely dispense repackaged drugs in practice. 14 It should be noted that all prescriptions included for this study were identified as either physician- or pharmacy-dispensed prescriptions. Although more detailed data allow us to observe, as needed, some more details about dispensing entities that were associated with certain prescription transactions, it did not allow us to systematically differentiate between medical clinics with a pharmacy and independent pharmacies, or between medical clinics and physician groups. Throughout the report, we focus on both physician- and pharmacy-dispensed prescriptions for major findings, and occasionally, we discuss some observations about the types of dispensing entities to provide more detail for better understanding of what we see in the data. 15 Claims with a prescription or pain medication prescription paid under workers’ compensation provide a robust base to measure frequency of opioid use because a variable percentage of injured workers across states and over time did not have a prescription paid under workers’ compensation for reasons discussed earlier in this chapter.
copyright © 2017 workers compensation research institute
27
_____________________________________________________________________________________________I N T E R S T A T E V A R I A T I O N S I N U S E O F O P I O I D S , 4 T H E D I T I O N
morphine equivalent amount (MEA) per claim with opioids, which is referred to as the amount of opioids per
claim throughout the report. This measure was constructed by applying a morphine equivalent equianalgesic
conversion (described in the next section). We use this measure for interstate comparisons and examining
trends because it standardizes both quantity and strength of different opioid medications. In this study, we
report the mean values of this measure after excluding a small percentage of claims (0.0–0.6 percent of claims
with opioids across the 26 states) that had unusually high amounts of morphine equivalent opioids per
claim.16 There is substantial variation in opioid use across individual claims within a state; relatively few
claims account for most opioid use. This raises a concern that the average MEA per claim may be skewed,
even after excluding the claims with unusually high amounts, affecting the results of interstate comparisons.
Based on our analysis of the comparative results for the same measure at the median and other selected
percentiles higher than the median, we concluded that the results based on the mean value correctly
characterize whether a state is higher, lower, or typical in terms of use of opioids. In Technical Appendix B,
we also report a pair of measures for each state to enable interstate comparisons for readers concerned with
the sensitive nature of the average MEA per claim measure—the percentage of claims with opioids that had
morphine equivalent amounts greater than 2,500 milligrams, to summarize the number of individuals with
relatively more use of opioids, and the average MEA per claim for claims with opioids that had morphine
equivalent amounts less than or equal to 2,500 milligrams, to characterize opioid use among the majority of
individuals that fill relatively fewer opioids.17 A detailed discussion and results are provided in Technical
Appendix B.
Several other utilization metrics are also included in the analyses to help explain why a state might have
higher or lower utilization of opioids or what might be the main reasons for trends. For example, since the
higher utilization of opioids in a state could be due to more prescriptions filled per claim or more pills per
opioid prescription, we include both measures in this study although they are imperfect measures for a
comparative analysis.18 Together with the frequency of using opioids and stronger Schedule II opioids, these
measures help us understand why a state had higher utilization of opioids per claim, such as (1) physicians
wrote and injured workers filled more prescriptions per claim; (2) prescriptions were written for a higher
number of pills; or (3) physicians were more likely to prescribe certain stronger Schedule II opioids, which
have a higher morphine equivalent conversion factor.
In this edition, we added metrics of duration and morphine equivalent daily dose (MED) in order to
highlight the patterns of chronic opioid use and high-dose use (i.e., use exceeding guideline-recommended
doses). We constructed these measures using a subset of claims with complete days of supply in the most
recent study year, 2013/2015. For 17 states, 59–87 percent of the claims had complete days of supply
16 This approach is somewhat different from what we used in the first edition of this study (Wang, Mueller, and Hashimoto, 2011). It helps smooth the trends observed so that the trend results are not unduly sensitive to the claims with extreme values. Although this change may result in some differences in the values on the amount of opioids per claim, the interstate comparison results are consistent for the states included in the two studies. See Technical Appendix B for a more detailed description and additional data on the amount of opioids per claim. 17 We chose a fixed cut-off of 2,500 milligrams MEA per claim based on the distribution of the measure across the 26 study states. Claims with morphine equivalent amounts greater than 2,500 milligrams represent the top 15 percent of claims across several states. These claims accounted for 30–74 percent of opioid prescriptions and 51–87 percent of total morphine equivalent amounts across the 26 study states. Technical Appendix B provides a more detailed discussion. 18 Conceivably, physicians in different states prescribe different quantities of opioids and/or prescribe the same quantities of opioid medications but at different strengths. If states vary systematically in these aspects, neither the average number of prescriptions nor the average number of pills per claim would accurately depict the level of use of opioids in a comparable way.
copyright © 2017 workers compensation research institute
28
_____________________________________________________________________________________________I N T E R S T A T E V A R I A T I O N S I N U S E O F O P I O I D S , 4 T H E D I T I O N
information for all prescriptions.19 One may be concerned that claims with days of supply are different from
claims without days of supply and may not represent all claims with opioid prescriptions in our sample. We
tested the magnitude of the potential bias introduced by using claims with complete days of supply on metrics
of duration and daily dose of opioids and found that it was unlikely to be material for the purpose of
interstate comparisons.20
To examine workers with chronic opioid use and high-dose opioid use, we converted the opioid
transactions into day-to-day utilization metrics based on the opioid fill date and days of supply of each opioid
prescription. We counted each day the injured worker had an opioid supply and computed the morphine
equivalent dose received on each day by adjusting for overlapping opioid prescriptions.
In this study, we define chronic opioid use as injured workers receiving opioids for at least 60 days during
any continuous 90-day period over the average 24-month observation period.21 Our definition allows for
small time gaps between two subsequent fills during the 90-day episode because injured workers may be
taking the opioid medication less frequently than prescribed. Considering each non-overlapping 90-day
period where an injured worker received opioids for at least 60 days as a chronic opioid therapy episode, we
measured the frequency of injured workers with multiple chronic opioid therapy episodes.22
We defined injured workers with high-dose opioids as those receiving an MED exceeding 50 and 90
milligrams for at least 60 days during the average 24-month observation period. CDC guidelines for
prescribing opioids for chronic pain caution prescribers to reassess the risks and benefits to the patient when
prescribing an MED exceeding 50 milligrams and to avoid an MED exceeding 90 milligrams; they
recommend tapering if the dose exceeds 90 milligrams MED.23 Some other metrics reported in this study are based on prescriptions for pain medications, which consist
of opioids and non-opioid pain medications. These measures help us identify states that have high or low use
of non-opioid pain medications. The utilization metrics were constructed based on a weighting method, so
the results reflect the claim experience in each state for all market segments included. Differences across states
in disability duration and claim maturities may also be reflected in the results of interstate comparisons. We
also examined the amount of opioids per claim at different maturities and at different disability durations to
19 The 17 states are Arkansas, Iowa, Kansas, Kentucky, Louisiana, Massachusetts, Michigan, Minnesota, Missouri, Nevada, New Jersey, New York, North Carolina, South Carolina, Texas, Virginia, and Wisconsin. These 17 states are among the states with higher, typical, and lower frequencies and amounts of opioids based on the 26-state comparison. 20 To test the bias we (1) compared the average MEA across all claims in the state with the average among claims with complete days of supply and found small differences under 10 percent in almost all states (see Table SA.4); and (2) we computed the proportion of claims with more than 90 days of continuous opioid use across all claims with opioids by assuming much lower rates of chronic opioid use among claims for which we do not have complete days of supply (we reduced the rate of chronic use by a multiplier of the percentage difference in the average MEA between claims with complete days of supply and all claims), and found that the characterization of states as higher, lower, or in the middle did not change. 21 Characterization of states as having higher, typical, or lower percentages of claims with chronic opioid use does not change when we use alternative definitions to characterize chronic opioid therapy, including receiving more than 90 days of opioids during any 180-day period, receiving 45 days of opioids during any 90-day period, or having two or more quarters with more than 60 days of opioids. 22 See Table SA.5 for interstate variations in the frequency of multiple chronic opioid therapy episodes. 23 Note that the 50-milligram maximum MED was based on two large population studies at Kaiser and the Veterans Administration. Higher daily dose limits are recommended by some other state guidelines (e.g., Massachusetts Chronic Pain Treatment Guidelines recommend a maximum daily dose of 120 milligrams MED). Table TA.B1 in Longer-Term Dispensing of Opioids, 4th Edition (Wang, 2017) provides the maximum daily dose recommendations of select guidelines used in and outside workers’ compensation. Higher limits recommended by other guidelines may understate the potential harm of high-dose opioid therapy in our population of injured workers without a major surgery evaluated at an average 24 months’ maturity.
copyright © 2017 workers compensation research institute
29
_____________________________________________________________________________________________I N T E R S T A T E V A R I A T I O N S I N U S E O F O P I O I D S , 4 T H E D I T I O N
see how the states compare when holding maturity or duration constant (see Technical Appendix B).
In this report, we chose to highlight comparative results where the differences are large enough to be
potentially meaningful from the perspective of policymakers and other stakeholders. We also ensured that the
comparisons with the 26-state median and trend results for the frequency and amount of opioid use we
highlight in this report are statistically significant at the 10 percent level (see Tables SA.1 and SA.2).
MORPHINE EQUIVALENT EQUIANALGESIC CONVERSION
Opioid medications vary in their effectiveness for relieving pain (i.e., analgesic potency in medical terms). The
same number of milligrams in the dosage for different opioids may indicate different strengths. For example,
1 milligram of oxycodone (OxyContin®) is equivalent to 1.5 milligrams of morphine, while 1 milligram of
hydromorphone (Exalgo®) is equivalent to 4 milligrams of morphine. The effectiveness of opioid medications
also depends on the route of administration. A medication will have a quicker onset action if given
intravenously or by intramuscular injection than if administered orally. Once an opioid drug is determined to
be beneficial for a patient, the physician often uses a morphine equivalent dose conversion table to determine
the proper dosage and administrative route for the patient.
We measured the utilization of opioids based on the MEA for specific opioid medications, which takes
into account the differences in strength as well as the quantity of opioid medications received by injured
workers. This way, the interstate difference in the utilization of opioids would not be affected by the
difference in the strength of specific opioid medications. We first applied the morphine equivalent
equianalgesic conversion factors from the CDC24 at the prescription level to compute the morphine
equivalent dose in milligrams for individual prescriptions.25 The morphine equivalent dose for each opioid
prescription was calculated as a product of the strength in milligrams of the prescribed opioid medication and
the analgesic potency ratio between the specific opioid and morphine, multiplied by the number of pills (or
quantity) of the prescription. A variable was created for each individual claim to capture the cumulative MEA
across different opioid medications received by the injured worker. The cumulative MEA was further
aggregated to the state level across all claims that received opioids in the state.
SENSITIVITY ANALYSIS FOR CLAIM SELECTION
The interstate comparisons in this report were made based on nonsurgical claims with more than seven days
of lost time that received pain medications and opioids. We chose this subset of claims for several reasons.
First, the patterns of use of opioids are very different between surgical and nonsurgical claims, with surgical
claims having higher frequency and amount of opioid use compared with nonsurgical claims, in general.
Examining patterns of use separately for surgical and nonsurgical claims helps to produce clinically
meaningful results and makes the sample of claims underlying the measures more comparable in terms of 24 The conversion factors compiled by the CDC for analytical purposes are available at https://www.cms.gov/Medicare/Prescription-Drug-Coverage/PrescriptionDrugCovContra/Downloads/Opioid-Morphine-EQ-Conversion-Factors-April-2017.pdf. 25 In the 3rd and 4th editions of this study, we decided to use the conversion factors published by the CDC because of their widespread use. It should be noted that for a few opioid drugs (e.g., fentanyl and buprenorphine) that were relatively infrequently prescribed to injured workers, the conversion factors used for this report are different from those used in the earlier editions. See Thumula, Wang, and Liu (2014) for more details about the conversion factors used in the previous editions of this study.
copyright © 2017 workers compensation research institute
30
_____________________________________________________________________________________________I N T E R S T A T E V A R I A T I O N S I N U S E O F O P I O I D S , 4 T H E D I T I O N
mix of injuries and injury severity. Second, since nonsurgical claims are mostly claims with musculoskeletal
injuries that tend to be less serious, with lower consensus regarding the need for opioids in pain management,
compared with surgical cases, analyzing nonsurgical claims helps identify potential issues with opioid
utilization and also helps to monitor the results of opioid policy changes. In this report, we continue to focus
on nonsurgical claims. Future studies may examine surgical claims to provide a full picture of opioid
utilization. Third, claims with more than seven days of lost time are those that account for a small proportion
of all claims but represent a large share of workers’ compensation medical costs with significant implications
for indemnity, total costs, and worker outcomes. Focusing on this set of claims also helps to capture interstate
variations and identify states that are likely to have more prevalent use of opioids. Fourth, we focus on claims
with pain medications because receiving pain medications may indicate that the injured worker suffers from
pain, for which opioids and/or non-opioid pain medications were prescribed.
Since the selection was based on three variables reflecting the differences across states in claim type and
how medical services were being delivered to injured workers, one may be concerned that such a selection
may bias the results of interstate comparisons if more severe cases were selected for some states and less severe
cases were selected for others. One way to assess the existence and extent of this potential selection issue is to
examine how a selection variable is correlated with key utilization measures among the subset of cases
selected. The notion is that if the selection variable resulted in a different percentage of cases being selected
for each state and the varying percentage is correlated with the utilization variable, this may suggest a
potential bias. If this occurs, one has to assess how sensitive the results are to potential selection.
We looked at the correlation at three different points of selection: (1) claims with more than seven days
of lost time, (2) nonsurgical claims, and (3) claims that received opioids. The results of our analysis suggest
that the potential bias due to the selection of the subset of claims is unlikely to be a serious concern. We
discuss this in detail in Technical Appendix B.
We also examined whether the interstate comparisons based on these claims are sensitive to differences
in case mix across the states. To do this we estimated the utilization metrics while controlling for the
differences in the worker’s age, gender, marital status, the type of injury the worker sustained, and the type of
industry in which the injured worker was employed. The regression-based results are largely consistent with
the results for the unadjusted measures (see Tables TA.B1–B4).
LIMITATIONS AND CAVEATS
Several limitations should be noted. First, the claims used for this study may not necessarily be representative
of all claims in some states. This may occur because the reporting of pharmacy data, although improving, was
less complete for several data sources, resulting in additional exclusions.26 For a few states, we are missing
data from some large regional insurers.27
Second, the data used for this analysis are based on an average 24 months of experience, which is not
necessarily sufficient to capture the full utilization of opioids. This is because certain types of opioid drugs,
26 Although we made sure that the claims included for this study represented all claims from the same data sources, the additional exclusions (of data sources in some states) may affect the representativeness if the claims from those data sources were different or had different experiences. 27 We do not provide more details because of confidentiality concerns.
copyright © 2017 workers compensation research institute
31
_____________________________________________________________________________________________I N T E R S T A T E V A R I A T I O N S I N U S E O F O P I O I D S , 4 T H E D I T I O N
especially long-acting opioids, are typically used at a later stage of medical treatment.28 As a result, we expect
that in some states, the use of opioids would increase as claims age, especially in those states with higher
proportions of injured workers with chronic opioid use compared with the median state. The reverse would
be true for states with a lower-than-typical share of injured workers with chronic use. This may affect the
ultimate rankings for some states.
Third, we report measures for nonsurgical claims with more than seven days of lost time that had
prescriptions paid under workers’ compensation at the time of evaluation.29 While these claim selections for
the analysis are unlikely to distort the results of interstate comparisons and trends in this report, we caution
the reader not to simply extrapolate the results to all nonsurgical claims in a state because the reported
measures may overstate the prevalence of opioid use and amount of opioid use per claim to some extent. This
is because claims not included in this study (i.e., claims with less than or equal to seven days of lost time and
claims with no prescriptions observed, either because they had no prescriptions or no prescriptions paid
under workers’ compensation) are likely to be less severe and therefore likely to have fewer prescriptions and
fewer opioid prescriptions on average than claims included in this study.
Lastly, the interstate comparisons in this study did not make certain statistical adjustments to adjust for
interstate differences in case mix and injury severity. However, we did a sensitivity analysis adjusting for
differences across states in the case mix and the comparative results did not change.30 Nonetheless, the reader
should keep this in mind when interpreting the results.
28 In a National Council on Compensation Insurance, Inc. (NCCI) study, the authors found that the opioid share of all prescriptions increased steadily when claims became more mature until about the eighth year postinjury (Lipton, Laws, and Li, 2009). The same study also looked at the opioid share by costs per opioid prescription, where the high-cost group would presumably include more prescriptions for stronger and long-acting opioids. The study found that the high-cost opioid prescriptions grew from 9 percent of all opioid prescriptions in the 1st year to 45 percent in the 12th year postinjury. 29 We chose to report the measures based on this subset of data for various reasons, including (1) opioids may be prescribed to patients with surgery for different reasons, especially for post-surgical care; (2) claims with more than seven days of lost time, representing a small percentage of all claims but a large share of workers’ compensation medical costs, have significant implications for indemnity costs, total costs, and worker outcomes; and (3) a large proportion of nonsurgical claims with more than seven days of lost time did not have paid prescriptions in our data. The concerns about potential bias of these selections are briefly addressed earlier in this chapter. 30 See a detailed discussion in Technical Appendix B. Several previously published WCRI studies also found that the usually small differences in case mix and injury severity across states are unlikely to affect interstate comparisons in a material way. See Savych and Thumula (2016) and Dolinschi and Rothkin (2016).
copyright © 2017 workers compensation research institute
32
_____________________________________________________________________________________________I N T E R S T A T E V A R I A T I O N S I N U S E O F O P I O I D S , 4 T H E D I T I O N
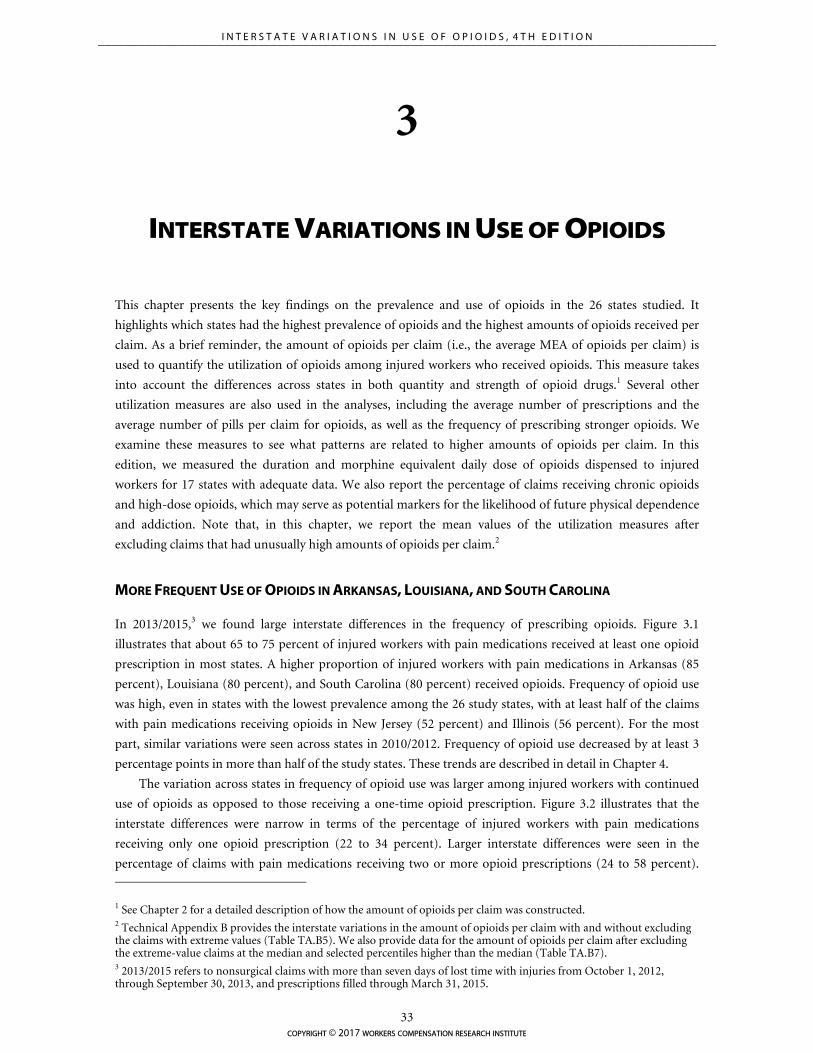
3
INTERSTATE VARIATIONS IN USE OF OPIOIDS
This chapter presents the key findings on the prevalence and use of opioids in the 26 states studied. It
highlights which states had the highest prevalence of opioids and the highest amounts of opioids received per
claim. As a brief reminder, the amount of opioids per claim (i.e., the average MEA of opioids per claim) is
used to quantify the utilization of opioids among injured workers who received opioids. This measure takes
into account the differences across states in both quantity and strength of opioid drugs.1 Several other
utilization measures are also used in the analyses, including the average number of prescriptions and the
average number of pills per claim for opioids, as well as the frequency of prescribing stronger opioids. We
examine these measures to see what patterns are related to higher amounts of opioids per claim. In this
edition, we measured the duration and morphine equivalent daily dose of opioids dispensed to injured
workers for 17 states with adequate data. We also report the percentage of claims receiving chronic opioids
and high-dose opioids, which may serve as potential markers for the likelihood of future physical dependence
and addiction. Note that, in this chapter, we report the mean values of the utilization measures after
excluding claims that had unusually high amounts of opioids per claim.2
MORE FREQUENT USE OF OPIOIDS IN ARKANSAS, LOUISIANA, AND SOUTH CAROLINA
In 2013/2015,3 we found large interstate differences in the frequency of prescribing opioids. Figure 3.1
illustrates that about 65 to 75 percent of injured workers with pain medications received at least one opioid
prescription in most states. A higher proportion of injured workers with pain medications in Arkansas (85
percent), Louisiana (80 percent), and South Carolina (80 percent) received opioids. Frequency of opioid use
was high, even in states with the lowest prevalence among the 26 study states, with at least half of the claims
with pain medications receiving opioids in New Jersey (52 percent) and Illinois (56 percent). For the most
part, similar variations were seen across states in 2010/2012. Frequency of opioid use decreased by at least 3
percentage points in more than half of the study states. These trends are described in detail in Chapter 4.
The variation across states in frequency of opioid use was larger among injured workers with continued
use of opioids as opposed to those receiving a one-time opioid prescription. Figure 3.2 illustrates that the
interstate differences were narrow in terms of the percentage of injured workers with pain medications
receiving only one opioid prescription (22 to 34 percent). Larger interstate differences were seen in the
percentage of claims with pain medications receiving two or more opioid prescriptions (24 to 58 percent).
1 See Chapter 2 for a detailed description of how the amount of opioids per claim was constructed. 2 Technical Appendix B provides the interstate variations in the amount of opioids per claim with and without excluding the claims with extreme values (Table TA.B5). We also provide data for the amount of opioids per claim after excluding the extreme-value claims at the median and selected percentiles higher than the median (Table TA.B7). 3 2013/2015 refers to nonsurgical claims with more than seven days of lost time with injuries from October 1, 2012, through September 30, 2013, and prescriptions filled through March 31, 2015.
copyright © 2017 workers compensation research institute
33
_____________________________________________________________________________________________I N T E R S T A T E V A R I A T I O N S I N U S E O F O P I O I D S , 4 T H E D I T I O N
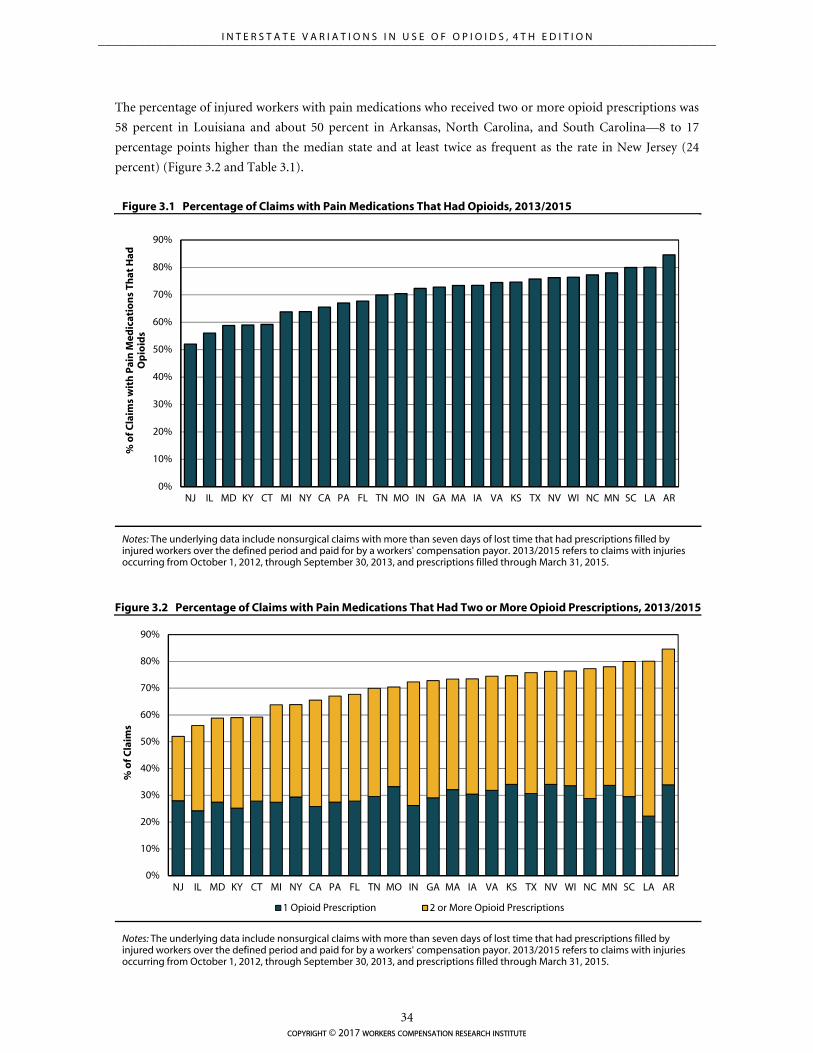
0%
10%
20%
30%
40%
50%
60%
70%
80%
90%
NJ IL MD KY CT MI NY CA PA FL TN MO IN GA MA IA VA KS TX NV WI NC MN SC LA AR
% o
f Cla
ims
1 Opioid Prescription 2 or More Opioid Prescriptions
The percentage of injured workers with pain medications who received two or more opioid prescriptions was
58 percent in Louisiana and about 50 percent in Arkansas, North Carolina, and South Carolina—8 to 17
percentage points higher than the median state and at least twice as frequent as the rate in New Jersey (24
percent) (Figure 3.2 and Table 3.1).
Figure 3.1 Percentage of Claims with Pain Medications That Had Opioids, 2013/2015
Notes: The underlying data include nonsurgical claims with more than seven days of lost time that had prescriptions filled by injured workers over the defined period and paid for by a workers' compensation payor. 2013/2015 refers to claims with injuries occurring from October 1, 2012, through September 30, 2013, and prescriptions filled through March 31, 2015.
Figure 3.2 Percentage of Claims with Pain Medications That Had Two or More Opioid Prescriptions, 2013/2015
Notes: The underlying data include nonsurgical claims with more than seven days of lost time that had prescriptions filled by injured workers over the defined period and paid for by a workers' compensation payor. 2013/2015 refers to claims with injuries occurring from October 1, 2012, through September 30, 2013, and prescriptions filled through March 31, 2015.
0%
10%
20%
30%
40%
50%
60%
70%
80%
90%
NJ IL MD KY CT MI NY CA PA FL TN MO IN GA MA IA VA KS TX NV WI NC MN SC LA AR
% o
f Cla
ims
wit
h P
ain
Med
icat
ion
s Th
at H
ad
Op
ioid
s
copyright © 2017 workers compensation research institute
34
_____________________________________________________________________________________________I N T E R S T A T E V A R I A T I O N S I N U S E O F O P I O I D S , 4 T H E D I T I O N
AMOUNT OF OPIOIDS PER CLAIM HIGHEST IN LOUISIANA, NEW YORK, AND PENNSYLVANIA
We found substantial interstate variation in the amount of opioids received by injured workers. Among the
26 states included in the study, Louisiana, New York, and Pennsylvania were the highest on the average MEA
of opioids per claim, among injured workers with more than seven days of lost time who did not have a major
surgery but received opioids.4 Note that although New York continued to be among the states with a higher-
than-typical amount of opioids per claim, we observed a decreasing trend in both the frequency and amount
of opioids received by New York injured workers. Over this same period, we observed little change in the
average amount of opioids per claim in Louisiana and Pennsylvania.
The extent of variation in the average amount of opioids received by injured workers narrowed across the
states over the three-year study period. In 2013/2015, there was a three-fold variation across the 25 states
(other than Louisiana), whereas the variation was four-fold across the same 25 states in 2010/2012.
Considering our underlying sample of claims without a major surgery, the results for Louisiana were
particularly striking. With an average amount of opioids per claim of 3,539 milligrams of morphine
equivalents, the per-claim utilization of opioids in the state was more than double the median of the 26 study
states and four times the average amount of opioids received per claim in Missouri, the state with the lowest
utilization among the study states (Figure 3.3).5 An MEA of over 3,500 milligrams per claim is fairly high. To
illustrate, it is equivalent to an injured worker taking a 5-milligram Vicodin® tablet every four hours for
nearly four months continuously, or a 120-milligram morphine equivalent daily dose for almost a month.
The utilization pattern we observed in Louisiana was mostly consistent with the former, where the average
number of days for which opioids were dispensed was over 100 days and the average daily dose of opioids
received by Louisiana workers was 36 milligrams. New York and Pennsylvania also had a higher average
amount of opioids per claim of over 2,400 milligrams—74 to 87 percent higher than the 26-state median.
Certain patterns were associated with the higher use of opioids in these three states. In Louisiana,
physicians wrote and injured workers filled more opioid prescriptions for more opioid pills. As Table 3.1
shows, on average there were 6.8 prescriptions for opioids, totaling 408 opioid pills per claim, compared with
3.5 prescriptions and 176 pills per claim for opioids in the median state. Injured workers in Pennsylvania who
had opioids received 4.4 prescriptions on average, totaling 258 opioid pills per claim. In New York, the
average number of prescriptions per claim was 3.6, which was similar to the 26-state median, whereas the
average number of pills per prescription for opioids and the average morphine equivalent milligrams of
opioids per pill were higher than in other study states, contributing to the higher utilization of opioids (Table
3.1).
The average amount of opioids received by injured workers in California, Massachusetts, North Carolina,
and South Carolina was 20–40 percent higher than the 26-state median6 (see Figure 3.3 and Table 3.1).
Compared with one of the states with the lowest use of opioids (Missouri), the average amount of opioids
received by injured workers in these four states was about 90–120 percent higher (Figure 3.3).
4 One may suspect that these states may have more serious injuries or a different mix of cases. However, we did a sensitivity analysis adjusting for differences across states in the case mix and the comparative results did not change. 5 Louisiana was also among the highest when we looked at the median values of the same measure and at different percentiles above the median (see Table TA.B7 in Technical Appendix B). 6 Differences between these states and the 26-state median are significant at the 10 percent significance level (see Table SA.1). Georgia, Texas, and Virginia were also different from the 26-state median at the 10 percent significance level. In this report we focus our discussion on states where the average amount of opioids per claim was more than 20 percent higher than the average amount in the median study state, but we provide the utilization measures for all 26 states in the study (Table 3.1).
copyright © 2017 workers compensation research institute
35
_____________________________________________________________________________________________I N T E R S T A T E V A R I A T I O N S I N U S E O F O P I O I D S , 4 T H E D I T I O N
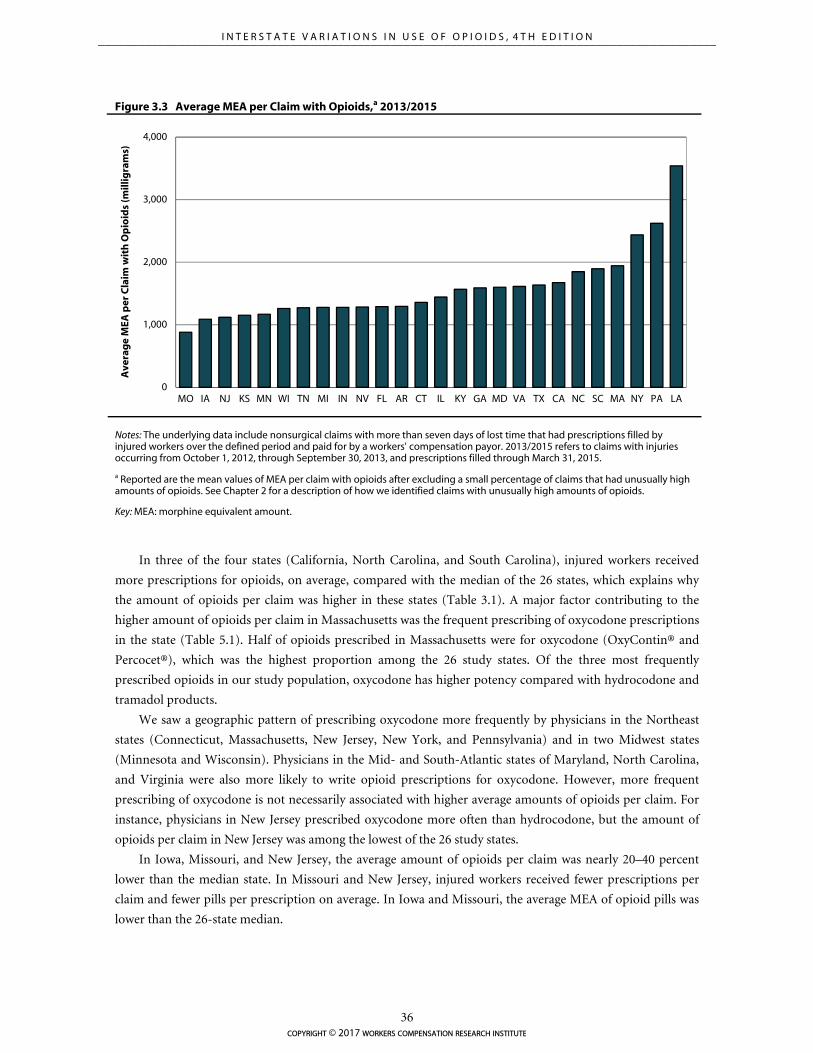
0
1,000
2,000
3,000
4,000
MO IA NJ KS MN WI TN MI IN NV FL AR CT IL KY GA MD VA TX CA NC SC MA NY PA LA
Ave
rag
e M
EA p
er C
laim
wit
h O
pio
ids
(mill
igra
ms)
Figure 3.3 Average MEA per Claim with Opioids,a 2013/2015
In three of the four states (California, North Carolina, and South Carolina), injured workers received
more prescriptions for opioids, on average, compared with the median of the 26 states, which explains why
the amount of opioids per claim was higher in these states (Table 3.1). A major factor contributing to the
higher amount of opioids per claim in Massachusetts was the frequent prescribing of oxycodone prescriptions
in the state (Table 5.1). Half of opioids prescribed in Massachusetts were for oxycodone (OxyContin® and
Percocet®), which was the highest proportion among the 26 study states. Of the three most frequently
prescribed opioids in our study population, oxycodone has higher potency compared with hydrocodone and
tramadol products.
We saw a geographic pattern of prescribing oxycodone more frequently by physicians in the Northeast
states (Connecticut, Massachusetts, New Jersey, New York, and Pennsylvania) and in two Midwest states
(Minnesota and Wisconsin). Physicians in the Mid- and South-Atlantic states of Maryland, North Carolina,
and Virginia were also more likely to write opioid prescriptions for oxycodone. However, more frequent
prescribing of oxycodone is not necessarily associated with higher average amounts of opioids per claim. For
instance, physicians in New Jersey prescribed oxycodone more often than hydrocodone, but the amount of
opioids per claim in New Jersey was among the lowest of the 26 study states.
In Iowa, Missouri, and New Jersey, the average amount of opioids per claim was nearly 20–40 percent
lower than the median state. In Missouri and New Jersey, injured workers received fewer prescriptions per
claim and fewer pills per prescription on average. In Iowa and Missouri, the average MEA of opioid pills was
lower than the 26-state median.
Notes: The underlying data include nonsurgical claims with more than seven days of lost time that had prescriptions filled by injured workers over the defined period and paid for by a workers' compensation payor. 2013/2015 refers to claims with injuries occurring from October 1, 2012, through September 30, 2013, and prescriptions filled through March 31, 2015.
a Reported are the mean values of MEA per claim with opioids after excluding a small percentage of claims that had unusually high amounts of opioids. See Chapter 2 for a description of how we identified claims with unusually high amounts of opioids.
Key: MEA: morphine equivalent amount.
copyright © 2017 workers compensation research institute
36
_____________________________________________________________________________________________I N T E R S T A T E V A R I A T I O N S I N U S E O F O P I O I D S , 4 T H E D I T I O N
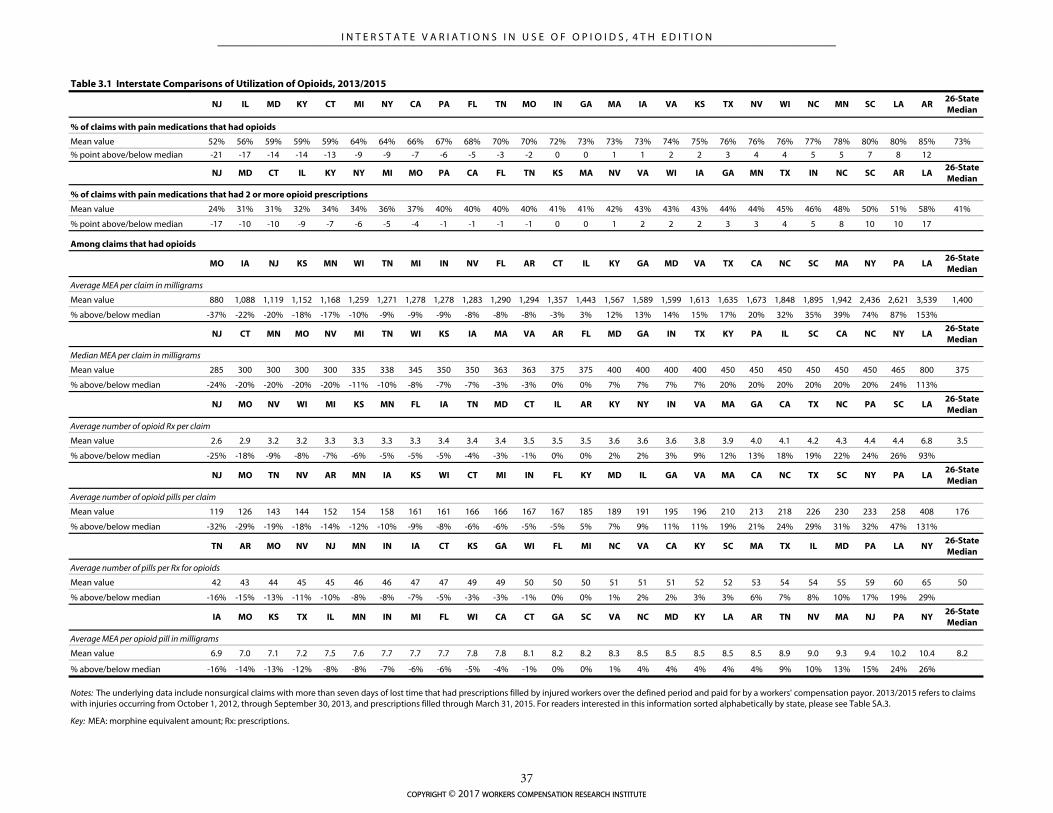
NJ IL MD KY CT MI NY CA PA FL TN MO IN GA MA IA VA KS TX NV WI NC MN SC LA AR26-State Median
% of claims with pain medications that had opioids
Mean value 52% 56% 59% 59% 59% 64% 64% 66% 67% 68% 70% 70% 72% 73% 73% 73% 74% 75% 76% 76% 76% 77% 78% 80% 80% 85% 73%
% point above/below median -21 -17 -14 -14 -13 -9 -9 -7 -6 -5 -3 -2 0 0 1 1 2 2 3 4 4 5 5 7 8 12
NJ MD CT IL KY NY MI MO PA CA FL TN KS MA NV VA WI IA GA MN TX IN NC SC AR LA26-State Median
% of claims with pain medications that had 2 or more opioid prescriptions
Mean value 24% 31% 31% 32% 34% 34% 36% 37% 40% 40% 40% 40% 41% 41% 42% 43% 43% 43% 44% 44% 45% 46% 48% 50% 51% 58% 41%
% point above/below median -17 -10 -10 -9 -7 -6 -5 -4 -1 -1 -1 -1 0 0 1 2 2 2 3 3 4 5 8 10 10 17
Among claims that had opioids
MO IA NJ KS MN WI TN MI IN NV FL AR CT IL KY GA MD VA TX CA NC SC MA NY PA LA26-State Median
Average MEA per claim in milligrams
Mean value 880 1,088 1,119 1,152 1,168 1,259 1,271 1,278 1,278 1,283 1,290 1,294 1,357 1,443 1,567 1,589 1,599 1,613 1,635 1,673 1,848 1,895 1,942 2,436 2,621 3,539 1,400
% above/below median -37% -22% -20% -18% -17% -10% -9% -9% -9% -8% -8% -8% -3% 3% 12% 13% 14% 15% 17% 20% 32% 35% 39% 74% 87% 153%
NJ CT MN MO NV MI TN WI KS IA MA VA AR FL MD GA IN TX KY PA IL SC CA NC NY LA26-State Median
Median MEA per claim in milligrams
Mean value 285 300 300 300 300 335 338 345 350 350 363 363 375 375 400 400 400 400 450 450 450 450 450 450 465 800 375
% above/below median -24% -20% -20% -20% -20% -11% -10% -8% -7% -7% -3% -3% 0% 0% 7% 7% 7% 7% 20% 20% 20% 20% 20% 20% 24% 113%
NJ MO NV WI MI KS MN FL IA TN MD CT IL AR KY NY IN VA MA GA CA TX NC PA SC LA26-State Median
Average number of opioid Rx per claim
Mean value 2.6 2.9 3.2 3.2 3.3 3.3 3.3 3.3 3.4 3.4 3.4 3.5 3.5 3.5 3.6 3.6 3.6 3.8 3.9 4.0 4.1 4.2 4.3 4.4 4.4 6.8 3.5
% above/below median -25% -18% -9% -8% -7% -6% -5% -5% -5% -4% -3% -1% 0% 0% 2% 2% 3% 9% 12% 13% 18% 19% 22% 24% 26% 93%
NJ MO TN NV AR MN IA KS WI CT MI IN FL KY MD IL GA VA MA CA NC TX SC NY PA LA26-State Median
Average number of opioid pills per claim
Mean value 119 126 143 144 152 154 158 161 161 166 166 167 167 185 189 191 195 196 210 213 218 226 230 233 258 408 176
% above/below median -32% -29% -19% -18% -14% -12% -10% -9% -8% -6% -6% -5% -5% 5% 7% 9% 11% 11% 19% 21% 24% 29% 31% 32% 47% 131%
TN AR MO NV NJ MN IN IA CT KS GA WI FL MI NC VA CA KY SC MA TX IL MD PA LA NY26-State Median
Average number of pills per Rx for opioids
Mean value 42 43 44 45 45 46 46 47 47 49 49 50 50 50 51 51 51 52 52 53 54 54 55 59 60 65 50
% above/below median -16% -15% -13% -11% -10% -8% -8% -7% -5% -3% -3% -1% 0% 0% 1% 2% 2% 3% 3% 6% 7% 8% 10% 17% 19% 29%
IA MO KS TX IL MN IN MI FL WI CA CT GA SC VA NC MD KY LA AR TN NV MA NJ PA NY26-State Median
Average MEA per opioid pill in milligrams
Mean value 6.9 7.0 7.1 7.2 7.5 7.6 7.7 7.7 7.7 7.8 7.8 8.1 8.2 8.2 8.3 8.5 8.5 8.5 8.5 8.5 8.9 9.0 9.3 9.4 10.2 10.4 8.2
% above/below median -16% -14% -13% -12% -8% -8% -7% -6% -6% -5% -4% -1% 0% 0% 1% 4% 4% 4% 4% 4% 9% 10% 13% 15% 24% 26%
Key: MEA: morphine equivalent amount; Rx: prescriptions.
Notes: The underlying data include nonsurgical claims with more than seven days of lost time that had prescriptions filled by injured workers over the defined period and paid for by a workers' compensation payor. 2013/2015 refers to claims with injuries occurring from October 1, 2012, through September 30, 2013, and prescriptions filled through March 31, 2015. For readers interested in this information sorted alphabetically by state, please see Table SA.3.
Table 3.1 Interstate Comparisons of Utilization of Opioids, 2013/2015
copyright © 2017 workers compensation research institute
37
_____________________________________________________________________________________________I N T E R S T A T E V A R I A T I O N S I N U S E O F O P I O I D S , 4 T H E D I T I O N
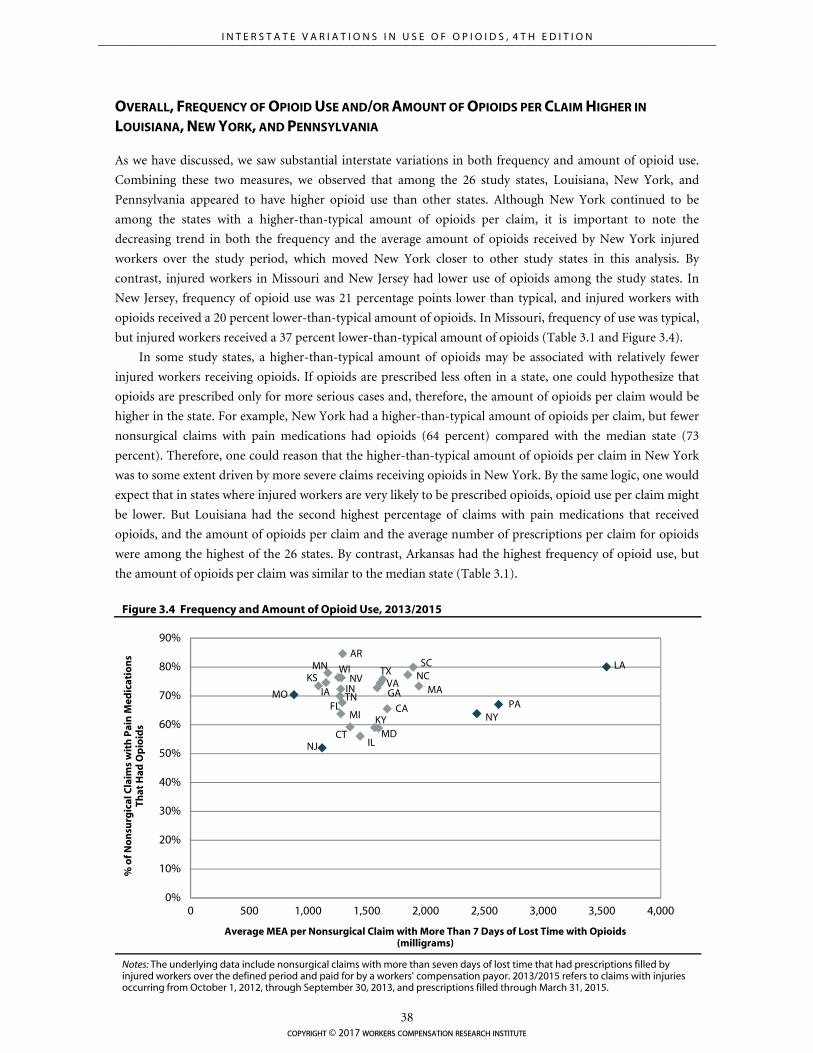
AR
CA
CT
FLGAIA
IL
INKS
KY
LA
MA
MD
MI
MN
MO
NC
NJ
NV
NYPA
SC
TN
TXVA
WI
0%
10%
20%
30%
40%
50%
60%
70%
80%
90%
0 500 1,000 1,500 2,000 2,500 3,000 3,500 4,000
% o
f No
nsu
rgic
al C
laim
s w
ith
Pai
n M
edic
atio
ns
That
Had
Op
ioid
s
Average MEA per Nonsurgical Claim with More Than 7 Days of Lost Time with Opioids (milligrams)
OVERALL, FREQUENCY OF OPIOID USE AND/OR AMOUNT OF OPIOIDS PER CLAIM HIGHER IN
LOUISIANA, NEW YORK, AND PENNSYLVANIA
As we have discussed, we saw substantial interstate variations in both frequency and amount of opioid use.
Combining these two measures, we observed that among the 26 study states, Louisiana, New York, and
Pennsylvania appeared to have higher opioid use than other states. Although New York continued to be
among the states with a higher-than-typical amount of opioids per claim, it is important to note the
decreasing trend in both the frequency and the average amount of opioids received by New York injured
workers over the study period, which moved New York closer to other study states in this analysis. By
contrast, injured workers in Missouri and New Jersey had lower use of opioids among the study states. In
New Jersey, frequency of opioid use was 21 percentage points lower than typical, and injured workers with
opioids received a 20 percent lower-than-typical amount of opioids. In Missouri, frequency of use was typical,
but injured workers received a 37 percent lower-than-typical amount of opioids (Table 3.1 and Figure 3.4).
In some study states, a higher-than-typical amount of opioids may be associated with relatively fewer
injured workers receiving opioids. If opioids are prescribed less often in a state, one could hypothesize that
opioids are prescribed only for more serious cases and, therefore, the amount of opioids per claim would be
higher in the state. For example, New York had a higher-than-typical amount of opioids per claim, but fewer
nonsurgical claims with pain medications had opioids (64 percent) compared with the median state (73
percent). Therefore, one could reason that the higher-than-typical amount of opioids per claim in New York
was to some extent driven by more severe claims receiving opioids in New York. By the same logic, one would
expect that in states where injured workers are very likely to be prescribed opioids, opioid use per claim might
be lower. But Louisiana had the second highest percentage of claims with pain medications that received
opioids, and the amount of opioids per claim and the average number of prescriptions per claim for opioids
were among the highest of the 26 states. By contrast, Arkansas had the highest frequency of opioid use, but
the amount of opioids per claim was similar to the median state (Table 3.1).
Figure 3.4 Frequency and Amount of Opioid Use, 2013/2015
Notes: The underlying data include nonsurgical claims with more than seven days of lost time that had prescriptions filled by injured workers over the defined period and paid for by a workers' compensation payor. 2013/2015 refers to claims with injuries occurring from October 1, 2012, through September 30, 2013, and prescriptions filled through March 31, 2015.
copyright © 2017 workers compensation research institute
38
_____________________________________________________________________________________________I N T E R S T A T E V A R I A T I O N S I N U S E O F O P I O I D S , 4 T H E D I T I O N
LARGE VARIATION IN DURATION OF OPIOID USE, WHILE AVERAGE DAILY DOSE VARIED LITTLE
This section presents the key findings on variations in the duration and dose of opioids prescribed to injured
workers across 17 states. We also report the frequency of injured workers receiving chronic opioids and
higher-dose opioids.7 The results are based on claims with complete days of supply associated with all opioid
prescriptions across 17 states that have higher, typical, and lower frequency and amounts of opioids.8 As
discussed previously, this claim selection is unlikely to bias interstate comparisons. Table 3.2 shows that
among 2013/2015 claims with opioids, the average duration of opioids per claim ranged from 30 to 50 days
across most states.9 Consistent with the findings of a higher average amount of opioids per claim and a higher
number of opioid prescriptions, we found that the average duration of opioids was also higher in Louisiana.
Louisiana workers received opioids for 104 days, on average, compared with 44 days in the 17-state median.
The figure was also higher in New York, South Carolina, and Texas (55–63 days). The average MED varied
little across the study states, from 32 to 42 milligrams.
Injured workers in some states received chronic opioids and high-dose opioids more frequently.10 In
2013/2015, 7–13 percent of injured workers with opioids received at least 60 days of opioids supply over any
90-day period (our measure of chronic opioid use) in 9 of the 17 states. The proportion was higher in
Louisiana (29 percent) and more than one in seven in Kentucky, Massachusetts, Michigan, New York, North
Carolina, South Carolina, and Texas (15–19 percent) (Table 3.2). Note that some of these injured workers
could have had one such 90-day episode where they received opioids for at least 60 days, while others could
have had multiple episodes of chronic opioid therapy. Table SA.5 provides the frequency of injured workers
with multiple episodes of chronic opioid therapy. Among injured workers receiving opioids, we observed
relatively smaller interstate variation in those with only one 90-day period with chronic opioid therapy (4–10
percent), as opposed to those with multiple episodes (2–20 percent).
A sizable proportion of claims in Louisiana and New York received high-dose opioids for at least 60 days
during the study period. Among injured workers receiving opioids in these two states, 5–6 percent had an
MED exceeding 50 milligrams for at least 60 days during the study period. In New York, 2.3 percent of
injured workers had an MED exceeding 90 milligrams for at least 60 days.11 Frequency of injured workers
receiving chronic and high-dose opioids during the same 90-day period was also higher in Louisiana and New 7 The opioid use metrics used to characterize chronic opioid use and high-dose opioid use are consistent with the measures proposed by the Washington State Dr. Robert Bree Collaborative and the Washington State Agency Medical Directors’ Group. Chronic opioid use is defined as receiving opioids for at least 60 days over any continuous 90-day period during the study period, and high-dose opioid use is defined as receiving an opioid daily dose of more than 50 and 90 morphine equivalent milligrams for at least 60 days during the observation period. See Chapter 2 for details. 8 Days of supply information was incomplete or claims with days of supply were not representative of all claims with opioids in the other nine states. Readers interested in the interstate variations and trends in the use of opioids on a longer-term basis across the 26 states may refer to the study Longer-Term Dispensing of Opioids, 4th Edition (Wang, 2017). In that study, opioid use on a longer-term basis is characterized as receiving opioids within the first three months after the injury and having three or more visits to fill opioid prescriptions between the 7th and 12th months after the injury. 9 Throughout the report, we use the term average duration of opioids per claim or average number of opioid days per claim to refer to the average number of days for which the injured worker received opioids during the average 24-month observation period. 10 Note that we report these utilization measures after excluding claims that had unusually high amounts of opioids per claim throughout this report. Claim frequencies are within 0.5 percentage points including or excluding these claims, and the characterization of states as higher, typical, or lower does not change. 11 The CDC guidelines for prescribing opioids for chronic pain caution prescribers to reassess the risks and benefits to the patient when prescribing an MED exceeding 50 milligrams and to avoid an MED exceeding 90 milligrams; they recommend tapering if the dose exceeds 90 milligrams MED. Higher daily dose limits are recommended by some other state guidelines (e.g., the Massachusetts Chronic Pain Treatment Guidelines recommend a maximum daily dose of 120 milligrams MED). Table TA.B1 in Longer-Term Dispensing of Opioids, 4th Edition (Wang, 2017) provides the maximum daily dose recommendations of select guidelines used in and outside workers’ compensation. Higher limits recommended by other guidelines may understate the potential harm of high-dose opioid therapy in our population of injured workers without a major surgery evaluated at an average 24 months’ maturity.
copyright © 2017 workers compensation research institute
39
_____________________________________________________________________________________________I N T E R S T A T E V A R I A T I O N S I N U S E O F O P I O I D S , 4 T H E D I T I O N
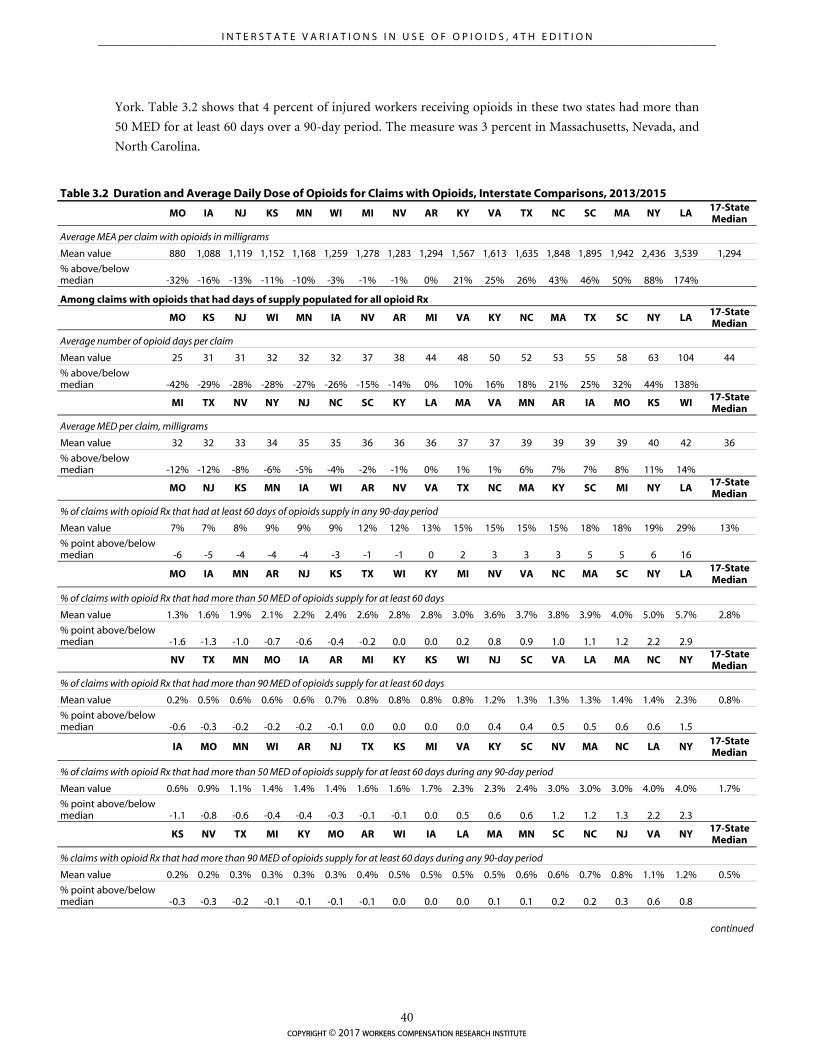
York. Table 3.2 shows that 4 percent of injured workers receiving opioids in these two states had more than
50 MED for at least 60 days over a 90-day period. The measure was 3 percent in Massachusetts, Nevada, and
North Carolina.
Table 3.2 Duration and Average Daily Dose of Opioids for Claims with Opioids, Interstate Comparisons, 2013/2015
MO IA NJ KS MN WI MI NV AR KY VA TX NC SC MA NY LA 17-State Median
Average MEA per claim with opioids in milligrams
Mean value 880 1,088 1,119 1,152 1,168 1,259 1,278 1,283 1,294 1,567 1,613 1,635 1,848 1,895 1,942 2,436 3,539 1,294
% above/below median -32% -16% -13% -11% -10% -3% -1% -1% 0% 21% 25% 26% 43% 46% 50% 88% 174%
Among claims with opioids that had days of supply populated for all opioid Rx
MO KS NJ WI MN IA NV AR MI VA KY NC MA TX SC NY LA 17-State Median
Average number of opioid days per claim
Mean value 25 31 31 32 32 32 37 38 44 48 50 52 53 55 58 63 104 44
% above/below median -42% -29% -28% -28% -27% -26% -15% -14% 0% 10% 16% 18% 21% 25% 32% 44% 138%
MI TX NV NY NJ NC SC KY LA MA VA MN AR IA MO KS WI 17-State Median
Average MED per claim, milligrams
Mean value 32 32 33 34 35 35 36 36 36 37 37 39 39 39 39 40 42 36
% above/below median -12% -12% -8% -6% -5% -4% -2% -1% 0% 1% 1% 6% 7% 7% 8% 11% 14%
MO NJ KS MN IA WI AR NV VA TX NC MA KY SC MI NY LA 17-State Median
% of claims with opioid Rx that had at least 60 days of opioids supply in any 90-day period
Mean value 7% 7% 8% 9% 9% 9% 12% 12% 13% 15% 15% 15% 15% 18% 18% 19% 29% 13%
% point above/below median -6 -5 -4 -4 -4 -3 -1 -1 0 2 3 3 3 5 5 6 16
MO IA MN AR NJ KS TX WI KY MI NV VA NC MA SC NY LA 17-State Median
% of claims with opioid Rx that had more than 50 MED of opioids supply for at least 60 days
Mean value 1.3% 1.6% 1.9% 2.1% 2.2% 2.4% 2.6% 2.8% 2.8% 3.0% 3.6% 3.7% 3.8% 3.9% 4.0% 5.0% 5.7% 2.8%
% point above/below median -1.6 -1.3 -1.0 -0.7 -0.6 -0.4 -0.2 0.0 0.0 0.2 0.8 0.9 1.0 1.1 1.2 2.2 2.9
NV TX MN MO IA AR MI KY KS WI NJ SC VA LA MA NC NY 17-State Median
% of claims with opioid Rx that had more than 90 MED of opioids supply for at least 60 days
Mean value 0.2% 0.5% 0.6% 0.6% 0.6% 0.7% 0.8% 0.8% 0.8% 0.8% 1.2% 1.3% 1.3% 1.3% 1.4% 1.4% 2.3% 0.8%
% point above/below median -0.6 -0.3 -0.2 -0.2 -0.2 -0.1 0.0 0.0 0.0 0.0 0.4 0.4 0.5 0.5 0.6 0.6 1.5
IA MO MN WI AR NJ TX KS MI VA KY SC NV MA NC LA NY 17-State Median
% of claims with opioid Rx that had more than 50 MED of opioids supply for at least 60 days during any 90-day period
Mean value 0.6% 0.9% 1.1% 1.4% 1.4% 1.4% 1.6% 1.6% 1.7% 2.3% 2.3% 2.4% 3.0% 3.0% 3.0% 4.0% 4.0% 1.7%
% point above/below median -1.1 -0.8 -0.6 -0.4 -0.4 -0.3 -0.1 -0.1 0.0 0.5 0.6 0.6 1.2 1.2 1.3 2.2 2.3
KS NV TX MI KY MO AR WI IA LA MA MN SC NC NJ VA NY 17-State Median
% claims with opioid Rx that had more than 90 MED of opioids supply for at least 60 days during any 90-day period
Mean value 0.2% 0.2% 0.3% 0.3% 0.3% 0.3% 0.4% 0.5% 0.5% 0.5% 0.5% 0.6% 0.6% 0.7% 0.8% 1.1% 1.2% 0.5%
% point above/below median -0.3 -0.3 -0.2 -0.1 -0.1 -0.1 -0.1 0.0 0.0 0.0 0.1 0.1 0.2 0.2 0.3 0.6 0.8
continued
copyright © 2017 workers compensation research institute
40
_____________________________________________________________________________________________I N T E R S T A T E V A R I A T I O N S I N U S E O F O P I O I D S , 4 T H E D I T I O N
Table 3.2 Duration and Average Daily Dose of Opioids for Claims with Opioids, Interstate Comparisons, 2013/2015 (continued)
Notes: The underlying data include nonsurgical claims with more than seven days of lost time that had prescriptions filled by injured workers over the defined period and paid for by a workers’ compensation payor. 2013/2015 refers to claims with injuries occurring from October 1, 2012, through September 30, 2013, and prescriptions filled through March 31, 2015. The 17 states included in this table are those where the days of supply is complete for all opioid prescriptions for a majority of claims in the state and claims with complete days of supply are substantially representative of all claims with opioids. For readers interested in this information sorted alphabetically by state, please see Table SA.4.
Key: MEA: morphine equivalent amount; MED: morphine equivalent daily dose in milligrams; Rx: prescriptions.
A higher percentage of workers receiving chronic opioids had an MED exceeding 50 and 90 milligrams
for at least 60 days during the study period. Of the states with higher claim frequency of chronic opioid
therapy, Massachusetts, New York, and North Carolina also had a higher percentage of workers receiving an
MED exceeding 50 milligrams (23 to 25 percent) and 90 milligrams (9 to 12 percent) for at least 60 days.
These three states had a relatively higher frequency of use of stronger Schedule II opioids such as Oxycontin®
and Percocet®. Relatively fewer workers receiving chronic opioids in Kentucky, Michigan, and Texas had
high-dose opioids—15 to 16 percent exceeded 50 MED and 4 to 5 percent exceeded 90 MED for at least 60
days.
It should be noted that area variation studies such as this one do not provide indications of whether or
not the observed level of opioid use is medically necessary; however, they do highlight the states that have
higher or lower opioid use than the median state. The large interstate variations we saw in opioid utilization
among injured workers are not likely to be solely a reflection of differences in case mix across states. Adjusting
for differences across states in demographics and injury/industry mix resulted in a narrowing of the interstate
variations as expected, but large variations in opioid utilization across states were seen even after controlling
for case mix. In 2013/2015, there was a four-fold variation across the 26 states in the average amount of
opioids per claim, whereas the variation was three-fold after adjusting for case mix. Moreover, the
characterization of states as higher, in the middle, or lower did not change.12
There are many factors that may explain the interstate variations we observed, including workers’
compensation policies for pharmaceuticals (e.g., pharmacy fee schedule, physician dispensing, provider
choice, and treatment guidelines for pain management), policies outside workers’ compensation (e.g., state
PDMPs and state pain policies), and industry practices. While analyzing the impact of these factors is beyond
the scope of this study, we provide some background information about these possible factors that may help
the reader to interpret the results (see Technical Appendix A).
Since the workers’ compensation benefit structure and claims administration may influence claim
development differently among the states, these may also explain some of the interstate differences in opioid
use among the states. We found that among the states studied, a greater amount of opioids received per claim
was associated with a higher proportion of claims that had longer disability duration (Table TA.B9). Among
the states studied, Louisiana, Massachusetts, Michigan, Pennsylvania, and Virginia are wage-loss states,13
where the average duration of temporary disability was longer than in the other states (except in Michigan
and Virginia). In New York, claims usually stay open for a longer period of time. One possible explanation for
the higher utilization of opioids per claim in these states may be because more claims stayed open and still
received medical services as claims became more mature. Alternately, opioids may have contributed to
injured workers staying out of work longer. For instance, a prospective study reported that, after controlling 12 See Table TA.B4. 13 Under a wage-loss benefit system, workers typically continue to receive temporary disability benefits so long as they experience wage loss because of the work-related injury. States with a wage-loss benefit structure are expected to have longer duration of temporary disability because most indemnity benefits are paid as temporary disability benefits.
copyright © 2017 workers compensation research institute
41
_____________________________________________________________________________________________I N T E R S T A T E V A R I A T I O N S I N U S E O F O P I O I D S , 4 T H E D I T I O N
for injury severity and workers’ self-reported pain and function, workers with back injuries receiving opioids
for more than seven days within six weeks of the first medical visit were more likely to receive disability
benefits one year after the injury compared with those without opioids.14 That study also found that the odds
of receiving disability benefits at one year were doubled when injured workers received two or more
prescriptions compared with no opioid prescriptions. Early opioid prescriptions within 15 days of injury were
found to be associated with continued opioid use and longer disability duration in another study.15 We found
that Louisiana, New York, and Pennsylvania continued to be the states with the highest amount of opioids
per claim even after controlling for disability duration.16 While a more rigorous analysis is needed to analyze
the precise impact of workers’ compensation system features contributing to longer disability duration on the
use of opioids in these states, the sensitivity analysis suggests that it is unlikely to change how the states are
characterized as higher or lower states in the use of opioids.
We also analyzed the patterns of opioid utilization at the end of each quarter postinjury and found that
the amount of opioids per claim in the states with high use of opioids (Louisiana, New York, and
Pennsylvania) was already higher at the end of the second quarter postinjury (see Table TA.B8).
14 Franklin et al. (2008). 15 Webster, Verma, and Gatchel (2007). 16 For more details, refer to the section “How Do States Compare on the Use of Opioids by Duration of Temporary Disability?” in Technical Appendix B.
copyright © 2017 workers compensation research institute
42
_____________________________________________________________________________________________I N T E R S T A T E V A R I A T I O N S I N U S E O F O P I O I D S , 4 T H E D I T I O N
4
TEMPORAL VARIATIONS IN USE OF OPIOIDS
Since the late 1990s, the use of prescription opioids has continued to increase rapidly, coinciding with a sharp
increase in unintended drug overdose deaths in the United States.1 The beginning of this decade marks the
time when opioid utilization rates were at their peak in a number of states. Since then, a few studies have
noted a decrease in opioid prescriptions in several states.2 These changing trends may be driven by the
numerous efforts at the federal, state, and organization levels in recent years to combat opioid overuse and
abuse. Similar changes were seen in some state workers’ compensation systems.3 In this study we found that
opioid utilization decreased between 2010/2012 and 2013/2015 in the majority of workers’ compensation
jurisdictions included in this report.4,5 It remains to be seen whether the decrease in opioid utilization we
observed in this study marks the beginning of a longer-term trend. Our report serves as a tool to monitor the
results of the ongoing policy changes that have been directed at opioid prescribing in the workers’
compensation systems in 26 states.
In this chapter we highlight states with rapid growths and declines in the frequency of use of opioids and
amount of opioids per claim between 2010/2012 and 2013/2015.6 In the previous edition of this study
covering data from 2010/2012 to 2012/2014, we reported noteworthy reductions in the amount of opioid use
across several states. With one more year of data, we continued to observe the downward trends. Changes in
several utilization measures are reported in this section to decompose the change in the amount of opioids
per claim in these states, including the average number of prescriptions and the average number of pills per
claim for opioids, and the frequency of prescribing opioids, by type of opioids (i.e., Schedule II opioids versus
other opioids)7 and dispensing point (i.e., physician- and pharmacy-dispensed opioid prescriptions). It is
1 Ahmedani et al. (2014) reported that the rate of opioid pharmacy fills, quantity of opioids prescribed, and proportion of chronic opioid users increased consistently by more than two-fold between 1997 and 2011, with the exception of a one-time drop in 2010 that the authors attributed to the market withdrawal of propoxyphene. The CDC reported that the age-adjusted rate of drug overdose deaths increased from 6 to 15 per 100,000 population between 2000 and 2014, and the age-adjusted rate of drug overdose deaths involving opioids increased from about 3 to 9 per 100,000 population (Rudd et al., 2016a). 2 Dart et al. (2015) examined trends in opioid abuse and mortality between 2002 and 2013 in the United States using data from IMS and Researched Abuse, Diversion, and Addiction Related Surveillance (RADARS) systems. They observed an increase in opioid prescriptions between 2002 and 2010 and a slight decrease in the measure from 2011 through 2013. The authors reported similar trends in other measures of opioid diversion, abuse, and opioid-related deaths. Florida also reported a decrease in opioid overdose deaths after the pill mill legislation became effective, from an all-time high of 3,201 deaths in 2010 to 2,666 in 2012 (Johnson et al., 2014). 3 Ireland, Young, and Swedlow (2014) and Thumula (2014). 4 The underlying data include nonsurgical claims with more than seven days of lost time that had prescriptions filled by injured workers over the defined period and paid for by a workers’ compensation payor. 2013/2015 refers to claims with injuries occurring from October 1, 2012, through September 30, 2013, and prescriptions filled through March 31, 2015. Similar notation is used for other years. 5 A decrease in the amount of opioids received by the average injured worker was witnessed in a vast majority of states during the time period covered in this study. Although we started to observe a decrease in opioid use in a few states (e.g., Connecticut and Virginia) between 2008/2010 and 2010/2012 in the second edition of this report, the decreasing trend was not seen in the other study states (Thumula, Wang, and Liu, 2014). 6 In this study, we report the amount of opioids per claim after excluding claims that had unusually high amounts of opioids. By doing so, we made sure that the trend results would not be unduly sensitive to claims with extreme values. This exclusion did not change the frequency of opioid use. See Technical Appendix B for more details. 7 Schedule II opioids prescribed to injured workers across the 26 study states include oxycodone, hydrocodone, fentanyl, morphine, oxymorphone, hydromorphone, tapentadol, and methadone. Other opioids include tramadol, propoxyphene,
copyright © 2017 workers compensation research institute
43
_____________________________________________________________________________________________I N T E R S T A T E V A R I A T I O N S I N U S E O F O P I O I D S , 4 T H E D I T I O N
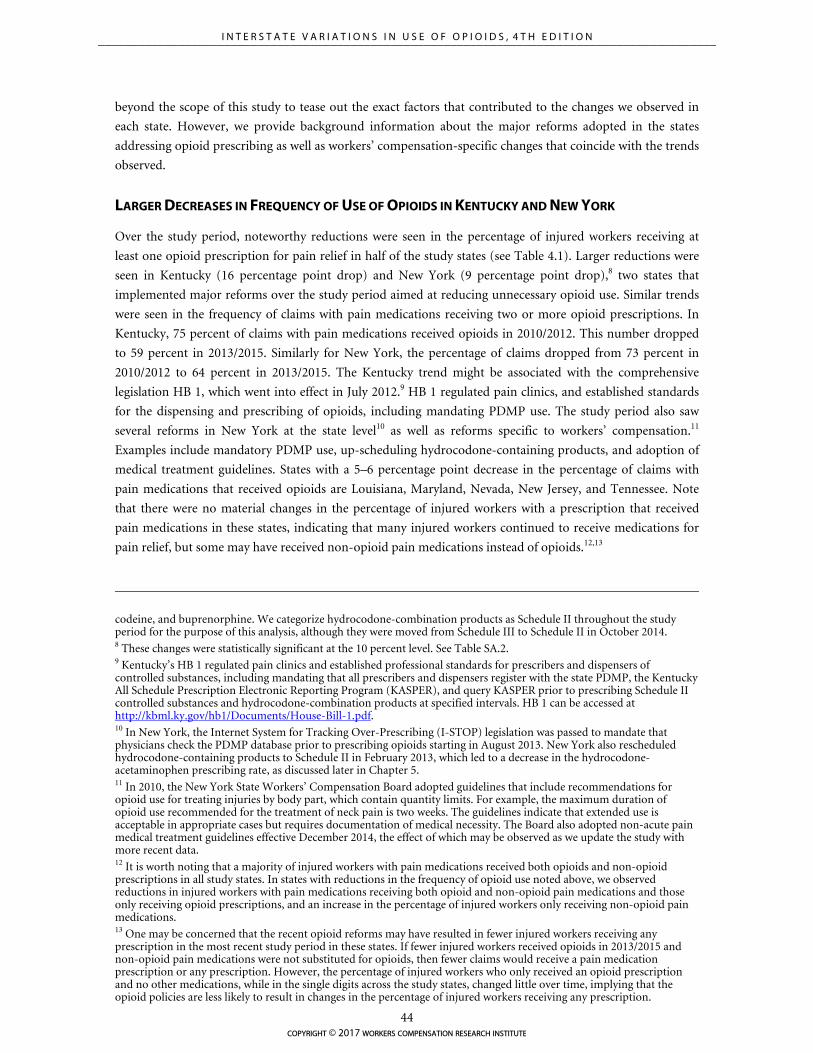
beyond the scope of this study to tease out the exact factors that contributed to the changes we observed in
each state. However, we provide background information about the major reforms adopted in the states
addressing opioid prescribing as well as workers’ compensation-specific changes that coincide with the trends
observed.
LARGER DECREASES IN FREQUENCY OF USE OF OPIOIDS IN KENTUCKY AND NEW YORK
Over the study period, noteworthy reductions were seen in the percentage of injured workers receiving at
least one opioid prescription for pain relief in half of the study states (see Table 4.1). Larger reductions were
seen in Kentucky (16 percentage point drop) and New York (9 percentage point drop),8 two states that
implemented major reforms over the study period aimed at reducing unnecessary opioid use. Similar trends
were seen in the frequency of claims with pain medications receiving two or more opioid prescriptions. In
Kentucky, 75 percent of claims with pain medications received opioids in 2010/2012. This number dropped
to 59 percent in 2013/2015. Similarly for New York, the percentage of claims dropped from 73 percent in
2010/2012 to 64 percent in 2013/2015. The Kentucky trend might be associated with the comprehensive
legislation HB 1, which went into effect in July 2012.9 HB 1 regulated pain clinics, and established standards
for the dispensing and prescribing of opioids, including mandating PDMP use. The study period also saw
several reforms in New York at the state level10 as well as reforms specific to workers’ compensation.11
Examples include mandatory PDMP use, up-scheduling hydrocodone-containing products, and adoption of
medical treatment guidelines. States with a 5–6 percentage point decrease in the percentage of claims with
pain medications that received opioids are Louisiana, Maryland, Nevada, New Jersey, and Tennessee. Note
that there were no material changes in the percentage of injured workers with a prescription that received
pain medications in these states, indicating that many injured workers continued to receive medications for
pain relief, but some may have received non-opioid pain medications instead of opioids.12,13
codeine, and buprenorphine. We categorize hydrocodone-combination products as Schedule II throughout the study period for the purpose of this analysis, although they were moved from Schedule III to Schedule II in October 2014. 8 These changes were statistically significant at the 10 percent level. See Table SA.2. 9 Kentucky’s HB 1 regulated pain clinics and established professional standards for prescribers and dispensers of controlled substances, including mandating that all prescribers and dispensers register with the state PDMP, the Kentucky All Schedule Prescription Electronic Reporting Program (KASPER), and query KASPER prior to prescribing Schedule II controlled substances and hydrocodone-combination products at specified intervals. HB 1 can be accessed at http://kbml.ky.gov/hb1/Documents/House-Bill-1.pdf. 10 In New York, the Internet System for Tracking Over-Prescribing (I-STOP) legislation was passed to mandate that physicians check the PDMP database prior to prescribing opioids starting in August 2013. New York also rescheduled hydrocodone-containing products to Schedule II in February 2013, which led to a decrease in the hydrocodone-acetaminophen prescribing rate, as discussed later in Chapter 5. 11 In 2010, the New York State Workers’ Compensation Board adopted guidelines that include recommendations for opioid use for treating injuries by body part, which contain quantity limits. For example, the maximum duration of opioid use recommended for the treatment of neck pain is two weeks. The guidelines indicate that extended use is acceptable in appropriate cases but requires documentation of medical necessity. The Board also adopted non-acute pain medical treatment guidelines effective December 2014, the effect of which may be observed as we update the study with more recent data. 12 It is worth noting that a majority of injured workers with pain medications received both opioids and non-opioid prescriptions in all study states. In states with reductions in the frequency of opioid use noted above, we observed reductions in injured workers with pain medications receiving both opioid and non-opioid pain medications and those only receiving opioid prescriptions, and an increase in the percentage of injured workers only receiving non-opioid pain medications. 13 One may be concerned that the recent opioid reforms may have resulted in fewer injured workers receiving any prescription in the most recent study period in these states. If fewer injured workers received opioids in 2013/2015 and non-opioid pain medications were not substituted for opioids, then fewer claims would receive a pain medication prescription or any prescription. However, the percentage of injured workers who only received an opioid prescription and no other medications, while in the single digits across the study states, changed little over time, implying that the opioid policies are less likely to result in changes in the percentage of injured workers receiving any prescription.
copyright © 2017 workers compensation research institute
44
_____________________________________________________________________________________________I N T E R S T A T E V A R I A T I O N S I N U S E O F O P I O I D S , 4 T H E D I T I O N
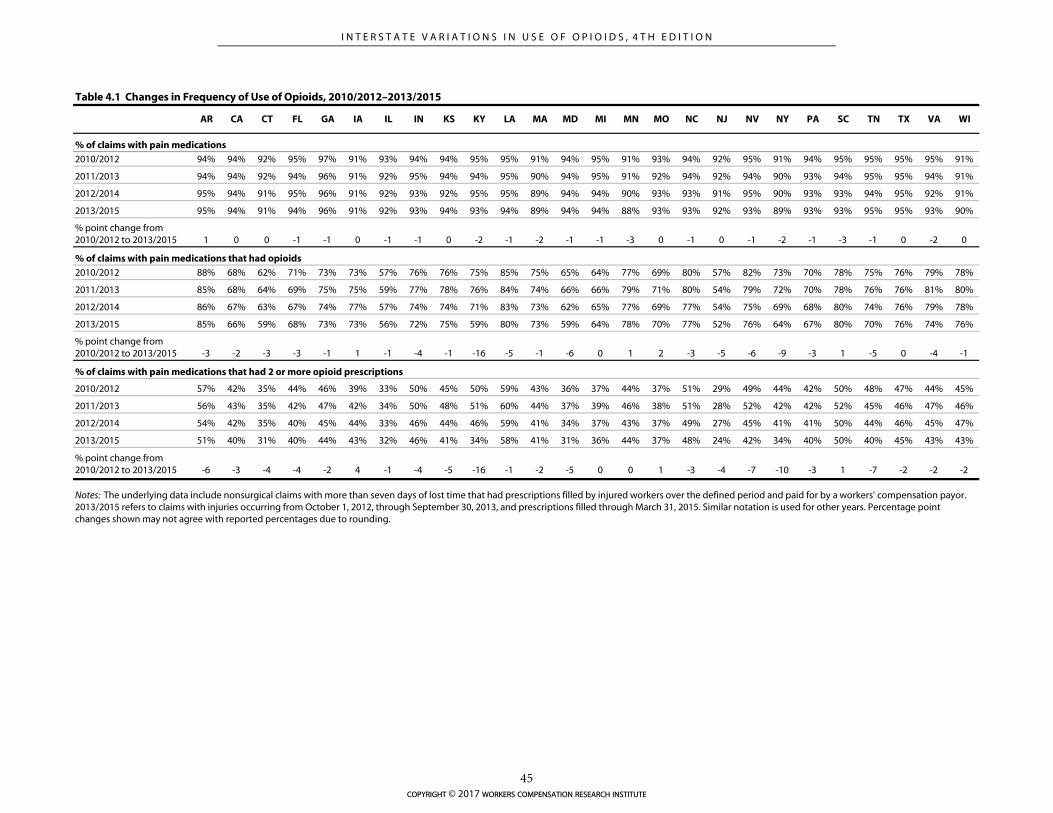
AR CA CT FL GA IA IL IN KS KY LA MA MD MI MN MO NC NJ NV NY PA SC TN TX VA WI
% of claims with pain medications
2010/2012 94% 94% 92% 95% 97% 91% 93% 94% 94% 95% 95% 91% 94% 95% 91% 93% 94% 92% 95% 91% 94% 95% 95% 95% 95% 91%
2011/2013 94% 94% 92% 94% 96% 91% 92% 95% 94% 94% 95% 90% 94% 95% 91% 92% 94% 92% 94% 90% 93% 94% 95% 95% 94% 91%
2012/2014 95% 94% 91% 95% 96% 91% 92% 93% 92% 95% 95% 89% 94% 94% 90% 93% 93% 91% 95% 90% 93% 93% 94% 95% 92% 91%
2013/2015 95% 94% 91% 94% 96% 91% 92% 93% 94% 93% 94% 89% 94% 94% 88% 93% 93% 92% 93% 89% 93% 93% 95% 95% 93% 90%
% point change from 2010/2012 to 2013/2015 1 0 0 -1 -1 0 -1 -1 0 -2 -1 -2 -1 -1 -3 0 -1 0 -1 -2 -1 -3 -1 0 -2 0
% of claims with pain medications that had opioids
2010/2012 88% 68% 62% 71% 73% 73% 57% 76% 76% 75% 85% 75% 65% 64% 77% 69% 80% 57% 82% 73% 70% 78% 75% 76% 79% 78%
2011/2013 85% 68% 64% 69% 75% 75% 59% 77% 78% 76% 84% 74% 66% 66% 79% 71% 80% 54% 79% 72% 70% 78% 76% 76% 81% 80%
2012/2014 86% 67% 63% 67% 74% 77% 57% 74% 74% 71% 83% 73% 62% 65% 77% 69% 77% 54% 75% 69% 68% 80% 74% 76% 79% 78%
2013/2015 85% 66% 59% 68% 73% 73% 56% 72% 75% 59% 80% 73% 59% 64% 78% 70% 77% 52% 76% 64% 67% 80% 70% 76% 74% 76%
% point change from 2010/2012 to 2013/2015 -3 -2 -3 -3 -1 1 -1 -4 -1 -16 -5 -1 -6 0 1 2 -3 -5 -6 -9 -3 1 -5 0 -4 -1
% of claims with pain medications that had 2 or more opioid prescriptions
2010/2012 57% 42% 35% 44% 46% 39% 33% 50% 45% 50% 59% 43% 36% 37% 44% 37% 51% 29% 49% 44% 42% 50% 48% 47% 44% 45%
2011/2013 56% 43% 35% 42% 47% 42% 34% 50% 48% 51% 60% 44% 37% 39% 46% 38% 51% 28% 52% 42% 42% 52% 45% 46% 47% 46%
2012/2014 54% 42% 35% 40% 45% 44% 33% 46% 44% 46% 59% 41% 34% 37% 43% 37% 49% 27% 45% 41% 41% 50% 44% 46% 45% 47%
2013/2015 51% 40% 31% 40% 44% 43% 32% 46% 41% 34% 58% 41% 31% 36% 44% 37% 48% 24% 42% 34% 40% 50% 40% 45% 43% 43%
% point change from 2010/2012 to 2013/2015 -6 -3 -4 -4 -2 4 -1 -4 -5 -16 -1 -2 -5 0 0 1 -3 -4 -7 -10 -3 1 -7 -2 -2 -2
Table 4.1 Changes in Frequency of Use of Opioids, 2010/2012–2013/2015
Notes: The underlying data include nonsurgical claims with more than seven days of lost time that had prescriptions filled by injured workers over the defined period and paid for by a workers' compensation payor. 2013/2015 refers to claims with injuries occurring from October 1, 2012, through September 30, 2013, and prescriptions filled through March 31, 2015. Similar notation is used for other years. Percentage point changes shown may not agree with reported percentages due to rounding.
copyright © 2017 workers compensation research institute
45
_____________________________________________________________________________________________I N T E R S T A T E V A R I A T I O N S I N U S E O F O P I O I D S , 4 T H E D I T I O N
AMOUNT OF OPIOIDS PER CLAIM DECREASED IN THE MAJORITY OF STATES
Over the study period from 2010/2012 to 2013/2015, the amount of opioids received by injured workers
decreased in the majority of states. Figure 4.1 presents the average amount of opioids received per claim in
2010/2012 and the change in the same measure between 2010/2012 and 2013/2015. Table 4.2 provides the
average amount of opioids per claim for the four injury years included in this study (2010/2012, 2011/2013,
2012/2014, and 2013/2015) so that readers can observe the year-to-year changes. It also includes the changes
in the amount of opioids per claim at the median and other select percentiles.
Between 2010/2012 and 2013/2015, the average amount of opioids per claim decreased in most study
states.14 Of these, four states (Kentucky, Maryland, Michigan, and New York) had substantially larger
reductions in the range of 30–40 percent. In 11 more states (California, Connecticut, Florida, Georgia,
Kansas, Massachusetts, Minnesota, Nevada, New Jersey, Tennessee, and Texas) the average amount of opioids
per claim decreased by 20–30 percent. North Carolina and Pennsylvania had reductions of about 10–15
percent that were significant at the 10 percent level.
In several states (Arkansas, Iowa, Kansas, Kentucky, Nevada, and Virginia), we found that the average
amount of opioids per claim was the highest in 2011/2013 and decreased thereafter by about 20–40 percent in
the next two years.
In most of these states with significant decreases in the average amount of opioids per claim, larger
reductions were seen at higher percentiles (90th and 95th percentiles) compared with the median. These
results may suggest that the policies that contributed to the changes predominantly affected injured workers
receiving higher amounts of opioids.
Unlike the trend observed in the majority of states, the average amount of opioids received by injured
workers in Indiana, Louisiana, and Wisconsin remained unchanged over the study period. Two of these states
(Indiana and Wisconsin) continued to be among the states with a lower amount of opioid use than the
median state despite no changes.
We restricted the majority of our discussion in this section to states with large and statistically significant
changes in the average amount of opioids per claim, but we provide the trend data for all 26 states in the
study (Tables 4.2 to 4.5). We highlight states where the reduction in the average amount of opioids per claim
was more than 20 percent over the three-year study period and the change was statistically significant at the
10 percent level. For each of the states with significant changes, we examined changes in several utilization
measures that are useful to decompose the change in the amount of opioids per claim, including changes in
the use of Schedule II opioids and changes in opioid prescriptions dispensed by physicians and pharmacies, as
well as changes in the number of prescriptions and the number of pills per claim, to see whether these
components contributed to the rapid decline in the amount of opioids per claim. Tables 4.4 and 4.5 present
the results for the states on the use of Schedule II opioids and physician- and pharmacy-dispensed
prescriptions for opioids, respectively.
14 Readers interested in the statistical significance of the changes in the average amount of opioids per claim may refer to Table SA.2.
copyright © 2017 workers compensation research institute
46
_____________________________________________________________________________________________I N T E R S T A T E V A R I A T I O N S I N U S E O F O P I O I D S , 4 T H E D I T I O N
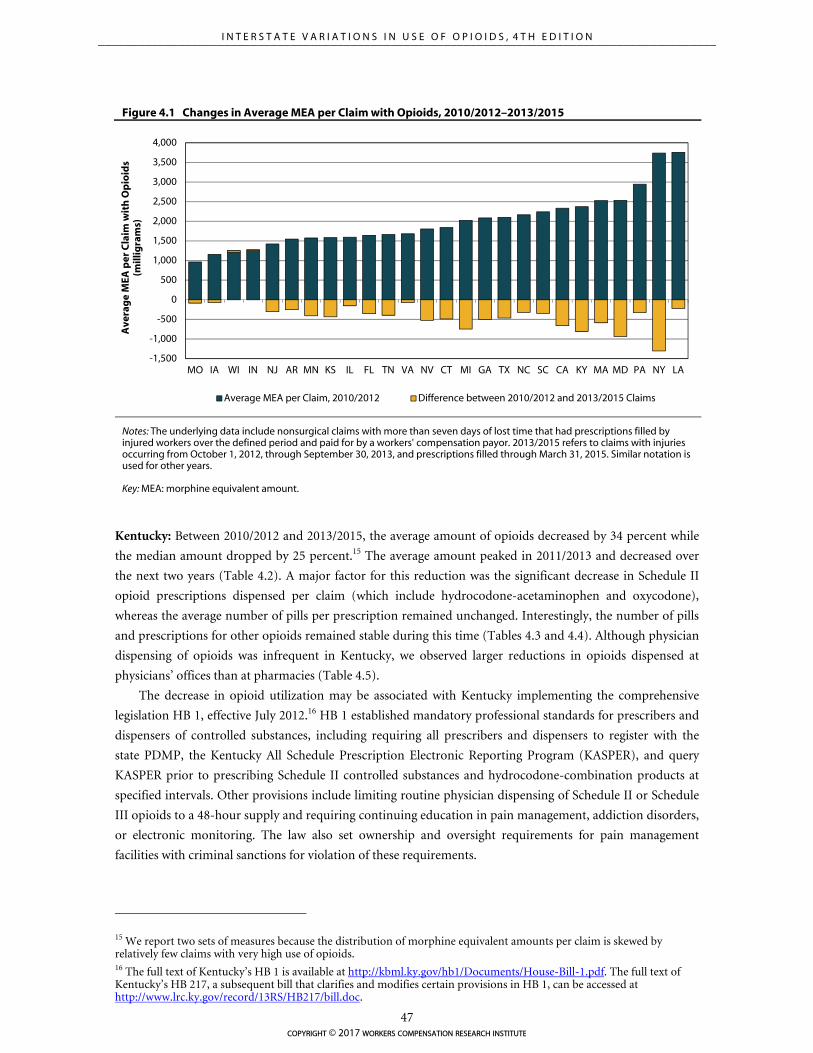
-1,500
-1,000
-500
0
500
1,000
1,500
2,000
2,500
3,000
3,500
4,000
MO IA WI IN NJ AR MN KS IL FL TN VA NV CT MI GA TX NC SC CA KY MA MD PA NY LA
Ave
rag
e M
EA p
er C
laim
wit
h O
pio
ids
(mill
igra
ms)
Average MEA per Claim, 2010/2012 Difference between 2010/2012 and 2013/2015 Claims
Figure 4.1 Changes in Average MEA per Claim with Opioids, 2010/2012–2013/2015
Notes: The underlying data include nonsurgical claims with more than seven days of lost time that had prescriptions filled by injured workers over the defined period and paid for by a workers' compensation payor. 2013/2015 refers to claims with injuries occurring from October 1, 2012, through September 30, 2013, and prescriptions filled through March 31, 2015. Similar notation is used for other years.
Key: MEA: morphine equivalent amount.
Kentucky: Between 2010/2012 and 2013/2015, the average amount of opioids decreased by 34 percent while
the median amount dropped by 25 percent.15 The average amount peaked in 2011/2013 and decreased over
the next two years (Table 4.2). A major factor for this reduction was the significant decrease in Schedule II
opioid prescriptions dispensed per claim (which include hydrocodone-acetaminophen and oxycodone),
whereas the average number of pills per prescription remained unchanged. Interestingly, the number of pills
and prescriptions for other opioids remained stable during this time (Tables 4.3 and 4.4). Although physician
dispensing of opioids was infrequent in Kentucky, we observed larger reductions in opioids dispensed at
physicians’ offices than at pharmacies (Table 4.5).
The decrease in opioid utilization may be associated with Kentucky implementing the comprehensive
legislation HB 1, effective July 2012.16 HB 1 established mandatory professional standards for prescribers and
dispensers of controlled substances, including requiring all prescribers and dispensers to register with the
state PDMP, the Kentucky All Schedule Prescription Electronic Reporting Program (KASPER), and query
KASPER prior to prescribing Schedule II controlled substances and hydrocodone-combination products at
specified intervals. Other provisions include limiting routine physician dispensing of Schedule II or Schedule
III opioids to a 48-hour supply and requiring continuing education in pain management, addiction disorders,
or electronic monitoring. The law also set ownership and oversight requirements for pain management
facilities with criminal sanctions for violation of these requirements.
15 We report two sets of measures because the distribution of morphine equivalent amounts per claim is skewed by relatively few claims with very high use of opioids. 16 The full text of Kentucky’s HB 1 is available at http://kbml.ky.gov/hb1/Documents/House-Bill-1.pdf. The full text of Kentucky’s HB 217, a subsequent bill that clarifies and modifies certain provisions in HB 1, can be accessed at http://www.lrc.ky.gov/record/13RS/HB217/bill.doc.
copyright © 2017 workers compensation research institute
47
_____________________________________________________________________________________________I N T E R S T A T E V A R I A T I O N S I N U S E O F O P I O I D S , 4 T H E D I T I O N
Maryland: We saw a decrease in the average amount of opioids over the three-year period, from 2,532 in
2010/2012 to 1,599 in 2013/2015, a 37 percent reduction. In the latest study period, between 2012/2014 and
2013/2015, the average and median amounts decreased by 14 and 11 percent, respectively. The downward
trend appeared to be consistent with the implementation of the state PDMP in December 2013 and a
subsequent increase in registration with and use of the PDMP.17 Opioid use may continue to decrease in
Maryland as the state enacted legislation mandating prescribers to register (effective July 2017) and query the
PDMP prior to the initial opioid and benzodiazepine fill and at least every three months thereafter if use of
the medication continues (effective July 2018). The average amount of opioids also decreased (by 26 percent)
between 2010/2012 and 2011/2013, but there was little change in the median amount. These results indicate
that the Maryland trend over this period was driven by large reductions among claims with higher use of
opioids. We are not aware of major policy initiatives that were implemented in the earlier part of the study
period.
The decrease in the average amount of opioids per claim was driven by a steady decline in the average
number of opioid prescriptions received by Maryland workers dispensed by physicians and pharmacies
(Table 4.3 and Table 4.5). Larger drops were seen in the average number of pills for Schedule II opioids (e.g.,
oxycodone and hydrocodone) compared with all other opioids (e.g., tramadol) (Table 4.4). We also found
changes in the mix of opioids prescribed to Maryland workers between 2010/2012 and 2011/2013. A 5
percentage point decrease was seen in the share of opioids for oxycodone, and a 6 percentage point increase
was seen in tramadol prescriptions.
Michigan: We found steady decreases in the average and median amounts of opioids per claim (37 percent
and 16 percent, respectively) over the three-year period. The 37 percent drop followed an increase in the
average opioid use between 2008/2010 and 2010/2012, as reported in the second edition of this study. We
found that the number of opioid prescriptions per claim and number of opioid pills per prescription
decreased on average between 2010/2012 and 2013/2015, contributing to the rapid decline in the amount of
opioids per claim (Table 4.3). This drop was seen in Schedule II opioids as well as all other opioids (Table
4.4). A significant drop in opioid prescriptions and pills per claim dispensed by both physicians and
pharmacies contributed to the observed drop in the state (Table 4.5).
Some important opioid-related policies became effective around this period in Michigan, which may
have contributed to this decrease in opioid use. Michigan is the only study state that provides PDMP access to
private payors, including workers’ compensation payors.18 PDMP access is likely to be helpful in the
identification of potentially harmful utilization and prescribing trends in the state and in the development of
appropriate interventions to ensure safe and effective utilization of opioids by injured workers. The Michigan
Workers’ Compensation Agency amended the reimbursement rules for opioid prescriptions toward the end
of the study period. Effective December 2014, the amended rules require that opioid treatment beyond 90
days for non-cancer related chronic pain should not be reimbursed unless detailed physician reporting
requirements and other processes are met. The new rules also provide incentives for compliance with the
requirement—a provider may bill for the additional services required for reporting beyond 90 days and for 17 The Maryland PDMP implementation and operations update can be accessed at http://bha.dhmh.maryland.gov/pdmp/Documents/BHA%20Prescription%20Drug%20Monitoring%20ProgramFinal%20Signed120815OGA1655.pdf. 18 Note that in Michigan, health care payment or benefit providers are allowed to access the state PDMP for the purpose of ensuring patient safety and investigating fraud and abuse as per the public health code, Act 368. Although this provision has been effective since 2002, the use of the state PDMP by workers’ compensation payors and benefit providers may have increased over the study period due to increasing attention to the risks associated with opioids. Act 368 can be accessed at http://www.legislature.mi.gov/(S(nt1iemiav00ghrxwe32ov0sk))/mileg.aspx?page=getobject&objectname=mcl-333-7333a&query=on&highlight=7333a.
copyright © 2017 workers compensation research institute
48
_____________________________________________________________________________________________I N T E R S T A T E V A R I A T I O N S I N U S E O F O P I O I D S , 4 T H E D I T I O N
accessing the state PDMP (a.k.a., MAPS) or other PDMPs in the treating jurisdiction. Opioid utilization by
Michigan injured workers needs to be closely monitored as we obtain more recent data to examine whether
the new reimbursement rules further reduce opioid utilization among injured workers in the state.19
Michigan also developed resources to increase the awareness of opioid prescribing and pain management
during this period.20
New York: The average and median amounts of opioids per claim decreased by 35 percent and 31 percent,
respectively, over the three-year period. The reductions mostly occurred in the latest study period between
2012/2014 and 2013/2015 (Table 4.2). We observed reductions in both the average number of prescriptions
per claim (27 percent) and the average number of pills per prescription (10 percent) during this period (Table
4.3). Larger drops were seen in the average number of pills per claim for Schedule II opioids, including
hydrocodone-acetaminophen and oxycodone (34 percent), compared with all other opioids (23 percent)
from 2010/2012 to 2013/2015. Concurrently, the average number of opioid prescriptions per claim fell by 26
percent (Schedule II opioids) and 15 percent (all other opioids) (Table 4.4). As discussed in more detail in
Chapter 5, we found a substantial reduction in hydrocodone-acetaminophen prescriptions in New York,
coinciding with the up-scheduling of these products from Schedule III to Schedule II, for which refills are
prohibited. At the same time, the share of opioid prescriptions for oxycodone increased. Effective February
2013, hydrocodone-combination products were moved from Schedule III to Schedule II in the state, ahead of
the federal schedule change in October 2014. The encouraging trend in New York is also consistent with a few
other policy initiatives implemented in the state in recent years. New York passed legislative mandates that
require prescribers to check the PDMP database at the time of each opioid prescription. Starting in August
2013, practitioners are required to consult the PDMP when prescribing or dispensing controlled substances in
Schedules II–IV, with limited exceptions.21 More recent policy changes also include the publication of non-
acute medical treatment guidelines by the New York Workers’ Compensation Board.22
19 For more details, please refer to the amended rules, which are available at http://www.michigan.gov/documents/lara/2014-029_LR_Final_Health_Care_Services_476952_7.pdf. 20 In September 2013, Governor Rick Snyder issued a proclamation recognizing September as Pain Awareness Month. The Advisory Committee on Pain and Symptom Management (ACPSM) in Michigan, charged with studying pain issues in the state and making recommendations to improve the care of patients with pain, developed model core curricula, continuing education (CE) recommendations to provide guidance on required CE hours and content for competent prescribing for the state professional boards, and pain management tool kits, which are accessible on the agency website. More details are available at http://www.michigan.gov/lara/0,4601,7-154-72600_72603_45947---,00.html. 21 Information about New York’s I-STOP legislation can be found at http://www.ag.ny.gov/sites/default/files/press-releases/2012/ISTOP%20REPORT%20FINAL%201.10.12.pdf. 22 On December 15, 2014, the New York Workers’ Compensation Board published the state non-acute pain medical treatment guidelines in an effort to address issues related to long-term opioid use in the state workers’ compensation system.
copyright © 2017 workers compensation research institute
49
_____________________________________________________________________________________________I N T E R S T A T E V A R I A T I O N S I N U S E O F O P I O I D S , 4 T H E D I T I O N
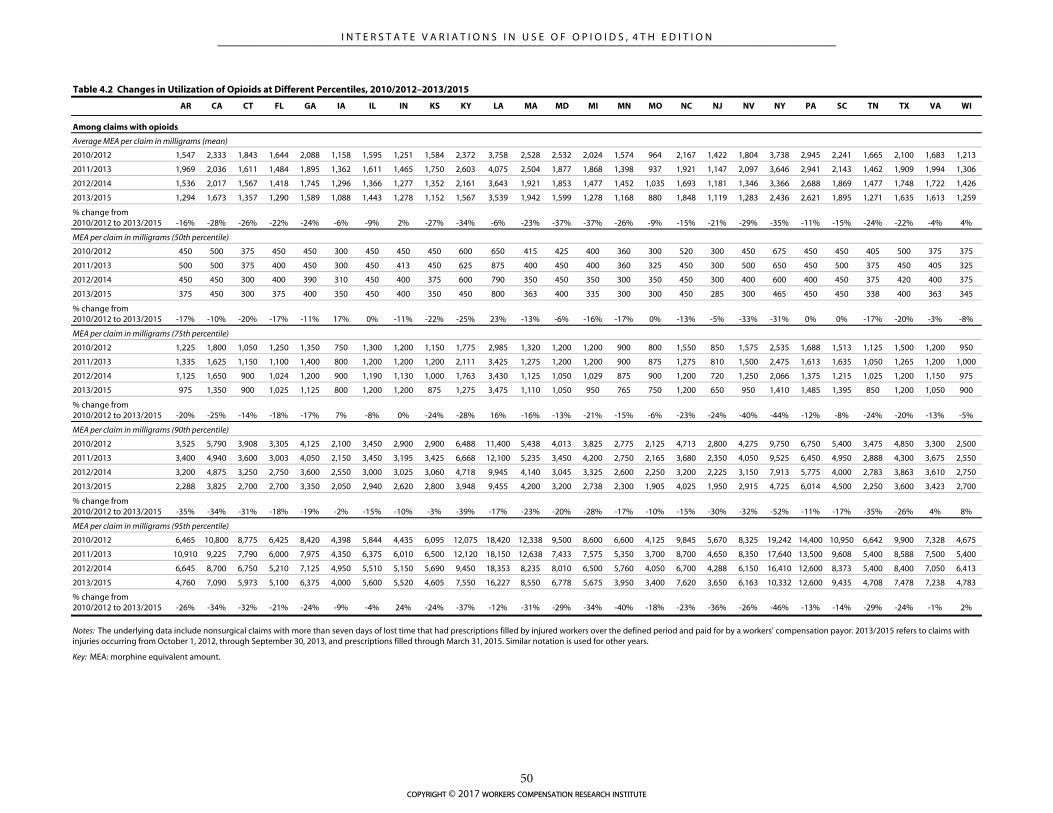
AR CA CT FL GA IA IL IN KS KY LA MA MD MI MN MO NC NJ NV NY PA SC TN TX VA WI
Average MEA per claim in milligrams (mean)
2010/2012 1,547 2,333 1,843 1,644 2,088 1,158 1,595 1,251 1,584 2,372 3,758 2,528 2,532 2,024 1,574 964 2,167 1,422 1,804 3,738 2,945 2,241 1,665 2,100 1,683 1,213
2011/2013 1,969 2,036 1,611 1,484 1,895 1,362 1,611 1,465 1,750 2,603 4,075 2,504 1,877 1,868 1,398 937 1,921 1,147 2,097 3,646 2,941 2,143 1,462 1,909 1,994 1,306
2012/2014 1,536 2,017 1,567 1,418 1,745 1,296 1,366 1,277 1,352 2,161 3,643 1,921 1,853 1,477 1,452 1,035 1,693 1,181 1,346 3,366 2,688 1,869 1,477 1,748 1,722 1,426
2013/2015 1,294 1,673 1,357 1,290 1,589 1,088 1,443 1,278 1,152 1,567 3,539 1,942 1,599 1,278 1,168 880 1,848 1,119 1,283 2,436 2,621 1,895 1,271 1,635 1,613 1,259
% change from 2010/2012 to 2013/2015 -16% -28% -26% -22% -24% -6% -9% 2% -27% -34% -6% -23% -37% -37% -26% -9% -15% -21% -29% -35% -11% -15% -24% -22% -4% 4%
MEA per claim in milligrams (50th percentile)
2010/2012 450 500 375 450 450 300 450 450 450 600 650 415 425 400 360 300 520 300 450 675 450 450 405 500 375 375
2011/2013 500 500 375 400 450 300 450 413 450 625 875 400 450 400 360 325 450 300 500 650 450 500 375 450 405 325
2012/2014 450 450 300 400 390 310 450 400 375 600 790 350 450 350 300 350 450 300 400 600 400 450 375 420 400 375
2013/2015 375 450 300 375 400 350 450 400 350 450 800 363 400 335 300 300 450 285 300 465 450 450 338 400 363 345
% change from 2010/2012 to 2013/2015 -17% -10% -20% -17% -11% 17% 0% -11% -22% -25% 23% -13% -6% -16% -17% 0% -13% -5% -33% -31% 0% 0% -17% -20% -3% -8%
MEA per claim in milligrams (75th percentile)
2010/2012 1,225 1,800 1,050 1,250 1,350 750 1,300 1,200 1,150 1,775 2,985 1,320 1,200 1,200 900 800 1,550 850 1,575 2,535 1,688 1,513 1,125 1,500 1,200 950
2011/2013 1,335 1,625 1,150 1,100 1,400 800 1,200 1,200 1,200 2,111 3,425 1,275 1,200 1,200 900 875 1,275 810 1,500 2,475 1,613 1,635 1,050 1,265 1,200 1,000
2012/2014 1,125 1,650 900 1,024 1,200 900 1,190 1,130 1,000 1,763 3,430 1,125 1,050 1,029 875 900 1,200 720 1,250 2,066 1,375 1,215 1,025 1,200 1,150 975
2013/2015 975 1,350 900 1,025 1,125 800 1,200 1,200 875 1,275 3,475 1,110 1,050 950 765 750 1,200 650 950 1,410 1,485 1,395 850 1,200 1,050 900
% change from 2010/2012 to 2013/2015 -20% -25% -14% -18% -17% 7% -8% 0% -24% -28% 16% -16% -13% -21% -15% -6% -23% -24% -40% -44% -12% -8% -24% -20% -13% -5%
MEA per claim in milligrams (90th percentile)
2010/2012 3,525 5,790 3,908 3,305 4,125 2,100 3,450 2,900 2,900 6,488 11,400 5,438 4,013 3,825 2,775 2,125 4,713 2,800 4,275 9,750 6,750 5,400 3,475 4,850 3,300 2,500
2011/2013 3,400 4,940 3,600 3,003 4,050 2,150 3,450 3,195 3,425 6,668 12,100 5,235 3,450 4,200 2,750 2,165 3,680 2,350 4,050 9,525 6,450 4,950 2,888 4,300 3,675 2,550
2012/2014 3,200 4,875 3,250 2,750 3,600 2,550 3,000 3,025 3,060 4,718 9,945 4,140 3,045 3,325 2,600 2,250 3,200 2,225 3,150 7,913 5,775 4,000 2,783 3,863 3,610 2,750
2013/2015 2,288 3,825 2,700 2,700 3,350 2,050 2,940 2,620 2,800 3,948 9,455 4,200 3,200 2,738 2,300 1,905 4,025 1,950 2,915 4,725 6,014 4,500 2,250 3,600 3,423 2,700
% change from 2010/2012 to 2013/2015 -35% -34% -31% -18% -19% -2% -15% -10% -3% -39% -17% -23% -20% -28% -17% -10% -15% -30% -32% -52% -11% -17% -35% -26% 4% 8%
MEA per claim in milligrams (95th percentile)
2010/2012 6,465 10,800 8,775 6,425 8,420 4,398 5,844 4,435 6,095 12,075 18,420 12,338 9,500 8,600 6,600 4,125 9,845 5,670 8,325 19,242 14,400 10,950 6,642 9,900 7,328 4,675
2011/2013 10,910 9,225 7,790 6,000 7,975 4,350 6,375 6,010 6,500 12,120 18,150 12,638 7,433 7,575 5,350 3,700 8,700 4,650 8,350 17,640 13,500 9,608 5,400 8,588 7,500 5,400
2012/2014 6,645 8,700 6,750 5,210 7,125 4,950 5,510 5,150 5,690 9,450 18,353 8,235 8,010 6,500 5,760 4,050 6,700 4,288 6,150 16,410 12,600 8,373 5,400 8,400 7,050 6,413
2013/2015 4,760 7,090 5,973 5,100 6,375 4,000 5,600 5,520 4,605 7,550 16,227 8,550 6,778 5,675 3,950 3,400 7,620 3,650 6,163 10,332 12,600 9,435 4,708 7,478 7,238 4,783
% change from 2010/2012 to 2013/2015 -26% -34% -32% -21% -24% -9% -4% 24% -24% -37% -12% -31% -29% -34% -40% -18% -23% -36% -26% -46% -13% -14% -29% -24% -1% 2%
Key: MEA: morphine equivalent amount.
Notes: The underlying data include nonsurgical claims with more than seven days of lost time that had prescriptions filled by injured workers over the defined period and paid for by a workers' compensation payor. 2013/2015 refers to claims with injuries occurring from October 1, 2012, through September 30, 2013, and prescriptions filled through March 31, 2015. Similar notation is used for other years.
Table 4.2 Changes in Utilization of Opioids at Different Percentiles, 2010/2012–2013/2015
Among claims with opioids
copyright © 2017 workers compensation research institute
50
_____________________________________________________________________________________________I N T E R S T A T E V A R I A T I O N S I N U S E O F O P I O I D S , 4 T H E D I T I O N
The following discussions are focused on the 11 states with a 20–30 percent decrease in the average
amount of opioids per claim over the study period. The changes in these states were briefly discussed in the
executive summary, and here we provide more detailed descriptions of the changes and background
information about state policies and initiatives addressing opioid prescribing.23
California: Between 2010/2012 and 2013/2015, the average amount of opioids decreased by 28 percent, and
the median amount decreased by 10 percent; larger reductions were seen among injured workers receiving
higher amounts of opioids (top 10 percent). In terms of utilization, the decrease in the average amount of
opioids per claim was due to fewer opioid pills per claim, which was the result of fewer opioid prescriptions
per claim and a smaller number of pills per opioid prescription dispensed at both physicians’ offices and
pharmacies (Table 4.3 and 4.5). Larger reductions were seen in the average number of Schedule II opioid
prescriptions per claim (e.g., hydrocodone-acetaminophen and oxycodone) compared with all other opioid
prescriptions (e.g., tramadol) (Table 4.4). On the other hand, the average number of pills per claim for other
opioids decreased more than for Schedule II opioids.
Several reforms implemented in California over this period may be associated with the decrease in the
amount of opioids received by workers. California requires medical treatment provided to injured workers,
including opioid prescribing, to be compliant with evidence-based guidelines and ensures compliance
through mandatory utilization review. Over the study period, the state made legislative and regulatory
changes to strengthen the guidelines and established an independent medical review (IMR) process for
medical dispute resolution. In California, the chronic pain treatment guidelines were first adopted by the
Division of Workers’ Compensation (DWC) in 2009, and were subsequently revised.24 Senate Bill (SB) 863
called for an IMR process for medical treatment disputes for injuries on or after January 1, 2013, effective July
1, 2013.25 During the study period, California also enacted SB 670, which authorizes the Medical Board of
California to impose limitations on prescribers suspected of overprescribing in cases of drug overdoses. In
November 2014, the California Medical Board published revised guidelines for prescribing controlled
substances for pain.26
Several prominent changes addressing opioid prescribing were implemented after the study period.
These changes are expected to further reduce the amount of opioids prescribed to injured workers in the
state. For example, the DWC issued updated Chronic Pain Medical Guidelines and adopted Opioids
Treatment Guidelines for the first time with recommendations about acute and chronic use of opioids to
treat injured workers, effective July 2016.27 California enacted legislation requiring the DWC to establish a
drug formulary by July 201728 and passed a law in September 2016 mandating prescribers to check the state
23 The information about opioid policy changes provided here and in Technical Appendix A is intended to be used by the reader who would like to interpret the results in the context of policy changes. Investigation of the relationship between opioid policy changes and the amount of opioids received by injured workers is beyond the scope of this report. 24 The DWC issued draft guidelines during the study period in April 2014, which were different from the final guidelines published in July 2016. 25 The California Workers’ Compensation Institute (CWCI) reported that nearly 50 percent of all IMR requests between January 2014 and June 2015 were related to prescription drugs, and one-third of these disputes were related to opioids. They found that the IMR physician upheld the decisions of the utilization review physician in 90 percent of the cases (David et al., 2015). Similar findings were reported in an earlier CWCI study covering data up to January 2014. 26 The guidelines can be found at http://www.mbc.ca.gov/licensees/prescribing/pain_guidelines.pdf. 27 The regulation can be found at http://www.dir.ca.gov/DIRNews/2016/2016-78.pdf, and the guidelines are available at https://www.dir.ca.gov/dwc/DWCPropRegs/MTUS-Opioids-ChronicPain/MTUS-Opioids-ChronicPain.htm. 28 Assembly Bill (AB) 1124 requires the DWC in California’s Department of Industrial and Relations to establish a drug formulary no later than July 1, 2017. In March 2017, the DWC released a formal draft of the medical treatment utilization schedule (MTUS) drug formulary, which is anticipated to take effect for services on or after January 1, 2018. Draft rules can be found at http://www.dir.ca.gov/dwc/DWCPropRegs/MTUS-Formulary/Text-Of-Regulations.pdf, and the draft drug list is available at http://www.dir.ca.gov/dwc/DWCPropRegs/MTUS-Formulary/MTUS-Drug-List.pdf. Opioids
copyright © 2017 workers compensation research institute
51
_____________________________________________________________________________________________I N T E R S T A T E V A R I A T I O N S I N U S E O F O P I O I D S , 4 T H E D I T I O N
PDMP prior to prescribing opioids.
Connecticut: The amount of opioids decreased gradually over the study period. Between 2010/2012 and
2013/2015, we found a 26 percent reduction in the average amount of opioids per claim and a 20 percent
reduction in the median amount (Table 4.2). Fewer prescriptions for Schedule II opioids explain these
reductions (Tables 4.3 and 4.4). Note that the average number of opioid pills per claim dispensed by
physicians increased slightly over the study period. As pharmacy-dispensed prescriptions account for a larger
share of opioid prescriptions in Connecticut, the increase in the amount of opioids dispensed by physicians
was offset by a larger drop in the amount of opioids dispensed at pharmacies.
Effective July 2012, the Connecticut Workers’ Compensation Commission created new medical
protocols for prescribing opioids for acute and chronic pain. In addition, Public Act 13-172, signed into law
on June 21, 2013, requires all prescribers to register with the state PDMP. More recently, in October 2015,
Connecticut further strengthened the PDMP by requiring prescribers to check the state PDMP prior to
writing the first prescription and every 90 days when prescribing continues. Connecticut also enacted
legislation limiting first opioid prescriptions to a seven-day supply, effective July 2016.
Florida: We found gradual decreases in the average and median amounts of opioids per claim (22 percent
and 17 percent, respectively) over the three-year period. A major factor in this reduction was the significant
drop in the number of Schedule II opioid prescriptions and pills per claim (e.g., hydrocodone-acetaminophen
and oxycodone) (Tables 4.3 and 4.4). The number of opioid pills and prescriptions per claim dispensed at
both physicians’ offices and pharmacies decreased (Table 4.5). The Florida trend may be associated with a
series of changes aimed at reducing unnecessary opioid use in the state, including the comprehensive
legislation HB 7095, which went into effect in July 2011, and the state PDMP, which became operational in
September 2011.29,30 Several studies reported a decrease in opioid prescriptions after the two Florida laws
went in effect, especially those written by top opioid prescribers in the state.31 Effective December 24, 2015,
the Florida Board of Pharmacy adopted a rule on standards of practice for the filling of controlled substance
prescriptions, electronic prescribing, and two hours of mandatory continuing education.32
Georgia: Over the study period, the average amount of opioids dropped by 24 percent. While the median
amount decreased by 11 percent, more significant drops were seen among claims with higher use of opioids
(top 5 percent) (Table 4.2). The decline in the average amount of opioids occurred gradually over the three-
commonly prescribed to injured workers are currently categorized as non-preferred drugs, which are generally subject to prospective utilization review under the draft formulary. 29 Other reforms in Florida that occurred during the study period include the following: (1) Florida required all pain clinics treating patients with controlled substances to register with the state by January 2010; and (2) in the same year, the state law enforcement along with the Drug Enforcement Administration began Operation Pill Nation, an undercover operation to crack down on pill mills. This resulted in the closure of some pain clinics in February 2011. 30 HB 7095, referred to as the “Florida pill mill bill,” regulates entities involved in the controlled substances supply chain, including physicians, pain management clinics, pharmacists, pharmacies, wholesalers, and manufacturers. For example, the bill banned physicians from dispensing Schedule II and III controlled substances effective July 2011, required physicians prescribing controlled substances to treat chronic pain to register as controlled substance prescribing entities with their licensing boards effective January 2012, created a standard of care for chronic pain management by registered controlled substance prescribers, and limited community pharmacies that can dispense Schedule II and Schedule III controlled substances to those that meet specific standards. Pharmacies were required to be re-licensed under the new standards by July 2012. The bill also defined and set operating procedures for pain management clinics and made minor changes to the PDMP. HB 7095 can be accessed at http://flsenate.gov/Session/Bill/2011/7095/BillText/er/PDF. 31 Rutkow et al. (2015); Chang et al. (2016). 32 See the Guidelines for Opioid Management of Pain Using Dangerous Drugs and Controlled Substances, which is available at http://druglibrary.org/schaffer/asap/florida_guide.htm.
copyright © 2017 workers compensation research institute
52
_____________________________________________________________________________________________I N T E R S T A T E V A R I A T I O N S I N U S E O F O P I O I D S , 4 T H E D I T I O N
year period. This decrease appears to be associated with a decrease in the number of both Schedule II and
non-Schedule II opioid prescriptions per claim. Note that Georgia is one of the states to launch a PDMP
during the study period, in 2013.
Kansas: The average and median amounts of opioids decreased by 27 percent and 22 percent, respectively.
Noteworthy contributions to this result were decreases in the number of opioid prescriptions per claim for
Schedule II opioids (Table 4.3 and 4.4). In Kansas, hydrocodone-acetaminophen was the most frequently
prescribed opioid in this category. This trend is consistent with the implementation of a PDMP in the state in
April 2011. Since its launch, the number of prescribers registered with the PDMP increased steadily, with
nearly one-third of prescribers enrolled as of December 2014.33 Kansas also adopted the Model Policy for the
Use of Controlled Substances for the Treatment of Pain, established by the Federation of State Medical
Boards (FSMB).34
Massachusetts: Over the study period, the average amount of opioids dropped by 23 percent while the
median amount decreased by 13 percent. More significant drops were seen among claims with higher use of
opioids (top 10 percent). The drops occurred between 2011/2013 and 2012/2014. A possible factor in this
trend was the significant drop in the number of opioid prescriptions per claim (15 percent) over the study
period. The changes we observed may be associated with the many reforms enacted in Massachusetts to
address overuse of opioids over this period—(1) chronic pain treatment guidelines, which went into effect in
March 2013; (2) mandatory physician education in pain management and opioid prescribing (effective
February 2012); and (3) the enhancement of the utility of the state PDMP by providing unsolicited reports of
patient controlled substance use history to prescribers (pilot effective July 2013; fully effective December
2013). After the study period, other reforms were passed in Massachusetts which may further reduce opioid
utilization. Effective January 2016, prescribers are required to check the PDMP database each time they
prescribe certain Schedule II or III drugs. In March 2016, the governor signed into law a landmark opioid
legislation, which contains several provisions to address the prevention and intervention of opioid overdose,
including limiting initial opioid prescriptions to seven days of supply.
Minnesota: We saw a 26 percent decrease in the average amount of opioids over the three-year period.
Sizable drops were seen at the median and especially at the 95th percentile (Table 4.2). The substantial
decrease was due to fewer Schedule II prescriptions (e.g., hydrocodone-acetaminophen and oxycodone),
whereas the average number of opioid pills per prescription remained stable over the study period (Table 4.3
and 4.4). The state PDMP was enacted in 2007 and became operational in 2010. Minnesota’s legislation only
mandated that prescribers in opioid treatment programs check the PDMP database initially, but in May 2016,
Minnesota’s legislature passed a law that requires more medical professionals in the state to sign up for the
PDMP.35 In 2010, the Minnesota Department of Labor and Industry (DLI) adopted rules governing
prescription drugs including opioids that are used in an outpatient setting for workers’ compensation
33 See Prescription Drug Monitoring Programs: Evidence-Based Practices to Optimize Prescriber Use (the Pew Charitable Trusts, 2016). 34 The guidelines consist of evaluating the patient, development of a treatment plan, obtaining informed consent and agreement for treatment, periodically reviewing the treatment plan, consulting with the patient, maintaining good medical records, and complying with controlled substances laws and regulations. See FSMB (2013). The Model Policy was being updated as of December of 2016. 35 See https://www.revisor.mn.gov/bills/text.php?number=SF1440&version=4&session=ls89&session_year=2016& session_number=0.
copyright © 2017 workers compensation research institute
53
_____________________________________________________________________________________________I N T E R S T A T E V A R I A T I O N S I N U S E O F O P I O I D S , 4 T H E D I T I O N
injuries.36 Immediately after the study period, effective July 2015, the DLI adopted administrative rules
requiring compliance with a set of guidelines governing long-term treatment with opioid analgesic
medication.37 Minnesota’s Opioid Prescribing Work Group (OPWG) played a crucial role in the state’s
response to the crisis of opioid overuse. In April 2014, the OPWG published A Protocol for Addressing Acute
Pain, which provides guidelines for prescribing opioids.38 The OPWG will help shape the opioid-prescribing
improvement and monitoring program, created in 2015 at the direction of the governor and the legislature to
reduce the spread of opioids.39
Nevada: The average and median amounts of opioids per claim decreased by 29 and 33 percent, respectively,
over the three-year period. The decline followed a peak in the average and median amounts of opioids in
2011/2013 (Table 4.2). The number of prescriptions and pills per claim decreased over this period for both
Schedule II opioids and all other opioids (Table 4.3 and 4.4). Note that opioid prescriptions dispensed by
physicians decreased from 10 percent of all opioid prescriptions to 3 percent over this period (Table 4.5).40
Nevada was one of the states that participated in the National Governors Association (NGA) 2014
Prescription Drug Abuse Reduction Policy Academy, whose purpose is to assist in developing a tailored
strategic plan to address prescription drug abuse in the state.41 Following the recommendations of the task
force, Nevada introduced and passed a comprehensive reform aimed at opioid overdose prevention, effective
after our study period in October 2015. Senate Bill 459 mandated prescribers to check the state PDMP prior
to prescribing the initial opioid prescription.42 The bill also requires controlled substance prescribers to
complete at least one hour of continuing education related to controlled substances misuse and abuse during
each licensure period. Nevada’s Division of Industrial Relations announced the adoption of the American
College of Occupational and Environmental Medicine (ACOEM) drug formulary for use in the state workers’
compensation system in 2015. Our results will serve as a baseline for evaluating the impact of these changes
on opioid prescriptions in Nevada.
New Jersey: The frequency and average amount of opioids per claim were among the lowest of the 26 study
states and continued to decrease. Between 2010/2012 and 2013/2015, we observed a 5 percentage point
decrease in the percentage of claims that received opioids for pain relief and a 21 percent reduction in the
average amount of opioids among those receiving opioids. The noticeable decrease in opioid prescriptions
may be related to the heightened awareness of the problem since 2013, when New Jersey legislators put
36 See https://www.revisor.mn.gov/rules/?id=5221.6105. 37 Minnesota’s workers’ compensation guidelines for chronic opioid management can be found at https://www.revisor.mn.gov/rules/?id=5221.6110. 38 The protocol includes avoiding prescribing more than a three-day supply (or 20 pills) of low-dose, short-acting opioids in general; never prescribing long-acting/extended-release preparations for acute pain; and maximizing appropriate non-opioid therapies. See the OPWG protocol for addressing acute pain and prescribing opioids at https://www.icsi.org/_asset/xbhfdk/opioidprotocolmnmedicine.pdf. 39 More information about the OPWG and their initiatives can be found at https://mn.gov/dhs/partners-and-providers/news-initiatives-reports-workgroups/minnesota-health-care-programs/opioid-work-group/. 40 Nevada adopted reforms effective January 2016 limiting physician dispensing of certain opioids to a 15-day supply, which is likely to further reduce physician dispensing of opioids. 41 Nevada’s plan to address opioid abuse is discussed in detail in NGA’s report available at http://dpbh.nv.gov/uploadedFiles/dpbhnvgov/content/Programs/ClinicalSAPTA/State%20of%20Nevada%20Plan%20to%20Reduce%20Prescription%20Drug%20Abuse.pdf. 42 In 2009, Nevada was the first state to require prescribers to query the PDMP prior to the first prescription if the prescriber believed that the patient was seeking the medication for a nonmedical reason.
copyright © 2017 workers compensation research institute
54
_____________________________________________________________________________________________I N T E R S T A T E V A R I A T I O N S I N U S E O F O P I O I D S , 4 T H E D I T I O N
together 21 bills geared at tackling the state’s prescription opioid crisis.43 Several of the bills passed in 2014,
including mandatory registration and requirement for medical providers to educate the patient on the
potential danger of opioid misuse and overdose when prescribing medication. Shortly after the study period,
New Jersey enacted a law, effective November 2015, mandating prescribers to use the PDMP before issuing
the initial prescription and at least every 90 days thereafter if use continues.
Tennessee: In 2013/2015, the average amount of opioids was 1,271 milligrams. The figure had decreased from
1,665 milligrams in 2010/2012, by 24 percent. The median amount decreased by 17 percent (Table 4.2).
Contributing to the rapid decline, the number of opioid prescriptions per claim decreased on average
between 2010/2012 and 2013/2015(Table 4.3). Larger drops were seen in the average number of Schedule II
opioid pills per claim compared with other opioids (Table 4.4). Note that opioid prescriptions dispensed by
physicians decreased from 18 percent of opioid prescriptions to 11 percent over this period (Table 4.5). In
Tennessee, prescribers must check the PDMP database when first prescribing opioids and benzodiazepines
for more than seven days and at least annually thereafter if prescribing continues.44 In November 2012,
Tennessee’s legislature passed Senate Bill 3315, which amended the definition of utilization review (UR) to
explicitly include Schedule II, III, and IV drugs being used for pain management. The provision requires the
parties involved to participate in UR if opioids are prescribed for pain management to an injured or disabled
employee for a period of time exceeding 90 days from the initial prescription. Effective October 1, 2013, a
new Tennessee legislation requires that a prescription for opioids or benzodiazepines may not be dispensed in
quantities greater than a 30-day supply. After the study period, the Bureau of Workers’ Compensation
adopted the Official Disability Guidelines (ODG) drug formulary as part of a comprehensive set of treatment
guidelines adopted at the same time, which may further impact prescribing of opioids.
Texas: Over the three-year study period from 2010/2012 to 2013/2015, the average and median amounts of
opioids decreased by 22 and 20 percent, respectively. The substantial decrease was due to fewer Schedule II
prescriptions (Table 4.3 and 4.4). In Texas, hydrocodone-acetaminophen accounted for almost all the opioids
in this category. Two changes coincided with the trend we observed in Texas—(1) the Texas Division of
Workers’ Compensation phased in a closed pharmacy formulary based on ODG starting in September 1, 2011
(the formulary was fully effective on September 1, 2013);45 and (2) Texas passed legislation, effective
September 2010, that requires pain management clinics that supply 50 percent of their patients with
controlled substances to register with the state medical board and be more highly regulated.46,47
43 For a brief description of the 21 bills, see http://www.nj.com/politics/index.ssf/2014/09/nj_legislature_tackles_addiction_list_of_bills_included_in_major_package.html. 44 See PDMP Center of Excellence at Brandeis University (2014b) and Clark et al. (2012). 45 According to a study by the Texas Department of Insurance (TDI), fewer opioids and other not-recommended drugs are being prescribed after the reform (TDI, Texas Workers’ Compensation Research and Evaluation Group, 2013). 46 Several other states also passed similar laws in recent years to address improper prescribing and dispensing of opioid medications in some pain management clinics and physicians’ offices (in states that allow physician dispensing of opioids). This type of law is often referred to as a “pill mill” legislation. 47 Lyapustina et al. (2015) reported that Texas’ pill mill law was associated with declines in the average MED per transaction and monthly opioid prescriptions. The reductions were more pronounced among prescribers and patients with higher rates of prescribing and utilization at baseline.
copyright © 2017 workers compensation research institute
55
_____________________________________________________________________________________________I N T E R S T A T E V A R I A T I O N S I N U S E O F O P I O I D S , 4 T H E D I T I O N
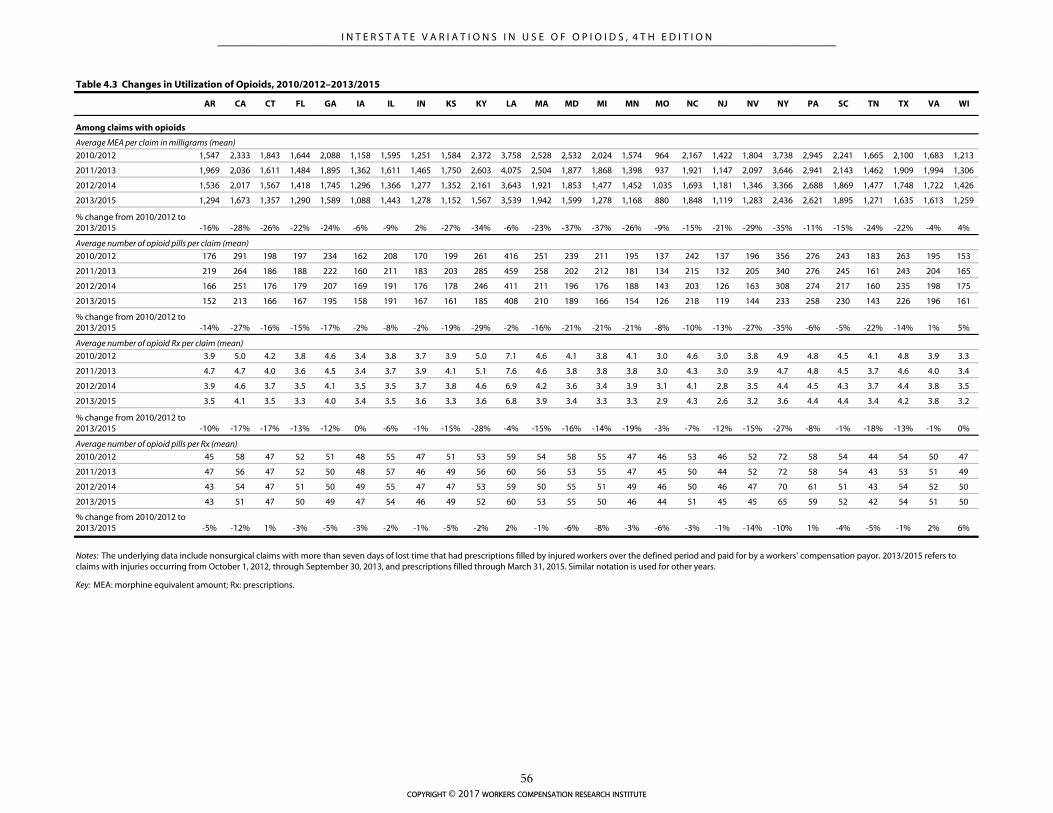
AR CA CT FL GA IA IL IN KS KY LA MA MD MI MN MO NC NJ NV NY PA SC TN TX VA WI
2010/2012 1,547 2,333 1,843 1,644 2,088 1,158 1,595 1,251 1,584 2,372 3,758 2,528 2,532 2,024 1,574 964 2,167 1,422 1,804 3,738 2,945 2,241 1,665 2,100 1,683 1,213
2011/2013 1,969 2,036 1,611 1,484 1,895 1,362 1,611 1,465 1,750 2,603 4,075 2,504 1,877 1,868 1,398 937 1,921 1,147 2,097 3,646 2,941 2,143 1,462 1,909 1,994 1,306
2012/2014 1,536 2,017 1,567 1,418 1,745 1,296 1,366 1,277 1,352 2,161 3,643 1,921 1,853 1,477 1,452 1,035 1,693 1,181 1,346 3,366 2,688 1,869 1,477 1,748 1,722 1,426
2013/2015 1,294 1,673 1,357 1,290 1,589 1,088 1,443 1,278 1,152 1,567 3,539 1,942 1,599 1,278 1,168 880 1,848 1,119 1,283 2,436 2,621 1,895 1,271 1,635 1,613 1,259
% change from 2010/2012 to 2013/2015 -16% -28% -26% -22% -24% -6% -9% 2% -27% -34% -6% -23% -37% -37% -26% -9% -15% -21% -29% -35% -11% -15% -24% -22% -4% 4%
2010/2012 176 291 198 197 234 162 208 170 199 261 416 251 239 211 195 137 242 137 196 356 276 243 183 263 195 153
2011/2013 219 264 186 188 222 160 211 183 203 285 459 258 202 212 181 134 215 132 205 340 276 245 161 243 204 165
2012/2014 166 251 176 179 207 169 191 176 178 246 411 211 196 176 188 143 203 126 163 308 274 217 160 235 198 175
2013/2015 152 213 166 167 195 158 191 167 161 185 408 210 189 166 154 126 218 119 144 233 258 230 143 226 196 161
% change from 2010/2012 to 2013/2015 -14% -27% -16% -15% -17% -2% -8% -2% -19% -29% -2% -16% -21% -21% -21% -8% -10% -13% -27% -35% -6% -5% -22% -14% 1% 5%
2010/2012 3.9 5.0 4.2 3.8 4.6 3.4 3.8 3.7 3.9 5.0 7.1 4.6 4.1 3.8 4.1 3.0 4.6 3.0 3.8 4.9 4.8 4.5 4.1 4.8 3.9 3.3
2011/2013 4.7 4.7 4.0 3.6 4.5 3.4 3.7 3.9 4.1 5.1 7.6 4.6 3.8 3.8 3.8 3.0 4.3 3.0 3.9 4.7 4.8 4.5 3.7 4.6 4.0 3.4
2012/2014 3.9 4.6 3.7 3.5 4.1 3.5 3.5 3.7 3.8 4.6 6.9 4.2 3.6 3.4 3.9 3.1 4.1 2.8 3.5 4.4 4.5 4.3 3.7 4.4 3.8 3.5
2013/2015 3.5 4.1 3.5 3.3 4.0 3.4 3.5 3.6 3.3 3.6 6.8 3.9 3.4 3.3 3.3 2.9 4.3 2.6 3.2 3.6 4.4 4.4 3.4 4.2 3.8 3.2
% change from 2010/2012 to 2013/2015 -10% -17% -17% -13% -12% 0% -6% -1% -15% -28% -4% -15% -16% -14% -19% -3% -7% -12% -15% -27% -8% -1% -18% -13% -1% 0%
2010/2012 45 58 47 52 51 48 55 47 51 53 59 54 58 55 47 46 53 46 52 72 58 54 44 54 50 47
2011/2013 47 56 47 52 50 48 57 46 49 56 60 56 53 55 47 45 50 44 52 72 58 54 43 53 51 49
2012/2014 43 54 47 51 50 49 55 47 47 53 59 50 55 51 49 46 50 46 47 70 61 51 43 54 52 50
2013/2015 43 51 47 50 49 47 54 46 49 52 60 53 55 50 46 44 51 45 45 65 59 52 42 54 51 50
% change from 2010/2012 to 2013/2015 -5% -12% 1% -3% -5% -3% -2% -1% -5% -2% 2% -1% -6% -8% -3% -6% -3% -1% -14% -10% 1% -4% -5% -1% 2% 6%
Average number of opioid pills per Rx (mean)
Notes: The underlying data include nonsurgical claims with more than seven days of lost time that had prescriptions filled by injured workers over the defined period and paid for by a workers' compensation payor. 2013/2015 refers to claims with injuries occurring from October 1, 2012, through September 30, 2013, and prescriptions filled through March 31, 2015. Similar notation is used for other years.
Key: MEA: morphine equivalent amount; Rx: prescriptions.
Table 4.3 Changes in Utilization of Opioids, 2010/2012–2013/2015
Average number of opioid pills per claim (mean)
Average MEA per claim in milligrams (mean)
Average number of opioid Rx per claim (mean)
Among claims with opioids
copyright © 2017 workers compensation research institute
56
_____________________________________________________________________________________________I N T E R S T A T E V A R I A T I O N S I N U S E O F O P I O I D S , 4 T H E D I T I O N
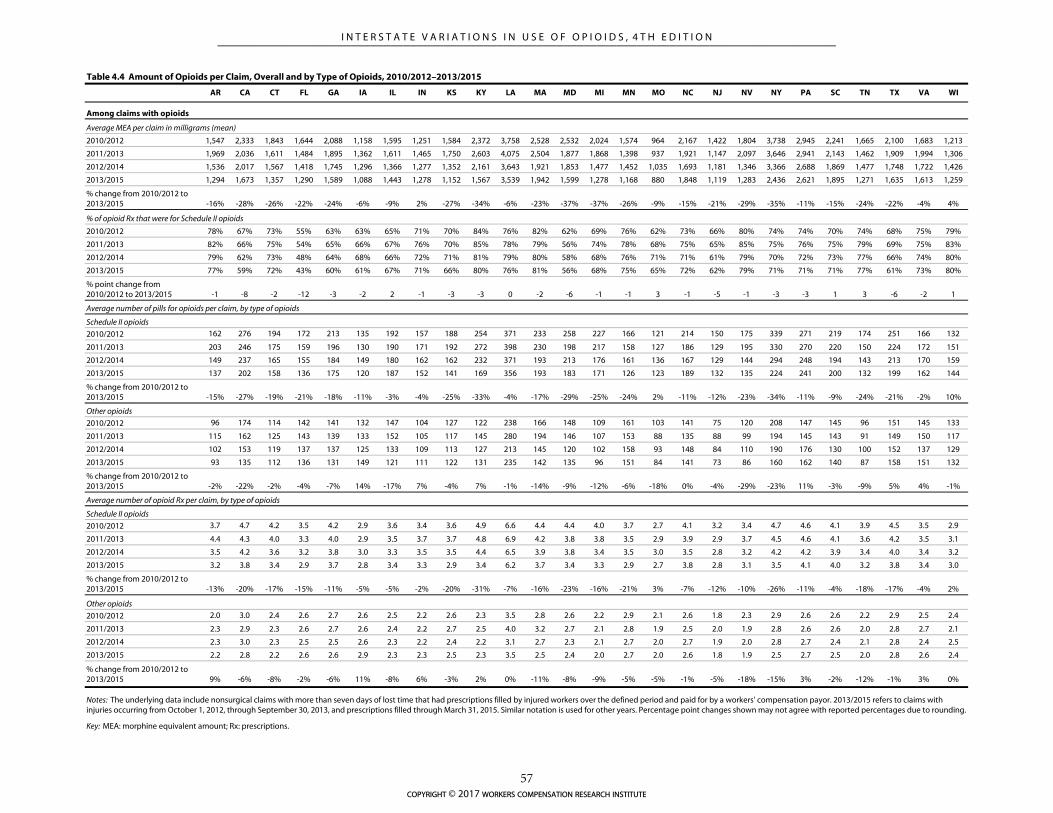
AR CA CT FL GA IA IL IN KS KY LA MA MD MI MN MO NC NJ NV NY PA SC TN TX VA WI
2010/2012 1,547 2,333 1,843 1,644 2,088 1,158 1,595 1,251 1,584 2,372 3,758 2,528 2,532 2,024 1,574 964 2,167 1,422 1,804 3,738 2,945 2,241 1,665 2,100 1,683 1,213
2011/2013 1,969 2,036 1,611 1,484 1,895 1,362 1,611 1,465 1,750 2,603 4,075 2,504 1,877 1,868 1,398 937 1,921 1,147 2,097 3,646 2,941 2,143 1,462 1,909 1,994 1,306
2012/2014 1,536 2,017 1,567 1,418 1,745 1,296 1,366 1,277 1,352 2,161 3,643 1,921 1,853 1,477 1,452 1,035 1,693 1,181 1,346 3,366 2,688 1,869 1,477 1,748 1,722 1,426
2013/2015 1,294 1,673 1,357 1,290 1,589 1,088 1,443 1,278 1,152 1,567 3,539 1,942 1,599 1,278 1,168 880 1,848 1,119 1,283 2,436 2,621 1,895 1,271 1,635 1,613 1,259
% change from 2010/2012 to 2013/2015 -16% -28% -26% -22% -24% -6% -9% 2% -27% -34% -6% -23% -37% -37% -26% -9% -15% -21% -29% -35% -11% -15% -24% -22% -4% 4%
2010/2012 78% 67% 73% 55% 63% 63% 65% 71% 70% 84% 76% 82% 62% 69% 76% 62% 73% 66% 80% 74% 74% 70% 74% 68% 75% 79%
2011/2013 82% 66% 75% 54% 65% 66% 67% 76% 70% 85% 78% 79% 56% 74% 78% 68% 75% 65% 85% 75% 76% 75% 79% 69% 75% 83%
2012/2014 79% 62% 73% 48% 64% 68% 66% 72% 71% 81% 79% 80% 58% 68% 76% 71% 71% 61% 79% 70% 72% 73% 77% 66% 74% 80%
2013/2015 77% 59% 72% 43% 60% 61% 67% 71% 66% 80% 76% 81% 56% 68% 75% 65% 72% 62% 79% 71% 71% 71% 77% 61% 73% 80%
% point change from 2010/2012 to 2013/2015 -1 -8 -2 -12 -3 -2 2 -1 -3 -3 0 -2 -6 -1 -1 3 -1 -5 -1 -3 -3 1 3 -6 -2 1
2010/2012 162 276 194 172 213 135 192 157 188 254 371 233 258 227 166 121 214 150 175 339 271 219 174 251 166 132
2011/2013 203 246 175 159 196 130 190 171 192 272 398 230 198 217 158 127 186 129 195 330 270 220 150 224 172 151
2012/2014 149 237 165 155 184 149 180 162 162 232 371 193 213 176 161 136 167 129 144 294 248 194 143 213 170 159
2013/2015 137 202 158 136 175 120 187 152 141 169 356 193 183 171 126 123 189 132 135 224 241 200 132 199 162 144
% change from 2010/2012 to 2013/2015 -15% -27% -19% -21% -18% -11% -3% -4% -25% -33% -4% -17% -29% -25% -24% 2% -11% -12% -23% -34% -11% -9% -24% -21% -2% 10%
2010/2012 96 174 114 142 141 132 147 104 127 122 238 166 148 109 161 103 141 75 120 208 147 145 96 151 145 133
2011/2013 115 162 125 143 139 133 152 105 117 145 280 194 146 107 153 88 135 88 99 194 145 143 91 149 150 117
2012/2014 102 153 119 137 137 125 133 109 113 127 213 145 120 102 158 93 148 84 110 190 176 130 100 152 137 129
2013/2015 93 135 112 136 131 149 121 111 122 131 235 142 135 96 151 84 141 73 86 160 162 140 87 158 151 132
% change from 2010/2012 to 2013/2015 -2% -22% -2% -4% -7% 14% -17% 7% -4% 7% -1% -14% -9% -12% -6% -18% 0% -4% -29% -23% 11% -3% -9% 5% 4% -1%
2010/2012 3.7 4.7 4.2 3.5 4.2 2.9 3.6 3.4 3.6 4.9 6.6 4.4 4.4 4.0 3.7 2.7 4.1 3.2 3.4 4.7 4.6 4.1 3.9 4.5 3.5 2.9
2011/2013 4.4 4.3 4.0 3.3 4.0 2.9 3.5 3.7 3.7 4.8 6.9 4.2 3.8 3.8 3.5 2.9 3.9 2.9 3.7 4.5 4.6 4.1 3.6 4.2 3.5 3.1
2012/2014 3.5 4.2 3.6 3.2 3.8 3.0 3.3 3.5 3.5 4.4 6.5 3.9 3.8 3.4 3.5 3.0 3.5 2.8 3.2 4.2 4.2 3.9 3.4 4.0 3.4 3.2
2013/2015 3.2 3.8 3.4 2.9 3.7 2.8 3.4 3.3 2.9 3.4 6.2 3.7 3.4 3.3 2.9 2.7 3.8 2.8 3.1 3.5 4.1 4.0 3.2 3.8 3.4 3.0
% change from 2010/2012 to 2013/2015 -13% -20% -17% -15% -11% -5% -5% -2% -20% -31% -7% -16% -23% -16% -21% 3% -7% -12% -10% -26% -11% -4% -18% -17% -4% 2%
2010/2012 2.0 3.0 2.4 2.6 2.7 2.6 2.5 2.2 2.6 2.3 3.5 2.8 2.6 2.2 2.9 2.1 2.6 1.8 2.3 2.9 2.6 2.6 2.2 2.9 2.5 2.4
2011/2013 2.3 2.9 2.3 2.6 2.7 2.6 2.4 2.2 2.7 2.5 4.0 3.2 2.7 2.1 2.8 1.9 2.5 2.0 1.9 2.8 2.6 2.6 2.0 2.8 2.7 2.1
2012/2014 2.3 3.0 2.3 2.5 2.5 2.6 2.3 2.2 2.4 2.2 3.1 2.7 2.3 2.1 2.7 2.0 2.7 1.9 2.0 2.8 2.7 2.4 2.1 2.8 2.4 2.5
2013/2015 2.2 2.8 2.2 2.6 2.6 2.9 2.3 2.3 2.5 2.3 3.5 2.5 2.4 2.0 2.7 2.0 2.6 1.8 1.9 2.5 2.7 2.5 2.0 2.8 2.6 2.4
% change from 2010/2012 to 2013/2015 9% -6% -8% -2% -6% 11% -8% 6% -3% 2% 0% -11% -8% -9% -5% -5% -1% -5% -18% -15% 3% -2% -12% -1% 3% 0%
Table 4.4 Amount of Opioids per Claim, Overall and by Type of Opioids, 2010/2012–2013/2015
Average MEA per claim in milligrams (mean)
% of opioid Rx that were for Schedule II opioids
Average number of pills for opioids per claim, by type of opioids
Among claims with opioids
Key: MEA: morphine equivalent amount; Rx: prescriptions.
Schedule II opioids
Other opioids
Average number of opioid Rx per claim, by type of opioids
Schedule II opioids
Other opioids
Notes: The underlying data include nonsurgical claims with more than seven days of lost time that had prescriptions filled by injured workers over the defined period and paid for by a workers' compensation payor. 2013/2015 refers to claims with injuries occurring from October 1, 2012, through September 30, 2013, and prescriptions filled through March 31, 2015. Similar notation is used for other years. Percentage point changes shown may not agree with reported percentages due to rounding.
copyright © 2017 workers compensation research institute
57
_____________________________________________________________________________________________I N T E R S T A T E V A R I A T I O N S I N U S E O F O P I O I D S , 4 T H E D I T I O N
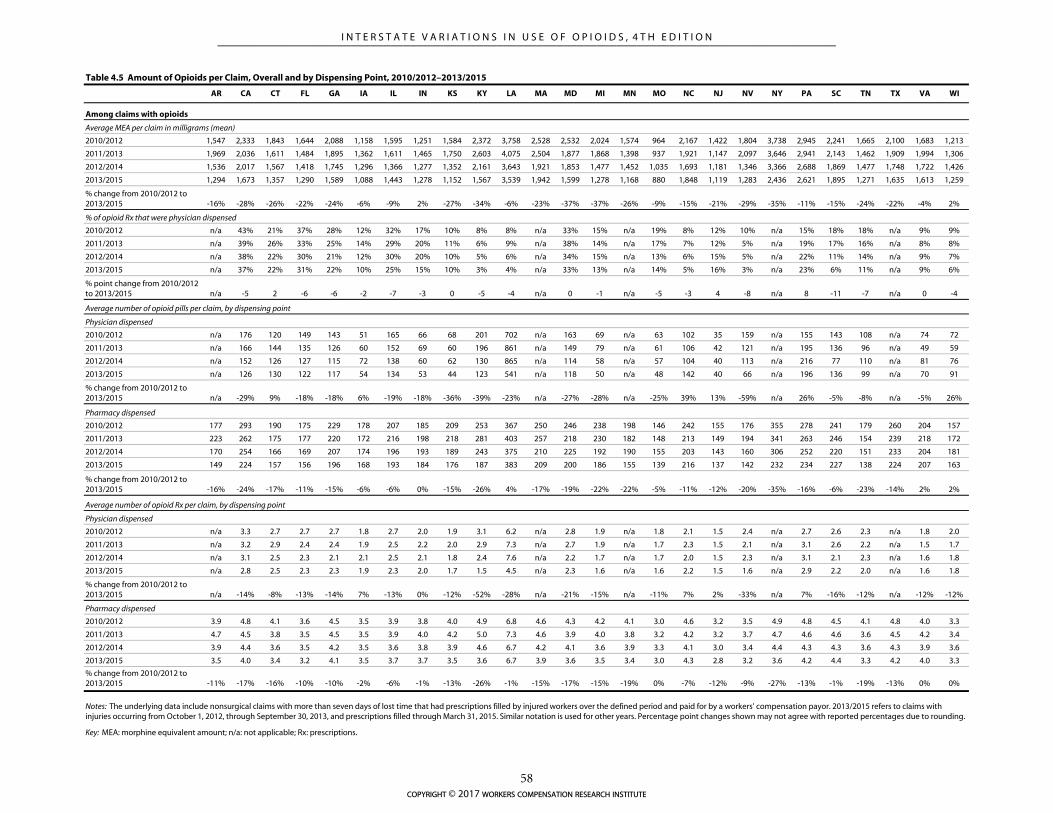
AR CA CT FL GA IA IL IN KS KY LA MA MD MI MN MO NC NJ NV NY PA SC TN TX VA WI
2010/2012 1,547 2,333 1,843 1,644 2,088 1,158 1,595 1,251 1,584 2,372 3,758 2,528 2,532 2,024 1,574 964 2,167 1,422 1,804 3,738 2,945 2,241 1,665 2,100 1,683 1,213
2011/2013 1,969 2,036 1,611 1,484 1,895 1,362 1,611 1,465 1,750 2,603 4,075 2,504 1,877 1,868 1,398 937 1,921 1,147 2,097 3,646 2,941 2,143 1,462 1,909 1,994 1,306
2012/2014 1,536 2,017 1,567 1,418 1,745 1,296 1,366 1,277 1,352 2,161 3,643 1,921 1,853 1,477 1,452 1,035 1,693 1,181 1,346 3,366 2,688 1,869 1,477 1,748 1,722 1,426
2013/2015 1,294 1,673 1,357 1,290 1,589 1,088 1,443 1,278 1,152 1,567 3,539 1,942 1,599 1,278 1,168 880 1,848 1,119 1,283 2,436 2,621 1,895 1,271 1,635 1,613 1,259
% change from 2010/2012 to 2013/2015 -16% -28% -26% -22% -24% -6% -9% 2% -27% -34% -6% -23% -37% -37% -26% -9% -15% -21% -29% -35% -11% -15% -24% -22% -4% 2%
2010/2012 n/a 43% 21% 37% 28% 12% 32% 17% 10% 8% 8% n/a 33% 15% n/a 19% 8% 12% 10% n/a 15% 18% 18% n/a 9% 9%
2011/2013 n/a 39% 26% 33% 25% 14% 29% 20% 11% 6% 9% n/a 38% 14% n/a 17% 7% 12% 5% n/a 19% 17% 16% n/a 8% 8%
2012/2014 n/a 38% 22% 30% 21% 12% 30% 20% 10% 5% 6% n/a 34% 15% n/a 13% 6% 15% 5% n/a 22% 11% 14% n/a 9% 7%
2013/2015 n/a 37% 22% 31% 22% 10% 25% 15% 10% 3% 4% n/a 33% 13% n/a 14% 5% 16% 3% n/a 23% 6% 11% n/a 9% 6%
% point change from 2010/2012 to 2013/2015 n/a -5 2 -6 -6 -2 -7 -3 0 -5 -4 n/a 0 -1 n/a -5 -3 4 -8 n/a 8 -11 -7 n/a 0 -4
2010/2012 n/a 176 120 149 143 51 165 66 68 201 702 n/a 163 69 n/a 63 102 35 159 n/a 155 143 108 n/a 74 72
2011/2013 n/a 166 144 135 126 60 152 69 60 196 861 n/a 149 79 n/a 61 106 42 121 n/a 195 136 96 n/a 49 59
2012/2014 n/a 152 126 127 115 72 138 60 62 130 865 n/a 114 58 n/a 57 104 40 113 n/a 216 77 110 n/a 81 76
2013/2015 n/a 126 130 122 117 54 134 53 44 123 541 n/a 118 50 n/a 48 142 40 66 n/a 196 136 99 n/a 70 91
% change from 2010/2012 to 2013/2015 n/a -29% 9% -18% -18% 6% -19% -18% -36% -39% -23% n/a -27% -28% n/a -25% 39% 13% -59% n/a 26% -5% -8% n/a -5% 26%
2010/2012 177 293 190 175 229 178 207 185 209 253 367 250 246 238 198 146 242 155 176 355 278 241 179 260 204 157
2011/2013 223 262 175 177 220 172 216 198 218 281 403 257 218 230 182 148 213 149 194 341 263 246 154 239 218 172
2012/2014 170 254 166 169 207 174 196 193 189 243 375 210 225 192 190 155 203 143 160 306 252 220 151 233 204 181
2013/2015 149 224 157 156 196 168 193 184 176 187 383 209 200 186 155 139 216 137 142 232 234 227 138 224 207 163
% change from 2010/2012 to 2013/2015 -16% -24% -17% -11% -15% -6% -6% 0% -15% -26% 4% -17% -19% -22% -22% -5% -11% -12% -20% -35% -16% -6% -23% -14% 2% 2%
2010/2012 n/a 3.3 2.7 2.7 2.7 1.8 2.7 2.0 1.9 3.1 6.2 n/a 2.8 1.9 n/a 1.8 2.1 1.5 2.4 n/a 2.7 2.6 2.3 n/a 1.8 2.0
2011/2013 n/a 3.2 2.9 2.4 2.4 1.9 2.5 2.2 2.0 2.9 7.3 n/a 2.7 1.9 n/a 1.7 2.3 1.5 2.1 n/a 3.1 2.6 2.2 n/a 1.5 1.7
2012/2014 n/a 3.1 2.5 2.3 2.1 2.1 2.5 2.1 1.8 2.4 7.6 n/a 2.2 1.7 n/a 1.7 2.0 1.5 2.3 n/a 3.1 2.1 2.3 n/a 1.6 1.8
2013/2015 n/a 2.8 2.5 2.3 2.3 1.9 2.3 2.0 1.7 1.5 4.5 n/a 2.3 1.6 n/a 1.6 2.2 1.5 1.6 n/a 2.9 2.2 2.0 n/a 1.6 1.8
% change from 2010/2012 to 2013/2015 n/a -14% -8% -13% -14% 7% -13% 0% -12% -52% -28% n/a -21% -15% n/a -11% 7% 2% -33% n/a 7% -16% -12% n/a -12% -12%
2010/2012 3.9 4.8 4.1 3.6 4.5 3.5 3.9 3.8 4.0 4.9 6.8 4.6 4.3 4.2 4.1 3.0 4.6 3.2 3.5 4.9 4.8 4.5 4.1 4.8 4.0 3.3
2011/2013 4.7 4.5 3.8 3.5 4.5 3.5 3.9 4.0 4.2 5.0 7.3 4.6 3.9 4.0 3.8 3.2 4.2 3.2 3.7 4.7 4.6 4.6 3.6 4.5 4.2 3.4
2012/2014 3.9 4.4 3.6 3.5 4.2 3.5 3.6 3.8 3.9 4.6 6.7 4.2 4.1 3.6 3.9 3.3 4.1 3.0 3.4 4.4 4.3 4.3 3.6 4.3 3.9 3.6
2013/2015 3.5 4.0 3.4 3.2 4.1 3.5 3.7 3.7 3.5 3.6 6.7 3.9 3.6 3.5 3.4 3.0 4.3 2.8 3.2 3.6 4.2 4.4 3.3 4.2 4.0 3.3
% change from 2010/2012 to 2013/2015 -11% -17% -16% -10% -10% -2% -6% -1% -13% -26% -1% -15% -17% -15% -19% 0% -7% -12% -9% -27% -13% -1% -19% -13% 0% 0%
Key: MEA: morphine equivalent amount; n/a: not applicable; Rx: prescriptions.
Table 4.5 Amount of Opioids per Claim, Overall and by Dispensing Point, 2010/2012–2013/2015
Pharmacy dispensed
Physician dispensed
Pharmacy dispensed
Notes: The underlying data include nonsurgical claims with more than seven days of lost time that had prescriptions filled by injured workers over the defined period and paid for by a workers' compensation payor. 2013/2015 refers to claims with injuries occurring from October 1, 2012, through September 30, 2013, and prescriptions filled through March 31, 2015. Similar notation is used for other years. Percentage point changes shown may not agree with reported percentages due to rounding.
Physician dispensed
Average number of opioid pills per claim, by dispensing point
% of opioid Rx that were physician dispensed
Average MEA per claim in milligrams (mean)
Average number of opioid Rx per claim, by dispensing point
Among claims with opioids
copyright © 2017 workers compensation research institute
58
_____________________________________________________________________________________________I N T E R S T A T E V A R I A T I O N S I N U S E O F O P I O I D S , 4 T H E D I T I O N
5
PRESCRIBING PATTERNS OF OPIOIDS
Many factors may influence a physician’s choice to prescribe different types of pain relief medications,1
including the physician’s beliefs about the medical necessity, practice norms within a medical community,
and the patient’s preference. State PDMPs, state pain policies, treatment guidelines, formularies, and
availability of safer formulations may also influence physicians’ prescribing behavior. This chapter
summarizes interstate variations and trends in the frequency of prescribing opioids and the types of opioids
prescribed for pain relief. To describe the prescribing patterns, we categorized pain medications into the
following categories: hydrocodone-acetaminophen (Vicodin®), oxycodone-containing products
(OxyContin® and Percocet®), tramadol-containing products (Ultram® and Ultracet®), all other opioids, and
non-opioid pain medications.2 We did this because hydrocodone-acetaminophen, oxycodone, and tramadol
were the most frequently prescribed opioids to injured workers across the 26 states, accounting for more than
90 percent of all opioid prescriptions in 2013/2015.
LARGE VARIATIONS ACROSS STATES IN THE TYPE OF OPIOIDS PRESCRIBED
The frequency of prescribing opioids as well as the mix of opioid and non-opioid analgesics prescribed to
injured workers across the 26 study states is provided in Table 5.1. We found large interstate differences in the
frequency of prescribing opioids as well as the types of opioids commonly prescribed across states.
In 2013/2015, about 65 to 75 percent of injured workers with pain medications received opioids in the
majority of states. A slightly higher proportion of injured workers with pain medications received opioids in
Arkansas (85 percent), Louisiana (80 percent), and South Carolina (80 percent). Frequency of opioid use was
high even in states with lower prevalence among the 26 study states, with at least half of the claims with pain
medications receiving opioids in New Jersey (52 percent) and Illinois (56 percent).
1 Stronger opioids such as oxycodone, less potent opioids such as tramadol, or non-opioid pain relievers such as non-steroidal anti-inflammatory drugs or acetaminophen. 2 All other opioids include propoxyphene, codeine, fentanyl, morphine sulfate, hydromorphone, oxymorphone, buprenorphine, and tapentadol. Non-opioid pain medications include non-steroidal anti-inflammatory drugs, corticosteroids, and acetaminophen. We did not include antidepressants and anticonvulsants among pain medications because they are relatively infrequent in our data and have multiple indications of use.
copyright © 2017 workers compensation research institute
59
_____________________________________________________________________________________________I N T E R S T A T E V A R I A T I O N S I N U S E O F O P I O I D S , 4 T H E D I T I O N
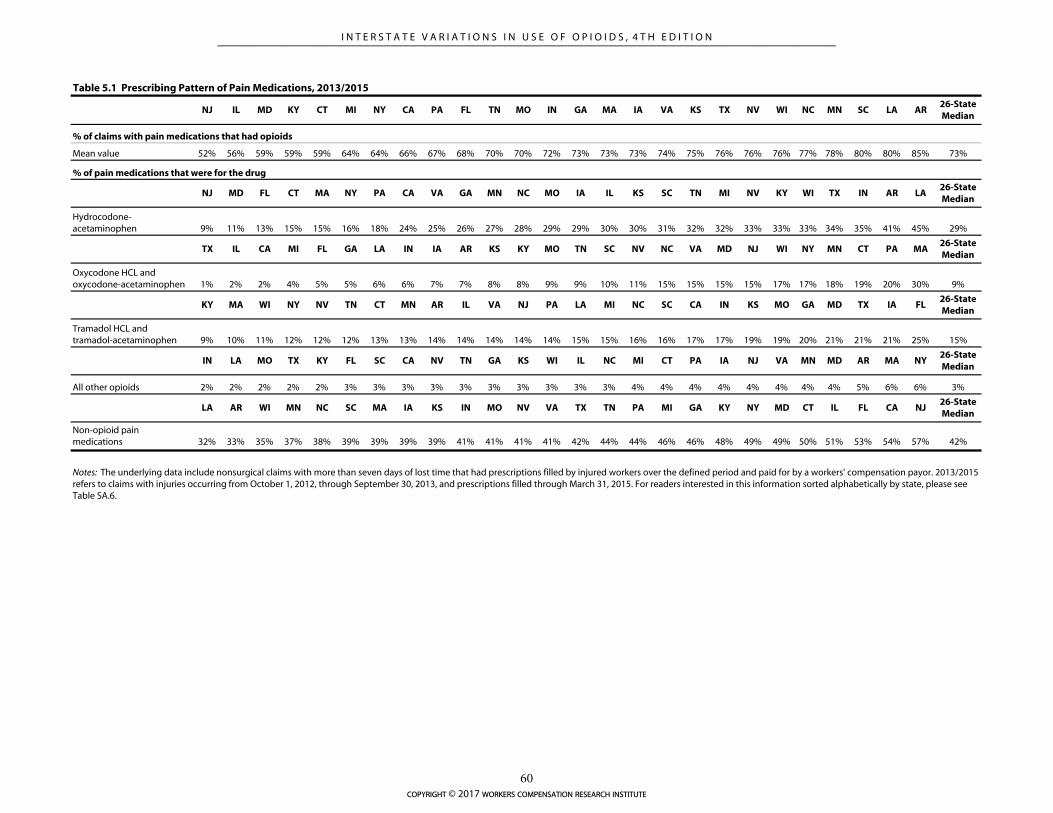
NJ IL MD KY CT MI NY CA PA FL TN MO IN GA MA IA VA KS TX NV WI NC MN SC LA AR26-State Median
% of claims with pain medications that had opioids
Mean value 52% 56% 59% 59% 59% 64% 64% 66% 67% 68% 70% 70% 72% 73% 73% 73% 74% 75% 76% 76% 76% 77% 78% 80% 80% 85% 73%
NJ MD FL CT MA NY PA CA VA GA MN NC MO IA IL KS SC TN MI NV KY WI TX IN AR LA26-State Median
Hydrocodone-acetaminophen 9% 11% 13% 15% 15% 16% 18% 24% 25% 26% 27% 28% 29% 29% 30% 30% 31% 32% 32% 33% 33% 33% 34% 35% 41% 45% 29%
TX IL CA MI FL GA LA IN IA AR KS KY MO TN SC NV NC VA MD NJ WI NY MN CT PA MA26-State Median
Oxycodone HCL and oxycodone-acetaminophen 1% 2% 2% 4% 5% 5% 6% 6% 7% 7% 8% 8% 9% 9% 10% 11% 15% 15% 15% 15% 17% 17% 18% 19% 20% 30% 9%
KY MA WI NY NV TN CT MN AR IL VA NJ PA LA MI NC SC CA IN KS MO GA MD TX IA FL26-State Median
Tramadol HCL and tramadol-acetaminophen 9% 10% 11% 12% 12% 12% 13% 13% 14% 14% 14% 14% 14% 15% 15% 16% 16% 17% 17% 19% 19% 20% 21% 21% 21% 25% 15%
IN LA MO TX KY FL SC CA NV TN GA KS WI IL NC MI CT PA IA NJ VA MN MD AR MA NY26-State Median
All other opioids 2% 2% 2% 2% 2% 3% 3% 3% 3% 3% 3% 3% 3% 3% 3% 4% 4% 4% 4% 4% 4% 4% 4% 5% 6% 6% 3%
LA AR WI MN NC SC MA IA KS IN MO NV VA TX TN PA MI GA KY NY MD CT IL FL CA NJ26-State Median
Non-opioid pain medications 32% 33% 35% 37% 38% 39% 39% 39% 39% 41% 41% 41% 41% 42% 44% 44% 46% 46% 48% 49% 49% 50% 51% 53% 54% 57% 42%
Notes: The underlying data include nonsurgical claims with more than seven days of lost time that had prescriptions filled by injured workers over the defined period and paid for by a workers' compensation payor. 2013/2015 refers to claims with injuries occurring from October 1, 2012, through September 30, 2013, and prescriptions filled through March 31, 2015. For readers interested in this information sorted alphabetically by state, please see Table SA.6.
% of pain medications that were for the drug
Table 5.1 Prescribing Pattern of Pain Medications, 2013/2015
copyright © 2017 workers compensation research institute
60
_____________________________________________________________________________________________I N T E R S T A T E V A R I A T I O N S I N U S E O F O P I O I D S , 4 T H E D I T I O N
When a physician prescribes opioids for pain relief, the choice becomes whether to prescribe stronger
opioid medications such as oxycodone or less potent opioids such as tramadol.3 We saw substantial variation
in the types of opioids commonly prescribed to injured workers across the 26 states. Table 5.1 shows that the
percentage of pain medication prescriptions for oxycodone and oxycodone-acetaminophen varied from 1–2
percent in California, Illinois, and Texas to 30 percent in Massachusetts. Fifteen to 20 percent of pain
medication prescriptions were for oxycodone in Connecticut, Maryland, Minnesota, North Carolina, New
Jersey, New York, Pennsylvania, Virginia, and Wisconsin. Similarly large variations were seen in terms of the
rate of prescribing hydrocodone-acetaminophen, from 9 percent in New Jersey (where oxycodone products
were more frequently prescribed) to 45 percent in Louisiana (where hydrocodone-acetaminophen was
prescribed more frequently than all non-opioid analgesics combined). Relatively smaller variations were seen
among the study states in the prescribing of tramadol and tramadol-acetaminophen. About 10 to 20 percent
of pain medication prescriptions were written for tramadol across all states except Florida, where one in four
pain medication prescriptions was written for tramadol. One of the reasons for more frequent prescribing of
tramadol products in Florida could be because physician dispensing is common practice, and physician-
dispensers are not allowed to dispense Schedule II and Schedule III opioids, such as hydrocodone and
oxycodone, effective July 2011.
As we discussed earlier, many factors may influence a physician’s choice to prescribe stronger or weaker
opioids, including the opioid policies in the state, the physician’s judgment as to the medical necessity for
pain relief, practice norms within a medical community, and the patient’s preference.4 For instance, a few
studies outside workers’ compensation have found evidence of the impact of state PDMPs on physicians’
prescribing of Schedule II opioids (Curtis et al., 2006a and 2006b, for example). However, we did not analyze
the impact of these programs in this report.
While a comprehensive discussion of the reasons for the substantial variation in prescribing of different
types of opioids is beyond the scope of this study, we observed that more frequent prescribing of oxycodone
did not always imply an overuse of opioids in a state. For example, physicians in New Jersey were more likely
to prescribe oxycodone medications compared with the prescribers in the median state—15 percent of pain
medication prescriptions were for oxycodone in New Jersey, 6 percentage points higher than the median of
the 26 states. However, the average MEA of opioids per claim in New Jersey was 20 percent lower than the 26-
state median. By contrast, physicians in Massachusetts and Pennsylvania prescribed these medications more
often, and the average amount of opioids received by injured workers in these states was 39–87 percent higher
than the 26-state median.
NOTABLE DECREASES IN PRESCRIBING OF HYDROCODONE-ACETAMINOPHEN, WHILE TRAMADOL
AND NON-OPIOID PAIN MEDICATIONS INCREASED IN MOST STUDY STATES
Prescribing patterns of the different types of pain medications changed between 2010/2012 and 2013/2015
3 We refer to oxycodone as a stronger opioid in this study to convey the relative strength of oxycodone prescriptions compared with other commonly dispensed opioids like hydrocodone-acetaminophen and tramadol. It is possible that some injured workers were prescribed stronger doses and more pills of hydrocodone-acetaminophen and tramadol to achieve the same MEA as oxycodone. However, in our study sample, the average morphine equivalent dose of oxycodone prescriptions was roughly 2–4 times higher than tramadol prescriptions and 1.5–2.5 times higher than hydrocodone prescriptions. 4 In Technical Appendix A, we provide some background information about the policy environment that may influence physicians’ prescribing behavior.
copyright © 2017 workers compensation research institute
61
_____________________________________________________________________________________________I N T E R S T A T E V A R I A T I O N S I N U S E O F O P I O I D S , 4 T H E D I T I O N
(Table 5.2).5
Over the three-year period, there was a noticeable decrease in the proportion of pain medications for
hydrocodone-acetaminophen (Vicodin®) in most study states. A notable drop of 11 percentage points was
seen in the measure in Kentucky and New York, both states with an increase in the proportion of non-opioid
pain medications. This change may be partly associated with Kentucky mandating prescribers to query the
PDMP prior to prescribing hydrocodone-acetaminophen for the first time, and every three months if the use
continues, and the up-scheduling of hydrocodone-acetaminophen from Schedule III to Schedule II in New
York, effective February 2013. California, Connecticut, Florida, Minnesota, Nevada, and Virginia also had 5–
6 percentage point decreases in the share of pain medication prescriptions that were for hydrocodone-
acetaminophen. Closer to the end of the study period in October 2014, the DEA changed the schedule of
hydrocodone-combination products from III to II. This downward trend may continue in several states when
we update the study with more recent data. Our findings are consistent with other studies that reported a
decrease in prescriptions for hydrocodone-combination products after the federal rescheduling.6
The proportion of tramadol products among all pain medications increased in several states over this
period, coinciding with the decreases in hydrocodone-acetaminophen and all other opioids, which includes
propoxyphene. Five states (California, Florida, Iowa, Indiana, and Texas) had 5–7 percentage point increases
in the percentage of pain medication prescriptions written for tramadol (Ultram® and Ultracet®) between
2010/2012 and 2013/2015. Tramadol was the only opioid that was not scheduled at the federal level during
most of the study period.7 In August 2014, the DEA classified tramadol as a Schedule IV drug.8 The increase
in the share of tramadol prescriptions between 2010/2012 and 2011/2013 could be partly explained by the
withdrawal of propoxyphene from the market in November 2010. The increase in the share of tramadol
prescriptions in the subsequent periods may be indicative of the substitution of relatively stronger opioids,
such as hydrocodone-acetaminophen, with tramadol by some practitioners. These trends should be closely
monitored to examine whether the federal and state policies are associated with reducing opioid prescribing
or substitution of stronger opioids with weaker opioids.
Coinciding with the substantial reductions in opioids prescribed to injured workers over the study
period, we noticed an increase in how likely physicians were to prescribe non-opioid pain medications when
pain medications were prescribed. Kentucky and New York had the highest increases in the percentage of
pain medication prescriptions that were for non-opioid pain medications (12–14 percentage points). Other
states with 5–8 percentage point increases were Arkansas, Connecticut, Maryland, Massachusetts, Nevada,
New Jersey, Pennsylvania, Tennessee, and Virginia. While non-opioid pain medications have their own set of
adverse effects,9 they are considered to be safer than opioid medications and are recommended as a first-line
of therapy in chronic management of non-cancer pain. 5 The percentage of all prescriptions that were for pain medications changed little in a majority of the study states, with the exception of Kentucky, Massachusetts, and New York, where we observed a 4–7 percentage point reduction from about 60 percent of all prescriptions written for pain medications in 2010/2012 to 53–58 percent in 2013/2015. In these three states, we observed an increase in the share of prescriptions written for non-steroidal anti-inflammatory drugs, corticosteroids, and acetaminophen (categorized as pain medications in this study) and an increase in prescriptions for anticonvulsants, antidepressants, dermatologicals, and muscle relaxants (not categorized as pain medications in this study). 6 Jones, Lurie, and, Throckmorton (2016) found that dispensing of prescriptions for hydrocodone-combination products decreased by 22 percent in the 12 months after the rescheduling, compared with 12 months prior to rescheduling. 7 Some states proactively classified it as a controlled substance even though it was not controlled at the federal level. 8 See DEA (2013) at http://www.deadiversion.usdoj.gov/fed_regs/rules/2013/fr1104.htm. 9 For example, non-steroidal anti-inflammatory drugs may cause gastrointestinal problems, and acetaminophen may cause liver failure if used over a long period of time.
copyright © 2017 workers compensation research institute
62
_____________________________________________________________________________________________I N T E R S T A T E V A R I A T I O N S I N U S E O F O P I O I D S , 4 T H E D I T I O N
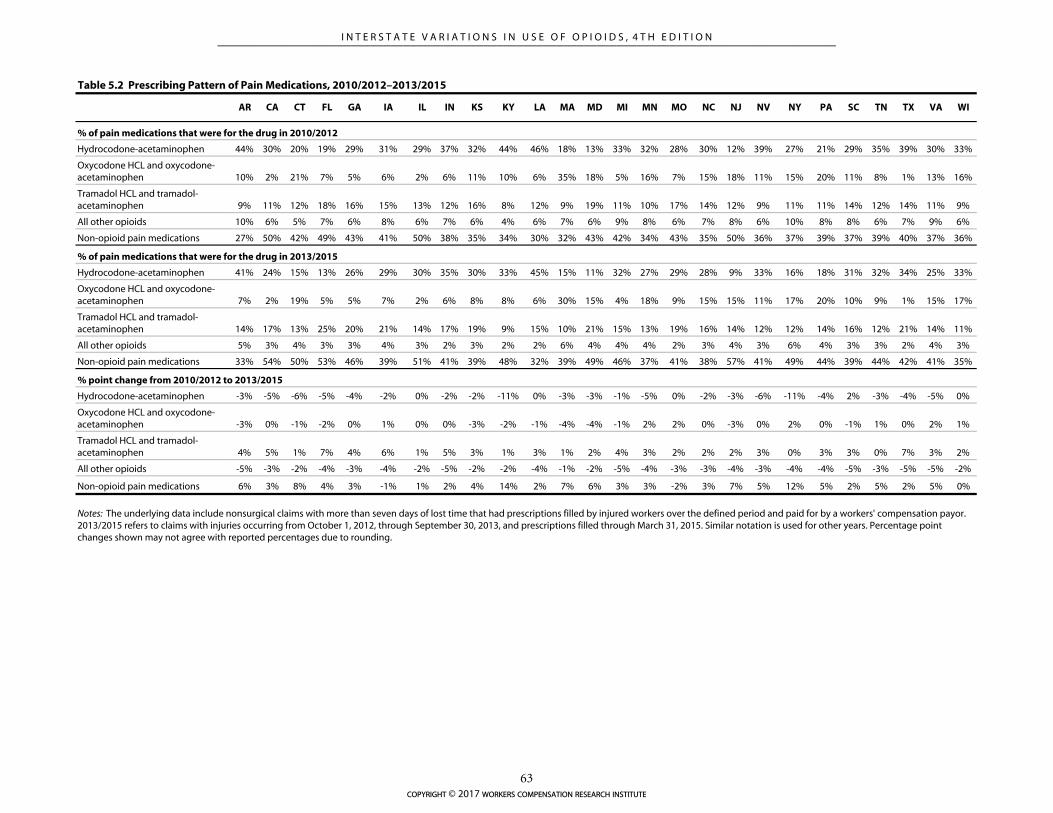
AR CA CT FL GA IA IL IN KS KY LA MA MD MI MN MO NC NJ NV NY PA SC TN TX VA WI
% of pain medications that were for the drug in 2010/2012
Hydrocodone-acetaminophen 44% 30% 20% 19% 29% 31% 29% 37% 32% 44% 46% 18% 13% 33% 32% 28% 30% 12% 39% 27% 21% 29% 35% 39% 30% 33%
Oxycodone HCL and oxycodone-acetaminophen 10% 2% 21% 7% 5% 6% 2% 6% 11% 10% 6% 35% 18% 5% 16% 7% 15% 18% 11% 15% 20% 11% 8% 1% 13% 16%
Tramadol HCL and tramadol-acetaminophen 9% 11% 12% 18% 16% 15% 13% 12% 16% 8% 12% 9% 19% 11% 10% 17% 14% 12% 9% 11% 11% 14% 12% 14% 11% 9%
All other opioids 10% 6% 5% 7% 6% 8% 6% 7% 6% 4% 6% 7% 6% 9% 8% 6% 7% 8% 6% 10% 8% 8% 6% 7% 9% 6%
Non-opioid pain medications 27% 50% 42% 49% 43% 41% 50% 38% 35% 34% 30% 32% 43% 42% 34% 43% 35% 50% 36% 37% 39% 37% 39% 40% 37% 36%
% of pain medications that were for the drug in 2013/2015
Hydrocodone-acetaminophen 41% 24% 15% 13% 26% 29% 30% 35% 30% 33% 45% 15% 11% 32% 27% 29% 28% 9% 33% 16% 18% 31% 32% 34% 25% 33%
Oxycodone HCL and oxycodone-acetaminophen 7% 2% 19% 5% 5% 7% 2% 6% 8% 8% 6% 30% 15% 4% 18% 9% 15% 15% 11% 17% 20% 10% 9% 1% 15% 17%
Tramadol HCL and tramadol-acetaminophen 14% 17% 13% 25% 20% 21% 14% 17% 19% 9% 15% 10% 21% 15% 13% 19% 16% 14% 12% 12% 14% 16% 12% 21% 14% 11%
All other opioids 5% 3% 4% 3% 3% 4% 3% 2% 3% 2% 2% 6% 4% 4% 4% 2% 3% 4% 3% 6% 4% 3% 3% 2% 4% 3%
Non-opioid pain medications 33% 54% 50% 53% 46% 39% 51% 41% 39% 48% 32% 39% 49% 46% 37% 41% 38% 57% 41% 49% 44% 39% 44% 42% 41% 35%
% point change from 2010/2012 to 2013/2015
Hydrocodone-acetaminophen -3% -5% -6% -5% -4% -2% 0% -2% -2% -11% 0% -3% -3% -1% -5% 0% -2% -3% -6% -11% -4% 2% -3% -4% -5% 0%
Oxycodone HCL and oxycodone-acetaminophen -3% 0% -1% -2% 0% 1% 0% 0% -3% -2% -1% -4% -4% -1% 2% 2% 0% -3% 0% 2% 0% -1% 1% 0% 2% 1%
Tramadol HCL and tramadol-acetaminophen 4% 5% 1% 7% 4% 6% 1% 5% 3% 1% 3% 1% 2% 4% 3% 2% 2% 2% 3% 0% 3% 3% 0% 7% 3% 2%
All other opioids -5% -3% -2% -4% -3% -4% -2% -5% -2% -2% -4% -1% -2% -5% -4% -3% -3% -4% -3% -4% -4% -5% -3% -5% -5% -2%
Non-opioid pain medications 6% 3% 8% 4% 3% -1% 1% 2% 4% 14% 2% 7% 6% 3% 3% -2% 3% 7% 5% 12% 5% 2% 5% 2% 5% 0%
Table 5.2 Prescribing Pattern of Pain Medications, 2010/2012–2013/2015
Notes: The underlying data include nonsurgical claims with more than seven days of lost time that had prescriptions filled by injured workers over the defined period and paid for by a workers' compensation payor. 2013/2015 refers to claims with injuries occurring from October 1, 2012, through September 30, 2013, and prescriptions filled through March 31, 2015. Similar notation is used for other years. Percentage point changes shown may not agree with reported percentages due to rounding.
copyright © 2017 workers compensation research institute
63
_____________________________________________________________________________________________I N T E R S T A T E V A R I A T I O N S I N U S E O F O P I O I D S , 4 T H E D I T I O N
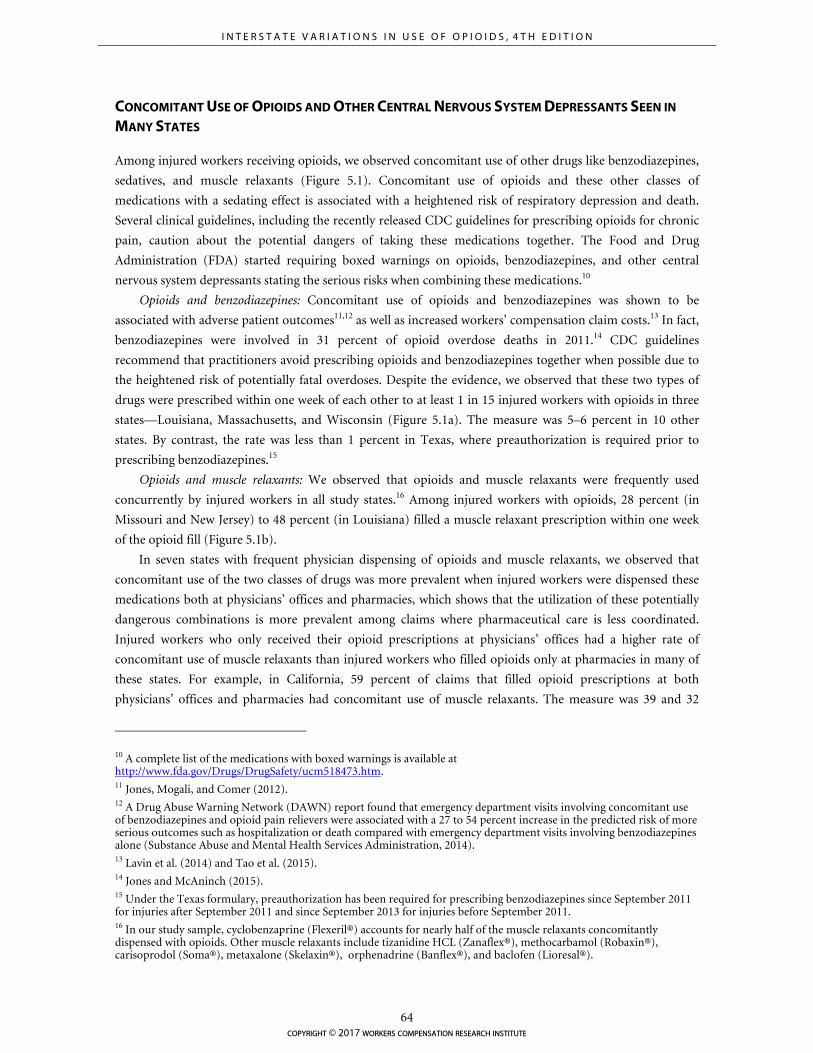
CONCOMITANT USE OF OPIOIDS AND OTHER CENTRAL NERVOUS SYSTEM DEPRESSANTS SEEN IN
MANY STATES
Among injured workers receiving opioids, we observed concomitant use of other drugs like benzodiazepines,
sedatives, and muscle relaxants (Figure 5.1). Concomitant use of opioids and these other classes of
medications with a sedating effect is associated with a heightened risk of respiratory depression and death.
Several clinical guidelines, including the recently released CDC guidelines for prescribing opioids for chronic
pain, caution about the potential dangers of taking these medications together. The Food and Drug
Administration (FDA) started requiring boxed warnings on opioids, benzodiazepines, and other central
nervous system depressants stating the serious risks when combining these medications.10
Opioids and benzodiazepines: Concomitant use of opioids and benzodiazepines was shown to be
associated with adverse patient outcomes11,12 as well as increased workers’ compensation claim costs.13 In fact,
benzodiazepines were involved in 31 percent of opioid overdose deaths in 2011.14 CDC guidelines
recommend that practitioners avoid prescribing opioids and benzodiazepines together when possible due to
the heightened risk of potentially fatal overdoses. Despite the evidence, we observed that these two types of
drugs were prescribed within one week of each other to at least 1 in 15 injured workers with opioids in three
states—Louisiana, Massachusetts, and Wisconsin (Figure 5.1a). The measure was 5–6 percent in 10 other
states. By contrast, the rate was less than 1 percent in Texas, where preauthorization is required prior to
prescribing benzodiazepines.15
Opioids and muscle relaxants: We observed that opioids and muscle relaxants were frequently used
concurrently by injured workers in all study states.16 Among injured workers with opioids, 28 percent (in
Missouri and New Jersey) to 48 percent (in Louisiana) filled a muscle relaxant prescription within one week
of the opioid fill (Figure 5.1b).
In seven states with frequent physician dispensing of opioids and muscle relaxants, we observed that
concomitant use of the two classes of drugs was more prevalent when injured workers were dispensed these
medications both at physicians’ offices and pharmacies, which shows that the utilization of these potentially
dangerous combinations is more prevalent among claims where pharmaceutical care is less coordinated.
Injured workers who only received their opioid prescriptions at physicians’ offices had a higher rate of
concomitant use of muscle relaxants than injured workers who filled opioids only at pharmacies in many of
these states. For example, in California, 59 percent of claims that filled opioid prescriptions at both
physicians’ offices and pharmacies had concomitant use of muscle relaxants. The measure was 39 and 32
10 A complete list of the medications with boxed warnings is available at http://www.fda.gov/Drugs/DrugSafety/ucm518473.htm. 11 Jones, Mogali, and Comer (2012). 12 A Drug Abuse Warning Network (DAWN) report found that emergency department visits involving concomitant use of benzodiazepines and opioid pain relievers were associated with a 27 to 54 percent increase in the predicted risk of more serious outcomes such as hospitalization or death compared with emergency department visits involving benzodiazepines alone (Substance Abuse and Mental Health Services Administration, 2014). 13 Lavin et al. (2014) and Tao et al. (2015). 14 Jones and McAninch (2015). 15 Under the Texas formulary, preauthorization has been required for prescribing benzodiazepines since September 2011 for injuries after September 2011 and since September 2013 for injuries before September 2011. 16 In our study sample, cyclobenzaprine (Flexeril®) accounts for nearly half of the muscle relaxants concomitantly dispensed with opioids. Other muscle relaxants include tizanidine HCL (Zanaflex®), methocarbamol (Robaxin®), carisoprodol (Soma®), metaxalone (Skelaxin®), orphenadrine (Banflex®), and baclofen (Lioresal®).
copyright © 2017 workers compensation research institute
64
_____________________________________________________________________________________________I N T E R S T A T E V A R I A T I O N S I N U S E O F O P I O I D S , 4 T H E D I T I O N
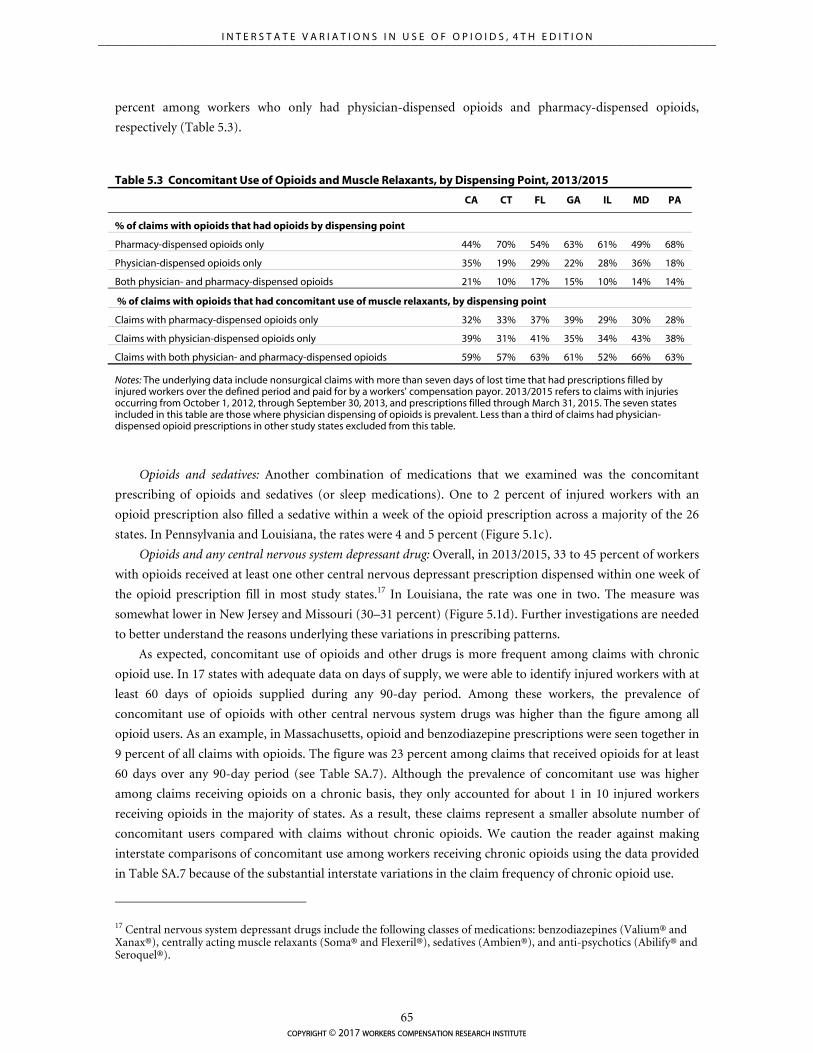
percent among workers who only had physician-dispensed opioids and pharmacy-dispensed opioids,
respectively (Table 5.3).
Opioids and sedatives: Another combination of medications that we examined was the concomitant
prescribing of opioids and sedatives (or sleep medications). One to 2 percent of injured workers with an
opioid prescription also filled a sedative within a week of the opioid prescription across a majority of the 26
states. In Pennsylvania and Louisiana, the rates were 4 and 5 percent (Figure 5.1c).
Opioids and any central nervous system depressant drug: Overall, in 2013/2015, 33 to 45 percent of workers
with opioids received at least one other central nervous depressant prescription dispensed within one week of
the opioid prescription fill in most study states.17 In Louisiana, the rate was one in two. The measure was
somewhat lower in New Jersey and Missouri (30–31 percent) (Figure 5.1d). Further investigations are needed
to better understand the reasons underlying these variations in prescribing patterns.
As expected, concomitant use of opioids and other drugs is more frequent among claims with chronic
opioid use. In 17 states with adequate data on days of supply, we were able to identify injured workers with at
least 60 days of opioids supplied during any 90-day period. Among these workers, the prevalence of
concomitant use of opioids with other central nervous system drugs was higher than the figure among all
opioid users. As an example, in Massachusetts, opioid and benzodiazepine prescriptions were seen together in
9 percent of all claims with opioids. The figure was 23 percent among claims that received opioids for at least
60 days over any 90-day period (see Table SA.7). Although the prevalence of concomitant use was higher
among claims receiving opioids on a chronic basis, they only accounted for about 1 in 10 injured workers
receiving opioids in the majority of states. As a result, these claims represent a smaller absolute number of
concomitant users compared with claims without chronic opioids. We caution the reader against making
interstate comparisons of concomitant use among workers receiving chronic opioids using the data provided
in Table SA.7 because of the substantial interstate variations in the claim frequency of chronic opioid use.
17 Central nervous system depressant drugs include the following classes of medications: benzodiazepines (Valium® and Xanax®), centrally acting muscle relaxants (Soma® and Flexeril®), sedatives (Ambien®), and anti-psychotics (Abilify® and Seroquel®).
Table 5.3 Concomitant Use of Opioids and Muscle Relaxants, by Dispensing Point, 2013/2015
CA CT FL GA IL MD PA
% of claims with opioids that had opioids by dispensing point
Pharmacy-dispensed opioids only 44% 70% 54% 63% 61% 49% 68%
Physician-dispensed opioids only 35% 19% 29% 22% 28% 36% 18%
Both physician- and pharmacy-dispensed opioids 21% 10% 17% 15% 10% 14% 14%
% of claims with opioids that had concomitant use of muscle relaxants, by dispensing point
Claims with pharmacy-dispensed opioids only 32% 33% 37% 39% 29% 30% 28%
Claims with physician-dispensed opioids only 39% 31% 41% 35% 34% 43% 38%
Claims with both physician- and pharmacy-dispensed opioids 59% 57% 63% 61% 52% 66% 63%
Notes: The underlying data include nonsurgical claims with more than seven days of lost time that had prescriptions filled by injured workers over the defined period and paid for by a workers' compensation payor. 2013/2015 refers to claims with injuries occurring from October 1, 2012, through September 30, 2013, and prescriptions filled through March 31, 2015. The seven states included in this table are those where physician dispensing of opioids is prevalent. Less than a third of claims had physician-dispensed opioid prescriptions in other study states excluded from this table.
copyright © 2017 workers compensation research institute
65
_____________________________________________________________________________________________I N T E R S T A T E V A R I A T I O N S I N U S E O F O P I O I D S , 4 T H E D I T I O N
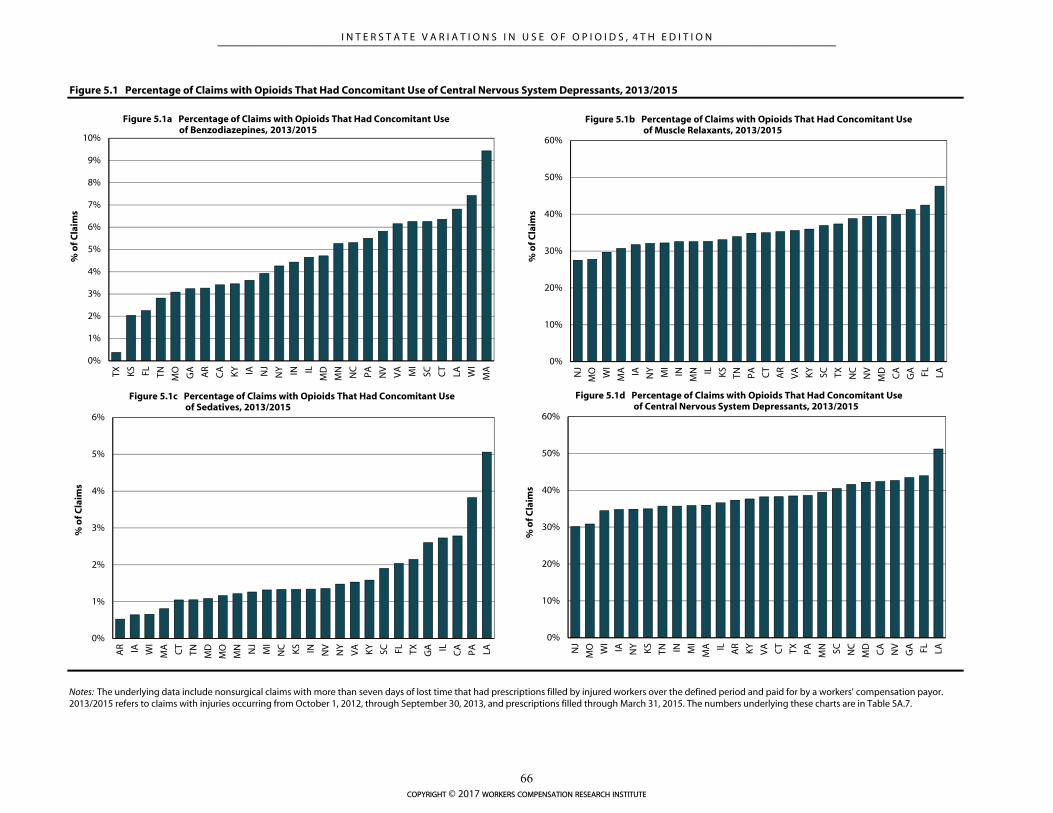
Figure 5.1 Percentage of Claims with Opioids That Had Concomitant Use of Central Nervous System Depressants, 2013/2015
Notes: The underlying data include nonsurgical claims with more than seven days of lost time that had prescriptions filled by injured workers over the defined period and paid for by a workers' compensation payor. 2013/2015 refers to claims with injuries occurring from October 1, 2012, through September 30, 2013, and prescriptions filled through March 31, 2015. The numbers underlying these charts are in Table SA.7.
0%
1%
2%
3%
4%
5%
6%
7%
8%
9%
10%
TX KS FL TN MO
GA AR
CA KY IA NJ
NY IN IL
MD
MN
NC
PA NV
VA MI
SC CT
LA WI
MA
% o
f Cla
ims
Figure 5.1a Percentage of Claims with Opioids That Had Concomitant Use of Benzodiazepines, 2013/2015
0%
10%
20%
30%
40%
50%
60%
NJ
MO W
I
MA IA NY MI
IN
MN IL KS
TN PA CT
AR
VA KY
SC TX NC
NV
MD CA
GA FL LA
% o
f Cla
ims
Figure 5.1b Percentage of Claims with Opioids That Had Concomitant Use of Muscle Relaxants, 2013/2015
0%
1%
2%
3%
4%
5%
6%
AR IA WI
MA CT
TN MD
MO
MN NJ
MI
NC KS IN NV
NY
VA KY
SC FL TX GA IL CA PA LA
% o
f Cla
ims
Figure 5.1c Percentage of Claims with Opioids That Had Concomitant Use of Sedatives, 2013/2015
0%
10%
20%
30%
40%
50%
60%
NJ
MO W
I
IA NY KS
TN IN MI
MA IL AR
KY
VA CT
TX PA MN SC NC
MD CA
NV
GA FL LA
% o
f Cla
ims
Figure 5.1d Percentage of Claims with Opioids That Had Concomitant Use of Central Nervous System Depressants, 2013/2015
copyright © 2017 workers compensation research institute
66
_____________________________________________________________________________________________I N T E R S T A T E V A R I A T I O N S I N U S E O F O P I O I D S , 4 T H E D I T I O N
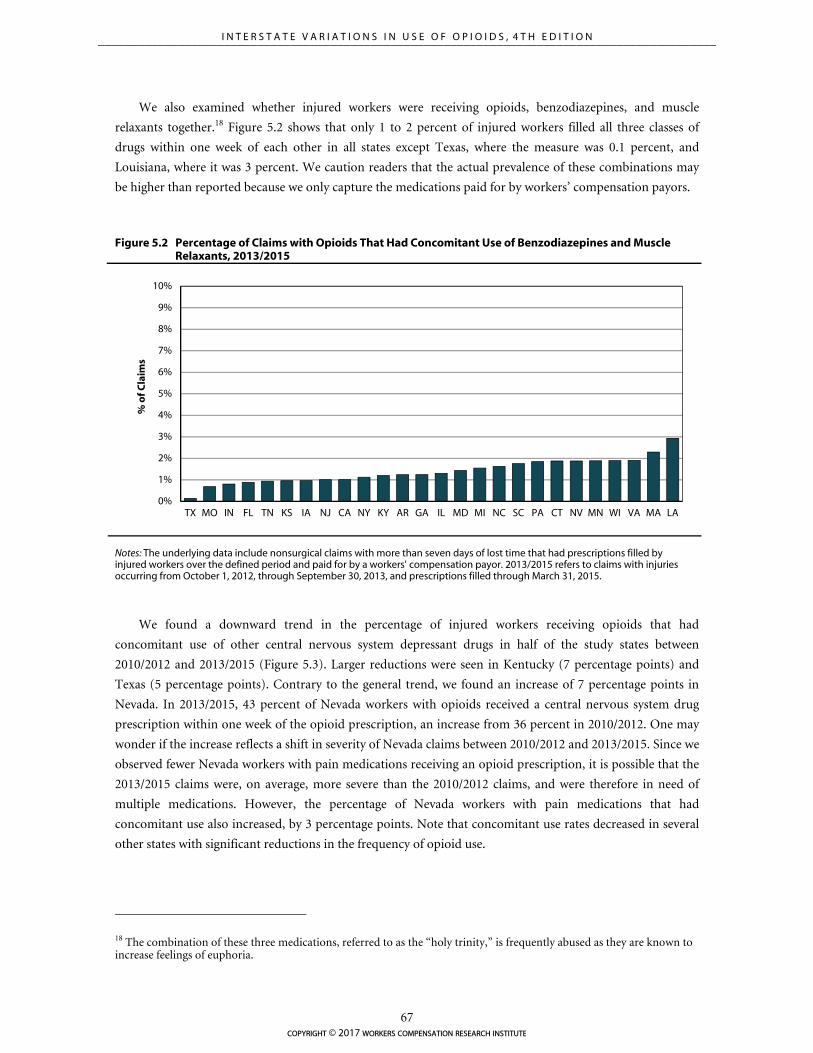
We also examined whether injured workers were receiving opioids, benzodiazepines, and muscle
relaxants together.18 Figure 5.2 shows that only 1 to 2 percent of injured workers filled all three classes of
drugs within one week of each other in all states except Texas, where the measure was 0.1 percent, and
Louisiana, where it was 3 percent. We caution readers that the actual prevalence of these combinations may
be higher than reported because we only capture the medications paid for by workers’ compensation payors.
Figure 5.2 Percentage of Claims with Opioids That Had Concomitant Use of Benzodiazepines and Muscle Relaxants, 2013/2015
Notes: The underlying data include nonsurgical claims with more than seven days of lost time that had prescriptions filled by injured workers over the defined period and paid for by a workers' compensation payor. 2013/2015 refers to claims with injuries occurring from October 1, 2012, through September 30, 2013, and prescriptions filled through March 31, 2015.
We found a downward trend in the percentage of injured workers receiving opioids that had
concomitant use of other central nervous system depressant drugs in half of the study states between
2010/2012 and 2013/2015 (Figure 5.3). Larger reductions were seen in Kentucky (7 percentage points) and
Texas (5 percentage points). Contrary to the general trend, we found an increase of 7 percentage points in
Nevada. In 2013/2015, 43 percent of Nevada workers with opioids received a central nervous system drug
prescription within one week of the opioid prescription, an increase from 36 percent in 2010/2012. One may
wonder if the increase reflects a shift in severity of Nevada claims between 2010/2012 and 2013/2015. Since we
observed fewer Nevada workers with pain medications receiving an opioid prescription, it is possible that the
2013/2015 claims were, on average, more severe than the 2010/2012 claims, and were therefore in need of
multiple medications. However, the percentage of Nevada workers with pain medications that had
concomitant use also increased, by 3 percentage points. Note that concomitant use rates decreased in several
other states with significant reductions in the frequency of opioid use.
18 The combination of these three medications, referred to as the “holy trinity,” is frequently abused as they are known to increase feelings of euphoria.
0%
1%
2%
3%
4%
5%
6%
7%
8%
9%
10%
TX MO IN FL TN KS IA NJ CA NY KY AR GA IL MD MI NC SC PA CT NV MN WI VA MA LA
% o
f Cla
ims
copyright © 2017 workers compensation research institute
67
_____________________________________________________________________________________________I N T E R S T A T E V A R I A T I O N S I N U S E O F O P I O I D S , 4 T H E D I T I O N
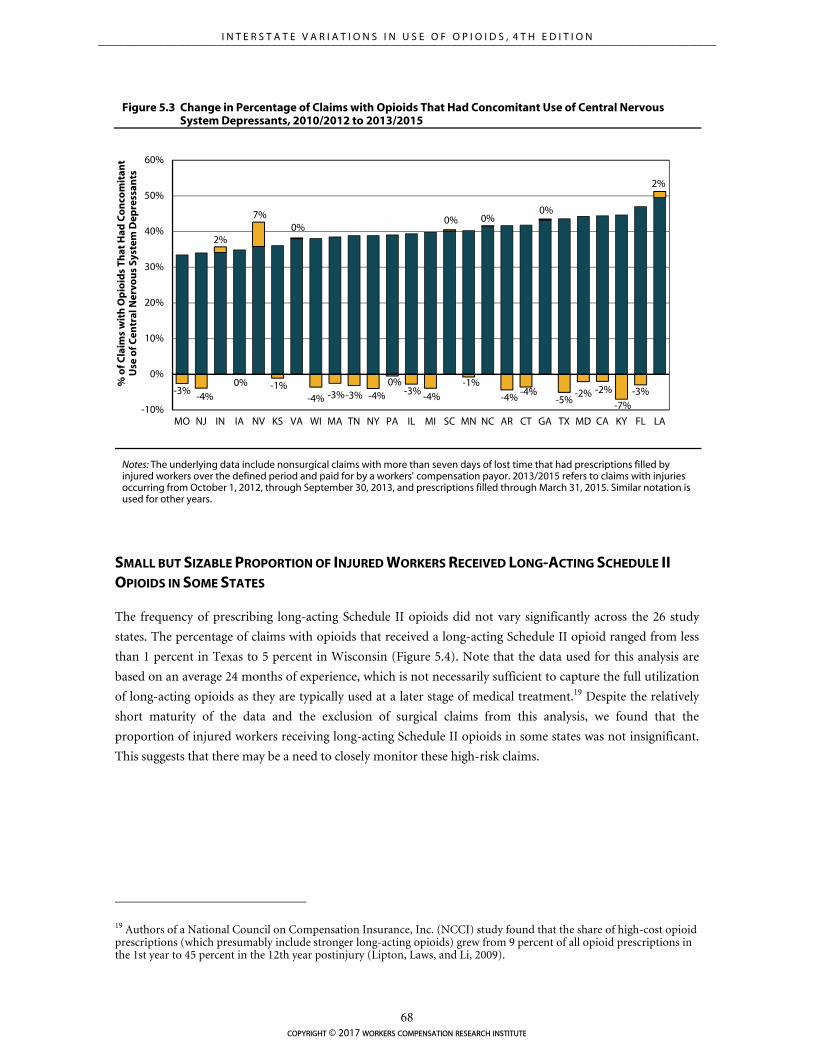
-3%-4%
2%
0%
7%
-1%
0%
-4% -3%-3% -4%0%
-3% -4%
0%
-1%
0%
-4%-4%
0%
-5%-2% -2%
-7%-3%
2%
-10%
0%
10%
20%
30%
40%
50%
60%
MO NJ IN IA NV KS VA WI MA TN NY PA IL MI SC MN NC AR CT GA TX MD CA KY FL LA
% o
f Cla
ims
wit
h O
pio
ids
That
Had
Co
nco
mit
ant
Use
of C
entr
al N
ervo
us
Syst
em D
epre
ssan
ts
Figure 5.3 Change in Percentage of Claims with Opioids That Had Concomitant Use of Central Nervous System Depressants, 2010/2012 to 2013/2015
Notes: The underlying data include nonsurgical claims with more than seven days of lost time that had prescriptions filled by injured workers over the defined period and paid for by a workers' compensation payor. 2013/2015 refers to claims with injuries occurring from October 1, 2012, through September 30, 2013, and prescriptions filled through March 31, 2015. Similar notation is used for other years.
SMALL BUT SIZABLE PROPORTION OF INJURED WORKERS RECEIVED LONG-ACTING SCHEDULE II
OPIOIDS IN SOME STATES
The frequency of prescribing long-acting Schedule II opioids did not vary significantly across the 26 study
states. The percentage of claims with opioids that received a long-acting Schedule II opioid ranged from less
than 1 percent in Texas to 5 percent in Wisconsin (Figure 5.4). Note that the data used for this analysis are
based on an average 24 months of experience, which is not necessarily sufficient to capture the full utilization
of long-acting opioids as they are typically used at a later stage of medical treatment.19 Despite the relatively
short maturity of the data and the exclusion of surgical claims from this analysis, we found that the
proportion of injured workers receiving long-acting Schedule II opioids in some states was not insignificant.
This suggests that there may be a need to closely monitor these high-risk claims.
19 Authors of a National Council on Compensation Insurance, Inc. (NCCI) study found that the share of high-cost opioid prescriptions (which presumably include stronger long-acting opioids) grew from 9 percent of all opioid prescriptions in the 1st year to 45 percent in the 12th year postinjury (Lipton, Laws, and Li, 2009).
copyright © 2017 workers compensation research institute
68
_____________________________________________________________________________________________I N T E R S T A T E V A R I A T I O N S I N U S E O F O P I O I D S , 4 T H E D I T I O N
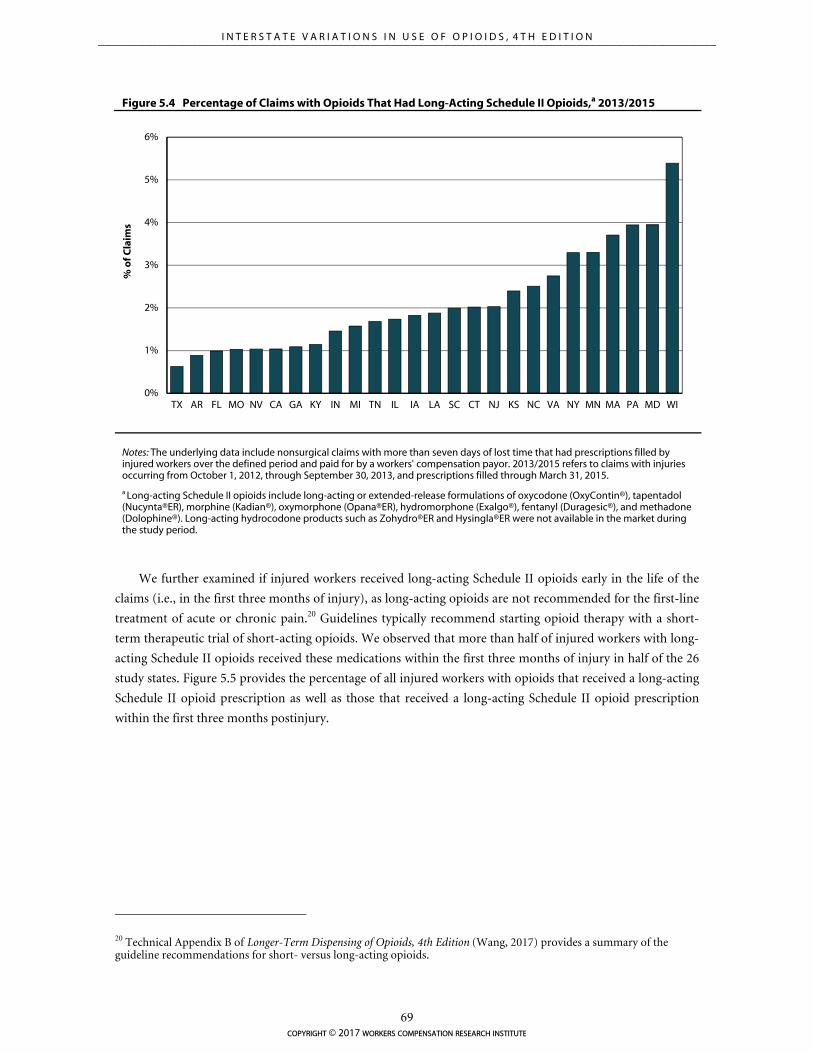
0%
1%
2%
3%
4%
5%
6%
TX AR FL MO NV CA GA KY IN MI TN IL IA LA SC CT NJ KS NC VA NY MN MA PA MD WI
% o
f Cla
ims
Figure 5.4 Percentage of Claims with Opioids That Had Long-Acting Schedule II Opioids,a 2013/2015
Notes: The underlying data include nonsurgical claims with more than seven days of lost time that had prescriptions filled by injured workers over the defined period and paid for by a workers' compensation payor. 2013/2015 refers to claims with injuries occurring from October 1, 2012, through September 30, 2013, and prescriptions filled through March 31, 2015.
a Long-acting Schedule II opioids include long-acting or extended-release formulations of oxycodone (OxyContin®), tapentadol (Nucynta®ER), morphine (Kadian®), oxymorphone (Opana®ER), hydromorphone (Exalgo®), fentanyl (Duragesic®), and methadone (Dolophine®). Long-acting hydrocodone products such as Zohydro®ER and Hysingla®ER were not available in the market during the study period.
We further examined if injured workers received long-acting Schedule II opioids early in the life of the
claims (i.e., in the first three months of injury), as long-acting opioids are not recommended for the first-line
treatment of acute or chronic pain.20 Guidelines typically recommend starting opioid therapy with a short-
term therapeutic trial of short-acting opioids. We observed that more than half of injured workers with long-
acting Schedule II opioids received these medications within the first three months of injury in half of the 26
study states. Figure 5.5 provides the percentage of all injured workers with opioids that received a long-acting
Schedule II opioid prescription as well as those that received a long-acting Schedule II opioid prescription
within the first three months postinjury.
20 Technical Appendix B of Longer-Term Dispensing of Opioids, 4th Edition (Wang, 2017) provides a summary of the guideline recommendations for short- versus long-acting opioids.
copyright © 2017 workers compensation research institute
69
_____________________________________________________________________________________________I N T E R S T A T E V A R I A T I O N S I N U S E O F O P I O I D S , 4 T H E D I T I O N
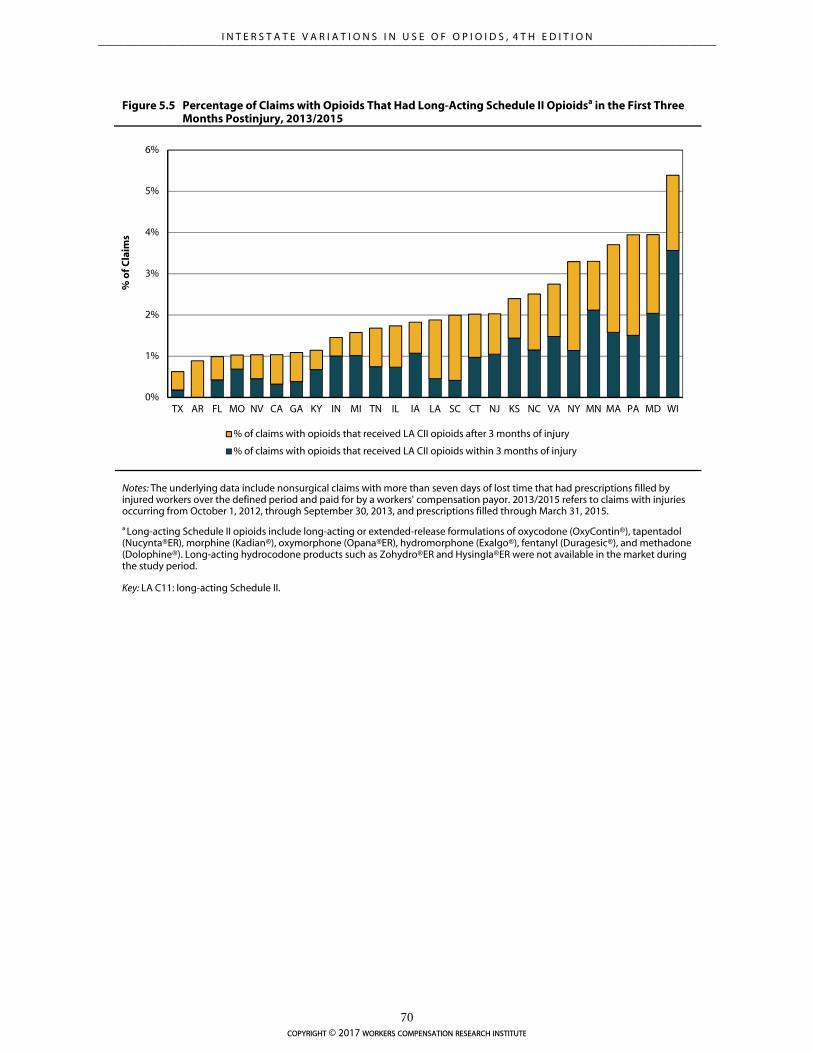
0%
1%
2%
3%
4%
5%
6%
TX AR FL MO NV CA GA KY IN MI TN IL IA LA SC CT NJ KS NC VA NY MN MA PA MD WI
% o
f Cla
ims
% of claims with opioids that received LA CII opioids after 3 months of injury
% of claims with opioids that received LA CII opioids within 3 months of injury
Figure 5.5 Percentage of Claims with Opioids That Had Long-Acting Schedule II Opioidsa in the First Three Months Postinjury, 2013/2015
Notes: The underlying data include nonsurgical claims with more than seven days of lost time that had prescriptions filled by injured workers over the defined period and paid for by a workers' compensation payor. 2013/2015 refers to claims with injuries occurring from October 1, 2012, through September 30, 2013, and prescriptions filled through March 31, 2015.
a Long-acting Schedule II opioids include long-acting or extended-release formulations of oxycodone (OxyContin®), tapentadol (Nucynta®ER), morphine (Kadian®), oxymorphone (Opana®ER), hydromorphone (Exalgo®), fentanyl (Duragesic®), and methadone (Dolophine®). Long-acting hydrocodone products such as Zohydro®ER and Hysingla®ER were not available in the market during the study period.
Key: LA C11: long-acting Schedule II.
copyright © 2017 workers compensation research institute
70
_____________________________________________________________________________________________I N T E R S T A T E V A R I A T I O N S I N U S E O F O P I O I D S , 4 T H E D I T I O N
6
IMPLICATIONS AND CONCLUSIONS
Since the late 1990s, the use of prescription opioids has increased very rapidly, coinciding with a sharp
increase in the per capita death rate in the United States due to unintended drug overdoses.1,2 For patients
with occupational injuries, a higher use of opioids may also lead to addiction, increased disability or work
loss, and even death.3 The beginning of this decade marks the time when opioid utilization rates were at their
peak in most states in the United States. In recent years, many states saw decreases in opioid prescriptions,
which may be associated with opioid policies and initiatives in the past few years, at the federal, state, and
organization levels, that were aimed at controlling inappropriate opioid prescribing and thereby reducing
opioid misuse and abuse.4,5,6,7 Over the study period, several such policies were adopted in the study states,
including mandatory use of PDMPs by controlled substance prescribers, adoption of guidelines for
prescribing opioids and managing chronic pain, regulation of pain clinics, implementation of drug
formularies, and mandatory requirements for continuing medical education on appropriate opioid
prescribing and pain management. This report serves as a tool to monitor the results of these ongoing policy
changes on opioid utilization in 26 state workers’ compensation systems.
Our study presents some encouraging findings in terms of trends in opioids prescribed and dispensed to
injured workers. Between 2010/2012 and 2013/2015, the average amount of opioids per claim decreased
significantly in most study states. This was the second year we saw decreases in opioid utilization across
multiple workers’ compensation jurisdictions. Four states (Kentucky, Maryland, Michigan, and New York)
experienced the largest decreases in the utilization of opioids. In these four states, the average amount of
1 The per capita death rate from unintentional drug overdoses involving opioids increased from 3 to 4 deaths per 100,000 population in the late 1990s to 9 deaths per 100,000 population in 2007 (Okie, 2010). Between 2000 and 2014, the age-adjusted rate of drug overdose deaths increased from 6 to 15 per 100,000 population, and the age-adjusted rate of drug overdose deaths involving opioids increased from about 3 to 9 per 100,000 population (Rudd et al., 2016a). 2 Ahmedani et al. (2014) reported that the rate of opioid pharmacy fills, quantity of opioids prescribed, and proportion of chronic opioid users increased consistently by more than two-fold between 1997 and 2011, with the exception of a one-time drop in 2010 that the authors attributed to the market withdrawal of propoxyphene. The CDC reported that opioid-related overdose deaths increased for 11 consecutive years and reached 16,651 deaths in 2010 (CDC, 2012). 3 See Kidner, Mayer, and Gatchel (2009) and Franklin et al. (2005). 4 Dart et al. (2015) examined trends in opioid abuse and mortality between 2002 and 2013 in the United States using data from IMS and Researched Abuse, Diversion, and Addiction Related Surveillance (RADARS) systems. They observed an increase in opioid prescriptions between 2002 and 2010 and a slight decrease in the measure from 2011 through 2013. The authors reported similar trends in other measures of opioid diversion, abuse, and opioid-related deaths. 5 Florida also reported a decrease in opioid overdose deaths after the pill mill legislation became effective, from an all-time high of 3,201 deaths in 2010 to 2,666 in 2012 (Johnson et al., 2014). Thumula (2014) found a 12 percent decrease in injured workers receiving opioids after Florida banned physician dispensing of certain opioids in the state. 6 A study conducted by the Texas Department of Insurance (TDI) to evaluate the impact of the closed formulary in the state reported a decrease in total opioid prescriptions by 10 percent following the implementation of the formulary (TDI, 2013). 7 Ireland, Young, and Swedlow (2014).
copyright © 2017 workers compensation research institute
71
_____________________________________________________________________________________________I N T E R S T A T E V A R I A T I O N S I N U S E O F O P I O I D S , 4 T H E D I T I O N
opioids per claim decreased by 30–40 percent over the study period, among nonsurgical claims with more
than seven days of lost time. In three of the four states, the substantial decreases in the opioid amount were
also coupled with a large decrease in the frequency of claims receiving opioids (a decrease of 16 percentage
points in Kentucky, 9 points in New York, and 6 points in Maryland). Effective in July 2012, Kentucky passed
the comprehensive legislation HB 1, which regulated pain clinics and established standards for prescribing
and dispensing opioids, including mandatory use of the state PDMP database. In New York, several reforms
went into effect, in and outside the workers’ compensation system, including the state I-Stop legislation,
which mandated that prescribers check the state PDMP database prior to prescribing opioids. Considerable
reductions in opioid utilization were also seen in 11 other states—California, Connecticut, Florida, Georgia,
Kansas, Massachusetts, Minnesota, Nevada, New Jersey, Tennessee, and Texas. With more opioid policies and
initiatives in place in many states, we will continue to monitor the trends to see if the downward trends
continue.
As a result of the substantial changes in opioid use over the study period, the extent of interstate
variations narrowed across most study states. However, we still saw unusually higher amounts of opioids
prescribed to injured workers in some states in 2013/2015, the latest study year. Louisiana and Pennsylvania
continued to have a higher average amount of opioids per claim compared with the other study states. With a
substantial decrease in the frequency and amount of opioids per claim, New York was not one of the highest
states on opioid use (as it was in 2010/2012), but it was still higher than the median of the 26 states. We also
observed a considerable percentage of claims with opioids that were receiving chronic opioids (at least 60 days
of opioids supply over any 90-day period) and at higher doses (average daily dose of opioids exceeding 50 and
90 MED). Given that these are nonsurgical claims, most of which had musculoskeletal injuries, opioid
treatment for these injured workers could perhaps be better monitored.
We found that in a few states, the frequency of concomitant use of opioids and other central nervous
system depressant drugs like benzodiazepines (Valium® and Xanax®), muscle relaxants (Soma® and
Flexeril®), and sedatives (Ambien®) were noticeably higher compared with the other study states. For
example, at least 1 in 15 injured workers with opioids in three states (Massachusetts, Louisiana, and
Wisconsin) filled a benzodiazepine prescription within one week of the opioid fill. By contrast, less than 1
percent of injured workers with opioids received benzodiazepines in Texas, where preauthorization has been
required prior to prescribing benzodiazepines since the implementation of the Texas formulary. Several
clinical guidelines, including the CDC guidelines for prescribing opioids for chronic pain, caution about the
potential dangers of taking these medications together. Although a small percentage of injured workers
received some of these combinations in many states, the dangers of combined use of these drugs may put
hundreds of injured workers at risk. Further investigations are needed to better understand the reasons
underlying these variations in prescribing patterns.
Despite the reductions in opioids dispensed for the treatment of workplace injuries, the most recent
trends in opioid-related overdose deaths published by the CDC raises concerns.8 Between 2010 and 2015,
drug overdose deaths increased or remained the same across all states. Overdose deaths related to opioids
increased by 15.6 percent from 2014 to 2015, driven by methadone and fentanyl. Deaths due to natural and
semi-synthetic opioids (which include hydrocodone-acetaminophen and oxycodone) increased in the
northeast and southern regions. Researchers are investigating the potential unintended consequences of
public policies aimed at reducing opioid prescribing, and the evidence is conflicting about the association
8 Rudd et al. (2016b).
copyright © 2017 workers compensation research institute
72
_____________________________________________________________________________________________I N T E R S T A T E V A R I A T I O N S I N U S E O F O P I O I D S , 4 T H E D I T I O N
between opioid policies and increases in drug overdose deaths related to the use of non-prescription opioids
(e.g., heroin and illicit fentanyl).9,10 As a result, in the last few years, a growing number of states took a
comprehensive approach to addressing opioid issues in a coordinated way, focusing on the prevention and
treatment of opioid overdoses. While this report does not track all reforms aimed at overdose prevention and
treatment, we plan to continue to track the results of primary prevention policies aimed at limiting
unnecessary prescribing of opioids.
CONCLUDING REMARKS
By highlighting substantial interstate variations in the use of opioids across the states, this study may inform
policymakers and stakeholders about the level of opioid use in their state and help them target their efforts to
address issues related to prescription opioids in their states. This study may also be used as an important
educational tool for the community of workers’ compensation medical providers in each state to compare
their practice patterns with the norms seen across the 26 study states. Some providers may subsequently
modify their practice patterns after seeing the practice norms.
This study further serves as a tool to monitor changes in opioid utilization as states continue to
implement policies addressing opioid overuse, although it does not provide insights as to which precise
policies or initiatives are effective at reducing unnecessary use of opioids that may put some injured workers
at risk of unnecessary harm. Limited in the scope of what policy questions this report can answer, this update
leaves many important policy questions unanswered. Future studies should focus on specific workers’
compensation system features and opioid policies that lead to interstate variations in opioid use and establish
causal relationships between specific opioid policies and trends in opioid use.
9 Finklea, Sacco, and Bagalman (2014). 10 Dowell et al. (2016); Patrick et al. (2016).
copyright © 2017 workers compensation research institute
73
_____________________________________________________________________________________________I N T E R S T A T E V A R I A T I O N S I N U S E O F O P I O I D S , 4 T H E D I T I O N
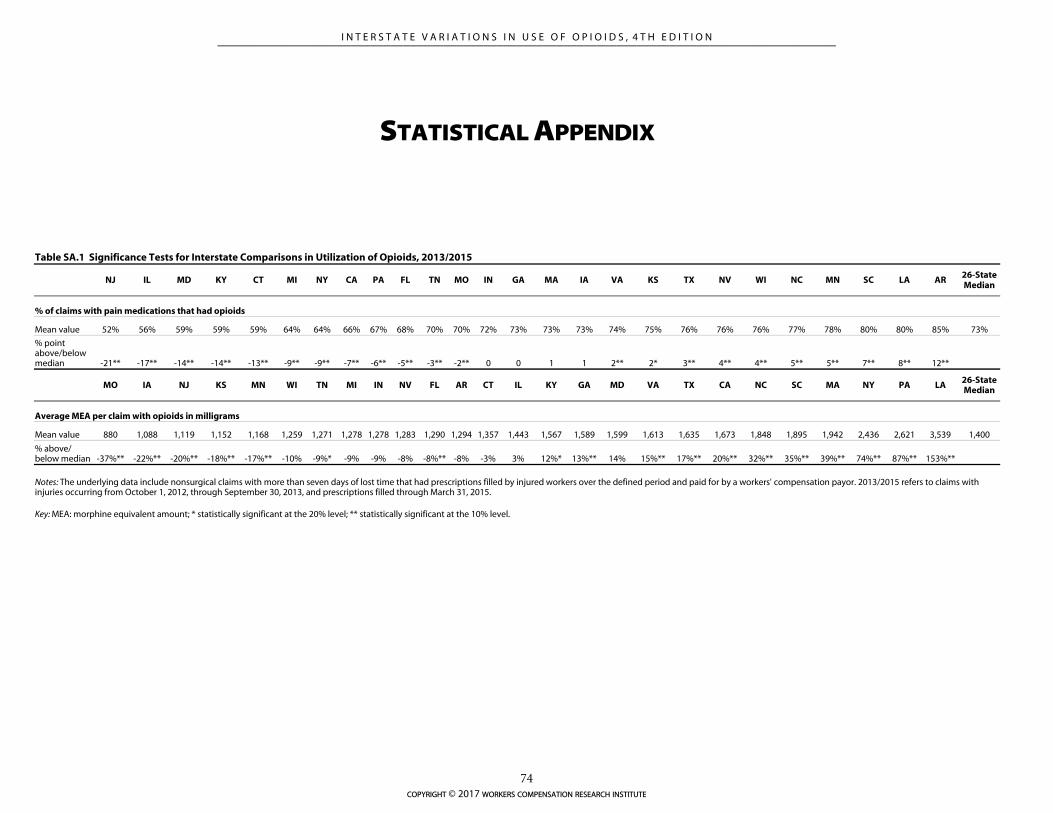
STATISTICAL APPENDIX
Table SA.1 Significance Tests for Interstate Comparisons in Utilization of Opioids, 2013/2015
NJ IL MD KY CT MI NY CA PA FL TN MO IN GA MA IA VA KS TX NV WI NC MN SC LA AR 26-State Median
% of claims with pain medications that had opioids
Mean value 52% 56% 59% 59% 59% 64% 64% 66% 67% 68% 70% 70% 72% 73% 73% 73% 74% 75% 76% 76% 76% 77% 78% 80% 80% 85% 73%
% point above/below median -21** -17** -14** -14** -13** -9** -9** -7** -6** -5** -3** -2** 0 0 1 1 2** 2* 3** 4** 4** 5** 5** 7** 8** 12**
MO IA NJ KS MN WI TN MI IN NV FL AR CT IL KY GA MD VA TX CA NC SC MA NY PA LA 26-State Median
Average MEA per claim with opioids in milligrams
Mean value 880 1,088 1,119 1,152 1,168 1,259 1,271 1,278 1,278 1,283 1,290 1,294 1,357 1,443 1,567 1,589 1,599 1,613 1,635 1,673 1,848 1,895 1,942 2,436 2,621 3,539 1,400
% above/ below median -37%** -22%** -20%** -18%** -17%** -10% -9%* -9% -9% -8% -8%** -8% -3% 3% 12%* 13%** 14% 15%** 17%** 20%** 32%** 35%** 39%** 74%** 87%** 153%**
Notes: The underlying data include nonsurgical claims with more than seven days of lost time that had prescriptions filled by injured workers over the defined period and paid for by a workers' compensation payor. 2013/2015 refers to claims with injuries occurring from October 1, 2012, through September 30, 2013, and prescriptions filled through March 31, 2015.
Key: MEA: morphine equivalent amount; * statistically significant at the 20% level; ** statistically significant at the 10% level.
copyright © 2017 workers compensation research institute
74
_____________________________________________________________________________________________I N T E R S T A T E V A R I A T I O N S I N U S E O F O P I O I D S , 4 T H E D I T I O N
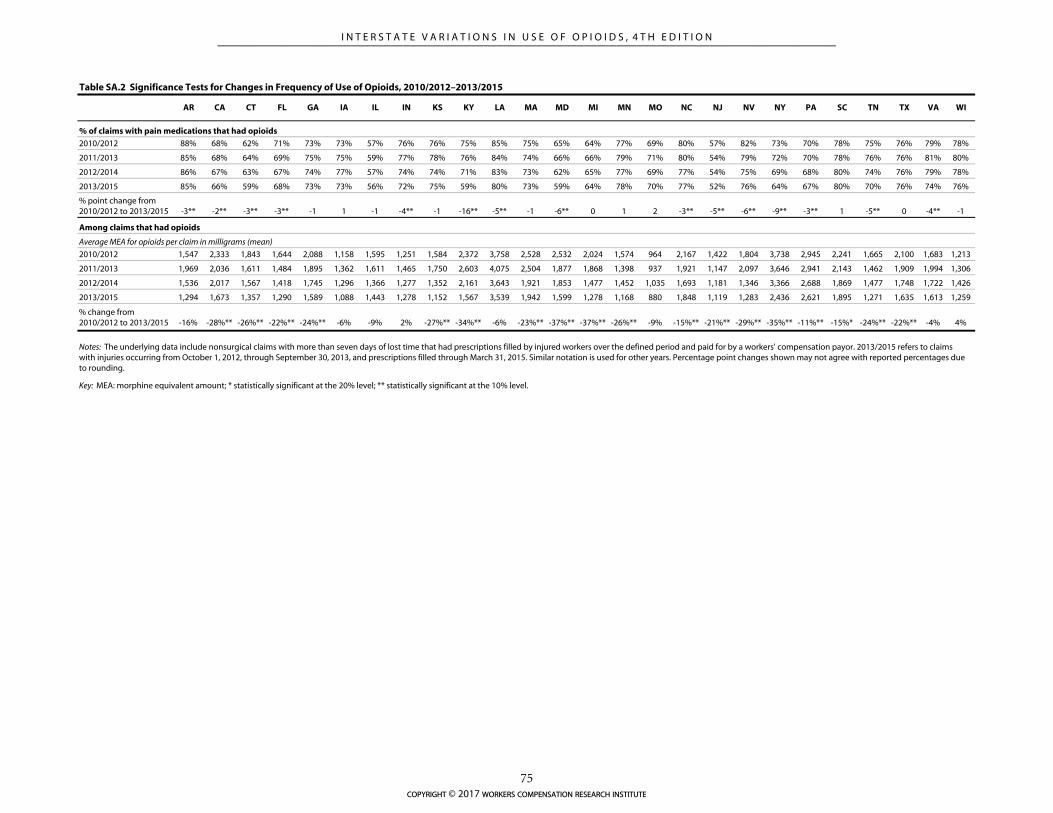
AR CA CT FL GA IA IL IN KS KY LA MA MD MI MN MO NC NJ NV NY PA SC TN TX VA WI
2010/2012 88% 68% 62% 71% 73% 73% 57% 76% 76% 75% 85% 75% 65% 64% 77% 69% 80% 57% 82% 73% 70% 78% 75% 76% 79% 78%
2011/2013 85% 68% 64% 69% 75% 75% 59% 77% 78% 76% 84% 74% 66% 66% 79% 71% 80% 54% 79% 72% 70% 78% 76% 76% 81% 80%
2012/2014 86% 67% 63% 67% 74% 77% 57% 74% 74% 71% 83% 73% 62% 65% 77% 69% 77% 54% 75% 69% 68% 80% 74% 76% 79% 78%
2013/2015 85% 66% 59% 68% 73% 73% 56% 72% 75% 59% 80% 73% 59% 64% 78% 70% 77% 52% 76% 64% 67% 80% 70% 76% 74% 76%
% point change from 2010/2012 to 2013/2015 -3** -2** -3** -3** -1 1 -1 -4** -1 -16** -5** -1 -6** 0 1 2 -3** -5** -6** -9** -3** 1 -5** 0 -4** -1
2010/2012 1,547 2,333 1,843 1,644 2,088 1,158 1,595 1,251 1,584 2,372 3,758 2,528 2,532 2,024 1,574 964 2,167 1,422 1,804 3,738 2,945 2,241 1,665 2,100 1,683 1,213
2011/2013 1,969 2,036 1,611 1,484 1,895 1,362 1,611 1,465 1,750 2,603 4,075 2,504 1,877 1,868 1,398 937 1,921 1,147 2,097 3,646 2,941 2,143 1,462 1,909 1,994 1,306
2012/2014 1,536 2,017 1,567 1,418 1,745 1,296 1,366 1,277 1,352 2,161 3,643 1,921 1,853 1,477 1,452 1,035 1,693 1,181 1,346 3,366 2,688 1,869 1,477 1,748 1,722 1,426
2013/2015 1,294 1,673 1,357 1,290 1,589 1,088 1,443 1,278 1,152 1,567 3,539 1,942 1,599 1,278 1,168 880 1,848 1,119 1,283 2,436 2,621 1,895 1,271 1,635 1,613 1,259
% change from 2010/2012 to 2013/2015 -16% -28%** -26%** -22%** -24%** -6% -9% 2% -27%** -34%** -6% -23%** -37%** -37%** -26%** -9% -15%** -21%** -29%** -35%** -11%** -15%* -24%** -22%** -4% 4%
Key: MEA: morphine equivalent amount; * statistically significant at the 20% level; ** statistically significant at the 10% level.
Table SA.2 Significance Tests for Changes in Frequency of Use of Opioids, 2010/2012–2013/2015
% of claims with pain medications that had opioids
Among claims that had opioids
Average MEA for opioids per claim in milligrams (mean)
Notes: The underlying data include nonsurgical claims with more than seven days of lost time that had prescriptions filled by injured workers over the defined period and paid for by a workers' compensation payor. 2013/2015 refers to claims with injuries occurring from October 1, 2012, through September 30, 2013, and prescriptions filled through March 31, 2015. Similar notation is used for other years. Percentage point changes shown may not agree with reported percentages due to rounding.
copyright © 2017 workers compensation research institute
75
_____________________________________________________________________________________________I N T E R S T A T E V A R I A T I O N S I N U S E O F O P I O I D S , 4 T H E D I T I O N
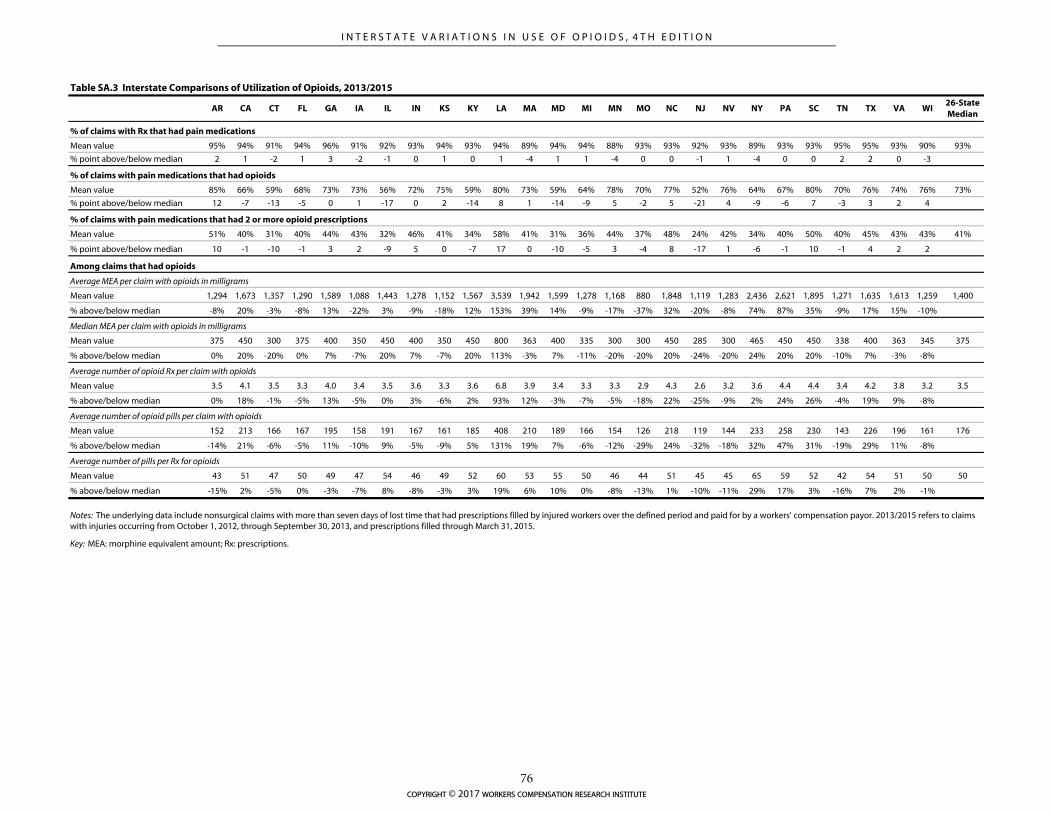
AR CA CT FL GA IA IL IN KS KY LA MA MD MI MN MO NC NJ NV NY PA SC TN TX VA WI26-State Median
% of claims with Rx that had pain medications
Mean value 95% 94% 91% 94% 96% 91% 92% 93% 94% 93% 94% 89% 94% 94% 88% 93% 93% 92% 93% 89% 93% 93% 95% 95% 93% 90% 93%
% point above/below median 2 1 -2 1 3 -2 -1 0 1 0 1 -4 1 1 -4 0 0 -1 1 -4 0 0 2 2 0 -3
% of claims with pain medications that had opioids
Mean value 85% 66% 59% 68% 73% 73% 56% 72% 75% 59% 80% 73% 59% 64% 78% 70% 77% 52% 76% 64% 67% 80% 70% 76% 74% 76% 73%
% point above/below median 12 -7 -13 -5 0 1 -17 0 2 -14 8 1 -14 -9 5 -2 5 -21 4 -9 -6 7 -3 3 2 4
% of claims with pain medications that had 2 or more opioid prescriptions
Mean value 51% 40% 31% 40% 44% 43% 32% 46% 41% 34% 58% 41% 31% 36% 44% 37% 48% 24% 42% 34% 40% 50% 40% 45% 43% 43% 41%
% point above/below median 10 -1 -10 -1 3 2 -9 5 0 -7 17 0 -10 -5 3 -4 8 -17 1 -6 -1 10 -1 4 2 2
Average MEA per claim with opioids in milligrams
Mean value 1,294 1,673 1,357 1,290 1,589 1,088 1,443 1,278 1,152 1,567 3,539 1,942 1,599 1,278 1,168 880 1,848 1,119 1,283 2,436 2,621 1,895 1,271 1,635 1,613 1,259 1,400
% above/below median -8% 20% -3% -8% 13% -22% 3% -9% -18% 12% 153% 39% 14% -9% -17% -37% 32% -20% -8% 74% 87% 35% -9% 17% 15% -10%
Median MEA per claim with opioids in milligrams
Mean value 375 450 300 375 400 350 450 400 350 450 800 363 400 335 300 300 450 285 300 465 450 450 338 400 363 345 375
% above/below median 0% 20% -20% 0% 7% -7% 20% 7% -7% 20% 113% -3% 7% -11% -20% -20% 20% -24% -20% 24% 20% 20% -10% 7% -3% -8%
Average number of opioid Rx per claim with opioids
Mean value 3.5 4.1 3.5 3.3 4.0 3.4 3.5 3.6 3.3 3.6 6.8 3.9 3.4 3.3 3.3 2.9 4.3 2.6 3.2 3.6 4.4 4.4 3.4 4.2 3.8 3.2 3.5
% above/below median 0% 18% -1% -5% 13% -5% 0% 3% -6% 2% 93% 12% -3% -7% -5% -18% 22% -25% -9% 2% 24% 26% -4% 19% 9% -8%
Average number of opioid pills per claim with opioids
Mean value 152 213 166 167 195 158 191 167 161 185 408 210 189 166 154 126 218 119 144 233 258 230 143 226 196 161 176
% above/below median -14% 21% -6% -5% 11% -10% 9% -5% -9% 5% 131% 19% 7% -6% -12% -29% 24% -32% -18% 32% 47% 31% -19% 29% 11% -8%
Average number of pills per Rx for opioids
Mean value 43 51 47 50 49 47 54 46 49 52 60 53 55 50 46 44 51 45 45 65 59 52 42 54 51 50 50
% above/below median -15% 2% -5% 0% -3% -7% 8% -8% -3% 3% 19% 6% 10% 0% -8% -13% 1% -10% -11% 29% 17% 3% -16% 7% 2% -1%
Key: MEA: morphine equivalent amount; Rx: prescriptions.
Notes: The underlying data include nonsurgical claims with more than seven days of lost time that had prescriptions filled by injured workers over the defined period and paid for by a workers' compensation payor. 2013/2015 refers to claims with injuries occurring from October 1, 2012, through September 30, 2013, and prescriptions filled through March 31, 2015.
Table SA.3 Interstate Comparisons of Utilization of Opioids, 2013/2015
Among claims that had opioids
copyright © 2017 workers compensation research institute
76
_____________________________________________________________________________________________I N T E R S T A T E V A R I A T I O N S I N U S E O F O P I O I D S , 4 T H E D I T I O N
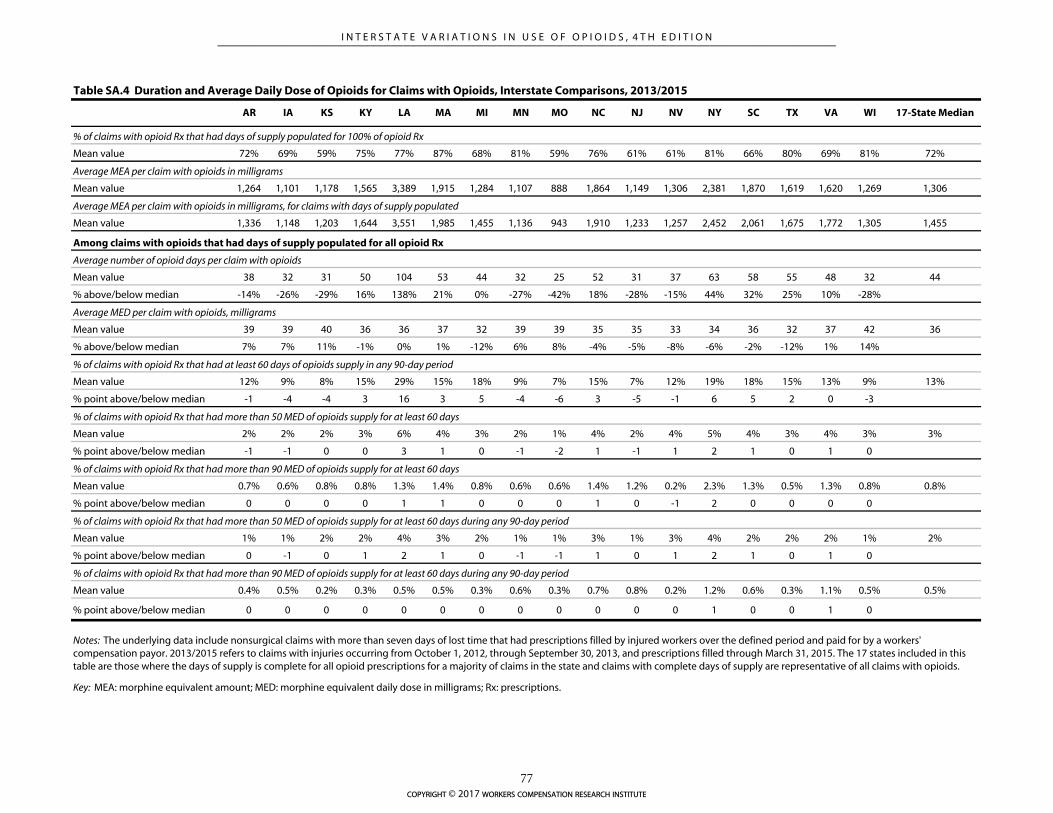
Table SA.4 Duration and Average Daily Dose of Opioids for Claims with Opioids, Interstate Comparisons, 2013/2015
AR IA KS KY LA MA MI MN MO NC NJ NV NY SC TX VA WI 17-State Median
% of claims with opioid Rx that had days of supply populated for 100% of opioid Rx
Mean value 72% 69% 59% 75% 77% 87% 68% 81% 59% 76% 61% 61% 81% 66% 80% 69% 81% 72%
Average MEA per claim with opioids in milligrams
Mean value 1,264 1,101 1,178 1,565 3,389 1,915 1,284 1,107 888 1,864 1,149 1,306 2,381 1,870 1,619 1,620 1,269 1,306
Average MEA per claim with opioids in milligrams, for claims with days of supply populated
Mean value 1,336 1,148 1,203 1,644 3,551 1,985 1,455 1,136 943 1,910 1,233 1,257 2,452 2,061 1,675 1,772 1,305 1,455
Average number of opioid days per claim with opioids
Mean value 38 32 31 50 104 53 44 32 25 52 31 37 63 58 55 48 32 44
% above/below median -14% -26% -29% 16% 138% 21% 0% -27% -42% 18% -28% -15% 44% 32% 25% 10% -28%
Average MED per claim with opioids, milligrams
Mean value 39 39 40 36 36 37 32 39 39 35 35 33 34 36 32 37 42 36
% above/below median 7% 7% 11% -1% 0% 1% -12% 6% 8% -4% -5% -8% -6% -2% -12% 1% 14%
% of claims with opioid Rx that had at least 60 days of opioids supply in any 90-day period
Mean value 12% 9% 8% 15% 29% 15% 18% 9% 7% 15% 7% 12% 19% 18% 15% 13% 9% 13%
% point above/below median -1 -4 -4 3 16 3 5 -4 -6 3 -5 -1 6 5 2 0 -3
% of claims with opioid Rx that had more than 50 MED of opioids supply for at least 60 days
Mean value 2% 2% 2% 3% 6% 4% 3% 2% 1% 4% 2% 4% 5% 4% 3% 4% 3% 3%
% point above/below median -1 -1 0 0 3 1 0 -1 -2 1 -1 1 2 1 0 1 0
% of claims with opioid Rx that had more than 90 MED of opioids supply for at least 60 days
Mean value 0.7% 0.6% 0.8% 0.8% 1.3% 1.4% 0.8% 0.6% 0.6% 1.4% 1.2% 0.2% 2.3% 1.3% 0.5% 1.3% 0.8% 0.8%
% point above/below median 0 0 0 0 1 1 0 0 0 1 0 -1 2 0 0 0 0
% of claims with opioid Rx that had more than 50 MED of opioids supply for at least 60 days during any 90-day period
Mean value 1% 1% 2% 2% 4% 3% 2% 1% 1% 3% 1% 3% 4% 2% 2% 2% 1% 2%
% point above/below median 0 -1 0 1 2 1 0 -1 -1 1 0 1 2 1 0 1 0
% of claims with opioid Rx that had more than 90 MED of opioids supply for at least 60 days during any 90-day period
Mean value 0.4% 0.5% 0.2% 0.3% 0.5% 0.5% 0.3% 0.6% 0.3% 0.7% 0.8% 0.2% 1.2% 0.6% 0.3% 1.1% 0.5% 0.5%
% point above/below median 0 0 0 0 0 0 0 0 0 0 0 0 1 0 0 1 0
Among claims with opioids that had days of supply populated for all opioid Rx
Notes: The underlying data include nonsurgical claims with more than seven days of lost time that had prescriptions filled by injured workers over the defined period and paid for by a workers' compensation payor. 2013/2015 refers to claims with injuries occurring from October 1, 2012, through September 30, 2013, and prescriptions filled through March 31, 2015. The 17 states included in this table are those where the days of supply is complete for all opioid prescriptions for a majority of claims in the state and claims with complete days of supply are representative of all claims with opioids.
Key: MEA: morphine equivalent amount; MED: morphine equivalent daily dose in milligrams; Rx: prescriptions.
copyright © 2017 workers compensation research institute
77
_____________________________________________________________________________________________I N T E R S T A T E V A R I A T I O N S I N U S E O F O P I O I D S , 4 T H E D I T I O N
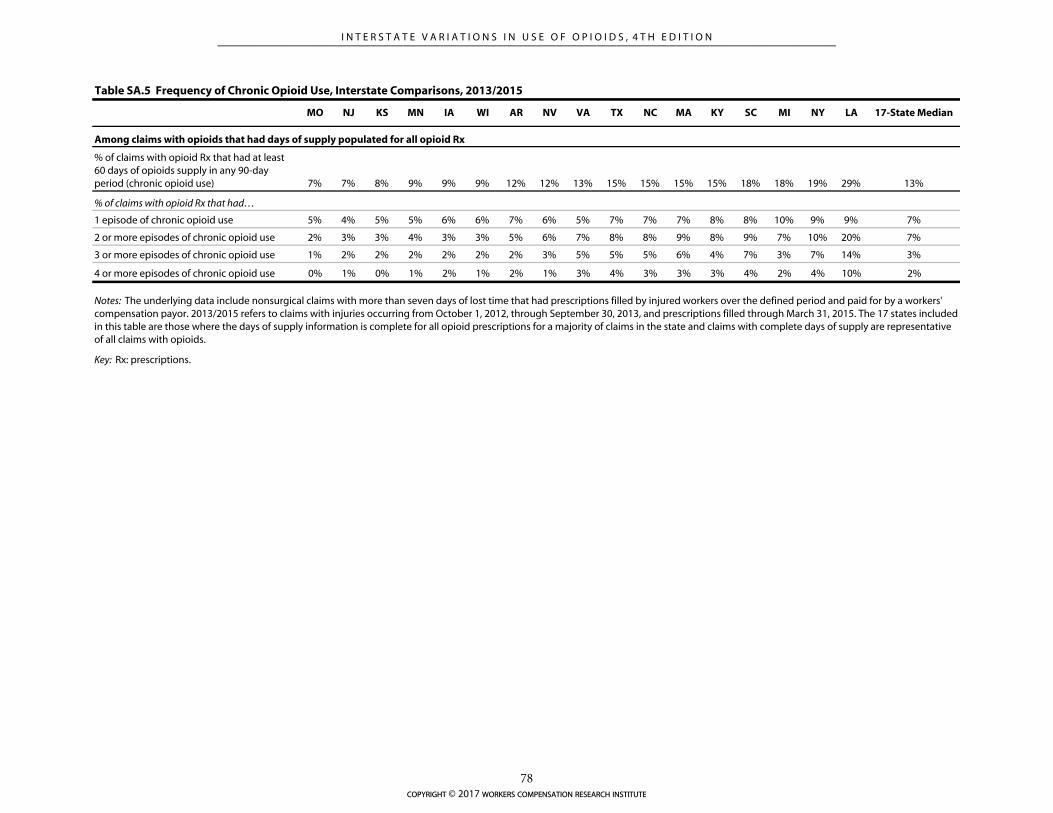
Table SA.5 Frequency of Chronic Opioid Use, Interstate Comparisons, 2013/2015
MO NJ KS MN IA WI AR NV VA TX NC MA KY SC MI NY LA 17-State Median
% of claims with opioid Rx that had at least 60 days of opioids supply in any 90-day period (chronic opioid use) 7% 7% 8% 9% 9% 9% 12% 12% 13% 15% 15% 15% 15% 18% 18% 19% 29% 13%
% of claims with opioid Rx that had…
1 episode of chronic opioid use 5% 4% 5% 5% 6% 6% 7% 6% 5% 7% 7% 7% 8% 8% 10% 9% 9% 7%
2 or more episodes of chronic opioid use 2% 3% 3% 4% 3% 3% 5% 6% 7% 8% 8% 9% 8% 9% 7% 10% 20% 7%
3 or more episodes of chronic opioid use 1% 2% 2% 2% 2% 2% 2% 3% 5% 5% 5% 6% 4% 7% 3% 7% 14% 3%
4 or more episodes of chronic opioid use 0% 1% 0% 1% 2% 1% 2% 1% 3% 4% 3% 3% 3% 4% 2% 4% 10% 2%
Among claims with opioids that had days of supply populated for all opioid Rx
Notes: The underlying data include nonsurgical claims with more than seven days of lost time that had prescriptions filled by injured workers over the defined period and paid for by a workers' compensation payor. 2013/2015 refers to claims with injuries occurring from October 1, 2012, through September 30, 2013, and prescriptions filled through March 31, 2015. The 17 states included in this table are those where the days of supply information is complete for all opioid prescriptions for a majority of claims in the state and claims with complete days of supply are representative of all claims with opioids.
Key: Rx: prescriptions.
copyright © 2017 workers compensation research institute
78
_____________________________________________________________________________________________I N T E R S T A T E V A R I A T I O N S I N U S E O F O P I O I D S , 4 T H E D I T I O N
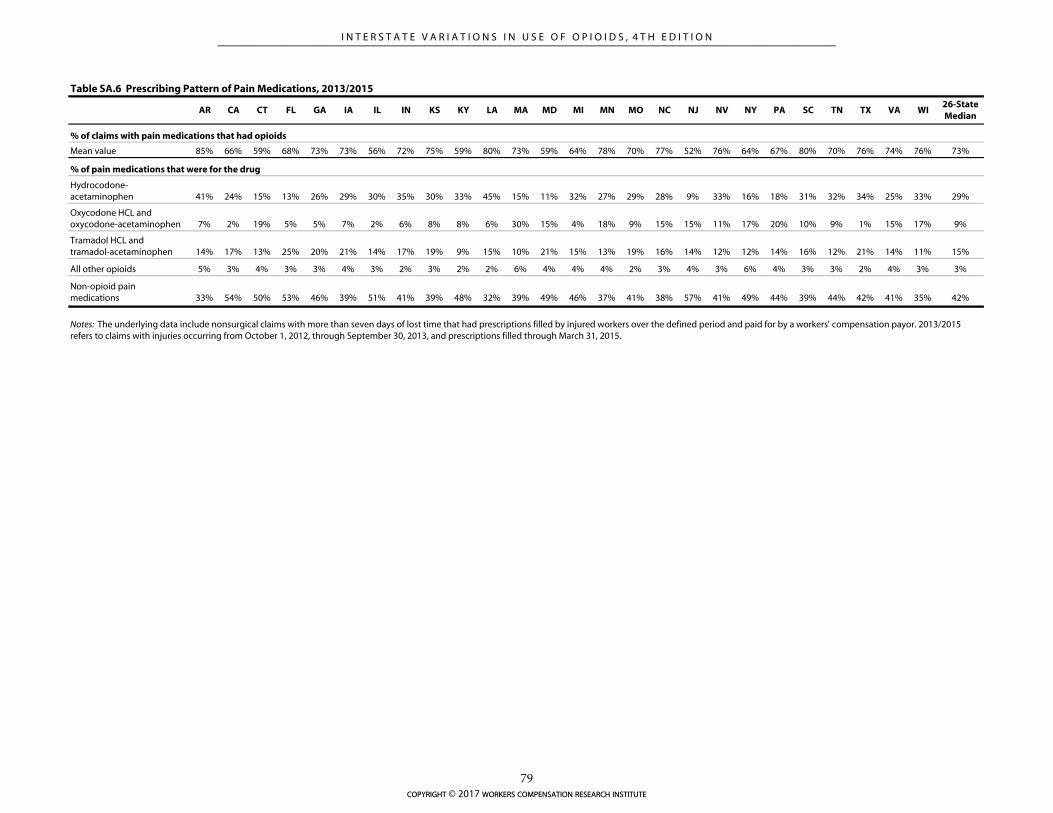
AR CA CT FL GA IA IL IN KS KY LA MA MD MI MN MO NC NJ NV NY PA SC TN TX VA WI26-State Median
% of claims with pain medications that had opioids
Mean value 85% 66% 59% 68% 73% 73% 56% 72% 75% 59% 80% 73% 59% 64% 78% 70% 77% 52% 76% 64% 67% 80% 70% 76% 74% 76% 73%
% of pain medications that were for the drug
Hydrocodone-acetaminophen 41% 24% 15% 13% 26% 29% 30% 35% 30% 33% 45% 15% 11% 32% 27% 29% 28% 9% 33% 16% 18% 31% 32% 34% 25% 33% 29%
Oxycodone HCL and oxycodone-acetaminophen 7% 2% 19% 5% 5% 7% 2% 6% 8% 8% 6% 30% 15% 4% 18% 9% 15% 15% 11% 17% 20% 10% 9% 1% 15% 17% 9%
Tramadol HCL and tramadol-acetaminophen 14% 17% 13% 25% 20% 21% 14% 17% 19% 9% 15% 10% 21% 15% 13% 19% 16% 14% 12% 12% 14% 16% 12% 21% 14% 11% 15%
All other opioids 5% 3% 4% 3% 3% 4% 3% 2% 3% 2% 2% 6% 4% 4% 4% 2% 3% 4% 3% 6% 4% 3% 3% 2% 4% 3% 3%
Non-opioid pain medications 33% 54% 50% 53% 46% 39% 51% 41% 39% 48% 32% 39% 49% 46% 37% 41% 38% 57% 41% 49% 44% 39% 44% 42% 41% 35% 42%
Table SA.6 Prescribing Pattern of Pain Medications, 2013/2015
Notes: The underlying data include nonsurgical claims with more than seven days of lost time that had prescriptions filled by injured workers over the defined period and paid for by a workers' compensation payor. 2013/2015 refers to claims with injuries occurring from October 1, 2012, through September 30, 2013, and prescriptions filled through March 31, 2015.
copyright © 2017 workers compensation research institute
79
_____________________________________________________________________________________________I N T E R S T A T E V A R I A T I O N S I N U S E O F O P I O I D S , 4 T H E D I T I O N
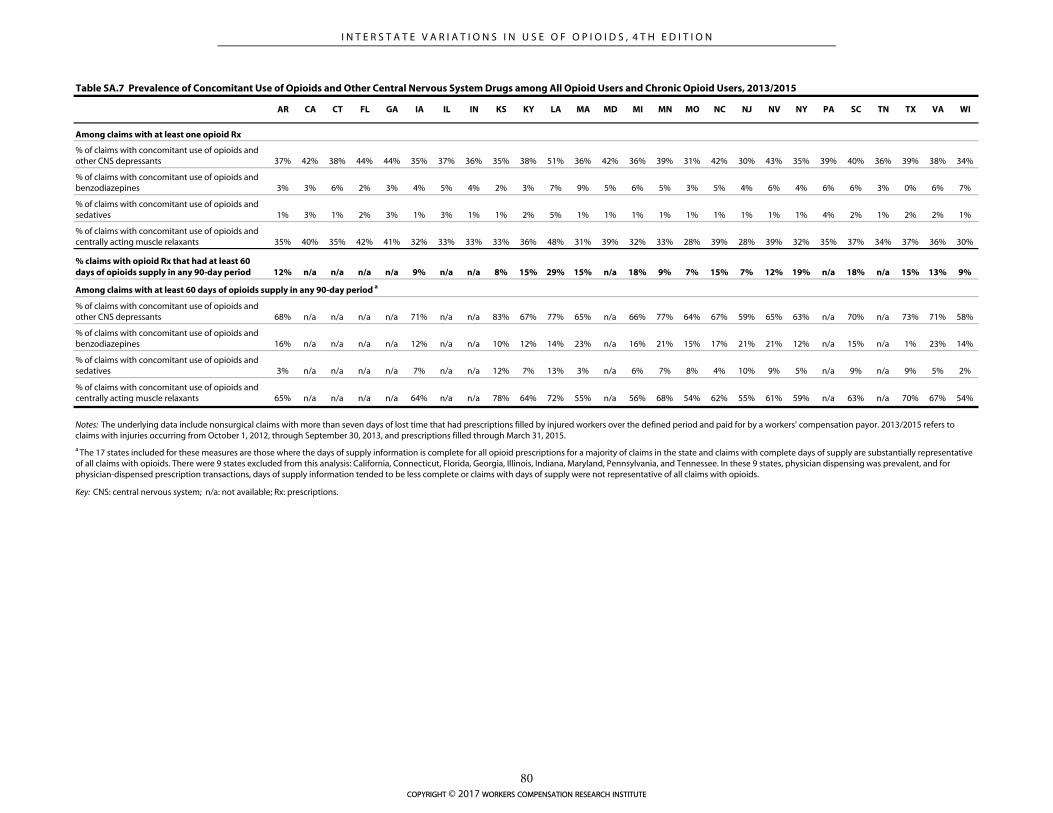
AR CA CT FL GA IA IL IN KS KY LA MA MD MI MN MO NC NJ NV NY PA SC TN TX VA WI
Among claims with at least one opioid Rx
% of claims with concomitant use of opioids and other CNS depressants 37% 42% 38% 44% 44% 35% 37% 36% 35% 38% 51% 36% 42% 36% 39% 31% 42% 30% 43% 35% 39% 40% 36% 39% 38% 34%
% of claims with concomitant use of opioids and benzodiazepines 3% 3% 6% 2% 3% 4% 5% 4% 2% 3% 7% 9% 5% 6% 5% 3% 5% 4% 6% 4% 6% 6% 3% 0% 6% 7%
% of claims with concomitant use of opioids and sedatives 1% 3% 1% 2% 3% 1% 3% 1% 1% 2% 5% 1% 1% 1% 1% 1% 1% 1% 1% 1% 4% 2% 1% 2% 2% 1%
% of claims with concomitant use of opioids and centrally acting muscle relaxants 35% 40% 35% 42% 41% 32% 33% 33% 33% 36% 48% 31% 39% 32% 33% 28% 39% 28% 39% 32% 35% 37% 34% 37% 36% 30%
% claims with opioid Rx that had at least 60 days of opioids supply in any 90-day period 12% n/a n/a n/a n/a 9% n/a n/a 8% 15% 29% 15% n/a 18% 9% 7% 15% 7% 12% 19% n/a 18% n/a 15% 13% 9%
Among claims with at least 60 days of opioids supply in any 90-day period a
% of claims with concomitant use of opioids and other CNS depressants 68% n/a n/a n/a n/a 71% n/a n/a 83% 67% 77% 65% n/a 66% 77% 64% 67% 59% 65% 63% n/a 70% n/a 73% 71% 58%
% of claims with concomitant use of opioids and benzodiazepines 16% n/a n/a n/a n/a 12% n/a n/a 10% 12% 14% 23% n/a 16% 21% 15% 17% 21% 21% 12% n/a 15% n/a 1% 23% 14%
% of claims with concomitant use of opioids and sedatives 3% n/a n/a n/a n/a 7% n/a n/a 12% 7% 13% 3% n/a 6% 7% 8% 4% 10% 9% 5% n/a 9% n/a 9% 5% 2%
% of claims with concomitant use of opioids and centrally acting muscle relaxants 65% n/a n/a n/a n/a 64% n/a n/a 78% 64% 72% 55% n/a 56% 68% 54% 62% 55% 61% 59% n/a 63% n/a 70% 67% 54%
Table SA.7 Prevalence of Concomitant Use of Opioids and Other Central Nervous System Drugs among All Opioid Users and Chronic Opioid Users, 2013/2015
Notes: The underlying data include nonsurgical claims with more than seven days of lost time that had prescriptions filled by injured workers over the defined period and paid for by a workers' compensation payor. 2013/2015 refers to claims with injuries occurring from October 1, 2012, through September 30, 2013, and prescriptions filled through March 31, 2015.
Key: CNS: central nervous system; n/a: not available; Rx: prescriptions.
a The 17 states included for these measures are those where the days of supply information is complete for all opioid prescriptions for a majority of claims in the state and claims with complete days of supply are substantially representative of all claims with opioids. There were 9 states excluded from this analysis: California, Connecticut, Florida, Georgia, Illinois, Indiana, Maryland, Pennsylvania, and Tennessee. In these 9 states, physician dispensing was prevalent, and for physician-dispensed prescription transactions, days of supply information tended to be less complete or claims with days of supply were not representative of all claims with opioids.
copyright © 2017 workers compensation research institute
80
_____________________________________________________________________________________________I N T E R S T A T E V A R I A T I O N S I N U S E O F O P I O I D S , 4 T H E D I T I O N
TECHNICAL APPENDIX A:
A BRIEF SUMMARY OF FACTORS THAT MAY
INFLUENCE THE PRESCRIBING OF OPIOIDS
The reader may want to know what might explain the results we observed in the use of opioids for each state.
In this report, we do not identify and examine the impact of key factors underlying the utilization and
prescribing patterns of opioids. Instead, we provide in this appendix some background information about
several possible factors that may influence prescribing and utilization patterns of opioids, including
information about the legal and regulatory environment for prescribing opioids for some state workers’
compensation health care delivery systems. Our intention is to provide the reader with a policy context that
may help facilitate the interpretation of the patterns observed.
The development of policies regarding controlled substances reflects a legislative and regulatory effort to
strike a balance between providing necessary pain relief and minimizing the risk of abuse and diversion of
opioids. In the past few years, there were numerous legislative and regulatory changes in opioid policies that
were aimed at reducing unnecessary use of opioids. Some of the policy changes were at the federal level,
including up-scheduling certain controlled substances1 and Risk Evaluation and Mitigation Strategies
(REMS) programs. Many changes are at the state level, in and outside workers’ compensation systems. Most
of the policy changes have been focused on changing provider behavior for safe opioid prescribing and
dispensing. Numerous guidelines have also been adopted by different agencies to address not only the
management of chronic opioid use but also opioid prescribing for acute and sub-acute pain. More recently,
an increasing number of states took a comprehensive approach to addressing opioid issues in a coordinated
way, focusing on the prevention and intervention of opioid overdoses. The policy discussion we provide in
this appendix is focused on the prevention of opioid misuse and abuse.
FEDERAL LAWS REGARDING PRESCRIPTIONS OF OPIOIDS
The federal Controlled Substance Act (CSA),2 as Title II of the Comprehensive Drug Abuse Prevention and
Control Act of 1970, established a classification structure by categorizing controlled substances into five
schedules based on their medicinal value and potential for abuse, addiction, and dependency. Controlled
substances in Schedules II through V can be used for medical purposes. Table 2.2 in Chapter 2 provides the
definition of each schedule and examples of specific opioid medications that are classified in each schedule.
Prescribing and dispensing of controlled substances in each of these schedules is regulated under federal law. 1 Examples include the change of hydrocodone-combined drugs from Schedule III to Schedule II and the change of tramadol from unscheduled to Schedule IV. 2 The CSA requires any pharmacy, hospital, physician, manufacturer, or distributor that works with any of the substances listed under the CSA to register with the DEA. The DEA has the authority to regulate transactions and monitor the movement of controlled substances from manufacturer and wholesale distributors to the retail level. The transaction data are available for use in investigations of illegal diversions from manufacturers and wholesalers to retail distributors, such as physicians and pharmacists, who receive unusual quantities of certain drugs. See United States General Accounting Office (2002) and Kraman (2004).
copyright © 2017 workers compensation research institute
81
_____________________________________________________________________________________________I N T E R S T A T E V A R I A T I O N S I N U S E O F O P I O I D S , 4 T H E D I T I O N
For example, refills are prohibited for substances in Schedule II, whereas prescription drugs in Schedules III–
V can be refilled. In 2014, the DEA reclassified two opioids that are among the drugs most frequently
prescribed to injured workers, hydrocodone-acetaminophen and tramadol. Effective October 2014,
hydrocodone-combined products were rescheduled from Schedule III to the more restrictive Schedule II.
Tramadol, which was not previously scheduled, was reclassified to Schedule IV effective August 2014. Jones,
Lurie, and Throckmorton (2016) found that dispensing of prescriptions of hydrocodone-combination
products decreased by 22 percent in the 12 months after the rescheduling compared with the 12 months prior
to rescheduling. Considering the implementation of these federal rule changes toward the end of the study
period, we may observe the full impact of the up-scheduling of these two drugs when we update the analysis
with more recent data.
REMS programs are another key policy tool at the federal level aimed at mitigating the risk of misuse and
abuse of opioid medications while ensuring the accessibility of those drugs to patients who may need them.
REMS programs are developed by drug sponsors, and the FDA reviews and approves these programs. For
example, in April 2011, the FDA announced REMS programs for all long-acting opioids and oral fentanyl
products. The REMS program for transmucosal immediate-release fentanyl (TIRF), consisting of oral
fentanyl products, was approved in December 2011. Under the TIRF REMS Access program, prescribers are
required to have a special certification to continue prescribing oral fentanyl products, which is likely to result
in a reduction of prescriptions for oral fentanyl products, such as Actiq® and Fentora®.3 The REMS program
for long-acting and extended-release opioids (ER/LA REMS) was implemented in July 2012 and includes the
following key components: (1) prescriber training, (2) medication guide and new drug labeling, (3) patient
education, and (4) evaluation of collected program data.4 While prescriber training is on a voluntary basis
and physicians can continue to prescribe long-acting opioids without the additional training, the
implementation of the program may help raise awareness of the potential danger of long-acting opioid
medications and, therefore, reduce the inappropriate use of such drugs as OxyContin® and Kadian®, to some
extent. Some recent studies provided evidence suggesting that some REMS programs were effective in
improving prescribers’ knowledge, attitudes, and self-reported clinical practice in safe opioid prescribing
(Alford et al., 2015; Donovan et al., 2016).
STATE-LEVEL POLICIES AND INITIATIVES AIMED AT REDUCING UNNECESSARY OPIOID
PRESCRIPTIONS
At the state level, the legal and regulatory environment aimed at preventing the abuse and diversion of
opioids includes, but is not limited to, statewide PDMPs, mandatory provider education and physician
licensing, opioid prescribing and pain policies, and state workers’ compensation laws and regulations for
pharmaceuticals.
PDMPs maintain statewide electronic databases of prescriptions dispensed for controlled substances.
Information collected by PDMPs may be used to support access to legitimate medical use of controlled
substances; identify or prevent drug abuse and diversion; facilitate identification of prescription drug-
addicted individuals and enable intervention and treatment; outline drug use and abuse trends to inform
3 Please see FDA (2014), available at http://www.fda.gov/downloads/Drugs/DrugSafety/ PostmarketDrugSafetyInformationforPatientsandProviders/UCM289730.pdf. 4 Please see FDA (2015), available at http://www.accessdata.fda.gov/drugsatfda_docs/rems/ERLA_opioids_2015-10-23_FDA_Blueprint.pdf.
copyright © 2017 workers compensation research institute
82
_____________________________________________________________________________________________I N T E R S T A T E V A R I A T I O N S I N U S E O F O P I O I D S , 4 T H E D I T I O N
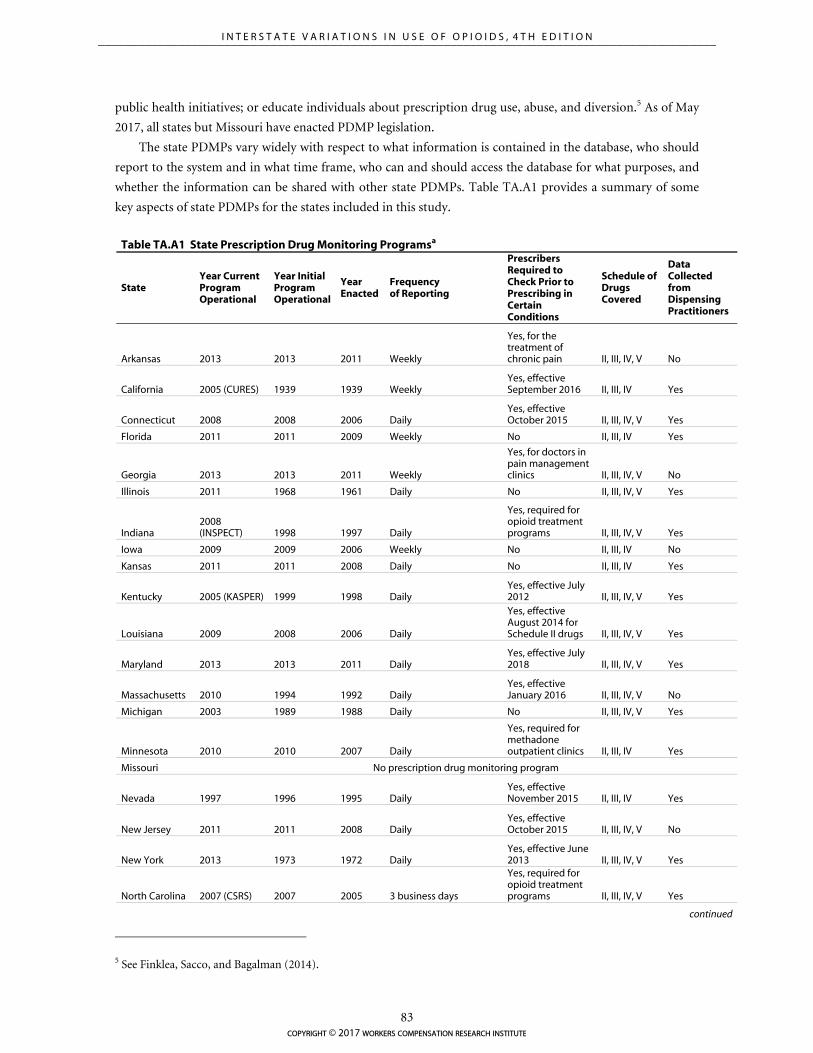
public health initiatives; or educate individuals about prescription drug use, abuse, and diversion.5 As of May
2017, all states but Missouri have enacted PDMP legislation.
The state PDMPs vary widely with respect to what information is contained in the database, who should
report to the system and in what time frame, who can and should access the database for what purposes, and
whether the information can be shared with other state PDMPs. Table TA.A1 provides a summary of some
key aspects of state PDMPs for the states included in this study.
Table TA.A1 State Prescription Drug Monitoring Programsa
State Year Current Program Operational
Year Initial Program Operational
Year Enacted
Frequency of Reporting
Prescribers Required to Check Prior to Prescribing in Certain Conditions
Schedule of Drugs Covered
Data Collected from Dispensing Practitioners
Arkansas 2013 2013 2011 Weekly
Yes, for the treatment of chronic pain II, III, IV, V No
California 2005 (CURES) 1939 1939 Weekly Yes, effective September 2016 II, III, IV Yes
Connecticut 2008 2008 2006 Daily Yes, effective October 2015 II, III, IV, V Yes
Florida 2011 2011 2009 Weekly No II, III, IV Yes
Georgia 2013 2013 2011 Weekly
Yes, for doctors in pain management clinics II, III, IV, V No
Illinois 2011 1968 1961 Daily No II, III, IV, V Yes
Indiana 2008 (INSPECT) 1998 1997 Daily
Yes, required for opioid treatment programs II, III, IV, V Yes
Iowa 2009 2009 2006 Weekly No II, III, IV No
Kansas 2011 2011 2008 Daily No II, III, IV Yes
Kentucky 2005 (KASPER) 1999 1998 Daily Yes, effective July 2012 II, III, IV, V Yes
Louisiana 2009 2008 2006 Daily
Yes, effective August 2014 for Schedule II drugs II, III, IV, V Yes
Maryland 2013 2013 2011 Daily Yes, effective July 2018 II, III, IV, V Yes
Massachusetts 2010 1994 1992 Daily Yes, effective January 2016 II, III, IV, V No
Michigan 2003 1989 1988 Daily No II, III, IV, V Yes
Minnesota 2010 2010 2007 Daily
Yes, required for methadone outpatient clinics II, III, IV Yes
Missouri No prescription drug monitoring program
Nevada 1997 1996 1995 Daily Yes, effective November 2015 II, III, IV Yes
New Jersey 2011 2011 2008 Daily Yes, effective October 2015 II, III, IV, V No
New York 2013 1973 1972 Daily Yes, effective June 2013 II, III, IV, V Yes
North Carolina 2007 (CSRS) 2007 2005 3 business days
Yes, required for opioid treatment programs II, III, IV, V Yes
continued
5 See Finklea, Sacco, and Bagalman (2014).
copyright © 2017 workers compensation research institute
83
_____________________________________________________________________________________________I N T E R S T A T E V A R I A T I O N S I N U S E O F O P I O I D S , 4 T H E D I T I O N
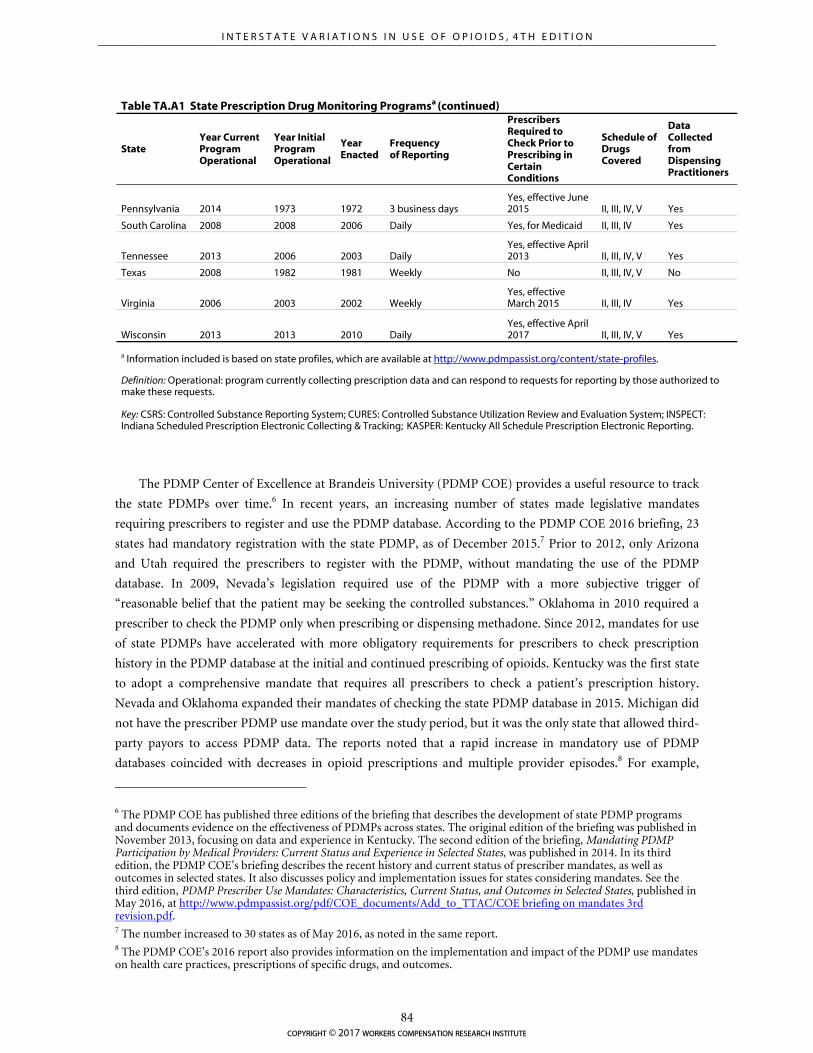
Table TA.A1 State Prescription Drug Monitoring Programsa (continued)
State Year Current Program Operational
Year Initial Program Operational
Year Enacted
Frequency of Reporting
Prescribers Required to Check Prior to Prescribing in Certain Conditions
Schedule of Drugs Covered
Data Collected from Dispensing Practitioners
Pennsylvania 2014 1973 1972 3 business days Yes, effective June 2015 II, III, IV, V Yes
South Carolina 2008 2008 2006 Daily Yes, for Medicaid II, III, IV Yes
Tennessee 2013 2006 2003 Daily Yes, effective April 2013 II, III, IV, V Yes
Texas 2008 1982 1981 Weekly No II, III, IV, V No
Virginia 2006 2003 2002 Weekly Yes, effective March 2015 II, III, IV Yes
Wisconsin 2013 2013 2010 Daily Yes, effective April 2017 II, III, IV, V Yes
a Information included is based on state profiles, which are available at http://www.pdmpassist.org/content/state-profiles.
Definition: Operational: program currently collecting prescription data and can respond to requests for reporting by those authorized to make these requests.
Key: CSRS: Controlled Substance Reporting System; CURES: Controlled Substance Utilization Review and Evaluation System; INSPECT: Indiana Scheduled Prescription Electronic Collecting & Tracking; KASPER: Kentucky All Schedule Prescription Electronic Reporting.
The PDMP Center of Excellence at Brandeis University (PDMP COE) provides a useful resource to track
the state PDMPs over time.6 In recent years, an increasing number of states made legislative mandates
requiring prescribers to register and use the PDMP database. According to the PDMP COE 2016 briefing, 23
states had mandatory registration with the state PDMP, as of December 2015.7 Prior to 2012, only Arizona
and Utah required the prescribers to register with the PDMP, without mandating the use of the PDMP
database. In 2009, Nevada’s legislation required use of the PDMP with a more subjective trigger of
“reasonable belief that the patient may be seeking the controlled substances.” Oklahoma in 2010 required a
prescriber to check the PDMP only when prescribing or dispensing methadone. Since 2012, mandates for use
of state PDMPs have accelerated with more obligatory requirements for prescribers to check prescription
history in the PDMP database at the initial and continued prescribing of opioids. Kentucky was the first state
to adopt a comprehensive mandate that requires all prescribers to check a patient’s prescription history.
Nevada and Oklahoma expanded their mandates of checking the state PDMP database in 2015. Michigan did
not have the prescriber PDMP use mandate over the study period, but it was the only state that allowed third-
party payors to access PDMP data. The reports noted that a rapid increase in mandatory use of PDMP
databases coincided with decreases in opioid prescriptions and multiple provider episodes.8 For example,
6 The PDMP COE has published three editions of the briefing that describes the development of state PDMP programs and documents evidence on the effectiveness of PDMPs across states. The original edition of the briefing was published in November 2013, focusing on data and experience in Kentucky. The second edition of the briefing, Mandating PDMP Participation by Medical Providers: Current Status and Experience in Selected States, was published in 2014. In its third edition, the PDMP COE’s briefing describes the recent history and current status of prescriber mandates, as well as outcomes in selected states. It also discusses policy and implementation issues for states considering mandates. See the third edition, PDMP Prescriber Use Mandates: Characteristics, Current Status, and Outcomes in Selected States, published in May 2016, at http://www.pdmpassist.org/pdf/COE_documents/Add_to_TTAC/COE briefing on mandates 3rd revision.pdf. 7 The number increased to 30 states as of May 2016, as noted in the same report. 8 The PDMP COE’s 2016 report also provides information on the implementation and impact of the PDMP use mandates on health care practices, prescriptions of specific drugs, and outcomes.
copyright © 2017 workers compensation research institute
84
_____________________________________________________________________________________________I N T E R S T A T E V A R I A T I O N S I N U S E O F O P I O I D S , 4 T H E D I T I O N
Kentucky observed an 8.5 percent decline in opioid doses dispensed in the first year after requiring prescriber
enrollment and use of KASPER. New York also observed a 9.5 percent decrease in opioid prescriptions
between the fourth quarters of 2012 and 2013 after implementing the I-STOP legislation in July 2013. A
recently published study by Dowell et al. (2016) also shows positive results of reforms mandating that
prescribers review the state PDMP. The authors observed substantial reductions in the amount of opioids and
opioid overdose deaths in states that simultaneously implemented PDMP prescriber mandates and regulated
pain clinics, compared with states without these reforms.
In a report jointly prepared by PDMP COE and the Pew Charitable Trusts, the researchers describe
evidence-based practices that were shown to increase prescriber utilization of PDMPs.9 The report noted that
prescriber use mandates were one of the important features of PDMPs, associated with a rapid increase in
PDMP utilization. Other practices include allowing delegates to access the PDMP, unsolicited reporting of at-
risk patients, enhanced user interfaces, and integration of PDMPs with health information exchanges, among
others—all features that make it easier for prescribers to utilize the information. The authors reported wide
variations in the status of the adoption of these evidence-based practices and noted wide variations in PDMP
utilization by prescribers of controlled substances across the 49 states with PDMPs.
In this study, we assessed how PDMP enrollment and utilization in 2014 correlated with the changes in
the frequency of opioid use over the study period between 2010/2012 and 2013/2015. We found some
correlations overall based on the 26-state data (Table TA.A2). We found a strong positive correlation between
PDMP utilization and the decrease in frequency of opioid use. PDMP enrollment was also correlated with the
change in frequency of opioid use over the study period to a lesser extent. We also observed positive
correlations between PDMP enrollment and utilization and the decrease in the share of pain medication
prescriptions that were for Schedule II opioids. However, the results we saw only suggest that there might be
an association between increases in PDMP utilization and reductions in opioids prescribed to injured workers
in workers’ compensation systems. More rigorous analysis is needed to evaluate the impact of PDMP policies
on the use of opioids received by injured workers.
9 The information on state regulations mandating the enrollment and use of PDMPs is from the 2016 report published by the Pew Charitable Trusts, Prescription Drug Monitoring Programs: Evidence-Based Practices to Optimize Prescriber Use. The report showed that, as of December 2014, there was substantial variation across states in prescribers’ enrollment and utilization of PDMPs, with several states experiencing increases in PDMP utilization in recent years. See Appendix A of that study.
copyright © 2017 workers compensation research institute
85
_____________________________________________________________________________________________I N T E R S T A T E V A R I A T I O N S I N U S E O F O P I O I D S , 4 T H E D I T I O N
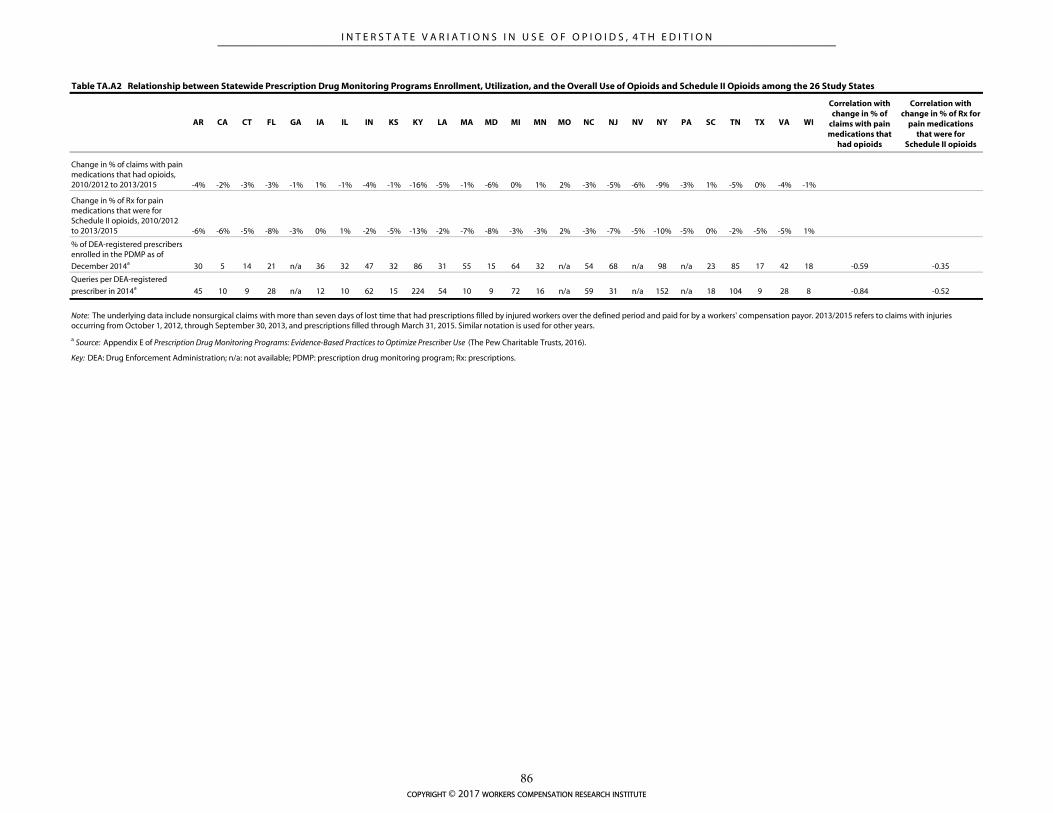
AR CA CT FL GA IA IL IN KS KY LA MA MD MI MN MO NC NJ NV NY PA SC TN TX VA WI
Correlation with change in % of
claims with pain medications that
had opioids
Correlation with change in % of Rx for
pain medications that were for
Schedule II opioids
Change in % of claims with pain medications that had opioids, 2010/2012 to 2013/2015 -4% -2% -3% -3% -1% 1% -1% -4% -1% -16% -5% -1% -6% 0% 1% 2% -3% -5% -6% -9% -3% 1% -5% 0% -4% -1%
Change in % of Rx for pain medications that were for Schedule II opioids, 2010/2012 to 2013/2015 -6% -6% -5% -8% -3% 0% 1% -2% -5% -13% -2% -7% -8% -3% -3% 2% -3% -7% -5% -10% -5% 0% -2% -5% -5% 1%
% of DEA-registered prescribers enrolled in the PDMP as of
December 2014a 30 5 14 21 n/a 36 32 47 32 86 31 55 15 64 32 n/a 54 68 n/a 98 n/a 23 85 17 42 18 -0.59 -0.35
Queries per DEA-registered
prescriber in 2014a 45 10 9 28 n/a 12 10 62 15 224 54 10 9 72 16 n/a 59 31 n/a 152 n/a 18 104 9 28 8 -0.84 -0.52
Key: DEA: Drug Enforcement Administration; n/a: not available; PDMP: prescription drug monitoring program; Rx: prescriptions.
Note: The underlying data include nonsurgical claims with more than seven days of lost time that had prescriptions filled by injured workers over the defined period and paid for by a workers' compensation payor. 2013/2015 refers to claims with injuries occurring from October 1, 2012, through September 30, 2013, and prescriptions filled through March 31, 2015. Similar notation is used for other years.
a Source: Appendix E of Prescription Drug Monitoring Programs: Evidence-Based Practices to Optimize Prescriber Use (The Pew Charitable Trusts, 2016).
Table TA.A2 Relationship between Statewide Prescription Drug Monitoring Programs Enrollment, Utilization, and the Overall Use of Opioids and Schedule II Opioids among the 26 Study States
copyright © 2017 workers compensation research institute
86
_____________________________________________________________________________________________I N T E R S T A T E V A R I A T I O N S I N U S E O F O P I O I D S , 4 T H E D I T I O N
Because of the dynamic nature of opioid policy changes, research that evaluates the impact of PDMPs has
been evolving. Some earlier evidence suggested that PDMPs had a positive impact on reducing “doctor
shopping” (see a review article by Worley, 2012) and slowing down the rapid growth of misuse and abuse (as
reported in Reifler et al., 2012, for example). Other researchers found limited effectiveness of PDMPs partly
due to the diversity of key program features of the state PDMPs as well as certain confounding factors,
including differences in prescribing practices and economic conditions across states (see a review article by
Finklea, Sacco, and Bagalman, 2014).10
However, studies using more recent data are reporting the effectiveness of PDMPs in reducing opioid
utilization as well as opioid overdose deaths. Bao et al. (2016) used National Ambulatory Medical Care survey
data from 2001 to 2010 across 24 states that implemented a PDMP during the study period. They found an
immediate decrease in the rate of prescribing opioids, especially Schedule II opioids, by 30 percent. Patrick et
al. (2016) found that PDMPs resulted in 1.12 fewer opioid overdose deaths per 100,000 people on average in
the year following the implementation of the PDMPs, using data from 1999 to 2013 across 35 states which
adopted a PDMP during the study period. Greater reductions were seen in states monitoring more schedules
of drugs and updating the PDMP at least weekly compared with states that did not have these characteristics.
Mandatory provider education for safe opioid prescribing is among the policy initiatives aimed at
preventing misuse and overuse of opioids. As of July 2014, five states (Kentucky, Massachusetts, New Jersey,
Texas, and Utah) adopted legislation or regulations mandating continuing medical education (CME) on pain
management for licensees.11 More states required CME on opioid prescribing and chronic pain management
as part of the criteria for license renewal. According to the Federation of State Medical Boards board-to-board
review, a number of states adopted CME requirements for opioid prescribing and/or chronic opioid
management, including California, Florida, Kentucky, Maryland, Massachusetts, New Hampshire, New
Mexico, Oklahoma, South Carolina, and Vermont. Several other states also encourage prescriber education
for pain management by providing online courses and resources for responsible opioid prescribing and by
recognizing the credits earned through training.
The authority for regulating medical practices also belongs to the states. State laws govern the prescribing
and dispensing of prescription drugs by licensed health care professionals through delegating the
responsibility of regulating physicians to state medical boards and delegating the responsibility of regulating
pharmacy practices to state boards of pharmacy. For example, Ohio passed legislation requiring its medical
and pharmacy licensing boards to adopt rules mandating use of its PDMP (Clark et al., 2012).
State laws also address the prevention of prescription drug overdose, including setting prescription drug
limits,12 regulating pain clinics,13 limiting physician dispensing of controlled substances, and prohibiting
10 For example, a study by Brady et al. (2014) reported that the implementation of state PDMPs did not show a significant impact on annual morphine milligram equivalents dispensed per capita. However, the data used for that study only captured the state PDMPs up to 2008. Since 2008, several of the 31 states included in that analysis have made significant improvements to their PDMPs. Based on a review of 47 PDMP websites for overdose contents from December 2012 to October 2013, Green et al. (2015) found that most PDMPs did not provide relevant tools and materials to address overdose and related issues. Green et al. recommended a more comprehensive public health orientation for PDMPs that explicitly and publicly articulates their application and role in overdose prevention, which may increase PDMP effectiveness and use. 11 See the Pain & Policy Study Group (PPSG) report entitled Achieving Balance in State Pain Policy: A Progress Report Card (CY 2013). The report is available at http://www.acscan.org/content/wp-content/uploads/2014/07/PRC-2013.pdf. 12 Laws setting prescribing or dispensing limits for controlled substances include quantity and day supply limits. See the CDC guidelines. 13 Laws regarding pain clinic regulation include state oversight of pain management clinics and specific requirements for licensure or ownership of a pain management clinic. See the CDC guidelines.
copyright © 2017 workers compensation research institute
87
_____________________________________________________________________________________________I N T E R S T A T E V A R I A T I O N S I N U S E O F O P I O I D S , 4 T H E D I T I O N
doctor shopping.14 For example, Florida’s 2011 legislation bans physicians from dispensing Schedule II and
III opioids. Kentucky’s 2013 rule change limits physician dispensing of Schedule II and III opioids to 48 hours
of supply. In workers’ compensation jurisdictions, issues with opioid prescribing and dispensing are typically
addressed in reimbursement rules, treatment guidelines, and drug formularies, which are described in the
following section.
There has been an ongoing effort to evaluate state policies related to opioid prescribing and pain
management. The Trust for America’s Health published a report in 2013 that provided ratings on state opioid
policies.15 The ratings were based on the status of opioid polices in individual states capturing opioid policies
in 10 main areas, including existence of state PDMPs, mandatory use of PDMPs, doctor shopping laws,
policies expanding the coverage of substance abuse services (e.g., Medicaid expansion), prescriber education,
good Samaritan laws to provide immunity from criminal charges for individuals seeking help for themselves
or others experiencing an overdose, support of rescue drug use, physician exam requirement, laws requiring
an ID prior to dispensing a controlled substance, and pharmacy lock-in programs. The National Governors
Association also made an effort to evaluate the effectiveness of different opioid policies and provide
recommendations to participating states to address opioid issues in a comprehensive and coordinated way.16
Several state reports also showed positive results of other state opioid policies. For example, Johnson et al.
(2014) reported a 27 percent decrease in opioid overdose death rates in Florida between 2010 and 2012, after
a series of changes regulating the use of opioids in the state during 2010 and 2011. Lyapustina et al. (2015)
reported that Texas’ pill mill law was associated with declines in average morphine equivalent daily dose and
monthly opioid prescriptions. The reductions were more pronounced among prescribers and patients with
higher rates of prescribing and utilization prior to the law.
TREATMENT GUIDELINES FOR PRESCRIBING OPIOIDS AND PAIN MANAGEMENT
A number of treatment guidelines for prescribing opioids and pain management have been developed at the
national and state levels. The widely-accepted national guidelines include the general treatment guidelines by
the American Pain Society and the American Academy of Pain Management, the occupational medical
treatment guidelines by the American College of Occupational and Environmental Medicine (ACOEM), and
the Official Disability Guidelines (ODG). The Federation of State Medical Boards (FSMB) also published the
Model Policy on the Use of Opioid Analgesics in the Treatment of Chronic Pain to provide a resource for use
by state medical boards in educating their licensees about appropriate opioid prescribing and avoiding over-
and under-treatment of patients with pain.17 More recently, the CDC published its guidelines for prescribing
14 All states have a “general” fraud statute that adopts verbatim or with slight alteration the provision in the Uniform Narcotic Drug Act of 1932 or the Uniform Controlled Substances Act of 1970. These statutes prohibit obtaining drugs, including through “doctor shopping,” by any or all of the following means: fraud, deceit, misrepresentation, subterfuge, or concealment of material fact. This resource distinguishes between general statutes and laws categorized as “specific” doctor shopping laws. See the CDC guidelines. 15 See Prescription Drug Abuse: Strategies to Stop the Epidemic (Trust for America’s Health, 2013). 16 See several reports published by NGA (2012, Six Strategies for Reducing Prescription Drug Abuse; 2014, Reducing Prescription Drug Abuse: Lessons Learned from an NGA Policy Academy; 2016, Finding Solutions to the Prescription Opioid and Heroin Crisis: A Road Map for States). 17 The Model Policy was published in 2013, and an updated and expanded edition was published in 2014. See Responsible Opioid Prescribing: A Clinician’s Guide (FSMB, 2014). The 2014 edition includes information from the 2013 model guidelines, which can be used as educational material for the category I CME required for license renewal. The 2013 Model Policy is available at http://www.fsmb.org/Media/Default/PDF/FSMB/Advocacy/pain_policy_july2013.pdf. Note that the model guidelines were being updated in 2016, entitled FSMB Guidelines for the Chronic Use of Opioid Analgesics.
copyright © 2017 workers compensation research institute
88
_____________________________________________________________________________________________I N T E R S T A T E V A R I A T I O N S I N U S E O F O P I O I D S , 4 T H E D I T I O N
opioids for chronic pain.
At the state level, many states, within and outside workers’ compensation systems, either developed
state’s proprietary guidelines or adopted existing guidelines or a modified version to address the state’s
specific needs. In a published report, the International Association of Industrial Accident Boards and
Commissions (IAIABC) tracked the states that adopted treatment guidelines for pain management and
highlighted key issues that should be addressed in chronic opioid treatment guidelines.18 A number of states
we studied, including Connecticut, Louisiana, Massachusetts, Minnesota, and New York, have adopted
separate guidelines for chronic pain and opioid management during the study period. Many of these states
have separate chronic opioid guidelines while addressing opioid prescribing for acute pain in the treatment
guidelines for different parts of the body and/or conditions. Massachusetts had a major update to the Chronic
Pain Treatment Guidelines in 2012, and the guidelines were further updated in May 2016. In Massachusetts,
the regulation requires that the chronic pain treatment guidelines be used in the drug utilization review. The
New York State Workers’ Compensation Board adopted non-acute pain medical treatment guidelines
effective December 2014 in an effort to address issues related to long-term opioid use in the state workers’
compensation system. Connecticut updated its medical treatment protocols in July 2012. In 2016, California
had a major update to the Chronic Pain Medical Treatment Guidelines first published in 2009 and adopted its
first Opioids Treatment Guidelines to address opioid prescribing. Washington State and Colorado, not
included in the study, were the first states that had guidelines for chronic opioid management.19 Some of the
recently updated guidelines in California, Connecticut, and Washington include recommendations about
prescribing opioids for acute and sub-acute pain. In general, they recommend a limited use of opioids for
severe acute pain or use of opioids when non-opioid therapy is ineffective. For example, Washington
guidelines recommend the lowest necessary dose of immediate-release opioids for the shortest duration (less
than two weeks) for acute pain.20 The 2016 CDC guidelines for prescribing opioids for chronic pain also
include recommendations for the duration of opioids for acute pain; the guideline states that three days or
less is often sufficient and more than seven days is rarely needed.
During and after the study period, several workers’ compensation jurisdictions adopted the ODG or
ACOEM guidelines. These guidelines generally discourage the use of opioids initially, except for traumatic
cases or those with severe pain,21 and if opioids are prescribed, prescriptions are usually for two weeks,
according to ACOEM. The 2014 update of the ACOEM guidelines also sets the maximum MED at 50
milligrams and recommends tapering if exceeding 50 MED. The ACOEM guidelines also recommend
checking the PDMP database when prescribing opioids, and similar recommendations can be found in
several other guidelines.22 Note that the 50-milligram maximum MED was based on two large population
18 According to IAIABC’s 2013 report, 20 states developed or adopted opioid treatment guidelines. Among those states, 7 states adopted either ACOEM or ODG and 13 states had state-specific guidelines. The report identified several key issues that should be addressed in state opioid guidelines, including comprehensive coverage of opioid management for acute and chronic pain, monitoring and evaluation of patients with chronic opioid therapy, documentation of improvement for continuing opioid treatment, and discontinuation of chronic opioid therapy in some circumstances. See IAIABC (2013). 19 The Washington State guidelines for prescribing opioids have also been used by the CDC to advise prescribing physicians on the use of opioids for treating pain. We have used these guidelines as a reference in our analysis. 20 See Part II. Prescribing Opioids in the Acute and Subacute Phase of the Washington Agency Medical Directors’ Group Interagency Guideline on Prescribing Opioids for Pain. 21 Opioids are recommended for post-operative pain and for fractures and other conditions likely to result in significant pain. 22 Wang (2017) provides a summary of the guideline recommendations for chronic opioid management in several selected key areas including baseline screening, type of opioids during initial trials, use of the PDMP, maximum daily dose recommendations, and drug testing.
copyright © 2017 workers compensation research institute
89
_____________________________________________________________________________________________I N T E R S T A T E V A R I A T I O N S I N U S E O F O P I O I D S , 4 T H E D I T I O N
studies at Kaiser and the Veterans Administration, and higher limits recommended by other guidelines may
understate the potential harm of high-dose opioid therapy. Outside workers’ compensation, opioid guidelines
have been adopted by the medical boards and the boards of other health care professionals for several states.
In Nevada, for example, the state medical board adopted opioid guidelines by referencing the Model Policy
for the Use of Controlled Substances for the Treatment of Pain while the state workers’ compensation
jurisdiction adopted ACOEM guidelines.
Long-term use of opioids has long been controversial. The Cochrane reviews23 pointed out that the
evidence in support of opioid use for chronic non-cancer pain is weak or questionable.24 Numerous
guidelines have been developed, within and outside workers’ compensation, to assure appropriate use and
management of chronic opioid therapy. They all advise similar approaches. Patients should be carefully
screened for signs of aberrant drug behavior and other risk factors such as comorbid psychiatric conditions.
Chronic opioid management should only be offered after other therapies have failed and the patient has
moderately severe pain from a defined physical condition.
The impact of medical treatment guidelines on opioid use has been examined with some mixed results
(see Haegerich et al., 2014, for a systematic review). Several studies examined the impact of Washington’s
opioid dosing guideline and found a decrease in opioid use after its implementation. For example, Garg et al.
(2013) reported a 53 percent decrease in chronic opioid users between the first quarter of 2004 and the fourth
quarter of 2010, after the implementation of the state opioid dosing guidelines on safe prescribing for chronic
non-cancer pain. The authors also reported that these chronic opioid users were 35 percent less likely to
receive a dosage greater than a 120-milligram morphine equivalent daily dose in the post-guideline period
compared with the pre-guideline period. Similar findings were reported in Franklin et al. (2012).
STATE WORKERS’ COMPENSATION DRUG FORMULARIES AND OTHER RELEVANT LAWS AND
REGULATIONS
Workers’ compensation laws and regulations that are likely to influence prescribing behavior and impact the
use of opioids include, but are not limited to, pharmacy fee schedules, physician dispensing restrictions,
pharmacy formularies, provider choice laws, preauthorization requirements, and drug utilization review. We
provide a few examples to illustrate approaches that workers’ compensation communities use to deal with
issues related to opioid utilization.
The Texas Division of Workers’ Compensation adopted a closed pharmacy formulary, which is based on
ODG. The formulary went into effect on September 1, 2011, for new claims with dates of injury on or after
that date, and became effective on September 1, 2013, for legacy claims with dates of injury before September
1, 2011. According to a recent study by the Texas Department of Insurance (TDI), fewer opioids and other
not-recommended drugs are being prescribed after the reform (TDI, Texas Workers’ Compensation Research
23 Cochrane Reviews provide systematic reviews of primary research in evidence-based health care and health policy. Published online in The Cochrane Library, Cochrane Reviews investigate the effect of interventions for prevention, treatment, and rehabilitation. They also assess the accuracy of a diagnostic test for a given condition in a specific patient group and setting. See more details at http://www.cochrane.org/evidence. 24 According to a Cochrane study, there is only weak evidence suggesting that patients on long-term opioid therapy experience clinically significant pain relief. However, multiple side effects are common, causing many patients to discontinue use. It is unclear whether this type of therapy functionally benefits most patients. See Noble et al. (2010). Most studies show that only around 50 percent of patients tolerate the side effects of opioids and related medications well and benefit from opioid therapy for pain relief. Depending on the diagnoses and other agents available for treatment, the incremental benefit of chronic opioid use can be small (Cepeda et al., 2007; Laudau et al., 2007; and Noble et al., 2010).
copyright © 2017 workers compensation research institute
90
_____________________________________________________________________________________________I N T E R S T A T E V A R I A T I O N S I N U S E O F O P I O I D S , 4 T H E D I T I O N
and Evaluation Group, 2013).
In the workers’ compensation system, two single payor states, Washington and Ohio, also mandated
drug formularies.25,26 California recently passed a law that requires the adoption of a drug formulary by July
2017. In January 2016, Tennessee adopted comprehensive workers’ compensation medical treatment
guidelines, and a drug formulary was adopted at the same time. Based on the experience of several states with
drug formularies (Ohio, Texas, and Washington), evidence-based formularies are expected to have a
significant impact on use of opioids.
Earlier in November 2012, Tennessee’s legislature passed Senate Bill 3315, which amended the definition
of utilization review to explicitly include Schedule II, III, and IV drugs being used for pain management. The
provision requires the parties involved to participate in utilization review if opioids are prescribed for pain
management to an injured or disabled employee for a period of time exceeding 90 days from the initial
prescription. Effective October 1, 2013, a new Tennessee legislation requires that a prescription for opioids or
benzodiazepines may not be dispensed in quantities greater than a 30-day supply. The new law also
encourages mandatory urine drug testing of patients on long-term drug therapy.
Effective December 26, 2014, the amended rules by Michigan’s Workers’ Compensation Agency require
that opioid treatment beyond 90 days for non-cancer related chronic pain should not be reimbursed unless
detailed physician reporting requirements and other processes are met. The new rules also provide incentives
for compliance with the requirement—a provider may bill for the additional services required for reporting
beyond 90 days and for accessing the state PDMP (a.k.a., MAPS) or other PDMPs in the treating
jurisdiction.27
Several states, including California, Connecticut, Louisiana, Massachusetts, Minnesota, New York, and
Oklahoma, have adopted or updated treatment guidelines for chronic opioid pain management, specifically
requiring treating physicians to screen their patients prior to conducting chronic opioid therapy, conduct
random drug screening and testing, and refer the patient to specialists for pain management and
psychological/psychiatric consultation.
Several states changed reimbursement rules to limit physician dispensing of opioid prescriptions. For
example, reimbursement for physician-dispensed opioids is limited to 15 days of supply for nonsurgical cases
and 30 days for surgical cases in Pennsylvania. In North Carolina, reimbursement for Schedule II and III
opioids is limited to an initial 5 days of supply when dispensed by outpatient providers other than a licensed
pharmacist. In Tennessee, physician dispensing of opioids is not permitted, with the exception of a 72-hour
maximum dose supply of a Schedule IV or V controlled substance at no charge.
Across the states studied, we also see a whole spectrum of policies regarding provider choice, which is
expected to have an impact on overall medical care and opioid use.28 Many states allow injured workers to
choose their providers with or without limitation, which include, among the states studied, Illinois,
Louisiana, and Maryland (with strictly employee choice) and California, Georgia, New York, and
Pennsylvania (with limited employee choice of providers). It is worth noting that two of the three states with
strictly employee choice were among the lowest on the frequency of use of opioids.
25 See the Washington drug formulary (http://www.lni.wa.gov/ClaimsIns/Files/Providers/DrugFormulary.pdf). 26 See the Ohio drug formulary (https://www.bwc.ohio.gov/downloads/blankpdf/OAC4123-6-21.3Appendix.pdf). 27 For more details, please refer to the amended rules, which are available at http://www.michigan.gov/documents/lara/2014-029_LR_Final_Health_Care_Services_476952_7.pdf. 28 See WCRI and IAIABC (2016).
copyright © 2017 workers compensation research institute
91
_____________________________________________________________________________________________I N T E R S T A T E V A R I A T I O N S I N U S E O F O P I O I D S , 4 T H E D I T I O N
MEDICAL PRACTICE AND HEALTH CARE DELIVERY SYSTEM
Geographic differences in medical practice and health care delivery systems may also play an important role
in shaping interstate variations in opioid use. Multiple studies reported that higher concentrations of active
physicians and surgeons in a region are strongly correlated with the amount of opioids prescribed (Curtis et
al., 2006a; Han et al., 2012; McDonald et al., 2012). Some states or regions may also have a higher
concentration of pain clinics and doctors who specialize in pain treatment than others. In states where
patients have easier access to clinics specializing in the treatment of pain, the prescribing patterns may differ
from states where there are few pain clinics. For example, some occupational medicine clinics are affiliated
with academic medical centers that also have pain clinics. This arrangement facilitates referrals of patients to
providers who specialize in pain treatment. If pain specialists prescribed opioids more frequently on a longer-
term basis compared with non-specialists, this could increase the use of opioids in these states.
In states where more workers’ compensation medical care is provided by hospital-affiliated clinics, the
prescribing patterns may be influenced indirectly by certain requirements of the Joint Commission on
Accreditation of Healthcare Organizations,29 which regulates hospital accreditation. Doctors who practice in
hospital-based or hospital-affiliated programs may be more likely influenced by these requirements, as
compared with doctors who are in private practice or those who work for commercial occupational medicine
networks. It is worth noting that a higher level of involvement with chiropractic care may also contribute to a
lower rate of opioid use in some states at the aggregate level because chiropractors cannot prescribe
medications.
Opioid prescribing patterns may also be influenced by programs implemented by Medicaid and group
health insurers, especially when the same doctors are treating patients with different types of insurance. For
example, Blue Cross Blue Shield, the largest group health insurer in Massachusetts, implemented a program
aimed at reducing the risk of opioid addiction in 2012.30 While this policy change influenced the prescribing
behaviors of the doctors who treated the patients covered by the group health policy, the same doctors may
also have changed their prescribing practice when treating workers’ compensation patients. In recent years,
Medicaid programs also implemented various opioid harm reduction strategies, which may have had a spill-
over effect on the opioids prescribed to injured workers. As of fiscal year 2015, Medicaid fee-for-service
programs in a majority of states implemented various opioid management strategies, including quality limits,
prior authorization requirements, etc. Twelve states required prescribers to check PDMPs before prescribing
opioids.31 Since these state-level and local policies tend to be different in different states, the extent of the
impact on opioid prescriptions may vary across states.
Pharmacy benefit managers (PBMs) also offer a greater number of services to help payors manage the
utilization of pharmaceuticals, especially opioids, which may also impact the use of opioids. It is worth noting
29 The Joint Commission is an independent not-for-profit organization that accredits and certifies more than 20,000 health care organizations and programs in the United States. More information can be found at www.jointcommission.org. 30 Under the Blue Cross Blue Shield (BCBS) program, first prescriptions of short-acting opioids are limited to a 15-day supply and prescriptions written for longer than a 30-day supply must be accompanied by a medical authorization before coverage is approved. Preauthorization is also required before prescribing long-acting opioids for the first time. See http://www.bluecrossma.com/bluelinks-for-employers/whats-new/special-announcements/opioid-management.html. Since the inception of the program in 2012, BCBS found an 18 percent decline in opioid doses prescribed and a 50 percent reduction in the prescriptions for long-acting opioids such as OxyContin®. Similar programs were implemented by BCBS of Michigan and BCBS of Tennessee. 31 See Table 19 in the Kaiser Family Foundation/National Association of Medicaid Directors report Implementing Coverage and Payment Initiatives Results from a 50-State Medicaid Budget Survey for State Fiscal Years 2016 and 2017 (2016).
copyright © 2017 workers compensation research institute
92
_____________________________________________________________________________________________I N T E R S T A T E V A R I A T I O N S I N U S E O F O P I O I D S , 4 T H E D I T I O N
that workers’ compensation fee schedules for other medical services may also have an indirect impact on the
use of opioids. For example, a low fee schedule rate for surgery might incentivize physicians to treat marginal
cases with opioid therapy instead of surgery.
PHARMACEUTICAL MARKET TRENDS
Several changes affecting the availability of opioids commonly used by workers’ compensation claimants have
occurred in recent years—such as the introduction of safer tamper-resistant formulations of opioids, generic
availability of commonly-used opioids, and product recalls.
During the last five years, several tamper-resistant formulations of opioids, like controlled-release
oxycodone (OxyContin®), immediate-release oxycodone hydrochloride (Oxecta®), and extended-release
oxymorphone (Opana® ER), were released. Physicians may feel more comfortable prescribing these safer
formulations, which may increase their use relative to opioids for which tamper-resistant formulations are
not currently available. Several other tamper-resistant formulations of commonly-used opioids are currently
in the pipeline. Propoxyphene, a commonly-used opioid, was withdrawn from the market in November 2010.
copyright © 2017 workers compensation research institute
93
_____________________________________________________________________________________________I N T E R S T A T E V A R I A T I O N S I N U S E O F O P I O I D S , 4 T H E D I T I O N
TECHNICAL APPENDIX B:
SENSITIVITY ANALYSIS
In this appendix, we discuss several issues that might impact the results of the interstate comparisons. We
focus on three main issues: (1) the difference in injury severity and case mix across states and how it may be
potentially affected by the selection of nonsurgical cases with seven days of lost time that received opioids, (2)
the difference in the proportion of outlier cases and heavy users of opioids across states and its impact on
overall utilization of opioids, and (3) the impact of different claim maturities on the interstate comparisons of
the utilization of opioids. Based on our analysis, we concluded that these potential issues are unlikely to be
significant enough to change how the states were characterized in terms of higher, lower, or typical in the use
of opioids.
INJURY SEVERITY, CASE MIX, AND SELECTION OF NONSURGICAL CASES WITH OPIOIDS
In this study, we examined the utilization of opioids based on nonsurgical cases with more than seven days of
lost time that received opioids. This subset of cases was selected based on three variables that are reflective of
the differences across the states in terms of claim types and how medical services were provided. Here, we
discuss potential endogenous issues related to these three variables and the results of our sensitivity analysis.
First, we chose to focus on the selection of claims with more than seven days of lost time for this study.
Since the percentage of claims that had more than seven days of lost time varied across the states, one may be
concerned that the injury severity and case mix of the subset of data with more than seven days of lost time
could be very different across the states. Conceivably, a state with a lower percentage of claims with more than
seven days of lost time may have proportionally more severe claims than another state where the percentage
was higher. If this were the case, the selection would make interstate comparisons less meaningful. However,
previous WCRI studies concluded that differences across states in injury severity and case mix among claims
with more than seven days of lost time were not large enough to materially affect the comparative results.1 We
also looked at the use of opioids to see how it was correlated with the percentage of claims with more than
seven days of lost time and did not find strong evidence suggesting that it should be a concern (Figure
TA.B1).
1 For example, a WCRI study based on survey data of worker outcomes reported that the injury severity for injured workers with more than seven days of lost time was similar among the 11 states surveyed (Savych and Thumula, 2016). The WCRI CompScope™ multistate benchmarks adjusted for differences in the mix of cases and other factors across the states and assessed the impact of the case-mix adjustment (Dolinschi and Rothkin, 2016). That study found that the difference in the mix of cases across states had only a small impact on the results—not large enough to change how the states were characterized as higher, lower, or typical.
copyright © 2017 workers compensation research institute
94
_____________________________________________________________________________________________I N T E R S T A T E V A R I A T I O N S I N U S E O F O P I O I D S , 4 T H E D I T I O N
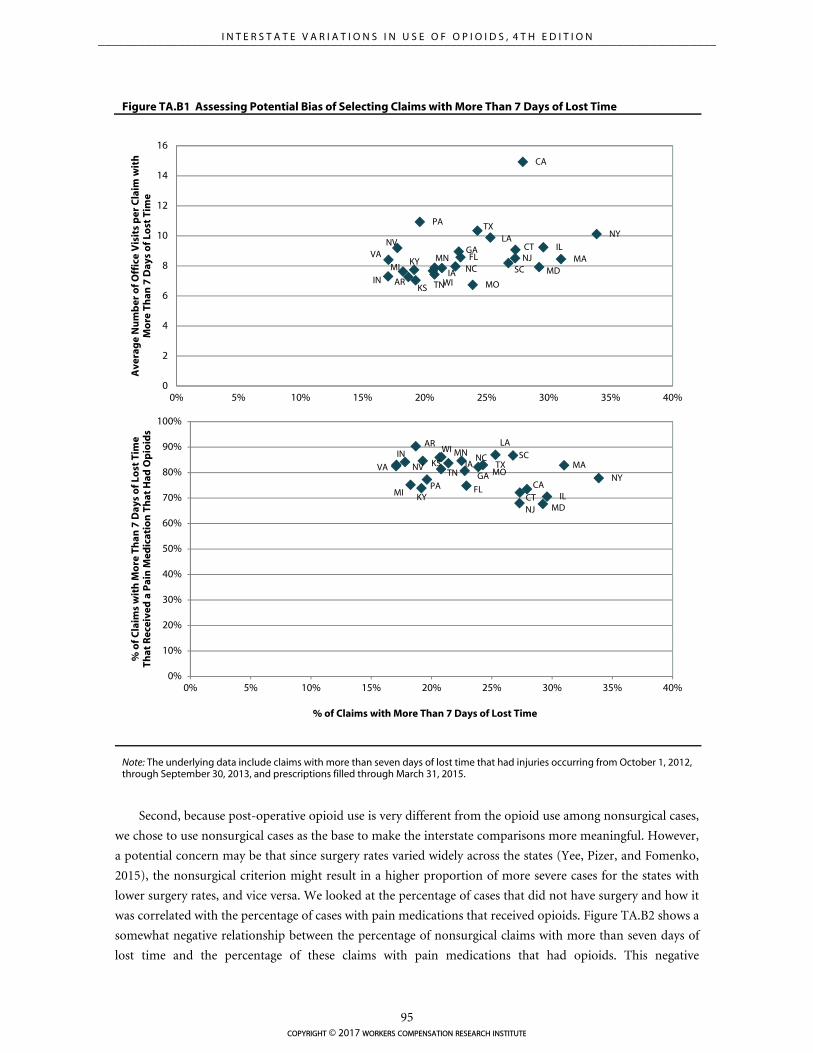
AR
CA
CTFL
GA
IA
IL
INKS
KY
LA
MAMDMI
MN
MO
NCNJ
NVNY
PA
SC
TN
TX
VA
WI
0
2
4
6
8
10
12
14
16
0% 5% 10% 15% 20% 25% 30% 35% 40%
Ave
rag
e N
um
ber
of O
ffic
e V
isit
s p
er C
laim
wit
h
Mo
re T
han
7 D
ays
of
Lost
Tim
e
% of Claims with More Than 7 Days of Lost Time
AR
CA
CTFL
GAIA
IL
INKS
KY
LA
MA
MD
MI
MN
MO
NC
NJ
NVNY
PA
SC
TNTXVA
WI
0%
10%
20%
30%
40%
50%
60%
70%
80%
90%
100%
0% 5% 10% 15% 20% 25% 30% 35% 40%
% o
f C
laim
s w
ith
Mo
re T
han
7 D
ays
of L
ost
Tim
e Th
at R
ecei
ved
a P
ain
Med
icat
ion
Th
at H
ad O
pio
ids
% of Claims with More Than 7 Days of Lost Time
Figure TA.B1 Assessing Potential Bias of Selecting Claims with More Than 7 Days of Lost Time
Note: The underlying data include claims with more than seven days of lost time that had injuries occurring from October 1, 2012, through September 30, 2013, and prescriptions filled through March 31, 2015.
Second, because post-operative opioid use is very different from the opioid use among nonsurgical cases,
we chose to use nonsurgical cases as the base to make the interstate comparisons more meaningful. However,
a potential concern may be that since surgery rates varied widely across the states (Yee, Pizer, and Fomenko,
2015), the nonsurgical criterion might result in a higher proportion of more severe cases for the states with
lower surgery rates, and vice versa. We looked at the percentage of cases that did not have surgery and how it
was correlated with the percentage of cases with pain medications that received opioids. Figure TA.B2 shows a
somewhat negative relationship between the percentage of nonsurgical claims with more than seven days of
lost time and the percentage of these claims with pain medications that had opioids. This negative
copyright © 2017 workers compensation research institute
95
_____________________________________________________________________________________________I N T E R S T A T E V A R I A T I O N S I N U S E O F O P I O I D S , 4 T H E D I T I O N
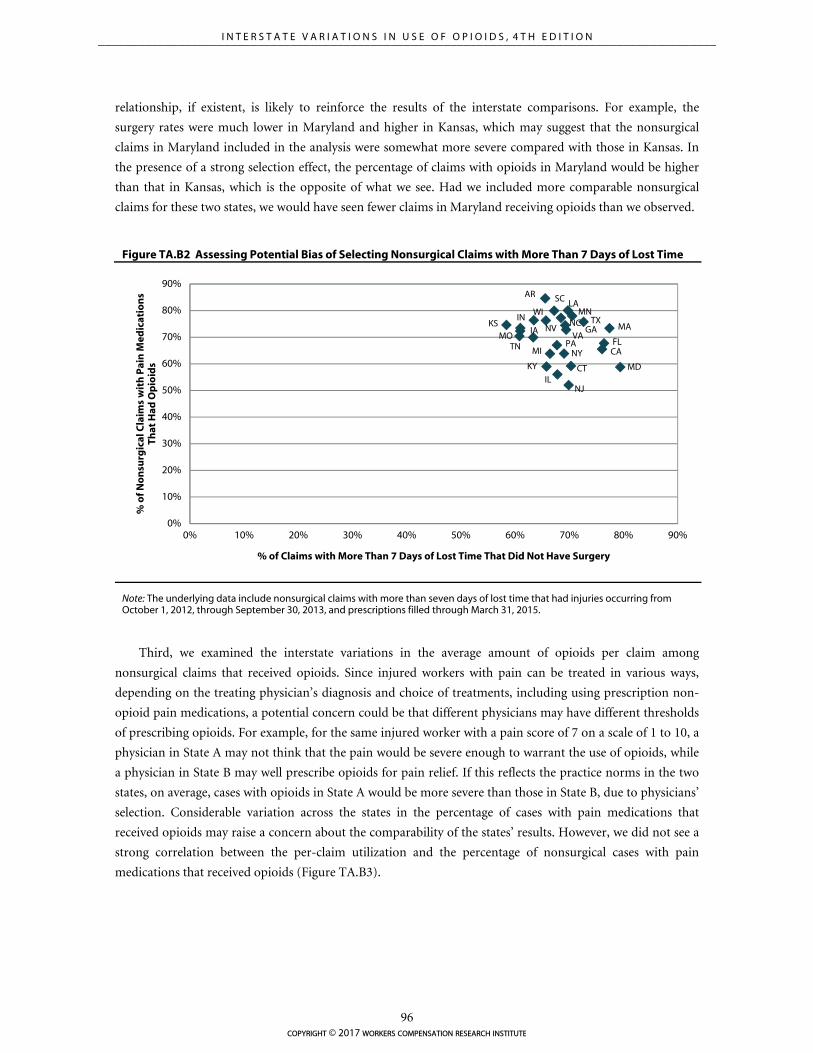
AR
CA
CT
FLGAIA
IL
INKS
KY
LA
MA
MD
MI
MN
MO
NC
NJ
NV
NYPA
SC
TN
TX
VA
WI
0%
10%
20%
30%
40%
50%
60%
70%
80%
90%
0% 10% 20% 30% 40% 50% 60% 70% 80% 90%
% o
f No
nsu
rgic
al C
laim
s w
ith
Pai
n M
edic
atio
ns
That
Had
Op
ioid
s
% of Claims with More Than 7 Days of Lost Time That Did Not Have Surgery
relationship, if existent, is likely to reinforce the results of the interstate comparisons. For example, the
surgery rates were much lower in Maryland and higher in Kansas, which may suggest that the nonsurgical
claims in Maryland included in the analysis were somewhat more severe compared with those in Kansas. In
the presence of a strong selection effect, the percentage of claims with opioids in Maryland would be higher
than that in Kansas, which is the opposite of what we see. Had we included more comparable nonsurgical
claims for these two states, we would have seen fewer claims in Maryland receiving opioids than we observed.
Figure TA.B2 Assessing Potential Bias of Selecting Nonsurgical Claims with More Than 7 Days of Lost Time
Note: The underlying data include nonsurgical claims with more than seven days of lost time that had injuries occurring from October 1, 2012, through September 30, 2013, and prescriptions filled through March 31, 2015.
Third, we examined the interstate variations in the average amount of opioids per claim among
nonsurgical claims that received opioids. Since injured workers with pain can be treated in various ways,
depending on the treating physician’s diagnosis and choice of treatments, including using prescription non-
opioid pain medications, a potential concern could be that different physicians may have different thresholds
of prescribing opioids. For example, for the same injured worker with a pain score of 7 on a scale of 1 to 10, a
physician in State A may not think that the pain would be severe enough to warrant the use of opioids, while
a physician in State B may well prescribe opioids for pain relief. If this reflects the practice norms in the two
states, on average, cases with opioids in State A would be more severe than those in State B, due to physicians’
selection. Considerable variation across the states in the percentage of cases with pain medications that
received opioids may raise a concern about the comparability of the states’ results. However, we did not see a
strong correlation between the per-claim utilization and the percentage of nonsurgical cases with pain
medications that received opioids (Figure TA.B3).
copyright © 2017 workers compensation research institute
96
_____________________________________________________________________________________________I N T E R S T A T E V A R I A T I O N S I N U S E O F O P I O I D S , 4 T H E D I T I O N
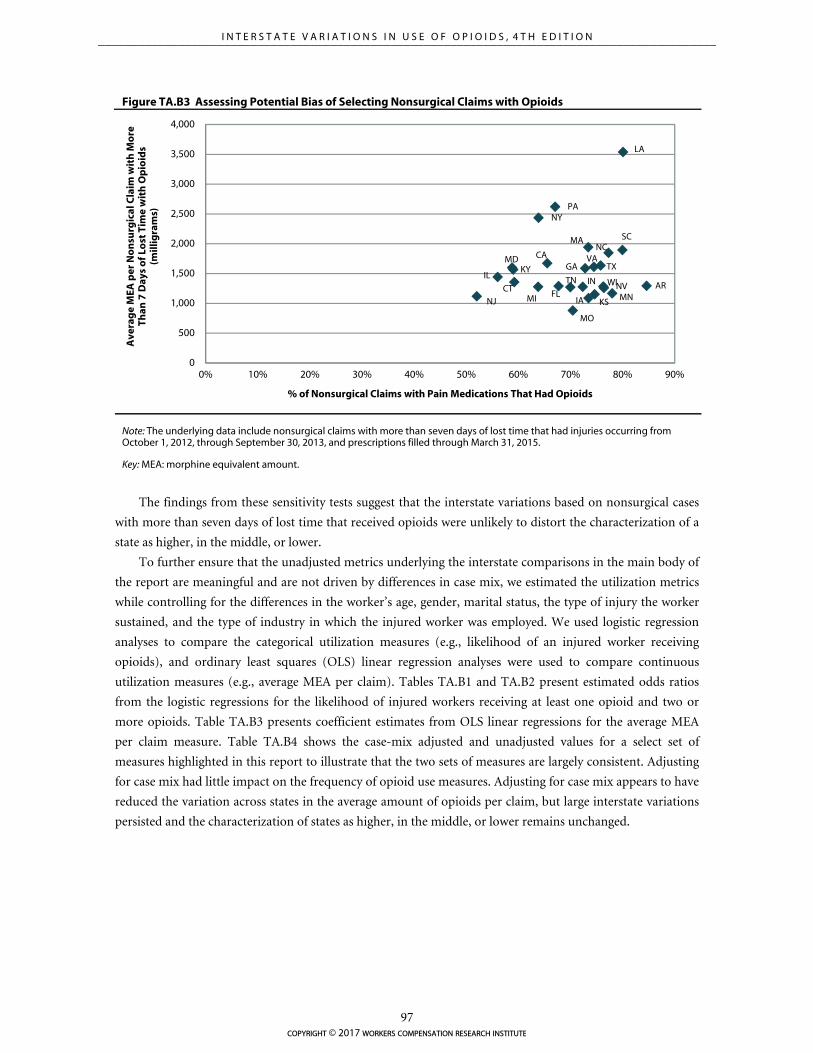
Figure TA.B3 Assessing Potential Bias of Selecting Nonsurgical Claims with Opioids
Note: The underlying data include nonsurgical claims with more than seven days of lost time that had injuries occurring from October 1, 2012, through September 30, 2013, and prescriptions filled through March 31, 2015.
Key: MEA: morphine equivalent amount.
The findings from these sensitivity tests suggest that the interstate variations based on nonsurgical cases
with more than seven days of lost time that received opioids were unlikely to distort the characterization of a
state as higher, in the middle, or lower.
To further ensure that the unadjusted metrics underlying the interstate comparisons in the main body of
the report are meaningful and are not driven by differences in case mix, we estimated the utilization metrics
while controlling for the differences in the worker’s age, gender, marital status, the type of injury the worker
sustained, and the type of industry in which the injured worker was employed. We used logistic regression
analyses to compare the categorical utilization measures (e.g., likelihood of an injured worker receiving
opioids), and ordinary least squares (OLS) linear regression analyses were used to compare continuous
utilization measures (e.g., average MEA per claim). Tables TA.B1 and TA.B2 present estimated odds ratios
from the logistic regressions for the likelihood of injured workers receiving at least one opioid and two or
more opioids. Table TA.B3 presents coefficient estimates from OLS linear regressions for the average MEA
per claim measure. Table TA.B4 shows the case-mix adjusted and unadjusted values for a select set of
measures highlighted in this report to illustrate that the two sets of measures are largely consistent. Adjusting
for case mix had little impact on the frequency of opioid use measures. Adjusting for case mix appears to have
reduced the variation across states in the average amount of opioids per claim, but large interstate variations
persisted and the characterization of states as higher, in the middle, or lower remains unchanged.
AR
CA
CTFL
GA
IA
ILIN
KS
KY
LA
MA
MD
MI MN
MO
NC
NJ
NV
NYPA
SC
TN
TXVA
WI
0
500
1,000
1,500
2,000
2,500
3,000
3,500
4,000
0% 10% 20% 30% 40% 50% 60% 70% 80% 90%
Ave
rag
e M
EA p
er N
on
surg
ical
Cla
im w
ith
Mo
re
Than
7 D
ays
of L
ost
Tim
e w
ith
Op
ioid
s (m
illig
ram
s)
% of Nonsurgical Claims with Pain Medications That Had Opioids
copyright © 2017 workers compensation research institute
97
_____________________________________________________________________________________________I N T E R S T A T E V A R I A T I O N S I N U S E O F O P I O I D S , 4 T H E D I T I O N
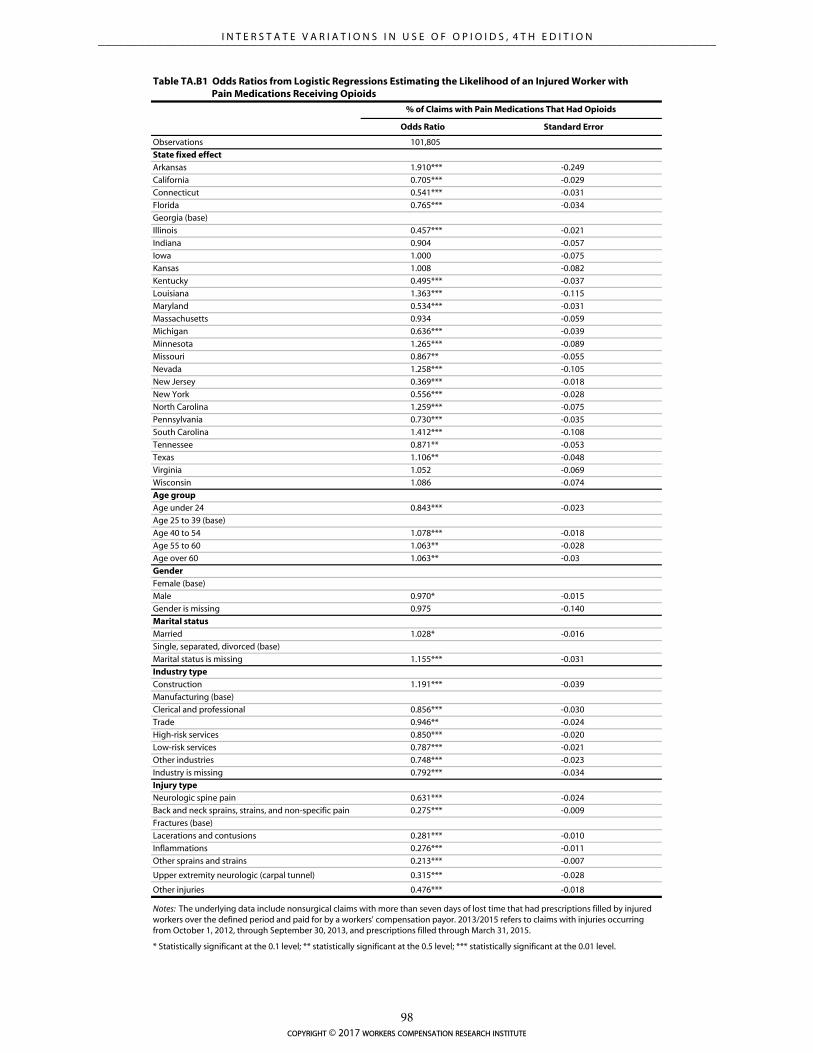
Odds Ratio Standard Error
Observations 101,805
State fixed effect
Arkansas 1.910*** -0.249
California 0.705*** -0.029
Connecticut 0.541*** -0.031
Florida 0.765*** -0.034
Georgia (base)
Illinois 0.457*** -0.021
Indiana 0.904 -0.057
Iowa 1.000 -0.075
Kansas 1.008 -0.082
Kentucky 0.495*** -0.037
Louisiana 1.363*** -0.115
Maryland 0.534*** -0.031
Massachusetts 0.934 -0.059
Michigan 0.636*** -0.039
Minnesota 1.265*** -0.089
Missouri 0.867** -0.055
Nevada 1.258*** -0.105
New Jersey 0.369*** -0.018
New York 0.556*** -0.028
North Carolina 1.259*** -0.075
Pennsylvania 0.730*** -0.035
South Carolina 1.412*** -0.108
Tennessee 0.871** -0.053
Texas 1.106** -0.048
Virginia 1.052 -0.069
Wisconsin 1.086 -0.074
Age group
Age under 24 0.843*** -0.023
Age 25 to 39 (base)
Age 40 to 54 1.078*** -0.018
Age 55 to 60 1.063** -0.028
Age over 60 1.063** -0.03
Gender
Female (base)
Male 0.970* -0.015
Gender is missing 0.975 -0.140
Marital status
Married 1.028* -0.016
Single, separated, divorced (base)
Marital status is missing 1.155*** -0.031
Industry type
Construction 1.191*** -0.039
Manufacturing (base)
Clerical and professional 0.856*** -0.030
Trade 0.946** -0.024
High-risk services 0.850*** -0.020
Low-risk services 0.787*** -0.021
Other industries 0.748*** -0.023
Industry is missing 0.792*** -0.034
Injury type
Neurologic spine pain 0.631*** -0.024
Back and neck sprains, strains, and non-specific pain 0.275*** -0.009
Fractures (base)
Lacerations and contusions 0.281*** -0.010
Inflammations 0.276*** -0.011
Other sprains and strains 0.213*** -0.007
Upper extremity neurologic (carpal tunnel) 0.315*** -0.028
Other injuries 0.476*** -0.018
Table TA.B1 Odds Ratios from Logistic Regressions Estimating the Likelihood of an Injured Worker with Pain Medications Receiving Opioids
% of Claims with Pain Medications That Had Opioids
Notes: The underlying data include nonsurgical claims with more than seven days of lost time that had prescriptions filled by injured workers over the defined period and paid for by a workers' compensation payor. 2013/2015 refers to claims with injuries occurring from October 1, 2012, through September 30, 2013, and prescriptions filled through March 31, 2015.
* Statistically significant at the 0.1 level; ** statistically significant at the 0.5 level; *** statistically significant at the 0.01 level.
copyright © 2017 workers compensation research institute
98
_____________________________________________________________________________________________I N T E R S T A T E V A R I A T I O N S I N U S E O F O P I O I D S , 4 T H E D I T I O N
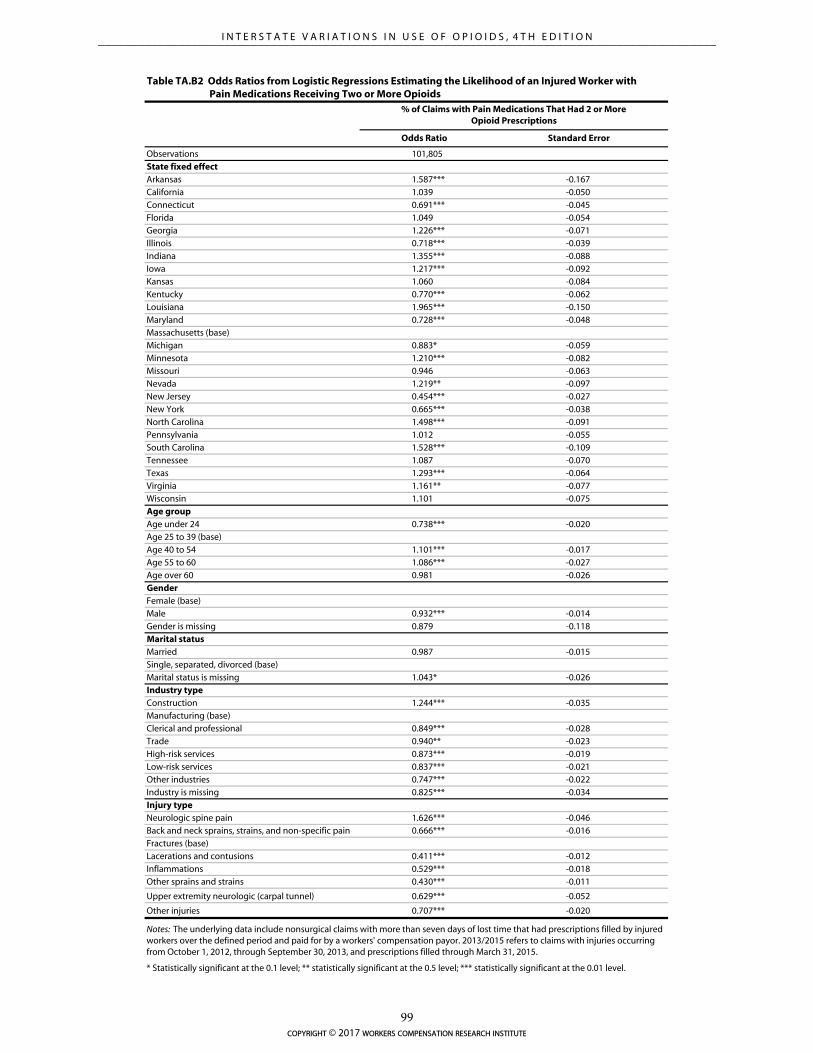
Odds Ratio Standard Error
Observations 101,805
State fixed effectArkansas 1.587*** -0.167
California 1.039 -0.050
Connecticut 0.691*** -0.045
Florida 1.049 -0.054
Georgia 1.226*** -0.071
Illinois 0.718*** -0.039
Indiana 1.355*** -0.088
Iowa 1.217*** -0.092
Kansas 1.060 -0.084
Kentucky 0.770*** -0.062
Louisiana 1.965*** -0.150
Maryland 0.728*** -0.048
Massachusetts (base)
Michigan 0.883* -0.059
Minnesota 1.210*** -0.082
Missouri 0.946 -0.063
Nevada 1.219** -0.097
New Jersey 0.454*** -0.027
New York 0.665*** -0.038
North Carolina 1.498*** -0.091
Pennsylvania 1.012 -0.055
South Carolina 1.528*** -0.109
Tennessee 1.087 -0.070
Texas 1.293*** -0.064
Virginia 1.161** -0.077
Wisconsin 1.101 -0.075
Age groupAge under 24 0.738*** -0.020
Age 25 to 39 (base)
Age 40 to 54 1.101*** -0.017
Age 55 to 60 1.086*** -0.027
Age over 60 0.981 -0.026
GenderFemale (base)
Male 0.932*** -0.014
Gender is missing 0.879 -0.118
Marital statusMarried 0.987 -0.015
Single, separated, divorced (base)
Marital status is missing 1.043* -0.026
Industry typeConstruction 1.244*** -0.035
Manufacturing (base)
Clerical and professional 0.849*** -0.028
Trade 0.940** -0.023
High-risk services 0.873*** -0.019
Low-risk services 0.837*** -0.021
Other industries 0.747*** -0.022
Industry is missing 0.825*** -0.034
Injury typeNeurologic spine pain 1.626*** -0.046
Back and neck sprains, strains, and non-specific pain 0.666*** -0.016
Fractures (base)
Lacerations and contusions 0.411*** -0.012
Inflammations 0.529*** -0.018
Other sprains and strains 0.430*** -0.011
Upper extremity neurologic (carpal tunnel) 0.629*** -0.052
Other injuries 0.707*** -0.020
Table TA.B2 Odds Ratios from Logistic Regressions Estimating the Likelihood of an Injured Worker with Pain Medications Receiving Two or More Opioids
% of Claims with Pain Medications That Had 2 or More Opioid Prescriptions
Notes: The underlying data include nonsurgical claims with more than seven days of lost time that had prescriptions filled by injured workers over the defined period and paid for by a workers' compensation payor. 2013/2015 refers to claims with injuries occurring from October 1, 2012, through September 30, 2013, and prescriptions filled through March 31, 2015.
* Statistically significant at the 0.1 level; ** statistically significant at the 0.5 level; *** statistically significant at the 0.01 level.
copyright © 2017 workers compensation research institute
99
_____________________________________________________________________________________________I N T E R S T A T E V A R I A T I O N S I N U S E O F O P I O I D S , 4 T H E D I T I O N
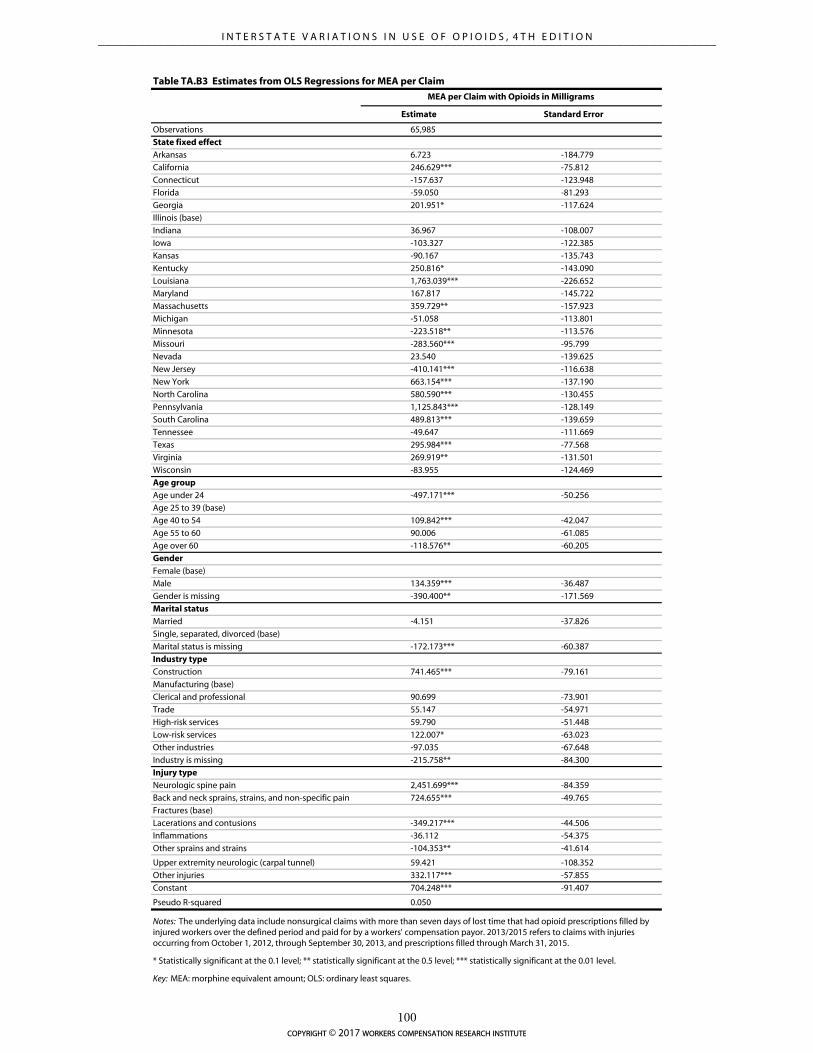
Estimate Standard Error
Observations 65,985
State fixed effect
Arkansas 6.723 -184.779
California 246.629*** -75.812
Connecticut -157.637 -123.948
Florida -59.050 -81.293
Georgia 201.951* -117.624
Illinois (base)
Indiana 36.967 -108.007
Iowa -103.327 -122.385
Kansas -90.167 -135.743
Kentucky 250.816* -143.090
Louisiana 1,763.039*** -226.652
Maryland 167.817 -145.722
Massachusetts 359.729** -157.923
Michigan -51.058 -113.801
Minnesota -223.518** -113.576
Missouri -283.560*** -95.799
Nevada 23.540 -139.625
New Jersey -410.141*** -116.638
New York 663.154*** -137.190
North Carolina 580.590*** -130.455
Pennsylvania 1,125.843*** -128.149
South Carolina 489.813*** -139.659
Tennessee -49.647 -111.669
Texas 295.984*** -77.568
Virginia 269.919** -131.501
Wisconsin -83.955 -124.469
Age group
Age under 24 -497.171*** -50.256
Age 25 to 39 (base)
Age 40 to 54 109.842*** -42.047
Age 55 to 60 90.006 -61.085
Age over 60 -118.576** -60.205
Gender
Female (base)
Male 134.359*** -36.487
Gender is missing -390.400** -171.569
Marital status
Married -4.151 -37.826
Single, separated, divorced (base)
Marital status is missing -172.173*** -60.387
Industry type
Construction 741.465*** -79.161
Manufacturing (base)
Clerical and professional 90.699 -73.901
Trade 55.147 -54.971
High-risk services 59.790 -51.448
Low-risk services 122.007* -63.023
Other industries -97.035 -67.648
Industry is missing -215.758** -84.300
Injury type
Neurologic spine pain 2,451.699*** -84.359
Back and neck sprains, strains, and non-specific pain 724.655*** -49.765
Fractures (base)
Lacerations and contusions -349.217*** -44.506
Inflammations -36.112 -54.375
Other sprains and strains -104.353** -41.614
Upper extremity neurologic (carpal tunnel) 59.421 -108.352
Other injuries 332.117*** -57.855
Constant 704.248*** -91.407
Pseudo R-squared 0.050
Key: MEA: morphine equivalent amount; OLS: ordinary least squares.
Table TA.B3 Estimates from OLS Regressions for MEA per Claim
MEA per Claim with Opioids in Milligrams
Notes: The underlying data include nonsurgical claims with more than seven days of lost time that had opioid prescriptions filled by injured workers over the defined period and paid for by a workers' compensation payor. 2013/2015 refers to claims with injuries occurring from October 1, 2012, through September 30, 2013, and prescriptions filled through March 31, 2015.
* Statistically significant at the 0.1 level; ** statistically significant at the 0.5 level; *** statistically significant at the 0.01 level.
copyright © 2017 workers compensation research institute
100
_____________________________________________________________________________________________I N T E R S T A T E V A R I A T I O N S I N U S E O F O P I O I D S , 4 T H E D I T I O N
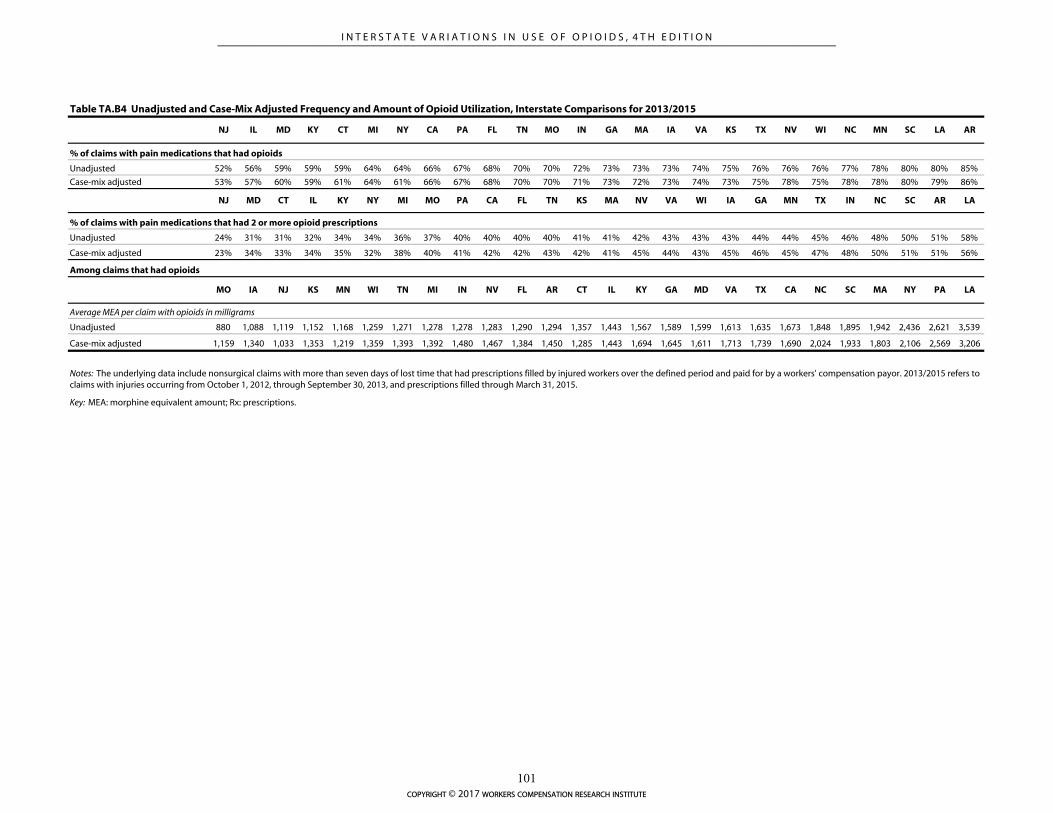
NJ IL MD KY CT MI NY CA PA FL TN MO IN GA MA IA VA KS TX NV WI NC MN SC LA AR
% of claims with pain medications that had opioids
Unadjusted 52% 56% 59% 59% 59% 64% 64% 66% 67% 68% 70% 70% 72% 73% 73% 73% 74% 75% 76% 76% 76% 77% 78% 80% 80% 85%
Case-mix adjusted 53% 57% 60% 59% 61% 64% 61% 66% 67% 68% 70% 70% 71% 73% 72% 73% 74% 73% 75% 78% 75% 78% 78% 80% 79% 86%
NJ MD CT IL KY NY MI MO PA CA FL TN KS MA NV VA WI IA GA MN TX IN NC SC AR LA
% of claims with pain medications that had 2 or more opioid prescriptions
Unadjusted 24% 31% 31% 32% 34% 34% 36% 37% 40% 40% 40% 40% 41% 41% 42% 43% 43% 43% 44% 44% 45% 46% 48% 50% 51% 58%
Case-mix adjusted 23% 34% 33% 34% 35% 32% 38% 40% 41% 42% 42% 43% 42% 41% 45% 44% 43% 45% 46% 45% 47% 48% 50% 51% 51% 56%
Among claims that had opioids
MO IA NJ KS MN WI TN MI IN NV FL AR CT IL KY GA MD VA TX CA NC SC MA NY PA LA
Average MEA per claim with opioids in milligrams
Unadjusted 880 1,088 1,119 1,152 1,168 1,259 1,271 1,278 1,278 1,283 1,290 1,294 1,357 1,443 1,567 1,589 1,599 1,613 1,635 1,673 1,848 1,895 1,942 2,436 2,621 3,539
Case-mix adjusted 1,159 1,340 1,033 1,353 1,219 1,359 1,393 1,392 1,480 1,467 1,384 1,450 1,285 1,443 1,694 1,645 1,611 1,713 1,739 1,690 2,024 1,933 1,803 2,106 2,569 3,206
Table TA.B4 Unadjusted and Case-Mix Adjusted Frequency and Amount of Opioid Utilization, Interstate Comparisons for 2013/2015
Key: MEA: morphine equivalent amount; Rx: prescriptions.
Notes: The underlying data include nonsurgical claims with more than seven days of lost time that had prescriptions filled by injured workers over the defined period and paid for by a workers' compensation payor. 2013/2015 refers to claims with injuries occurring from October 1, 2012, through September 30, 2013, and prescriptions filled through March 31, 2015.
copyright © 2017 workers compensation research institute
101
_____________________________________________________________________________________________I N T E R S T A T E V A R I A T I O N S I N U S E O F O P I O I D S , 4 T H E D I T I O N
SENSITIVITY OF AMOUNT OF OPIOIDS PER CLAIM MEASURE
Some of the initial results on interstate variations were surprising. For example, the average MEA of opioids
per claim was surprisingly high in several states. Since we compared the mean values of the measure, one
concern may be that the amounts of opioids received per claim may be influenced by claims with unusually
high amounts of opioids. If there were more such cases in some states than in others, the results of interstate
comparisons would be skewed and misleading. Similarly, if the proportion of such cases was different across
years, the trend results would be unnecessarily fluctuated. To address this concern, we did three things.
CLAIMS WITH UNUSUALLY HIGHER AMOUNTS OF OPIOIDS
First, we identified the claims in which morphine equivalent amounts of opioids were unusually high and
excluded these claims from the data used for the interstate comparison and trend analyses for the use of
opioids. Note that for this study, we revised the approach to determining the maximum amount of opioids
used to identify claims with unusually high amounts of opioids that was used in the first edition of the study
(Wang, Mueller, and Hashimoto, 2011). Instead of using a fixed duration, we estimated the maximum
amount of opioids based on the duration of opioids received by individual claims from the date of the first to
the date of the last opioid prescription, plus a 30-day supply for the last prescription. The MEA of opioids was
considered unusually high for a claim if the estimated daily dosage (i.e., the total amount of morphine
equivalent opioids received by the claim divided by the duration of receiving opioid prescriptions) for the
claim exceeded 120 milligrams of morphine equivalents per day for the duration of opioid use.2 As a result,
we excluded less than 1 percent of the claims with opioids in all states. We report the mean values of the
amount of opioids per claim and other utilization measures after this exclusion. Extreme values are not due to
data entry errors or other data anomalies, in general. They are usually due to injured workers receiving a
higher-than-typical number of Schedule II opioid prescriptions, such as oxycodone (OxyContin®) and
fentanyl patches (Duragesic®), at high doses. Even though injured workers with extreme values accounted for
less than 1 percent of all claims with opioids, they accounted for 3–5 percent of all opioid prescriptions and
10–20 percent of total morphine equivalent doses dispensed in Massachusetts, Nevada, New York,
Pennsylvania, and Tennessee. Extreme-value claims accounted for 0–1 percent of opioid prescriptions and
about 5 percent of morphine equivalent doses dispensed in all other states. Half of the claims with extreme
values of MEA were neurologic spine pain cases, and a majority of the other half was for sprains and strains.
With the extreme value claims included, the amount of opioids per claim would be considerably higher
than reported, especially in the states with higher morphine equivalent amounts per claim reported, like New
York. We chose to report data with the exclusion to make the trend results more meaningful. Since the
comparative results are consistent in the data with and without those extreme-value claims, we report the
results of interstate comparisons using the same set of measures for simplicity. The results on the amount of
opioids per claim before and after the exclusion are presented in Table TA.B5. This should not be interpreted
as the number of claims with more than a 120-milligram morphine equivalent dose per day because we did
not compute the duration by adding the day supply. Instead, we computed duration of opioid use as (last
opioid fill date – first opioid fill date) + 30, which underestimates the average morphine equivalent dose per
day.
2 The 120-milligram threshold is the maximum daily dosage typically recommended by guidelines (e.g., Oregon guidelines for prescribing opioids [Oregon Health and Science University, 2006]).
copyright © 2017 workers compensation research institute
102
_____________________________________________________________________________________________I N T E R S T A T E V A R I A T I O N S I N U S E O F O P I O I D S , 4 T H E D I T I O N
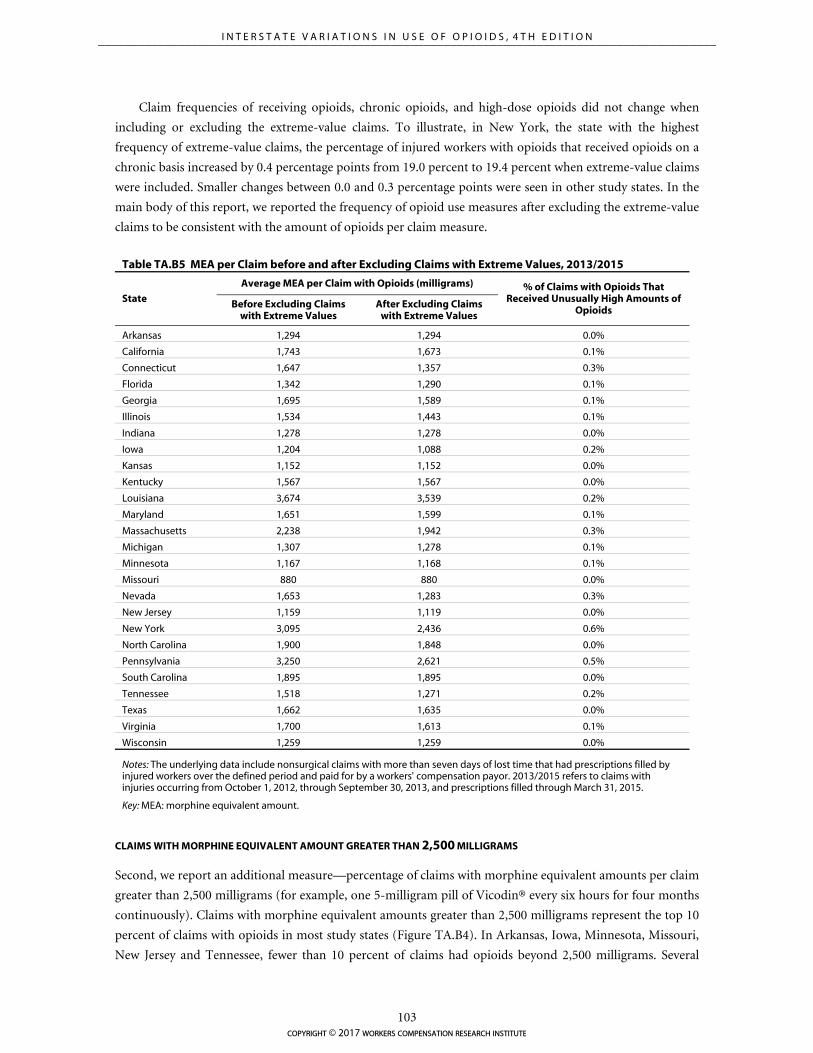
Claim frequencies of receiving opioids, chronic opioids, and high-dose opioids did not change when
including or excluding the extreme-value claims. To illustrate, in New York, the state with the highest
frequency of extreme-value claims, the percentage of injured workers with opioids that received opioids on a
chronic basis increased by 0.4 percentage points from 19.0 percent to 19.4 percent when extreme-value claims
were included. Smaller changes between 0.0 and 0.3 percentage points were seen in other study states. In the
main body of this report, we reported the frequency of opioid use measures after excluding the extreme-value
claims to be consistent with the amount of opioids per claim measure.
Table TA.B5 MEA per Claim before and after Excluding Claims with Extreme Values, 2013/2015
State
Average MEA per Claim with Opioids (milligrams) % of Claims with Opioids That Received Unusually High Amounts of
Opioids Before Excluding Claims
with Extreme Values After Excluding Claims
with Extreme Values
Arkansas 1,294 1,294 0.0%
California 1,743 1,673 0.1%
Connecticut 1,647 1,357 0.3%
Florida 1,342 1,290 0.1%
Georgia 1,695 1,589 0.1%
Illinois 1,534 1,443 0.1%
Indiana 1,278 1,278 0.0%
Iowa 1,204 1,088 0.2%
Kansas 1,152 1,152 0.0%
Kentucky 1,567 1,567 0.0%
Louisiana 3,674 3,539 0.2%
Maryland 1,651 1,599 0.1%
Massachusetts 2,238 1,942 0.3%
Michigan 1,307 1,278 0.1%
Minnesota 1,167 1,168 0.1%
Missouri 880 880 0.0%
Nevada 1,653 1,283 0.3%
New Jersey 1,159 1,119 0.0%
New York 3,095 2,436 0.6%
North Carolina 1,900 1,848 0.0%
Pennsylvania 3,250 2,621 0.5%
South Carolina 1,895 1,895 0.0%
Tennessee 1,518 1,271 0.2%
Texas 1,662 1,635 0.0%
Virginia 1,700 1,613 0.1%
Wisconsin 1,259 1,259 0.0%
Notes: The underlying data include nonsurgical claims with more than seven days of lost time that had prescriptions filled by injured workers over the defined period and paid for by a workers' compensation payor. 2013/2015 refers to claims with injuries occurring from October 1, 2012, through September 30, 2013, and prescriptions filled through March 31, 2015.
Key: MEA: morphine equivalent amount.
CLAIMS WITH MORPHINE EQUIVALENT AMOUNT GREATER THAN 2,500 MILLIGRAMS
Second, we report an additional measure—percentage of claims with morphine equivalent amounts per claim
greater than 2,500 milligrams (for example, one 5-milligram pill of Vicodin® every six hours for four months
continuously). Claims with morphine equivalent amounts greater than 2,500 milligrams represent the top 10
percent of claims with opioids in most study states (Figure TA.B4). In Arkansas, Iowa, Minnesota, Missouri,
New Jersey and Tennessee, fewer than 10 percent of claims had opioids beyond 2,500 milligrams. Several
copyright © 2017 workers compensation research institute
103
_____________________________________________________________________________________________I N T E R S T A T E V A R I A T I O N S I N U S E O F O P I O I D S , 4 T H E D I T I O N
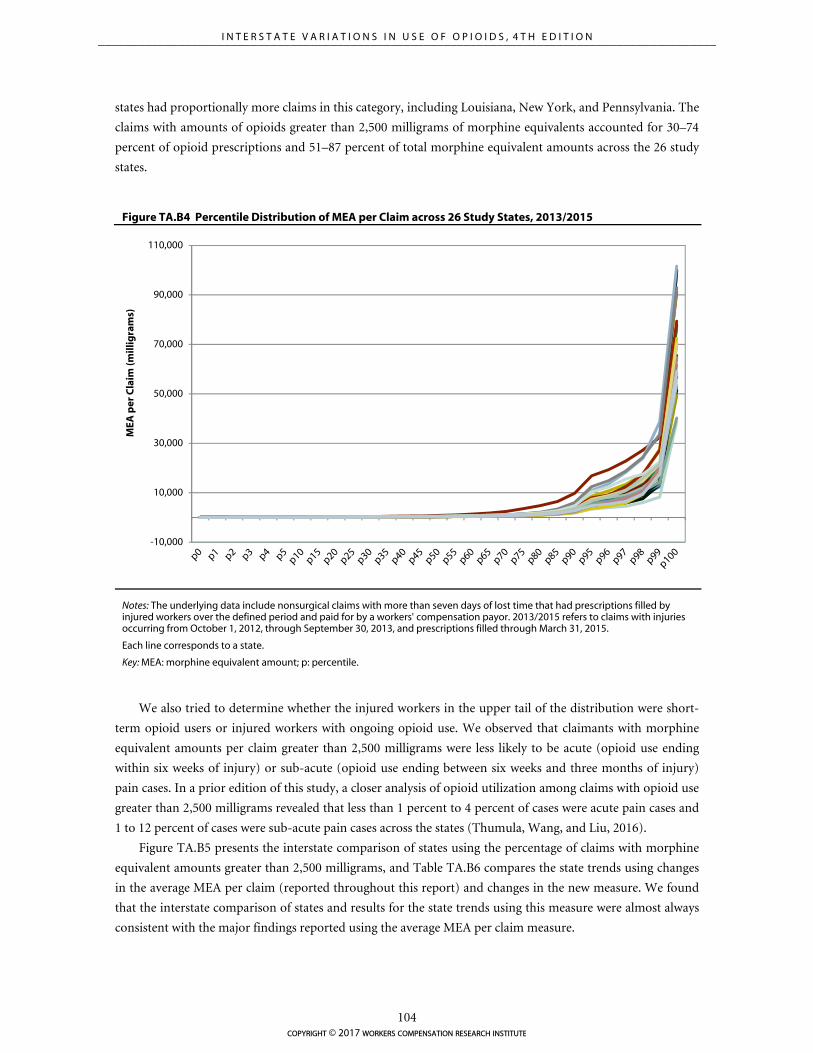
-10,000
10,000
30,000
50,000
70,000
90,000
110,000
MEA
per
Cla
im (m
illig
ram
s)
states had proportionally more claims in this category, including Louisiana, New York, and Pennsylvania. The
claims with amounts of opioids greater than 2,500 milligrams of morphine equivalents accounted for 30–74
percent of opioid prescriptions and 51–87 percent of total morphine equivalent amounts across the 26 study
states.
Figure TA.B4 Percentile Distribution of MEA per Claim across 26 Study States, 2013/2015
Notes: The underlying data include nonsurgical claims with more than seven days of lost time that had prescriptions filled by injured workers over the defined period and paid for by a workers' compensation payor. 2013/2015 refers to claims with injuries occurring from October 1, 2012, through September 30, 2013, and prescriptions filled through March 31, 2015.
Each line corresponds to a state.
Key: MEA: morphine equivalent amount; p: percentile.
We also tried to determine whether the injured workers in the upper tail of the distribution were short-
term opioid users or injured workers with ongoing opioid use. We observed that claimants with morphine
equivalent amounts per claim greater than 2,500 milligrams were less likely to be acute (opioid use ending
within six weeks of injury) or sub-acute (opioid use ending between six weeks and three months of injury)
pain cases. In a prior edition of this study, a closer analysis of opioid utilization among claims with opioid use
greater than 2,500 milligrams revealed that less than 1 percent to 4 percent of cases were acute pain cases and
1 to 12 percent of cases were sub-acute pain cases across the states (Thumula, Wang, and Liu, 2016).
Figure TA.B5 presents the interstate comparison of states using the percentage of claims with morphine
equivalent amounts greater than 2,500 milligrams, and Table TA.B6 compares the state trends using changes
in the average MEA per claim (reported throughout this report) and changes in the new measure. We found
that the interstate comparison of states and results for the state trends using this measure were almost always
consistent with the major findings reported using the average MEA per claim measure.
copyright © 2017 workers compensation research institute
104
_____________________________________________________________________________________________I N T E R S T A T E V A R I A T I O N S I N U S E O F O P I O I D S , 4 T H E D I T I O N
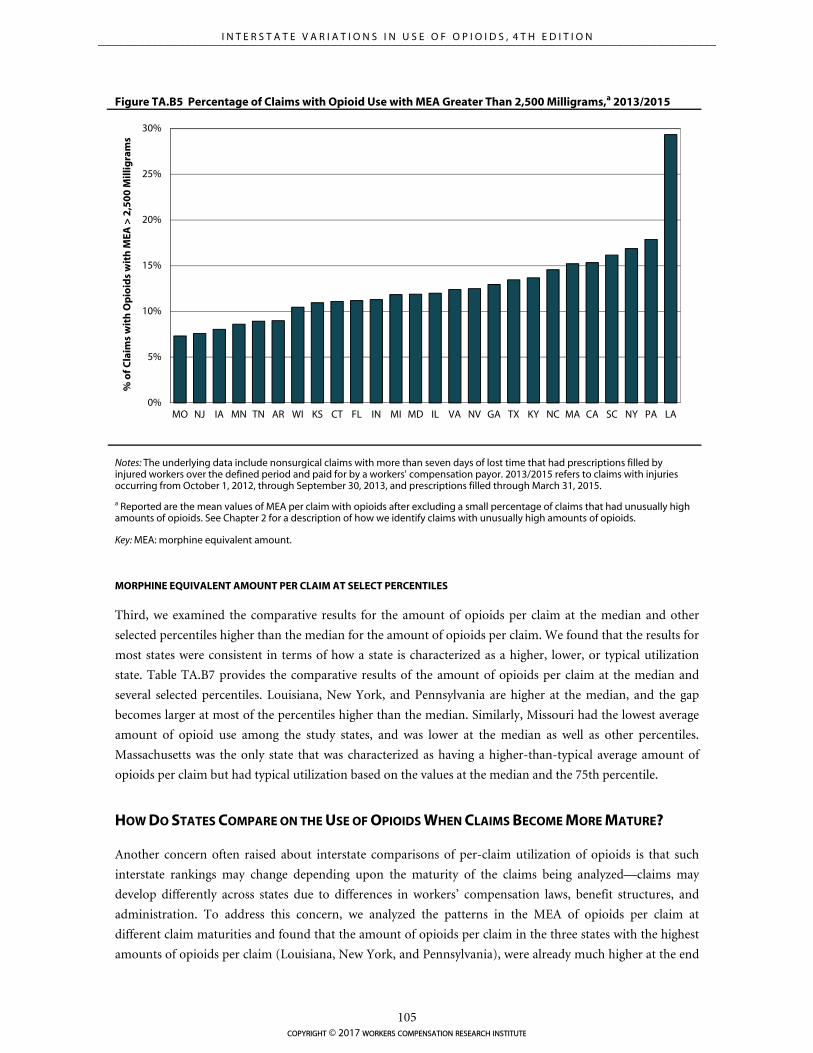
0%
5%
10%
15%
20%
25%
30%
MO NJ IA MN TN AR WI KS CT FL IN MI MD IL VA NV GA TX KY NC MA CA SC NY PA LA
% o
f Cla
ims
wit
h O
pio
ids
wit
h M
EA >
2,5
00
Mill
igra
ms
Figure TA.B5 Percentage of Claims with Opioid Use with MEA Greater Than 2,500 Milligrams,a 2013/2015
Notes: The underlying data include nonsurgical claims with more than seven days of lost time that had prescriptions filled by injured workers over the defined period and paid for by a workers' compensation payor. 2013/2015 refers to claims with injuries occurring from October 1, 2012, through September 30, 2013, and prescriptions filled through March 31, 2015.
a Reported are the mean values of MEA per claim with opioids after excluding a small percentage of claims that had unusually high amounts of opioids. See Chapter 2 for a description of how we identify claims with unusually high amounts of opioids.
Key: MEA: morphine equivalent amount.
MORPHINE EQUIVALENT AMOUNT PER CLAIM AT SELECT PERCENTILES
Third, we examined the comparative results for the amount of opioids per claim at the median and other
selected percentiles higher than the median for the amount of opioids per claim. We found that the results for
most states were consistent in terms of how a state is characterized as a higher, lower, or typical utilization
state. Table TA.B7 provides the comparative results of the amount of opioids per claim at the median and
several selected percentiles. Louisiana, New York, and Pennsylvania are higher at the median, and the gap
becomes larger at most of the percentiles higher than the median. Similarly, Missouri had the lowest average
amount of opioid use among the study states, and was lower at the median as well as other percentiles.
Massachusetts was the only state that was characterized as having a higher-than-typical average amount of
opioids per claim but had typical utilization based on the values at the median and the 75th percentile.
HOW DO STATES COMPARE ON THE USE OF OPIOIDS WHEN CLAIMS BECOME MORE MATURE?
Another concern often raised about interstate comparisons of per-claim utilization of opioids is that such
interstate rankings may change depending upon the maturity of the claims being analyzed—claims may
develop differently across states due to differences in workers’ compensation laws, benefit structures, and
administration. To address this concern, we analyzed the patterns in the MEA of opioids per claim at
different claim maturities and found that the amount of opioids per claim in the three states with the highest
amounts of opioids per claim (Louisiana, New York, and Pennsylvania), were already much higher at the end
copyright © 2017 workers compensation research institute
105
_____________________________________________________________________________________________I N T E R S T A T E V A R I A T I O N S I N U S E O F O P I O I D S , 4 T H E D I T I O N
of the first year postinjury (Table TA.B8).
HOW DO STATES COMPARE ON THE USE OF OPIOIDS BY DURATION OF TEMPORARY DISABILITY?
We also looked at how the use of opioids per claim correlates with different intervals of temporary disability
duration across the states and found a strong positive correlation between the amount of opioids per claim
and the proportion of claims with longer disability duration (Table TA.B9). This suggests that the higher use
of opioids in some states may be explained partially by the average longer duration of temporary disability. It
is also possible that a certain pattern of opioid use may lead to longer disability duration. Without a more
rigorous analysis, we cannot tell to what extent the longer disability duration would affect the use of opioids
in a state. However, we tried to assess the sensitivity of our characterization of states as higher, lower, or
typical by setting the disability duration distribution in each state to the distribution in the median state and
found that Louisiana, New York, and Pennsylvania continued to be among the states with the highest amount
of opioid use per average injured worker even after the adjustment, although the adjusted average amount of
opioids per claim was lower than the actual amount.
copyright © 2017 workers compensation research institute
106
_____________________________________________________________________________________________I N T E R S T A T E V A R I A T I O N S I N U S E O F O P I O I D S , 4 T H E D I T I O N
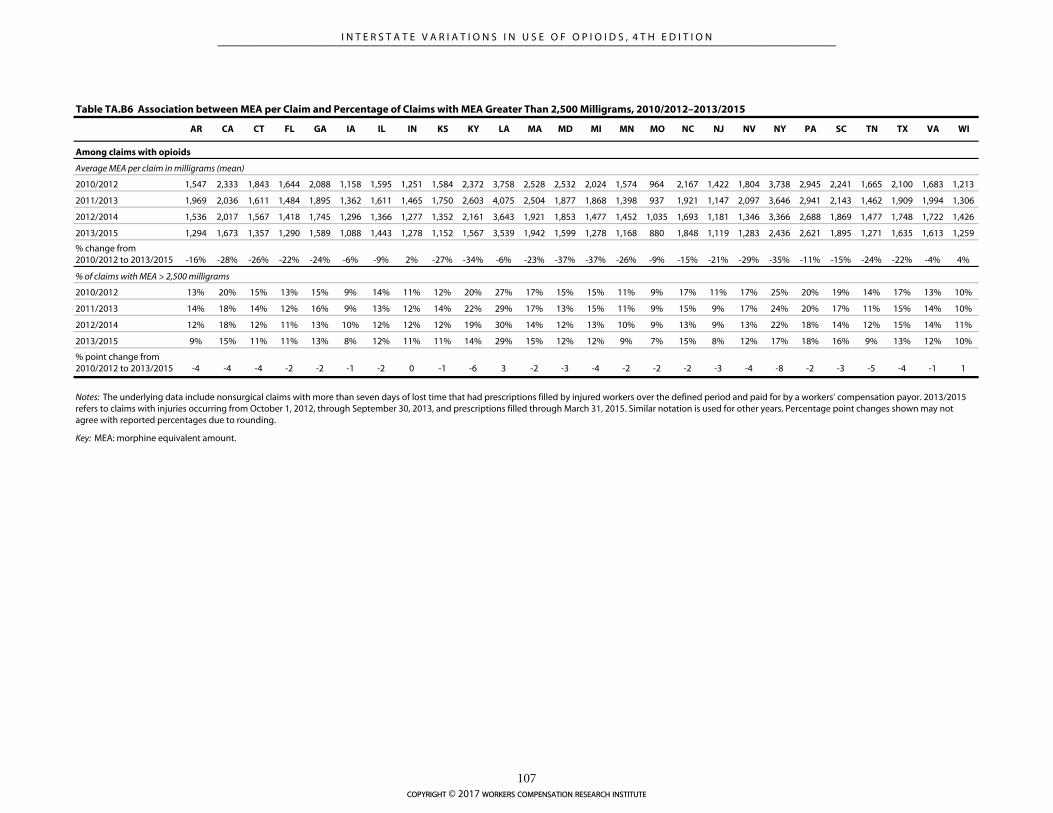
AR CA CT FL GA IA IL IN KS KY LA MA MD MI MN MO NC NJ NV NY PA SC TN TX VA WI
2010/2012 1,547 2,333 1,843 1,644 2,088 1,158 1,595 1,251 1,584 2,372 3,758 2,528 2,532 2,024 1,574 964 2,167 1,422 1,804 3,738 2,945 2,241 1,665 2,100 1,683 1,213
2011/2013 1,969 2,036 1,611 1,484 1,895 1,362 1,611 1,465 1,750 2,603 4,075 2,504 1,877 1,868 1,398 937 1,921 1,147 2,097 3,646 2,941 2,143 1,462 1,909 1,994 1,306
2012/2014 1,536 2,017 1,567 1,418 1,745 1,296 1,366 1,277 1,352 2,161 3,643 1,921 1,853 1,477 1,452 1,035 1,693 1,181 1,346 3,366 2,688 1,869 1,477 1,748 1,722 1,426
2013/2015 1,294 1,673 1,357 1,290 1,589 1,088 1,443 1,278 1,152 1,567 3,539 1,942 1,599 1,278 1,168 880 1,848 1,119 1,283 2,436 2,621 1,895 1,271 1,635 1,613 1,259
% change from 2010/2012 to 2013/2015 -16% -28% -26% -22% -24% -6% -9% 2% -27% -34% -6% -23% -37% -37% -26% -9% -15% -21% -29% -35% -11% -15% -24% -22% -4% 4%
2010/2012 13% 20% 15% 13% 15% 9% 14% 11% 12% 20% 27% 17% 15% 15% 11% 9% 17% 11% 17% 25% 20% 19% 14% 17% 13% 10%
2011/2013 14% 18% 14% 12% 16% 9% 13% 12% 14% 22% 29% 17% 13% 15% 11% 9% 15% 9% 17% 24% 20% 17% 11% 15% 14% 10%
2012/2014 12% 18% 12% 11% 13% 10% 12% 12% 12% 19% 30% 14% 12% 13% 10% 9% 13% 9% 13% 22% 18% 14% 12% 15% 14% 11%
2013/2015 9% 15% 11% 11% 13% 8% 12% 11% 11% 14% 29% 15% 12% 12% 9% 7% 15% 8% 12% 17% 18% 16% 9% 13% 12% 10%
% point change from 2010/2012 to 2013/2015 -4 -4 -4 -2 -2 -1 -2 0 -1 -6 3 -2 -3 -4 -2 -2 -2 -3 -4 -8 -2 -3 -5 -4 -1 1
Table TA.B6 Association between MEA per Claim and Percentage of Claims with MEA Greater Than 2,500 Milligrams, 2010/2012–2013/2015
Among claims with opioids
Key: MEA: morphine equivalent amount.
Average MEA per claim in milligrams (mean)
% of claims with MEA > 2,500 milligrams
Notes: The underlying data include nonsurgical claims with more than seven days of lost time that had prescriptions filled by injured workers over the defined period and paid for by a workers' compensation payor. 2013/2015 refers to claims with injuries occurring from October 1, 2012, through September 30, 2013, and prescriptions filled through March 31, 2015. Similar notation is used for other years. Percentage point changes shown may not agree with reported percentages due to rounding.
copyright © 2017 workers compensation research institute
107
_____________________________________________________________________________________________I N T E R S T A T E V A R I A T I O N S I N U S E O F O P I O I D S , 4 T H E D I T I O N
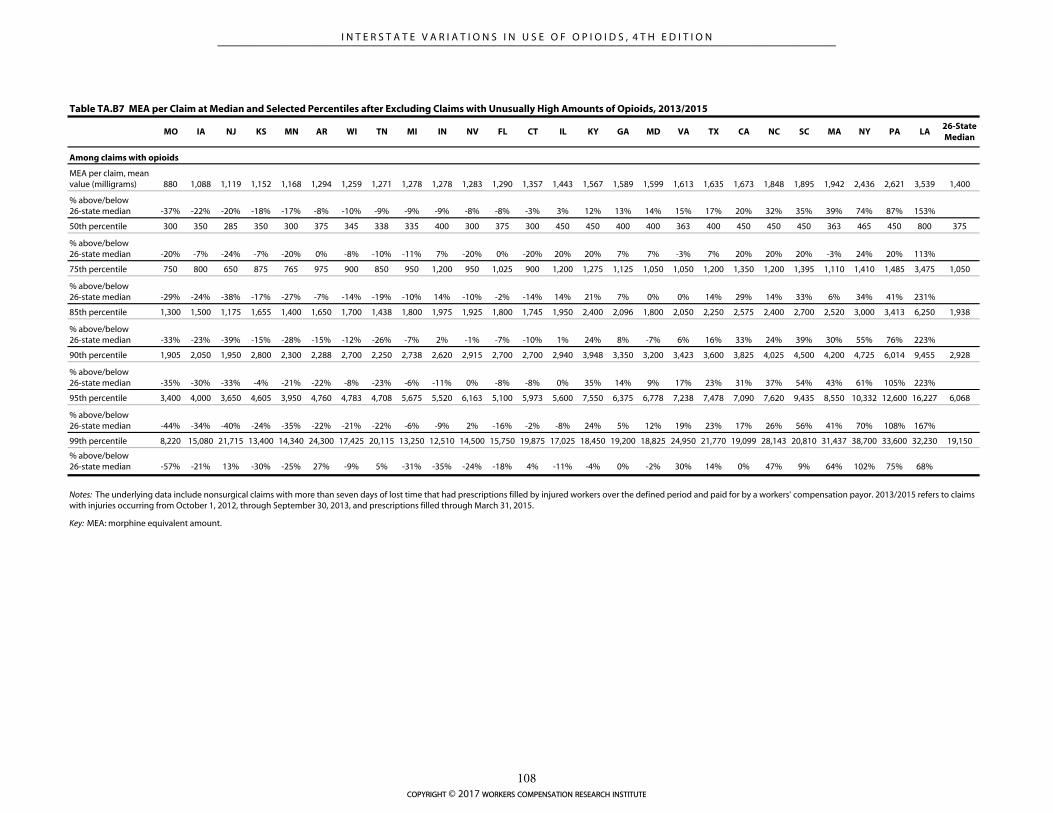
MO IA NJ KS MN AR WI TN MI IN NV FL CT IL KY GA MD VA TX CA NC SC MA NY PA LA26-State Median
MEA per claim, mean value (milligrams) 880 1,088 1,119 1,152 1,168 1,294 1,259 1,271 1,278 1,278 1,283 1,290 1,357 1,443 1,567 1,589 1,599 1,613 1,635 1,673 1,848 1,895 1,942 2,436 2,621 3,539 1,400
% above/below 26-state median -37% -22% -20% -18% -17% -8% -10% -9% -9% -9% -8% -8% -3% 3% 12% 13% 14% 15% 17% 20% 32% 35% 39% 74% 87% 153%
50th percentile 300 350 285 350 300 375 345 338 335 400 300 375 300 450 450 400 400 363 400 450 450 450 363 465 450 800 375
% above/below 26-state median -20% -7% -24% -7% -20% 0% -8% -10% -11% 7% -20% 0% -20% 20% 20% 7% 7% -3% 7% 20% 20% 20% -3% 24% 20% 113%
75th percentile 750 800 650 875 765 975 900 850 950 1,200 950 1,025 900 1,200 1,275 1,125 1,050 1,050 1,200 1,350 1,200 1,395 1,110 1,410 1,485 3,475 1,050
% above/below 26-state median -29% -24% -38% -17% -27% -7% -14% -19% -10% 14% -10% -2% -14% 14% 21% 7% 0% 0% 14% 29% 14% 33% 6% 34% 41% 231%
85th percentile 1,300 1,500 1,175 1,655 1,400 1,650 1,700 1,438 1,800 1,975 1,925 1,800 1,745 1,950 2,400 2,096 1,800 2,050 2,250 2,575 2,400 2,700 2,520 3,000 3,413 6,250 1,938
% above/below 26-state median -33% -23% -39% -15% -28% -15% -12% -26% -7% 2% -1% -7% -10% 1% 24% 8% -7% 6% 16% 33% 24% 39% 30% 55% 76% 223%
90th percentile 1,905 2,050 1,950 2,800 2,300 2,288 2,700 2,250 2,738 2,620 2,915 2,700 2,700 2,940 3,948 3,350 3,200 3,423 3,600 3,825 4,025 4,500 4,200 4,725 6,014 9,455 2,928
% above/below 26-state median -35% -30% -33% -4% -21% -22% -8% -23% -6% -11% 0% -8% -8% 0% 35% 14% 9% 17% 23% 31% 37% 54% 43% 61% 105% 223%
95th percentile 3,400 4,000 3,650 4,605 3,950 4,760 4,783 4,708 5,675 5,520 6,163 5,100 5,973 5,600 7,550 6,375 6,778 7,238 7,478 7,090 7,620 9,435 8,550 10,332 12,600 16,227 6,068
% above/below 26-state median -44% -34% -40% -24% -35% -22% -21% -22% -6% -9% 2% -16% -2% -8% 24% 5% 12% 19% 23% 17% 26% 56% 41% 70% 108% 167%
99th percentile 8,220 15,080 21,715 13,400 14,340 24,300 17,425 20,115 13,250 12,510 14,500 15,750 19,875 17,025 18,450 19,200 18,825 24,950 21,770 19,099 28,143 20,810 31,437 38,700 33,600 32,230 19,150
% above/below 26-state median -57% -21% 13% -30% -25% 27% -9% 5% -31% -35% -24% -18% 4% -11% -4% 0% -2% 30% 14% 0% 47% 9% 64% 102% 75% 68%
Notes: The underlying data include nonsurgical claims with more than seven days of lost time that had prescriptions filled by injured workers over the defined period and paid for by a workers' compensation payor. 2013/2015 refers to claims with injuries occurring from October 1, 2012, through September 30, 2013, and prescriptions filled through March 31, 2015.
Key: MEA: morphine equivalent amount.
Table TA.B7 MEA per Claim at Median and Selected Percentiles after Excluding Claims with Unusually High Amounts of Opioids, 2013/2015
Among claims with opioids
copyright © 2017 workers compensation research institute
108
_____________________________________________________________________________________________I N T E R S T A T E V A R I A T I O N S I N U S E O F O P I O I D S , 4 T H E D I T I O N
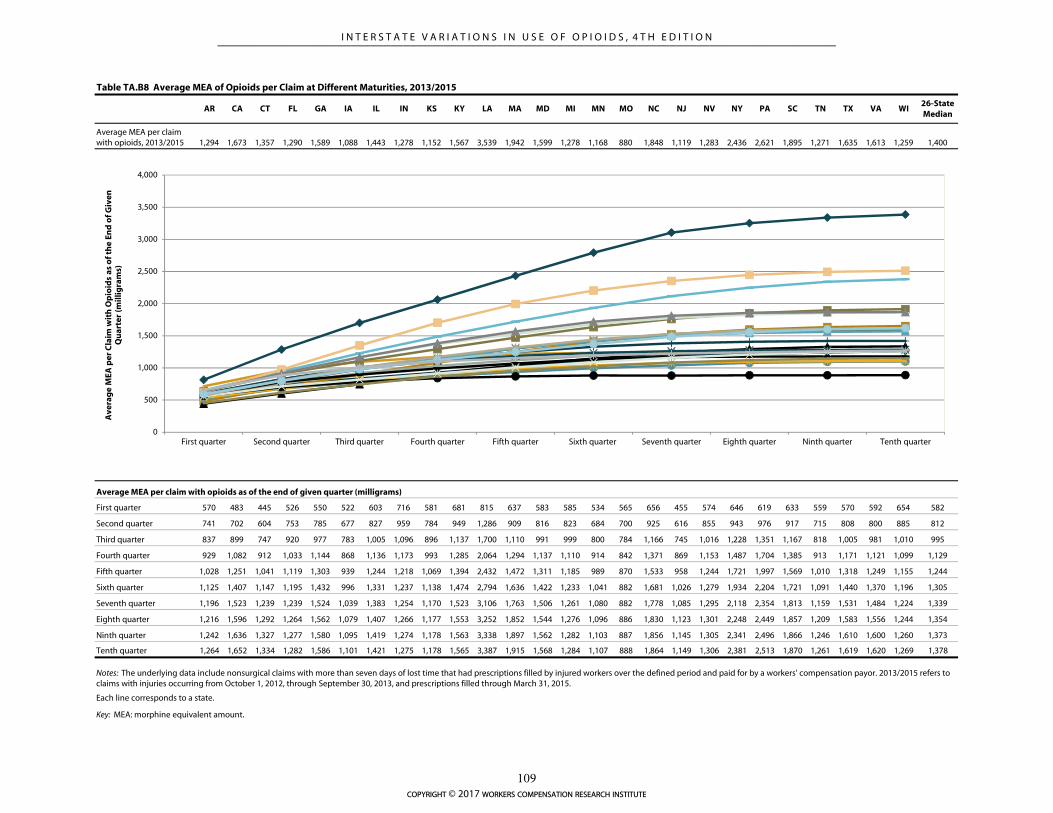
Table TA.B8 Average MEA of Opioids per Claim at Different Maturities, 2013/2015
AR CA CT FL GA IA IL IN KS KY LA MA MD MI MN MO NC NJ NV NY PA SC TN TX VA WI26-State Median
Average MEA per claim with opioids, 2013/2015 1,294 1,673 1,357 1,290 1,589 1,088 1,443 1,278 1,152 1,567 3,539 1,942 1,599 1,278 1,168 880 1,848 1,119 1,283 2,436 2,621 1,895 1,271 1,635 1,613 1,259 1,400
Average MEA per claim with opioids as of the end of given quarter (milligrams)
First quarter 570 483 445 526 550 522 603 716 581 681 815 637 583 585 534 565 656 455 574 646 619 633 559 570 592 654 582
Second quarter 741 702 604 753 785 677 827 959 784 949 1,286 909 816 823 684 700 925 616 855 943 976 917 715 808 800 885 812
Third quarter 837 899 747 920 977 783 1,005 1,096 896 1,137 1,700 1,110 991 999 800 784 1,166 745 1,016 1,228 1,351 1,167 818 1,005 981 1,010 995
Fourth quarter 929 1,082 912 1,033 1,144 868 1,136 1,173 993 1,285 2,064 1,294 1,137 1,110 914 842 1,371 869 1,153 1,487 1,704 1,385 913 1,171 1,121 1,099 1,129
Fifth quarter 1,028 1,251 1,041 1,119 1,303 939 1,244 1,218 1,069 1,394 2,432 1,472 1,311 1,185 989 870 1,533 958 1,244 1,721 1,997 1,569 1,010 1,318 1,249 1,155 1,244
Sixth quarter 1,125 1,407 1,147 1,195 1,432 996 1,331 1,237 1,138 1,474 2,794 1,636 1,422 1,233 1,041 882 1,681 1,026 1,279 1,934 2,204 1,721 1,091 1,440 1,370 1,196 1,305
Seventh quarter 1,196 1,523 1,239 1,239 1,524 1,039 1,383 1,254 1,170 1,523 3,106 1,763 1,506 1,261 1,080 882 1,778 1,085 1,295 2,118 2,354 1,813 1,159 1,531 1,484 1,224 1,339
Eighth quarter 1,216 1,596 1,292 1,264 1,562 1,079 1,407 1,266 1,177 1,553 3,252 1,852 1,544 1,276 1,096 886 1,830 1,123 1,301 2,248 2,449 1,857 1,209 1,583 1,556 1,244 1,354
Ninth quarter 1,242 1,636 1,327 1,277 1,580 1,095 1,419 1,274 1,178 1,563 3,338 1,897 1,562 1,282 1,103 887 1,856 1,145 1,305 2,341 2,496 1,866 1,246 1,610 1,600 1,260 1,373
Tenth quarter 1,264 1,652 1,334 1,282 1,586 1,101 1,421 1,275 1,178 1,565 3,387 1,915 1,568 1,284 1,107 888 1,864 1,149 1,306 2,381 2,513 1,870 1,261 1,619 1,620 1,269 1,378
Notes: The underlying data include nonsurgical claims with more than seven days of lost time that had prescriptions filled by injured workers over the defined period and paid for by a workers' compensation payor. 2013/2015 refers to claims with injuries occurring from October 1, 2012, through September 30, 2013, and prescriptions filled through March 31, 2015.
Each line corresponds to a state.
Key: MEA: morphine equivalent amount.
0
500
1,000
1,500
2,000
2,500
3,000
3,500
4,000
First quarter Second quarter Third quarter Fourth quarter Fifth quarter Sixth quarter Seventh quarter Eighth quarter Ninth quarter Tenth quarter
Ave
rag
e M
EA p
er C
laim
wit
h O
pio
ids
as o
f th
e En
d o
f Giv
en
Qu
arte
r (m
illig
ram
s)
copyright © 2017 workers compensation research institute
109
_____________________________________________________________________________________________I N T E R S T A T E V A R I A T I O N S I N U S E O F O P I O I D S , 4 T H E D I T I O N
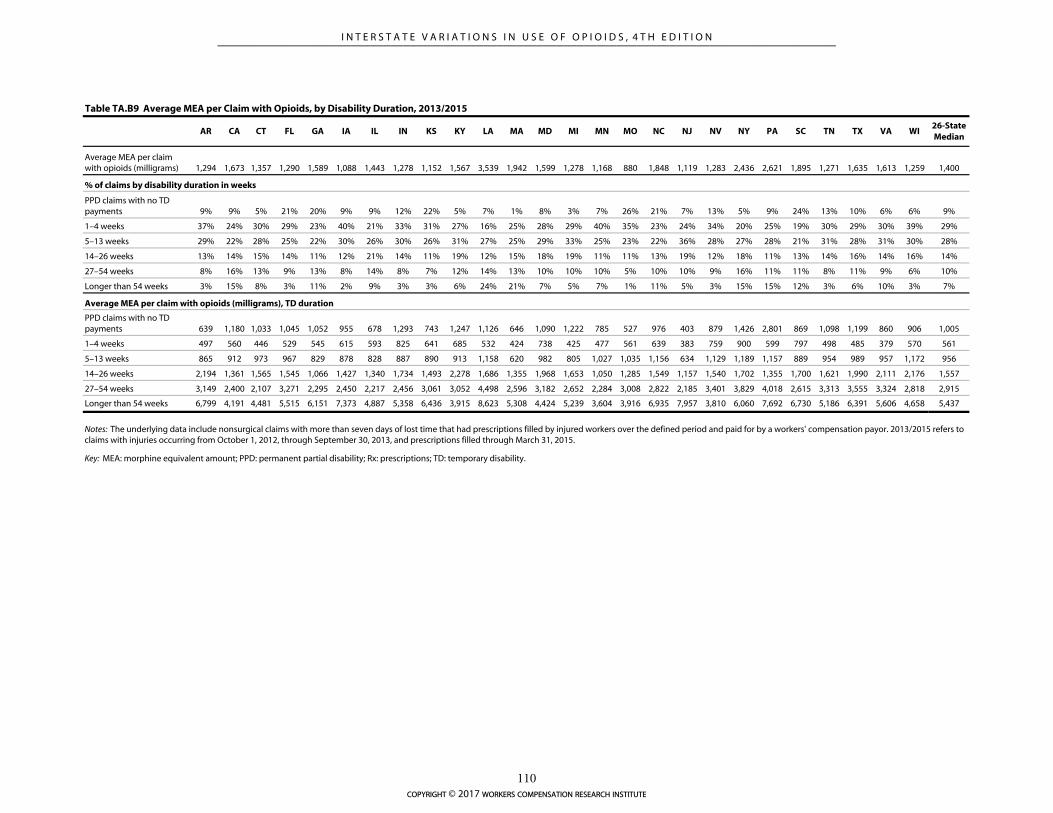
AR CA CT FL GA IA IL IN KS KY LA MA MD MI MN MO NC NJ NV NY PA SC TN TX VA WI26-State Median
Average MEA per claim with opioids (milligrams) 1,294 1,673 1,357 1,290 1,589 1,088 1,443 1,278 1,152 1,567 3,539 1,942 1,599 1,278 1,168 880 1,848 1,119 1,283 2,436 2,621 1,895 1,271 1,635 1,613 1,259 1,400
% of claims by disability duration in weeks
PPD claims with no TD payments 9% 9% 5% 21% 20% 9% 9% 12% 22% 5% 7% 1% 8% 3% 7% 26% 21% 7% 13% 5% 9% 24% 13% 10% 6% 6% 9%
1–4 weeks 37% 24% 30% 29% 23% 40% 21% 33% 31% 27% 16% 25% 28% 29% 40% 35% 23% 24% 34% 20% 25% 19% 30% 29% 30% 39% 29%
5–13 weeks 29% 22% 28% 25% 22% 30% 26% 30% 26% 31% 27% 25% 29% 33% 25% 23% 22% 36% 28% 27% 28% 21% 31% 28% 31% 30% 28%
14–26 weeks 13% 14% 15% 14% 11% 12% 21% 14% 11% 19% 12% 15% 18% 19% 11% 11% 13% 19% 12% 18% 11% 13% 14% 16% 14% 16% 14%
27–54 weeks 8% 16% 13% 9% 13% 8% 14% 8% 7% 12% 14% 13% 10% 10% 10% 5% 10% 10% 9% 16% 11% 11% 8% 11% 9% 6% 10%
Longer than 54 weeks 3% 15% 8% 3% 11% 2% 9% 3% 3% 6% 24% 21% 7% 5% 7% 1% 11% 5% 3% 15% 15% 12% 3% 6% 10% 3% 7%
Average MEA per claim with opioids (milligrams), TD duration
PPD claims with no TD payments 639 1,180 1,033 1,045 1,052 955 678 1,293 743 1,247 1,126 646 1,090 1,222 785 527 976 403 879 1,426 2,801 869 1,098 1,199 860 906 1,005
1–4 weeks 497 560 446 529 545 615 593 825 641 685 532 424 738 425 477 561 639 383 759 900 599 797 498 485 379 570 561
5–13 weeks 865 912 973 967 829 878 828 887 890 913 1,158 620 982 805 1,027 1,035 1,156 634 1,129 1,189 1,157 889 954 989 957 1,172 956
14–26 weeks 2,194 1,361 1,565 1,545 1,066 1,427 1,340 1,734 1,493 2,278 1,686 1,355 1,968 1,653 1,050 1,285 1,549 1,157 1,540 1,702 1,355 1,700 1,621 1,990 2,111 2,176 1,557
27–54 weeks 3,149 2,400 2,107 3,271 2,295 2,450 2,217 2,456 3,061 3,052 4,498 2,596 3,182 2,652 2,284 3,008 2,822 2,185 3,401 3,829 4,018 2,615 3,313 3,555 3,324 2,818 2,915
Longer than 54 weeks 6,799 4,191 4,481 5,515 6,151 7,373 4,887 5,358 6,436 3,915 8,623 5,308 4,424 5,239 3,604 3,916 6,935 7,957 3,810 6,060 7,692 6,730 5,186 6,391 5,606 4,658 5,437
Table TA.B9 Average MEA per Claim with Opioids, by Disability Duration, 2013/2015
Notes: The underlying data include nonsurgical claims with more than seven days of lost time that had prescriptions filled by injured workers over the defined period and paid for by a workers' compensation payor. 2013/2015 refers to claims with injuries occurring from October 1, 2012, through September 30, 2013, and prescriptions filled through March 31, 2015.
Key: MEA: morphine equivalent amount; PPD: permanent partial disability; Rx: prescriptions; TD: temporary disability.
copyright © 2017 workers compensation research institute
110
_____________________________________________________________________________________________I N T E R S T A T E V A R I A T I O N S I N U S E O F O P I O I D S , 4 T H E D I T I O N
REFERENCES
Ahmedani, B., E. Peterson, K. Wells, D. Lanfear, and L. Williams. 2014. Policies and events affecting
prescription opioid use for non-cancer pain among an insured patient population. Pain Physician 17
(3): 205–216.
Alford, D., L. Zisblatt, P. Ng, S. Hayes, S. Peloquin, I. Hardesty, and J. White. 2015. SCOPE of pain: An
evaluation of an opioid risk evaluation and mitigation strategy continuing education program. Pain
Medicine. DOI:10.1111/pme.12878.
American College of Occupational and Environmental Medicine (ACOEM). 2011. ACOEM’s guidelines for the
chronic use of opioids. Elk Grove Village, IL: American College of Occupational and Environmental
Medicine.
American Medical Association. 2006. Current procedural terminology CPT 2006. Chicago, IL: American
Medical Association.
Bao, Y., Y. Pan, A. Taylor, S. Radakrishnan, F. Luo, H. Pincus, and B. Schackman. 2016. Prescription drug
monitoring programs are associated with sustained reductions in opioid prescribing by physicians.
Health Affairs 35 (6): 1,045–1,051.
Brady, J., H. Wunsch, C. DiMaggio, B. Lang, J. Giglio, and G. Li. 2014. Prescription drug monitoring and
dispensing of prescription opioids. Public Health Reports 129 (2): 139–147.
Centers for Disease Control and Prevention (CDC), United States Department of Health and Human
Services. 2010. Unintentional drug poisoning in the United States. Issue Brief.
———. 2012. CDC grand rounds: Prescription drug overdoses — a U.S. epidemic. Morbidity and Mortality
Weekly Report 61 (01): 10–13.
______. 2016. CDC guidelines for prescribing opioids for chronic pain—United States, 2016. Morbidity and
Mortality Weekly Report 65: 1–49.
Cepeda, M., F. Camargo, C. Zea, and L. Valencia. 2007. Tramadol for osteoarthritis: A systematic review and
metaanalysis. The Journal of Rheumatology 34: 543–555.
Chang, H., T. Lyapustina, L. Rutkow, G. Alexander. 2016. Impact of prescription drug monitoring programs
and pill mill laws on high-risk opioid prescribers: A comparative interrupted time series analysis.
Drug and Alcohol Dependence 165 (June 2016). DOI: 10.1016/j.drugalcdep.2016.04.033.
Charleston Daily Mail. 2004. New guidelines for pain medication worry doctors, pain management experts say
DEA proposal would have chilling effect on the way they practice. Retrieved from
http://www.redorbit.com/news/health/107676/new_guidelines_for_pain_medication_worry_doctor
s__pain_management/index.html (accessed January 21, 2016).
Clark, T., J. Eadie, P. Kreiner, and G. Strickler. 2012. Prescription drug monitoring programs: An assessment of
the evidence for best practices. The Prescription Drug Monitoring Program Center for Excellence at
Brandeis University. Prepared for The Pew Charitable Trusts.
Curtis, L., J. Stoddard, J. Radeva, S. Hutchison, P. Dans, A. Wright, R. Woosley, and K. Schulman. 2006a.
Geographic variations in the prescription of Schedule II opioid analgesics among outpatients in the
United States. Health Services Research 41: 837–855.
———. 2006b. Correction to “Geographic variations in the prescription of Schedule II opioid analgesics
among outpatients in the United States.” Health Services Research 41: 856–858.
copyright © 2017 workers compensation research institute
111
_____________________________________________________________________________________________I N T E R S T A T E V A R I A T I O N S I N U S E O F O P I O I D S , 4 T H E D I T I O N
Dart, R., H. Surratt, T. Cicero, M. Parrino, S. Severtson, B. Bucher-Bartelson, and J. Green. 2015. Trends in
opioid analgesic abuse and mortality in the United States. New England Journal of Medicine 372:
241–248.
David, R., S. Jones, B. Ramirez, and A. Swedlow. 2015. Medical Review and dispute resolution in the California
workers’ compensation system. Oakland, CA: California Workers’ Compensation Institute.
Dolinschi, R., and K. Rothkin. 2016. CompScope™ benchmarks: Technical appendix, 16th edition. Cambridge,
MA: Workers Compensation Research Institute.
Donovan, A., G. Wood, D. Rubio, H. Day, and C. Spagnoletti. 2016. Faculty communication knowledge,
attitudes, and skills around chronic non-malignant pain improve with online training. Pain
Medicine. Advance online publication. DOI: 10.1093/pm/pnw029.
Dowell, D., K. Zhang, R. Noonan, and J. Hockenberry. 2016. Mandatory provider review and pain clinic laws
reduce the amounts of opioids prescribed and overdose death rates. Health Affairs 35 (10): 1,876–
1,883.
Drug Enforcement Administration (DEA), United States Department of Justice. 2013. Schedules of controlled
substances: Placement of tramadol into Schedule IV. Retrieved from
http://www.deadiversion.usdoj.gov/fed_regs/rules/2013/fr1104.htm (accessed January 21, 2016).
———. 2015. Drugs of abuse. Retrieved from http://www.justice.gov/dea/pr/multimedia-
library/publications/drug_of_abuse.pdf (accessed January 21, 2016).
Dunn, K., K. Saunders, C. Rutter, C. Banta-Green, J. Merill, M. Sullivan, C. Weisner, M. Silverberg, C.
Campbell, B. Psaty, and M. Von Korff. 2010. Opioid prescriptions for chronic pain and overdose: A
cohort study. Annals of Internal Medicine 152: 85–92.
Federation of State Medical Boards (FSMB). 2013. Model policy on the use of opioid analgesics in the treatment
of chronic pain. Retrieved from
http://www.fsmb.org/Media/Default/PDF/FSMB/Advocacy/pain_policy_july2013.pdf (accessed
March 27, 2017).
———. 2014. Responsible opioid prescribing: A clinician’s guide.
Finklea, K., L. Sacco, and E. Bagalman. 2014. Prescription drug monitoring programs. Congressional Research
Service. Retrieved from https://www.fas.org/sgp/crs/misc/R42593.pdf (accessed January 21, 2016).
Food and Drug Administration (FDA). U.S. Department of Health and Human Services. 2014. Transmucosal
immediate release fentanyl (TIRF), risk evaluation and mitigation strategy (REMS). Retrieved from
http://www.fda.gov/downloads/Drugs/DrugSafety/PostmarketDrugSafetyInformationforPatientsand
Providers/UCM289730.pdf (accessed January 21, 2016).
———. 2015. Introduction for the FDA blueprint for prescriber education for extended-release and long-acting
opioid analgesics. Retrieved from
http://www.accessdata.fda.gov/drugsatfda_docs/rems/ERLA_opioids_2015-10-
23_FDA_Blueprint.pdf (accessed accessed January 21, 2016).
Franklin, G., B. Stover, J. Turner, D. Fulton-Kehoe, and T. Wickizer. 2008. Early opioid prescription and
subsequent disability among workers with back injuries. Spine 33 (2): 199–204.
Franklin, G., J. Mai, J. Turner, M. Sullivan, T. Wickizer, and D. Fulton-Kehoe. 2012. Bending the prescription
opioid dosing and mortality curves: Impact of the Washington State opioid dosing guideline.
American Journal of Industrial Medicine 55 (4): 325–331.
Franklin, G., J. Mai, T. Wickizer, J. Turner, D. Fulton-Kehoe, and L. Grant. 2005. Opioid dosing trends and
mortality in Washington state workers’ compensation, 1996–2002. American Journal of Industrial
copyright © 2017 workers compensation research institute
112
_____________________________________________________________________________________________I N T E R S T A T E V A R I A T I O N S I N U S E O F O P I O I D S , 4 T H E D I T I O N
Medicine 48: 91–99.
Garg, R., D. Fulton-Kehoe, J. Turner, A. Bauer, T. Wickizer, M. Sullivan, and G. Franklin. 2013. Changes in
opioid prescribing for Washington workers’ compensation claimants after implementation of an
opioid dosing guideline for chronic noncancer pain: 2004 to 2010. Journal of Pain 14 (12): 1,620–
1,628.
Green, T., S. Bowman, C. Davis, C. Los, K. McHugh, and P. Friedman. 2015. Discrepancies in addressing
overdose prevention through prescription monitoring programs. Drug and Alcohol Dependence 153:
355–358.
Haegerich T., L. Paulozzi, B. Manns, and C. Jones. 2014. What we know, and don’t know, about the impact
of state policy and systems-level interventions on prescription drug overdose. Drug and Alcohol
Dependence 145: 34–47.
Haffajee, R., A. Jena, S. Weiner. 2015. Mandatory use of prescription drug monitoring programs. Journal of
the American Medical Association 313 (9): 891–892.
Hall, A., J. Logan, R. Toblin, J. Kaplan, J. Kraner, D. Bixler, A. Crosby, and L. Paulozzi. 2008. Patterns of
abuse among unintentional pharmaceutical overdose fatalities. Journal of the American Medical
Association 300: 2,613–2,620.
Han, H., P. Kass, B. Wilsey, and C. Li. 2012. Individual and county level factors associated with use of
multiple prescribers and multiple pharmacies to obtain prescriptions in California. PLoS ONE 7(9):
e46246.
Hegmann, K., M. Weiss, K. Bowden, F. Branco, K. DuBrueler, C. Els, S. Mandel, D. McKinney, R. Miguel, K.
Mueller, R. Nadig, M. Schaffer, L. Studt, J. Talmage, R. Travis, T. Winters, M. Thiese, and J. Harris.
2014. ACOEM practice guidelines: Opioids for treatment of acute, subacute, chronic, and
postoperative pain. Journal of Occupational and Environmental Medicine 56 (12): e143–59.
International Association of Industrial Accident Boards and Commissions (IAIABC). 2013. Reducing
inappropriate opioid use in treatment of injured workers: A policy guide. Madison, WI: IAIABC.
Ireland, J., B. Young, and A. Swedlow. 2014. Part 1: Schedule II & Schedule III opioids: Prescription and
payment trends in California workers’ compensation. CWCI Research Update. Oakland, CA:
California Workers’ Compensation Institute.
Johnson, H., L. Paulozzi, C. Porucznik, K. Mack, and B. Herter. 2014. Decline in drug overdose deaths after
state policy changes—Florida, 2010–2012. Morbidity and Mortality Weekly Report 63 (26): 569–574.
Joint Commission on Accreditation of Healthcare Organizations. 2002. Examples of compliance: Pain
assessment and management. Oakbrook Terrace, IL: Joint Commission Resources.
Jones, C., and J. McAninch. 2015. Emergency department visits and overdose deaths from combined use of
opioids and benzodiazepines. American Journal of Preventive Medicine 49 (4): 493–501.
Jones, J., P. Lurie, and D. Throckmorton. 2016. Effect of US Drug Enforcement Administration’s
rescheduling of hydrocodone combination analgesic products on opioid analgesic prescribing.
JAMA Internal Medicine 176 (3): 399–402.
Jones, J., S. Mogali, and S. Comer. 2012. Polydrug abuse: A review of opioid and benzodiazepine combination
use. Drug and Alcohol Dependence 125 (1-2): 8–18.
Kidner, C., T. Mayer, and R. Gatchel. 2009. Higher opioid doses predict poorer functional outcome in
patients with chronic disabling occupational musculoskeletal disorders. The Journal of Bone and Joint
Surgery 91: 919–927.
Kraman, P. 2004. Drug abuse in America—Prescription drug diversion. The Council of State Governments:
copyright © 2017 workers compensation research institute
113
_____________________________________________________________________________________________I N T E R S T A T E V A R I A T I O N S I N U S E O F O P I O I D S , 4 T H E D I T I O N
Trends Alert. Retrieved from http://www.csg.org/knowledgecenter/docs/TA0404DrugDiversion.pdf
(accessed January 21, 2016).
Laudau C., W. Carr, A. Razzetti, N. Sessier, C. Munera, and S. Ripa. 2007. Buprenorphine transdermal
delivery system in adults with persistent noncancer-related pain syndromes who require opioid
therapy: A multicenter, 5-week run-in and randomized, double-blind maintenance-of-analgesia
study. Clinical Therapeutics 29 (10): 2,179–2,193.
Lavin, R., X. Tao, L. Yuspeh, and E. Bernacki. 2014. Impact of the combined use of benzodiazepines and
opioids on workers’ compensation claim cost. Journal of Occupational and Environmental Medicine
56 (9): 973–978.
Lipton, B., C. Laws, and L. Li. 2009. Narcotics in workers compensation. NCCI Research Brief. Boca Raton, FL:
National Council on Compensation Insurance, Inc.
Lyapustina, T., L. Rutkow, H. Chang, M. Daubresse, A. Ramji, M. Faul, E. Stuart, and G. Alexander. 2015.
Effect of a “pill mill” law on opioid prescribing and utilization: The case of Texas. Drug and Alcohol
Dependence 159: 190–197.
McDonald, D., K. Carlson, and D. Izrael. 2012. Geographic variation in opioid prescribing in the U.S. The
Journal of Pain 13 (10): 988–996.
Medi-Span®. 2005. Master drug data base (MDDB®) v2.5: Documentation manual. Indianapolis, IN: Wolters
Kluwer Health, Inc.
National Governors Association. 2012. Six strategies for reducing prescription drug abuse. Washington, DC.
———. 2014. Reducing prescription drug abuse: Lessons learned from an NGA policy academy. Washington,
DC.
———. 2016. Finding solutions to the prescription opioid and heroin crisis: A road map for states. Washington,
DC.
New York State Office of the Attorney General. 2012. Internet system for tracking over-prescribing (I-STOP), a
proposal addressing New York’s prescription drug abuse and drug diversion epidemic. Retrieved from
http://www.ag.ny.gov/sites/default/files/press-
releases/2012/ISTOP%20REPORT%20FINAL%201.10.12.pdf (accessed January 21, 2016).
New York State Workers’ Compensation Board. 2014. New York non-acute pain medical treatment guidelines.
first edition. Retrieved from
http://www.wcb.ny.gov/content/main/hcpp/MedicalTreatmentGuidelines/Non-
AcutePainMTG2014.pdf (accessed January 21, 2016).
Noble, M., J. Treadwell, S. Tregear, V. Coates, P. Wiffen, C. Akafomo, and K. Schoelles. 2010. Long-term
opioid management for chronic noncancer pain. Cochrane Database of Systematic Reviews. Issue 1.
Art. No.: CD006605. DOI: 10.1002/14651858.CD006605.pub2.
Okie, S. 2010. A flood of opioids, a rising tide of deaths. New England Journal of Medicine 363 (21): 1,981–
1,985.
Oregon Health and Science University. 2006. Opioids and chronic non-malignant pain: A clinicians’ handbook.
Part II, Section 3: Converting opioids after a successful trial: Equianalgesic dosing. Portland, OR.
Pain & Policy Studies Group (PPSG). 2014. Achieving balance in state pain policy: A progress report card (CY
2013). University of Wisconsin. Retrieved from http://www.acscan.org/content/wp-
content/uploads/2014/07/PRC-2013.pdf (accessed January 21, 2016).
Patrick, S., C. Fry, T. Jones, and M. Buntin. 2016. Implementation of prescription drug monitoring programs
associated with reductions in opioid-related death rates. Health Affairs. Published online before print
copyright © 2017 workers compensation research institute
114
_____________________________________________________________________________________________I N T E R S T A T E V A R I A T I O N S I N U S E O F O P I O I D S , 4 T H E D I T I O N
June 2016, DOI:10.1377/hlthaff.2015.1496.Paulozzi, L., and G. Ryan. 2006. Opioid analgesics and
rates of fatal drug poisoning in the United States. American Journal of Preventive Medicine 31: 506–
511.
The Pew Charitable Trusts. 2016. Prescription drug monitoring programs: Evidence-based practices to optimize
prescriber use. Philadelphia, PA.
Pomerleau, A., L. Nelson, J. Hoppe, M. Salsman, P. Weiss, and J. Perrone. 2016. The impact of prescription
drug monitoring programs and prescribing guidelines on emergency department opioid prescribing:
A multi-center survey. Pain Medicine 17 (3). First published online: 19 March 2016. Oxford
University Press.
Prescription Drug Monitoring Program Center of Excellence at Brandeis University (PDMP COE). 2014a.
Briefing on PDMP effectiveness. Waltham, MA.
———. 2014b. Mandating PDMP participation by medical providers: Current status and experience in selected
states. Waltham, MA.
———. 2015. Electronic alerts for prescribers: Massachusetts prescription monitoring program experience.
Waltham, MA.
———. 2016. PDMP prescriber use mandates: Characteristics, current status, and outcomes in selected states.
Waltham, MA. Retrieved from
http://www.pdmpassist.org/pdf/COE_documents/Add_to_TTAC/COE%20briefing%20on%20man
dates%203rd%20revision.pdf (accessed March 27, 2017).
Prescription Drug Monitoring Program (PDMP) Training and Technical Assistance Center. n.d. State profiles.
Retrieved from http://www.pdmpassist.org/content/state-profiles (accessed January 21, 2016).
———. 2015. Status of prescription drug monitoring programs (PDMPs). Retrieved from
http://www.pdmpassist.org/pdf/PDMPProgramStatus2015_v5.pdf (accessed January 21, 2016).
Reifler, L., D. Droz, J. Bailey, S. Schnoll, R. Fant, R. Dart, and B. Bartelson. 2012. Do prescription monitoring
programs impact state trends in opioid abuse/misuse? Pain Medicine 3: 434–442.
Rudd, R., N. Aleshire, J. Zibbell, and R. Gladden. 2016a. Increase in drug and opioid overdose deaths—
United States, 2000–2014. Morbidity and Mortality Weekly Report 64 (50 & 51): 1,378–1,382.
Rudd, R., P. Seth, F. David, and L. Scholl. 2016b. Increase in drug and opioid-involved overdose deaths—
United States, 2010–2015. Morbidity and Mortality Weekly Report 65 (50 & 51): 1,445–1,452.
Rutkow, L., H. Chang, M. Daubresse, G. Alexander. 2015. Effect of Florida’s prescription drug monitoring
program and pill mill laws on opioid prescribing and use. JAMA Internal Medicine 175 (10). DOI:
10.1001/jamainternmed.2015.3931.
Savych, B., and V. Thumula. 2016. Comparing outcomes for injured workers in Michigan. Cambridge, MA:
Workers Compensation Research Institute.
Stapleton, D., G. Livermore, J. Cores, M. Nowak, and E. Eiseman. 2001. Evaluation of the New York State
ONECARD Rx workers’ compensation benefit: Final report. Prepared for State of New York,
Department of Civil Service. Project Officer: Stephanie Washington. Prepared by the Lewin Group,
Inc. and Cornell University.
Smith, V., K. Gifford, E. Ellis, B. Edwards, R. Rudowitz, E. Hinton, L. Antonisse, and A. Valentine. 2016.
Implementing coverage and payment initiatives results from a 50-state Medicaid budget survey for state
fiscal years 2016 and 2017. The Henry J. Kaiser Family Foundation and National Association of
Medicaid Directors.
Substance Abuse and Mental Health Services Administration, Center for Behavioral Health Statistics and
copyright © 2017 workers compensation research institute
115
_____________________________________________________________________________________________I N T E R S T A T E V A R I A T I O N S I N U S E O F O P I O I D S , 4 T H E D I T I O N
Quality. 2014. The DAWN Report: Benzodiazepines in combination with opioid pain relievers or
alcohol: Greater risk of more serious ED visit outcomes. Rockville, MD.
Tao, X., R. Lavin, L. Yuspeh, V. Weaver, and E. Bernacki. 2015. The association of the use of opioid and
psychotropic medications with workers’ compensation claim costs and lost work time. Journal of
Occupational and Environmental Medicine 57 (2): 196–201.
Texas Department of Insurance (TDI), Texas Workers’ Compensation Research and Evaluation Group. 2013.
Impact of the Texas pharmacy closed formulary: A preliminary report based on 12-month injuries with
9-month services. Retrieved from
http://www.tdi.texas.gov/reports/wcreg/documents/Pharma_070913.pdf (accessed January 21,
2016).
Thomas, C., M. Kim, R. Nikitin, P. Kreiner, T. Clark, and G. Carrow. 2014. Prescriber response to
unsolicited prescription drug monitoring program reports in Massachusetts. Pharmacoepidemiology
and Drug Safety. Published online in Wiley Online Library (wileyonlinelibrary.com) DOI:
10.1002/pds.3666.
Thumula, V. 2014. The impact of physician dispensing on opioid use. Cambridge, MA: Workers Compensation
Research Institute.
Thumula, V., D. Wang, and T. Liu. 2014. Interstate variations in use of narcotics, 2nd edition. Cambridge, MA:
Workers Compensation Research Institute.
———. 2016. Interstate variations in use of opioids, 3rd edition. Cambridge, MA: Workers Compensation
Research Institute.
Trust for America’s Health. 2013. Prescription drug abuse: Strategies to stop the epidemic. Washington, DC.
United States General Accounting Office (GAO). 2002. Prescription drugs: State monitoring programs provide
useful tool to reduce diversion. GAO-02-634. Retrieved from
http://www.gao.gov/new.items/d02634.pdf (accessed January 21, 2016).
Volinn, E., J. Fargo, and P. Fine. 2009. Opioid therapy for nonspecific low back pain and the outcome of
chronic work loss. Pain 142: 194–201.
Wang, D. 2017. Longer-term dispensing of opioids, 4th edition. Cambridge, MA: Workers Compensation
Research Institute.
Wang, D., and T. Liu. 2011. Prescription benchmarks, 2nd edition: Trends and interstate comparisons.
Cambridge, MA: Workers Compensation Research Institute.
Wang, D., K. Mueller, and D. Hashimoto. 2011. Interstate variations in use of narcotics. Cambridge, MA:
Workers Compensation Research Institute.
Webster, B., S. Verma, and R. Gatchel. 2007. Relationship between early opioid prescribing for acute
occupational low back pain and disability duration, medical costs, subsequent surgery and late
opioid use. Spine 32: 2,127–2,132.
Workers Compensation Research Institute (WCRI) and International Association of Industrial Accident
Boards and Commissions (IAIABC). 2016. Workers’ compensation laws as of January 1, 2016.
Cambridge, MA: Workers Compensation Research Institute.
Worley, J. 2012. Prescription drug monitoring programs, a response to doctor shopping: Purpose,
effectiveness, and directions for future research. Issues in Mental Health Nursing 33: 319–328.
Yee, C., S. Pizer, and O. Fomenko. 2015. Why surgery rates vary. Cambridge, MA: Workers Compensation
Research Institute.
copyright © 2017 workers compensation research institute
116
_____________________________________________________________________________________________I N T E R S T A T E V A R I A T I O N S I N U S E O F O P I O I D S , 4 T H E D I T I O N
WCRI Publications
Medical Costs, Utilization, and Health Care Delivery the effects of provider choice policies on workers’ compensation costs. David Neumark and Bogdan
Savych. April 2017. wc-17-21. evaluation of the 2015 and 2016 fee schedule changes in delaware. Olesya Fomenko, Rui Yang, and Te-
Chun Liu. February 2017. wc-17-18. wcri medical price index for workers’ compensation, eighth edition (mpi-wc). Rui Yang and Olesya
Fomenko. November 2016. wc-16-74. designing workers’ compensation medical fee schedules, 2016. Olesya Fomenko and Te-Chun Liu. November
2016. wc-16-71. compscope™ medical benchmarks for california, 17th edition. Rui Yang and Karen Rothkin. October 2016.
wc-16-53. compscope™ medical benchmarks for florida, 17th edition. Rui Yang and Roman Dolinschi. October 2016.
wc-16-54. compscope™ medical benchmarks for georgia, 17th edition. Rui Yang. October 2016. wc-16-55. compscope™ medical benchmarks for illinois, 17th edition. Evelina Radeva. October 2016. wc-16-56. compscope™ medical benchmarks for indiana, 17th edition. Carol A. Telles. October 2016. wc-16-57. compscope™ medical benchmarks for kentucky, 17th edition. Carol A. Telles. October 2016. wc-16-58. compscope™ medical benchmarks for louisiana, 17th edition. Carol A. Telles. October 2016. wc-16-59. compscope™ medical benchmarks for massachusetts, 17th edition. Evelina Radeva. October 2016. wc-16-60. compscope™ medical benchmarks for michigan, 17th edition. Evelina Radeva. October 2016. wc-16-61. compscope™ medical benchmarks for minnesota, 17th edition. Sharon E. Belton. October 2016. wc-16-62. compscope™ medical benchmarks for new jersey, 17th edition. Carol A. Telles. October 2016. wc-16-63. compscope™ medical benchmarks for north carolina, 17th edition. Carol A. Telles. October 2016. wc-16-64. compscope™ medical benchmarks for pennsylvania, 17th edition. Evelina Radeva. October 2016. wc-16-65. compscope™ medical benchmarks for texas, 17th edition. Carol A. Telles. October 2016. wc-16-66. compscope™ medical benchmarks for virginia, 17th edition. Bogdan Savych. October 2016. wc-16-67. compscope™ medical benchmarks for wisconsin, 17th edition. Sharon E. Belton. October 2016. wc-16-68. hospital outpatient payment index: interstate variations and policy analysis, 5th edition. Olesya
Fomenko and Rui Yang. August 2016. wc-16-72. monitoring connecticut reforms on physician dispensing. Dongchun Wang, Vennela Thumula, and Te-Chun
Liu. July 2016. wc-16-44. early impact of florida reforms on physician dispensing. Dongchun Wang, Vennela Thumula, and Te-Chun
Liu. July 2016. wc-16-45. impact of georgia reforms on physician dispensing. Dongchun Wang, Vennela Thumula, and Te-Chun Liu.
July 2016. wc-16-46. monitoring illinois reforms on physician dispensing. Dongchun Wang, Vennela Thumula, and Te-Chun Liu.
July 2016. wc-16-47. monitoring indiana reforms on physician dispensing. Dongchun Wang, Vennela Thumula, and Te-Chun Liu.
July 2016. wc-16-48. monitoring michigan reforms on physician dispensing. Dongchun Wang, Vennela Thumula, and Te-Chun
Liu. July 2016. wc-16-49. impact of south carolina reforms on physician dispensing. Dongchun Wang, Vennela Thumula, and Te-
Chun Liu. July 2016. wc-16-50. monitoring tennessee reforms on physician dispensing. Dongchun Wang, Vennela Thumula, and Te-Chun
Liu. July 2016. wc-16-51. longer-term use of opioids, 3rd edition. Dongchun Wang. June 2016. wc-16-42.
copyright © 2017 workers compensation research institute
interstate variations in use of opioids, 3rd edition. Vennela Thumula, Dongchun Wang, and Te-Chun Liu. June 2016. wc-16-22.
payments to ambulatory surgery centers, 2nd edition. Bogdan Savych. May 2016. wc-16-39. comparing payments to ambulatory surgery centers and hospital outpatient departments, 2nd edition.
Bogdan Savych. May 2016. wc-16-40. crossing state lines for ambulatory surgical care: exploring claims from new york. Bogdan Savych. May
2016. wc-16-41. do higher fee schedules increase the number of workers’ compensation cases? Olesya Fomenko and
Jonathan Gruber. April 2016. wc-16-21. physician dispensing of higher-priced new drug strengths and formulation. Dongchun Wang, Vennela
Thumula, and Te-Chun Liu. April 2016. wc-16-18. texas-like formulary for north carolina state employees. Vennela Thumula and Te-Chun Liu. March 2016.
wc-16-19. evaluation of the 2015 fee schedule rates in illinois. Olesya Fomenko. February 2016. wc-16-20. wcri medical price index for workers’ compensation, seventh edition (mpi-wc). Rui Yang and Olesya
Fomenko. November 2015. wc-15-47. wcri flashreport: evaluation of the 2015 professional fee schedule update for florida. Olesya Fomenko.
November 2015. fr-15-01. will the affordable care act shift claims to workers’ compensation payors? Richard A. Victor, Olesya
Fomenko, and Jonathan Gruber. September 2015. wc-15-26. why surgery rates vary. Christine A. Yee, Steve Pizer, and Olesya Fomenko. June 2015. wc-15-24. workers’ compensation medical cost containment: a national inventory, 2015. Ramona P. Tanabe. April
2015. wc-15-27. hospital outpatient cost index for workers’ compensation, 4th edition. Olesya Fomenko and Rui Yang.
February 2015. wc-15-23. are physician dispensing reforms sustainable? Dongchun Wang, Vennela Thumula, and Te-Chun Liu. January
2015. wc-15-01. hospital outpatient cost index for workers’ compensation, 3rd edition. Olesya Fomenko and Rui Yang.
December 2014. wc-14-66. the impact of physician dispensing on opioid use. Vennela Thumula. December 2014. wc-14-56. early impact of tennessee reforms on physician dispensing. Dongchun Wang, Vennela Thumula, and Te-
Chun Liu. December 2014. wc-14-55. early impact of south carolina reforms on physician dispensing. Dongchun Wang, Vennela Thumula, and
Te-Chun Liu. November 2014. wc-14-54. early impact of connecticut reforms on physician dispensing. Dongchun Wang, Vennela Thumula, and Te-
Chun Liu. November 2014. wc-14-53. estimating the effect of california’s fee schedule changes: lessons from WCRI studies. Rui Yang. October
2014. wc-14-49. impact of physician dispensing reform in georgia, 2nd edition. Dongchun Wang, Te-Chun Liu, and Vennela
Thumula. September 2014. wc-14-50. physician dispensing in pennsylvania, 2nd edition. Dongchun Wang, Te-Chun Liu, and Vennela Thumula.
September 2014. wc-14-51. wcri medical price index for workers’ compensation, sixth edition (mpi-wc). Rui Yang and Olesya
Fomenko. July 2014. wc-14-34. impact of a texas-like formulary in other states. Vennela Thumula and Te-Chun Liu. June 2014. wc-14-31. comparing payments to ambulatory surgery centers and hospital outpatient departments. Bogdan
Savych. June 2014. wc-14-30. payments to ambulatory surgery centers. Bogdan Savych. June 2014. wc-14-29. interstate variations in use of narcotics, 2nd edition. Vennela Thumula, Dongchun Wang, and Te-Chun
Liu. May 2014. wc-14-18. longer-term use of opioids, 2nd edition. Dongchun Wang. May 2014. wc-14-19. the effect of reducing the illinois fee schedule. Rui Yang and Olesya Fomenko. January 2014. wc-14-01. the prevalence and costs of physician-dispensed drugs. Dongchun Wang, Te-Chun Liu, and Vennela
Thumula. September 2013. wc-13-39.
copyright © 2017 workers compensation research institute
physician dispensing in the pennsylvania workers’ compensation system. Dongchun Wang, Te-Chun Liu, and Vennela Thumula. September 2013. wc-13-23.
physician dispensing in the maryland workers’ compensation system. Dongchun Wang, Te-Chun Liu, and Vennela Thumula. September 2013. wc-13-22.
impact of banning physician dispensing of opioids in florida. Vennela Thumula. July 2013. wc-13-20. impact of reform on physician dispensing and prescription prices in georgia. Dongchun Wang, Te-Chun
Liu, and Vennela Thumula. July 2013. wc-13-21. a new benchmark for workers' compensation fee schedules: prices paid by commercial insurers?. Olesya
Fomenko and Richard A. Victor. June 2013. wc-13-17. comparing workers’ compensation and group health hospital outpatient payments. Olesya Fomenko. June
2013. wc-13-18. wcri medical price index for workers’ compensation, fifth edition (mpi-wc). Rui Yang and Olesya
Fomenko. June 2013. wc-13-19. workers’ compensation medical cost containment: a national inventory, 2013. Ramona P. Tanabe.
February 2013. wc-13-02. hospital outpatient cost index for workers’ compensation, 2nd edition. Olesya Fomenko and Rui Yang.
January 2013. wc-13-01. longer-term use of opioids. Dongchun Wang, Dean Hashimoto, and Kathryn Mueller. October 2012. wc-12-39. impact of treatment guidelines in texas. Philip S. Borba and Christine A. Yee. September 2012. wc-12-23. physician dispensing in workers’ compensation. Dongchun Wang. July 2012. wc-12-24. designing workers’ compensation medical fee schedules. Olesya Fomenko and Te-Chun Liu. June 2012.
wc-12-19. compscope™ medical benchmarks for maryland, 12th edition. Rui Yang. May 2012. wc-12-06. why surgeon owners of ambulatory surgical centers do more surgery than non-owners. Christine A. Yee.
May 2012. wc-12-17. wcri medical price index for workers’ compensation, fourth edition (mpi-wc). Rui Yang and Olesya
Fomenko. March 2012. wc-12-20. hospital outpatient cost index for workers’ compensation. Rui Yang and Olesya Fomenko. January 2012.
wc-12-01. wcri medical price index for workers’ compensation, third edition (mpi-wc). Rui Yang. August 2011. wc-
11-37. prescription benchmarks, 2nd edition: trends and interstate comparisons. Dongchun Wang and Te-Chun
Liu. July 2011. wc-11-31. prescription benchmarks for florida, 2nd edition. Dongchun Wang and Te-Chun Liu. July 2011. wc-11-32. prescription benchmarks for washington. Dongchun Wang and Te-Chun Liu. July 2011. wc-11-33. interstate variations in use of narcotics. Dongchun Wang, Kathryn Mueller, and Dean Hashimoto. July 2011.
wc-11-01. impact of preauthorization on medical care in texas. Christine A. Yee, Philip S. Borba, and Nicole Coomer.
June 2011. wc-11-34. workers' compensation medical cost containment: a national inventory, 2011. April 2011. wc-11-35. prescription benchmarks for minnesota. Dongchun Wang and Richard A. Victor. October 2010. wc-10-53. prescription benchmarks for florida. Dongchun Wang and Richard A. Victor. March 2010. wc-10-06. prescription benchmarks for illinois. Dongchun Wang and Richard A. Victor. March 2010. wc-10-05. prescription benchmarks for louisiana. Dongchun Wang and Richard A. Victor. March 2010. wc-10-10. prescription benchmarks for maryland. Dongchun Wang and Richard A. Victor. March 2010. wc-10-08. prescription benchmarks for massachusetts. Dongchun Wang and Richard A. Victor. March 2010. wc-10-07. prescription benchmarks for michigan. Dongchun Wang and Richard A. Victor. March 2010. wc-10-09. prescription benchmarks for north carolina. Dongchun Wang and Richard A. Victor. March 2010. wc-10-16. prescription benchmarks for new jersey. Dongchun Wang and Richard A. Victor. March 2010. wc-10-15. prescription benchmarks for pennsylvania. Dongchun Wang and Richard A. Victor. March 2010. wc-10-11. prescription benchmarks for tennessee. Dongchun Wang and Richard A. Victor. March 2010. wc-10-13. prescription benchmarks for texas. Dongchun Wang and Richard A. Victor. March 2010. wc-10-12. prescription benchmarks for wisconsin. Dongchun Wang and Richard A. Victor. March 2010. wc-10-14.
copyright © 2017 workers compensation research institute
fee schedules for hospitals and ambulatory surgical centers: a guide for policymakers. Nicole M. Coomer. February 2010. wc-10-01.
national inventory of workers’ compensation fee schedules for hospitals and ambulatory surgical centers. Nicole M. Coomer. February 2010. wc-10-02.
workers’ compensation medical cost containment: a national inventory. August 2009. wc-09-15. wcri flashreport: information requested by medicare to support decision-making on medicare
secondary payer regulations. Ramona P. Tanabe. April 2009. fr-09-01. wcri medical price index for workers’ compensation, second edition (mpi-wc). Stacey M. Eccleston with the
assistance of Juxiang Liu. June 2008. wc-08-29. wcri flashreport: connecticut fee schedule rates compared to state medicare rates: common medical
services delivered to injured workers by nonhospital providers. Stacey M. Eccleston. December 2007. fr-07-04.
wcri flashreport: what are the most important medical conditions in workers’ compensation. August 2007. fr-07-03.
wcri flashreport: what are the most important medical conditions in new york workers’ compensation. July 2007. fr-07-02.
wcri flashreport: analysis of illustrative medical fee schedules in wisconsin. Stacey M. Eccleston, Te-Chun Liu, and Richard A. Victor. March 2007. fr-07-01.
wcri medical price index for workers’ compensation: the mpi-wc, first edition. Stacey M. Eccleston. February 2007. wc-07-33.
benchmarks for designing workers’ compensation medical fee schedules: 2006. Stacey M. Eccleston and Te-Chun Liu. October 2006. wc-06-14.
analysis of the workers’ compensation medical fee schedules in illinois. Stacey M. Eccleston. July 2006. wc-06-28.
state policies affecting the cost and use of pharmaceuticals in workers’ compensation: a national inventory. Richard A. Victor and Petia Petrova. June 2006. wc-06-30.
the cost and use of pharmaceuticals in workers’ compensation: a guide for policymakers. Richard A. Victor and Petia Petrova. June 2006. wc-06-13.
how does the massachusetts medical fee schedule compare to prices actually paid in workers’ compensation? Stacey M. Eccleston. April 2006. wc-06-27.
the impact of provider choice on workers’ compensation costs and outcomes. Richard A. Victor, Peter S. Barth, and David Neumark, with the assistance of Te-Chun Liu. November 2005. wc-05-14.
adverse surprises in workers’ compensation: cases with significant unanticipated medical care and costs. Richard A. Victor. June 2005. wc-05-16.
wcri flashreport: analysis of the proposed workers’ compensation fee schedule in tennessee. Stacey M. Eccleston and Xiaoping Zhao. January 2005. fr-05-01.
wcri flashreport: analysis of services delivered at chiropractic visits in texas compared to other states. Stacey M. Eccleston and Xiaoping Zhao. July 2004. fr-04-07.
wcri flashreport: supplement to benchmarking the 2004 pennsylvania workers’ compensation medical fee schedule. Stacey M. Eccleston and Xiaoping Zhao. May 2004. fr-04-06.
wcri flashreport: is chiropractic care a cost driver in texas? reconciling studies by wcri and mgt/texas chiropractic association. April 2004. fr-04-05.
wcri flashreport: potential impact of a limit on chiropractic visits in texas. Stacey M. Eccleston. April 2004. fr-04-04.
wcri flashreport: are higher chiropractic visits per claim driven by “outlier” providers? Richard A. Victor. April 2004. fr-04-03.
wcri flashreport: benchmarking the 2004 pennsylvania workers’ compensation medical fee schedule. Stacey M. Eccleston and Xiaoping Zhao. March 2004. fr-04-01.
evidence of effectiveness of policy levers to contain medical costs in workers’ compensation. Richard A. Victor. November 2003. wc-03-08.
wcri medical price index for workers’ compensation. Dongchun Wang and Xiaoping Zhao. October 2003. wc-03-05.
wcri flashreport: where the medical dollar goes? how california compares to other states. Richard A. Victor and Stacey M. Eccleston. March 2003. fr-03-03.
copyright © 2017 workers compensation research institute
patterns and costs of physical medicine: comparison of chiropractic and physician-directed care. Richard A. Victor and Dongchun Wang. December 2002. wc-02-07.
provider choice laws, network involvement, and medical costs. Richard A. Victor, Dongchun Wang, and Philip Borba. December 2002. wc-02-05.
wcri flashreport: analysis of payments to hospitals and surgery centers in florida workers’ compensation. Stacey M. Eccleston and Xiaoping Zhao. December 2002. fr-02-03.
benchmarks for designing workers’ compensation medical fee schedules: 2001–2002. Stacey M. Eccleston, Aniko Laszlo, Xiaoping Zhao, and Michael Watson. August 2002. wc-02-02.
wcri flashreport: changes in michigan’s workers’ compensation medical fee schedule: 1996–2002. Stacey M. Eccleston. December 2002. fr-02-02.
targeting more costly care: area variation in texas medical costs and utilization. Richard A. Victor and N. Michael Helvacian. May 2002. wc-02-03.
wcri flashreport: comparing the pennsylvania workers’ compensation fee schedule with medicare rates: evidence from 160 important medical procedures. Richard A. Victor, Stacey M. Eccleston, and Xiaoping Zhao. November 2001. fr-01-07.
wcri flashreport: benchmarking pennsylvania’s workers’ compensation medical fee schedule. Stacey M. Eccleston and Xiaoping Zhao. October 2001. fr-01-06.
wcri flashreport: benchmarking california’s workers’ compensation medical fee schedules. Stacey M. Eccleston. August 2001. fr-01-04.
managed care and medical cost containment in workers’ compensation: a national inventory, 2001–2002. Ramona P. Tanabe and Susan M. Murray. December 2001. wc-01-04.
wcri flashreport: benchmarking florida’s workers’ compensation medical fee schedules. Stacey M. Eccleston and Aniko Laszlo. August 2001. fr-01-03.
the impact of initial treatment by network providers on workers’ compensation medical costs and disability payments. Sharon E. Fox, Richard A. Victor, Xiaoping Zhao, and Igor Polevoy. August 2001. dm-01-01.
the impact of workers’ compensation networks on medical and disability payments. William G. Johnson, Marjorie L. Baldwin, and Steven C. Marcus. November 1999. wc-99-5.
fee schedule benchmark analysis: ohio. Philip L. Burstein. December 1996. fs-96-1. the rbrvs as a model for workers’ compensation medical fee schedules: pros and cons. Philip L. Burstein.
July 1996. wc-96-5. benchmarks for designing workers’ compensation medical fee schedules: 1995–1996. Philip L. Burstein.
May 1996. wc-96-2. fee schedule benchmark analysis: north carolina. Philip L. Burstein. December 1995. fs-95-2. fee schedule benchmark analysis: colorado. Philip L. Burstein. August 1995. fs-95-1. benchmarks for designing workers’ compensation medical fee schedules: 1994–1995. Philip L. Burstein.
December 1994. wc-94-7. review, regulate, or reform: what works to control workers’ compensation medical costs. Thomas W.
Grannemann, ed. September 1994. wc-94-5. fee schedule benchmark analysis: michigan. Philip L. Burstein. September 1994. fs-94-1. medicolegal fees in california: an assessment. Leslie I. Boden. March 1994. wc-94-1. benchmarks for designing workers’ compensation medical fee schedules. Stacey M. Eccleston, Thomas W.
Grannemann, and James F. Dunleavy. December 1993. wc-93-4. how choice of provider and recessions affect medical costs in workers’ compensation. Richard B. Victor
and Charles A. Fleischman. June 1990. wc-90-2. medical costs in workers’ compensation: trends & interstate comparisons. Leslie I. Boden and Charles A.
Fleischman. December 1989. wc-89-5.
Worker Outcomes comparing outcomes for injured workers in indiana, 2016 interviews. Bogdan Savych and Vennela Thumula.
June 2017. wc-17-22. comparing outcomes for injured workers in massachusetts, 2016 interviews. Bogdan Savych and Vennela
Thumula. June 2017. wc-17-23.
copyright © 2017 workers compensation research institute
comparing outcomes for injured workers in michigan, 2016 interviews. Bogdan Savych and Vennela Thumula. June 2017. wc-17-24.
comparing outcomes for injured workers in north carolina, 2016 interviews. Bogdan Savych and Vennela Thumula. June 2017. wc-17-25.
comparing outcomes for injured workers in virginia, 2016 interviews. Bogdan Savych and Vennela Thumula. June 2017. wc-17-26.
comparing outcomes for injured workers in wisconsin, 2016 interviews. Bogdan Savych and Vennela Thumula. June 2017. wc-17-27.
comparing outcomes for injured workers in arkansas. Bogdan Savych and Vennela Thumula. May 2016. wc-16-23.
comparing outcomes for injured workers in connecticut. Bogdan Savych and Vennela Thumula. May 2016. wc-16-24.
comparing outcomes for injured workers in florida. Bogdan Savych and Vennela Thumula. May 2016. wc-16-25.
comparing outcomes for injured workers in georgia. Bogdan Savych and Vennela Thumula. May 2016. wc-16-26.
comparing outcomes for injured workers in indiana. Bogdan Savych and Vennela Thumula. May 2016. wc-16-27.
comparing outcomes for injured workers in iowa. Bogdan Savych and Vennela Thumula. May 2016. wc-16-28. comparing outcomes for injured workers in kentucky. Bogdan Savych and Vennela Thumula. May 2016. wc-
16-29. comparing outcomes for injured workers in massachusetts. Bogdan Savych and Vennela Thumula. May
2016. wc-16-30. comparing outcomes for injured workers in michigan. Bogdan Savych and Vennela Thumula. May 2016. wc-
16-31. comparing outcomes for injured workers in minnesota. Bogdan Savych and Vennela Thumula. May 2016. wc-
16-32. comparing outcomes for injured workers in north carolina. Bogdan Savych and Vennela Thumula. May
2016. wc-16-33. comparing outcomes for injured workers in pennsylvania. Bogdan Savych and Vennela Thumula. May 2016.
wc-16-34. comparing outcomes for injured workers in tennessee. Bogdan Savych and Vennela Thumula. May 2016. wc-
16-35. comparing outcomes for injured workers in virginia. Bogdan Savych and Vennela Thumula. May 2016. wc-
16-36. comparing outcomes for injured workers in wisconsin. Bogdan Savych and Vennela Thumula. May 2016. wc-
16-37. predictors of worker outcomes in arkansas. Bogdan Savych, Vennela Thumula, and Richard A. Victor. January
2015. wc-15-02. predictors of worker outcomes in connecticut. Bogdan Savych, Vennela Thumula, and Richard A. Victor.
January 2015. wc-15-03. predictors of worker outcomes in iowa. Bogdan Savych, Vennela Thumula, and Richard A. Victor. January
2015. wc-15-04. predictors of worker outcomes in tennessee. Bogdan Savych, Vennela Thumula, and Richard A. Victor.
January 2015. wc-15-05. predictors of worker outcomes in indiana. Bogdan Savych, Vennela Thumula, and Richard A. Victor. June
2014. wc-14-20. predictors of worker outcomes in massachusetts. Bogdan Savych, Vennela Thumula, and Richard A. Victor.
June 2014. wc-14-21. predictors of worker outcomes in michigan. Bogdan Savych, Vennela Thumula, and Richard A. Victor. June
2014. wc-14-22. predictors of worker outcomes in minnesota. Bogdan Savych, Vennela Thumula, and Richard A. Victor. June
2014. wc-14-23. predictors of worker outcomes in north carolina. Vennela Thumula, Bogdan Savych, and Richard A. Victor.
June 2014. wc-14-24.
copyright © 2017 workers compensation research institute
predictors of worker outcomes in pennsylvania. Vennela Thumula, Bogdan Savych, and Richard A. Victor. June 2014. wc-14-25.
predictors of worker outcomes in virginia. Vennela Thumula, Bogdan Savych, and Richard A. Victor. June 2014. wc-14-26.
predictors of worker outcomes in wisconsin. Vennela Thumula, Bogdan Savych, and Richard A. Victor. June 2014. wc-14-27.
how have worker outcomes and medical costs changed in wisconsin? Sharon E. Belton and Te-Chun Liu. May 2010. wc-10-04.
comparing outcomes for injured workers in michigan. Sharon E. Belton and Te-Chun Liu. June 2009. wc-09-31.
comparing outcomes for injured workers in maryland. Sharon E. Belton and Te-Chun Liu. June 2008. wc-08-15.
comparing outcomes for injured workers in nine large states. Sharon E. Belton, Richard A. Victor, and Te-Chun Liu, with the assistance of Pinghui Li. May 2007. wc-07-14.
comparing outcomes for injured workers in seven large states. Sharon E. Fox, Richard A. Victor, and Te-Chun Liu, with the assistance of Pinghui Li. February 2006. wc-06-01.
wcri flashreport: worker outcomes in texas by type of injury. Richard A. Victor. February 2005. fr-05-02. outcomes for injured workers in california, massachusetts, pennsylvania, and texas. Richard A. Victor,
Peter S. Barth, and Te-Chun Liu, with the assistance of Pinghui Li. December 2003. wc-03-07. outcomes for injured workers in texas. Peter S. Barth and Richard A. Victor, with the assistance of Pinghui Li
and Te-Chun Liu. July 2003. wc-03-02. the workers’ story: results of a survey of workers injured in wisconsin. Monica Galizzi, Leslie I. Boden,
and Te-Chun Liu. December 1998. wc-98-5. workers’ compensation medical care: effective measurement of outcomes. Kate Kimpan. October 1996.
wc-96-7.
Benefits and Return to Work adequacy of workers’ compensation income benefits in michigan. Bogdan Savych and H. Allan Hunt. June
2017. wc-17-20. return to work after a lump-sum settlement. Bogdan Savych. July 2012. wc-12-21. factors influencing return to work for injured workers: lessons from pennsylvania and wisconsin.
Sharon E. Belton. November 2011. wc-11-39. the impact of the 2004 ppd reforms in tennessee: early evidence. Evelina Radeva and Carol Telles. May 2008.
fr-08-02. factors that influence the amount and probability of permanent partial disability benefits. Philip S.
Borba and Mike Helvacian. June 2006. wc-06-16. return-to-work outcomes of injured workers: evidence from california, massachusetts, pennsylvania,
and texas. Sharon E. Fox, Philip S. Borba, and Te-Chun Liu. May 2005. wc-05-15. who obtains permanent partial disability benefits: a six state analysis. Peter S. Barth, N. Michael
Helvacian, and Te-Chun Liu. December 2002. wc-02-04. wcri flashreport: benchmarking oregon’s permanent partial disability benefits. Duncan S. Ballantyne and
Michael Manley. July 2002. fr-02-01. wcri flashreport: benchmarking florida’s permanent impairment benefits. Richard A. Victor and Duncan
S. Ballantyne. September 2001. fr-01-05. permanent partial disability benefits: interstate differences. Peter S. Barth and Michael Niss. September
1999. wc-99-2. measuring income losses of injured workers: a study of the wisconsin system—A WCRI Technical Paper.
Leslie I. Boden and Monica Galizzi. November 1998. permanent partial disability in tennessee: similar benefits for similar injuries? Leslie I. Boden. November
1997. wc-97-5. what are the most important factors shaping return to work? evidence from wisconsin. Monica Galizzi
and Leslie I. Boden. October 1996. wc-96-6.
copyright © 2017 workers compensation research institute
do low ttd maximums encourage high ppd utilization: re-examining the conventional wisdom. John A. Gardner. January 1992. wc-92-2.
benefit increases and system utilization: the connecticut experience. John A. Gardner. December 1991. wc-91-5.
designing benefit structures for temporary disability: a guide for policymakers—Two-Volume Publication. Richard B. Victor and Charles A. Fleischman. December 1989. wc-89-4.
return to work incentives: lessons for policymakers from economic studies. John A. Gardner. June 1989. wc-89-2.
income replacement for long-term disability: the role of workers’ compensation and ssdi. Karen R. DeVol. December 1986. sp-86-2.
Cost Drivers and Benchmarks of System Performance compscope™ benchmarks for california, 17th edition. Rui Yang. April 2017. wc-17-01. compscope™ benchmarks for florida, 17th edition. Rui Yang. April 2017. wc-17-02. compscope™ benchmarks for georgia, 17th edition. Rui Yang and William-Monnin Browder. April 2017. wc-
17-03. compscope™ benchmarks for illinois, 17th edition. Evelina Radeva. April 2017. wc-17-04. compscope™ benchmarks for indiana, 17th edition. Carol A. Telles. April 2017. wc-17-05. compscope™ benchmarks for kentucky, 17th edition. William-Monnin Browder. April 2017. wc-17-06. compscope™ benchmarks for louisiana, 17th edition. Carol A. Telles. April 2017. wc-17-07. compscope™ benchmarks for massachusetts, 17th edition. Evelina Radeva. April 2017. wc-17-08. compscope™ benchmarks for michigan, 17th edition. Evelina Radeva. April 2017. wc-17-09. compscope™ benchmarks for minnesota, 17th edition. Sharon E. Belton. April 2017. wc-17-10. compscope™ benchmarks for new jersey, 17th edition. Evelina Radeva. April 2017. wc-17-11. monitoring the north carolina system: compscope™ benchmarks, 17th edition. Carol A. Telles. April 2017.
wc-17-12. compscope™ benchmarks for pennsylvania, 17th edition. Evelina Radeva. April 2017. wc-17-13. compscope™ benchmarks for texas, 17th edition. Carol A. Telles. April 2017. wc-17-14. compscope™ benchmarks for virginia, 17th edition. Bogdan Savych. April 2017. wc-17-15. compscope™ benchmarks for wisconsin, 17th edition. Sharon E. Belton. April 2017. wc-17-16. monitoring trends in the new york workers’ compensation system, 2005–2014. Carol A. Telles and William
Monnin-Browder. February 2017. wc-17-19. monitoring trends in the new york workers’ compensation system, 2005–2013. Carol A. Telles and Ramona
P. Tanabe. February 2016. wc-16-38. monitoring trends in the new york workers’ compensation system. Carol A. Telles and Ramona P. Tanabe.
September 2014. wc-14-33. monitoring changes in new york after the 2007 reforms. Carol A. Telles and Ramona P. Tanabe. October
2013. wc-13-24. monitoring the impact of the 2007 reforms in new york. Carol A. Telles and Ramona P. Tanabe. October 2012.
wc-12-22. compscope™ benchmarks for maryland, 12th edition. Rui Yang, with the assistance of Syd Allan. December
2011. wc-11-45. early impact of 2007 reforms in new york. Carol A. Telles and Ramona P. Tanabe. December 2011. wc-11-38. compscopeTM benchmarks for tennessee, 11th edition. Evelina Radeva, Nicole M. Coomer, Bogdan Savych,
Carol A. Telles, Rui Yang, and Ramona P. Tanabe, with the assistance of Syd Allan. January 2011. wc-11-13. baseline trends for evaluating the impact of the 2007 reforms in new york. Ramona P. Tanabe and Carol
A. Telles. November 2010. wc-10-36. updated baseline for evaluating the impact of the 2007 reforms in new york. Ramona P. Tanabe, Stacey
Eccleston, and Carol A. Telles. April 2009. wc-09-14. interstate variations in medical practice patterns for low back conditions. Dongchun Wang, Kathryn
Meuller, Dean Hashimoto, Sharon Belton, and Xiaoping Zhao. June 2008. wc-08-28.
copyright © 2017 workers compensation research institute
wcri flashreport: timeliness of injury reporting and first indemnity payment in new york: a comparison with 14 states. Carol A. Telles and Ramona P. Tanabe. March 2008. fr-08-01.
baseline for evaluating the impact of the 2007 reforms in new york. Ramona P. Tanabe, Stacey Eccleston, and Carol A. Telles. March 2008. wc-08-14.
why are benefit delivery expenses higher in california and florida? Duncan S. Ballantyne and Carol A. Telles. December 2002. wc-02-06.
compscopeTM benchmarks: massachusetts, 1994–1999. Carol A. Telles, Aniko Laszlo, and Te-Chun Liu. January
2002. cs-01-03. compscopeTM
benchmarks: florida, 1994–1999. N. Michael Helvacian and Seth A. Read. September 2001. cs-01-1. wcri flashreport: where the workers’ compensation dollar goes. Richard A. Victor and Carol A. Telles.
August 2001. fr-01-01. predictors of multiple workers’ compensation claims in wisconsin. Glenn A. Gotz, Te-Chun Liu, and
Monica Galizzi. November 2000. wc-00-7. area variations in texas benefit payments and claim expenses. Glenn A. Gotz, Te-Chun Liu, Christopher J.
Mazingo, and Douglas J. Tattrie. May 2000. wc-00-3. area variations in california benefit payments and claim expenses. Glenn A. Gotz, Te-Chun Liu, and
Christopher J. Mazingo. May 2000. wc-00-2. area variations in pennsylvania benefit payments and claim expenses. Glenn A. Gotz, Te-Chun Liu, and
Christopher J. Mazingo. May 2000. wc-00-1. benchmarking the performance of workers’ compensation systems: compscopeTM
measures for minnesota. H. Brandon Haller and Seth A. Read. June 2000. cs-00-2.
benchmarking the performance of workers’ compensation systems: compscopeTM measures for
massachusetts. Carol A. Telles and Tara L. Nells. December 1999. cs-99-3. benchmarking the performance of workers’ compensation systems: compscopeTM
measures for california. Sharon E. Fox and Tara L. Nells. December 1999. cs-99-2.
benchmarking the performance of workers’ compensation systems: compscopeTM measures for
pennsylvania. Sharon E. Fox and Tara L. Nells. November 1999. cs-99-1. cost drivers and system performance in a court-based system: tennessee. John A. Gardner, Carol A. Telles,
and Gretchen A. Moss. June 1996. wc-96-4. the 1991 reforms in massachusetts: an assessment of impact. John A. Gardner, Carol A. Telles, and Gretchen
A. Moss. May 1996. wc-96-3. the impact of oregon’s cost containment reforms. John A. Gardner, Carol A. Telles, and Gretchen A. Moss.
February 1996. wc-96-1. cost drivers and system change in georgia, 1984–1994. John A. Gardner, Carol A. Telles, and Gretchen A. Moss.
November 1995. wc-95-3. cost drivers in missouri. John A. Gardner, Richard A. Victor, Carol A. Telles, and Gretchen A. Moss. December
1994. wc-94-6. cost drivers in new jersey. John A. Gardner, Richard A. Victor, Carol A. Telles, and Gretchen A. Moss. September
1994. wc-94-4. cost drivers in six states. Richard A. Victor, John A. Gardner, Daniel Sweeney, and Carol A. Telles. December
1992. wc-92-9. performance indicators for permanent disability: low-back injuries in texas. Sara R. Pease. August 1988.
wc-88-4. performance indicators for permanent disability: low-back injuries in new jersey. Sara R. Pease.
December 1987. wc-87-5. performance indicators for permanent disability: low-back injuries in wisconsin. Sara R. Pease. December
1987. wc-87-4.
Administration/Litigation wcri flashreport – worker attorney involvement: a new measure. Rui Yang, Karen Rothkin, and Roman
Dolinschi. May 2017. FR-17-01. workers’ compensation laws as of january 1, 2016. Joint publication of IAIABC and WCRI. May 2016.
wc-16-43.
copyright © 2017 workers compensation research institute
workers’ compensation laws as of january 1, 2014. Joint publication of IAIABC and WCRI. April 2014. wc-14-28.
workers’ compensation laws as of january 2012. Joint publication of IAIABC and WCRI. Ramona P. Tanabe. March 2012. wc-12-18.
workers’ compensation laws, 3rd edition. Joint publication of IAIABC and WCRI. Ramona P. Tanabe. October 2010. wc-10-52.
avoiding litigation: what can employers, insurers, and state workers’ compensation agencies do?. Richard A. Victor and Bogdan Savych. July 2010. wc-10-18.
workers’ compensation laws, 2nd edition. Joint publication of IAIABC and WCRI. June 2009. wc-09-30. did the florida reforms reduce attorney involvement? Bogdan Savych and Richard A. Victor. June 2009.
wc-09-16. lessons from the oregon workers’ compensation system. Duncan S. Ballantyne. March 2008. wc-08-13. workers’ compensation in montana: administrative inventory. Duncan S. Ballantyne. March 2007. wc-07-12. workers’ compensation in nevada: administrative inventory. Duncan S. Ballantyne. December 2006.
wc-06-15. workers’ compensation in hawaii: administrative inventory. Duncan S. Ballantyne. April 2006. wc-06-12. workers’ compensation in arkansas: administrative inventory. Duncan S. Ballantyne. August 2005.
wc-05-18. workers’ compensation in mississippi: administrative inventory. Duncan S. Ballantyne. May 2005. wc-05-13. workers’ compensation in arizona: administrative inventory. Duncan S. Ballantyne. September 2004.
wc-04-05. workers’ compensation in iowa: administrative inventory. Duncan S. Ballantyne. April 2004. wc-04-02. wcri flashreport: measuring the complexity of the workers’ compensation dispute resolution processes
in tennessee. Richard A. Victor. April 2004. fr-04-02. revisiting workers’ compensation in missouri: administrative inventory. Duncan S. Ballantyne. December
2003. wc-03-06. workers’ compensation in tennessee: administrative inventory. Duncan S. Ballantyne. April 2003. wc-03-01. revisiting workers’ compensation in new york: administrative inventory. Duncan S. Ballantyne. January
2002. wc-01-05. workers’ compensation in kentucky: administrative inventory. Duncan S. Ballantyne. June 2001. wc-01-01. workers’ compensation in ohio: administrative inventory. Duncan S. Ballantyne. October 2000. wc-00-5. workers’ compensation in louisiana: administrative inventory. Duncan S. Ballantyne. November 1999.
wc-99-4. workers’ compensation in florida: administrative inventory. Peter S. Barth. August 1999. wc-99-3. measuring dispute resolution outcomes: a literature review with implications for workers’
compensation. Duncan S. Ballantyne and Christopher J. Mazingo. April 1999. wc-99-1. revisiting workers’ compensation in connecticut: administrative inventory. Duncan S. Ballantyne.
September 1998. wc-98-4. dispute prevention and resolution in workers’ compensation: a national inventory, 1997–1998. Duncan S.
Ballantyne. May 1998. wc-98-3. workers’ compensation in oklahoma: administrative inventory. Michael Niss. April 1998. wc-98-2. workers’ compensation advisory councils: a national inventory, 1997–1998. Sharon E. Fox. March 1998.
wc-98-1. the role of advisory councils in workers’ compensation systems: observations from wisconsin. Sharon E.
Fox. November 1997. revisiting workers’ compensation in michigan: administrative inventory. Duncan S. Ballantyne and
Lawrence Shiman. October 1997. wc-97-4. revisiting workers’ compensation in minnesota: administrative inventory. Carol A. Telles and Lawrence
Shiman. September 1997. wc-97-3. revisiting workers’ compensation in california: administrative inventory. Carol A. Telles and Sharon E.
Fox. June 1997. wc-97-2. revisiting workers’ compensation in pennsylvania: administrative inventory. Duncan S. Ballantyne. March
1997. wc-97-1.
copyright © 2017 workers compensation research institute
revisiting workers’ compensation in washington: administrative inventory. Carol A. Telles and Sharon E. Fox. December 1996. wc-96-10.
workers’ compensation in illinois: administrative inventory. Duncan S. Ballantyne and Karen M. Joyce. November 1996. wc-96-9.
workers’ compensation in colorado: administrative inventory. Carol A. Telles and Sharon E. Fox. October 1996. wc-96-8.
workers’ compensation in oregon: administrative inventory. Duncan S. Ballantyne and James F. Dunleavy. December 1995. wc-95-2.
revisiting workers’ compensation in texas: administrative inventory. Peter S. Barth and Stacey M. Eccleston. April 1995. wc-95-1.
workers’ compensation in virginia: administrative inventory. Carol A. Telles and Duncan S. Ballantyne. April 1994. wc-94-3.
workers’ compensation in new jersey: administrative inventory. Duncan S. Ballantyne and James F. Dunleavy. April 1994. wc-94-2.
workers’ compensation in north carolina: administrative inventory. Duncan S. Ballantyne. December 1993. wc-93-5.
workers’ compensation in missouri: administrative inventory. Duncan S. Ballantyne and Carol A. Telles. May 1993. wc-93-1.
workers’ compensation in california: administrative inventory. Peter S. Barth and Carol A. Telles. December 1992. wc-92-8.
workers’ compensation in wisconsin: administrative inventory. Duncan S. Ballantyne and Carol A. Telles. November 1992. wc-92-7.
workers’ compensation in new york: administrative inventory. Duncan S. Ballantyne and Carol A. Telles. October 1992. wc-92-6.
the ama guides in maryland: an assessment. Leslie I. Boden. September 1992. wc-92-5. workers’ compensation in georgia: administrative inventory. Duncan S. Ballantyne and Stacey M. Eccleston.
September 1992. wc-92-4. workers’ compensation in pennsylvania: administrative inventory. Duncan S. Ballantyne and Carol A.
Telles. December 1991. wc-91-4. reducing litigation: using disability guidelines and state evaluators in oregon. Leslie I. Boden, Daniel E.
Kern, and John A. Gardner. October 1991. wc-91-3. workers’ compensation in minnesota: administrative inventory. Duncan S. Ballantyne and Carol A. Telles.
June 1991. wc-91-1. workers’ compensation in maine: administrative inventory. Duncan S. Ballantyne and Stacey M. Eccleston.
December 1990. wc-90-5. workers’ compensation in michigan: administrative inventory. H. Allan Hunt and Stacey M. Eccleston.
January 1990. wc-90-1. workers’ compensation in washington: administrative inventory. Sara R. Pease. November 1989. wc-89-3. workers’ compensation in texas: administrative inventory. Peter S. Barth, Richard B. Victor, and Stacey M.
Eccleston. March 1989. wc-89-1. reducing litigation: evidence from wisconsin. Leslie I. Boden. December 1988. wc-88-7. workers’ compensation in connecticut: administrative inventory. Peter S. Barth. December 1987. wc-87-3. use of medical evidence: low-back permanent partial disability claims in new jersey. Leslie I. Boden.
December 1987. wc-87-2. use of medical evidence: low-back permanent partial disability claims in maryland. Leslie I. Boden.
September 1986. sp-86-1.
Vocational Rehabilitation
improving vocational rehabilitation outcomes: opportunities for early intervention. John A. Gardner. August 1988. wc-88-3.
appropriateness and effectiveness of vocational rehabilitation in florida: costs, referrals, services, and outcomes. John A. Gardner. February 1988. wc-88-2.
copyright © 2017 workers compensation research institute
vocational rehabilitation in florida workers’ compensation: rehabilitants, services, costs, and outcomes. John A. Gardner. February 1988. wc-88-1.
vocational rehabilitation outcomes: evidence from new york. John A. Gardner. December 1986. wc-86-1. vocational rehabilitation in workers’ compensation: issues and evidence. John A. Gardner. June 1985.
s-85-1.
Occupational Disease
liability for employee grievances: mental stress and wrongful termination. Richard B. Victor, ed. October 1988. wc-88-6.
asbestos claims: the decision to use workers’ compensation and tort. Robert I. Field and Richard B. Victor. September 1988. wc-88-5.
Other
workers’ compensation: where have we come from? where are we going?. Richard A. Victor and Linda L. Carrubba, eds. November 2010. wc-10-33.
recession, fear of job loss, and return to work. Richard A. Victor and Bogdan Savych. April 2010. wc-10-03. wcri flashreport: what are the prevalence and size of lump-sum payments in workers’ compensation:
estimates relevant for medicare set-asides. Richard A. Victor, Carol A. Telles, and Rui Yang. November 2006. fr-06-01.
the future of workers’ compensation: opportunities and challenges. Richard A. Victor, ed. April 2004. wc-04-03.
managing catastrophic events in workers’ compensation: lessons from 9/11. Ramona P. Tanabe, ed. March 2003. wc-03-03.
wcri flashreport: workers’ compensation in california: lessons from recent wcri studies. Richard A. Victor. March 2003. fr-03-02.
wcri flashreport: workers’ compensation in florida: lessons from recent wcri studies. Richard A. Victor. February 2003. fr-03-01.
workers’ compensation and the changing age of the workforce. Douglas J. Tattrie, Glenn A. Gotz, and Te-Chun Liu. December 2000. wc-00-6.
medical privacy legislation: implications for workers’ compensation. Ramona P. Tanabe, ed. November 2000. wc-00-4.
the implications of changing employment relations for workers’ compensation. Glenn A. Gotz, ed. December 1999. wc-99-6.
workers’ compensation success stories. Richard A. Victor, ed. July 1993. wc-93-3. the americans with disabilities act: implications for workers’ compensation. Stacey M. Eccleston, ed. July
1992. wc-92-3. twenty-four-hour coverage. Richard A. Victor, ed. June 1991. wc-91-2.
These publications can be obtained by visiting our web site at www.wcrinet.org or by sending a written request by fax to (617) 661-9284, or by mail to
Publications Department Workers Compensation Research Institute 955 Massachusetts Avenue Cambridge, MA 02139
copyright © 2017 workers compensation research institute
About the Institute
Our Mission:
To be a catalyst for significant improvements in workers’ compensation
systems, providing the public with objective, credible, high-quality
research on important public policy issues.
The Institute:
Founded in 1983, the Workers Compensation Research Institute (WCRI)
is an independent, not-for-profit research organization which strives to
help those interested in making improvements to the workers’
compensation system by providing highly-regarded, objective data
and analysis.
The Institute does not take positions on the issues it researches; rather,
it provides information obtained through studies and data collection
efforts, which conform to recognized scientific methods. Objectivity is
further ensured through rigorous, unbiased peer review procedures.
The Institute’s work includes:
Original research studies of major issues confronting workers’
compensation systems (for example, outcomes for injured
workers).
Studies of individual state systems where policymakers have
shown an interest in change and where there is an unmet need
for objective information.
Studies of states that have undergone major legislative changes
to measure the impact of those reforms and draw possible lessons
for other states.
Presentations on research findings to legislators, workers’
compensation administrators, industry groups, and other
stakeholders.
With WCRI’s research, policymakers and other system stakeholders—
employers, insurers, and labor unions—can monitor state systems on a
regular basis and identify incremental changes to improve system
performance. This results in a more enduring, efficient, and equitable
system that better serves the needs of workers and employers.
copyright © 2017 workers compensation research institute