Embed Size (px)
Citation preview
Interstate and Strategic Corridor Plans January 9, 2014 9:30 AM
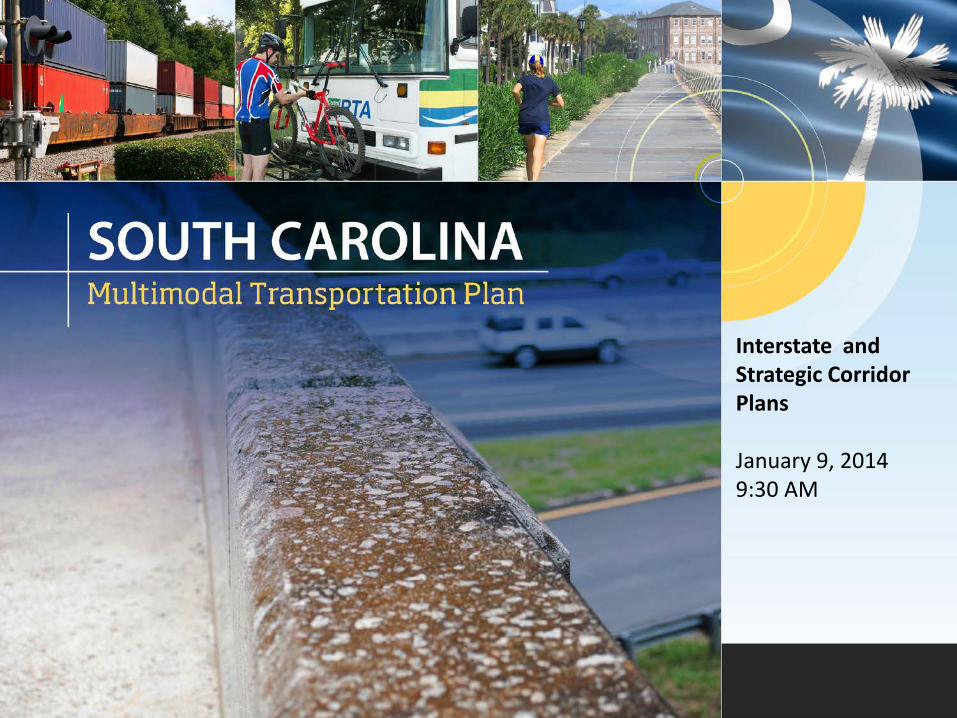
Agenda
• Modal Needs • Baseline Revenue • Modal Scenarios • Website • Interstate Plan • Strategic Corridor Plan
MULTIMODAL TRANSPORTATION NEEDS
Jeff Carroll

2030 MTP vs. 2040 MTP Technical Changes
• Databases
None
• Analysis Tools Maintenance Assessment Tool
• Agency Coordination Yes
• Modes Highway Bridges Mass Transit Premium Transit / Passenger Rail
• Databases 2011 HPMS 2011 NBI Transearch
• Analysis Tools HERS-ST (Highways) NBIAS (Bridges)
• Agency Coordination Yes
• Modes Highway Bridges Mass Transit Premium Transit / Passenger Rail Freight Rail, Ports, Aviation, Bike/Ped
2030 MTP 2040 MTP FHWA has developed analytical tools to identify future needs
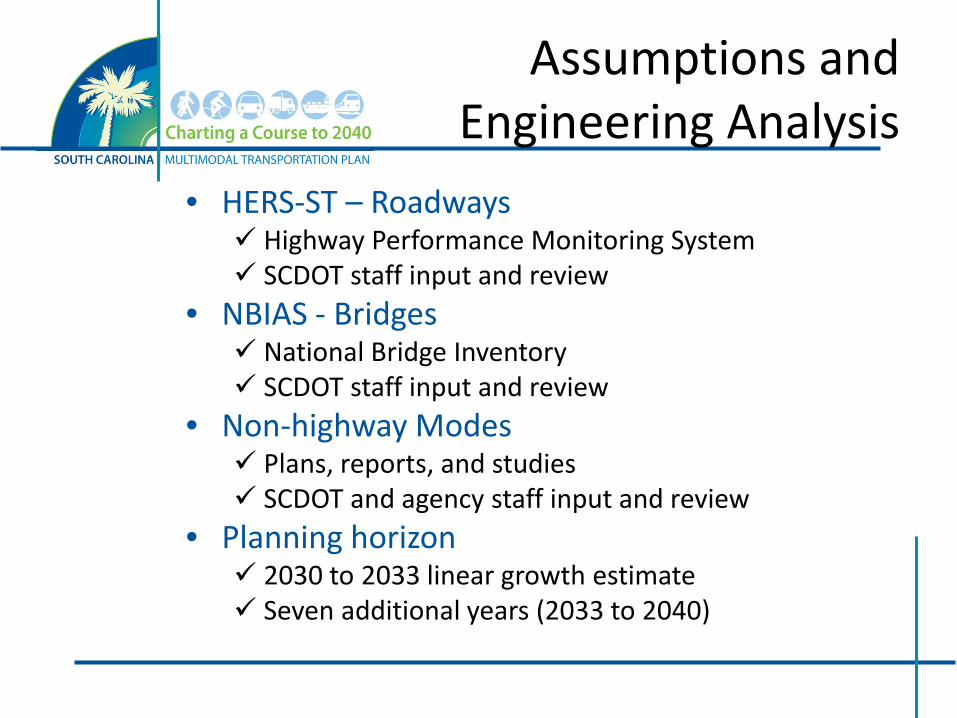
Assumptions and Engineering Analysis
• HERS-ST – Roadways Highway Performance Monitoring System SCDOT staff input and review
• NBIAS - Bridges National Bridge Inventory SCDOT staff input and review
• Non-highway Modes Plans, reports, and studies SCDOT and agency staff input and review
• Planning horizon 2030 to 2033 linear growth estimate Seven additional years (2033 to 2040)
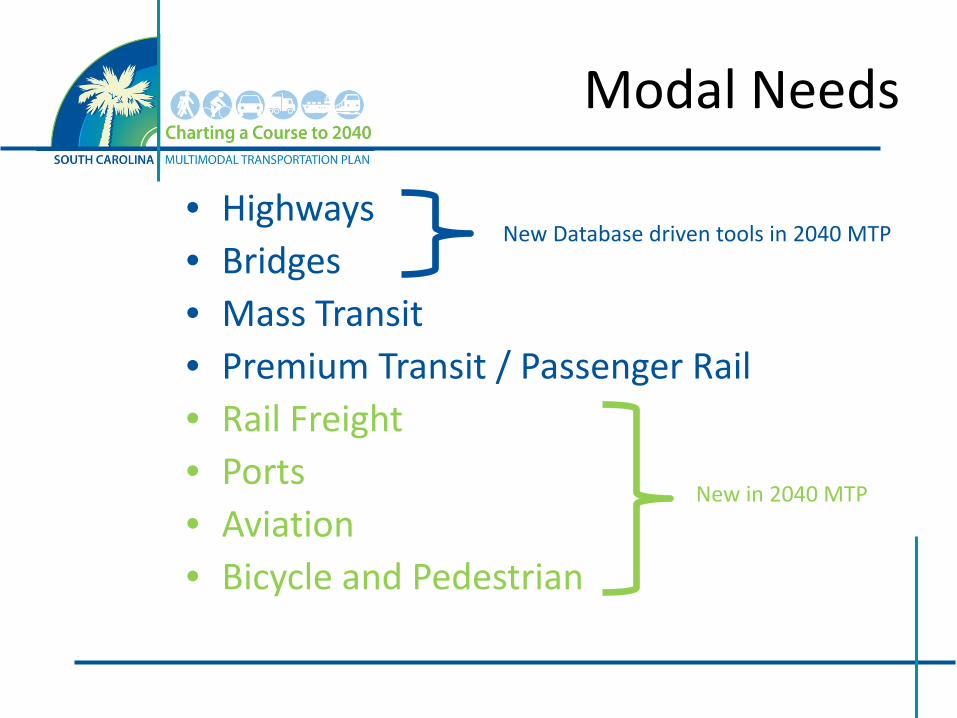
Modal Needs
• Highways • Bridges • Mass Transit • Premium Transit / Passenger Rail • Rail Freight • Ports • Aviation • Bicycle and Pedestrian
New in 2040 MTP
New Database driven tools in 2040 MTP

QUESTIONS

BASELINE REVENUE PROJECTIONS Amanda Spencer
Purpose
• Provides an estimate of revenues expected to be available for capital improvements to 2040
• Identifies the funding gap between revenues and modal needs
Methodology
• Projection of baseline revenues by mode – No new revenues – Business as usual – conservative estimate
• Based on current year revenues and short-term budgeted revenues, grown annually at assumed rates
• Converted to “real” dollars to account for inflation
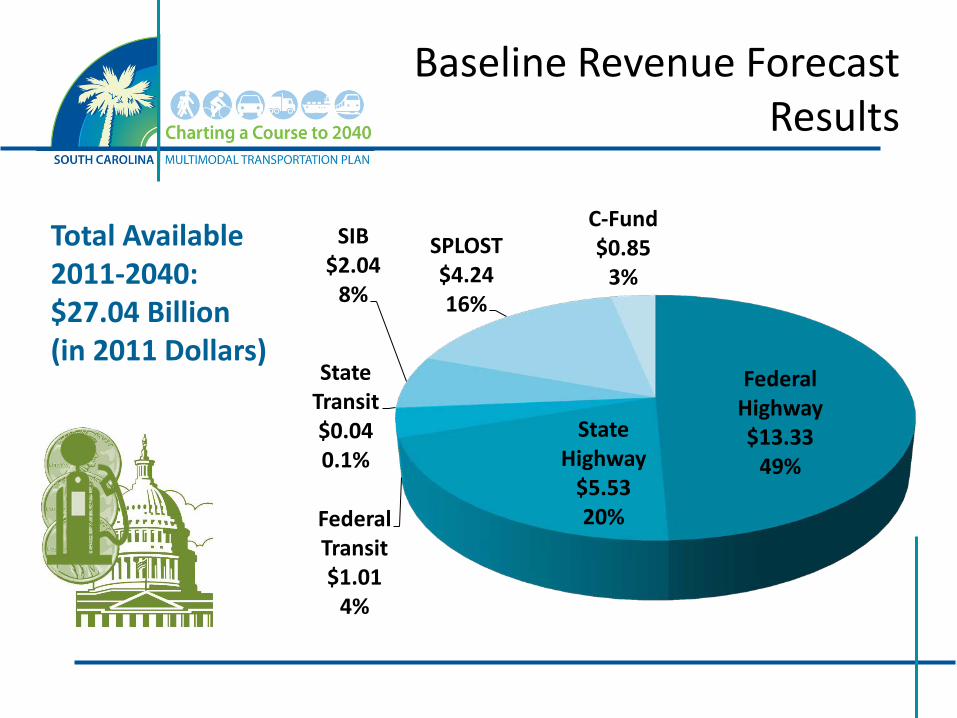
Baseline Revenue Forecast Results
Total Available 2011-2040: $27.04 Billion (in 2011 Dollars)
Federal Highway $13.33
49% State
Highway $5.53 20% Federal
Transit $1.01
4%
State Transit $0.04 0.1%
SIB $2.04
8%
SPLOST $4.24 16%
C-Fund $0.85
3%
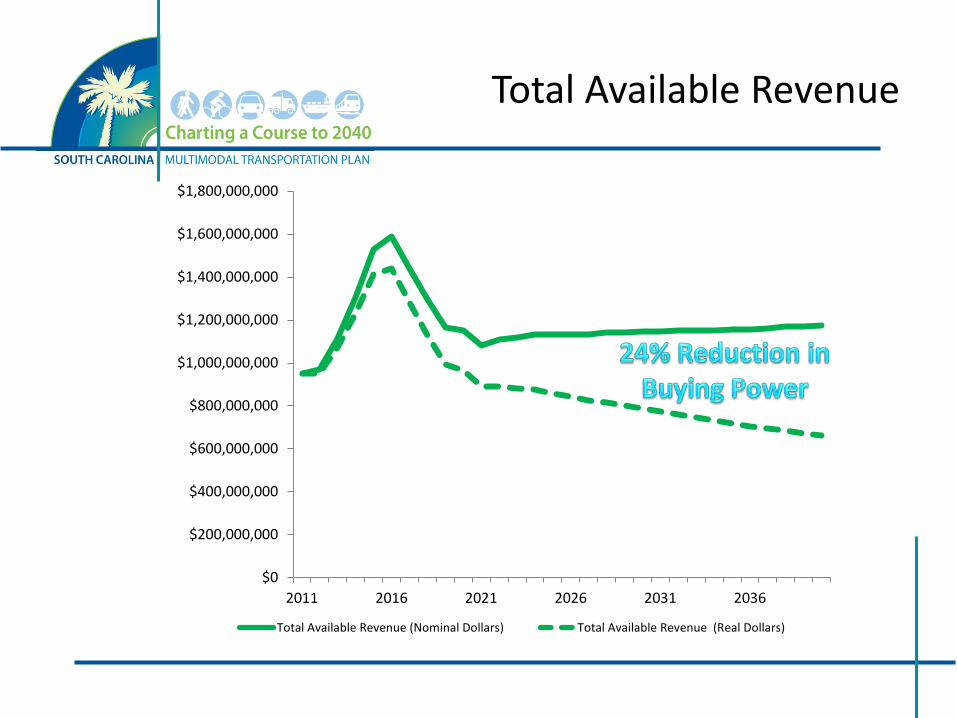
Total Available Revenue
$0
$200,000,000
$400,000,000
$600,000,000
$800,000,000
$1,000,000,000
$1,200,000,000
$1,400,000,000
$1,600,000,000
$1,800,000,000
2011 2016 2021 2026 2031 2036
Total Available Revenue (Nominal Dollars) Total Available Revenue (Real Dollars)

QUESTIONS

Developing and Evaluating Modal Scenarios – Status Update
Don Vary
Modal Scenarios
• Develop different allocations of long-range plan transportation revenue – Revenue levels, investment types
• Evaluate according to quantitative and qualitative criteria
• Develop implementation strategies
Inputs
• Uses plan outputs – Vision, goals, objectives – Plan performance measures – Needs, gap – Baseline revenue forecast
• …And creates new inputs – Allocate fixed revenue levels into investment
categories – Measures of effectiveness
SCMTP Scenarios
$0.00
$5.00
$10.00
$15.00
$20.00
$25.00
$30.00
Interstate OtherFederal-aid
Local Passengerrail/bus
Freight
Preservation/ModernizationCapacity
$0.00
$5.00
$10.00
$15.00
$20.00
$25.00
$30.00
Interstate OtherFederal-aid
Local Passengerrail/bus
Freight
Preservation/Modernization
Capacity
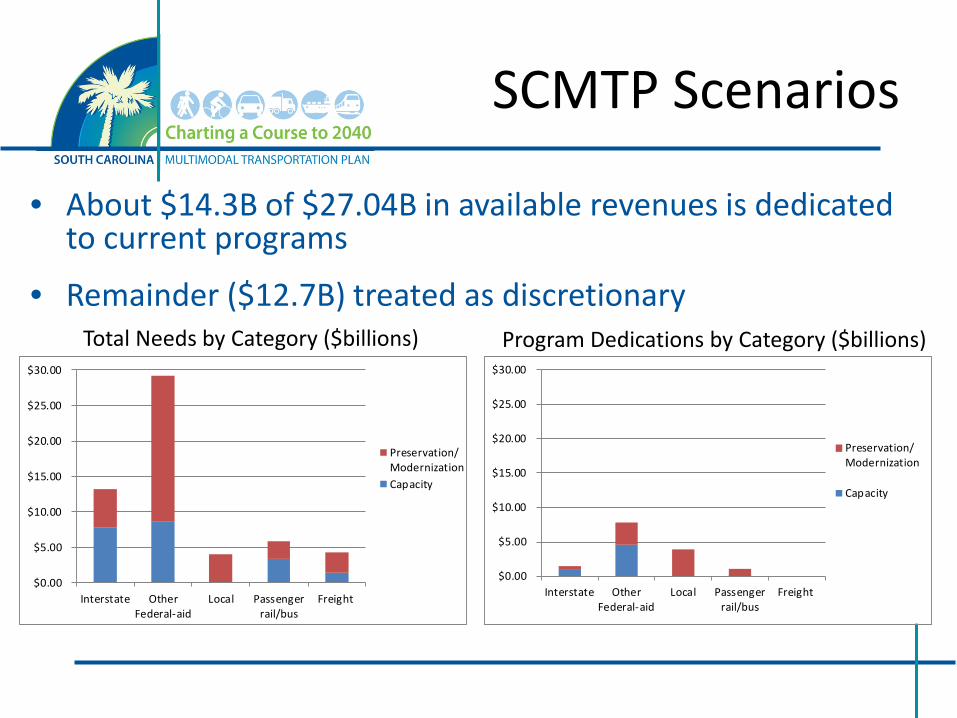
• About $14.3B of $27.04B in available revenues is dedicated to current programs
• Remainder ($12.7B) treated as discretionary
Total Needs by Category ($billions) Program Dedications by Category ($billions)
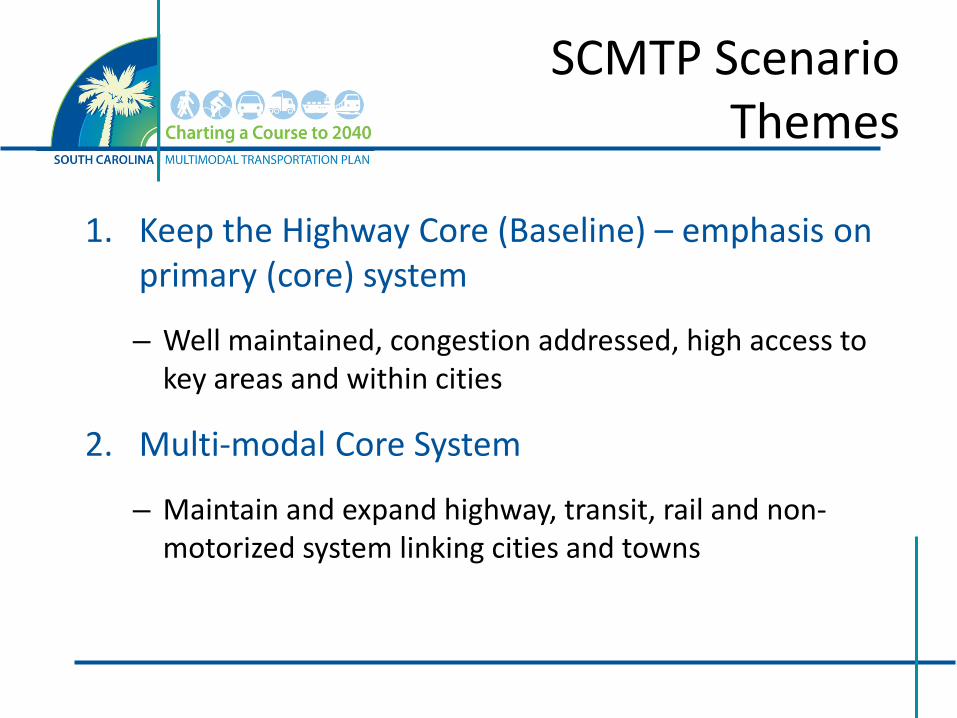
SCMTP Scenario Themes
1. Keep the Highway Core (Baseline) – emphasis on primary (core) system
– Well maintained, congestion addressed, high access to key areas and within cities
2. Multi-modal Core System
– Maintain and expand highway, transit, rail and non-motorized system linking cities and towns
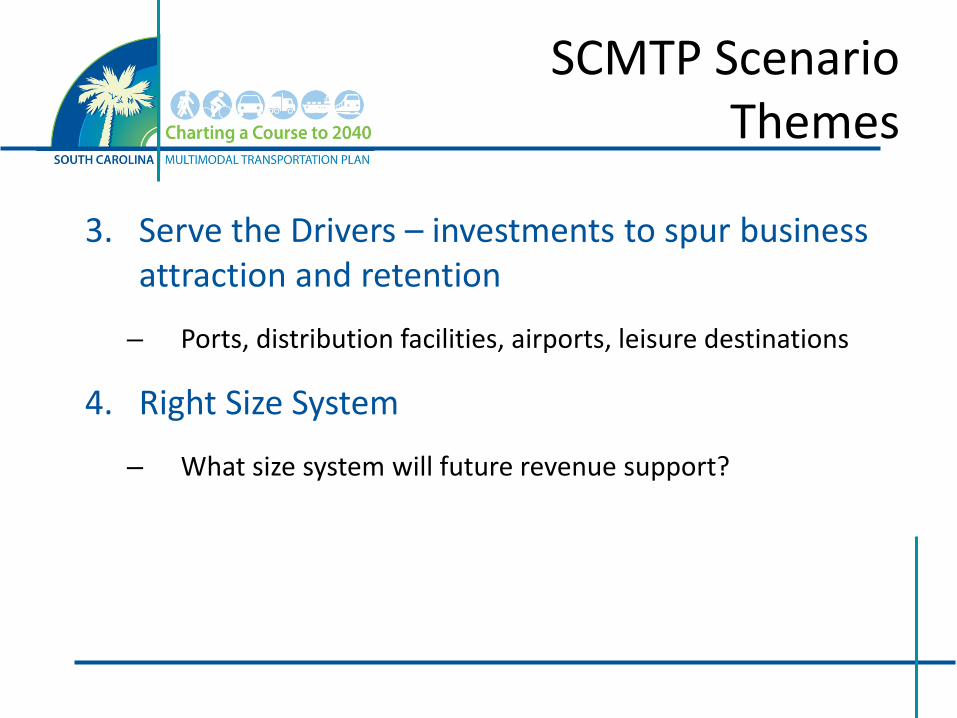
SCMTP Scenario Themes
3. Serve the Drivers – investments to spur business attraction and retention
– Ports, distribution facilities, airports, leisure destinations
4. Right Size System
– What size system will future revenue support?
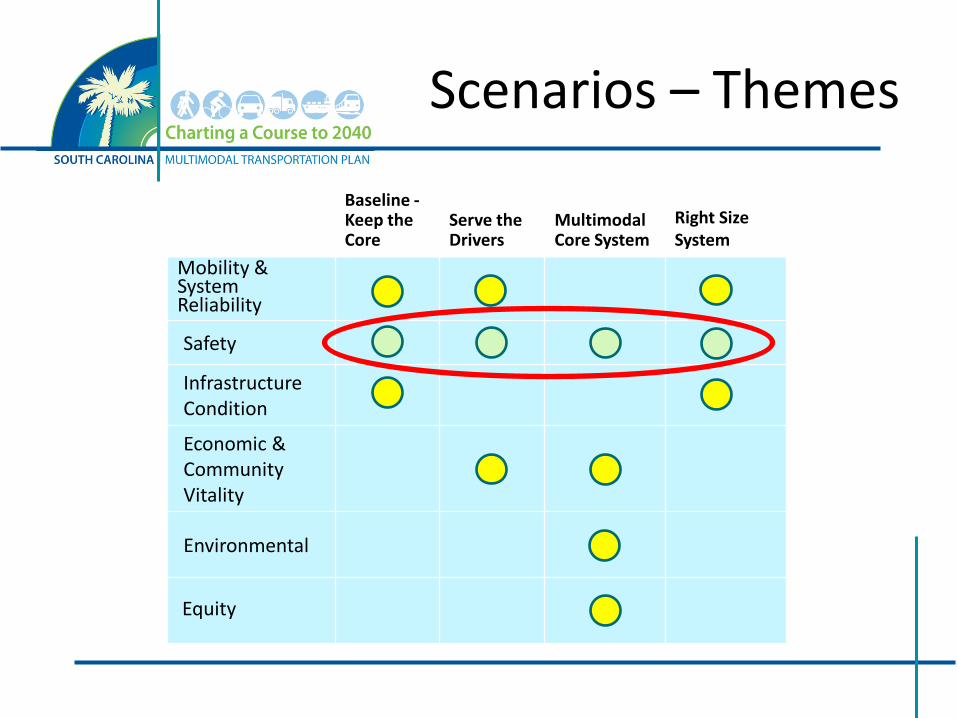
Scenarios – Themes
Baseline -Keep the Core
Serve the Drivers
Multimodal Core System
Right Size System
Mobility & System Reliability
Safety
Infrastructure Condition
Economic & Community Vitality
Environmental
Equity
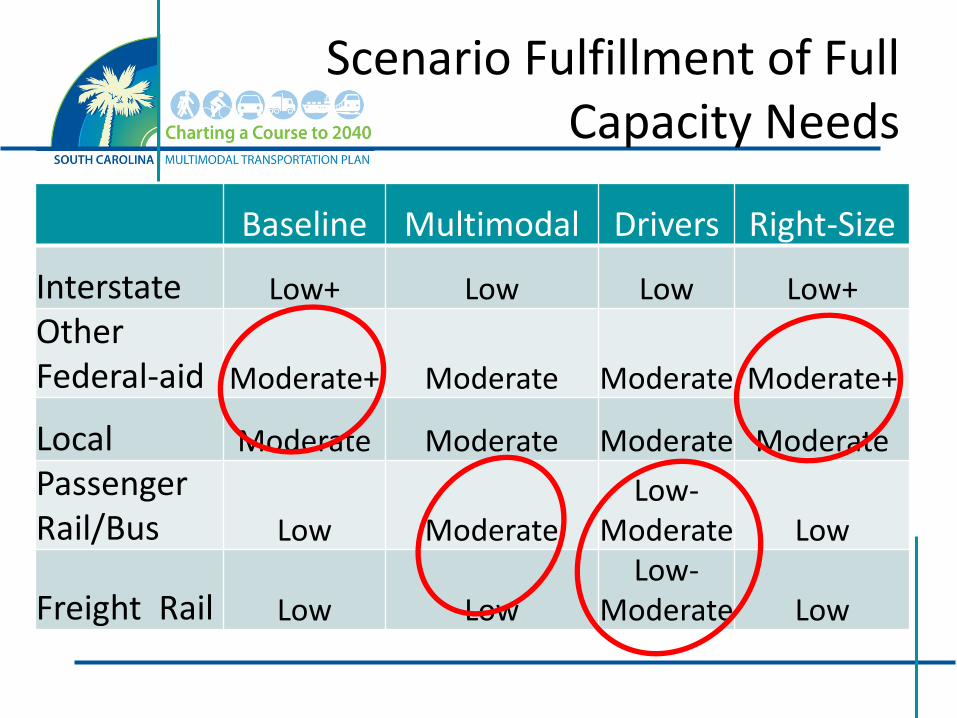
Scenario Fulfillment of Full Capacity Needs
Baseline Multimodal Drivers Right-Size
Interstate Low+ Low Low Low+ Other Federal-aid Moderate+ Moderate Moderate Moderate+
Local Moderate Moderate Moderate Moderate Passenger Rail/Bus Low Moderate
Low-Moderate Low
Freight Rail Low Low Low-
Moderate Low
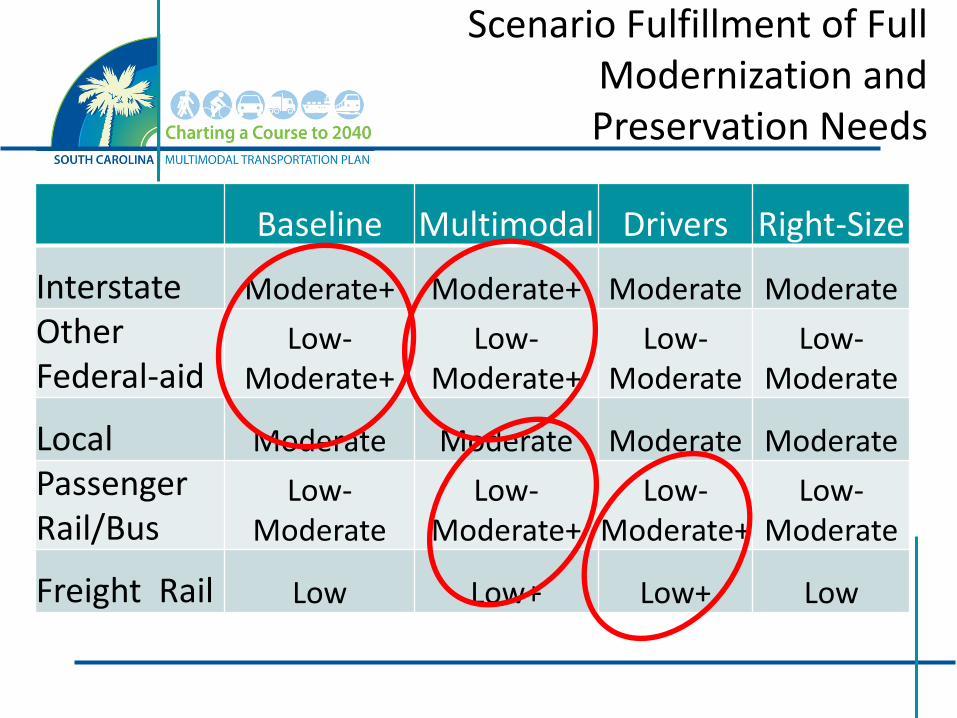
Scenario Fulfillment of Full Modernization and Preservation Needs
Baseline Multimodal Drivers Right-Size
Interstate Moderate+ Moderate+ Moderate Moderate Other Federal-aid
Low-Moderate+
Low-Moderate+
Low-Moderate
Low-Moderate
Local Moderate Moderate Moderate Moderate Passenger Rail/Bus
Low-Moderate
Low-Moderate+
Low-Moderate+
Low-Moderate
Freight Rail Low Low+ Low+ Low
Scenario Next Steps
• Analyze scenario performance according to goal areas
• Summarize trade-offs and policy implementation implications
Measures of Effectiveness
• Estimated pavement and bridge condition
• Estimated travel time and vehicle operating costs
• User costs
• Goal needs met based on funding
QUESTIONS
WEBSITE Karen Hadley
Live Website
INTERSTATE PLAN Rick Reiff
Interstate Plan Overview
• Summary of Progress – Data Collection – Congestion Analyses – Project Costs – Environmental Screenings
• Next Steps • Questions & Answers
Data Collection
• INRIX Speed Data • SCDOT’s automatic traffic recorder
(ATR) hourly volume data – Peak-to-Daily (K) Factors – Directional (D) Factors – Truck Percentages – Urban/Rural Boundaries
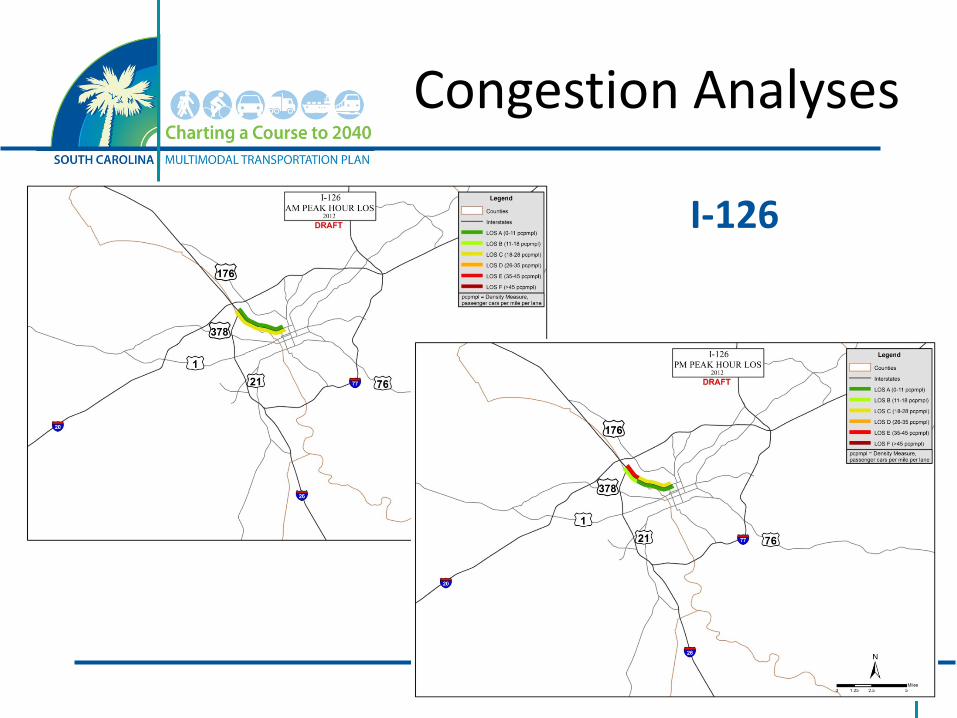
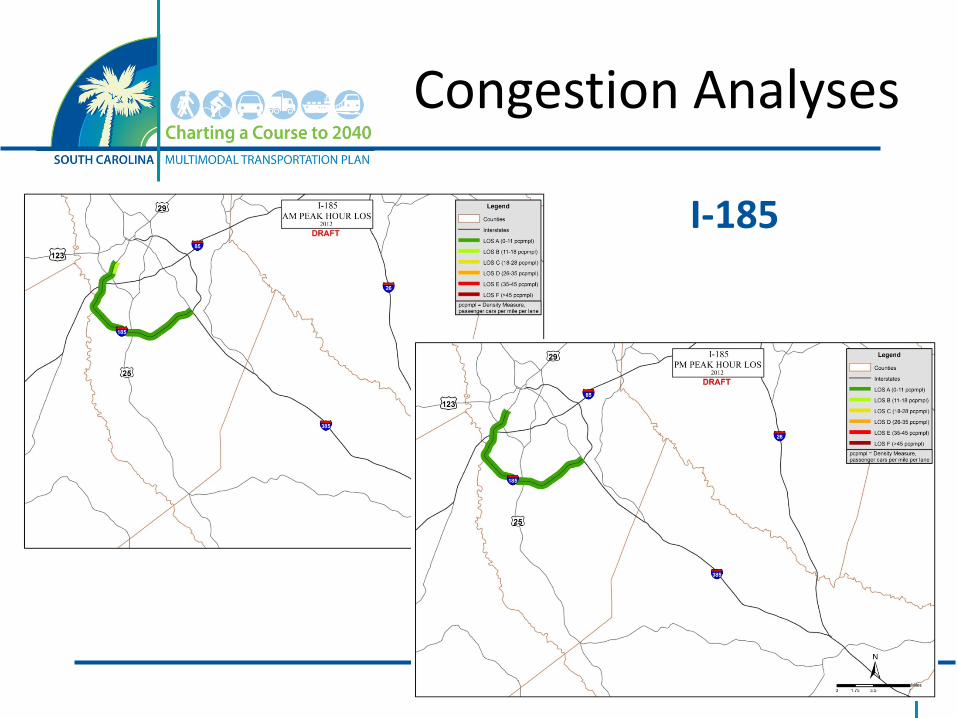
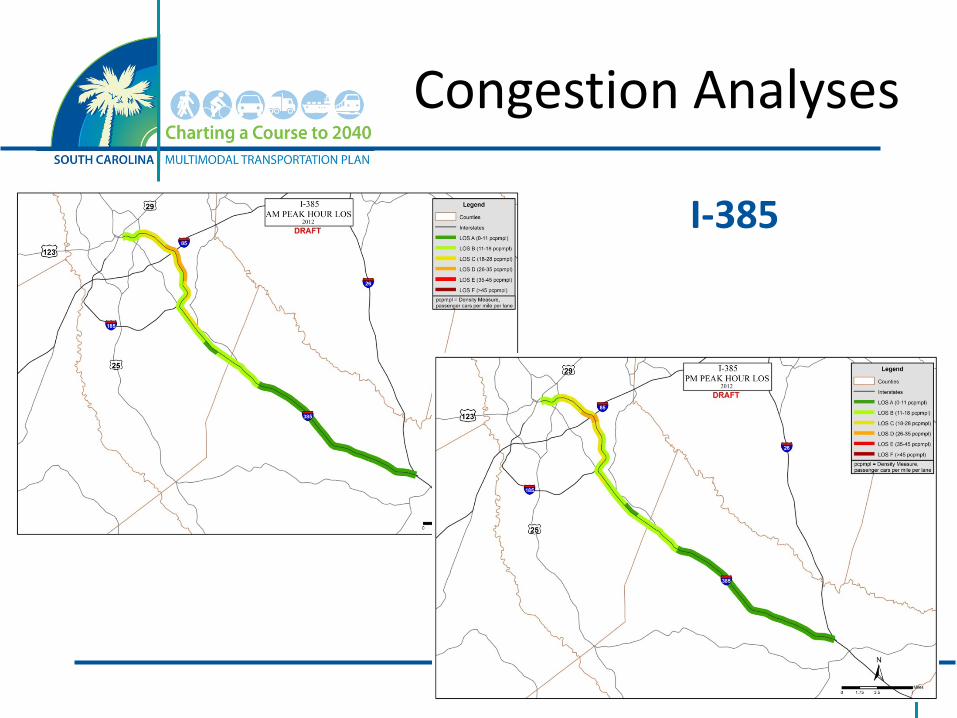
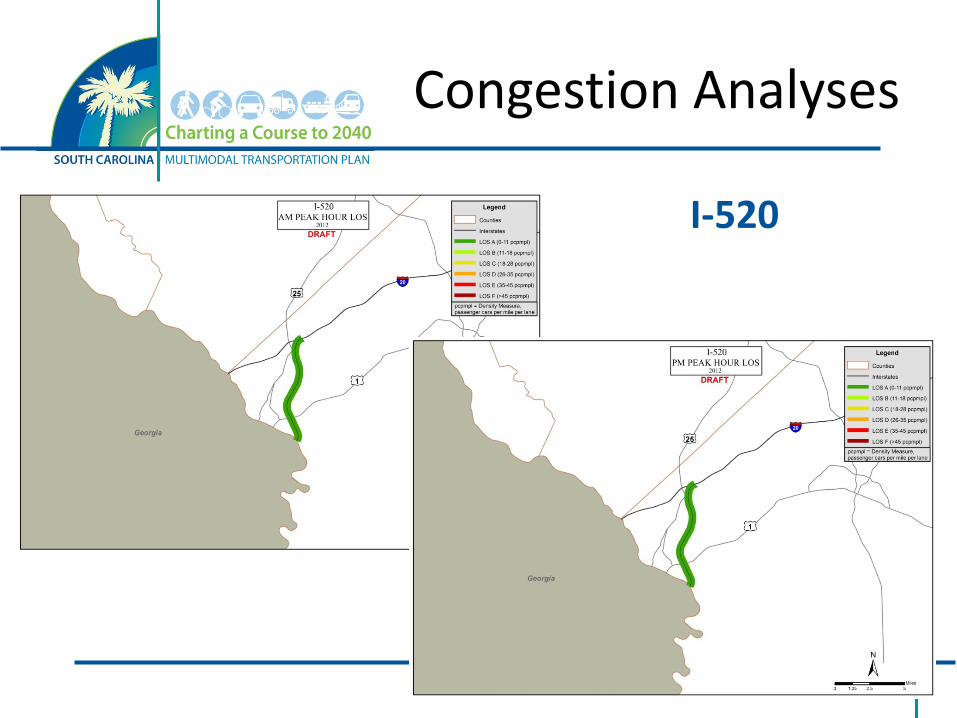
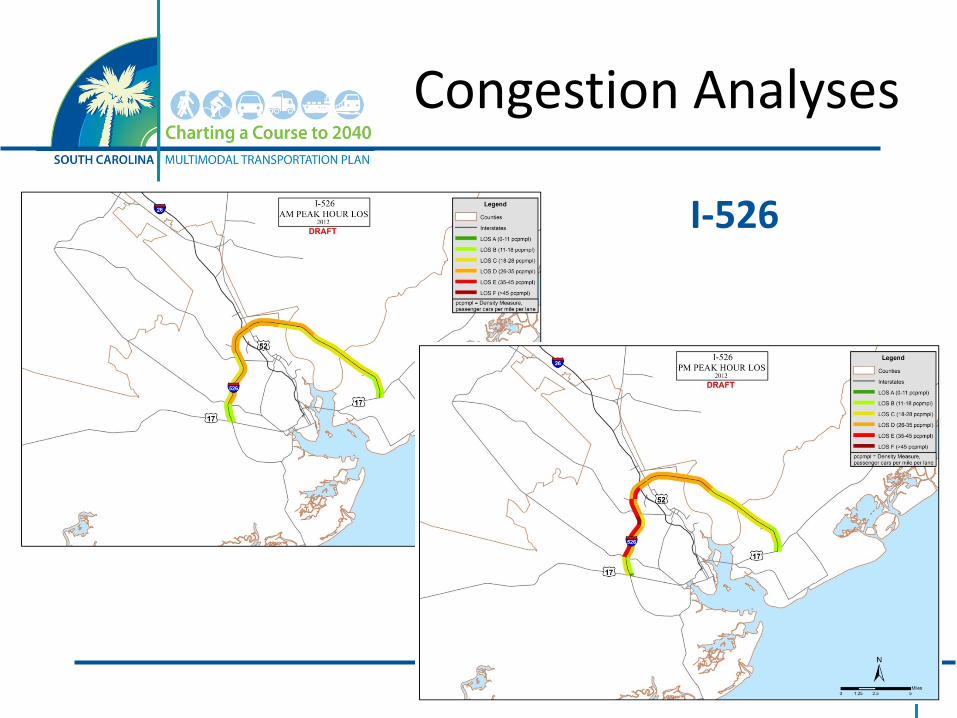
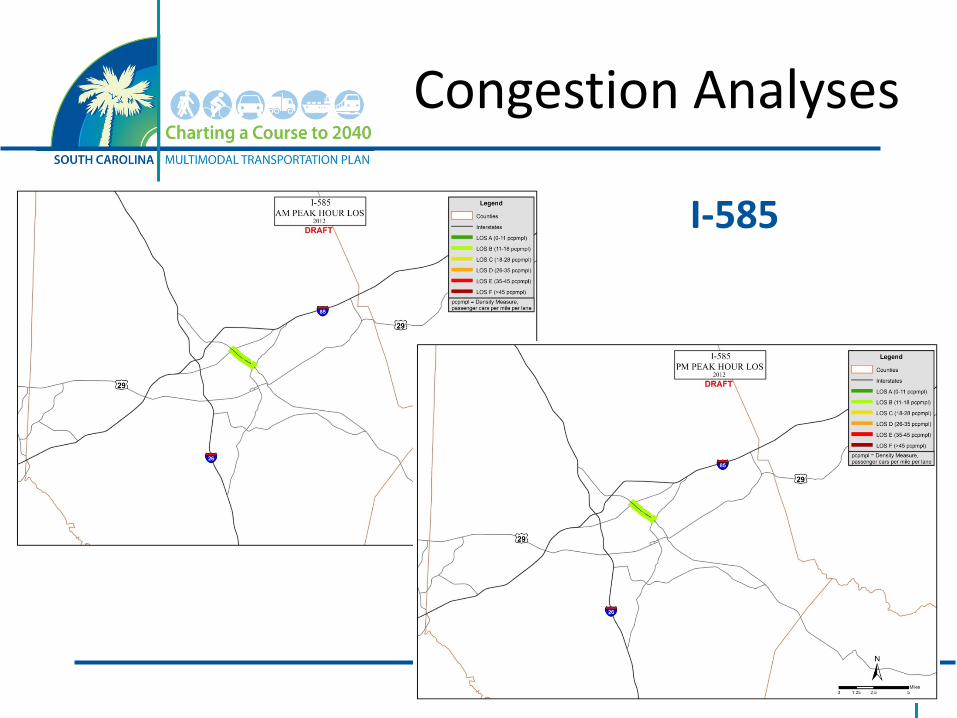
Congestion Analyses
• Interstate mainline – 11 interstates: I-20, I-26, I-77, I-85, I-95,
I-126, I-185, I-385, I-520, I-526, I-585 – Four Analysis hours: 7-8a, 8-9a, 4-5p, 5-6p
• Performance Metric – Highway Capacity Manual 2010 Level of
Service (LOS) Analysis – Based upon Freeway Density for
Interstates
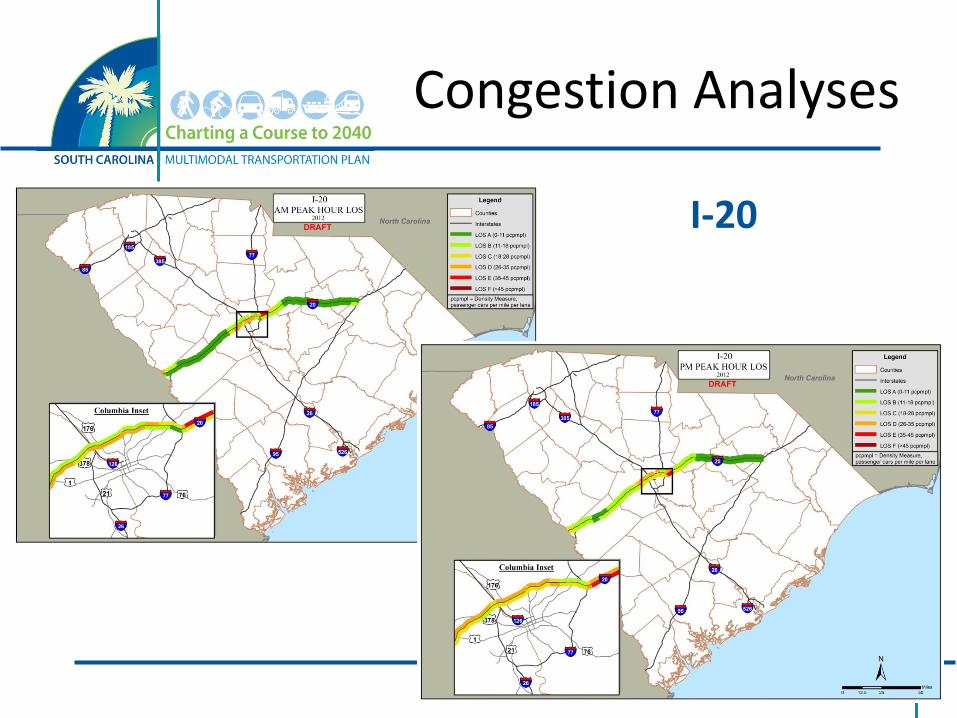
Congestion Analyses
I-20

Congestion Analyses
I-26
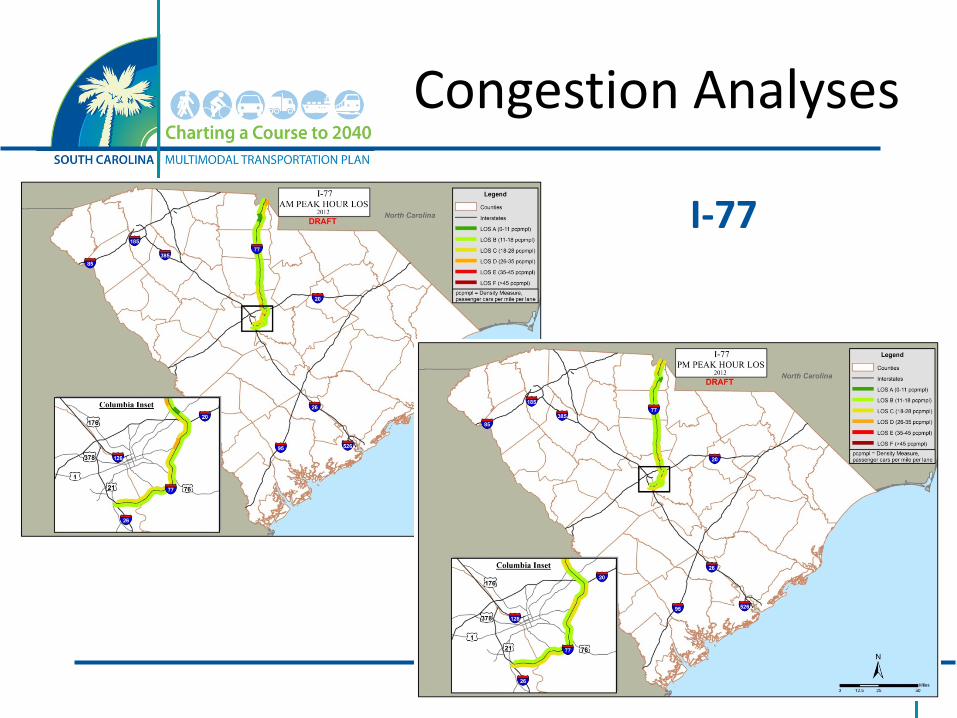
Congestion Analyses
I-77
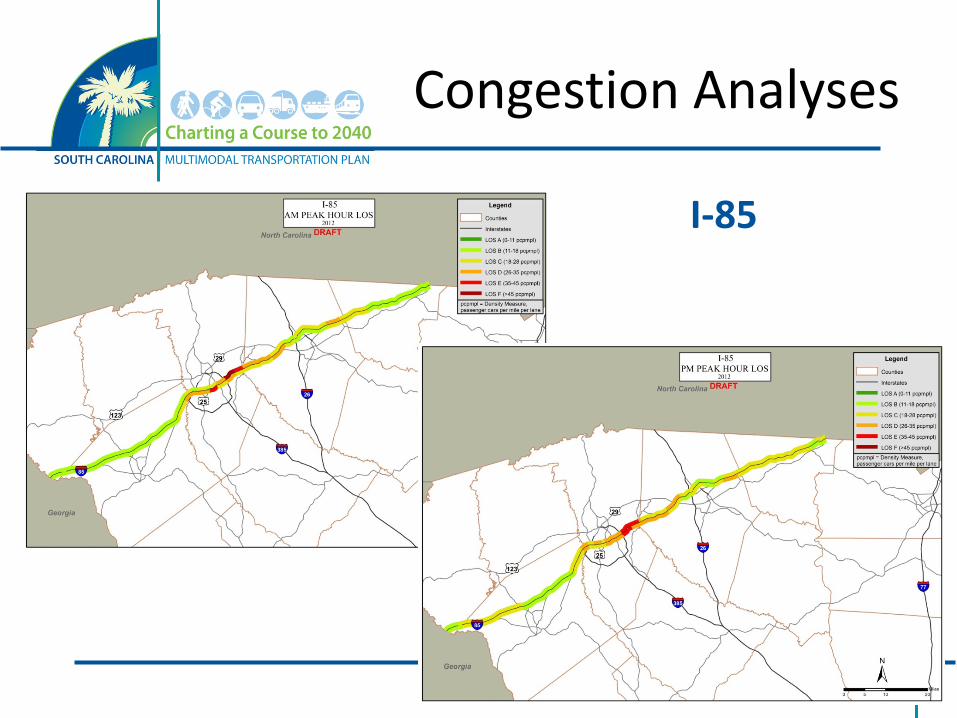
Congestion Analyses
I-85
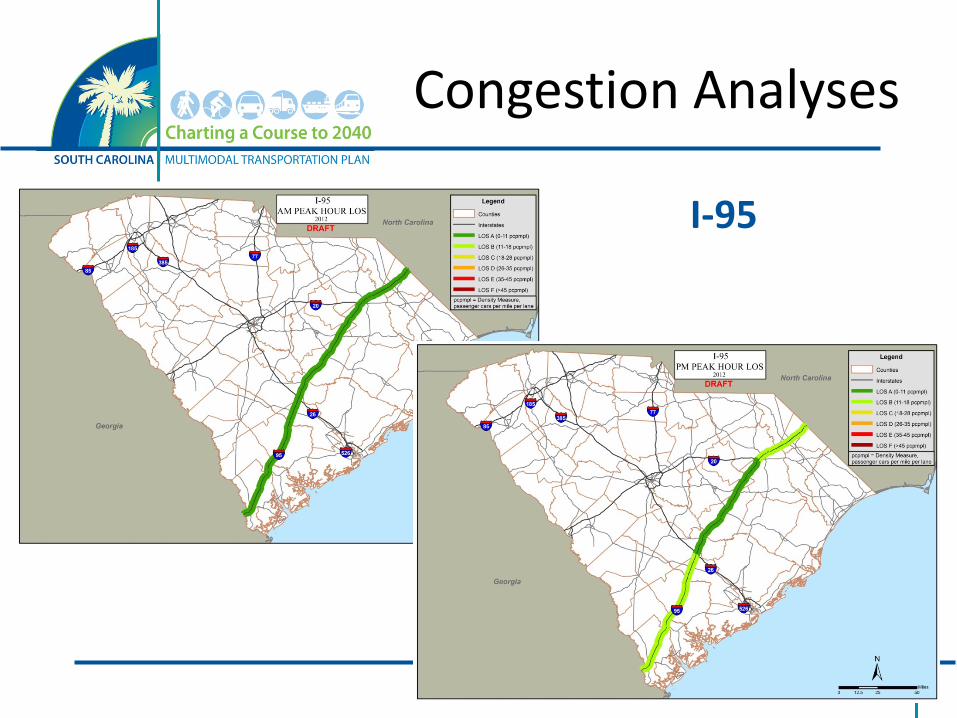
Congestion Analyses
I-95
Congestion Analyses
I-126
Congestion Analyses
I-185
Congestion Analyses
I-385
Congestion Analyses
I-520
Congestion Analyses
I-526
Congestion Analyses
I-585
Congestion Analyses
• Density Index Performance Metric (Individual Segments) – Segments are Interchange to Interchange – Developed to compare and rank the respective levels of
congestion for the individual interstate mainline segments. – Defined as the summation of the individual interstate
mainline segment Densities for each of the four study hours for both directions.
• Average Density Index Performance Metric (Corridors) – Corridors are made up of Multiple segments – Developed to compare and rank the respective levels of
congestion for the interstate corridors. – Individual interstate mainline segments were combined into
interstate corridors based upon like cross-sections. – Defined as the average of the density indexes across all
corridor segments.
Congestion Analyses
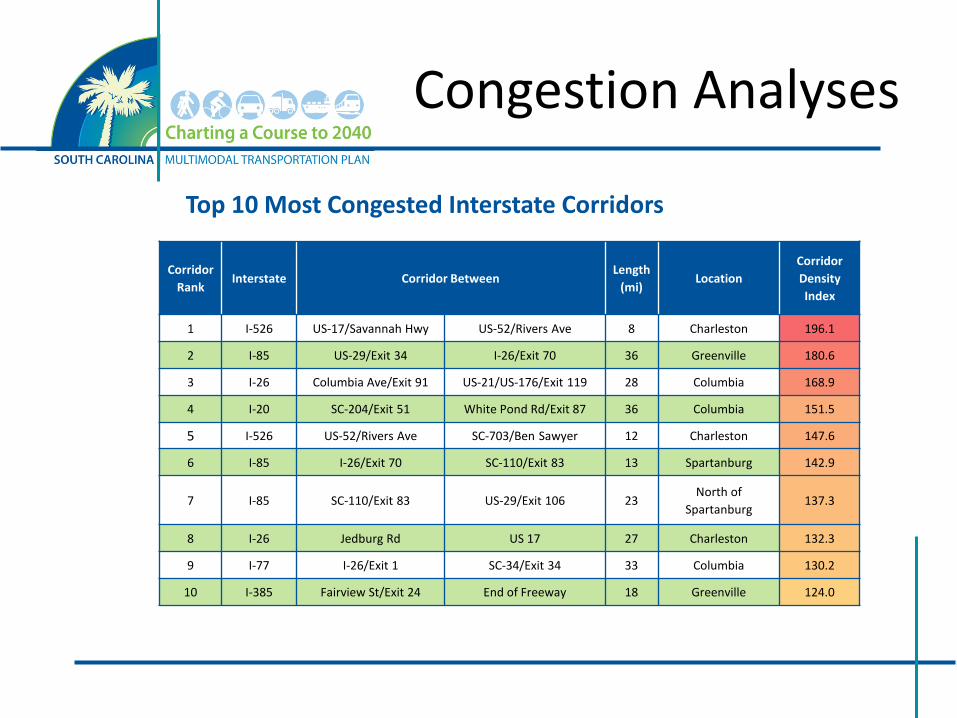
Top 10 Most Congested Interstate Corridors
Corridor Rank
Interstate Corridor Between Length
(mi) Location
Corridor Density Index
1 I-526 US-17/Savannah Hwy US-52/Rivers Ave 8 Charleston 196.1
2 I-85 US-29/Exit 34 I-26/Exit 70 36 Greenville 180.6
3 I-26 Columbia Ave/Exit 91 US-21/US-176/Exit 119 28 Columbia 168.9
4 I-20 SC-204/Exit 51 White Pond Rd/Exit 87 36 Columbia 151.5
5 I-526 US-52/Rivers Ave SC-703/Ben Sawyer 12 Charleston 147.6
6 I-85 I-26/Exit 70 SC-110/Exit 83 13 Spartanburg 142.9
7 I-85 SC-110/Exit 83 US-29/Exit 106 23 North of
Spartanburg 137.3
8 I-26 Jedburg Rd US 17 27 Charleston 132.3
9 I-77 I-26/Exit 1 SC-34/Exit 34 33 Columbia 130.2
10 I-385 Fairview St/Exit 24 End of Freeway 18 Greenville 124.0
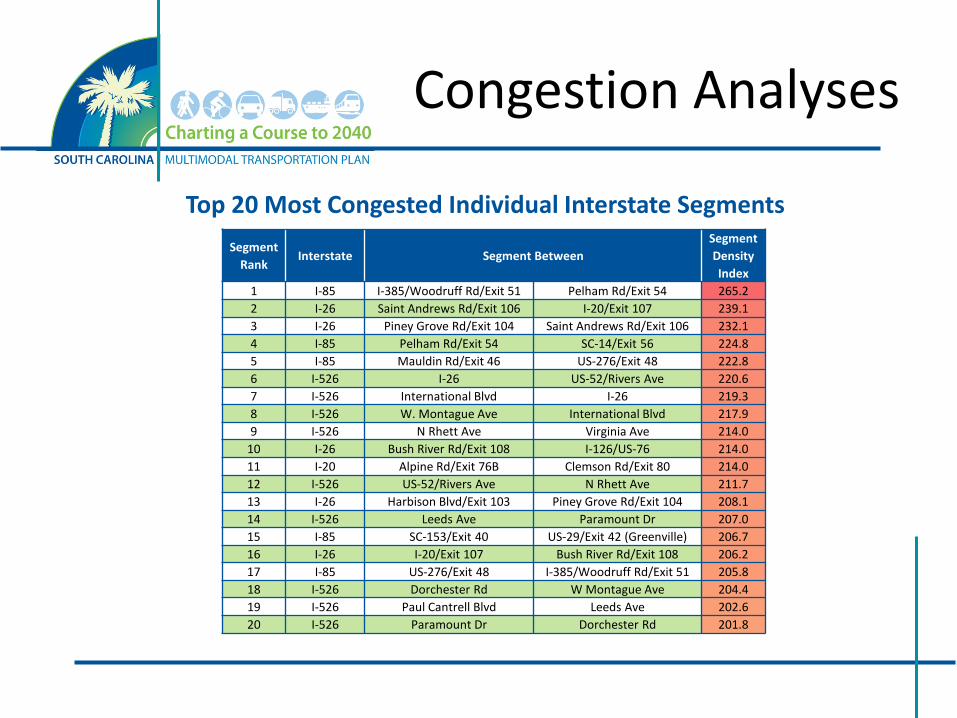
Congestion Analyses
Top 20 Most Congested Individual Interstate Segments Segment
Rank Interstate Segment Between
Segment Density Index
1 I-85 I-385/Woodruff Rd/Exit 51 Pelham Rd/Exit 54 265.2 2 I-26 Saint Andrews Rd/Exit 106 I-20/Exit 107 239.1 3 I-26 Piney Grove Rd/Exit 104 Saint Andrews Rd/Exit 106 232.1 4 I-85 Pelham Rd/Exit 54 SC-14/Exit 56 224.8 5 I-85 Mauldin Rd/Exit 46 US-276/Exit 48 222.8 6 I-526 I-26 US-52/Rivers Ave 220.6 7 I-526 International Blvd I-26 219.3 8 I-526 W. Montague Ave International Blvd 217.9 9 I-526 N Rhett Ave Virginia Ave 214.0
10 I-26 Bush River Rd/Exit 108 I-126/US-76 214.0 11 I-20 Alpine Rd/Exit 76B Clemson Rd/Exit 80 214.0 12 I-526 US-52/Rivers Ave N Rhett Ave 211.7 13 I-26 Harbison Blvd/Exit 103 Piney Grove Rd/Exit 104 208.1 14 I-526 Leeds Ave Paramount Dr 207.0 15 I-85 SC-153/Exit 40 US-29/Exit 42 (Greenville) 206.7 16 I-26 I-20/Exit 107 Bush River Rd/Exit 108 206.2 17 I-85 US-276/Exit 48 I-385/Woodruff Rd/Exit 51 205.8 18 I-526 Dorchester Rd W Montague Ave 204.4 19 I-526 Paul Cantrell Blvd Leeds Ave 202.6 20 I-526 Paramount Dr Dorchester Rd 201.8
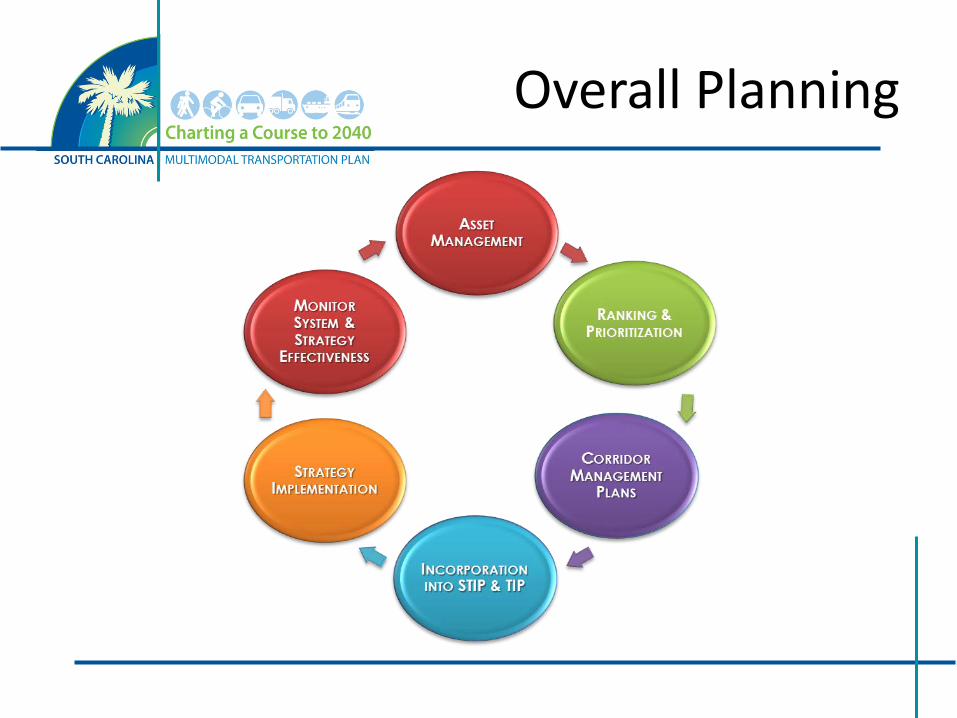
Overall Planning

Overall Planning
• Ranking Process – Congestion – Safety – Truck Traffic – Pavement Quality – Costs – Environmental Screenings – Economic Modeling
• Corridor Management Plans – For worst segments – I-26/I-20/I-126, I-85, I-526 completed
Project Costs
• Planning-level cost estimates were developed for the top 10 most congested interstate corridors.
• Based upon: – Interstate Feasibility Studies that are currently
underway or complete and SCDOT planning estimates.
– SCDOT Planning Office Estimates – Planning-level cost of $15 million per two-way
mile if no further information in known.
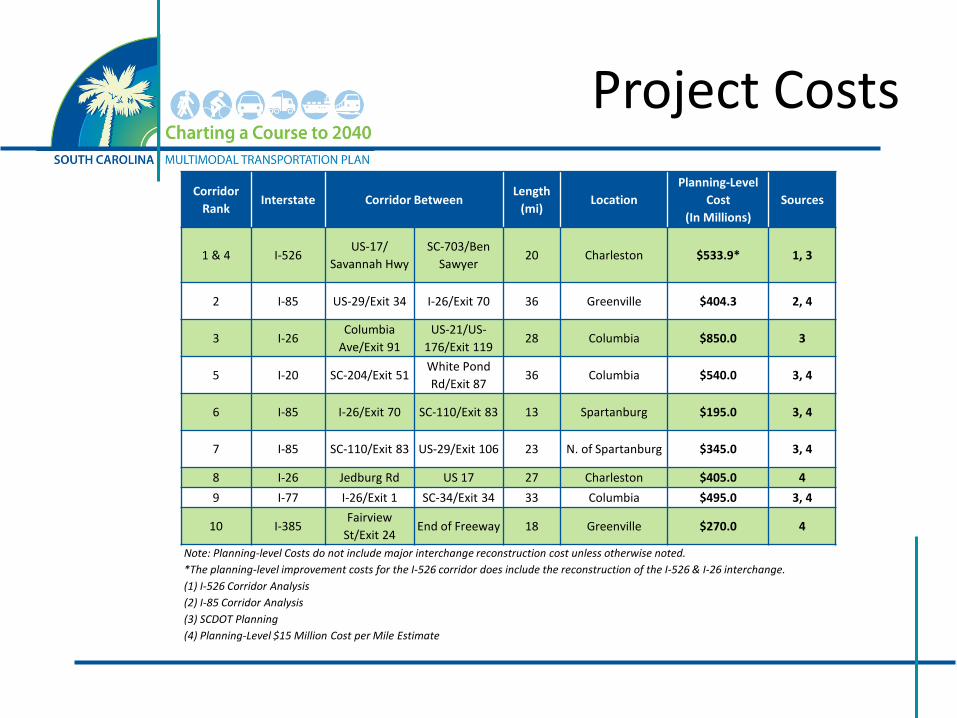
Project Costs
• xxx
Corridor Rank
Interstate Corridor Between Length
(mi) Location
Planning-Level Cost
(In Millions) Sources
1 & 4 I-526 US-17/
Savannah Hwy SC-703/Ben
Sawyer 20 Charleston $533.9* 1, 3
2 I-85 US-29/Exit 34 I-26/Exit 70 36 Greenville $404.3 2, 4
3 I-26 Columbia
Ave/Exit 91 US-21/US-
176/Exit 119 28 Columbia $850.0 3
5 I-20 SC-204/Exit 51 White Pond Rd/Exit 87
36 Columbia $540.0 3, 4
6 I-85 I-26/Exit 70 SC-110/Exit 83 13 Spartanburg $195.0 3, 4
7 I-85 SC-110/Exit 83 US-29/Exit 106 23 N. of Spartanburg $345.0 3, 4
8 I-26 Jedburg Rd US 17 27 Charleston $405.0 4 9 I-77 I-26/Exit 1 SC-34/Exit 34 33 Columbia $495.0 3, 4
10 I-385 Fairview
St/Exit 24 End of Freeway 18 Greenville $270.0 4
Note: Planning-level Costs do not include major interchange reconstruction cost unless otherwise noted. *The planning-level improvement costs for the I-526 corridor does include the reconstruction of the I-526 & I-26 interchange. (1) I-526 Corridor Analysis (2) I-85 Corridor Analysis (3) SCDOT Planning (4) Planning-Level $15 Million Cost per Mile Estimate
Environmental Screenings
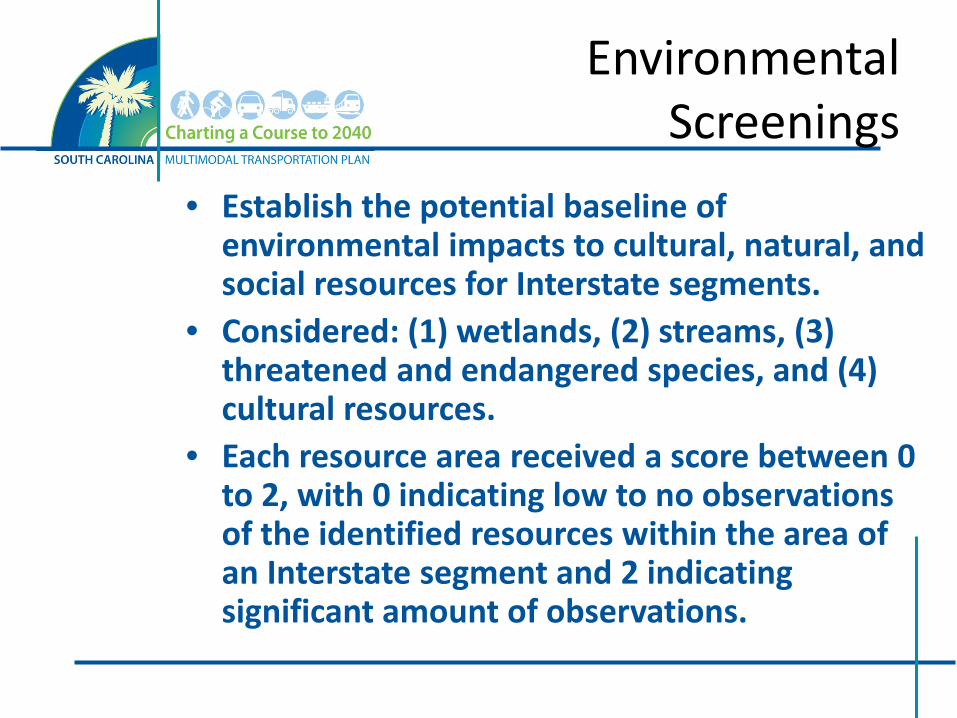
• Establish the potential baseline of environmental impacts to cultural, natural, and social resources for Interstate segments.
• Considered: (1) wetlands, (2) streams, (3) threatened and endangered species, and (4) cultural resources.
• Each resource area received a score between 0 to 2, with 0 indicating low to no observations of the identified resources within the area of an Interstate segment and 2 indicating significant amount of observations.

Environmental Screenings
---- High Impact ---- Medium Impact ---- Low Impact
Environmental Screenings
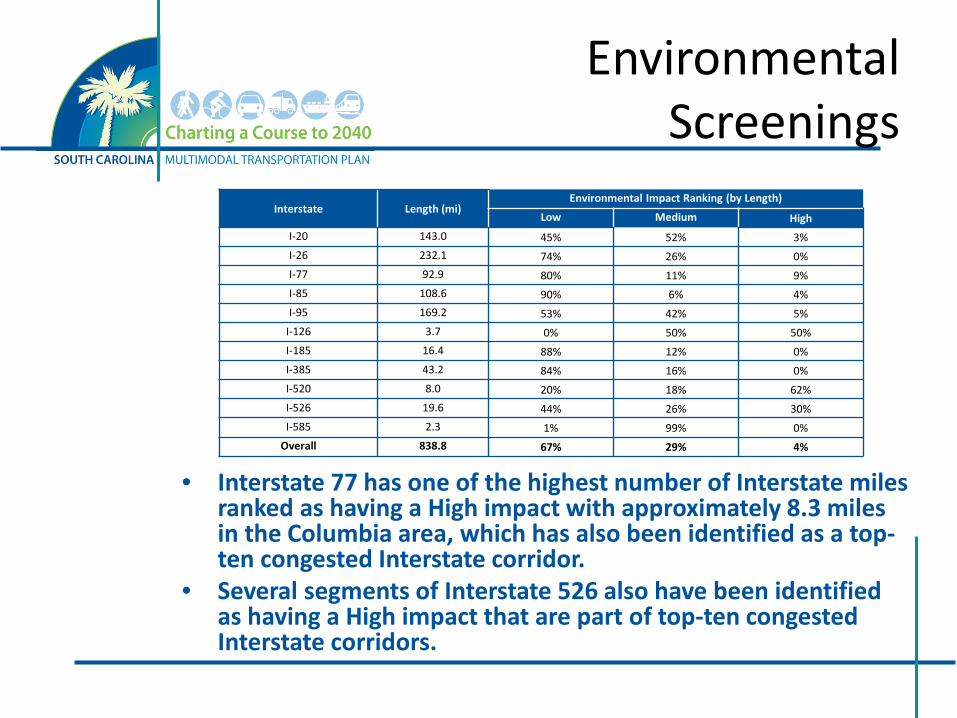
• Interstate 77 has one of the highest number of Interstate miles ranked as having a High impact with approximately 8.3 miles in the Columbia area, which has also been identified as a top-ten congested Interstate corridor.
• Several segments of Interstate 526 also have been identified as having a High impact that are part of top-ten congested Interstate corridors.
Interstate Length (mi) Environmental Impact Ranking (by Length)
Low Medium High I-20 143.0 45% 52% 3% I-26 232.1 74% 26% 0% I-77 92.9 80% 11% 9% I-85 108.6 90% 6% 4% I-95 169.2 53% 42% 5%
I-126 3.7 0% 50% 50% I-185 16.4 88% 12% 0% I-385 43.2 84% 16% 0% I-520 8.0 20% 18% 62% I-526 19.6 44% 26% 30% I-585 2.3 1% 99% 0%
Overall 838.8 67% 29% 4%
Next Steps
• Interchange Needs – Update to SCDOT’s Interstate Interchange
Management System (IIMS)
• Statewide Travel Demand Model currently under development – Long-Range Congestion Projections
QUESTIONS & ANSWERS
STRATEGIC CORRIDOR NETWORK PLAN
Mike Plagens and Praveen Pasumarthy
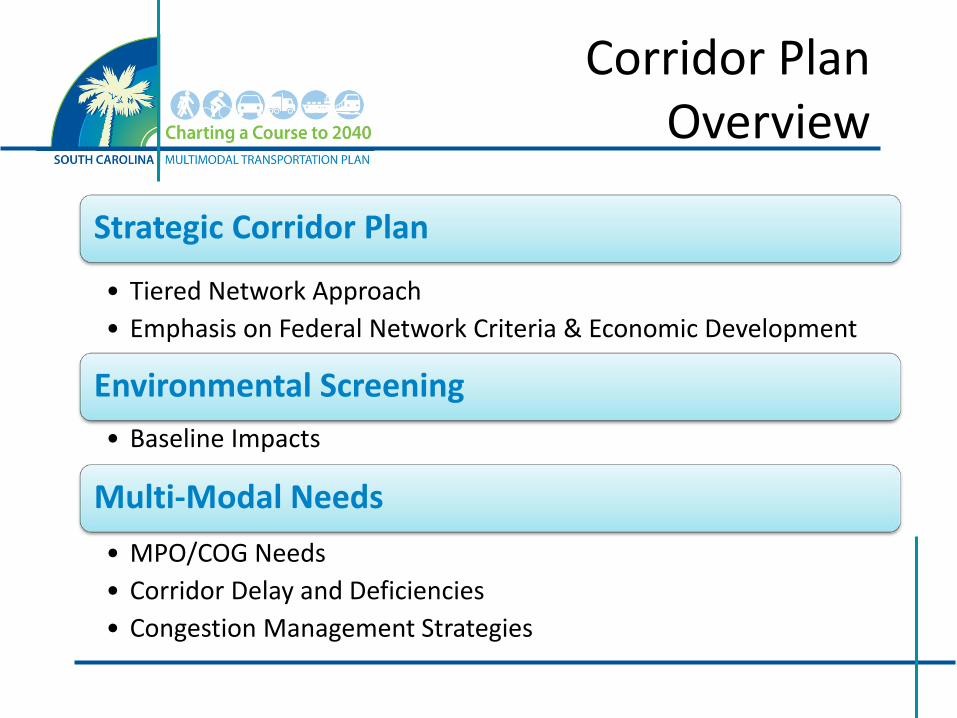
Corridor Plan Overview
Strategic Corridor Plan
• Tiered Network Approach • Emphasis on Federal Network Criteria & Economic Development
Environmental Screening • Baseline Impacts
Multi-Modal Needs • MPO/COG Needs • Corridor Delay and Deficiencies • Congestion Management Strategies
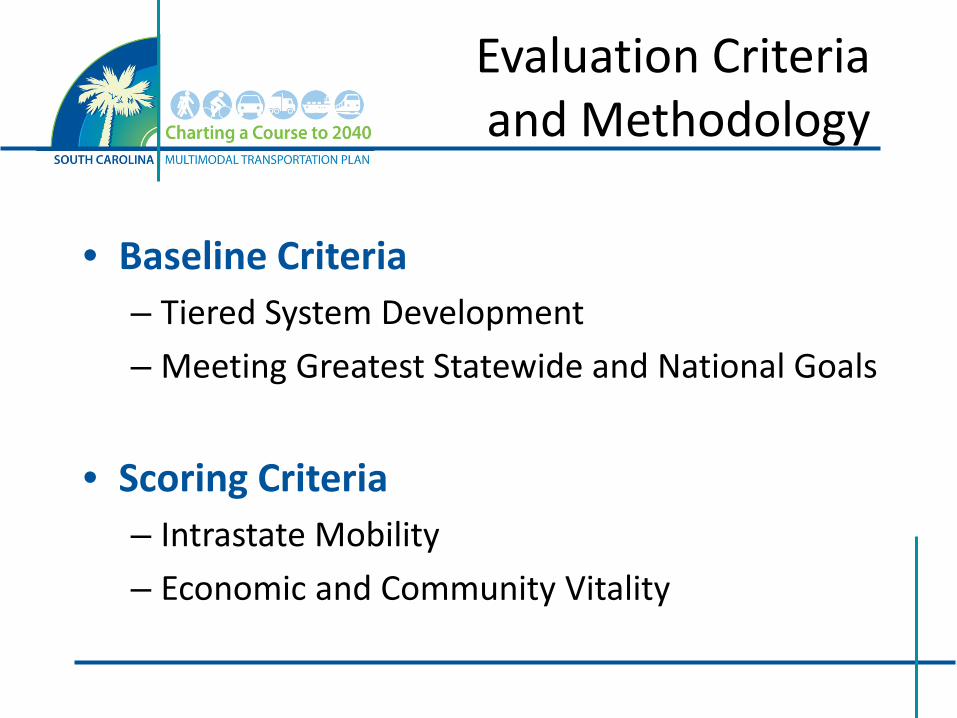
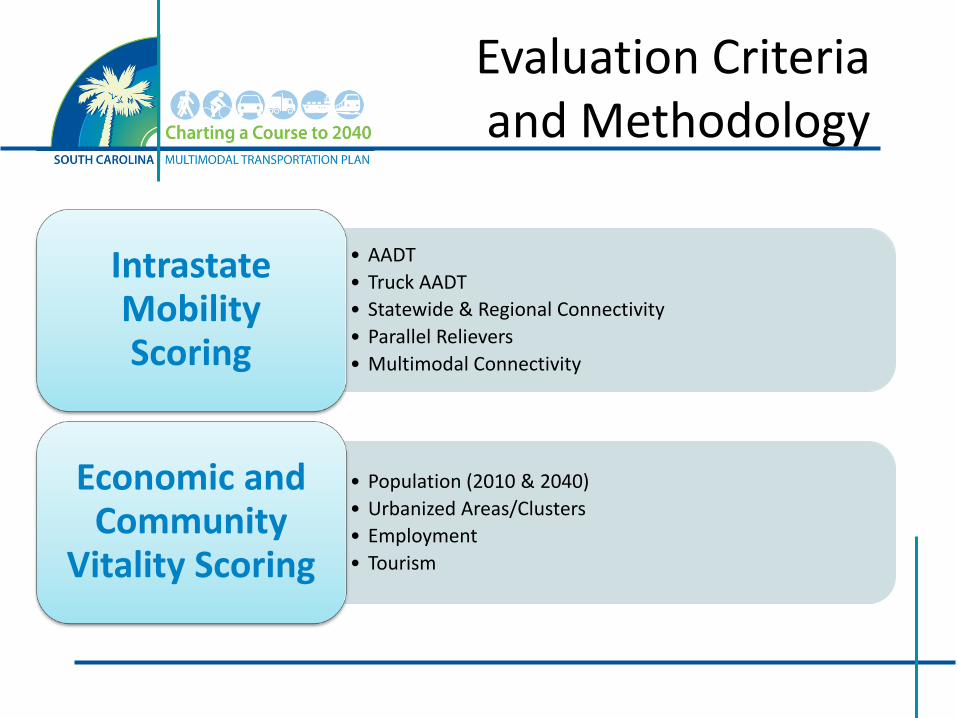
Evaluation Criteria and Methodology
• Baseline Criteria – Tiered System Development – Meeting Greatest Statewide and National Goals
• Scoring Criteria – Intrastate Mobility – Economic and Community Vitality
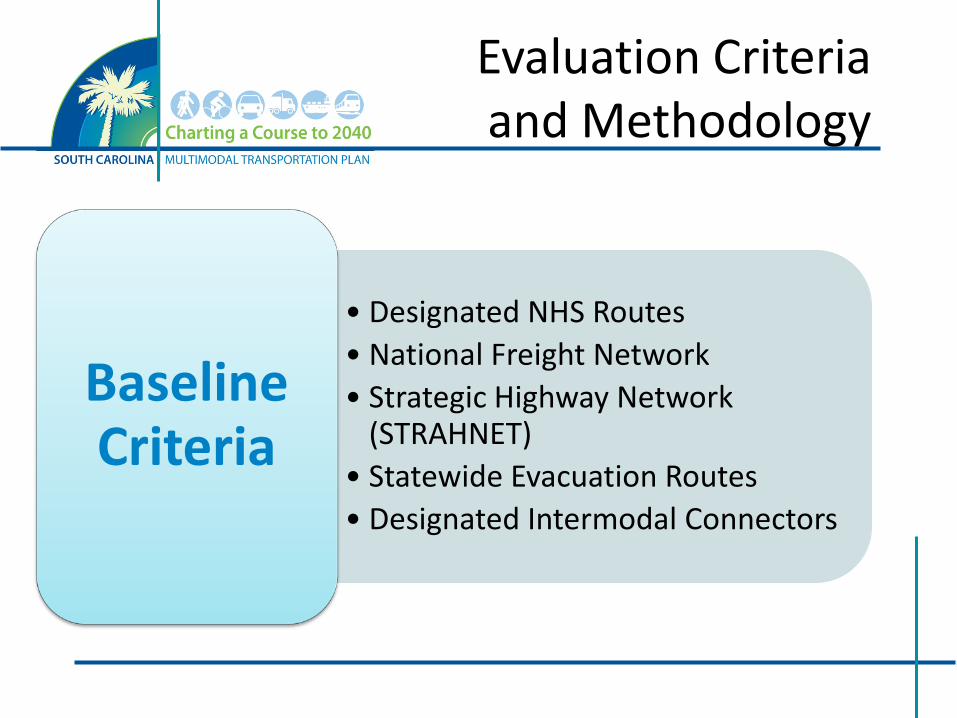
Evaluation Criteria and Methodology
• Designated NHS Routes • National Freight Network • Strategic Highway Network
(STRAHNET) • Statewide Evacuation Routes • Designated Intermodal Connectors
Baseline Criteria
Evaluation Criteria and Methodology
• AADT • Truck AADT • Statewide & Regional Connectivity • Parallel Relievers • Multimodal Connectivity
Intrastate Mobility Scoring
• Population (2010 & 2040) • Urbanized Areas/Clusters • Employment • Tourism
Economic and Community
Vitality Scoring
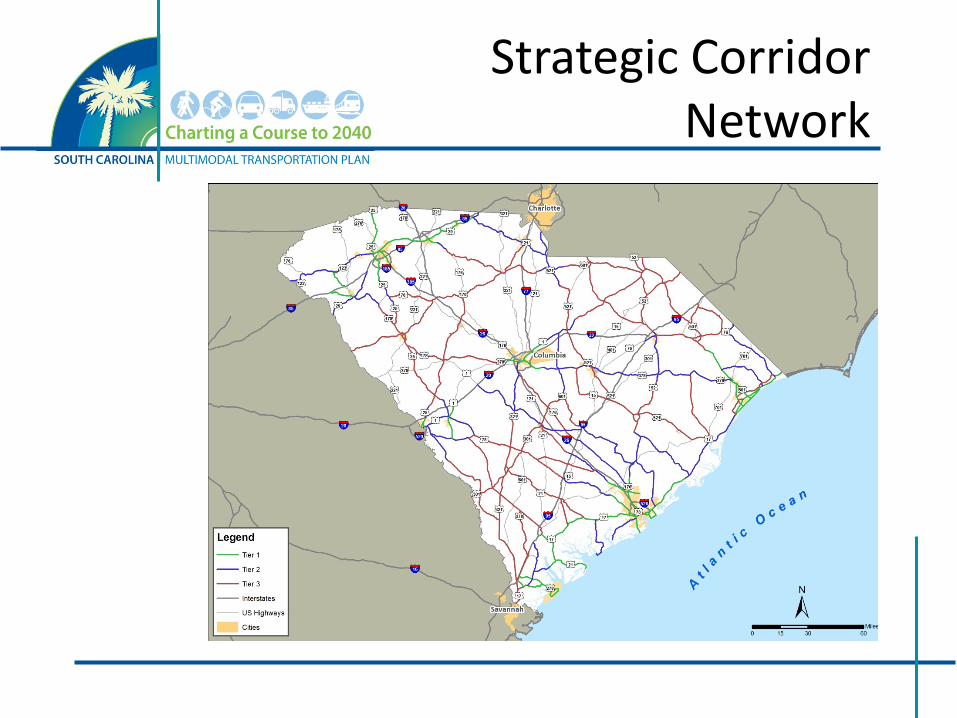
Strategic Corridor Network

Environmental Screening
• Baseline of Environmental Impacts – Federal Level: MAP-21 – State Level: Act 114
• Methodology – Reviewed four resource areas
• Wetlands • Streams
– Scoring system to rank each resource area
• Threatened and endangered species • Cultural resources
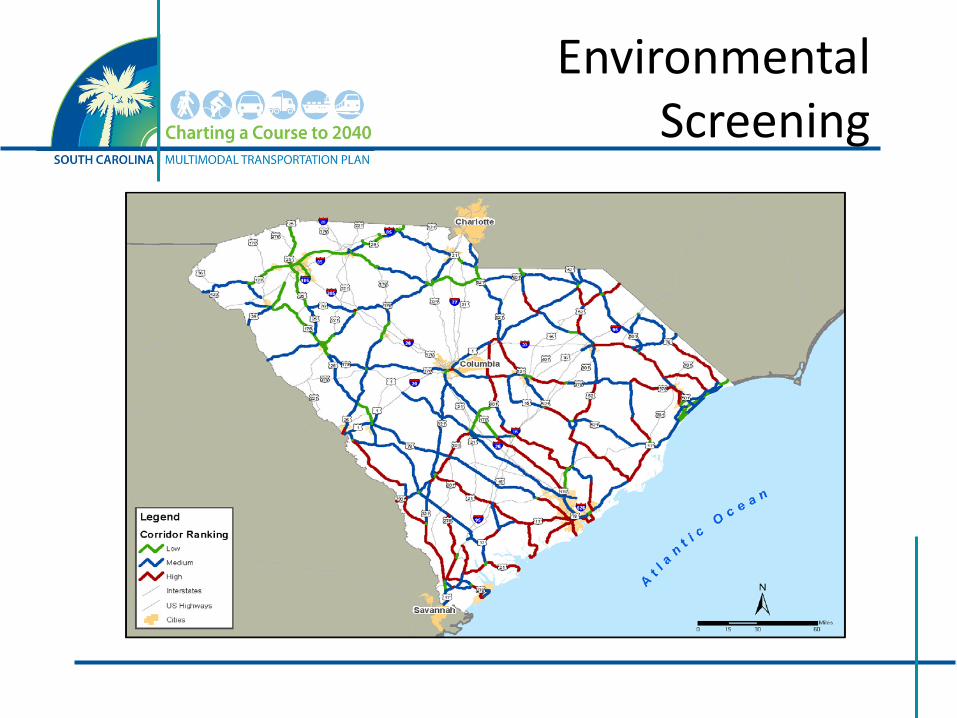
Environmental Screening
Multi-Modal Needs
• Methodology – Corridor Delay and Deficiencies – MPO/COG plans – Level of Service – Multi-Modal Criteria
• On-going Process
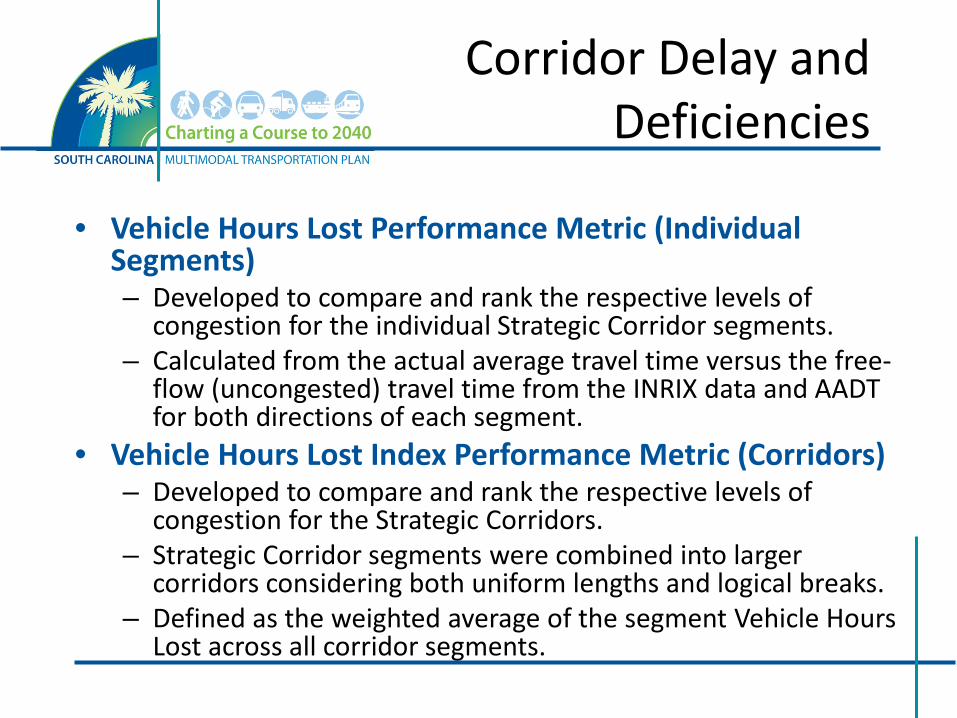
Corridor Delay and Deficiencies
• Vehicle Hours Lost Performance Metric (Individual Segments) – Developed to compare and rank the respective levels of
congestion for the individual Strategic Corridor segments. – Calculated from the actual average travel time versus the free-
flow (uncongested) travel time from the INRIX data and AADT for both directions of each segment.
• Vehicle Hours Lost Index Performance Metric (Corridors) – Developed to compare and rank the respective levels of
congestion for the Strategic Corridors. – Strategic Corridor segments were combined into larger
corridors considering both uniform lengths and logical breaks. – Defined as the weighted average of the segment Vehicle Hours
Lost across all corridor segments.
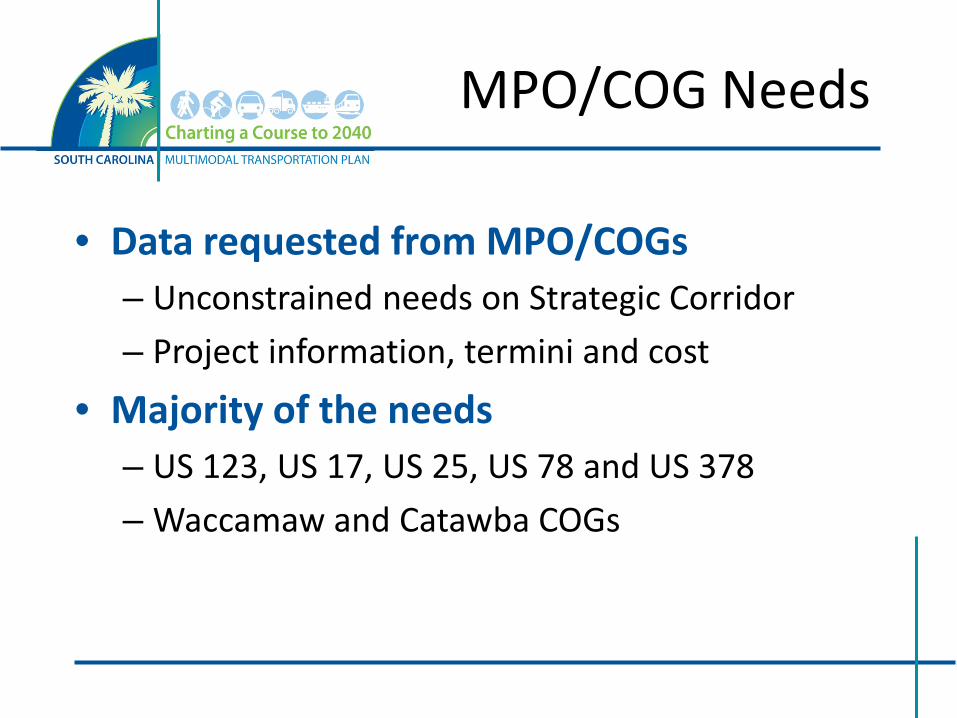
MPO/COG Needs
• Data requested from MPO/COGs – Unconstrained needs on Strategic Corridor – Project information, termini and cost
• Majority of the needs – US 123, US 17, US 25, US 78 and US 378 – Waccamaw and Catawba COGs
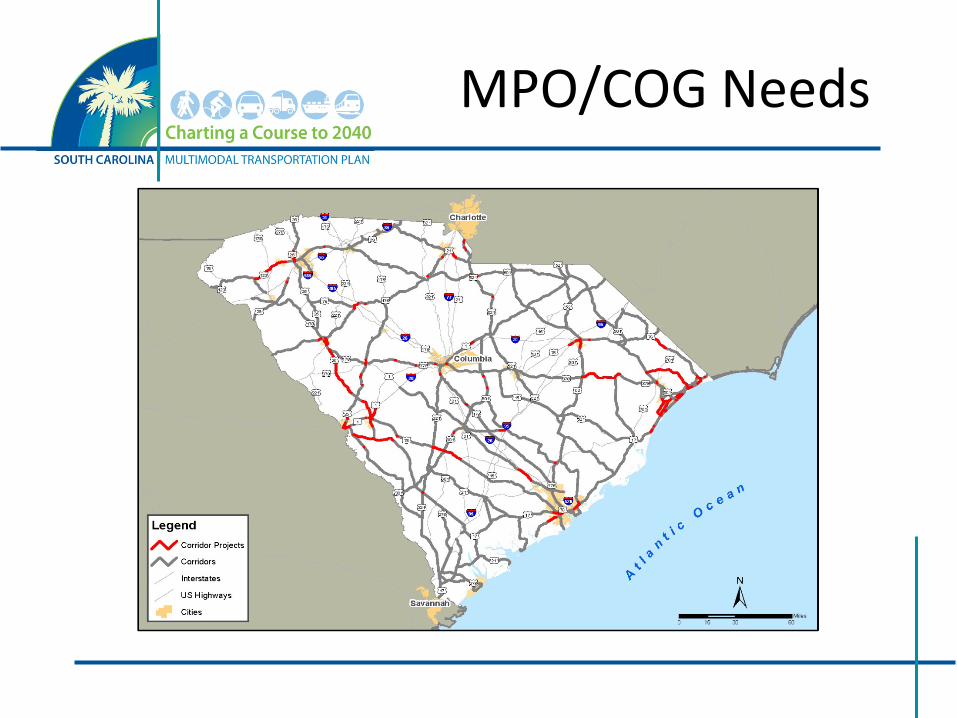
MPO/COG Needs
Overall Planning Approach
• Implement corridor management plans
• Coordinate with and integrate MPO/COG plans
• Long-range considerations of statewide model
• Economic considerations
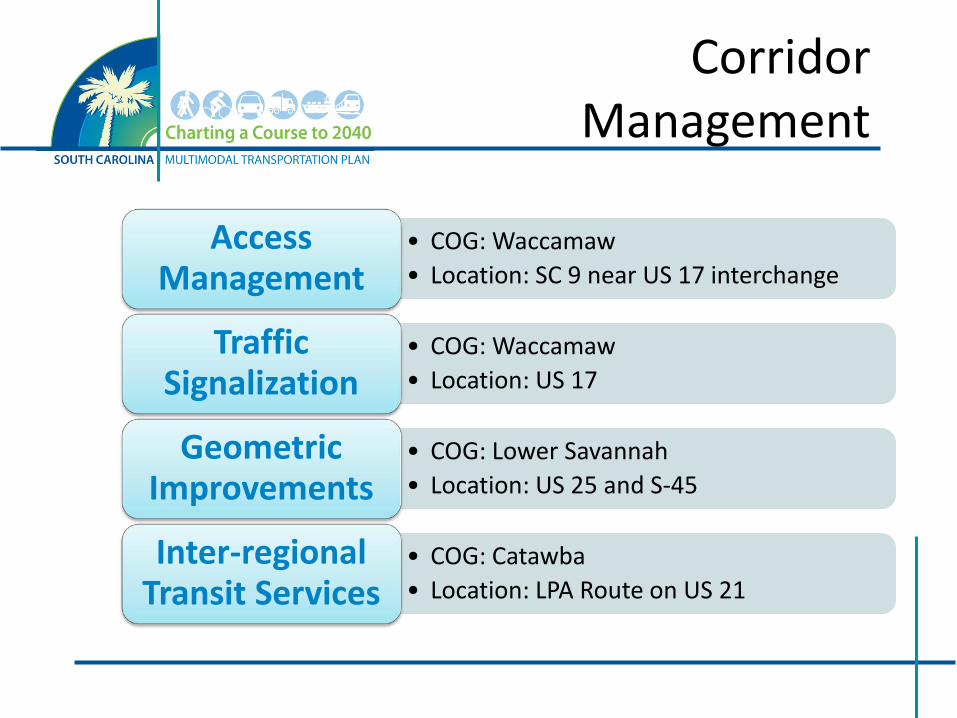
Corridor Management
• COG: Waccamaw • Location: SC 9 near US 17 interchange
Access Management
• COG: Waccamaw • Location: US 17
Traffic Signalization
• COG: Lower Savannah • Location: US 25 and S-45
Geometric Improvements
• COG: Catawba • Location: LPA Route on US 21
Inter-regional Transit Services
QUESTIONS & ANSWERS

Mark Pleasant, SCDOT [email protected] 803-737-1437 Jeff Carroll, CDM Smith [email protected] 803-251-2189
Project Website:
http://www.scdot.org/Multimodal/default.aspx