Embed Size (px)
Citation preview

Interstate 5
Corridor Economic
Development Plan June 3, 2010
Prepared for: Southern California Association of Governments
Prepared by: The McCarty Company LLC
700 South Flower Street, Suite 1000
Los Angeles, CA 90017
―Funding: The preparation of this report was financed in part through grants from the United States
Department of Transportation (DOT).‖
―The contents of this report reflect the views of the author who is responsible for the facts and
accuracy of the data presented herein. The contents do not necessarily reflect the official views or
policies of SCAG or DOT. This report does not constitute a standard, specification or regulation.‖

EXECUTIVE SUMMARY
The 30-mile segment of Interstate 5 that is the spine of the ―Interstate 5
Corridor‖ in Los Angeles County represents a true region of opportunity.
Bookended by Glendale/Burbank to the south and Santa Clarita on the north,
the I-5 Corridor is richly diverse by nearly any demographic or economic
measure—population, occupations, incomes, housing, industries or lifestyles.
The Corridor is surrounded by some of the nation’s leading educational
institutions and has an amazingly diverse mix of businesses, industries and
workforce. Surprisingly, there is still some remaining availability of
buildable land. And, as the area has matured, large tracts of land used for
heaving industry and mining are offering new opportunities for
redevelopment.
The region is replete with opportunities for private redevelopment. In many
cases, the corridor’s potential can only be unlocked through partnerships
between private capital, city planning, community development and
redevelopment agencies. These opportunities are situated in the heart of the
nation’s second-largest metropolis providing an ideal breeding ground for
economic development and innovation. The main purpose of this plan is to
offer a roadmap for transforming these rich opportunities into realities.
In anticipation of the development of the SFVCOG, the Southern California
Association of Governments (SCAG) in coordination with the Mulholland
Institute and the Valley Economic Alliance (VEA) commissioned the
development of this Interstate 5 Corridor Economic Development Plan
(I5CEDP) with a vision that it would serve as an important starting point for
the economic development initiatives of the soon-to-be-formed SFVCOG.
The formation of the San Fernando Valley Council of Governments
(SFVCOG) in May of 2010 is the bold first step in that direction. Its
chartering documents include responsibilities that can be grouped into four
general roles: (1) creating collaboration between the localities in areas of
mutual interest, (2) serving as a clearinghouse for information, (3) advocating
for the region’s interests, and (4) coordinating regional responses and efforts
to advance economic and community development.
Similarly, this Economic Development Plan identifies four parallel roles for
the SFVCOG in the area of economic development:
1. Foster collaboration and cooperation between the constituent
jurisdictions and agencies within the corridor;
2. Leverage and build on the region's economic strengths;
Interstate 5 Corridor Economic Development Plan
ii | P a g e
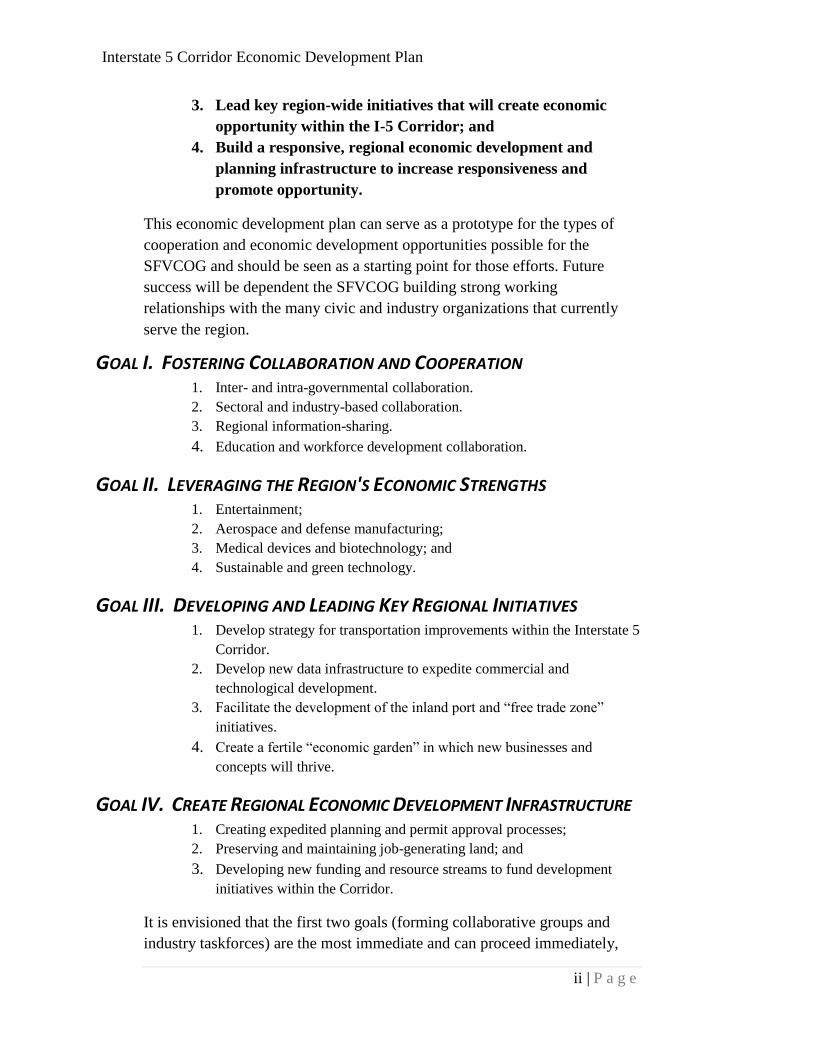
3. Lead key region-wide initiatives that will create economic
opportunity within the I-5 Corridor; and
4. Build a responsive, regional economic development and
planning infrastructure to increase responsiveness and
promote opportunity.
This economic development plan can serve as a prototype for the types of
cooperation and economic development opportunities possible for the
SFVCOG and should be seen as a starting point for those efforts. Future
success will be dependent the SFVCOG building strong working
relationships with the many civic and industry organizations that currently
serve the region.
GOAL I. FOSTERING COLLABORATION AND COOPERATION 1. Inter- and intra-governmental collaboration.
2. Sectoral and industry-based collaboration.
3. Regional information-sharing.
4. Education and workforce development collaboration.
GOAL II. LEVERAGING THE REGION'S ECONOMIC STRENGTHS 1. Entertainment;
2. Aerospace and defense manufacturing;
3. Medical devices and biotechnology; and
4. Sustainable and green technology.
GOAL III. DEVELOPING AND LEADING KEY REGIONAL INITIATIVES 1. Develop strategy for transportation improvements within the Interstate 5
Corridor.
2. Develop new data infrastructure to expedite commercial and
technological development.
3. Facilitate the development of the inland port and ―free trade zone‖
initiatives.
4. Create a fertile ―economic garden‖ in which new businesses and
concepts will thrive.
GOAL IV. CREATE REGIONAL ECONOMIC DEVELOPMENT INFRASTRUCTURE 1. Creating expedited planning and permit approval processes;
2. Preserving and maintaining job-generating land; and
3. Developing new funding and resource streams to fund development
initiatives within the Corridor.
It is envisioned that the first two goals (forming collaborative groups and
industry taskforces) are the most immediate and can proceed immediately,

Interstate 5 Corridor Economic Development Plan
iii | P a g e
while the major infrastructure and regulatory reform processes of the third
and fourth goals will require more time and study to accomplish.
With the creation of the San Fernando Valley COG, we now have the
framework to implement inter-jurisdictional strategies and pursue common
goals for the benefit of the region.

TABLE OF CONTENTS
Executive Summary ....................................................................................................................... i
Goal I. Fostering Collaboration and Cooperation .............................................................................. ii
Goal II. Leveraging the Region's Economic Strengths ...................................................................... ii
Goal III. Developing and Leading Key Regional Initiatives ............................................................. ii
Goal IV. Create Regional Economic Development Infrastructure ................................................... ii
Table of Contents ......................................................................................................................... iv
Introduction ................................................................................................................................... 1
The I-5 Corridor — The Land of Opportunity.................................................................................... 1
Moving the I-5 Corridor Forward: A Plan For the Future ...................................................... 2
The Tension between Regional Collaboration and Competition ....................................................... 3
Goals of this Economic Development Plan ........................................................................................... 3
Goal I. Fostering Collaboration and Cooperation .............................................................................. 4 Objective 1.1. Fostering Communication Across Governments ......................................................................... 4
Objective 1.2. Build Cross-sectoral, Cross-jurisdictional and Inter-agency Focus on Specific
Sectors and Initiatives .......................................................................................................................................... 5
Objective 1.3. Develop Regional Data-sharing Infrastructure and Collaboration ............................................... 6
Objective 1.4. Establish Dialogue for Collaboration Between Regional Workforce
Development Initiatives, Secondary Education and Postsecondary Education Institutions ................................ 7
Goal II. Leveraging the Region's Economic and Demographic Strengths ....................................... 8 Objective 2.1. Develop growth and retention initiatives that support the entertainment industry....................... 8
Objective 2.2. Develop growth and retention initiatives that support the aerospace and defense
manufacturing cluster. ........................................................................................................................................ 10
Objective 2.3. Develop growth and retention initiatives that support the medical devices and
biomedical industries. ........................................................................................................................................ 12
Objective 2.4. Develop growth and retention initiatives that support the sustainable and green
technology industries. ........................................................................................................................................ 14
Goal III. Developing and Leading Key Regional Initiatives ........................................................... 16 Objective 3.1. Explore Options for Transportation Improvement Along the I-5 Corridor ................................ 16
Objective 3.2. Development of Key Data Infrastructure ................................................................................... 17
Objective 3.3. Facilitate the development of the I-5 Inland Port proposal and "Free Trade Zone"
initiatives. ........................................................................................................................................................... 18
Objective 3.4. Expand the use of "economic gardening" across the corridor. ................................................... 18
Goal IV. Create and Maintain Regional Economic Planning and Responsiveness
Infrastructure ....................................................................................................................................... 19

Interstate 5 Corridor Economic Development Plan
v | P a g e
Objective 4.1. Provide leadership in accommodating economic development and expediting
approvals in the local planning infrastructure. ................................................................................................... 19
Objective 4.2. Develop regional initiatives and proposals that maintain job-generating land. ......................... 20
Objective 4.3. Develop new funding streams and strategies to support economic development
initiatives in the corridor. ................................................................................................................................... 21
Why it matters… .................................................................................................................................. 22
The Dynamics of Building This Plan .................................................................................................. 23 The Role of This Plan Relative to the SFVCOG ................................................................................................ 23
The Relationship of This Plan to Existing Efforts .............................................................................................. 24
The Plan Development Process .......................................................................................................................... 25
References and Sources ...................................................................................................................................... 26
The Plan Agenda ................................................................................................................................................ 27
THE CORRIDOR: THEN AND TODAY ............................................................................... 27
The Interstate-5 Corridor Then .......................................................................................................... 28
Education and Income ......................................................................................................................... 31
Housing .................................................................................................................................................. 32 Workforce Housing ............................................................................................................................................ 35
Executive Housing ............................................................................................................................................. 38
Jobs-Housing Mix .............................................................................................................................................. 39
Transportation ...................................................................................................................................... 40 The Interstate-5 Transportation Infrastructure ................................................................................................... 44
Commuter Rail/Transit ....................................................................................................................................... 50
Goods Movement and Infrastructure .................................................................................................................. 52
Where we are now… ............................................................................................................................ 54
Appendix 1: Attendees at I-5 Corridor Economic Development Plan Study - Roundtable 1
....................................................................................................................................................... 62
Appendix 2: Attendees at I-5 Corridor Economic Development Plan Study - Roundtable
2..................................................................................................................................................... 65
Appendix 3: Summary of Key References .............................................................................. 67
Appendix 4: Inventory of Key Participants and Actors ........................................................ 71

Interstate 5 Corridor Economic Development Plan
1 | P a g e
INTRODUCTION
THE INTERSTATE-5 CORRIDOR—A TALE OF FIVE CITIES
Because it is such a sprawling megalopolis, it can be difficult to determine
where greater Los Angeles begins and ends. By some, more expansive
definitions it extends from the edge of Camp Pendleton on the south to the
mountain passes of the San Gabriels on the north. For sub-areas like the San
Fernando and Santa Clarita valleys, identity and cohesiveness can be even
more elusive—even in a combined subregion of two million residents.
The I-5 Corridor plan adopts the view that subregional strategies are part of
the solution; not used instead of regional thinking, but as a supplement—as a
way of dealing with the unique opportunities and challenges of such
complementary locales as L.A.’s valleys and sibling suburbs. Using the
newly-formed San Fernando Valley Council of Governments joint-powers
agency, a conduit has been established that will allow unprecedented cross-
collaboration between and among corridor cities. The COG provides an
opportunity for multi-jurisdictional consensus building and unified initiatives
for the betterment of this vital two-valley region.
This project’s geographical focus is a 30-mile segment along the Interstate 5
freeway which extends from California Route 126 to the north, east across
Santa Clarita Valley, southeast through the east San Fernando Valley and
southeast into Burbank and Glendale down to the northern edge of downtown
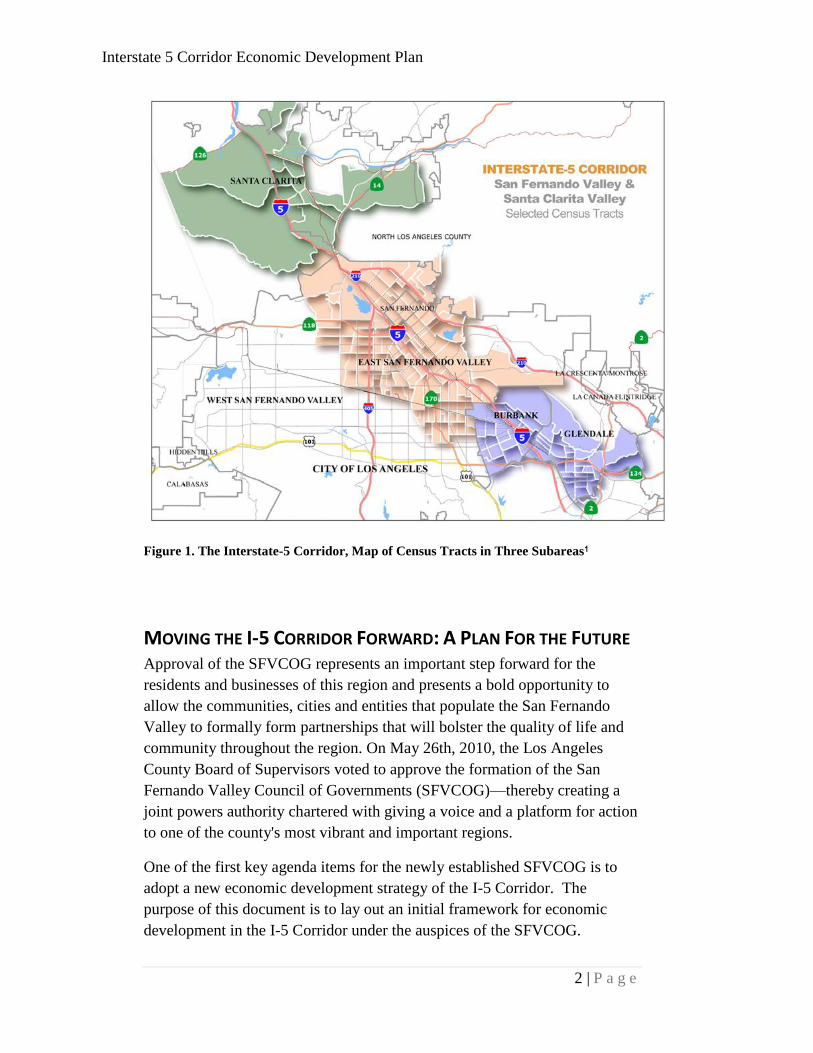
Los Angeles. Figure 1 provides a map of the I-5 Corridor. These
boundaries correspond to those used in the Interstate-5 Corridor: Economic
and Community Development Strategy.
Interstate 5 Corridor Economic Development Plan
2 | P a g e
Figure 1. The Interstate-5 Corridor, Map of Census Tracts in Three Subareas1
MOVING THE I-5 CORRIDOR FORWARD: A PLAN FOR THE FUTURE Approval of the SFVCOG represents an important step forward for the
residents and businesses of this region and presents a bold opportunity to
allow the communities, cities and entities that populate the San Fernando
Valley to formally form partnerships that will bolster the quality of life and
community throughout the region. On May 26th, 2010, the Los Angeles
County Board of Supervisors voted to approve the formation of the San
Fernando Valley Council of Governments (SFVCOG)—thereby creating a
joint powers authority chartered with giving a voice and a platform for action
to one of the county's most vibrant and important regions.
One of the first key agenda items for the newly established SFVCOG is to
adopt a new economic development strategy of the I-5 Corridor. The
purpose of this document is to lay out an initial framework for economic
development in the I-5 Corridor under the auspices of the SFVCOG.

Interstate 5 Corridor Economic Development Plan
3 | P a g e
THE TENSION BETWEEN REGIONAL COLLABORATION AND COMPETITION
Because of the inclusion of numerous municipal jurisdictions within the I-5
Corridor, there is an inherent tension between cooperation and competition
between the communities involved. The Cities of Burbank, Glendale, Santa
Clarita, and Los Angeles, as well as the County of Los Angeles all have
active and focused community economic development strategies. Especially
in periods of constrained economic activity, these jurisdictions are actively
competing to attract, retain, or develop new business opportunities.
At the same time, this competition benefits all of the communities in the
corridor. If a new or existing firm decides to expand jobs in one of the cities
in the corridor, the region is so interconnected that a significant share of the
new jobs may well be staffed by residents of an adjoining city.
Consequently, there is a benefit to all of the communities in the corridor
when other cities are successful in attracting new opportunities.
When the rich diversity of the communities and the differences in their
residential labor forces, economic bases, locations, educational opportunities,
housing mixes and infrastructure are considered, there is considerable benefit
to marketing the region as a joint entity and as an advantage to its constituent
communities in addition to attributes that each community may individually
have. The purpose of this strategy is not to replace the local economic
development initiatives in the jurisdictions that compose the I-5 Corridor but
rather to complement them with a new set of tools and resources that can
further enhance the effectiveness of both local and joint initiatives.
GOALS OF THIS ECONOMIC DEVELOPMENT PLAN
The primary goal of this economic development strategy is to enhance the
quality of life for residents and workers in the I-5 corridor by maximizing the
economic opportunities and quality of life of people within the region. The
Los Angeles Economic Development Corporation completed its Los Angeles
County Strategic Plan for Economic Development 2010-2014 in early 2010.
In that document, the LAEDC proposes five goals that set an important
context for this economic development plan:
1. Prepare an educated workforce;
2. Create a business-friendly environment;
3. Enhance our quality of life;
4. Implement smart land use; and
5. Build 21st Century infrastructure.
Interstate 5 Corridor Economic Development Plan
4 | P a g e
In the context of these general objectives, this economic development plan
adds four additional goals to this initiative:
1. Foster collaboration and cooperation between the
constituent jurisdictions and agencies within the corridor;
2. Leverage and build on the region's economic strengths;
3. Identify and lead regional initiatives that will create
economic opportunity within the I-5 Corridor; and
4. Build regional economic development and planning
infrastructure to increase responsiveness and promote
opportunity.
In this plan, the details of the region's plan to accomplish each of these goals
will be discussed and evaluated. In each instance, the objectives and best
practices associated with each goal are discussed and appropriate action
items are identified.
GOAL I. FOSTERING COLLABORATION AND COOPERATION
The SFVCOG is intended to play a collaborative and complementary role in
assisting the local county and cities, and their various departments and
agencies, advance the already rich and diverse set of economic development
initiatives under way. As such, creating a framework for collaboration and
cooperation is one of the SFVCOG’s primary and most important functions.
Numerous public and private organizations and actors are key players within
the I-5 Corridor and the first priority of this Plan is to build bridges and
social capital so that these actors can work together more effectively to
achieve their common goals.
Objective 1.1. Fostering Communication Across Governments
The I-5 Corridor, as a region, shares a common employment base, roads,
retail centers, diverse housing, and workforce, but it is governed by six
separate jurisdictions. Each of these jurisdictions works diligently to
distinguish itself as a unique employment and living destination. The role of
the SFVCOG and this Plan is to identify areas where the jurisdictions have
mutual interests and can work together, along with their respective private
party interests to facilitate actions in their mutual benefit.

Interstate 5 Corridor Economic Development Plan
5 | P a g e
Action Item 1.1a. Establish a committee of appropriate public sector
community development representatives.
The first step in this process is to institute a protocol and routine for
collaborative meetings between the appropriate community development
directors within the six jurisdictions (the Cities of Burbank, Glendale, Los
Angeles, Santa Clarita and San Fernando, and the County of Los Angeles).
Such a formal mechanism, when active and routinized, will allow for the
local governments to not only share information and collaborate on planning
economic initiatives, such as those discussed in Goals II and III below, but to
also collaborate on the development of ongoing regional processes such as
workforce development, data sharing, etc. Development of this plan has
initiated important dialogues on topics such as these and they need to be
formally organized and established under the auspices of the SFVCOG.
Action Item 1.1b. Establish and periodically convene appropriate
committees of public sector representatives that relate to specific aspects of
the economic development process including transportation, public works,
infrastructure, and planning.
Beyond the assemblage of community development departments, the
SFVCOG will serve as a strong nexus for political dialogue and cooperation
within the constituent jurisdictions. It is essential that the SFVCOG develop
functionally-driven collaborations with appropriate representatives of the
specific cities, county, and region. These working groups should be built
around specific purposes as needed, and should include political
representatives, as well as key representatives from functional departments
such as transportation, public works, infrastructure, and planning.
Objective 1.2. Build Cross-sectoral, Cross-jurisdictional, and Inter-
agency Focus on Specific Sectors and Initiatives
One of the most powerful aspects of the efforts to develop this proposal was
a clear consensus between public officials, industry associations, and local
business people about the need for greater and more effective joint efforts to
foster and promote the interests and needs of local businesses. The public-
private relationships within this region should be significantly enhanced by
the formation of the SFVCOG and it is incumbent on the SFVCOG to
continue these relationships as one of its highest priorities.
Examples of industries that are already pursuing joint regional deliberations
include aerospace manufacturing, entertainment, logistics, and warehousing.
As part of this economic development plan, the SFVCOG should specifically

Interstate 5 Corridor Economic Development Plan
6 | P a g e
and systematically identify key industry clusters (See Goal II below) to
advance and create specific "strike teams" for those sectors that will engage
public, private, and nonprofit actors in the development and pursuit of
businesses within each of those sectors.
Action Item 1.2a. Develop "strike teams" within each of the priority
industry cluster.
Each of these "strike teams," as is the role of fire suppression strike teams, is
to engage the obstacles and challenges faced by their respective industries.
They will be staffed by representatives from the community, officials from
interested jurisdictions, leaders from business, and officials from appropriate
industry associations who will assist in developing local and regional
initiatives targeted at specific industries.
Objective 1.3. Develop Regional Data-sharing Infrastructure and
Collaboration
Another critical role for the SFVCOG in the Economic Development of the I-
5 Corridor is the development of a repository of data and resources relating
to the region and its economic development. This resource functions as a
"one-stop shop" for prospective new employers and developers within the
region, and also as a resource enabling jurisdictions within the corridor to
share information.
The Mulholland Institute's Interstate-5 Community and Economic
Development Strategy (I5CEDS), this Plan and the accompanying Interstate
5 Corridor Economic Development Plan: Threshold Assessment (I5TA)
report represent the first steps in developing materials to serve as resources
for regional collaboration along the I-5 Corridor. But, much more needs to
be shared within the corridor by its constituent jurisdictions.
Action Item 1.3a. Compile a list of resources that can be shared between the
jurisdictions.
This resource base might include information from the individual city and
county websites relevant to the I-5 Corridor; materials from the Mulholland
Institute, the Valley Industry and Commerce Association and the Economic
Alliance of the San Fernando Valley; and materials from the numerous
governmental agencies whose work and jurisdictions impact this corridor,
including SCAG, the MTA, LAEDC, the SCAQMD, and CalTrans.

Interstate 5 Corridor Economic Development Plan
7 | P a g e
Action Item 1.3b. Develop a website with these resources for both internal
and external access.
The website would contain regional resources available to prospective
employers and developers, as well as local resources available within each of
the constituent jurisdictions. This can be one of the easiest and yet most
valuable items to complete.
Action Item 1.3c. Advocate the Identification of Sub-regions Within the
County's "Jobs-creating Land" database initiative.
One of the expressed priorities of the LAEDC's Strategic Plan for Economic
Development 2010-2014 is the development of a database for facilitating the
retention and expansion of local companies. The SFVCOG should work with
the County to ensure the database contains adequate local and regional
identifiers and tools that it can be used to assist economic development in the
I-5 Corridor area. The SFVCOG should assume a leadership role in ensuring
that the I-5 Corridor's data is made available as part of this initiative.
Objective 1.4. Establish Dialogue for Collaboration Between Regional
Workforce Development Initiatives, Secondary Education, and
Postsecondary Education Institutions
The SFVCOG should host a collaborative dialogue between the I-5
Corridor's community colleges, adult education programs, and universities to
assist in the identification and development of new workforce-oriented
educational objectives that can support demands for specially-skilled labor
within the local labor market. The College of the Canyons, Glendale
Community College, Los Angeles City College, Pasadena City College,
Woodbury University, the University of La Verne, California State
University, Northridge, among others, are all located immediately within the
I-5 Corridor and all serve as major workforce education resources.
Additionally, local adult schools and Regional Occupational Programs
(ROPs) should be engaged. As discussed in Objective 1.2, the efforts of the
public sector should be in partnership with the efforts of the private and
nonprofit sectors. These collaborations should build upon the successes
already seen in the San Fernando Worksource Collaborative and the
Educated Workforce Initiative.
Interstate 5 Corridor Economic Development Plan
8 | P a g e
Action Item 1.4a. Convene workforce development educational
collaboration committee.
GOAL II. LEVERAGING THE REGION'S ECONOMIC AND DEMOGRAPHIC
STRENGTHS
One of the main characteristics of an effective Economic Development Plan
is that it builds on the many strengths of the region. These strengths can
range from unique natural resources to specialized workforces to strong
existing industry clusters to location and even climate. This Plan builds upon
the region’s strengths as laid out in the Mulholland Institute's Interstate-5
Community and Economic Development Strategy (2006), the LAEDC's
Industry Cluster Reports (2008), as well as the research included in this
report. Based on the region’s strengths, combined with feedback from
individual stakeholder interviews and the extensive dialogues at the two
community stakeholder roundtables conducted as part of this project, four
priority industry clusters have been identified for emphasis in the initial
implementation phases of this economic plan.
The approach envisioned in this Plan builds on the economic development
best practice strategy of prioritizing industry clusters in economic
development initiatives. It is important to note that four industries were
selected as either core areas of economic emphasis or areas of extraordinary
opportunity or both: the aerospace and defense industry, the entertainment
industry, the international trade and logistics industry, and the health services
and biomedical industry. In each instance, the economic development needs
and issues differ significantly and differing "best practices" solutions are
prescribed.
Even though these industries have been selected for initial emphasis, their
identification here should not preclude the SFVCOG from expanding this list
or from refocusing its priorities if regional circumstances or opportunities so
indicate.
Objective 2.1. Develop growth and retention initiatives that support
the entertainment industry.
The I-5 Corridor is home to the leading entertainment companies and their
sub-contractors and creative talent. The elected officials, the community,
and the entertainment management and workers have a sense of ownership
that is cultural and literal. The California Film Commission and the Santa
Clarita Film Commission and FilmLA have demonstrated that production

Interstate 5 Corridor Economic Development Plan
9 | P a g e
incentives do increase production in the I-5 Corridor. Examples include the
Disney Ranch in Santa Clarita and un-incorporated LA County and the I-5
NBC evaluation plan. Recent television production examples include that
regionally produced production for one hour of television resulted in $20
million dollars of local business.
If the Corridor were able to attract $100 million in additional industry sales,
there would be a projected increase of 801 jobs and more than $174 million
in additional economic activity, as shown in Figure 2.
Impact Type Employment Labor
Income Total Value
Added Output
Direct Effect 364.2 35,882,988 55,636,736 100,000,000
Indirect Effect 210.4 15,287,498 23,280,320 41,290,384
Induced Effect 226.8 10,943,943 19,688,000 32,763,420
Total Effect 801.4 62,114,428 98,605,056 174,053,808
Figure 2. Annual Economic Impact of Increase of $100 million In Entertainment
Industry Sales.2
Action Item 2.1a. Develop an industry-focused task force for the
entertainment area.
The I-5 Corridor is the ―Creative Capital‖ of the entertainment industry.
Jurisdiction representatives need to work with the industry through a task
force focused on developing the future of entertainment and, specifically,
entertainment technology. The task force should develop a comprehensive
government, community, and industry strategy for fostering arts and
creativity in the I-5 Corridor, which enjoys a comparative advantage over
other regions in that a significant number of the creative class already live
and work there.
Action Item 2.1b. The immediate recommendation is for the San Fernando
Valley region to create sub-regional multijurisdictional incentives for
existing and future entertainment production.
FilmLA, working with California Film Commission can provide the
leadership and expertise to formulate the mission statement and competitive
plan to compete with New Mexico, Connecticut, Michigan, and other states
competing for entertainment business.
Specific tactics include:
Film tax credits;
Increased film grants and investment;

Interstate 5 Corridor Economic Development Plan
10 | P a g e
Expansion of "Unified Regional Film Programs‖ as part of the
economic development plans; and
Creation of local area film offices such as in Santa Clarita.
The California Film commission found that for every $1 in film tax credits
provided, California gets $1.27 in new spending, including new tax dollars
and wages.
Action Item 2.1c. Pursue upgrades and public/private partnership support
for sustainability upgrades to existing facilities.
Studios have partnered with government to get infrastructure improvements
for more efficiency and future growth. There is a need not only for expanded
availability of facilities within the region, but the retro-fitting and upgrading
of existing facilities to allow the region to better meet the sustainability goals
imposed by AB 32 and SB 375.
Objective 2.2. Develop growth and retention initiatives that support
the aerospace and defense manufacturing cluster.
Los Angeles County is still one of the largest manufacturing regions in the
United States. Leading this critical business activity is the aerospace and
defense sector. This cluster remains strongly based in the I-5 Corridor and
remains a priority area for economic development. While the civilian
aviation industry is experiencing difficulties, military applications, especially
in the area of unmanned air vehicles, remains extremely strong.
The importance of the sector can be seen in Figure 3 as the total output for
the region rises by more than $185 million if an increase of $100 million in
industry sales is achieved. It would also result in nearly 500 new jobs within
the region.
Impact Type Employment Labor
Income
Total Value Added Output
Direct Effect 85.5 14,646,799 22,799,808 100,000,000
Indirect Effect 232.5 19,376,070 26,669,120 63,661,928
Induced Effect 150.7 7,271,915 13,081,472 21,769,604
Total Effect 468.6 41,294,784 62,550,400 185,431,536
Figure 3. Annual Economic Impact of Increase of $100 million In Aircraft
Manufacturing Industry Sales.3
Interstate 5 Corridor Economic Development Plan
11 | P a g e
Action Item 2.2a. Develop an industry-focused task force for the aerospace
and manufacturing area.
Collaboration in this area of economic opportunity has remained difficult
over time. Yet collaborative efforts are precisely what is needed to (1)
identify and develop expansion opportunities for existing firms and (2) to
develop the base to leverage the political capital necessary to ensure that
future defense and manufacturing contracts continue to benefit manufacturers
in the I-5 Corridor.
Action Item 2.2b. Develop workforce training and enhancement initiatives
in conjunction with local community colleges and vocational programs.
Aerospace and defense manufacturing processes in an increasingly
technological age necessitate the on-going upgrade of worker skills. The
SFVCOG should develop collaborative educational initiatives between
government officials, private industry representatives and local educational
institutions to ensure that the sector's workforce has access to a workforce
adequate to it and the region's needs. One key to maintaining and growing
our regional manufacturers to be competitive in advanced manufacturing is
the education, retention, continuous training, and attraction of employees.
Aerospace and defense manufacturers need an efficient education system to
prepare future employees and train current people. Workforce development
programs are needed to train employees how to manufacture the technologies
coming from research and competitive development.
Action Item 2.2c. Improve communication among local government elected
officials, their staff and businesses to understand business strategic and
operational plans. Expand community involvement and understanding of
the industry's role in the community.
Aerospace and defense manufacturing not only provide high-wage
opportunity for a range of workers, but they also provide stability to the local
economy as their business cycles and contracts are typically multi-year
projects. It is essential, for this sector to thrive, that local elected officials
and members of the community support the sector's efforts to secure new
projects in the future. The task force model allows the industry to establish
better relations with both elected officials and members of the local
community. This can subsequently result in a broader, more unified voice in
Washington, DC as these contracts are awarded. This can also facilitate
upgrades and expansions in local communities as the increased collaboration
with local officials and the members of local communities enhances
understanding of the value of investment in sector.

Interstate 5 Corridor Economic Development Plan
12 | P a g e
Action Item 2.2d. Preservation of regional industrial-zoned real estate.
One of the key strengths of the I-5 Corridor, as discussed in both the I5CEDS
and the ICTA is the relative availability of industrial real estate resources
within the I-5 Corridor. Efforts must be taken by the Aerospace and Defense
Manufacturing Task Force to ensure that these zoning designations remain
strong.
Action Item 2.2e. Identify opportunities to create tax incentives for local
expansion of existing operations.
The SFVCOG Aerospace and Defense Manufacturing Task Force can work
with local, state, and federal officials to identify both external and internal
sources of funding that can be used to incentivize sustainable upgrades and
expansion of existing manufacturing operations.
Objective 2.3. Develop growth and retention initiatives that support
the medical devices and biomedical industries.
Biotechnology and medical devices represent two strong aspects of the San
Fernando Valley's export economy. From the Amgen at the western end to
Warner Center's towering health insurance offices to California Institute of
Technology at the eastern end, the region is rife with medical innovation and
resources. The future of the biotechnology industry in the San Fernando
Valley Region (and the I-5 Corridor) depends on the commitment of
government, education, and community leaders to understand and act in a
coordinated effort to address the barriers and opportunities for:
Start up and commercialization of biotechnologies
Growth of regional biotechnology companies
Maturation and transition of biotechnology companies
Attraction of biotechnology companies to our region
Retention of biotechnology companies in our region.
Our region is one of the richest global centers for biotechnology research and
development. UCLA, the California Institute of Technology, and California
State University Northridge produce innovative biotechnology research in the
fields of medicine, agriculture, and alternative fuels among others.
Academic institutions and businesses compete for and secure a total of $3
billion in biotechnology research dollars each year. There is tremendous
potential for the commercialization of these academic resources. Each year,
some 200 to 300 new biotechnology patents are awarded to southern

Interstate 5 Corridor Economic Development Plan
13 | P a g e
California biotechnology research and development centers and businesses
but these patents are not commercialized in this region.
In assessing the potential economic impact of the biomedical sector on the
local economy, an increase in $100 million in industry sales would result in
an increase of $177.5 million in total economic output in the corridor and an
increase of 730 jobs, as shown in Figure 4.
Impact Type Employment Labor
Income
Total Value Added Output
Direct Effect 288.4 33,485,596 43,707,136 100,000,000
Indirect Effect 219.5 15,765,106 24,271,808 45,377,900
Induced Effect 222.7 10,721,973 19,309,056 32,122,644
Total Effect 730.6 59,972,676 87,288,064 177,500,544
Figure 4. Annual Economic Impact of Increase of $100 million In Biomedical and
Surgical Equipment Industry Sales.4
Action Item 2.3a. Develop an industry-focused task force for the health
services and biomedical area.
The SFVCOG should develop a task force committed to this important
economic development opportunity. This task force could establish a
unified strategy to attract federal and state grants and private capital to
increase the funds invested in regional biotechnology research and
development and companies.
Action Item 2.3b. Develop public/private partnerships to enhance the
availability of capital available for commercialization of biomedical
research in the region.
According to industry experts, the growth of biotechnology in our region
depends on our coordinated effort to solve the biggest problem to
biotechnology growth: access to capital.
The San Fernando Valley region lacks a unified public, private, and
community commitment to compete for the capital, grants, and contracts.
The region's biggest competitors are in Silicon Valley and San Diego County.
The Silicon Valley Leadership Group is an alliance of business, government,
academic, and community leaders that is committed to securing the
conditions for their region to dominate in the research and development of
technologies, commercialization of technologies, and fostering of businesses
to lead industries with profitable companies. As a result, the Silicon Valley
attracted the lion's share of private capital in biotechnology in 2009 (60-65
Interstate 5 Corridor Economic Development Plan
14 | P a g e
percent), while Los Angeles County biotechnology companies only received
10 percent.1
Action Item 2.3c. Explore ways in which local pension funds and pools can
be used to stimulate biotechnology investments in the region.
Sources of potential funding for southern California biotechnology and
indeed all companies are the State, county, and city pension funds. Each year
$300 to $500 million is invested in biotechnology. In many locations
outside the SFVCOG region, biotechnology researchers, academic
institutions, business leaders, the elected officials and their staff work
together (for example in San Diego and Silicon Valley). They have
progressive thinking to identify the research, the capital, the business
expertise and political clout needed to plan and implement winning
strategies.
Action Item 2.3d. Collaborate between industry, government and local
higher education institutions to retain best and brightest graduates.
The biotechnology academic and business organizations attract and graduate
but do not retain many of the biotechnology leaders in southern California.
The neighboring California Institute of Technology is one of the leading
producers of the best-trained people who go other places to commercialize
their research.
Objective 2.4. Develop growth and retention initiatives that support
the sustainable and green technology industries.
As the State of California's bold initiatives in passing AB 32 and SB 375
demonstrate, the state and the region are ahead of the nation in taking
seriously sustainable and environmentally-friendly innovation and
development. The SFVCOG should take a leadership role in not only
expediting the deployment of these technologies and innovations across the
region, but also in building a foundation for exporting these to other regions
across the nation and around the world as they "catch up" to California in this
important area.
If the region were to add the equivalent of $100 million in sales in the
sustainable and green technology industries, it would increase Corridor
1 Dr. Manish Singh, President & CEO of ImmunoCellular Therapeutics at
Roundtable 2, April 14, 2010, Burbank, California.
Interstate 5 Corridor Economic Development Plan
15 | P a g e
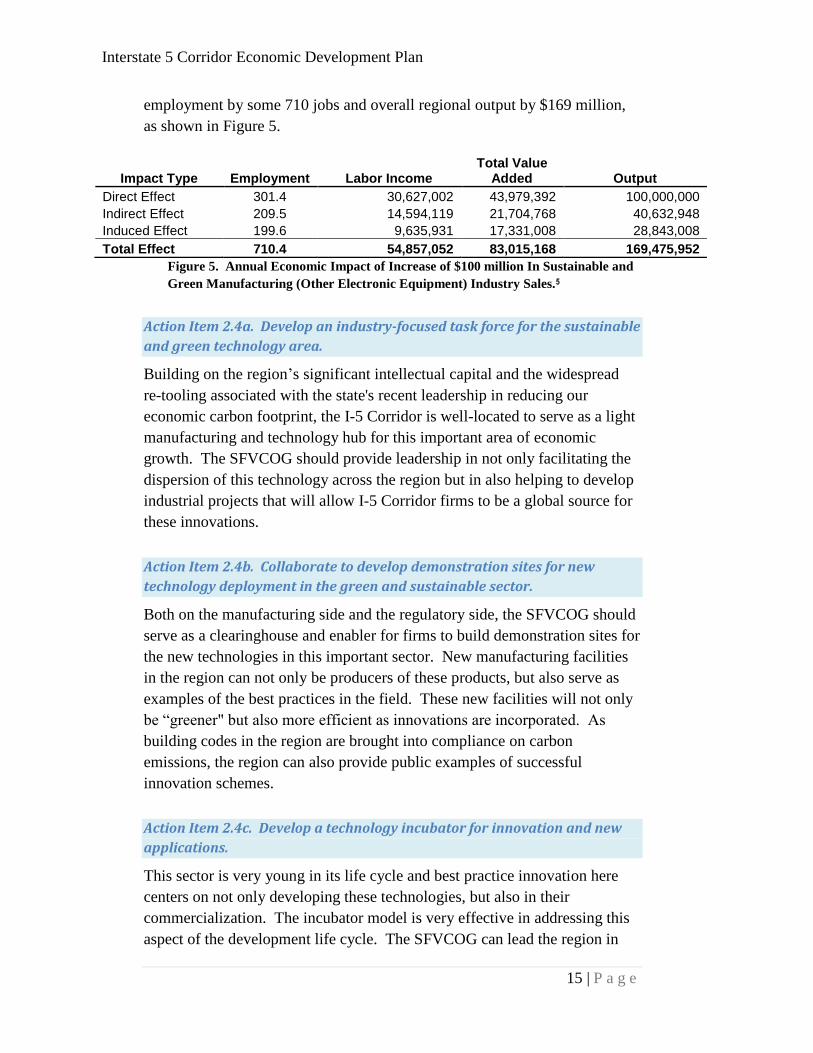
employment by some 710 jobs and overall regional output by $169 million,
as shown in Figure 5.
Impact Type Employment Labor Income Total Value
Added Output
Direct Effect 301.4 30,627,002 43,979,392 100,000,000
Indirect Effect 209.5 14,594,119 21,704,768 40,632,948
Induced Effect 199.6 9,635,931 17,331,008 28,843,008
Total Effect 710.4 54,857,052 83,015,168 169,475,952
Figure 5. Annual Economic Impact of Increase of $100 million In Sustainable and
Green Manufacturing (Other Electronic Equipment) Industry Sales.5
Action Item 2.4a. Develop an industry-focused task force for the sustainable
and green technology area.
Building on the region’s significant intellectual capital and the widespread
re-tooling associated with the state's recent leadership in reducing our
economic carbon footprint, the I-5 Corridor is well-located to serve as a light
manufacturing and technology hub for this important area of economic
growth. The SFVCOG should provide leadership in not only facilitating the
dispersion of this technology across the region but in also helping to develop
industrial projects that will allow I-5 Corridor firms to be a global source for
these innovations.
Action Item 2.4b. Collaborate to develop demonstration sites for new
technology deployment in the green and sustainable sector.
Both on the manufacturing side and the regulatory side, the SFVCOG should
serve as a clearinghouse and enabler for firms to build demonstration sites for
the new technologies in this important sector. New manufacturing facilities
in the region can not only be producers of these products, but also serve as
examples of the best practices in the field. These new facilities will not only
be ―greener" but also more efficient as innovations are incorporated. As
building codes in the region are brought into compliance on carbon
emissions, the region can also provide public examples of successful
innovation schemes.
Action Item 2.4c. Develop a technology incubator for innovation and new
applications.
This sector is very young in its life cycle and best practice innovation here
centers on not only developing these technologies, but also in their
commercialization. The incubator model is very effective in addressing this
aspect of the development life cycle. The SFVCOG can lead the region in
Interstate 5 Corridor Economic Development Plan
16 | P a g e
the creation of workforce-industry partnerships for the development and
implementation of new and current best practices in manufacturing,
installation and innovation.
GOAL III. DEVELOPING AND LEADING KEY REGIONAL INITIATIVES
Beyond the collaborative frameworks of Goal I and the industry-cluster
targets of Goal II, there are specific elements of regional infrastructure that it
makes for the SFVCOG to pursue for the region. These infrastructure
elements represent core, global objectives that would benefit all industry
clusters and businesses.
Objective 3.1. Explore Options for Transportation Improvement Along
the I-5 Corridor
The issues of traffic congestion adversely impact the economic development
of the I-5 Corridor. While one of its strengths of the Corridor is that it is
generally uncongested as it goes through the northeast corner of the San
Fernando Valley, much of the rest of the Corridor experiences high
congestion. Rush-hour bottlenecks undermine the region's attractiveness for
economic development, investment, and expansion. The SFVCOG should
undertake actions to reduce this level of congestion.
Action Item 3.1a. Commission study to identify ways of improving the jobs-
housing mix within the region.
One driver of the cross-flow of traffic through the region is the extent to
which employees live in different areas than they work. One of the strengths
of the I-5 Corridor as a potential development area is (1) the availability of
developable industrial and commercial land and (2) the nearby availability of
both workforce and executive housing. A review of the zoning and surface
street configurations, in conjunction with Action Items 3.1b and 3.1c could
serve not only to enhance the quality of life for those employed and residing
in the region, but significantly alleviate the volume of traffic on Interstate 5.
Action Item 3.1b. Commission studies of options to enhance traffic flows
within the Corridor.
The SFVCOG should commission studies to identify specific initiatives
within the I-5 Corridor that could reduce congestion on Interstate 5 while
concurrently expanding the surface and arterial flows within the region. Two
proposals that received strong interest, response, and support over the course

Interstate 5 Corridor Economic Development Plan
17 | P a g e
of the development of this plan included expansion of San Fernando Road
and the creation of dedicated transit throughways throughout the corridor.
Expanding San Fernando Road. Through much of the length of the I-5
Corridor, San Fernando Road parallels Interstate 5. Between inconsistent
signalization, relatively narrow lanes, and intermittent maintenance
schedules, this major arterial is not a popular throughway and/or alternative
to the freeway. In fact, local employees and residents are anecdotally more
likely to take the freeway than this major arterial, even for local trips.
Improvement, widening, and re-signalization of this important arterial would
give the I-5 Corridor two major traffic flows that could result in significant
reductions in congestion on Interstate 5. SFVCOG should commission a
study and plan to address this possibility.
Improving Public Transportation Flows. The SFVCOG should use its role
as a coordinating agency to examine possible improvements between
Metrolink, the Los Angeles County Metropolitan Transportation Authority,
Santa Clara Transit and the numerous local transportation alternatives to
ensure that the key commute and transit needs are being met
comprehensively and in as effective and efficient a manner as possible.
Objective 3.2. Development of Key Data Infrastructure
The SFVCOG should lead the initiative to develop a data backbone to serve
the I-5 Corridor. One of the most striking attributes of the corridor is the rich
assemblage of information-driven industries anchored on both ends of the
corridor. Concurrently, some regions of the corridor are running out of
developable land while others still have large expanses of yet-to-be-
developed real estate. In information technology-intensive industries like
data services, entertainment, biotechnology and business services, the ability
to utilize data infrastructure to move large quantities of information easily
can – through online data transfers and telecommuting - relieve comparable
movements of people, thereby reducing traffic congestion and improving
overall quality of life.
Action Item 3.2a. Commission a study of the information capacity and needs
for the I-5 Corridor.
As the SFVCOG explores expanding San Fernando Road, it should also
explore the simultaneous installation of high-bandwidth internet backbone
capacity as part of that construction. In an economy whose growth is
increasingly fueled by information-based exchanges, this infrastructure will
position the I-5 Corridor to be a leader in the next stages of national

Interstate 5 Corridor Economic Development Plan
18 | P a g e
economic growth. These backbones are becoming, quite literally, the super-
highways of economic prosperity and communities worldwide are pursuing
strategies whereby these key pieces of infrastructure are included.
Action Item 3.2b. Convene a regional dialogue on regional wireless
coverage and integration.
One of the increasingly important pieces of community infrastructure is the
availability of consistent, quality access to wireless data services. The
SFVCOG should convene a series of meetings with constituent communities
and industry representatives to assess the adequacy of the current
infrastructure and to develop an initiative to improve that coverage through
joint efforts.
Objective 3.3. Facilitate the development of the I-5 Inland Port
proposal and "Free Trade Zone" initiatives.
As the Los Angeles region faces the 21st Century and international trade
continues to expand, the need to develop a coherent network of ports will be
necessary to distribute the heavy volume of cargo that will need to pass
through the region's ports. Because of its critical location on the backbone of
peripheral rail and at the outer fringes of the region's worst congestion, the I-
5 Corridor can and should play a critical role in serving as part of the cargo
and customs infrastructure of the region and the nation. The SFVCOG
should take a leadership role in collaborating with the Ports of Long Beach
and Los Angeles, as well as the U.S. Immigration and Customs Enforcement
Agency to facilitate the Corridor's participation in the initiative. There are
several proposals for "inland ports" that include the region and the SFVCOG
is ideally suited to not only represent the region in the discussions, but also to
serve as an important mediating agency to make certain that constituent
jurisdictions' individual and joint concerns are addressed. It is also a great
convening forum for fostering collaboration and dialogue with the numerous
community organizations and communities who have already advanced the
proposals to their current level of discussion.
Action Item 3.3a. Lead regional discussions regarding the development an
"inland port" that will encompass portions of the I-5 Corridor.
Objective 3.4. Expand the use of "economic gardening" across the
corridor.

Interstate 5 Corridor Economic Development Plan
19 | P a g e
"Economic gardening" is the name given to the concept of developing one’s
own businesses through entrepreneurship and innovation rather than
capturing existing or growing business operations from other areas. Los
Angeles is one of the nation's leading homes of entrepreneurship and new
businesses. This concept necessitates the development of three categories of
materials and information: (1) information resources (such as resource,
market, geographic and real estate data), (2) infrastructure (including not
only bricks and mortar, but also social and intellectual resources) and (3)
connectivity (including linkages between public and private actors, trade
groups, academic institutions, and workforces). The SFVCOG Economic
Development Plan includes liberal portions of each of these and they should
be focused not only on retention (keeping existing business growing) and
recruiting (attracting business to the Corridor from other locations), but also
on growing local entrepreneurs and enterprises into successful businesses.
Action Item 3.4a. Develop innovative approaches to encouraging growth in
local new business initiatives through expanded use of best practices, such
as incubators.
One of the most dynamic tools for the development of new businesses is the
creation of incubators such as the Advanced Technology Incubator at the
College of the Canyons in Santa Clarita. The program provides
comprehensive resources to entrepreneurs as a model to facilitate success and
growth. While this specific initiative is targeted at high-tech activities, the
model can easily be replicated and applied to nearly any industry and sector
(especially in information-intensive industries like entertainment and
biotechnology, for example). The SFVCOG should serve as a bridge for
advancing the strength of the existing incubator program and carrying its
application over to other industries within the Corridor.
GOAL IV. CREATE AND MAINTAIN REGIONAL ECONOMIC PLANNING AND
RESPONSIVENESS INFRASTRUCTURE
The SFVCOG will both lead new initiatives and serve a coordinating
function, especially in cross-jurisdictional initiatives within the Corridor.
Objective 4.1. Provide leadership in accommodating economic
development and expediting approvals in the local planning
infrastructure.
The SFVCOG should lead regional efforts to create expedited processes that
reflect regional priorities and objectives. While it is not uncommon for

Interstate 5 Corridor Economic Development Plan
20 | P a g e
communities to form "tiger teams" and one-stop shops to help businesses
navigate the morass of public business regulations they impose, it is
uncommon for a region with as broad and rich an employment base and
workforce to pursue such a strategy across jurisdictions.
Action Item 4.1a. Develop a streamlined permitting and fast tracking.
The SFVCOG should form a group that could actively work with local
jurisdictions to develop one-stop permitting and red tape reduction shortcuts
for the region. The initiative should specifically look at the codes, zoning,
and programs necessary to find those areas that can be standardized across
the jurisdictions to expedite approvals.
Action Item 4.1b. Develop and share details of permitting processes for
member jurisdictions.
Action Item 4.1c. Coordinate Community Redevelopment Agency Zoning
initiatives across jurisdictions so that they can better meet the needs of
industry and encourage economic growth.
Action Item 4.1d. Create a common, joint voice for advocating for changes
to existing state, county, and federal regulation that could improve
business success.
Objective 4.2. Develop regional initiatives and proposals that maintain
job-generating land.
The SFVCOG should develop proposals that serve the economic
development vision of the Corridor. It should lead the region in initiatives
that, while working within existing regulatory and planning frameworks,
ensure that job-generating land resources will be preserved.
Interstate 5 Corridor Economic Development Plan
21 | P a g e
Action Item 4.2a. Assess the federal, state, county, city and neighborhood
requirements as incentives for business formation, competitiveness.
Action Item 4.2b. Develop zoning proposals and initiatives maintain "job-
generating" parcels and locations.
Action Item 4.2c. Assess CEQA, litigation challenges, aerospace, building
codes for earthquakes, and state-based issues. Band together to identify
regional issues that can be addressed by cities, the county, state and federal
to create unified, cross jurisdictional vision for business and especially
manufacturing.
Objective 4.3. Develop new funding streams and strategies to support
economic development initiatives in the corridor.
The SFVCOG should lead several new initiatives to obtain and create
resources which can be used to support economic development activities.
The action items below represent only an initial set of initiatives and should
not be construed as limiting, but rather suggestive of existing opportunities.
Action Item 4.3a. Create San Fernando Valley Regional Center to expand the
public private partnerships potential from American Recovery and
Reinvestment Act funds.
Action Item 4.3b. Use the California Attorney General approval of
Infrastructure Improvement Zones such as the work in the City of Carlsbad
to implement a funding mechanism for infrastructure improvement
districts.
Action Item 4.3c. Establish and promote Community Economic Development
Service zones.
Action Item 4.3d. Identify potential additional funding sources to expedite
the process for infrastructure improvements.
Potential private sector options include:
o Family, friends, angel funders
o Venture capital
o Institutional investors
o Banks
o Corporate and Private Foundations

Interstate 5 Corridor Economic Development Plan
22 | P a g e
Potential public sector options include:
o Small Business Administration Development Centers (SBADC)
o Business Entrepreneurial Centers
o Federal, state, nonprofit bonds
o Tax incentives
o Enterprise Zones
o Free Trade Zones
o Utility incentives and rebates
o Proposition 218 business taxes and tax increment models
o IRS incentives and credits (small business)
o Department of Energy Small Business Initiative
o Department of Defense
o Federal Highway Funds
o State incentives and rebates
o County incentives and rebates
o City incentives and rebates
o Regional incentives and rebates
WHY IT MATTERS…
The I-5 Corridor represents a unique set of resources and an opportunity for
local governments to work together and develop this connected region. The
region is bookmarked at one end by Glendale/Burbank and the other by Santa
Clarita. Both areas are or are becoming heavily involved in the
entertainment industry. These ends are connected by the City of San
Fernando and Northeast San Fernando Valley portion of the City of Los
Angeles. These areas are more heavily involved in construction and
manufacturing. The area houses a highly diverse population with significant
populations having less than a high school diploma along with a substantial
portion holding college degrees.
The actions of the San Fernando Valley Council of Governments over the
next several years can and will have a profound impact on the lives of those
in the Interstate-5 Corridor. Through the effective leadership of the
SFVCOG, the quality of life will be enhanced not only for those living and
working in the Corridor, but also for the Greater Los Angeles region as well.
IMPLEMENTATION TIMELINE FOR THIS PLAN
One area where this plan is relatively silent is in the creation of timelines and
deadlines for the many action items identified. This reflects not only the
concurrency between the development of this plan and the SFVCOG but also
a desire and willingness to maximize the opportunity for the SFVCOG to
take ownership and leadership on these initiatives under its own watch.
Interstate 5 Corridor Economic Development Plan
23 | P a g e
Generally, all of the action items identified in this plan are available for
immediate implementation. In some instances, individuals and organizations
have stepped forward to claim leadership and ownership. It will be attendant
on the SFVCOG Board to establish priorities across the initiatives and action
items in the report and to provide guidance to those leading those processes
and actions.
THE DYNAMICS OF BUILDING THIS PLAN
This plan is the result of an ongoing deliberative process with many moving
parts. The two largest, and most significant portions, are the establishment of
the San Fernando Valley Sub-County Census District and the creation of the
San Fernando Valley Council of Governments. Both these initiatives created
recognition of the region’s unique and important contributions to the county,
state, and national economies.
In anticipation of the development of the SFVCOG, the Southern California
Association of Governments provided seed funding to develop this plan as
the SFVCOG was going through the approval process. The vision was to
institute an active dialogue among the many public, private, and nonprofit
actors while providing a framework that could allow the SFVCOG to ―hit the
ground running‖ upon its approval.
The Role of This Plan Relative to the SFVCOG
In anticipation of the development of the SFVCOG, the Southern California
Association of Governments (SCAG) in coordination with the Mulholland
Institute and the Valley Economic Alliance (VEA) commissioned the
development of this Interstate 5 Corridor Economic Development Plan
(I5CEDP) with a vision that it would serve as an important starting point for
the economic development initiatives of the soon-to-be-formed SFVCOG.
While the geographic boundaries of the community included the SFVCOG
are much broader than the I-5 Corridor, nearly all of the cities and
jurisdictions that have elected to be part of the SFVCOG are represented in
this corridor, including Burbank, Glendale, Los Angeles, Santa Clarita, and
the County of Los Angeles.
This economic development plan is offered as a prototype for cooperation
and economic development opportunities possible for the SFVCOG and
should be seen as a starting point for those efforts. It is also by no means
limiting in that the successes encountered thus far in launching the SFVCOG
serve as an excellent springboard for advancing economic development in the
region and the initiatives discussed in this document will likely positively

Interstate 5 Corridor Economic Development Plan
24 | P a g e
affect communities, not only throughout the SFVCOG area, but also in other
surrounding cities and communities.
The Relationship of This Plan to Existing Efforts
It is also important to note that this plan is not developed in a vacuum and
that, while the SFVCOG represents a quantum step forward in terms of
equipping the region to address the question of economic development, it
does so on the shoulders of many efforts and initiatives that have already
been launched by the constituent jurisdictions, nonprofit organizations,
private sector partnerships, and individual efforts. On a general level, the
Mulholland Institute and the Valley Economic Alliance have played a central
level in working with public officials, private industry, and nonprofit
neighbors to provide leadership in the economic development of this region
and the San Fernando Valley. The creation of the SFVCOG does not
supplant or reduce the importance of their role, but rather complements it and
provides a solid platform for the constituent jurisdictions to focus their
efforts in the area of economic development. The concept of partnership
between these nonprofit leaders, government, and private industry is essential
to the success of any efforts to improve the quality of life within the region.
Additionally, this Plan is intended to complement the commendable efforts
of the Los Angeles Economic Development Corporation in its efforts to
provide leadership in the area of economic development through its
launching of its Los Angeles County Strategic Plan for Economic
Development 2010-2014. It is intended to open the door to specific
initiatives and agenda items that can be used to focus a specific economic
development process for the I-5 Corridor in the context of that plan.
Finally, it should be noted that this document is seen as a supplement and an
update to the Mulholland Institute’s September 2007 Interstate-5 Community
and Economic Development Strategy (I5CEDS). This analysis updates the
data offered then and incorporates the results of a deliberative process that
included participants from all jurisdictions within the Corridor and from a
broad range of industries, advocacy organizations, and nonprofit groups. It
also integrates and builds on the work of multiple agencies, groups, and
governments in their reports on opportunity and challenge within the region.
As in the case of the 2007 study by the Mulholland Institute, this Plan finds
numerous opportunities for pursuing opportunity within the region and offers
specific goals, objectives, and action items to capitalize on those
opportunities.
Interstate 5 Corridor Economic Development Plan
25 | P a g e
Historically, coordination between jurisdictions has been generally weak,
with each in its own ―silo.‖ More often than not this has resulted in disjointed
economic development and transportation planning, inhibiting the realization
of the true potential of the Corridor’s workforce and infrastructure.
Especially in these times of economic recession and high unemployment
(11.9%6at the time of writing), a comprehensive I-5 Corridor Economic
Development Plan is needed to strategically attract, develop, and retain
businesses, to capitalize on the Corridor’s significant workforce and
infrastructure, and to focus attention on its strengths: a business-friendly,
service-rich, synergistic transportation artery where job-creating industries
can thrive. This Plan identified several industry clusters as opportunities for
regional economic and community development and presents them for
discussion, exploration, and commitment to action.
The Plan Development Process
To bridge the time and informational gap between The Mulholland Institute’s
Interstate-5 Community and Economic Development Strategy and the I-5
Economic Development Plan, we have updated the original data and
interviewed stakeholders and constituents to identify jurisdictional conditions
and concerns, resulting in a Draft Threshold Assessment.
This initial analysis in this report, entitled the Threshold Assessment, was
initially presented to Corridor stakeholders at ―Roundtable 1,‖ held January
20, 2010 at Woodbury University. Business and government leaders were
recruited to lead discussions on specific topics for regional economic and
community development at this presentation. Based on the results of that
dialogue, the Threshold Assessment was revised and remains the context
portion of this Economic Development Plan.
Subsequent to that process, the components of the Draft Economic
Development Plan were presented to Corridor stakeholders at ―Roundtable
2,‖ held April 14, 2010 at Woodbury University. As with Roundtable 1,
several business and government leaders volunteered to lead discussions on
specific topics for regional economic and community development at this
presentation.
The detailed conclusions of "Roundtable 2" were collated and became the
backbone of the recommendations and details included in this Economic
Development Plan. The project team conducted further follow-on interviews
and collaborative discussions with additional stakeholders and participants to
complete the full range of goals, objectives, and action items contained in the
last chapter of this report.

Interstate 5 Corridor Economic Development Plan
26 | P a g e
Finally, the plan and its recommendations were presented in near-final form
to the members of the boards and leadership of the key stakeholder groups in
the region. Their comments and suggestions were incorporated into this
documented and this plan represents the final, cumulative product of those
suggestions and recommendations.
References and Sources
To create this Plan, we obtained information from studies and reports
including, but not limited to, the Interstate-5 Community and Economic
Development Strategy, Mulholland Institute; Northeast Valley Study,
LAEDC and Economic Alliance SFV; Prosperity Tomorrow, Mulholland
Institute; Our Future Neighborhoods, Mulholland Institute; Changing Face
of the San Fernando Valley, Joel Kotkin; Compass Growth Vision, Blueprint
2% Strategy, SCAG; Regional Transportation Plan, SCAG; State of the
Region, SCAG; and Regional Housing Needs Assessment, SCAG. However,
just as importantly, to incorporate the perspectives and experience of
constituents of the Corridor, we interviewed city, business, non-profit
organization and community representatives of the cities of Burbank,
Glendale, Los Angeles, San Fernando, Santa Clarita, and the County of Los
Angeles.
The Mulholland Institute’s Interstate-5 Community and Economic
Development Strategy completed much of the research that the I-5 Economic
Development Plan incorporates. Through ongoing, collaborative discussions
with stakeholders, the process for developing the I-5 Economic Development
Plan builds stakeholder consensus and momentum for making decisions on
regional projects that can actually be implemented in the Corridor, as well as
determining what infrastructure, policy, or other changes need to be made to
remove barriers to economic development. The project seeks to unite the
visions of cities comprising the newly formed SFVCOG so that it can move
forward to implement and accomplish its recommendations.

Interstate 5 Corridor Economic Development Plan
27 | P a g e
The Plan Agenda
The Plan discusses and provides a framework within which to analyze
current and potential relationships, partnerships and connections among
regional jurisdictions, private, nonprofit, community and public stakeholders.
It provides a benchmarking for regional business patterns and successful
industry clusters, assessment of multiplier effects of industry clusters, and
presents the synergies among industry clusters and the common resources for
public and private leadership to provide support and make them competitive
and sustainable.
The Plan with input from government, academic, and business community
leaders have analyzed opportunities and appropriate categories for
commercial and industrial development. The Plan action items provide
actionable recommendations to foster industry clusters and the creation of
diverse and healthy mix of trades and occupations that reduce economic
―leakage‖ and promote export (regional wealth) products and services.
The Plan presents the process for the SFVCOG to work with community and
business leaders for the advancement of regional and sub-regional priorities
to relieve stress on regional corridors, to enhance capacities along I-5 and
other key thoroughfares. It promotes industrial and commercial nodes,
supports the regional logistics industry, strengthens existing workforce, and
assesses needs for industry-specific education and training. The goal is to
develop and maintain a technical and knowledge-based workforce and
accommodate them with a variety of executive, workforce and market rate
housing.
The Plan explores:
o Assessment of region’s business strengths and unique business
attraction advantages.
o Strategies to enhance the Corridor’s ability to attract and
accommodate leading national and global class business and industry
o Recommendations to identify Corridor sites for re-purposing to attract
and accommodate leading national and global class business and
industry
THE CORRIDOR: THEN AND TODAY Three years ago when the Mulholland Institute published its monograph
Interstate-5 Community and Economic Development Strategy the world was
Interstate 5 Corridor Economic Development Plan
28 | P a g e
quite a different place. The high growth of the real estate boom was just
beginning to taper and the subprime mortgage market was just a blip on the
horizon. The dramatic events of the past 16 months have reshaped the
environment in which economic activity unfolds. Extraordinary changes in
both employment and housing have opened many new doors to opportunities
which have yet to be fully realized. To grasp the significance of these
changes, it is necessary to go back to where the I5CEDS left off.
THE INTERSTATE-5 CORRIDOR THEN
The Interstate-5 Community and Economic Development Strategy touted the
region as a flourishing nexus for new business and opportunity. Some of the
highlights included a 4-year employment growth rate of nearly five percent
with growth in financial services employment totaling 10.4 percent from
2001 to 2005; with entertainment jobs growing 15.4 percent and professional,
scientific and technical employment growing 15.8 percent. While this
economic performance is impressive by its own measure, this accelerated the
growth in jobs took place against a dismal backdrop. County employment
during that same period was basically flat, and state employment was only
growing at a rate of 1.8 percent. Concurrent with this growth, was an
explosion in payrolls—rising some 26 percent in the region—reflecting the
high-wage character of this growth.
The Corridor is a key industry hub, anchoring the Los Angeles Metro Area’s
heavy presence in technology (especially biomedical, digital information and
environmental technologies), motion picture and television production, and
business and professional services.
In terms of the overall workforce, the region’s economy and workforce is
extremely diverse. From Ph.D. researchers to unskilled laborers, the
Corridor is populated by one of the widest-ranging concentrations of human
capital in America, if not on the planet. The Northeast San Fernando Valley,
with its densely populated pockets of both low-wage workers and blue-collar
workers, sits at the geographic heart of the Corridor. The affluent suburbs of
Glendale, Burbank and Santa Clarita, and the communities on its periphery
within the City of Los Angeles provide a deep reservoir of highly-educated,
highly-skilled workers. Together they comprise a workforce that is, quite
literally, capable of driving any industry or of achieving any goal whether it’s
helping to put man on the moon, curing disease or creating the next
blockbuster motion picture.

Interstate 5 Corridor Economic Development Plan
29 | P a g e
Affordable housing and traffic congestion have always been seen as the
region’s Achilles heel—serving as major factors limiting economic growth
over the past decade. The escalating price of housing and skyrocketing
commercial and industrial rents were seen as two of the greatest threats to the
region’s prosperity. Median home prices in the Northeast San Fernando
Valley increased from $322,250 in 2004 to $536,000 in 20067 rendering even
the most basic residence unaffordable to most who lived in the area. These
escalating prices manifested, not only in rising home prices, but also in
higher commercial and industrial rents.
Reviewing the available8 Census data since the release of the I5CEDS,that
trends are clear, that the region continued to progress and expand well into
the first half of 2007, until the subprime mortgage crisis began to take root.
Not surprisingly, the corridor’s employment shown in Figure 6 looks much
like that identified in the I5CEDS.9 Education, health, professional services
and technology continue to be the dominant sectors, with manufacturing,
entertainment, arts and leisure living facilities construction and retail in the
next tier.
Figure 6. Employment of Residents by Industry Category, NAICS Code, I-5 Corridor,
2007.10
Interstate 5 Corridor Economic Development Plan
30 | P a g e
What is more interesting are some of the trends that are already starting to
emerge here. When compared to the prior period, there is clear evidence of a
decline in the importance of both manufacturing (particularly in the
Northeast San Fernando Valley) and information services in the region, while
employment in construction, professional and scientific services and
entertainment (especially in Santa Clarita) have become more important.
These trends appear to continue right up to the time of the first of the several
waves of crises that strike the regional and national economies.
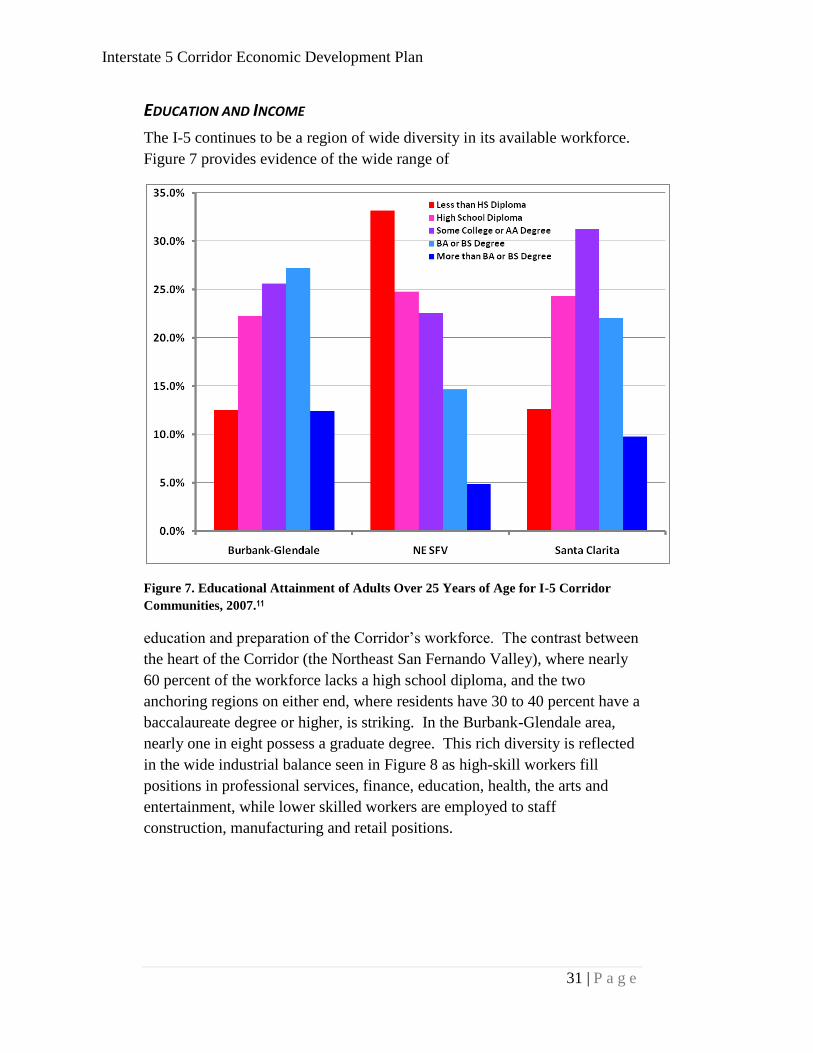
Interstate 5 Corridor Economic Development Plan
31 | P a g e
EDUCATION AND INCOME
The I-5 continues to be a region of wide diversity in its available workforce.
Figure 7 provides evidence of the wide range of
Figure 7. Educational Attainment of Adults Over 25 Years of Age for I-5 Corridor
Communities, 2007.11
education and preparation of the Corridor’s workforce. The contrast between
the heart of the Corridor (the Northeast San Fernando Valley), where nearly
60 percent of the workforce lacks a high school diploma, and the two
anchoring regions on either end, where residents have 30 to 40 percent have a
baccalaureate degree or higher, is striking. In the Burbank-Glendale area,
nearly one in eight possess a graduate degree. This rich diversity is reflected
in the wide industrial balance seen in Figure 8 as high-skill workers fill
positions in professional services, finance, education, health, the arts and
entertainment, while lower skilled workers are employed to staff
construction, manufacturing and retail positions.

Interstate 5 Corridor Economic Development Plan
32 | P a g e
Figure 8. Share of Households, By Income Level, I-5 Corridor Communities, 2007.12
This also plays itself out in the relative balance in the income distribution
seen in the three communities. With a national median household income of
$52,673 in 2007,13
the Northeast San Fernando Valley has an income
distribution that generally reflects the national profile. Both the
Burbank/Glendale and Santa Clarita regions are skewed toward the higher
end of the distribution, with Santa Clarita having some 55 percent of
households showing more than 150 percent of the national median household
income. These higher incomes are eroded, however, by the significantly
higher costs associated with housing and living costs in the region.
HOUSING
Housing is one of the most complex issues in the I-5 Corridor. While the
increase in property values was arguably one of the driving forces behind the
accumulation of wealth that fueled an important share of the region’s growth,
the high cost of housing and the associated high price of commercial and
industrial real estate are cited in numerous studies14
as one of the chief
factors that made the region less competitive in attracting new business
locations. It has made home ownership problematic and supported high
residential rents.

Interstate 5 Corridor Economic Development Plan
33 | P a g e
Figure 9. Share of Households That Are Owner-occupied, I-5 Corridor Communities,
2007.15
Figure 9 shows the homeownership rates for the three regions in the I-5
Corridor. At a time when owners occupied some 68 percent of housing
nationally and 58 percent in California,16
owner-occupied housing only
accounted for 45 percent of housing in Burbank-Glendale and 52 percent of
housing in the Los Angeles City portion of the Corridor. Combined, these
two sections account for more than 80 percent of the housing stock in the
Corridor. Santa Clarita was just above the national average at 73 percent
owner-occupied.

Interstate 5 Corridor Economic Development Plan
34 | P a g e
Figure 10. Share of Households Where Housing Expense Exceeds 30 percent of
Household Income, I-5 Corridor Communities, 2007.17
Figure 10 demonstrates the impact of this on households in the Corridor as
the share of households whose housing costs (mortgage-related expenses18
or
rent) far outstrip the 30 percent of household income that is typically used by
finance companies and policymakers as the standard for affordability. Aside
from Santa Clarita, where high household incomes hold the share down,
more than half of homeowners (usually about 55 percent) in the Corridor
communities spend more than 30 percent of their household income on
housing-related expenses. This compares to a national average of 37.5
percent of households spending this much on ownership-related expenses and
45.6 percent of renters.

Interstate 5 Corridor Economic Development Plan
35 | P a g e
Workforce Housing
The issue of affordability has lead to more determined efforts to assess the
availability of housing for workers as a critical consideration in community
and regional planning initiatives. As housing values rise in a given area,
potential employees will often seek housing in more affordable, outlying
areas thereby imposing significant traffic burdens on the region and
decreasing the quality of life for these workers (such as police, fire and
teachers) and those impacted by the higher traffic levels.
Thus housing affordability has become a key focus for local and regional
policymakers who emphasize that the availability of affordable housing and a
decrease in vehicle miles traveled (VMT) are essential policy goals. With
the increasing emphasis on ―sustainable‖ and ―green‖ development under
statewide initiatives to address concerns about carbon emissions (including
SB 375), these considerations will only increase in importance.
While numerous government initiatives are explicitly targeted at low-income
households and very low income households, including subsidies for
redevelopment, inclusionary housing requirements, all of these are targeted at
the lower end of the income distribution—people with incomes at 80 percent
or less of the Area Median Income (AMI).19
SCAG is required by the State
of California to develop a Regional Housing Needs Assessment wherein not
only does it provide leadership and guidance for local governments as to the
housing growth for which they need to plan, but it also explicitly identifies
the number of units of housing that is affordable to very low and low-income
households. These estimates are incorporated into each community’s
Housing Element within their general plan.
Beyond these, there are concerns regarding the availability of housing for
those whose incomes do not qualify them for these limited housing
opportunities, but for whom the affordability of housing in Los Angeles
County is still problematic. The typical categories of workforce housing
include workers whose household incomes range from 80 to 180 percent of
the AMI. These individuals face a market where the median home price is
$390,000.
Figure 11 below shows how much an individual in this ―workforce‖ category
would be able to afford. As is readily evident, in the recent history of
southern California, even at Tier 3, workforce-level residents would have
been hard-pressed to afford in light of these limitations.

Interstate 5 Corridor Economic Development Plan
36 | P a g e
1-person Household 4-person Household
Income Category Maximum
Income
Maximum Home Price
Maximum Rent
Maximum Income
Maximum Home Price
Maximum Rent
Area Median Income 43,450 179,593 1,086 62,100 256,680 $1,553
80-120% AMI (Tier 1) 52,140 215,512 1,304 74,520 308,016 1,863
120 - 150% AMI (Tier 2) 65,175 269,390 1,629 93,150 385,020 2,329
150 - 180% AMI (Tier 3) 78,210 323,268 1,955 111,780 462,024 2,795 Figure 11. Workforce affordability income thresholds.20
At the same time, one of the ―silver linings‖ of the recent meltdown in the
subprime market and the collapse of home values throughout the region is
that these homes are now much more affordable. Figure 12 shows a table by
the National Association of Home Builders that documents the increase in
affordability in the Los Angeles-Long Beach-Glendale region.
Figure 12. Los Angeles-Long Beach-Glendale Affordability Index.21
In fact, a review of the Multiple Listing Service data used by realtors in this
region found 719 and 890 single family homes available in the Tier 2 and
Tier 3 ranges, respectively, as seen in Figure 13.
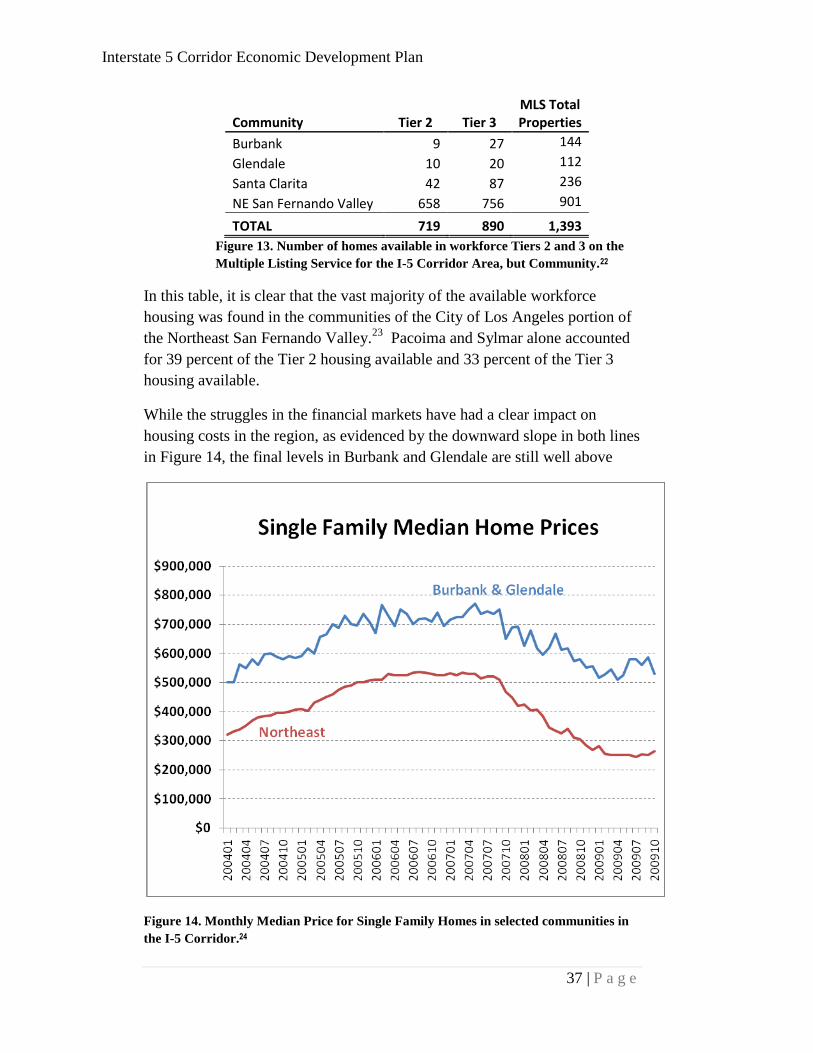
Interstate 5 Corridor Economic Development Plan
37 | P a g e
Community Tier 2 Tier 3 MLS Total Properties
Burbank 9 27 144
Glendale 10 20 112
Santa Clarita 42 87 236
NE San Fernando Valley 658 756 901
TOTAL 719 890 1,393 Figure 13. Number of homes available in workforce Tiers 2 and 3 on the
Multiple Listing Service for the I-5 Corridor Area, but Community.22
In this table, it is clear that the vast majority of the available workforce
housing was found in the communities of the City of Los Angeles portion of
the Northeast San Fernando Valley.23
Pacoima and Sylmar alone accounted
for 39 percent of the Tier 2 housing available and 33 percent of the Tier 3
housing available.
While the struggles in the financial markets have had a clear impact on
housing costs in the region, as evidenced by the downward slope in both lines
in Figure 14, the final levels in Burbank and Glendale are still well above
Figure 14. Monthly Median Price for Single Family Homes in selected communities in
the I-5 Corridor.24
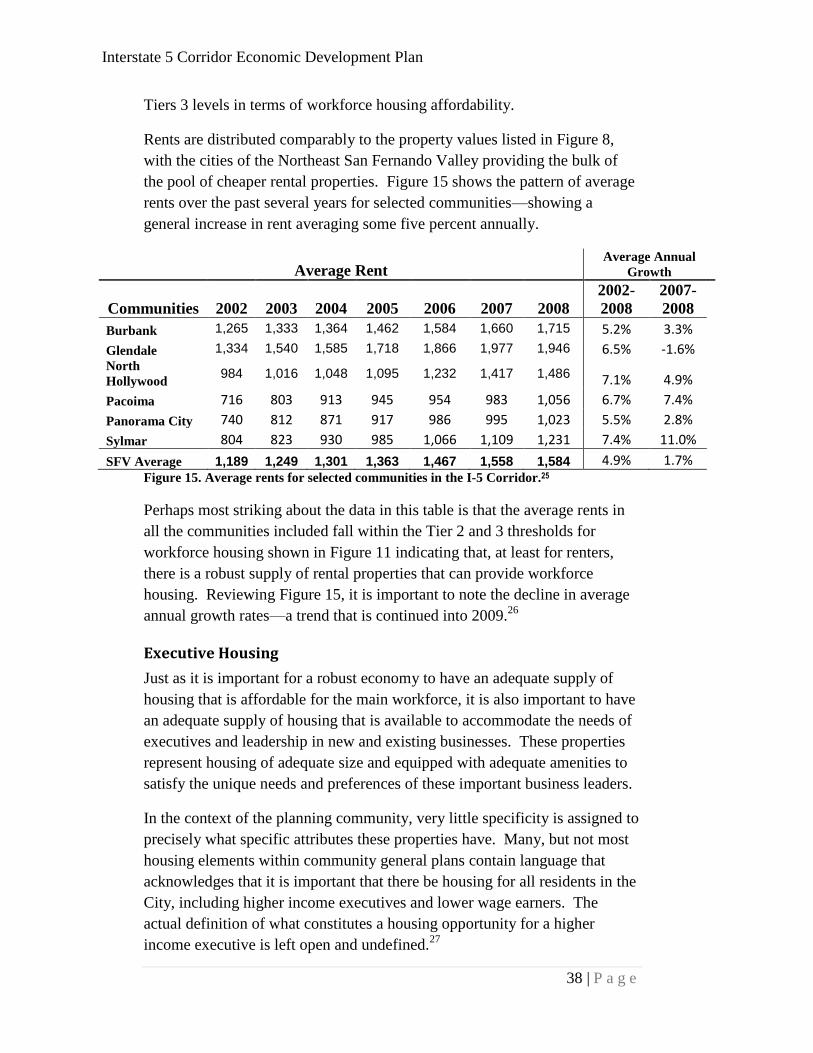
Interstate 5 Corridor Economic Development Plan
38 | P a g e
Tiers 3 levels in terms of workforce housing affordability.
Rents are distributed comparably to the property values listed in Figure 8,
with the cities of the Northeast San Fernando Valley providing the bulk of
the pool of cheaper rental properties. Figure 15 shows the pattern of average
rents over the past several years for selected communities—showing a
general increase in rent averaging some five percent annually.
Average Rent Average Annual
Growth
Communities 2002 2003 2004 2005 2006 2007 2008
2002-
2008
2007-
2008
Burbank 1,265 1,333 1,364 1,462 1,584 1,660 1,715 5.2% 3.3%
Glendale 1,334 1,540 1,585 1,718 1,866 1,977 1,946 6.5% -1.6% North
Hollywood 984 1,016 1,048 1,095 1,232 1,417 1,486 7.1% 4.9%
Pacoima 716 803 913 945 954 983 1,056 6.7% 7.4%
Panorama City 740 812 871 917 986 995 1,023 5.5% 2.8%
Sylmar 804 823 930 985 1,066 1,109 1,231 7.4% 11.0%
SFV Average 1,189 1,249 1,301 1,363 1,467 1,558 1,584 4.9% 1.7% Figure 15. Average rents for selected communities in the I-5 Corridor.25
Perhaps most striking about the data in this table is that the average rents in
all the communities included fall within the Tier 2 and 3 thresholds for
workforce housing shown in Figure 11 indicating that, at least for renters,
there is a robust supply of rental properties that can provide workforce
housing. Reviewing Figure 15, it is important to note the decline in average
annual growth rates—a trend that is continued into 2009.26
Executive Housing
Just as it is important for a robust economy to have an adequate supply of
housing that is affordable for the main workforce, it is also important to have
an adequate supply of housing that is available to accommodate the needs of
executives and leadership in new and existing businesses. These properties
represent housing of adequate size and equipped with adequate amenities to
satisfy the unique needs and preferences of these important business leaders.
In the context of the planning community, very little specificity is assigned to
precisely what specific attributes these properties have. Many, but not most
housing elements within community general plans contain language that
acknowledges that it is important that there be housing for all residents in the
City, including higher income executives and lower wage earners. The
actual definition of what constitutes a housing opportunity for a higher
income executive is left open and undefined.27

Interstate 5 Corridor Economic Development Plan
39 | P a g e
For purposes of this analysis, executive housing was defined as high-end (for
this market affordable at about 250 percent of AMI or more), containing a
significant amount of internal space (3,000 square feet was used as a
minimum boundary for this assessment), and with an adequate number of
bedrooms (a minimum of four). Many other amenities could have been
incorporated, but this standard should capture a sense of the number and type
of properties that would loosely meet the standard of executive housing. The
results of a zip code-by-zip code analysis of the corridor conducted to
identify the range of these properties currently available on the market is
presented in Figure 16.
Community Executive Total Percent
Burbank 16 144 11.1% Glendale 22 112 19.6% Santa Clarita 59 236 25.0% NE San Fernando Valley 20 901 2.2%
TOTAL 117 1393 8.4% Figure 16. Number of homes available meeting Executive Housing
criteria on the Multiple Listing Service for the I-5 Corridor Area, by
Community, January 2010.28
Not surprisingly, the largest share (about half) of the properties meeting the
executive housing standard is found in the newer, larger developments in the
Santa Clarita area. It is important to note, however, that inventories did exist
in all of the communities of the Corridor.
Jobs-Housing Mix
Intrinsic to the question of housing supply is not only the question of
affordability, but also of accessibility. Economists, for example, will argue
that one solution to the absence of an adequate supply of affordable housing
in one market is to simply pursue housing in another, more distant, market
and then to commute to the place of employment. This commuting strategy
is rampant in most urban areas and can lead to sprawl (as developers pursue
more remote, less expensive land to develop) and high congestion (as these
commuters travel between their homes and places of employment).
To help gauge the scope and intensity of the pressures that an economic
development plan may have on a community, therefore, it is important to
look at current traffic patterns and the relationship between the number of
jobs within a planning area and the number of housing units available within
it—the ―jobs-housing ratio.‖ If the ratio is significantly less than 1.0, this
indicates a ―bedroom community‖ where mornings bring a surge of
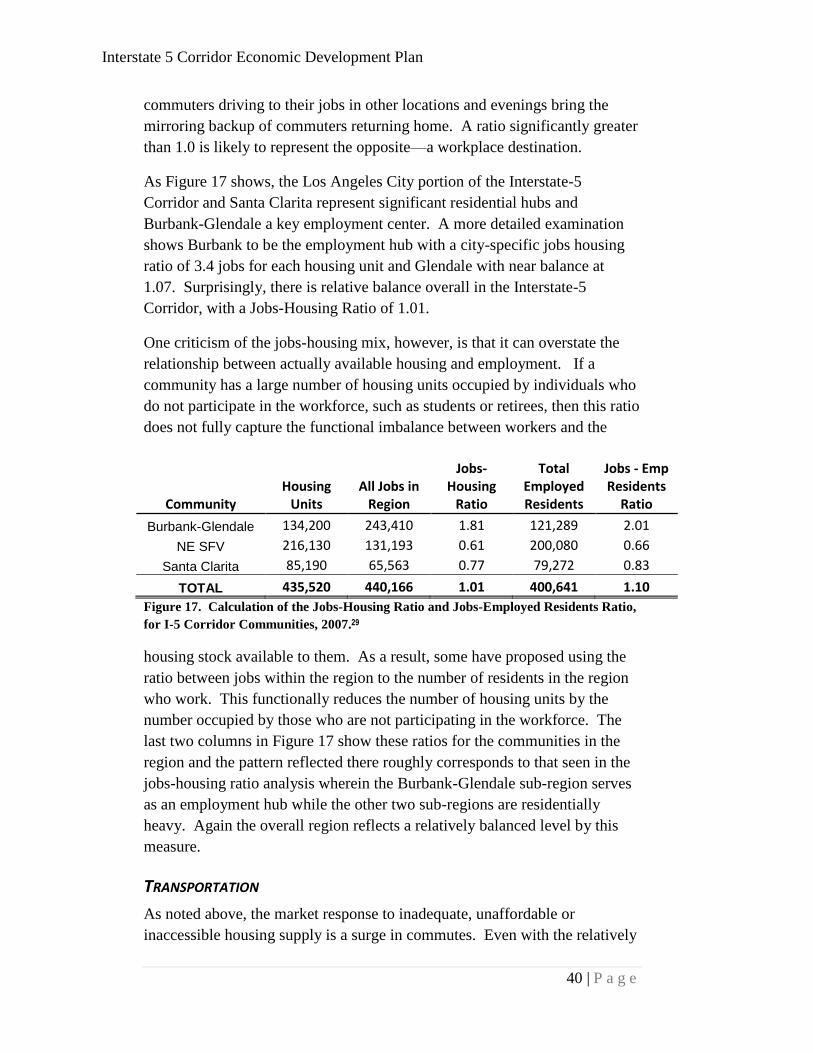
Interstate 5 Corridor Economic Development Plan
40 | P a g e
commuters driving to their jobs in other locations and evenings bring the
mirroring backup of commuters returning home. A ratio significantly greater
than 1.0 is likely to represent the opposite—a workplace destination.
As Figure 17 shows, the Los Angeles City portion of the Interstate-5
Corridor and Santa Clarita represent significant residential hubs and
Burbank-Glendale a key employment center. A more detailed examination
shows Burbank to be the employment hub with a city-specific jobs housing
ratio of 3.4 jobs for each housing unit and Glendale with near balance at
1.07. Surprisingly, there is relative balance overall in the Interstate-5
Corridor, with a Jobs-Housing Ratio of 1.01.
One criticism of the jobs-housing mix, however, is that it can overstate the
relationship between actually available housing and employment. If a
community has a large number of housing units occupied by individuals who
do not participate in the workforce, such as students or retirees, then this ratio
does not fully capture the functional imbalance between workers and the
Community Housing
Units All Jobs in
Region
Jobs-Housing
Ratio
Total Employed Residents
Jobs - Emp Residents
Ratio
Burbank-Glendale 134,200 243,410 1.81 121,289 2.01
NE SFV 216,130 131,193 0.61 200,080 0.66
Santa Clarita 85,190 65,563 0.77 79,272 0.83
TOTAL 435,520 440,166 1.01 400,641 1.10 Figure 17. Calculation of the Jobs-Housing Ratio and Jobs-Employed Residents Ratio,
for I-5 Corridor Communities, 2007.29
housing stock available to them. As a result, some have proposed using the
ratio between jobs within the region to the number of residents in the region
who work. This functionally reduces the number of housing units by the
number occupied by those who are not participating in the workforce. The
last two columns in Figure 17 show these ratios for the communities in the
region and the pattern reflected there roughly corresponds to that seen in the
jobs-housing ratio analysis wherein the Burbank-Glendale sub-region serves
as an employment hub while the other two sub-regions are residentially
heavy. Again the overall region reflects a relatively balanced level by this
measure.
TRANSPORTATION
As noted above, the market response to inadequate, unaffordable or
inaccessible housing supply is a surge in commutes. Even with the relatively
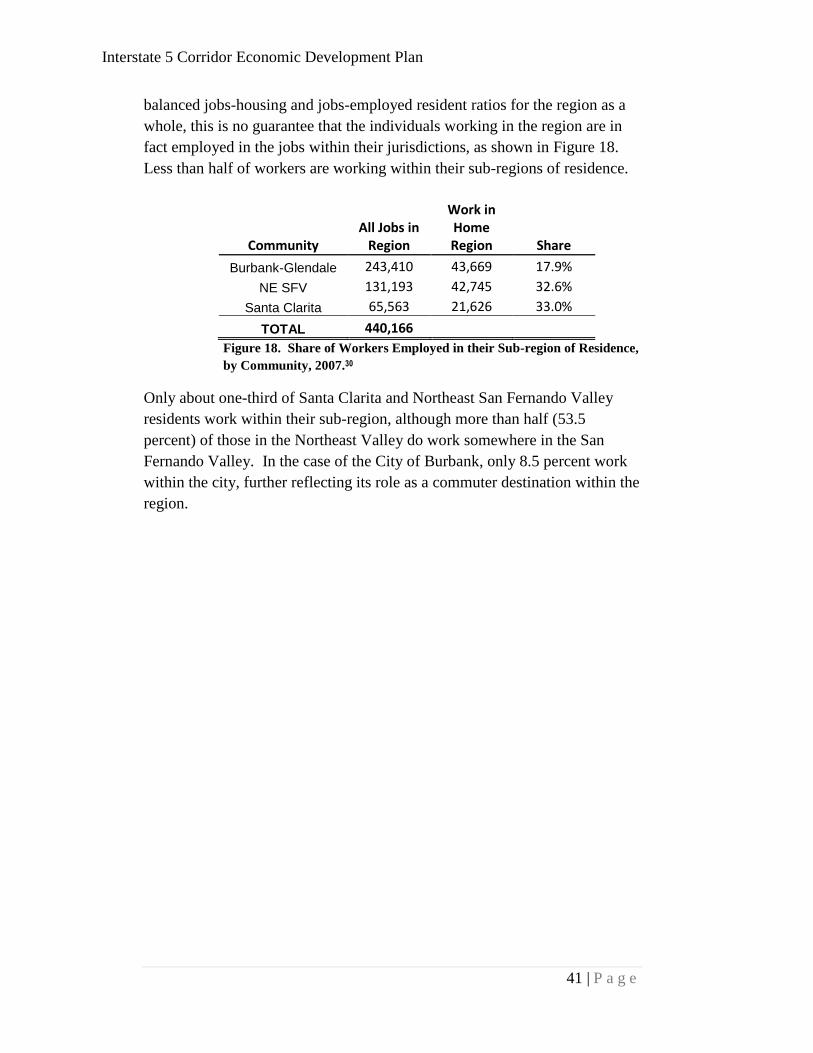
Interstate 5 Corridor Economic Development Plan
41 | P a g e
balanced jobs-housing and jobs-employed resident ratios for the region as a
whole, this is no guarantee that the individuals working in the region are in
fact employed in the jobs within their jurisdictions, as shown in Figure 18.
Less than half of workers are working within their sub-regions of residence.
Community All Jobs in
Region
Work in Home Region Share
Burbank-Glendale 243,410 43,669 17.9%
NE SFV 131,193 42,745 32.6%
Santa Clarita 65,563 21,626 33.0%
TOTAL 440,166 Figure 18. Share of Workers Employed in their Sub-region of Residence,
by Community, 2007.30
Only about one-third of Santa Clarita and Northeast San Fernando Valley
residents work within their sub-region, although more than half (53.5
percent) of those in the Northeast Valley do work somewhere in the San
Fernando Valley. In the case of the City of Burbank, only 8.5 percent work
within the city, further reflecting its role as a commuter destination within the
region.
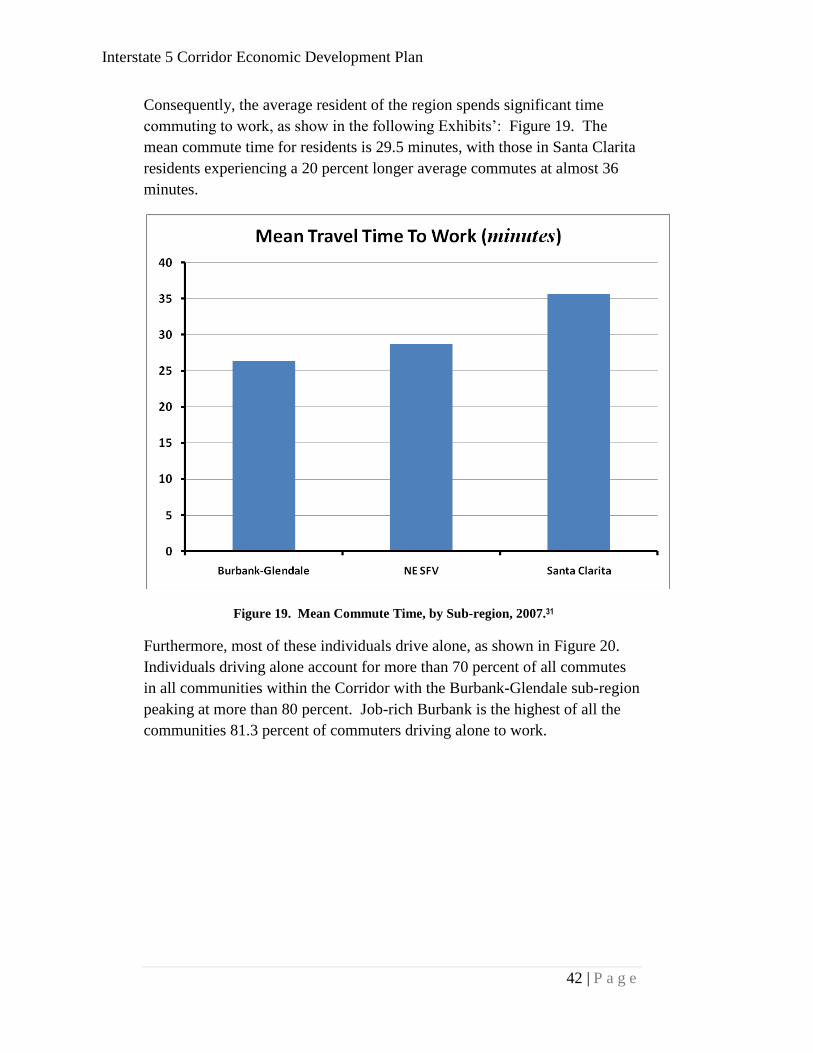
Interstate 5 Corridor Economic Development Plan
42 | P a g e
Consequently, the average resident of the region spends significant time
commuting to work, as show in the following Exhibits’: Figure 19. The
mean commute time for residents is 29.5 minutes, with those in Santa Clarita
residents experiencing a 20 percent longer average commutes at almost 36
minutes.
Figure 19. Mean Commute Time, by Sub-region, 2007.31
Furthermore, most of these individuals drive alone, as shown in Figure 20.
Individuals driving alone account for more than 70 percent of all commutes
in all communities within the Corridor with the Burbank-Glendale sub-region
peaking at more than 80 percent. Job-rich Burbank is the highest of all the
communities 81.3 percent of commuters driving alone to work.
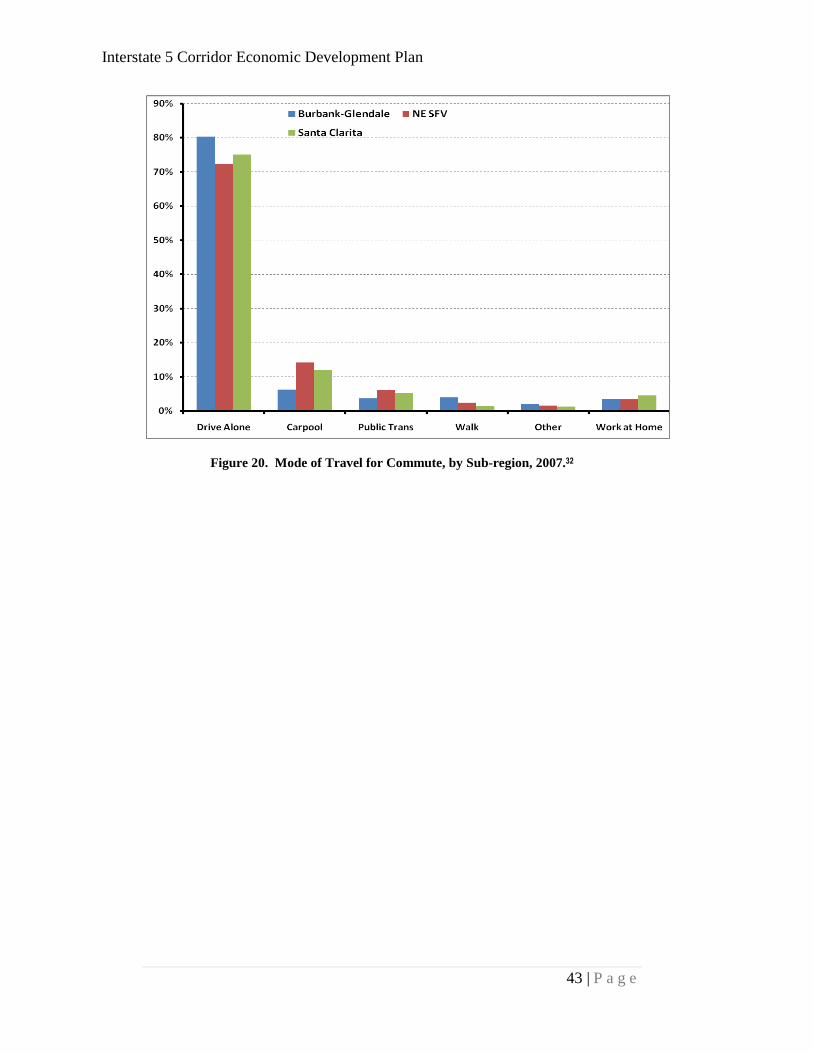
Interstate 5 Corridor Economic Development Plan
43 | P a g e
Figure 20. Mode of Travel for Commute, by Sub-region, 2007.32

Interstate 5 Corridor Economic Development Plan
44 | P a g e
The Interstate-5 Transportation Infrastructure
For a region which defines itself by proximity to Interstate 5, transportation
issues are critical to understanding the opportunities and challenges which
shape the efforts to develop a comprehensive economic development strategy
for the region. The Interstate-5 Corridor is situated between several unique
transportation foci as well as several destination locations—creating both
unique opportunities and unique challenges. These factors affect not only
commuters traveling to and from work, but also the flow of goods and
commerce throughout the region.
Overall, the region is one marked by some levels of significant congestion.
To understand these flows and their impacts on the region’s prospects, they
will be considered one at a time: vehicular flows, air flows, goods movement
flows, port-related transport flows and transit-related flows. In the aggregate,
these flows have combined to create a region that is subject to relatively high
levels of congestion, especially at peak hours. Figure 21 shows the
congestion present in the LA County highway and roadway system during
peak hours.

Interstate 5 Corridor Economic Development Plan
45 | P a g e
Figure 21. 2003 CMP Highway and Roadway System AM Peak Hour Levels of
Service33
Zoomed in on Figure 22, one can see that Interstate 5 is at the LOS F level,
indicating that it is operating at or above capacity from the 101 to the 118.

Interstate 5 Corridor Economic Development Plan
46 | P a g e
Figure 22. Zoomed Image of I-5 Corridor at AM Peak Hours.
The data for capacity utilization along the I-5, shows that the freeway
demand peaks above capacity during the morning and afternoon peaks.
Figure 19 shows that, during the peak hours the freeway ranges as much as
26 percent above the rated capacity for stretches of Interstate 5.
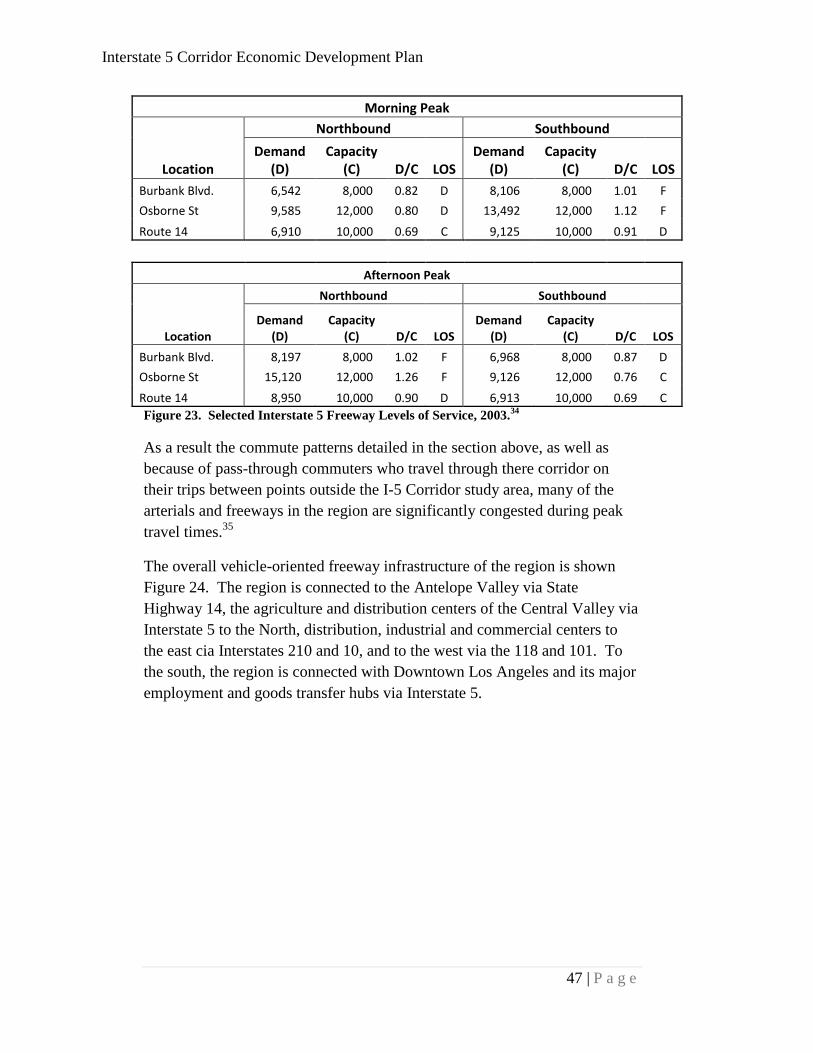
Interstate 5 Corridor Economic Development Plan
47 | P a g e
Morning Peak
Northbound Southbound
Location Demand
(D) Capacity
(C) D/C LOS Demand
(D) Capacity
(C) D/C LOS
Burbank Blvd. 6,542 8,000 0.82 D 8,106 8,000 1.01 F
Osborne St 9,585 12,000 0.80 D 13,492 12,000 1.12 F
Route 14 6,910 10,000 0.69 C 9,125 10,000 0.91 D
Afternoon Peak
Northbound Southbound
Location Demand
(D) Capacity
(C) D/C LOS Demand
(D) Capacity
(C) D/C LOS
Burbank Blvd. 8,197 8,000 1.02 F 6,968 8,000 0.87 D
Osborne St 15,120 12,000 1.26 F 9,126 12,000 0.76 C
Route 14 8,950 10,000 0.90 D 6,913 10,000 0.69 C
Figure 23. Selected Interstate 5 Freeway Levels of Service, 2003.34
As a result the commute patterns detailed in the section above, as well as
because of pass-through commuters who travel through there corridor on
their trips between points outside the I-5 Corridor study area, many of the
arterials and freeways in the region are significantly congested during peak
travel times.35
The overall vehicle-oriented freeway infrastructure of the region is shown
Figure 24. The region is connected to the Antelope Valley via State
Highway 14, the agriculture and distribution centers of the Central Valley via
Interstate 5 to the North, distribution, industrial and commercial centers to
the east cia Interstates 210 and 10, and to the west via the 118 and 101. To
the south, the region is connected with Downtown Los Angeles and its major
employment and goods transfer hubs via Interstate 5.

Interstate 5 Corridor Economic Development Plan
48 | P a g e
Figure 24. Vehicle-oriented Transportation Infrastructure in the Study Area.36
The I-5 corridor also is supported throughout by a series of major N-S and E-
W arterials, as seen in Figure 25. These routes further connect the Corridor
with the surrounding communities and also connect the cities and
communities within the Corridor. San Fernando Road, which parallels
Interstate 5 in many areas, often exceeds its rated capacity with a V/C
(volume to capacity) ratio in excess of 1.0 during the morning commute.37

Interstate 5 Corridor Economic Development Plan
49 | P a g e
Figure 25. Major N-S Arterials in San Fernando Valley.38
Figure 26. HOV Gap Closure and Connectors - SCAG Regional Transportation Plan
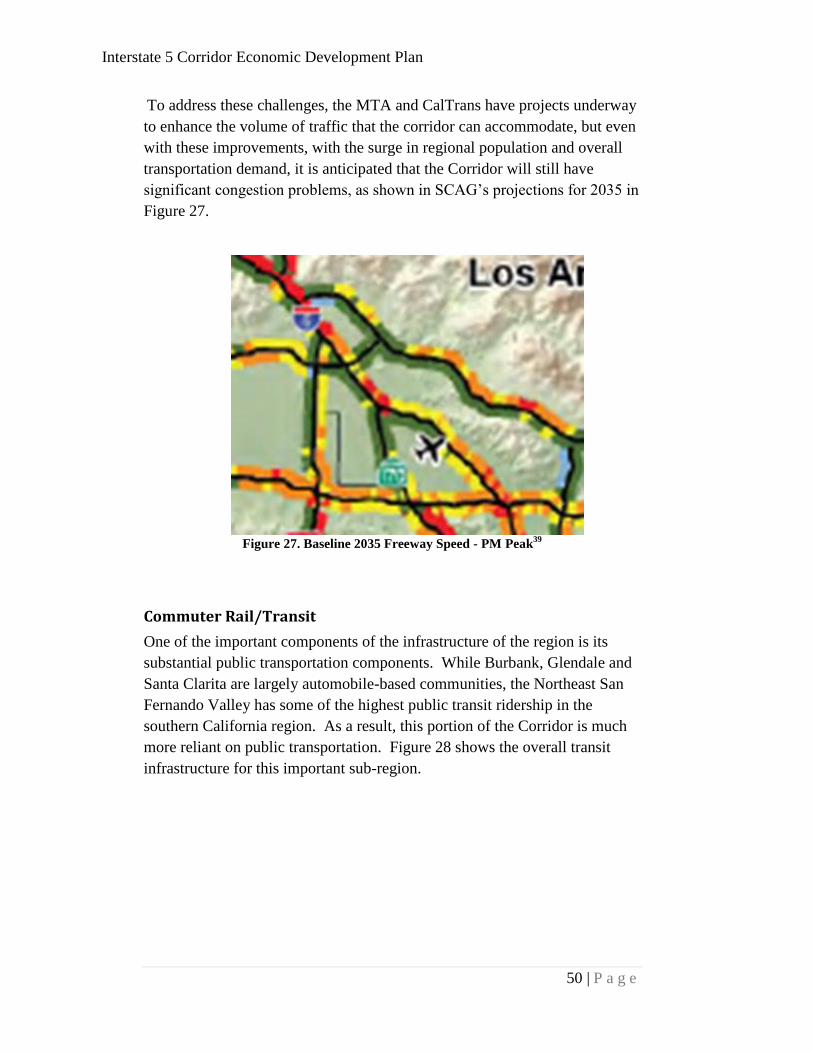
Interstate 5 Corridor Economic Development Plan
50 | P a g e
To address these challenges, the MTA and CalTrans have projects underway
to enhance the volume of traffic that the corridor can accommodate, but even
with these improvements, with the surge in regional population and overall
transportation demand, it is anticipated that the Corridor will still have
significant congestion problems, as shown in SCAG’s projections for 2035 in
Figure 27.
Figure 27. Baseline 2035 Freeway Speed - PM Peak
39
Commuter Rail/Transit
One of the important components of the infrastructure of the region is its
substantial public transportation components. While Burbank, Glendale and
Santa Clarita are largely automobile-based communities, the Northeast San
Fernando Valley has some of the highest public transit ridership in the
southern California region. As a result, this portion of the Corridor is much
more reliant on public transportation. Figure 28 shows the overall transit
infrastructure for this important sub-region.

Interstate 5 Corridor Economic Development Plan
51 | P a g e
Figure 28. Existing Transit Network, San Fernando Valley, 2002.40
This extensive network provides access to employment centers across the
Valley, although not always in the most timely fashion. Figure 29 shows
how the ridership pattern is shaped by the availability of high-frequency
transit lines.

Interstate 5 Corridor Economic Development Plan
52 | P a g e
Figure 29. Transit Ridership in the San Fernando Valley, 2002.41
The prevalence of transit usage tends to be inversely correlated with income
as poorer households tend not to be able to afford the high costs of
automobile ownership and thus rely more heavily on public transit. This
correlation can be seen in the concentration of high transit use in the poorer,
more high-density sections of the San Fernando Valley like Pacoima and
Sylmar.42
Goods Movement and Infrastructure
Beyond moving people, the transportation infrastructure is a key link in the
movement of goods around the southern California region. Between 2003
and 2035, SCAG anticipates an increase from 35,700 daily truck volumes on
I-5 to 62,100—a 74 percent increase. This truck volume, driven in part by a
near-tripling of the cargo volume out of the Ports of Los Angeles and Long
Beach,43
will be a significant contributor to the congestion levels identified in
Figure 27.
Complementing the truck traffic is the existing and proposed rail
infrastructure for the SCAG region show in Figure 30.

Interstate 5 Corridor Economic Development Plan
53 | P a g e
Figure 30. Railroad Lines in SCAG Region, 2003.
44
One set of proposals that has gained some traction among the economic
development community has been the establishment of inland port regions.
The general concept would use expanded and/or dedicated rail to transfer
cargo from port locations to inland, regionally distributed port locations that
would house distribution and customs areas. The creation of these inland
ports would allow for the broader distribution of truck traffic away from the
Ports of Long Beach and Los Angeles and allow truck traffic, which is a
confounding driver of congestion, to be more widely distributed and thus
relieve the pressure on any single portion of the region’s transportation
infrastructure. Figure 31 portrays one potential vision of this model from the
Multi-county Goods Movement Action Plan. This plan shows the potential
inland port models near the airport in Burbank and how extra-regional rail
could be used to link these locations.
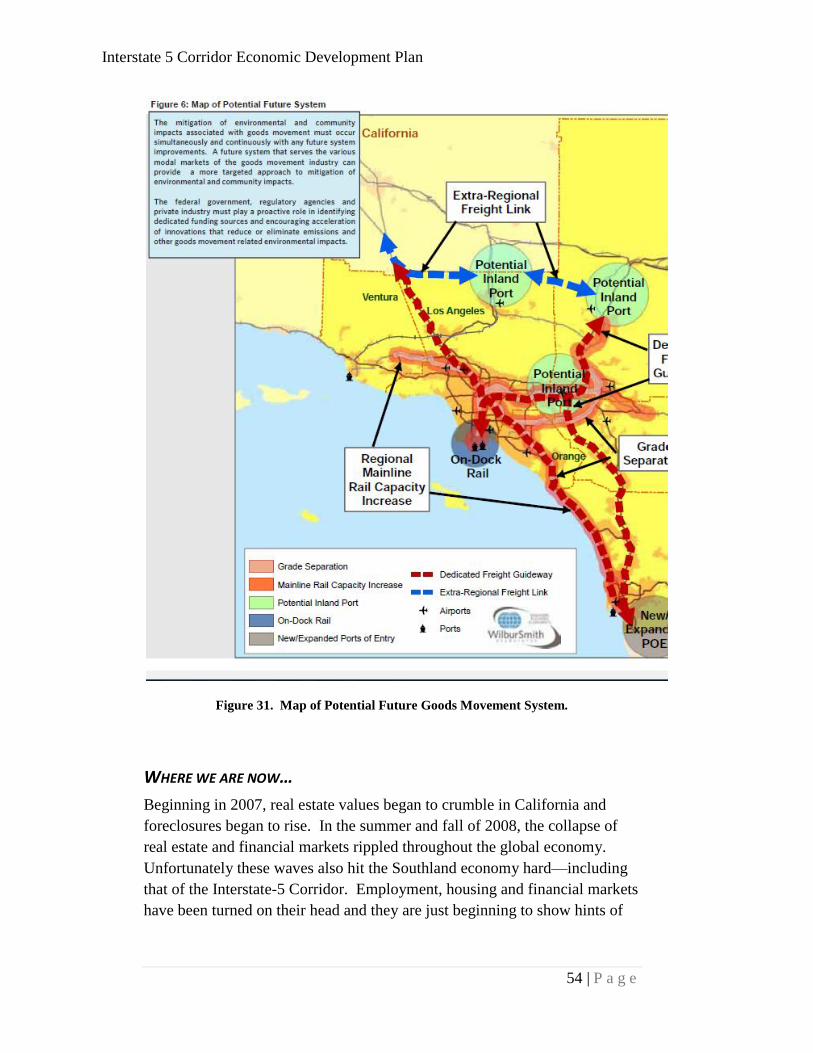
Interstate 5 Corridor Economic Development Plan
54 | P a g e
Figure 31. Map of Potential Future Goods Movement System.
WHERE WE ARE NOW…
Beginning in 2007, real estate values began to crumble in California and
foreclosures began to rise. In the summer and fall of 2008, the collapse of
real estate and financial markets rippled throughout the global economy.
Unfortunately these waves also hit the Southland economy hard—including
that of the Interstate-5 Corridor. Employment, housing and financial markets
have been turned on their head and they are just beginning to show hints of
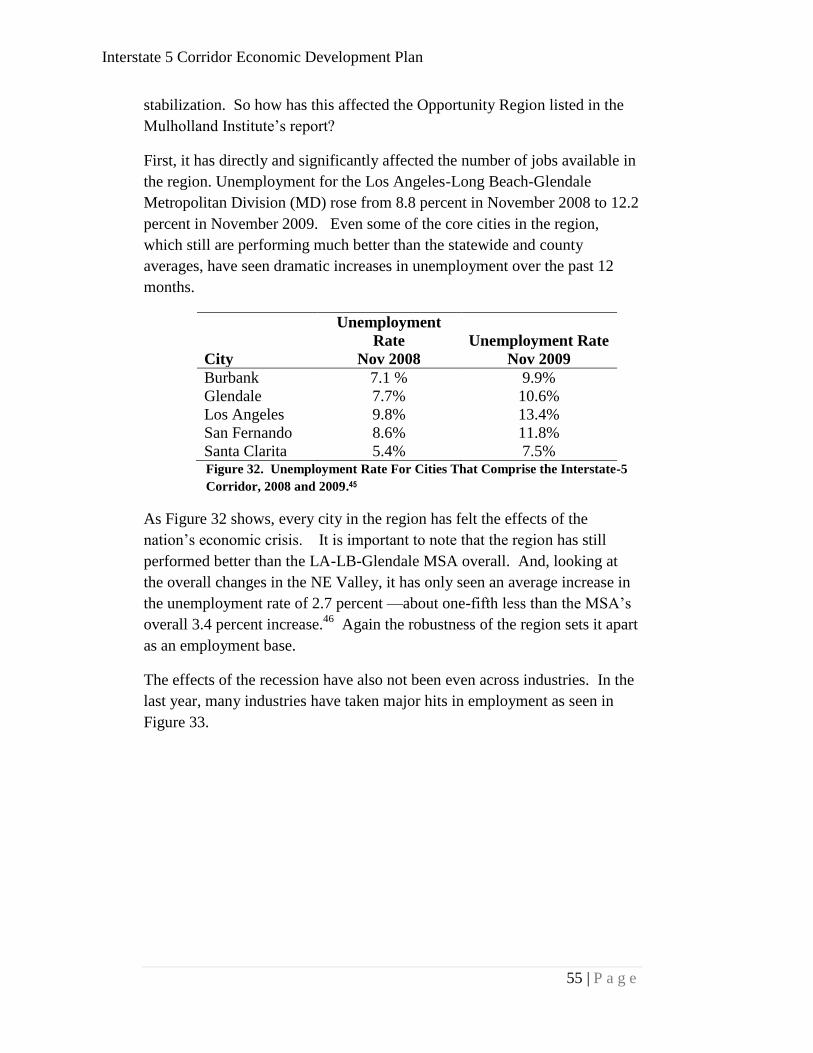
Interstate 5 Corridor Economic Development Plan
55 | P a g e
stabilization. So how has this affected the Opportunity Region listed in the
Mulholland Institute’s report?
First, it has directly and significantly affected the number of jobs available in
the region. Unemployment for the Los Angeles-Long Beach-Glendale
Metropolitan Division (MD) rose from 8.8 percent in November 2008 to 12.2
percent in November 2009. Even some of the core cities in the region,
which still are performing much better than the statewide and county
averages, have seen dramatic increases in unemployment over the past 12
months.
City
Unemployment
Rate
Nov 2008
Unemployment Rate
Nov 2009
Burbank 7.1 % 9.9%
Glendale 7.7% 10.6%
Los Angeles 9.8% 13.4%
San Fernando 8.6% 11.8%
Santa Clarita 5.4% 7.5% Figure 32. Unemployment Rate For Cities That Comprise the Interstate-5
Corridor, 2008 and 2009.45
As Figure 32 shows, every city in the region has felt the effects of the
nation’s economic crisis. It is important to note that the region has still
performed better than the LA-LB-Glendale MSA overall. And, looking at
the overall changes in the NE Valley, it has only seen an average increase in
the unemployment rate of 2.7 percent —about one-fifth less than the MSA’s
overall 3.4 percent increase.46
Again the robustness of the region sets it apart
as an employment base.
The effects of the recession have also not been even across industries. In the
last year, many industries have taken major hits in employment as seen in
Figure 33.
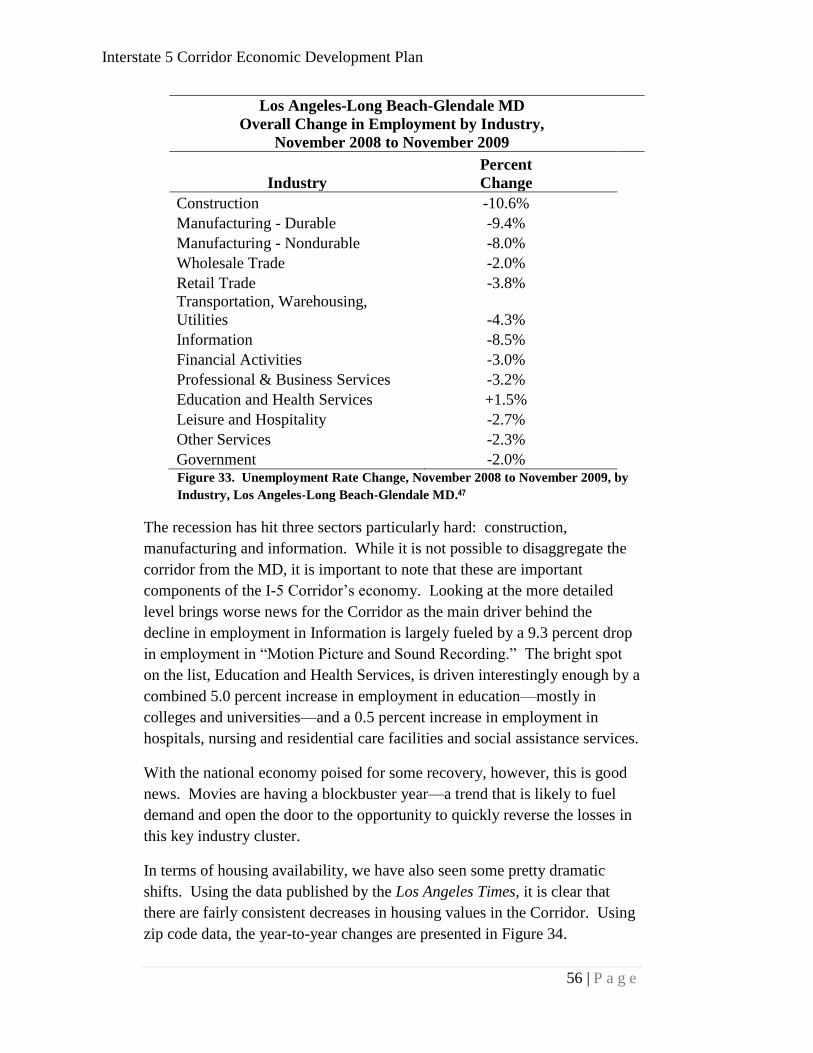
Interstate 5 Corridor Economic Development Plan
56 | P a g e
Los Angeles-Long Beach-Glendale MD
Overall Change in Employment by Industry,
November 2008 to November 2009
Industry
Percent
Change
Construction -10.6%
Manufacturing - Durable -9.4%
Manufacturing - Nondurable -8.0%
Wholesale Trade -2.0%
Retail Trade -3.8%
Transportation, Warehousing,
Utilities -4.3%
Information -8.5%
Financial Activities -3.0%
Professional & Business Services -3.2%
Education and Health Services +1.5%
Leisure and Hospitality -2.7%
Other Services -2.3%
Government -2.0% Figure 33. Unemployment Rate Change, November 2008 to November 2009, by
Industry, Los Angeles-Long Beach-Glendale MD.47
The recession has hit three sectors particularly hard: construction,
manufacturing and information. While it is not possible to disaggregate the
corridor from the MD, it is important to note that these are important
components of the I-5 Corridor’s economy. Looking at the more detailed
level brings worse news for the Corridor as the main driver behind the
decline in employment in Information is largely fueled by a 9.3 percent drop
in employment in ―Motion Picture and Sound Recording.‖ The bright spot
on the list, Education and Health Services, is driven interestingly enough by a
combined 5.0 percent increase in employment in education—mostly in
colleges and universities—and a 0.5 percent increase in employment in
hospitals, nursing and residential care facilities and social assistance services.
With the national economy poised for some recovery, however, this is good
news. Movies are having a blockbuster year—a trend that is likely to fuel
demand and open the door to the opportunity to quickly reverse the losses in
this key industry cluster.
In terms of housing availability, we have also seen some pretty dramatic
shifts. Using the data published by the Los Angeles Times, it is clear that
there are fairly consistent decreases in housing values in the Corridor. Using
zip code data, the year-to-year changes are presented in Figure 34.
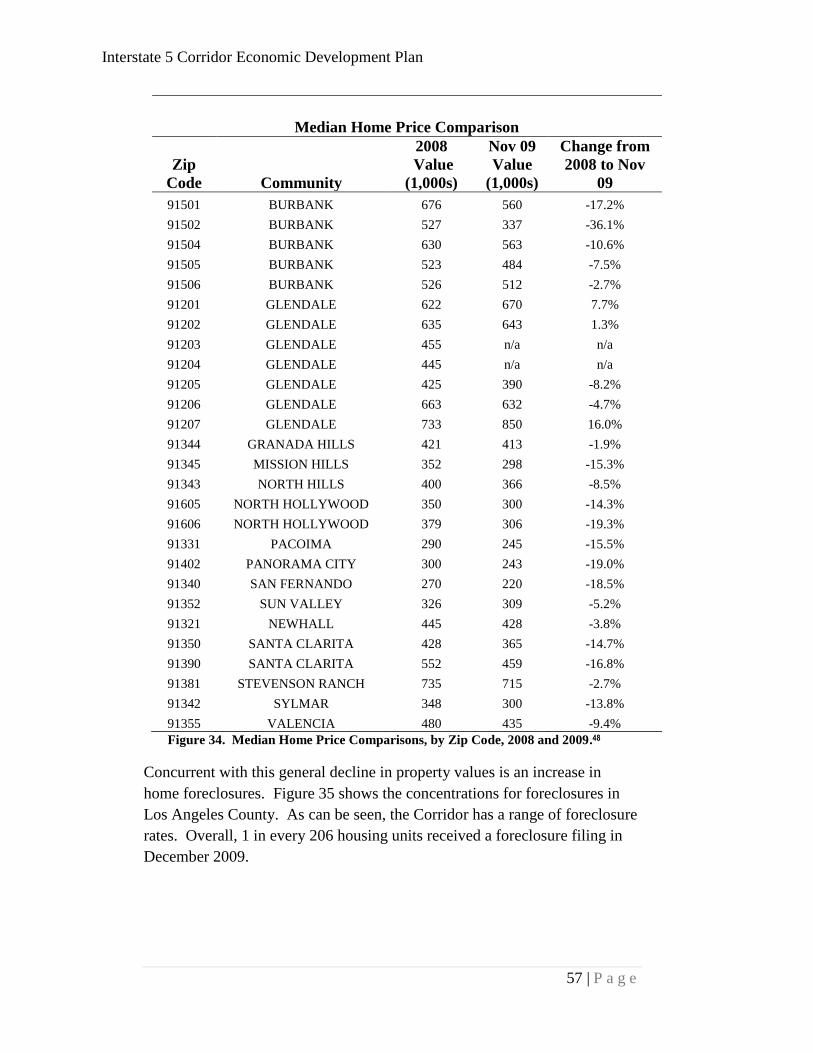
Interstate 5 Corridor Economic Development Plan
57 | P a g e
Median Home Price Comparison
Zip
Code Community
2008
Value
(1,000s)
Nov 09
Value
(1,000s)
Change from
2008 to Nov
09
91501 BURBANK 676 560 -17.2%
91502 BURBANK 527 337 -36.1%
91504 BURBANK 630 563 -10.6%
91505 BURBANK 523 484 -7.5%
91506 BURBANK 526 512 -2.7%
91201 GLENDALE 622 670 7.7%
91202 GLENDALE 635 643 1.3%
91203 GLENDALE 455 n/a n/a
91204 GLENDALE 445 n/a n/a
91205 GLENDALE 425 390 -8.2%
91206 GLENDALE 663 632 -4.7%
91207 GLENDALE 733 850 16.0%
91344 GRANADA HILLS 421 413 -1.9%
91345 MISSION HILLS 352 298 -15.3%
91343 NORTH HILLS 400 366 -8.5%
91605 NORTH HOLLYWOOD 350 300 -14.3%
91606 NORTH HOLLYWOOD 379 306 -19.3%
91331 PACOIMA 290 245 -15.5%
91402 PANORAMA CITY 300 243 -19.0%
91340 SAN FERNANDO 270 220 -18.5%
91352 SUN VALLEY 326 309 -5.2%
91321 NEWHALL 445 428 -3.8%
91350 SANTA CLARITA 428 365 -14.7%
91390 SANTA CLARITA 552 459 -16.8%
91381 STEVENSON RANCH 735 715 -2.7%
91342 SYLMAR 348 300 -13.8%
91355 VALENCIA 480 435 -9.4%
Figure 34. Median Home Price Comparisons, by Zip Code, 2008 and 2009.48
Concurrent with this general decline in property values is an increase in
home foreclosures. Figure 35 shows the concentrations for foreclosures in
Los Angeles County. As can be seen, the Corridor has a range of foreclosure
rates. Overall, 1 in every 206 housing units received a foreclosure filing in
December 2009.
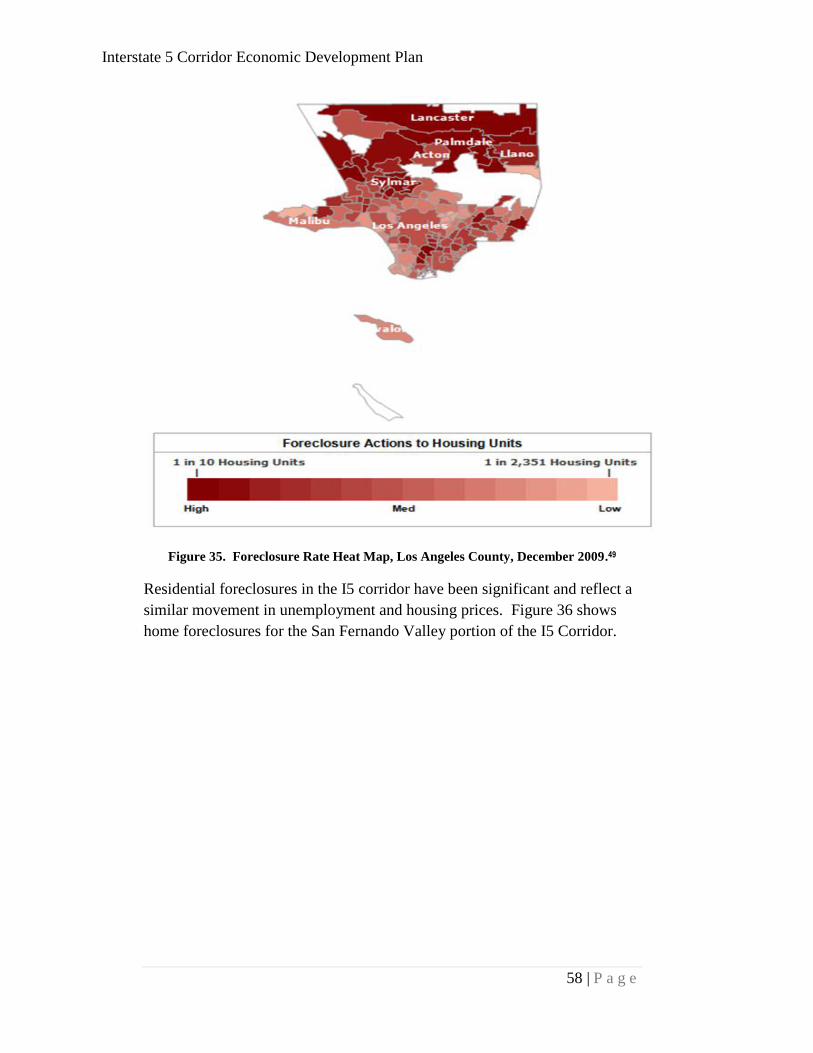
Interstate 5 Corridor Economic Development Plan
58 | P a g e
Figure 35. Foreclosure Rate Heat Map, Los Angeles County, December 2009.49
Residential foreclosures in the I5 corridor have been significant and reflect a
similar movement in unemployment and housing prices. Figure 36 shows
home foreclosures for the San Fernando Valley portion of the I5 Corridor.

Interstate 5 Corridor Economic Development Plan
59 | P a g e
Figure 36. Home Foreclosures, San Fernando portion of the I-5 Corridor. Source:
SFVERC, DataQuick.
Following the onset of the recession in early 2007, home foreclosures started
a dramatic rise, peaking in August 2008 at 472 for this area. The upside of
this evidence is that foreclosures have recently been on the decline implying
the start of a recovery.
Concurrent with the changes in the residential markets in southern California,
the industrial market has also taken the recession hard. Vacancies are up
significantly in the second and third quarters of 2009 while rents are down, as
shown in Figure 37.
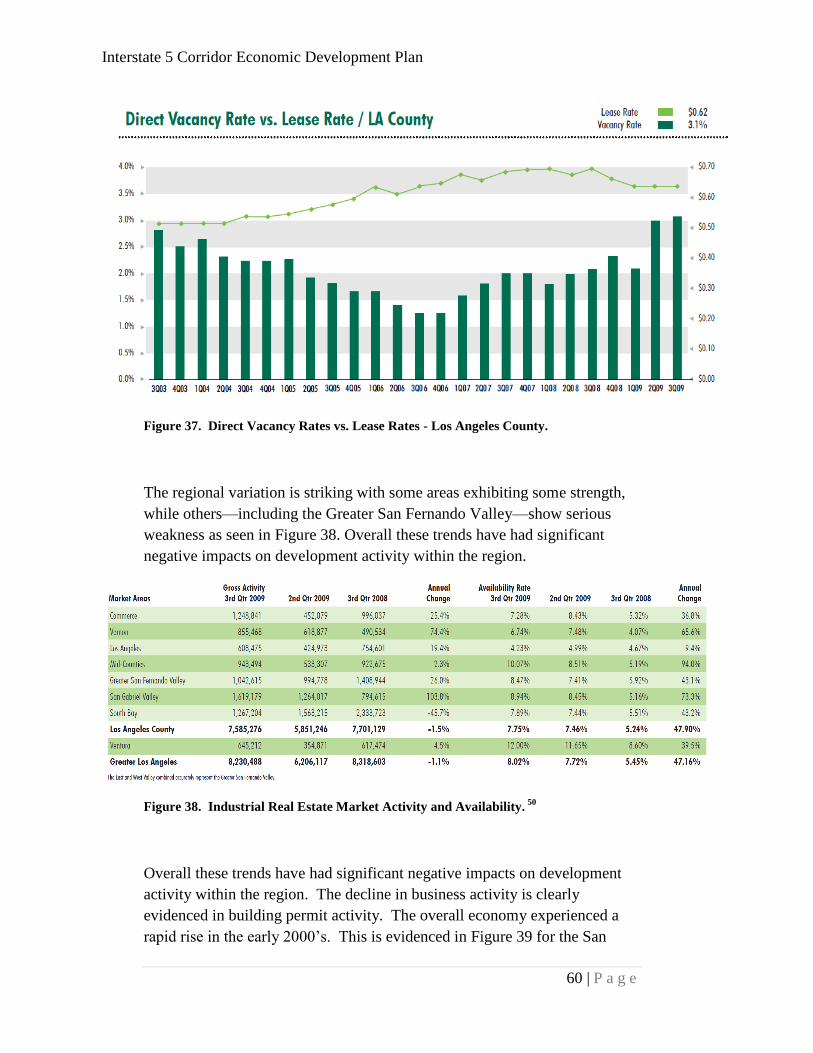
Interstate 5 Corridor Economic Development Plan
60 | P a g e
Figure 37. Direct Vacancy Rates vs. Lease Rates - Los Angeles County.
The regional variation is striking with some areas exhibiting some strength,
while others—including the Greater San Fernando Valley—show serious
weakness as seen in Figure 38. Overall these trends have had significant
negative impacts on development activity within the region.
Figure 38. Industrial Real Estate Market Activity and Availability. 50
Overall these trends have had significant negative impacts on development
activity within the region. The decline in business activity is clearly
evidenced in building permit activity. The overall economy experienced a
rapid rise in the early 2000’s. This is evidenced in Figure 39 for the San

Interstate 5 Corridor Economic Development Plan
61 | P a g e
Fernando Valley by the significant increase in building permits, peaking in
2006. As the economic recession began in 2007, new building permits
dropped off substantially, reflecting a significant decline in overall economic
activity.
Figure 39. New Building Permit Activity for the San Fernando Valley, 2004-2008.51
But it does have its upside. The economy is poised for a slow, but steady
recovery and this provides a excellent opportunity to leverage the area’s
unique resources for economic development.

Interstate 5 Corridor Economic Development Plan
62 | P a g e
APPENDIX 1:
ATTENDEES AT I-5 CORRIDOR ECONOMIC DEVELOPMENT PLAN
STUDY - ROUNDTABLE 1
The Roundtable was held on the afternoon of January 20th
, 2010 at
Woodbury University. In attendance at the Roundtable 1, in alphabetical
order:
Bruce Ackerman
President/CEO, Economic
Alliance
Richard Alarcon
Councilman CD7, City of
Los Angeles
Farah Awan
Administrative Analyst, City
of Santa Clarita
Marcella Ayala
Los Angeles Business Team
Staff, Mayor's Office of
Economic Development
James Bond
President, NE LA Gateway
Chamber
Mike Cusumano
Cusumano Real Estate Group
Paul Deibel
Community Development
Director, City of San
Fernando
Pam Elyea
VP, History For Hire
Laurie Ender
Councilmember, City of
Santa Clarita
Donna Estacio
Director of State Relations,
Office of Mayor Antonio
Villaraigosa
Teresa Fong
Transportation Planning
Manager, Metro - San
Fernando Valley/North
County Area Team
Laura Friedman
Councilmember, City of
Glendale
Dr. Bruce Getzan
Dean, College of the
Canyons
Interstate 5 Corridor Economic Development Plan
63 | P a g e
David Grannis
CEO, Planning Company
Associates
Emiko Isa
Assistant to the President,
The McCarty Company, LLC
Philip Lanzafame
Director of Development
Services, City of Glendale
Philip Law
Corridors Program Manager,
Southern California
Association of Governemnts
Jeff Lebow
Economic Development
Services, Southern California
Edison
Denise Lellan
Administrative Analyst, City
of Santa Clarita
Amy Lemisch
Director, California Film
Commission
Guillaume Lemoine
Husband of Councilmember
Friedman, City of Glendale
Victor Lindenheim,
Executive Director
Golden State Gateway
Coalition
Larry Mankin
President/CEO, Santa Clarita
Valley Chamber of
Commerce
Peter McCarty
Economic Development
Advisor, The McCarty
Company, LLC
Paul Moeller
Verdugo Workforce
Investment Board, Glendale
Steve Novotny
Area Manager, Caltrans
Rick Nordin
VP University Advancement,
Woodbury University
Craig Peters
Executive Vice President, CB
Richard Ellis
Bill Roberts
San Fernando Economic
Research Center, California
State University, Northridge
Bennett Robinson
Executive VP of Brokerage
Services, CB Ricard Ellis
Patrick Rodriguez
Public Information Officer,
US SBA
Ron Ruiz
Public Works Director, City
of San Fernando
Interstate 5 Corridor Economic Development Plan
64 | P a g e
Bob Scott
President/CEO, Mulholland
Institute
Michael Shires
School of Public Policy,
Pepperdine University
Don Sinclair
Woodbury University
Michael Tou
Policy Director, Office of
Congressman Brad Sherman
Interstate 5 Corridor Economic Development Plan
65 | P a g e
APPENDIX 2:
ATTENDEES AT I-5 CORRIDOR ECONOMIC DEVELOPMENT PLAN
STUDY - ROUNDTABLE 2
The Roundtable was held on the afternoon of April 14th
, 2010 at Woodbury
University. In attendance at the Roundtable 1, in alphabetical order:
In attendance at the Roundtable 2, in alphabetical order:
Bruce Ackerman
President/CEO
Economic Alliance
Marisa Alcaraz
Councilman CD7,
City of Los Angeles
Paul Audley
CEO, Film LA
William Barritt
CFO, Aerospace Dynamics
International, Inc.
Jason Crawford
Economic Development, City
of Santa Clarita
Paul Deibel
Community Development
Director,
City of San Fernando
Teresa Fong
Transportation Planning
Manager, Metro - San
Fernando Valley/North
County Area Team
Lauren Gallant
Deputy, Senator Alex Padilla
Dr. Bruce Getzan
Dean,
College of the Canyons
Gilbert Gonzalez
Los Angeles Business Team
Staff, Mayor's Office of
Economic Development
Mary Hamzoian
Economic Development,
City of Burbank
Ken Hitts
Director of Economic
Development Services,
City of Glendale
Bill Kennedy
Wingspan Business
Consulting
Michael Kiaman
Verdugo Workforce
Investment Board, Glendale
Philip Law
Corridors Program Manager,
Southern California
Association of Governments
Kathryn Leibrach
Deputy, Supervisor Michael
Antonovich

Interstate 5 Corridor Economic Development Plan
66 | P a g e
Denise Lellan
Economic Development, City
of Santa Clarita
Victor Lindenheim,
Executive Director
Golden State Gateway
Coalition
Peter McCarty
Economic Development
Advisor, The McCarty
Company, LLC
Tom McCarty
President, The McCarty
Company, LLC
Dr. Manish Singh
President & CEO of
ImmunoCellular
Therapeutics
Tracy Rafter
Los Angeles County
Business Federation
Bill Roberts
San Fernando Economic
Research Center, California
State University, Northridge
Robert Scott
The Mulholland Institute
Michael Shires
Pepperdine University
Laurel Shockley
Southern California Edison
Daniel Skolnick
Planning Deputy,
Council District 6
Trivedi Sunez
Canyons Economic
Development
Karo Torossian
Planning Deputy,
Council District 2
Stuart Waldman
CEO, Valley Industry &
Commerce Association

Interstate 5 Corridor Economic Development Plan
67 | P a g e
APPENDIX 3:
SUMMARY OF KEY REFERENCES
Interstate-5 Community and Economic Development Strategy,
Mulholland Institute
The Interstate-5 Corridor is in an outstanding position for economic
development due to its status as the largest U.S. manufacturing center, its
proximity to numerous educational institutions, technical facilities,
occupational centers, and community colleges, its desirable climate and
lifestyle, its service by local and regional airports and the fifth-largest harbor
complex in the world, and its economic diversity and range of business types
and sizes. In order to capitalize on its investments and advantages, the area
needs a common vision and plan of action in order to reach its potential. The
vision and plan of action must include ways to make the area more attractive
to business and industry, including enhancing the transportation and goods
movement infrastructure, increasing the business-friendliness of the City of
Los Angeles, and creating commercial and industrial sites, as well as housing
to balance jobs, through a coherent land use planning and entitlement
process. Specific recommendations include promoting the assets of the
Corridor, supporting and expanding industry clusters, training the workforce
appropriately to pursue quality jobs synchronized with the needs of the
market, expanding infrastructure, spurring economic development with
public sector support, incentives, and programs, and aligning business,
government, and non-profit sectors in order to achieve economic
development.
Northeast Valley Study, LAEDC and Economic Alliance SFV
The Northeast San Fernando Valley - comprised of Pacoima, Sun Valley, and
Sylmar - is distinguished by an average household income 20 percent higher
than the City of Los Angeles as a whole, by a high degree of employer
satisfaction, and crime rates roughly half those of the City of Los Angeles as
a whole. To become economically vital, the area needs to develop modern
industrial space, develop more and diverse housing, retain high paying
employers, strengthen its efforts to train and educate its residents for the
workforce, and become more enticing to companies with revision of the City
of Los Angeles Gross Receipts Tax. The Northeast San Fernando Valley is
compared to surrounding areas and found to have strengths such as
Interstate 5 Corridor Economic Development Plan
68 | P a g e
geographic location and young labor forces, as well as weaknesses such as
City of Los Angeles Gross Receipts Tax and poor image and appearance.
Specific recommendations are made for retention and expansion of existing
business, business attraction, neighborhood economic development, and
education and workforce training strategies. To retain and expand existing
businesses, recommendations are to provide modern industrial space to
accommodate the expansion potential of key employers; develop a contact
program to identify retention/expansion opportunities; provide direct
technical assistance to companies considering relocation or expansion; assist
local companies to expand their markets to increase revenue and
employment; and increase the use and effectiveness of federal, state, and
local incentives and programs to offset high cost of doing business. To
attract new businesses, recommendations are to promote the study data as
marketing material to manufacturers, developers, and retailers; to identify
large redevelopment sites for a variety of uses; and to facilitate and support
projects. For neighborhood economic development, recommended strategies
are to develop a leadership group composed of the Chambers, Economic
Alliance of the San Fernando Valley and Valley Economic Development
Council Offices to manage the prioritization and implementation of the plan;
identify federal, state, and local programs, grants, financing tools, and
incentives to facilitate improvements, identify industrial, commercial, and
residential sites for development and redevelopment; identify and develop
strategies to overcome the physical barriers and policies limiting desired
development; create development strategies incorporating transit and housing
to maximize land use; support entrepreneurs including women- and minority-
owned and small businesses; and eliminate physical barriers to economic
vitality. To educate and train its residents, recommended strategies are to
expand existing business, education, and workforce training collaboratives to
increase effectiveness; provide better coordination between employer
training needs and workforce program providers; facilitate the flow of
information from workforce programs to employers; support and establish
neighborhood programs to improve K-12 performance and graduation rates;
and support the creation of more adult opportunities.
Prosperity Tomorrow, Mulholland Institute
For the Valley to have a future as a region of opportunity, the public sector
needs to address issues of governance and concerns about quality of life. In
partnership with the private sector, it is critical that the public sector correct
the severe transportation, housing, school and other key infrastructure
shortcomings which are stymieing the region. To secure its long-term
economic future, the Valley must focus on achieving three goals. First, the
Valley must build an economic development consensus that includes
business, government, and non-profit sectors in order to reduce unnecessary
barriers to high end economic development and growth. Second, the quality
Interstate 5 Corridor Economic Development Plan
69 | P a g e
of life must be improved so that high-skilled residents and businesses are
attracted to and stay in the area. Third, new capacity for growth must be
created for physically growing companies and preparing the workforce to
enter 21st-Century companies.
Our Future Neighborhoods, Mulholland Institute
As of the writing of the report in July 2003, the steep rise in housing values
had made home ownership cost-prohibitive for many families, with resulting
issues of overcrowding and deteriorating quality of life. Residents and
businesses have expressed concerns about overdevelopment, deteriorating
neighborhoods, declining public schools, increasing crime, loss of quality of
life, ethnic change, overtaxed infrastructure, and air and water pollution.
Yet, the Valley has an advantageous geographical location, a strong
economic base, a diverse population, and an egalitarian character that keep it
attractive. Thus, the area still experiences population growth, ahead of the
growth of employment and housing capacity. Population density across the
entire region increased from 4,200 people per square mile in 1970 to 5,900
people per square mile in 2000 (varying drastically among communities).
One component of the density increase was the growth in household size,
especially in the northeastern Valley. Despite the need for additional
housing, especially affordable housing, there is little vacant land to
accommodate it, resulting in a shortfall. Another consequence of population
exceeding capacity is traffic congestion. To combat the issues of high-priced
housing, overcrowded conditions, and growth restrictions, the report
recommends fostering communities such as urban villages which combine
retail and commercial uses with higher density housing and provide a sense
of place and community identity.
Compass Growth Vision, Blueprint 2% Strategy, SCAG
The 2% Strategy proposes increasing the region's mobility by:
Encouraging transportation investments and land use decisions that
are mutually supportive
Locating new housing near existing jobs and new jobs near existing
housing
Encouraging transit-oriented development
Promoting a variety of travel choices
The livability of our communities can be enhanced by:
Promoting in-fill development and redevelopment to revitalize
existing communities
Promoting developments which provide a mix of uses
Interstate 5 Corridor Economic Development Plan
70 | P a g e
Promoting "people-scaled," walkable‖ communities
Supporting the preservation of stable neighborhoods
Our prosperity will be enabled by:
Providing a variety of housing types in each community to meet the
housing needs of all income levels
Supporting educational opportunities that promote balanced growth
Ensuring environmental justice regardless of race, ethnicity or income
class
Supporting local and state fiscal policies that encourage balanced
growth
Encouraging civic engagement
We can promote sustainability for future generations by:
Developing strategies to accommodate growth that use resources
efficiently, and minimize pollution and greenhouse gas emissions
Preserving rural, agricultural, recreational and environmentally
sensitive areas
Focusing development in urban centers and existing cities
Using "green" development techniques
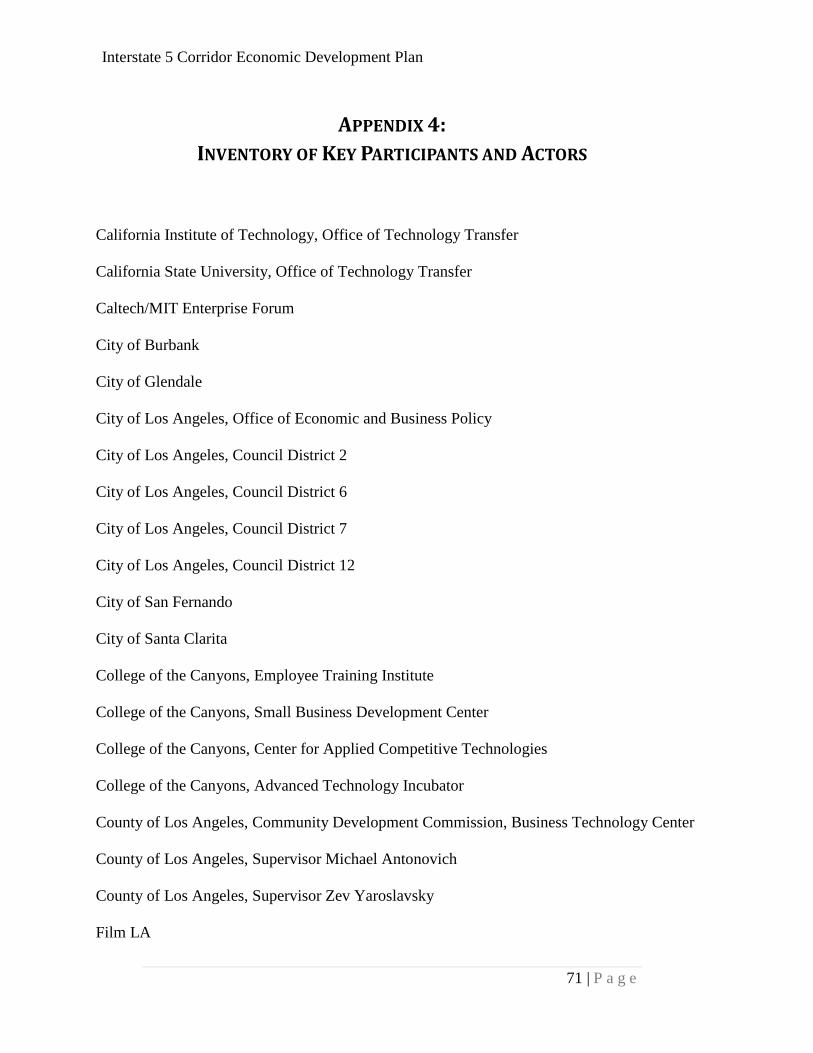
Interstate 5 Corridor Economic Development Plan
71 | P a g e
APPENDIX 4:
INVENTORY OF KEY PARTICIPANTS AND ACTORS
California Institute of Technology, Office of Technology Transfer
California State University, Office of Technology Transfer
Caltech/MIT Enterprise Forum
City of Burbank
City of Glendale
City of Los Angeles, Office of Economic and Business Policy
City of Los Angeles, Council District 2
City of Los Angeles, Council District 6
City of Los Angeles, Council District 7
City of Los Angeles, Council District 12
City of San Fernando
City of Santa Clarita
College of the Canyons, Employee Training Institute
College of the Canyons, Small Business Development Center
College of the Canyons, Center for Applied Competitive Technologies
College of the Canyons, Advanced Technology Incubator
County of Los Angeles, Community Development Commission, Business Technology Center
County of Los Angeles, Supervisor Michael Antonovich
County of Los Angeles, Supervisor Zev Yaroslavsky
Film LA

Interstate 5 Corridor Economic Development Plan
72 | P a g e
Golden State Gateway Coalition
International Brotherhood of Teamsters Local 399
Los Angeles County Business Federation
Los Angeles Economic Development Corporation
The Mulholland Institute
Northridge East Neighborhood Council
Northridge Vision
Port of Los Angeles
San Fernando Valley Green Team
Santa Clarita Valley Chamber of Commerce
Southern California Association of Governments
Southern California Biomedical Council
State of California, Economic Development Department
State of California, 38th Assembly District
State of California, 39th Assembly District
State of California, 43rd Assembly District
U.S. Congressman Brad Sherman
Valley Economic Alliance
Valley Industry Commerce Association
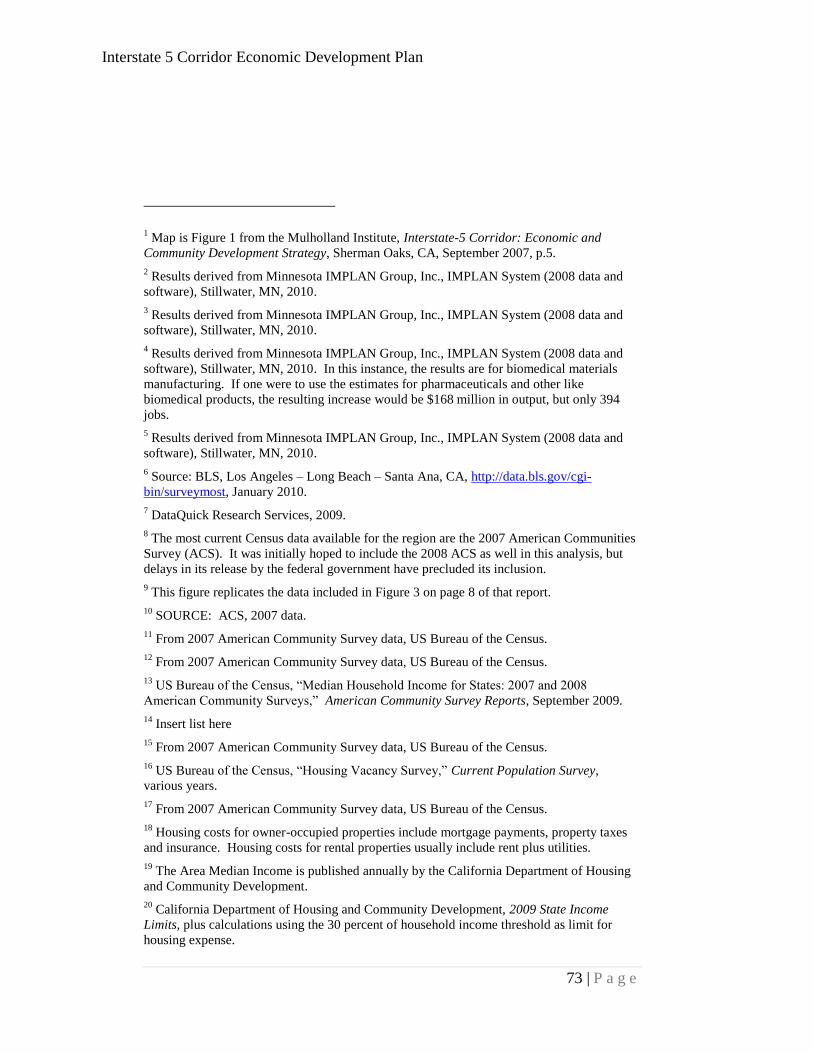
Interstate 5 Corridor Economic Development Plan
73 | P a g e
1 Map is Figure 1 from the Mulholland Institute, Interstate-5 Corridor: Economic and
Community Development Strategy, Sherman Oaks, CA, September 2007, p.5.
2 Results derived from Minnesota IMPLAN Group, Inc., IMPLAN System (2008 data and
software), Stillwater, MN, 2010.
3 Results derived from Minnesota IMPLAN Group, Inc., IMPLAN System (2008 data and
software), Stillwater, MN, 2010.
4 Results derived from Minnesota IMPLAN Group, Inc., IMPLAN System (2008 data and
software), Stillwater, MN, 2010. In this instance, the results are for biomedical materials
manufacturing. If one were to use the estimates for pharmaceuticals and other like
biomedical products, the resulting increase would be $168 million in output, but only 394
jobs.
5 Results derived from Minnesota IMPLAN Group, Inc., IMPLAN System (2008 data and
software), Stillwater, MN, 2010.
6 Source: BLS, Los Angeles – Long Beach – Santa Ana, CA, http://data.bls.gov/cgi-
bin/surveymost, January 2010. 7 DataQuick Research Services, 2009.
8 The most current Census data available for the region are the 2007 American Communities
Survey (ACS). It was initially hoped to include the 2008 ACS as well in this analysis, but
delays in its release by the federal government have precluded its inclusion.
9 This figure replicates the data included in Figure 3 on page 8 of that report.
10 SOURCE: ACS, 2007 data.
11 From 2007 American Community Survey data, US Bureau of the Census.
12 From 2007 American Community Survey data, US Bureau of the Census.
13 US Bureau of the Census, ―Median Household Income for States: 2007 and 2008
American Community Surveys,‖ American Community Survey Reports, September 2009.
14 Insert list here
15 From 2007 American Community Survey data, US Bureau of the Census.
16 US Bureau of the Census, ―Housing Vacancy Survey,‖ Current Population Survey,
various years.
17 From 2007 American Community Survey data, US Bureau of the Census.
18 Housing costs for owner-occupied properties include mortgage payments, property taxes
and insurance. Housing costs for rental properties usually include rent plus utilities.
19 The Area Median Income is published annually by the California Department of Housing
and Community Development.
20 California Department of Housing and Community Development, 2009 State Income
Limits, plus calculations using the 30 percent of household income threshold as limit for
housing expense.

Interstate 5 Corridor Economic Development Plan
74 | P a g e
21 National Association of Home Builders data, 2009.
22 These figures were compiled using the on-line search engine for the Southern California
Multiple Listing Service using the income boundaries for each tier to search for single family
residences in each. Results were tallied by Zip Code as specified in the study lists and then
aggregated to the community level. Data were accessed on January 13, 2009 at
http://www.socalmls.com/.
23 This includes the City of San Fernando as well—it is not possible to fully separate it in the
American Community Survey data for 2007.
24 Source: DataQuick Information Systems, 2009..
25 Rental data from realfacts.com, courtesy of the San Fernando Valley Economic Research
Center, 2009.
26 In the context of this limited analysis, a detailed assessment of the full extent of the
workforce housing stock was not possible. The project team recommends that SCAG
undertake a complete study modeled along the lines of that funded for the Westside Council
of Governments. Since our purposes here are to provide a context for the broader creation of
an economic development plan for the Interstate-5 Corridor region, we have chosen to focus
on the specific issues that should frame our dialogue with respect to workforce housing.
27 There are a handful of possible operational definitions, usually provided in the context of a
specific plan for a unique development area. One example of a Specific Plan providing
standards for executive housing introduces the following three specifications: development
with lots of 10,000 square feet or greater; development adjacent to a golf course; and
developments adjacent to a large open space, lake, park, or Village Green (Ontario Sphere of
Influence Specific Plan Policy Matrix).
28 These figures were compiled using the on-line search engine for the Southern California
Multiple Listing Service using the income boundaries for each tier to search for single family
residences in each. Results were tallied by Zip Code as specified in the study lists and then
aggregated to the community level. Data were accessed on January 13, 2009 at
http://www.socalmls.com/. Executive criteria included price in excess of $641,700
(affordable at 250% of AMI), more than 4 bedrooms and more than 3,000 square feet.
29 Housing unit data are from the American Communities Survey, 2007. Jobs data represent
all jobs designation are from the U.S. Bureau of the Census, Longitudinal Employer-
Household Dynamics (LEHD) data set using OnTheMapVersion 4 to derive the data points.
Employed residents are derived from the LEHD as well the Home/Residential Area
definition to identify primary jobs. Note that although the LEHD contains 2008 data, these
were computed using 2007 data because the ACS for 2008 is not yet available with the
necessary detail.
30 Results compiled from the Bureau of the Census LEHD using 2007 data.
31 American Community Survey, 2007.
32 American Community Survey, 2007.
33 Metropolitan Transit Authority, Congestion Management Program for Los Angeles
County, Adopted July 22, 2004, Figure 2-6, p. 24. Level of Service (LOS) levels are
denoted as A: 0 0.– 0.6 Volume to Capacity ratio, B: 0.6 - 0.7, C: 0.7 – 0.8, D: 0.8 - 0.9, E:
0.9 – 1.0 and F: > 1.0. In this figure, Significant branches of the region are shown at 90
percent or above utilization during peak hours.
34 Ibid, 2003 CMP Freeway Monitoring Stations and Levels of Service, Appendix A, p. A-
23.
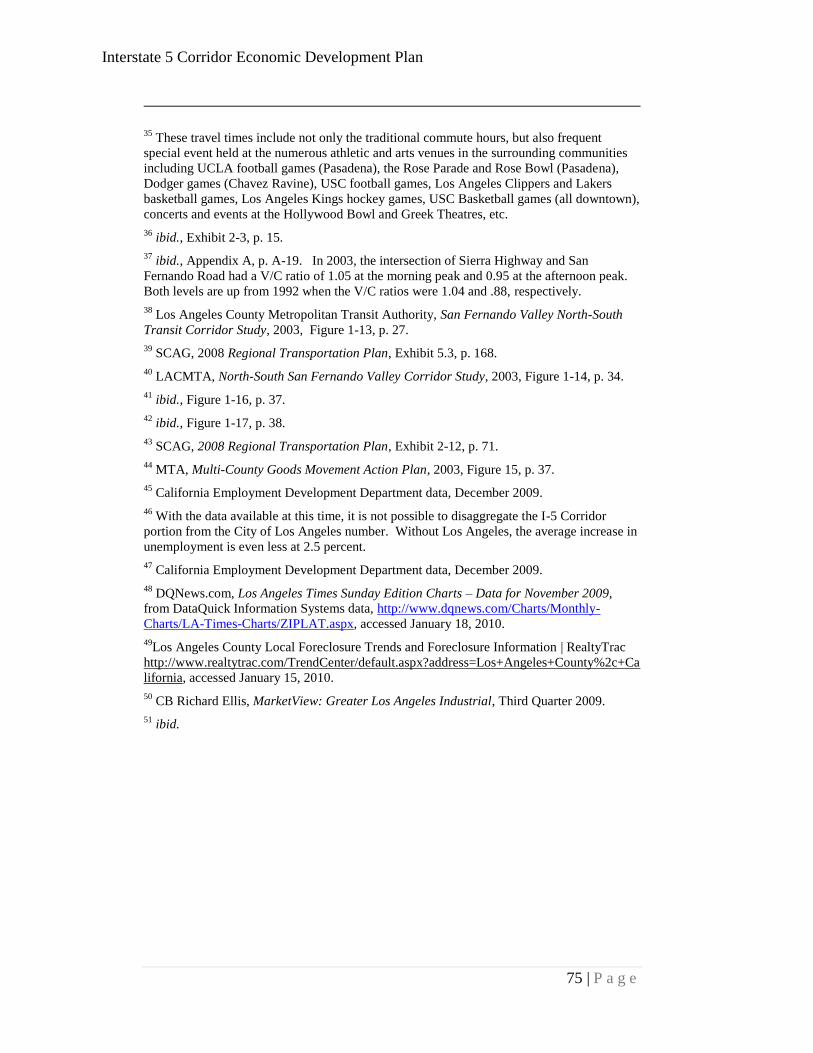
Interstate 5 Corridor Economic Development Plan
75 | P a g e
35 These travel times include not only the traditional commute hours, but also frequent
special event held at the numerous athletic and arts venues in the surrounding communities
including UCLA football games (Pasadena), the Rose Parade and Rose Bowl (Pasadena),
Dodger games (Chavez Ravine), USC football games, Los Angeles Clippers and Lakers
basketball games, Los Angeles Kings hockey games, USC Basketball games (all downtown),
concerts and events at the Hollywood Bowl and Greek Theatres, etc.
36 ibid., Exhibit 2-3, p. 15.
37 ibid., Appendix A, p. A-19. In 2003, the intersection of Sierra Highway and San
Fernando Road had a V/C ratio of 1.05 at the morning peak and 0.95 at the afternoon peak.
Both levels are up from 1992 when the V/C ratios were 1.04 and .88, respectively.
38 Los Angeles County Metropolitan Transit Authority, San Fernando Valley North-South
Transit Corridor Study, 2003, Figure 1-13, p. 27.
39 SCAG, 2008 Regional Transportation Plan, Exhibit 5.3, p. 168.
40 LACMTA, North-South San Fernando Valley Corridor Study, 2003, Figure 1-14, p. 34.
41 ibid., Figure 1-16, p. 37.
42 ibid., Figure 1-17, p. 38.
43 SCAG, 2008 Regional Transportation Plan, Exhibit 2-12, p. 71.
44 MTA, Multi-County Goods Movement Action Plan, 2003, Figure 15, p. 37.
45 California Employment Development Department data, December 2009.
46 With the data available at this time, it is not possible to disaggregate the I-5 Corridor
portion from the City of Los Angeles number. Without Los Angeles, the average increase in
unemployment is even less at 2.5 percent.
47 California Employment Development Department data, December 2009.
48 DQNews.com, Los Angeles Times Sunday Edition Charts – Data for November 2009,
from DataQuick Information Systems data, http://www.dqnews.com/Charts/Monthly-
Charts/LA-Times-Charts/ZIPLAT.aspx, accessed January 18, 2010.
49Los Angeles County Local Foreclosure Trends and Foreclosure Information | RealtyTrac
http://www.realtytrac.com/TrendCenter/default.aspx?address=Los+Angeles+County%2c+Ca
lifornia, accessed January 15, 2010.
50 CB Richard Ellis, MarketView: Greater Los Angeles Industrial, Third Quarter 2009.
51 ibid.