Embed Size (px)
Citation preview
8/4/2019 Intership Project Report (2)
http://slidepdf.com/reader/full/intership-project-report-2 1/44
PROJECT
REPORT ON RECIEVABLESMANAGMET OF
SAINT GOBAINLTD
SUBMITTED BY:
SAURABH TYAGI
C-23
SUBMITTED TO:
MR GAURAV
SHREEKANT
8/4/2019 Intership Project Report (2)
http://slidepdf.com/reader/full/intership-project-report-2 2/44
ACKNOWLEDGEMENT
Apart from the efforts of me, the completion of this project depends largely on
the encouragement and guidelines of many others. I take this opportunity to
express my gratitude to the people who have been instrumental in the successful
completion of this project.
I would like to show my greatest appreciation to MR MITHLESH PANDEY
and MR GAURAV SHREEKANT. I say thank you for his tremendous supportand help. I feel motivated and encouraged .
8/4/2019 Intership Project Report (2)
http://slidepdf.com/reader/full/intership-project-report-2 3/44
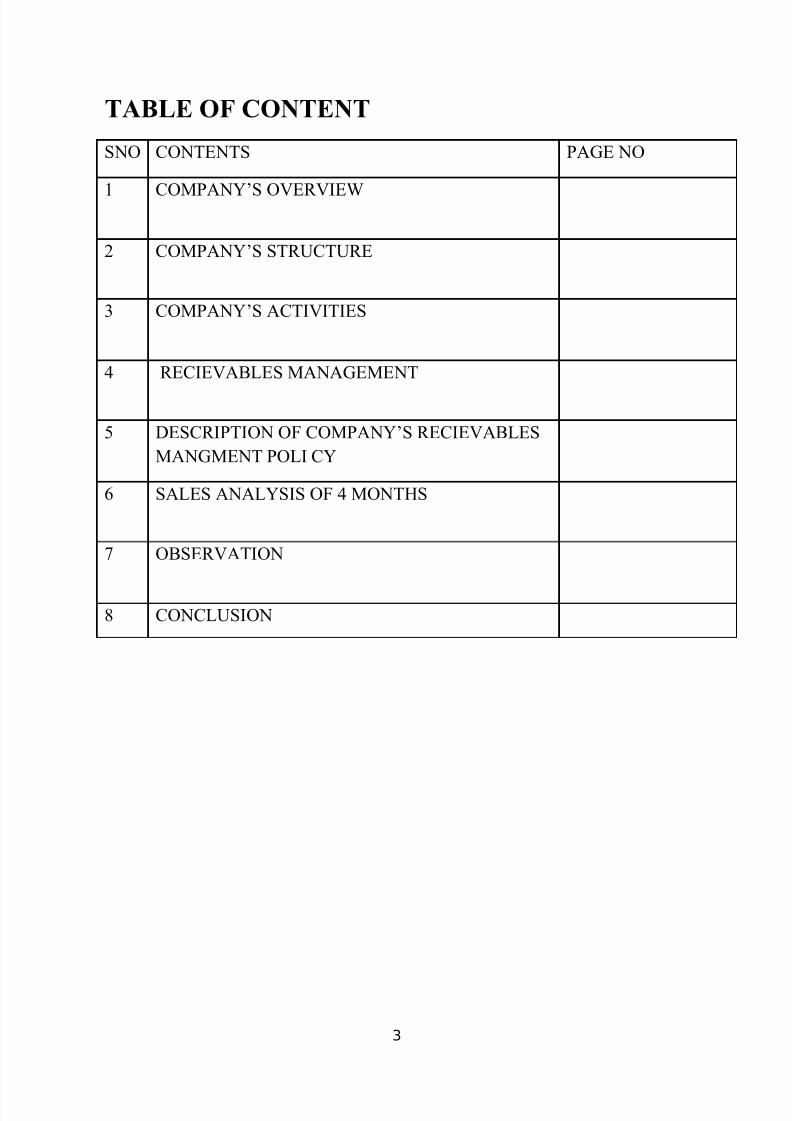
TABLE OF CONTENT
SNO CONTENTS PAGE NO
1 COMPANY’S OVERVIEW
2 COMPANY’S STRUCTURE
3 COMPANY’S ACTIVITIES
4 RECIEVABLES MANAGEMENT
5 DESCRIPTION OF COMPANY’S RECIEVABLES
MANGMENT POLI CY
6 SALES ANALYSIS OF 4 MONTHS
7 OBSERVATION
8 CONCLUSION
8/4/2019 Intership Project Report (2)
http://slidepdf.com/reader/full/intership-project-report-2 4/44
ABSTRACT
SAINT GOBAIN GLASS LTD appointed interns to understand the
receivables position of their company. I was asked to analyze the data of the
past six months starting from October’10 to March’11. I had to analyze the
debtors’ payment pattern for that period and find out the reasons why there was
a delay in receiving payments from the debtors’
OBJECTIVE OF THE STUDY:
• Compare Actual Date of Receipt from customers with the Payment Due
Date.
• Find out the number of days delay in receiving the payment.
• Compute the interest cost @12% for the number of days delayed.
• Find out the reason for delay in case of each invoice.
• Analyze the reasons.
• Find out the impact of each reason.
8/4/2019 Intership Project Report (2)
http://slidepdf.com/reader/full/intership-project-report-2 5/44
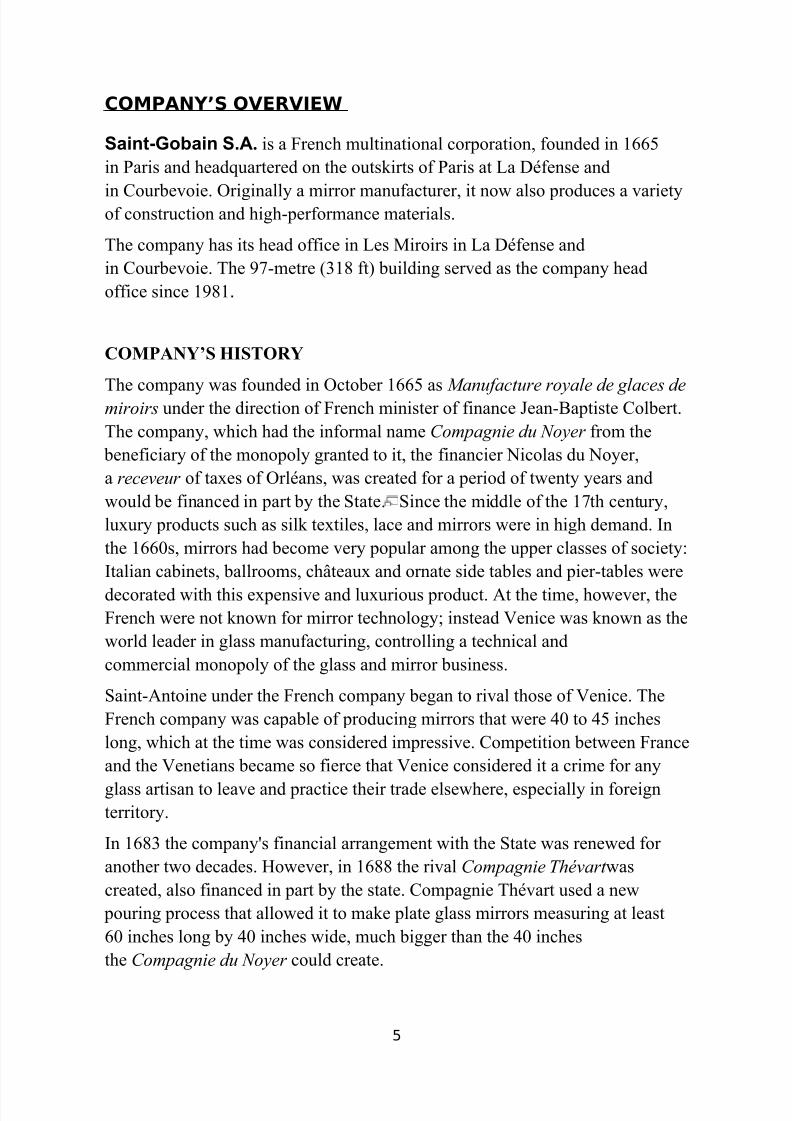
COMPANY’S OVERVIEW
Saint-Gobain S.A. is a French multinational corporation, founded in 1665
in Paris and headquartered on the outskirts of Paris at La Défense and
in Courbevoie. Originally a mirror manufacturer, it now also produces a varietyof construction and high-performance materials.
The company has its head office in Les Miroirs in La Défense and
in Courbevoie. The 97-metre (318 ft) building served as the company head
office since 1981.
COMPANY’S HISTORY
The company was founded in October 1665 as Manufacture royale de glaces demiroirs under the direction of French minister of finance Jean-Baptiste Colbert.
The company, which had the informal name Compagnie du Noyer from the
beneficiary of the monopoly granted to it, the financier Nicolas du Noyer,
a receveur of taxes of Orléans, was created for a period of twenty years and
would be financed in part by the State. Since the middle of the 17th century,
luxury products such as silk textiles, lace and mirrors were in high demand. In
the 1660s, mirrors had become very popular among the upper classes of society:
Italian cabinets, ballrooms, châteaux and ornate side tables and pier-tables weredecorated with this expensive and luxurious product. At the time, however, the
French were not known for mirror technology; instead Venice was known as the
world leader in glass manufacturing, controlling a technical and
commercial monopoly of the glass and mirror business.
Saint-Antoine under the French company began to rival those of Venice. The
French company was capable of producing mirrors that were 40 to 45 inches
long, which at the time was considered impressive. Competition between France
and the Venetians became so fierce that Venice considered it a crime for anyglass artisan to leave and practice their trade elsewhere, especially in foreign
territory.
In 1683 the company's financial arrangement with the State was renewed for
another two decades. However, in 1688 the rival Compagnie Thévart was
created, also financed in part by the state. Compagnie Thévart used a new
pouring process that allowed it to make plate glass mirrors measuring at least
60 inches long by 40 inches wide, much bigger than the 40 inches
the Compagnie du Noyer could create.
8/4/2019 Intership Project Report (2)
http://slidepdf.com/reader/full/intership-project-report-2 6/44
For seven years, the two companies were in competition until, in 1695, the
economy slowed down and their technical and commercial rivalry became
counterproductive. Under an order from the French government the two
companies were forced to merge together, creating the Compagnie Plastier .
In 1702 Compagnie Plastier declared bankruptcy. A group of Franco-
Swiss Protestant bankers rescued of the collapsing company changing the name
to Compagnie Dagincourt . At the same time the company was provided royal
patents which allowed it to maintain a legal monopoly in the glass
manufacturing industry up until the French Revolution.
1789-1910: Industrial Revolution
In 1789, as a consequence of the French Revolution, the state financial and
competitive privileges accorded to Compagnie Dagincourt were abolished. The
company now had to depend on the participation and capital of private
investors, although it continued to remain partly under the control of the French
state.
In the 1820s, Saint-Gobain continued to function as it had under the Ancient
Regime, manufacturing high quality mirrors and glass for the luxury market.
However, in 1824, a new glass manufacturer was established in Commentary,
France and in 1837 several Belgian glass manufacturers were also founded.
While Saint-Gobain continued to dominate the luxury, high quality mirror and
glass markets, its newly created competitors focused their attention on making
medium and low quality products. By manufacturing products of such quality,
mirrors and glass became affordable for the masses. In response the company
extended its product line to include lower quality glass and mirrors.
In 1830, just as Louis-Philippe became King of the newly restored French
Monarchy, Saint-Gobain was transformed into a Public Limited Company and
became independent from the state for the first time.
While mirrors remained their primary business, Saint-Gobain began to diversify
their product line; glass panes for skylight, roofs and room dividers, thick
mirrors, semi-thick glass for windows, laminated mirrors and glass, and finally
embossed mirrors and window panes. Some of the more famous buildings that
Saint-Gobain contributed to during that period were the Crystal Palace in
London, le Jar din des Plantes, les Grand et Petit Palais and les Halles in Paris,
the Milan railway station and buildings in Philadelphia, Sydney and New York.
8/4/2019 Intership Project Report (2)
http://slidepdf.com/reader/full/intership-project-report-2 7/44
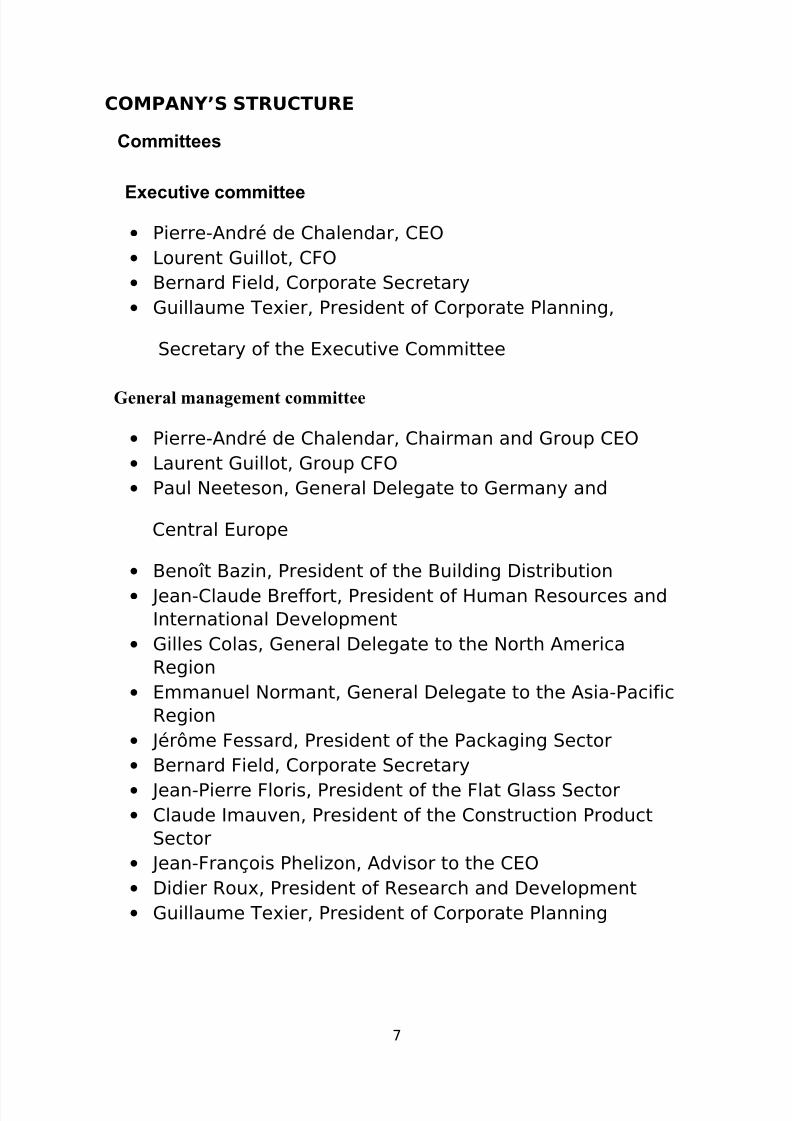
COMPANY’S STRUCTURE
Committees
Executive committee
• Pierre-André de Chalendar, CEO
• Lourent Guillot, CFO
• Bernard Field, Corporate Secretary
• Guillaume Texier, President of Corporate Planning,
Secretary of the Executive Committee
General management committee
• Pierre-André de Chalendar, Chairman and Group CEO
• Laurent Guillot, Group CFO
• Paul Neeteson, General Delegate to Germany and
Central Europe
•
Benoît Bazin, President of the Building Distribution• Jean-Claude Breffort, President of Human Resources and
International Development
• Gilles Colas, General Delegate to the North America
Region
• Emmanuel Normant, General Delegate to the Asia-Pacific
Region
• Jérôme Fessard, President of the Packaging Sector
•
Bernard Field, Corporate Secretary• Jean-Pierre Floris, President of the Flat Glass Sector
• Claude Imauven, President of the Construction Product
Sector
• Jean-François Phelizon, Advisor to the CEO
• Didier Roux, President of Research and Development
• Guillaume Texier, President of Corporate Planning

8/4/2019 Intership Project Report (2)
http://slidepdf.com/reader/full/intership-project-report-2 8/44
Saint-Gobain's activities.
Focusing on the habitat and construction markets has make it possible to
implement major growth synergies within a more integrated Group, thereby
optimising operational performance via cost savings.
Construction Products include the Insulation, Gypsum, Exterior Products,
Pipework and Industrial Mortars activities. Their complementary nature allows
the Group to meet the needs of every field of activity in both the new
construction and renovation sectors.Innovative materials cover Flat Glass (flat glass manufacture, transformation
and distribution of glass for the building industry, automotive glazing andspecialities). These also include High-Performance Materials taking in the
Ceramics & Plastics, Abrasives and Textile Solutions activities with
developments in the fields of housing, energy and the environment.
Building Distribution, which grew out of the two subsidiaries POINT.P and
Lapeyre acquired in 1996, is Europe's leading building materials distributor and
the N°1 distributor for tiles in the world.
Packaging, the world’s second-ranking producer of glass containers, makes
bottles and jars for foodstuffs and beverages.
INNOVATIVE MATERIALS
With more than 60,000 employees in 45 countries, the Innovative Materials
Sector has access to a unique portfolio of materials and processes for the
homebuilding and industrial markets
Leveraging innovation as a powerful growth driver, the Innovative Materials
Sector is spearheading Saint-Gobain's advance in over-the-horizon technologies.
In the area of High-Performance Materials, it offers a broad array of innovative
technologies in three main types of materials: ceramics, performance polymersand glass fabrics.
The Flat Glass division produces a range of highly effective products in terms
of energy-saving, environmental protection, safety, comfort and aesthetics.
Innovative Materials Sector eight core businesses:
- Abrasives
- Ceramic materials
- Plastics

8/4/2019 Intership Project Report (2)
http://slidepdf.com/reader/full/intership-project-report-2 9/44
- Textile solutions
- Flat glass manufacturing
- Processing of glass for the building industry and domestic appliances
- Processing of glass for the automotive and mass transit markets
- Solar energy solutionsThe Innovative Materials Sector is European or world leader in each of its nine
activities nine core businesses.
Key facts and figures
- More than 65% of the Group's R&D budget
- More than 60,000 staff in 45 countries
- Saint-Gobain equips 1 residential property out of 3 with
insulating glazing in Europe.- Saint-Gobain supplies the glazing for 1 car out of 2 in
Europe
Construction Products
The Construction Products Sector provides solutions adapted to every type
of requirement: acoustic and thermal insulation, exterior wall covering,roofing, interior and exterior fittings and piping.
Construction Products Sector activities:
- Gypsum: plasterboard and lightweight construction systems, gypsum plasters
including formulated plasters for building and industrial applications, ceiling
systems including insulating and acoustic solutions and other products for
interior fittings.
- Insulation: glass wool, rock wool and insulating foams.
- Exterior Products: asphalt shingle tiles for roofing, PVC clapboard, fibre
8/4/2019 Intership Project Report (2)
http://slidepdf.com/reader/full/intership-project-report-2 10/44
cement sidings, barriers, balustrades and terrace materials.
- Industrial Mortars: external wall rendering, floor-tiling products, technical
mortars and insulation systems adapted to each type of building works.
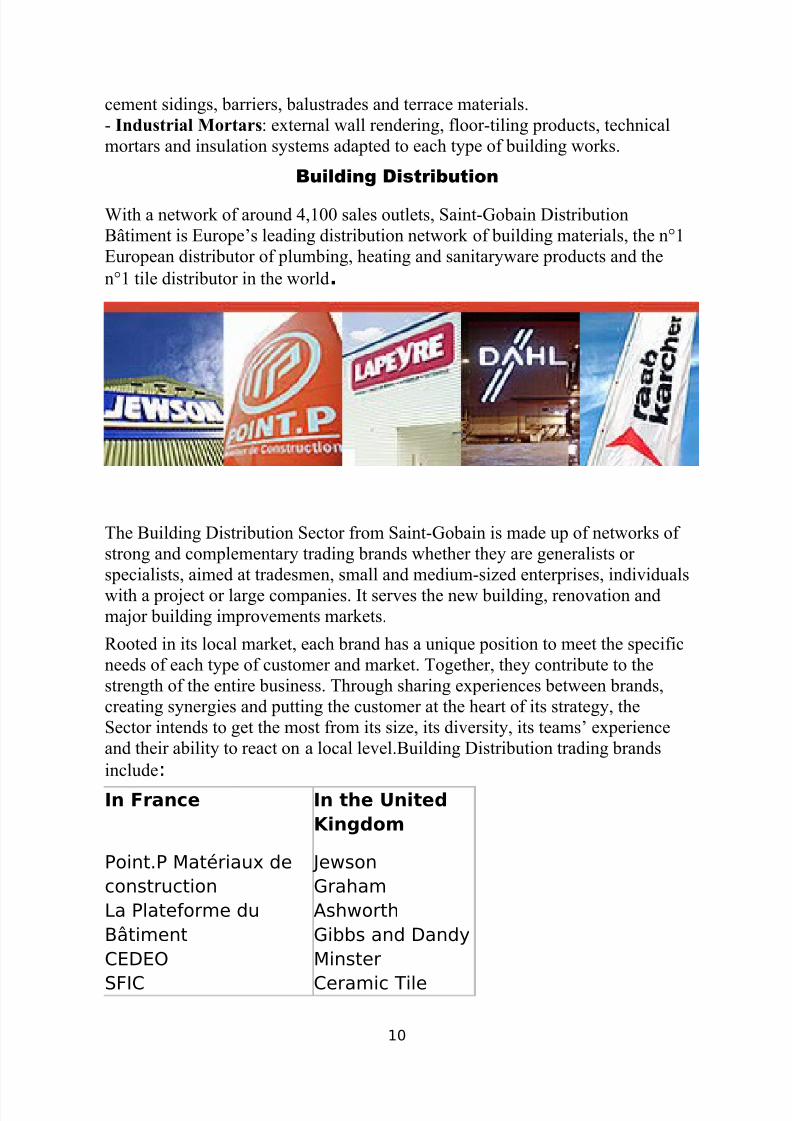
Building Distribution
With a network of around 4,100 sales outlets, Saint-Gobain Distribution
Bâtiment is Europe’s leading distribution network of building materials, the n°1
European distributor of plumbing, heating and sanitaryware products and the
n°1 tile distributor in the world.
The Building Distribution Sector from Saint-Gobain is made up of networks of
strong and complementary trading brands whether they are generalists or
specialists, aimed at tradesmen, small and medium-sized enterprises, individualswith a project or large companies. It serves the new building, renovation and
major building improvements markets.
Rooted in its local market, each brand has a unique position to meet the specific
needs of each type of customer and market. Together, they contribute to the
strength of the entire business. Through sharing experiences between brands,
creating synergies and putting the customer at the heart of its strategy, the
Sector intends to get the most from its size, its diversity, its teams’ experience
and their ability to react on a local level.Building Distribution trading brands
include:
In France In the United
Kingdom
Point.P Matériaux de
construction
La Plateforme du
Bâtiment
CEDEOSFIC
Jewson
Graham
Ashworth
Gibbs and Dandy
MinsterCeramic Tile

8/4/2019 Intership Project Report (2)
http://slidepdf.com/reader/full/intership-project-report-2 11/44
Asturienne
PUM Plastiques
Point.P Travaux
Publics
Dispano
Lapeyre
K par K
Distributors
International
Decorative
International
Timber
Ideal Bathrooms
Greenworks
In Germany In the Nordics
Raab Karcher
Plattform Handwerker-
FachmarktBalzer Group
Gallhöfer
Oskar Huber
Isobau
Dämmisol
Muffenrohr
Dahl
Optimera
Monter
8/4/2019 Intership Project Report (2)
http://slidepdf.com/reader/full/intership-project-report-2 12/44
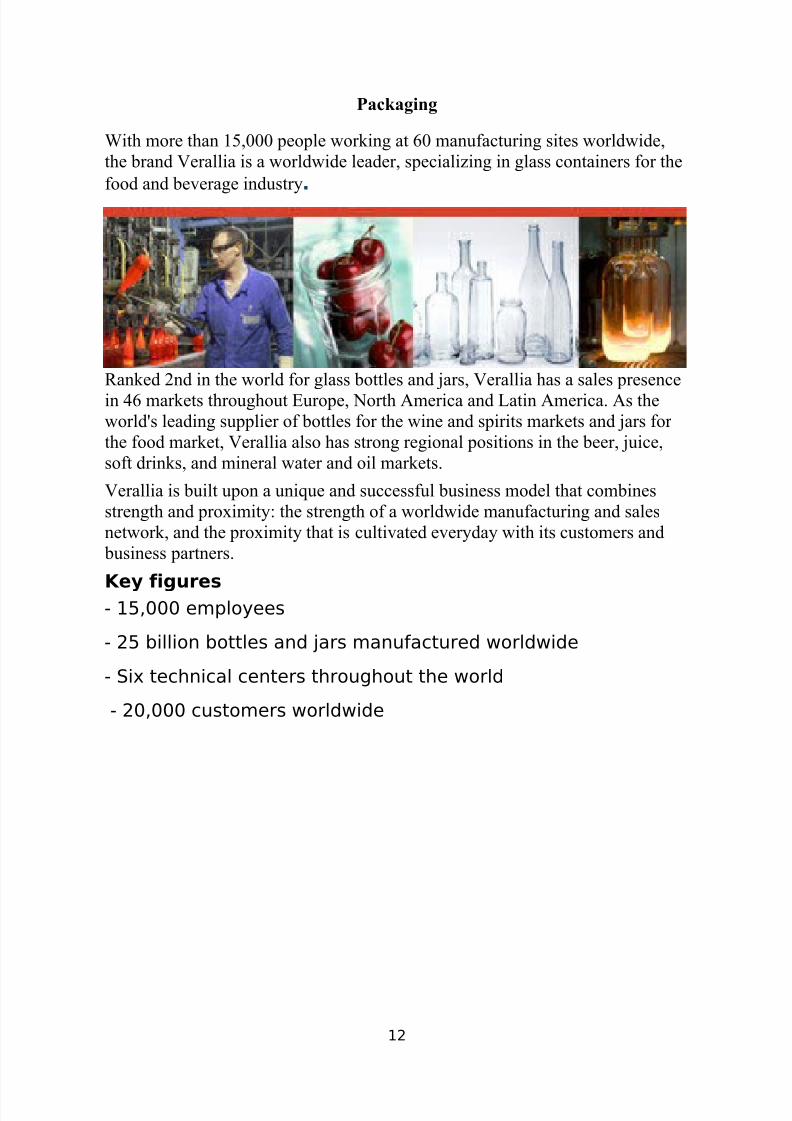
Packaging
With more than 15,000 people working at 60 manufacturing sites worldwide,
the brand Verallia is a worldwide leader, specializing in glass containers for the
food and beverage industry.
Ranked 2nd in the world for glass bottles and jars, Verallia has a sales presencein 46 markets throughout Europe, North America and Latin America. As the
world's leading supplier of bottles for the wine and spirits markets and jars for
the food market, Verallia also has strong regional positions in the beer, juice,
soft drinks, and mineral water and oil markets.
Verallia is built upon a unique and successful business model that combines
strength and proximity: the strength of a worldwide manufacturing and sales
network, and the proximity that is cultivated everyday with its customers and
business partners.
Key figures
- 15,000 employees
- 25 billion bottles and jars manufactured worldwide
- Six technical centers throughout the world
- 20,000 customers worldwide

8/4/2019 Intership Project Report (2)
http://slidepdf.com/reader/full/intership-project-report-2 13/44
Finance
The Combined Ordinary and Extraordinary Shareholders' Meeting of
Compagnie de Saint-Gobain’s were held on Thursday, June 9, 2011, in Paris.
Stock price
SGO: 42.475 € +1.24%
CAC40: 3,842.70 +0.68%
Paris, Jul. 22, 2011at 17:35:00

8/4/2019 Intership Project Report (2)
http://slidepdf.com/reader/full/intership-project-report-2 14/44
Stock information
Paris stock exchange
Code ISIN: FR0000125007
Latest quote at Paris stock exchange
Session on Jul. 22, 2011 Saint-Gobain CAC 40
Price at 17:35:00 42.475 3,842.70
Previous close 41.955 3,816.75
Change +1.24% +0.68%
Opening price 42.620 3,855.43
Day high 43.010 3,866.34
Day low 42.110 3,817.61
Weighted average session
price
42.666
Volume - Traded equity 1,781,143
shares
€3,245 M
Benchmarks
Year high 28/04/2011
47.640
16/02/2011
4,169.87
Year low 10/01/2011
37.470
18/07/2011
3,645.79
Price on Dec. 31, 2010 38.500 3,804.78
Change since Dec. 31, 2010 10.32% 1.00%
RECEIVABLES MANAGEMENT
8/4/2019 Intership Project Report (2)
http://slidepdf.com/reader/full/intership-project-report-2 15/44
A Receivable is the money owed to a company by a consumer for products and
services purchased on credit. This is usually treated as a current asset of
accounts receivable after the customer is sent an invoice. Accounts receivable
are known by various names, such as accounts receivable aging, days
receivable, accounts receivable turnover and invoice factoring.
Accounts receivable are reported on the balance sheet of the seller at net realizable value, which is the net amount the seller expects to collect.
According to the experts, receivable or invoice factoring is one of a series of
accounting transactions. These accounting transactions deal with the billing of
customers who owe money to a person, company or organization for goods and
services purchased.
With businesses looking for improved bottom line performance, better
receivables management, collections is a key focus area along with timely and
accurate billing for organizations across industries.
It can be argued that revenue generation is the most critical function of a
company. Every company expends substantial resources to generate increasing
levels of revenue. However the revenue must be converted into cash. Cash is the
lifeblood of any company. Every rupee of a company’s revenue becomes a
receivable that must be managed and collected in time. Therefore the staff and processes that manage your receivables are asset to a company.
Benefits of effectively managing the Receivables are:
Increased Cash Flow
Higher Credit Sales and Margin
Reduced Bad Debts Loss
Lower Administrative cost in the entire revenue cycle
Decreased deduction and concession losses
Reduced Interest Loss
CREDIT POLICY
8/4/2019 Intership Project Report (2)
http://slidepdf.com/reader/full/intership-project-report-2 16/44
When a sale takes place they are generally on credit basis i.e. the customer is
given certain period of time to pay back the seller. Each company has its own
way of providing credit to its customers. This is called as the CREDIT
POLICY of the company. The credit terms of the company should beaccording to the competitive market situation otherwise the loss of customers
could prove costly to the company.
Components of Credit Policy:
• Development of credit standards
• Credit Terms including credit period allowed and cash discount
• Credit Limit allowed to customers
• Collection Procedurehow long to wait past due date to initiate collection efforts
methods of contact
whether and at what point to refer account to collection agency
Determinants of credit period:
• Market competition
• The financial power of the buyer
• Customer type (i.e. wholesaler, retailer or final consumer)• Credit Risk
• Consumer Demand
• Cost, Profitability and Standardization.
COMPANY’S RECEIVABLES MANGEMENT POLICY:
SAINT GOBAIN GLASS LTD monitors its receivables and manages them on
a monthly basis. As mentioned before it has divided its sales team in to differentgroups. SAINT GOBAIN GLASS LTD monthly basis analyzing the
outstanding of each group and in that each manager. They prepare a collection
plan for each manager on a monthly basis. Once the month ends the manager
has to fill the actual statistics of collection done by him. Now an easy
comparison is possible with the planned figures and the actual collection
figures.
EFFECTS OF IMPROPER RECEIVABLES MANAGEMENT
8/4/2019 Intership Project Report (2)
http://slidepdf.com/reader/full/intership-project-report-2 17/44
The following mentioned below are the ill effects of not properly managing the
receivables of the company:
If the money from the debtors don’t come on time the operating cycle of
the company will be affected
The company will not be able to pay back its Creditors on time.
In case of shortage of money the company would be forced to take bank
loan.
This would in turn increase the fixed cost incurred by the company in the
form of bank interest.
Each company has some monetary obligations on a monthly basis. If the
collections due for that particular month are not received then the
company would become incapable of fulfilling those monetaryobligations and statutory payments.
Some of the statutory payments are sales tax, custom and excise duties
payments. Some of the monetary obligations are office rent, factory rent,
salaries to employees etc.
8/4/2019 Intership Project Report (2)
http://slidepdf.com/reader/full/intership-project-report-2 18/44
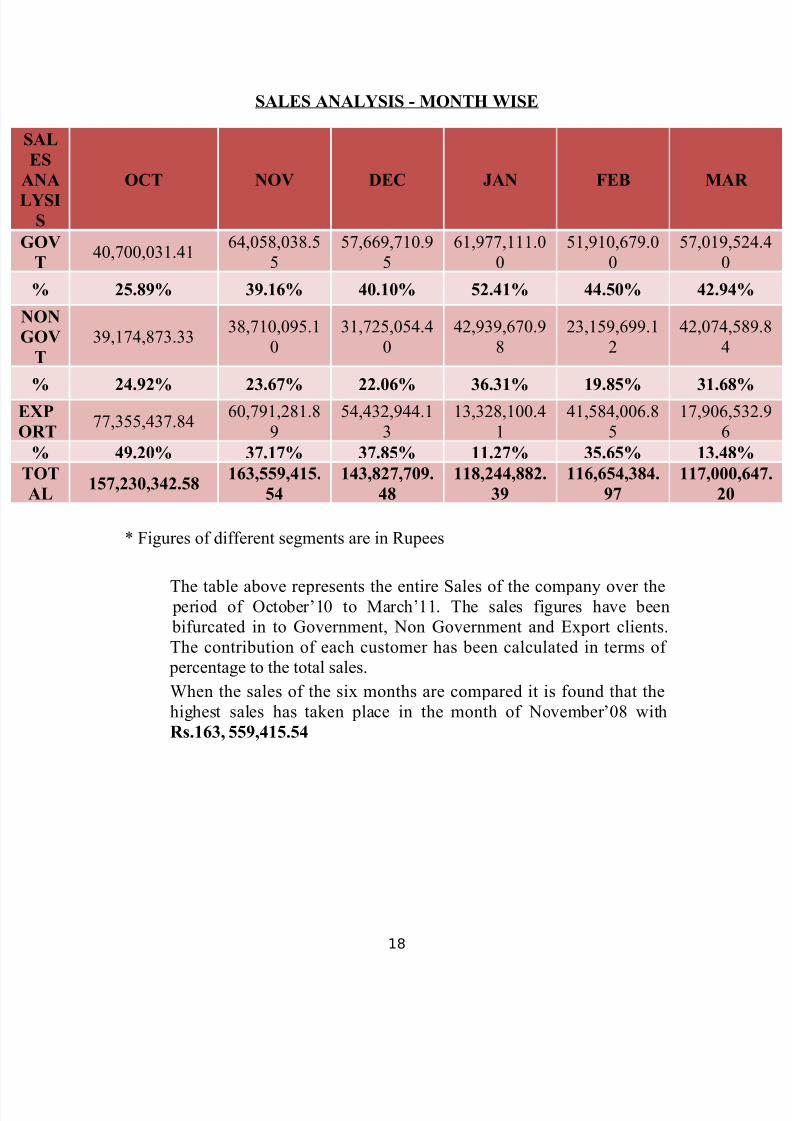
SALES ANALYSIS - MONTH WISE
* Figures of different segments are in Rupees
The table above represents the entire Sales of the company over the
period of October’10 to March’11. The sales figures have been
bifurcated in to Government, Non Government and Export clients.
The contribution of each customer has been calculated in terms of
percentage to the total sales.
When the sales of the six months are compared it is found that the
highest sales has taken place in the month of November’08 with
Rs.163, 559,415.54
AL
S
NA
YSI
S
OCT NOV DEC JAN FEB MA
OV
T40,700,031.41
64,058,038.5
5
57,669,710.9
5
61,977,111.0
0
51,910,679.0
0
57,019,
0
% 25.89% 39.16% 40.10% 52.41% 44.50% 42.94
ON
OV
T
39,174,873.3338,710,095.1
0
31,725,054.4
0
42,939,670.9
8
23,159,699.1
2
42,074,
4
% 24.92% 23.67% 22.06% 36.31% 19.85% 31.68
XP
RT77,355,437.84
60,791,281.8
9
54,432,944.1
3
13,328,100.4
1
41,584,006.8
5
17,906,
6
% 49.20% 37.17% 37.85% 11.27% 35.65% 13.48
OT
AL157,230,342.58
163,559,415.
54
143,827,709.
48
118,244,882.
39
116,654,384.
97
117,000
20
18
8/4/2019 Intership Project Report (2)
http://slidepdf.com/reader/full/intership-project-report-2 19/44
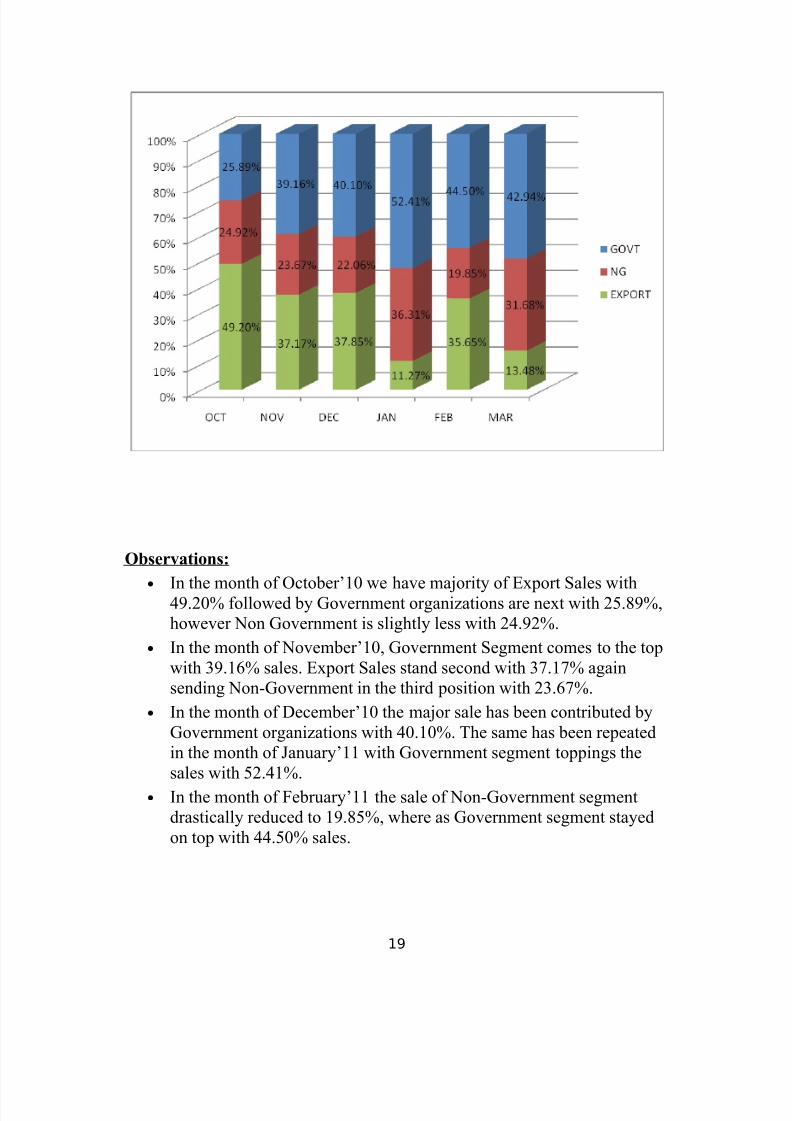
Observations:
• In the month of October’10 we have majority of Export Sales with49.20% followed by Government organizations are next with 25.89%,
however Non Government is slightly less with 24.92%.
• In the month of November’10, Government Segment comes to the top
with 39.16% sales. Export Sales stand second with 37.17% again
sending Non-Government in the third position with 23.67%.
• In the month of December’10 the major sale has been contributed by
Government organizations with 40.10%. The same has been repeated
in the month of January’11 with Government segment toppings the
sales with 52.41%.
• In the month of February’11 the sale of Non-Government segment
drastically reduced to 19.85%, where as Government segment stayed
on top with 44.50% sales.
19

8/4/2019 Intership Project Report (2)
http://slidepdf.com/reader/full/intership-project-report-2 20/44
• In the month of March’11 Non-Government sector recovered by
increasing it sales to 31.68%. Government Segment had a sales of
42.94%
Sales v/s Collection Analysis
For the month - OCTOBER Invoice
Amount
Amt Rcvd on
Time
Amt Rcvd Post
Due DatePending Amt
157,230,342.5
8 39,806,017.14 101,243,557.78 18,184,295.94
100% 25.32% 64.39% 11.57%
The table represents of the entire sales in the month of October ’10 how
much was collected on time and how much was collected post due date,
finally leaving the pending amount yet to be received. The data has also
been graphically represented with a pie chart.
It is observed that out of the entire sales around 25.32% was collected
on time where as 64.39% was collected post due date leaving with
11.57% still pending.
20

8/4/2019 Intership Project Report (2)
http://slidepdf.com/reader/full/intership-project-report-2 21/44
Sales v/s Collection Analysis
For the month - OCTOBER
OCT Invoice AmtAmt Rcvd
on Time
Amt Rcvd
Post Due
Date
Pending
Amt
GOVT 40,700,031.41 3,448,944.00 30,740,450.95 7,075,050.05
% on
Sales100% 8.47% 75.53% 17.38%
NG 39,174,873.33 4,850,687.49 28,554,100.48 5,765,218.40
% on
Sales100% 12.38% 72.89% 14.72%
EXPORT 77,355,437.8431,506,385.6
541,949,006.35 5,344,027.49
% on
Sales100% 40.73% 54.23% 6.91%
OCT
TOTAL
157,230,342.5
8
39,806,017.1
4
101,243,557.7
8
18,184,295.9
4
% on
Sales100% 25.32% 64.39% 11.57%
* Figures of different segments are in Rupees
Observations:
• The Total Government Sales was Rs. 40,700,031.41 out of which
Rs.3,448,944.00 was received on or before due date and Rs.
30,740,450.95 was received post due date.
• The Total Non Government Sales comprises to Rs.39, 174,873.33 out
of which Rs.4, 850,687.49 came on time Rs. 28,554,100.48 was
delayed.
• The Total Export Sales amounts to Rs. 77,355,437.84 out of which
Rs. 31,506,385.65 was received on time and Rs. 41,949,006.35 were
delayed.
21
8/4/2019 Intership Project Report (2)
http://slidepdf.com/reader/full/intership-project-report-2 22/44
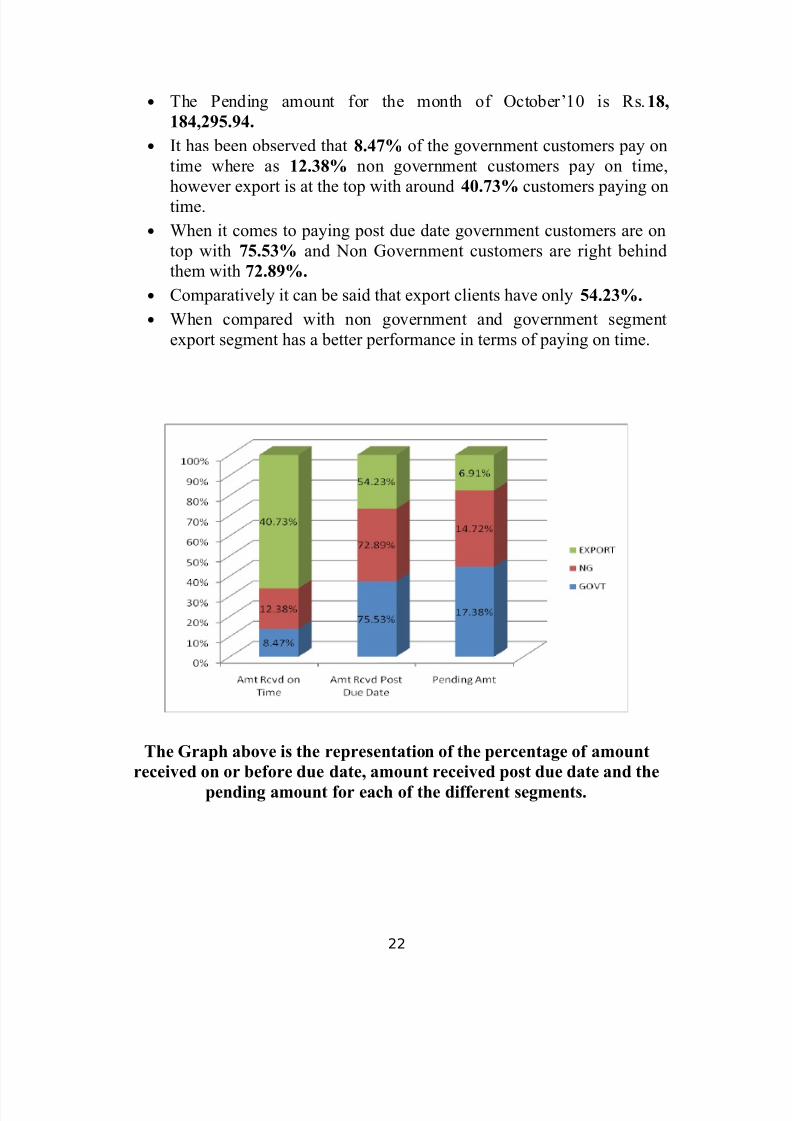
• The Pending amount for the month of October’10 is Rs.18,
184,295.94.
• It has been observed that 8.47% of the government customers pay on
time where as 12.38% non government customers pay on time,
however export is at the top with around 40.73% customers paying ontime.
• When it comes to paying post due date government customers are on
top with 75.53% and Non Government customers are right behind
them with 72.89%.
• Comparatively it can be said that export clients have only 54.23%.
• When compared with non government and government segment
export segment has a better performance in terms of paying on time.
The Graph above is the representation of the percentage of amount
received on or before due date, amount received post due date and thepending amount for each of the different segments.
22
8/4/2019 Intership Project Report (2)
http://slidepdf.com/reader/full/intership-project-report-2 23/44
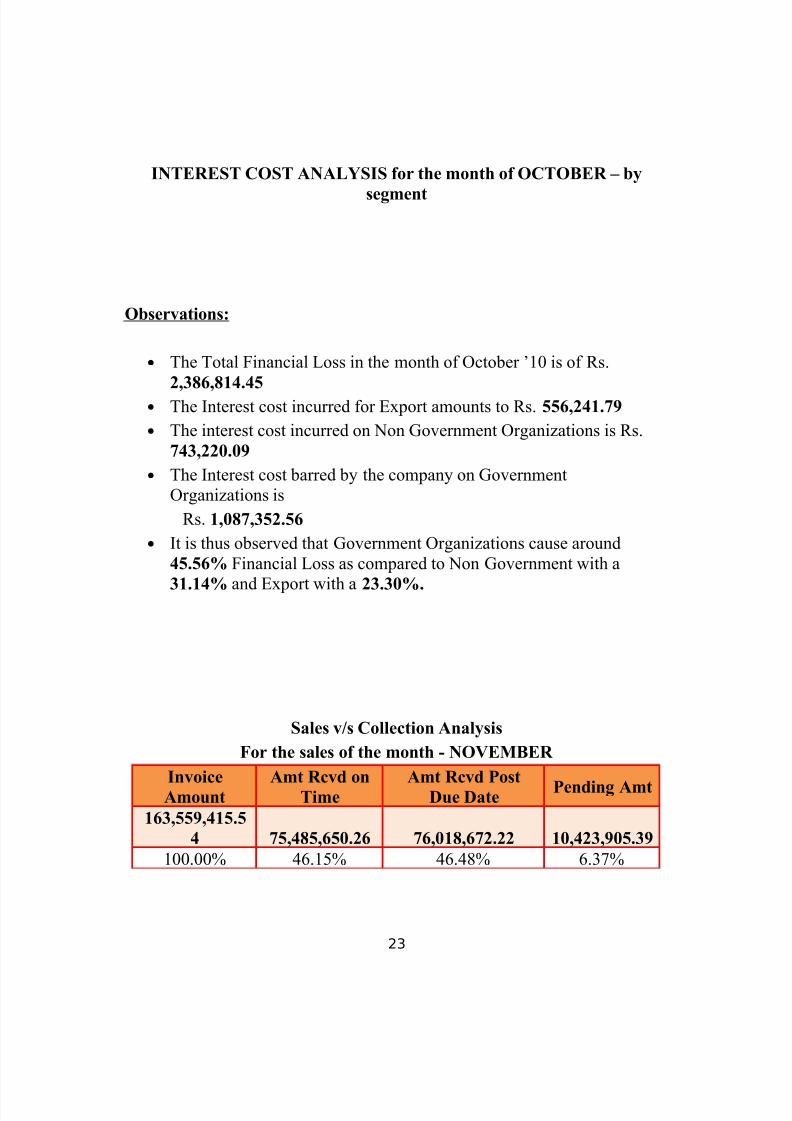
INTEREST COST ANALYSIS for the month of OCTOBER – by
segment
Observations:
• The Total Financial Loss in the month of October ’10 is of Rs.
2,386,814.45• The Interest cost incurred for Export amounts to Rs. 556,241.79
• The interest cost incurred on Non Government Organizations is Rs.
743,220.09
• The Interest cost barred by the company on Government
Organizations is
Rs. 1,087,352.56
• It is thus observed that Government Organizations cause around
45.56% Financial Loss as compared to Non Government with a
31.14% and Export with a 23.30%.
Sales v/s Collection Analysis
For the sales of the month - NOVEMBER
Invoice
Amount
Amt Rcvd on
Time
Amt Rcvd Post
Due DatePending Amt
163,559,415.5
4 75,485,650.26 76,018,672.22 10,423,905.39
100.00% 46.15% 46.48% 6.37%
23
8/4/2019 Intership Project Report (2)
http://slidepdf.com/reader/full/intership-project-report-2 24/44
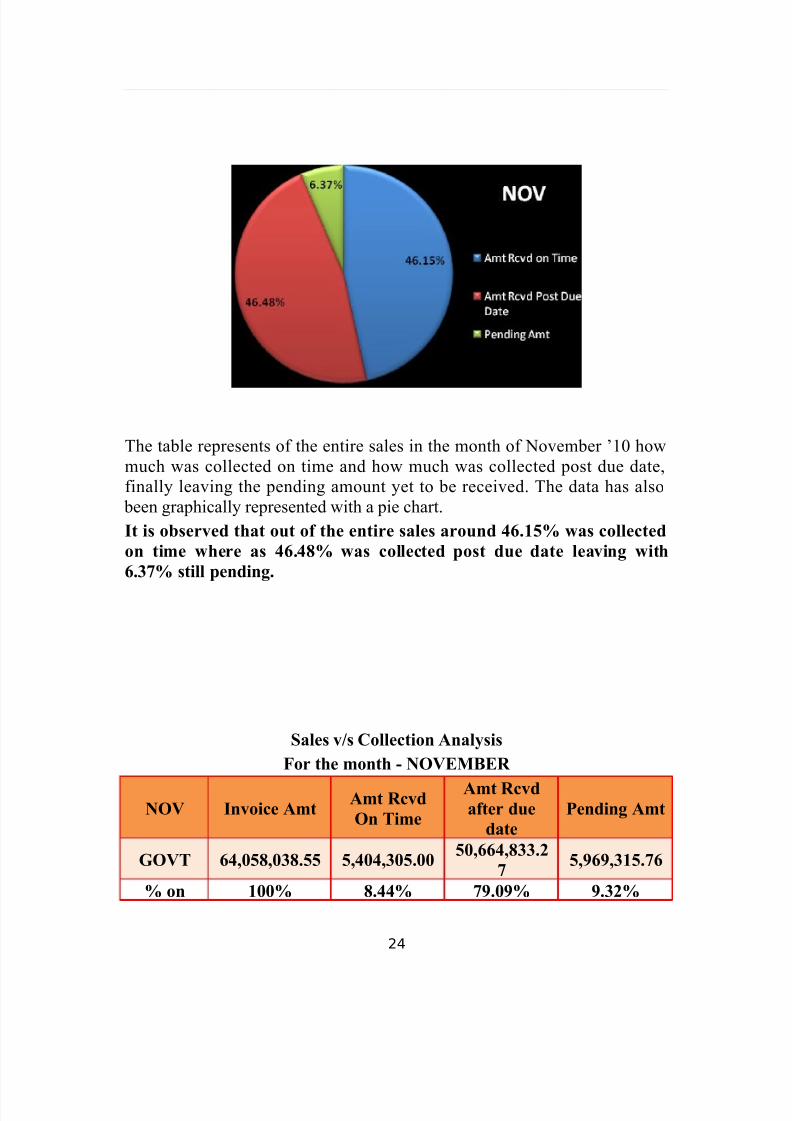
The table represents of the entire sales in the month of November ’10 how
much was collected on time and how much was collected post due date,
finally leaving the pending amount yet to be received. The data has also
been graphically represented with a pie chart.
It is observed that out of the entire sales around 46.15% was collected
on time where as 46.48% was collected post due date leaving with
6.37% still pending.
Sales v/s Collection Analysis
For the month - NOVEMBER
NOV Invoice AmtAmt Rcvd
On Time
Amt Rcvd
after due
date
Pending Amt
GOVT 64,058,038.55 5,404,305.0050,664,833.2
75,969,315.76
% on 100% 8.44% 79.09% 9.32%
24
8/4/2019 Intership Project Report (2)
http://slidepdf.com/reader/full/intership-project-report-2 25/44
Sales
NG 38,710,095.1022,066,022.8
0
12,244,902.8
53,513,548.81
% on
Sales
100% 57.00% 31.63% 9.08%
EXPORT 60,791,281.8948,015,322.4
6
13,108,936.1
0941,040.82
% on
Sales100% 78.98% 21.56% 1.55%
NOV
TOTAL
163,559,415.5
4
75,485,650.2
6
76,018,672.2
2
10,423,905.3
9
% on
Sales100% 46.15% 46.48% 6.37%
* Figures of different segments are in Rupees
Observations:
• The Total Government Sales was Rs. 64,058,038.55 out of which Rs.
5,404,305.00 was received on or before due date and Rs.
50,664,833.27 was received post due date.
• The Total Non Government Sales comprises to Rs. 38,710,095.10 out
of which Rs.22, 066,022.80 came on time Rs. 12,244,902.85 was
delayed.• The Total Export Sales amounts to Rs. 60,791,281.89 out of which
Rs. 48,015,322.46 was received on time and Rs. 13,108,936.10 were
delayed.
• The Pending amount for the month of November is Rs. 10,423,905.39
• The government clients are very much inconsistent in paying back on
time as compared to non government and export clients.
• It is observed that mere 8.44% clients have paid on time were as
57.00% of Non Government and a major 78.98% Export customers
have paid on time.
25
8/4/2019 Intership Project Report (2)
http://slidepdf.com/reader/full/intership-project-report-2 26/44
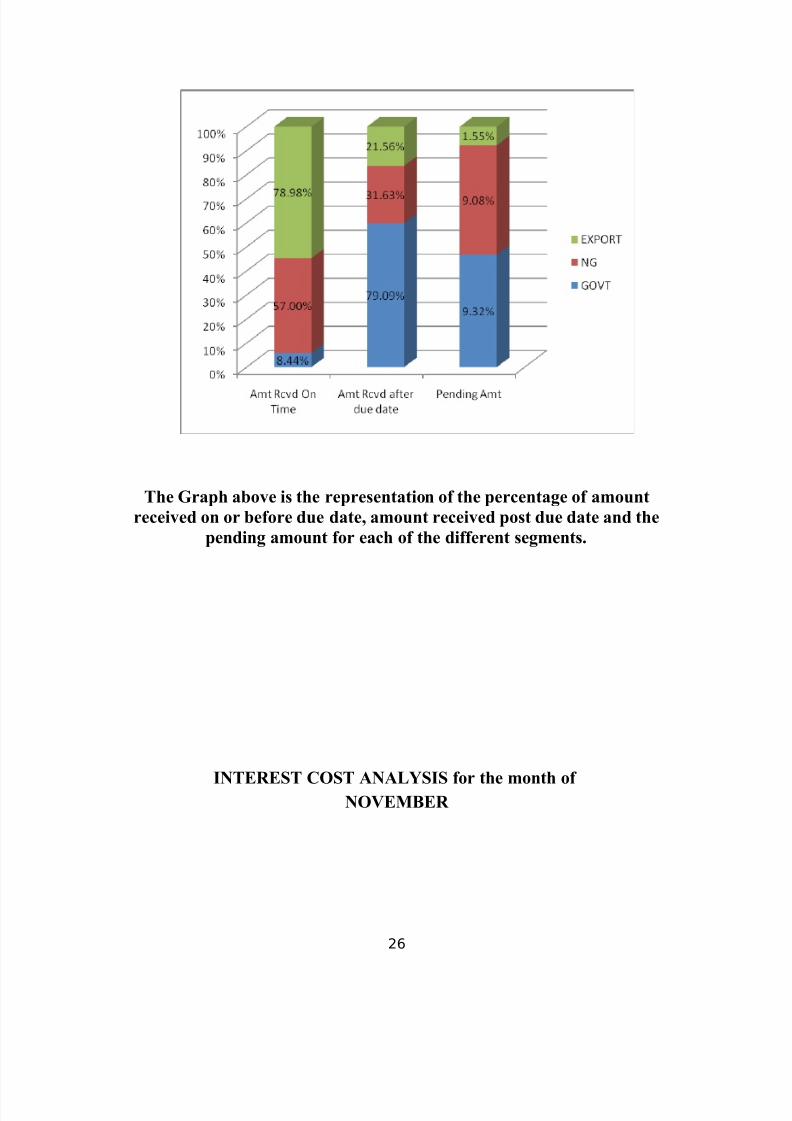
The Graph above is the representation of the percentage of amount
received on or before due date, amount received post due date and the
pending amount for each of the different segments.
INTEREST COST ANALYSIS for the month of
NOVEMBER
26
8/4/2019 Intership Project Report (2)
http://slidepdf.com/reader/full/intership-project-report-2 27/44
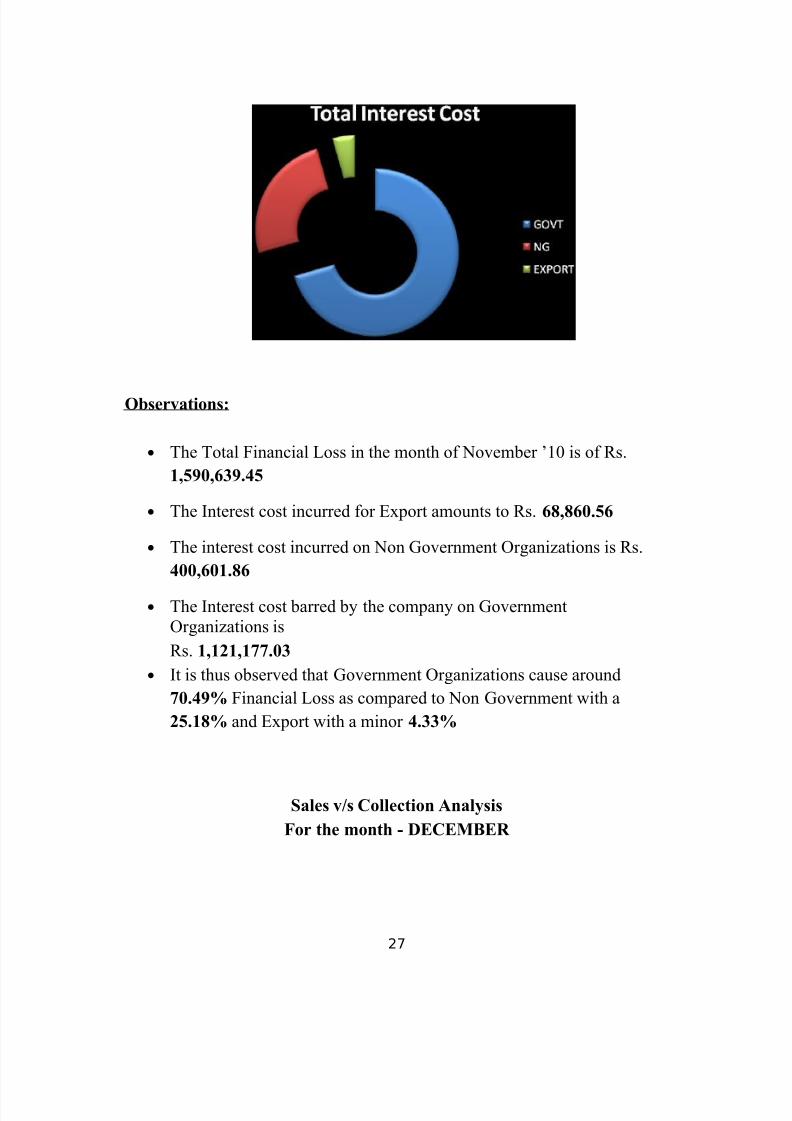
Observations:
• The Total Financial Loss in the month of November ’10 is of Rs.
1,590,639.45
• The Interest cost incurred for Export amounts to Rs. 68,860.56
• The interest cost incurred on Non Government Organizations is Rs.
400,601.86
• The Interest cost barred by the company on Government
Organizations is
Rs. 1,121,177.03
• It is thus observed that Government Organizations cause around
70.49% Financial Loss as compared to Non Government with a
25.18% and Export with a minor 4.33%
Sales v/s Collection Analysis
For the month - DECEMBER
27

8/4/2019 Intership Project Report (2)
http://slidepdf.com/reader/full/intership-project-report-2 28/44
DEC Invoice AmtAmt rcvd on
time
Amt rcvd
post Due
Date
Pending amt
GOVT 57,669,710.9514,092,253.3
2
36,746,258.8
8
6,782,640.32
% on
Sales100% 24.44% 63.72% 11.76%
NGs 31,725,054.4014,944,447.0
8
15,999,239.2
4821,738.95
% on
Sales100% 47.11% 50.43% 2.59%
EXPORT
S54,432,944.13
26,242,106.0
8
20,681,484.1
27,506,896.42
% on
Sales 100% 48.21% 37.99% 13.79%DEC
TOTAL
143,827,709.4
8
55,278,806.4
8
73,426,982.2
4
15,111,275.6
9
% on
Sales100% 38.43% 51.05% 10.51%
* Figures of different segments are in Rupees
Observations:
• The Total Government Sales was Rs. 57,669,710.95 out of which Rs.
14,092,253.32 was received on or before due date and Rs.
36,746,285.88 was received post due date.
• The Total Non Government Sales comprises to Rs. 31,725,054.40 out
of which Rs.14, 944,447.08 came on time Rs. 15,999,239.24 was
delayed.
• The Total Export Sales amounts to Rs. 54,432,944.13 out of which
Rs. 26,242,106.08 was received on time and Rs. 20,681,484.12 were
delayed.
• The Pending amount for the month of December is Rs. 15,111,275.69
• It is observed that 24.44% Government clients have paid on time were
as 47.11% of Non Government clients have paid on time and 48.21%
Export customers have paid on time.
• These figures show that Export Segment is more efficient on paying
back their dues on time.
28

8/4/2019 Intership Project Report (2)
http://slidepdf.com/reader/full/intership-project-report-2 29/44
The Graph above is the representation of the percentage of amount
received on or before due date, amount received post due date and the
pending amount for each of the different segments.
INTEREST COST ANALYSIS for the month of
DECEMBER
29
8/4/2019 Intership Project Report (2)
http://slidepdf.com/reader/full/intership-project-report-2 30/44
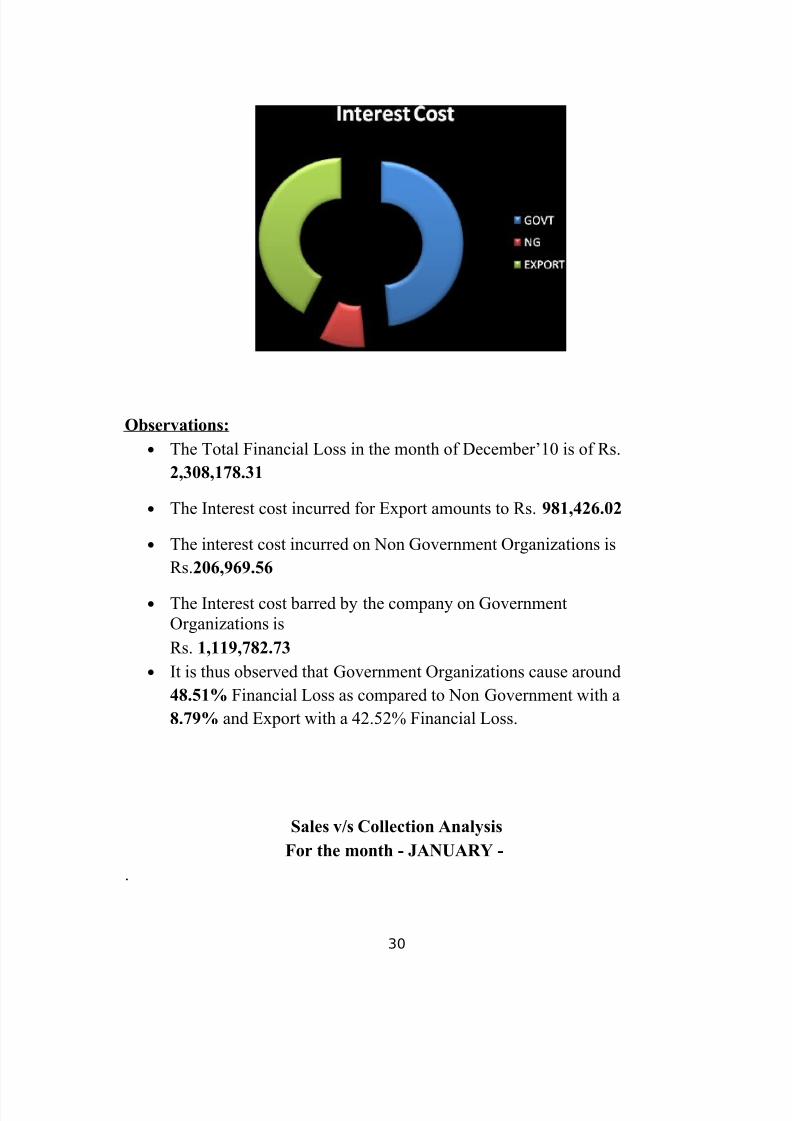
Observations:
• The Total Financial Loss in the month of December’10 is of Rs.
2,308,178.31
• The Interest cost incurred for Export amounts to Rs. 981,426.02
• The interest cost incurred on Non Government Organizations is
Rs.206,969.56
• The Interest cost barred by the company on Government
Organizations is
Rs. 1,119,782.73
• It is thus observed that Government Organizations cause around
48.51% Financial Loss as compared to Non Government with a
8.79% and Export with a 42.52% Financial Loss.
Sales v/s Collection Analysis
For the month - JANUARY -
.
30
8/4/2019 Intership Project Report (2)
http://slidepdf.com/reader/full/intership-project-report-2 31/44
JAN Invoice AmtAmt Rcvd On
Time
Amt Rcvd
Post Due
Date
Pending
Amt
GOVT 61,977,111.00 2,446,814.98 57,777,157.06 1,723,883.02% on
Sales100% 3.95% 93.22% 2.78%
NG 42,939,670.98 23,802,031.71 14,383,789.34 4246561.62
% on
Sales100% 55.43% 33.50% 9.89%
Export 13,328,100.41 1,951,591.46 11,376,508.81 0.00
% on
Sales100% 14.64% 85.36% 0.00%
JANTOTAL
118,244,882.39
28,200,438.15 83,537,455.21 5,970,444.64
% on
Sales100% 23.85% 70.65% 5.05%
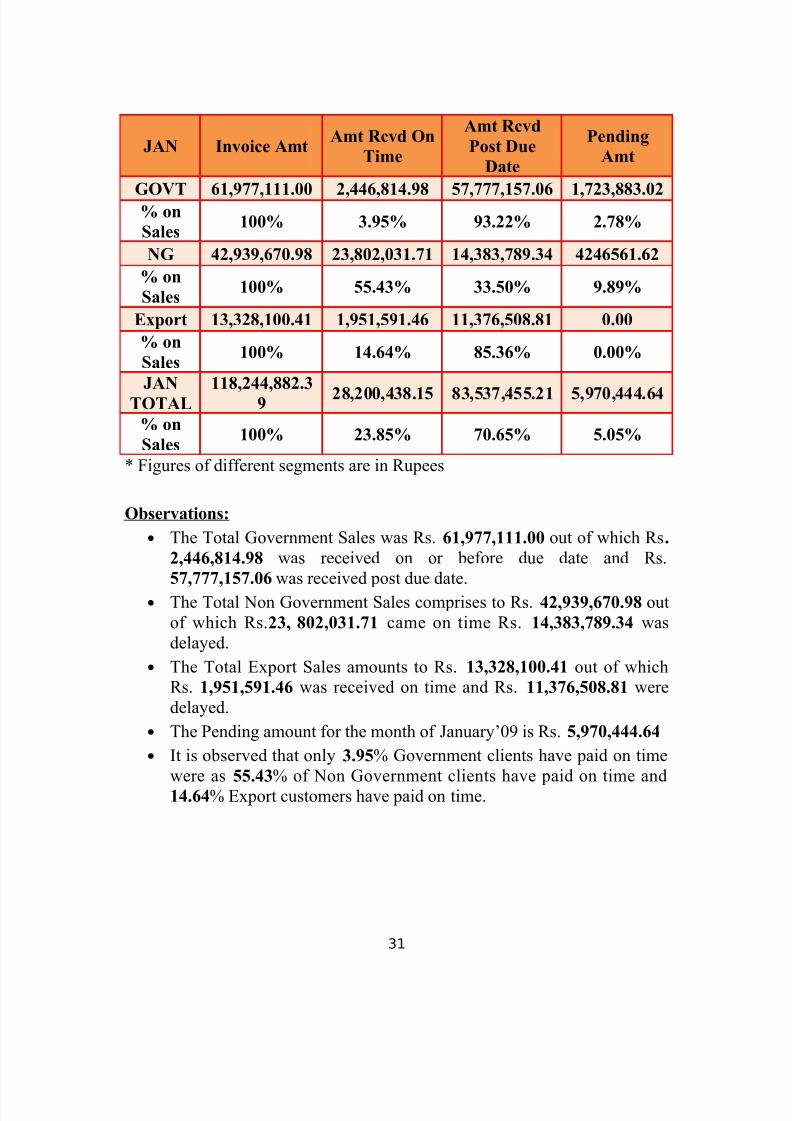
* Figures of different segments are in Rupees
Observations:
• The Total Government Sales was Rs. 61,977,111.00 out of which Rs.
2,446,814.98 was received on or before due date and Rs.
57,777,157.06 was received post due date.• The Total Non Government Sales comprises to Rs. 42,939,670.98 out
of which Rs.23, 802,031.71 came on time Rs. 14,383,789.34 was
delayed.
• The Total Export Sales amounts to Rs. 13,328,100.41 out of which
Rs. 1,951,591.46 was received on time and Rs. 11,376,508.81 were
delayed.
• The Pending amount for the month of January’09 is Rs. 5,970,444.64
• It is observed that only 3.95% Government clients have paid on time
were as 55.43% of Non Government clients have paid on time and14.64% Export customers have paid on time.
31
8/4/2019 Intership Project Report (2)
http://slidepdf.com/reader/full/intership-project-report-2 32/44
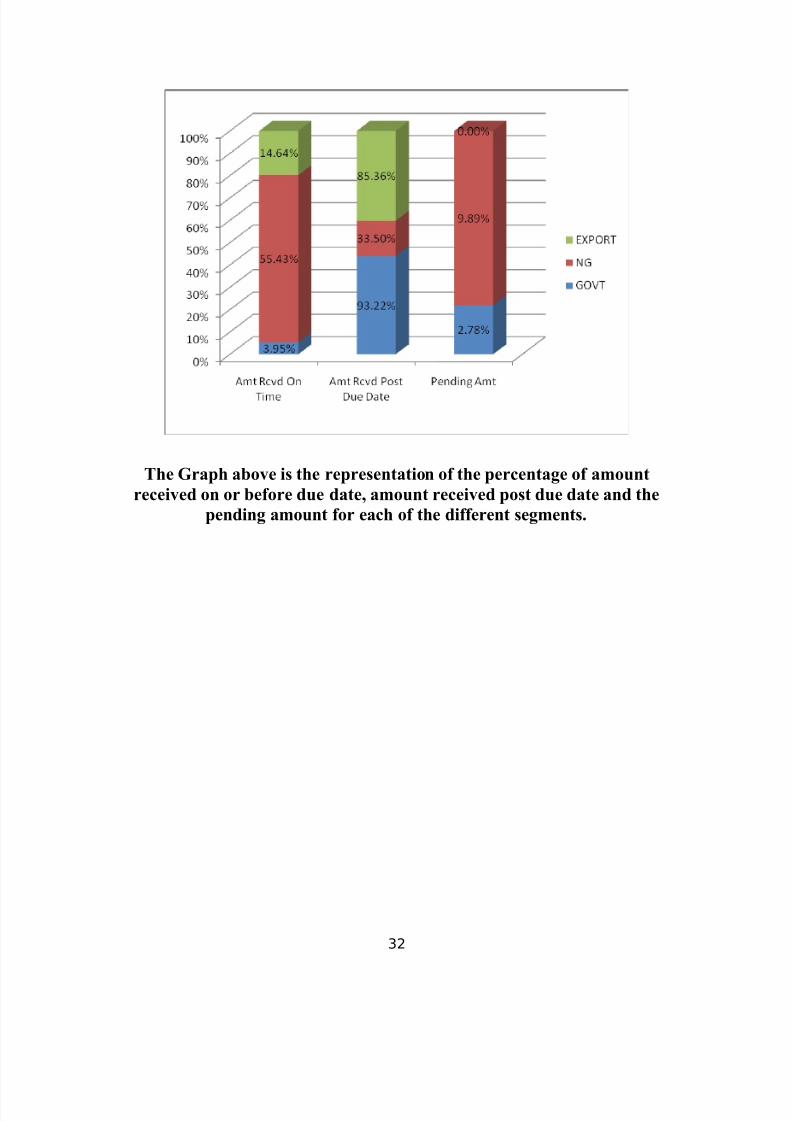
The Graph above is the representation of the percentage of amount
received on or before due date, amount received post due date and the
pending amount for each of the different segments.
32
8/4/2019 Intership Project Report (2)
http://slidepdf.com/reader/full/intership-project-report-2 33/44
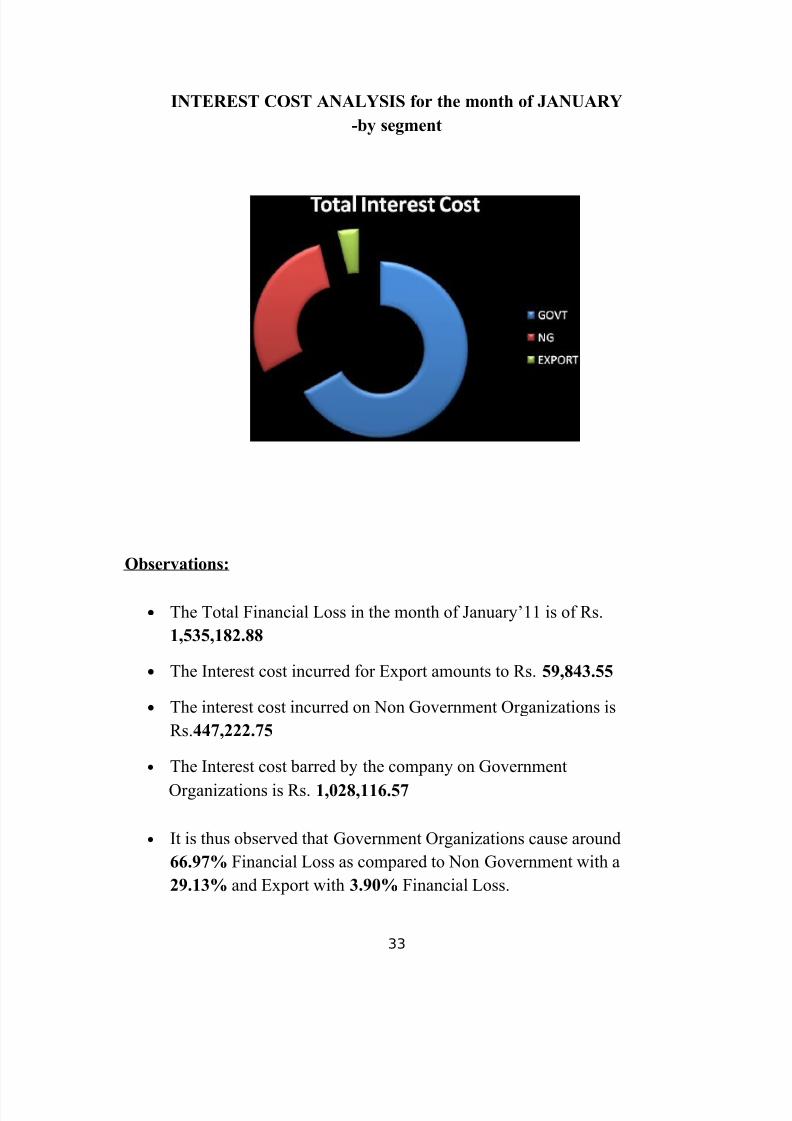
INTEREST COST ANALYSIS for the month of JANUARY
-by segment
Observations:
• The Total Financial Loss in the month of January’11 is of Rs.
1,535,182.88
• The Interest cost incurred for Export amounts to Rs. 59,843.55
• The interest cost incurred on Non Government Organizations is
Rs.447,222.75
• The Interest cost barred by the company on GovernmentOrganizations is Rs. 1,028,116.57
• It is thus observed that Government Organizations cause around
66.97% Financial Loss as compared to Non Government with a
29.13% and Export with 3.90% Financial Loss.
33
8/4/2019 Intership Project Report (2)
http://slidepdf.com/reader/full/intership-project-report-2 34/44
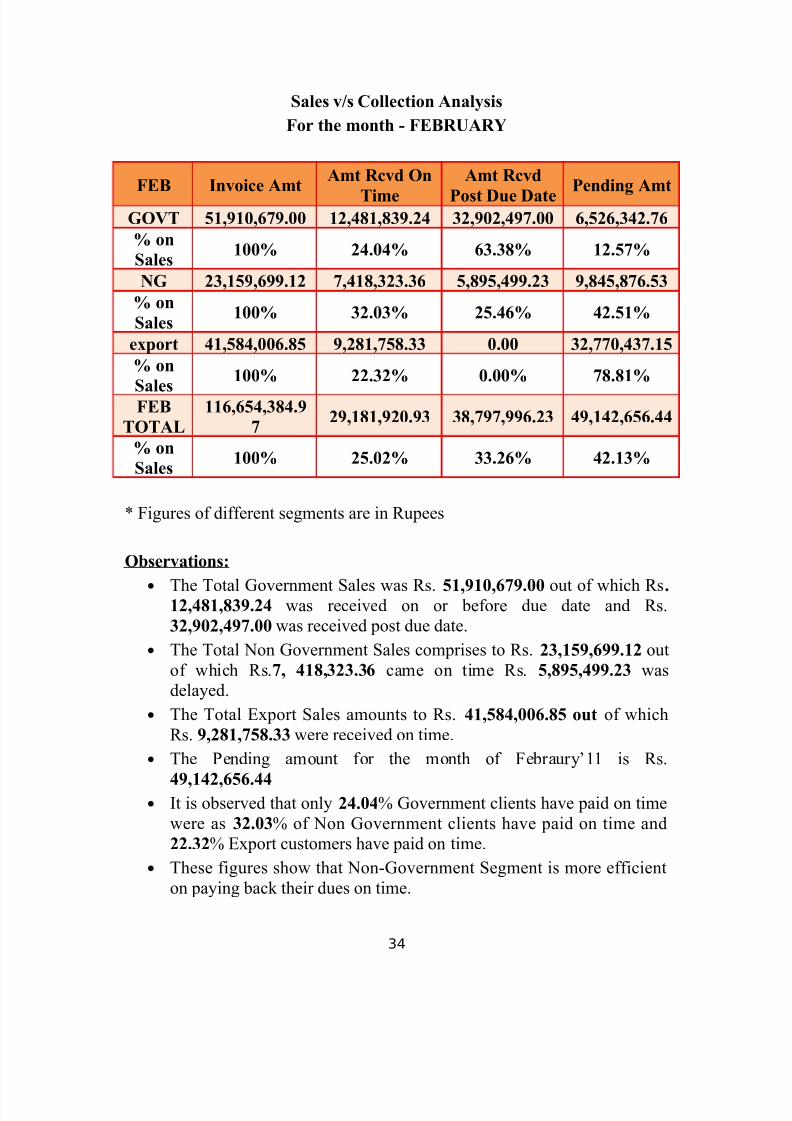
Sales v/s Collection Analysis
For the month - FEBRUARY
FEB Invoice Amt
Amt Rcvd On
Time
Amt Rcvd
Post Due Date Pending AmtGOVT 51,910,679.00 12,481,839.24 32,902,497.00 6,526,342.76
% on
Sales100% 24.04% 63.38% 12.57%
NG 23,159,699.12 7,418,323.36 5,895,499.23 9,845,876.53
% on
Sales100% 32.03% 25.46% 42.51%
export 41,584,006.85 9,281,758.33 0.00 32,770,437.15
% on
Sales 100% 22.32% 0.00% 78.81%FEB
TOTAL
116,654,384.9
729,181,920.93 38,797,996.23 49,142,656.44
% on
Sales100% 25.02% 33.26% 42.13%
* Figures of different segments are in Rupees
Observations:
• The Total Government Sales was Rs. 51,910,679.00 out of which Rs.
12,481,839.24 was received on or before due date and Rs.
32,902,497.00 was received post due date.
• The Total Non Government Sales comprises to Rs. 23,159,699.12 out
of which Rs.7, 418,323.36 came on time Rs. 5,895,499.23 was
delayed.
• The Total Export Sales amounts to Rs. 41,584,006.85 out of which
Rs. 9,281,758.33 were received on time.
• The Pending amount for the month of Febraury’11 is Rs.
49,142,656.44
• It is observed that only 24.04% Government clients have paid on time
were as 32.03% of Non Government clients have paid on time and
22.32% Export customers have paid on time.
• These figures show that Non-Government Segment is more efficient
on paying back their dues on time.
34
8/4/2019 Intership Project Report (2)
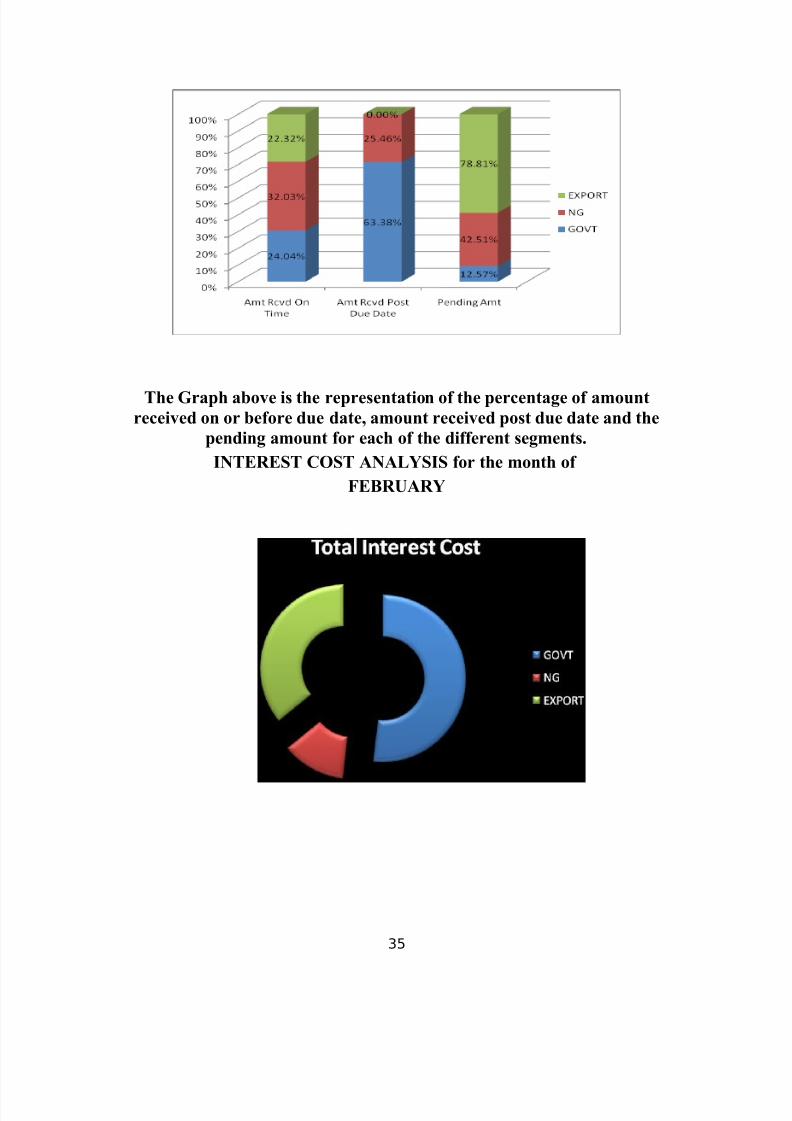
http://slidepdf.com/reader/full/intership-project-report-2 35/44
The Graph above is the representation of the percentage of amount
received on or before due date, amount received post due date and the
pending amount for each of the different segments.
INTEREST COST ANALYSIS for the month of
FEBRUARY
35

8/4/2019 Intership Project Report (2)
http://slidepdf.com/reader/full/intership-project-report-2 36/44
Observations:
• The Total Financial Loss in the month of January’09 is of Rs.
1,790,997.36
• The Interest cost incurred for Export amounts to Rs. 642,583.61
• The interest cost incurred on Non Government Organizations is Rs.
220,558.13
• The Interest cost barred by the company on Government
Organizations is
Rs. 927,855.62
• It is thus observed that Government Organizations cause around
51.81% Financial Loss as compared to Non Government with a
12.31% and Export with 35.88% Financial Loss.
Sales v/s Collection Analysis
For the month - MARCH
MAR Invoice AmtAmt Rcvd
On Time
Amt RcvdPost Due
Date
Pending Amt
GOVT 72,811,155.40 36,369.00 971,446.00 71,803,340.40
% on
Sales100% 0.05% 1.33% 98.62%
NG 42,074,589.84 7,072,245.83 9,688,837.00 20,274,434.01
% on
Sales100% 16.81% 23.03% 48.19%
exports 17,906,532.96 3,808,741.60 12,182,573.48 2,396,196.97% on
Sales100% 21.27% 68.03% 13.38%
MAR
TOTAL
132,792,278.2
0
10,917,356.4
322,842,856.48 94,473,971.38
% on
Sales100% 8.22% 17.20% 71.14%
36
8/4/2019 Intership Project Report (2)
http://slidepdf.com/reader/full/intership-project-report-2 37/44
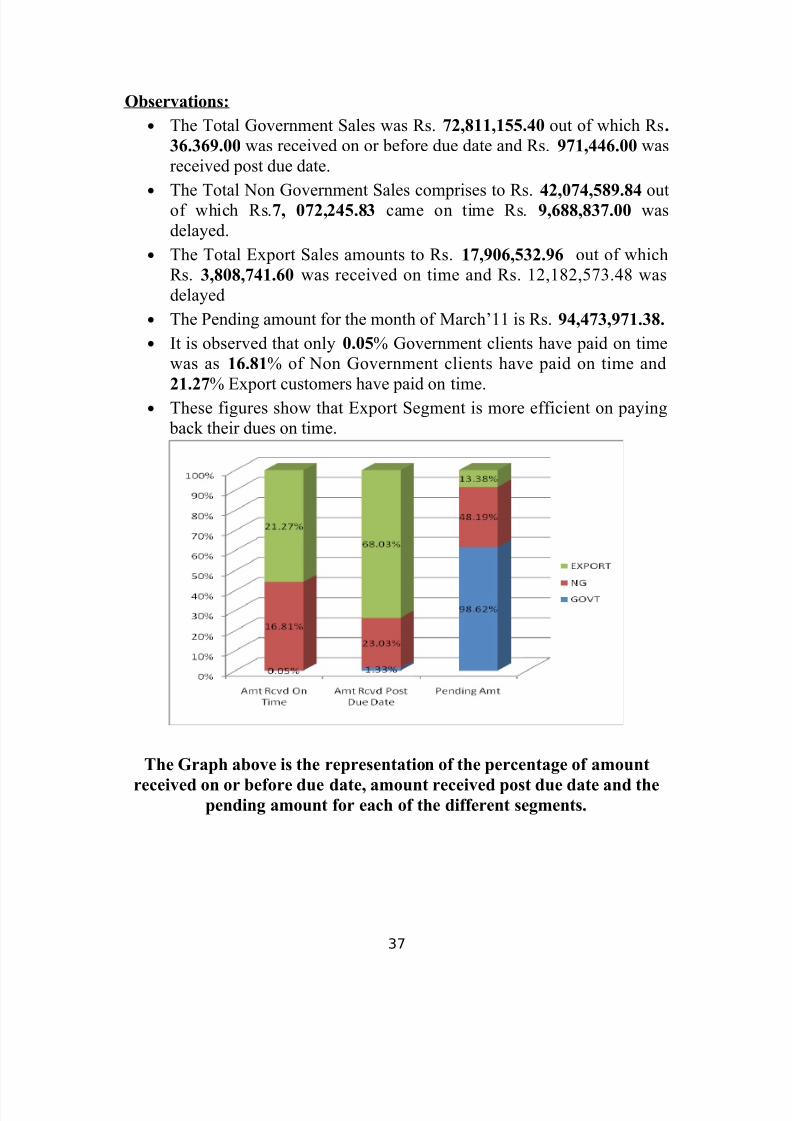
Observations:
• The Total Government Sales was Rs. 72,811,155.40 out of which Rs.
36.369.00 was received on or before due date and Rs. 971,446.00 was
received post due date.
• The Total Non Government Sales comprises to Rs. 42,074,589.84 outof which Rs.7, 072,245.83 came on time Rs. 9,688,837.00 was
delayed.
• The Total Export Sales amounts to Rs. 17,906,532.96 out of which
Rs. 3,808,741.60 was received on time and Rs. 12,182,573.48 was
delayed
• The Pending amount for the month of March’11 is Rs. 94,473,971.38.
• It is observed that only 0.05% Government clients have paid on time
was as 16.81% of Non Government clients have paid on time and
21.27% Export customers have paid on time.• These figures show that Export Segment is more efficient on paying
back their dues on time.
The Graph above is the representation of the percentage of amountreceived on or before due date, amount received post due date and the
pending amount for each of the different segments.
37
8/4/2019 Intership Project Report (2)
http://slidepdf.com/reader/full/intership-project-report-2 38/44
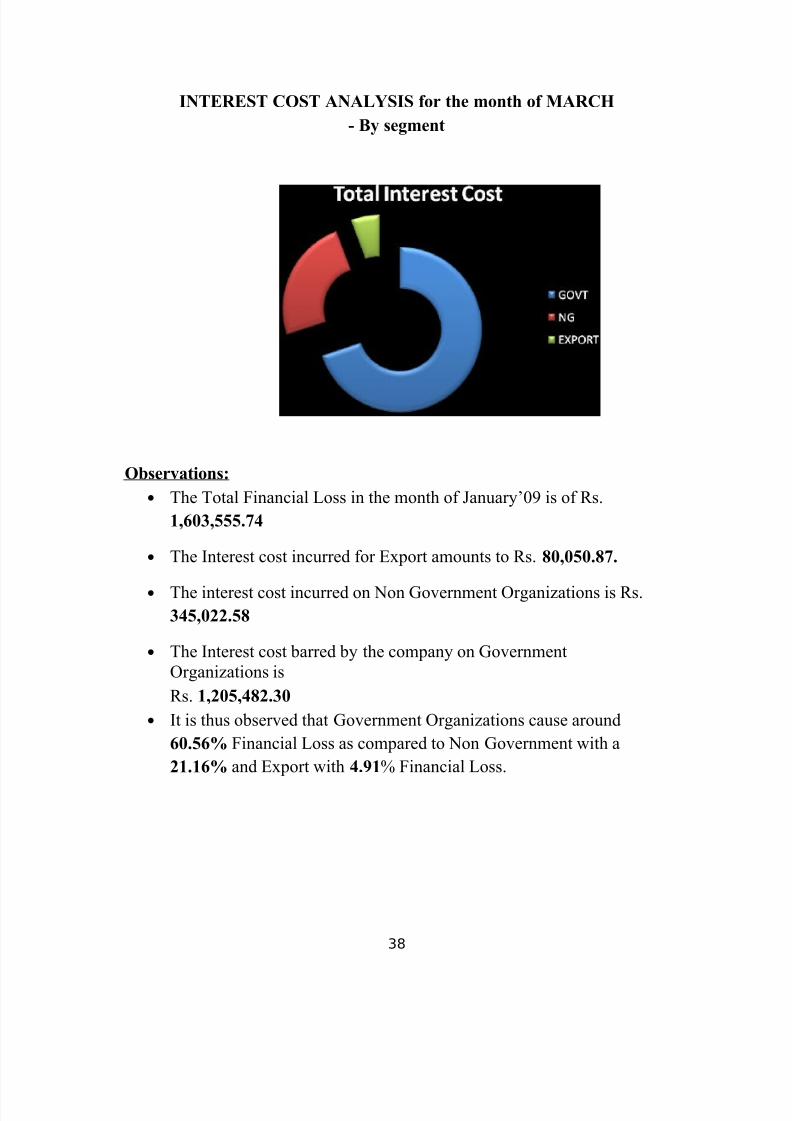
INTEREST COST ANALYSIS for the month of MARCH
- By segment
Observations:
• The Total Financial Loss in the month of January’09 is of Rs.
1,603,555.74
• The Interest cost incurred for Export amounts to Rs. 80,050.87.
• The interest cost incurred on Non Government Organizations is Rs.
345,022.58
• The Interest cost barred by the company on Government
Organizations is
Rs. 1,205,482.30
• It is thus observed that Government Organizations cause around
60.56% Financial Loss as compared to Non Government with a
21.16% and Export with 4.91% Financial Loss.
38
8/4/2019 Intership Project Report (2)
http://slidepdf.com/reader/full/intership-project-report-2 39/44
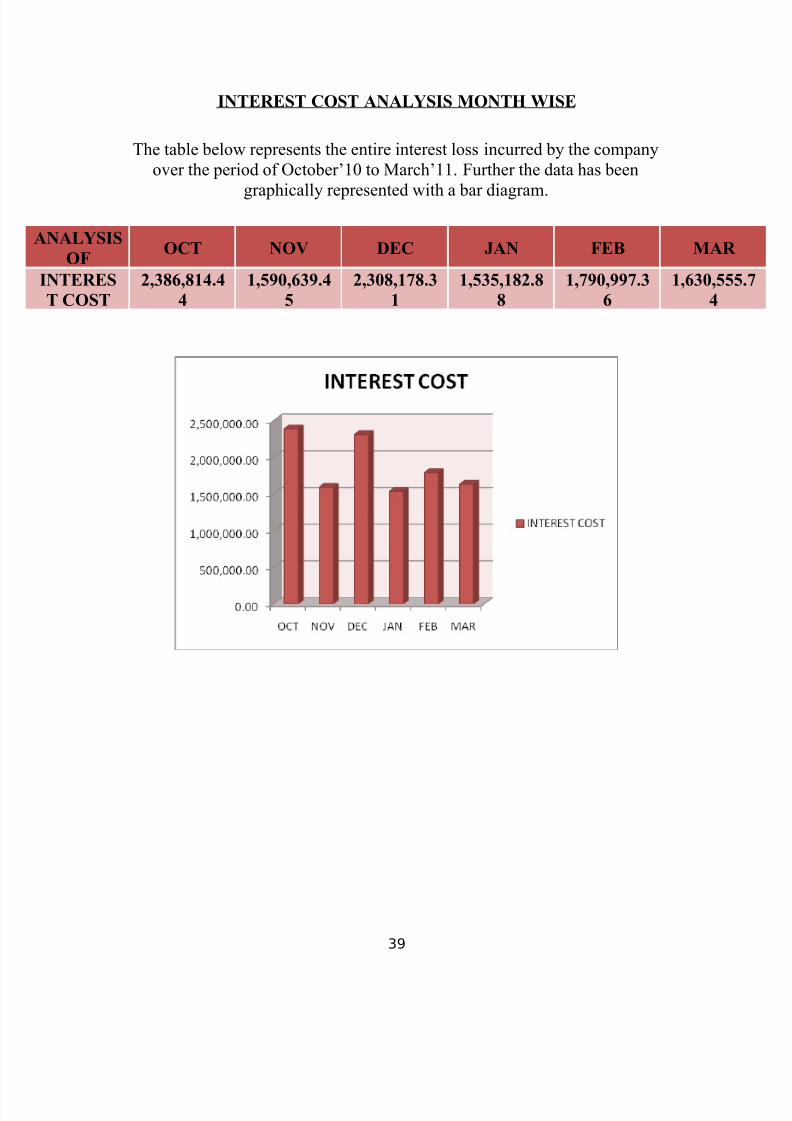
INTEREST COST ANALYSIS MONTH WISE
The table below represents the entire interest loss incurred by the company
over the period of October’10 to March’11. Further the data has been
graphically represented with a bar diagram.
ANALYSIS
OFOCT NOV DEC JAN FEB MAR
INTERES
T COST
2,386,814.4
4
1,590,639.4
5
2,308,178.3
1
1,535,182.8
8
1,790,997.3
6
1,630,55
4
39
8/4/2019 Intership Project Report (2)
http://slidepdf.com/reader/full/intership-project-report-2 40/44
FROM THE RESEARCH
REASONS FOR DELAY:
Many a times it was observed that the debtors didn’t pay company the agreed payment terms. The reasons for such a delay were found out by interacting with the
respective sales managers. It was found out that reasons were such that some could
be controlled and some of the reasons were out of the company’s control.
Accordingly the reasons for delay in receiving the credit amount from customers
have been divided into controllable reasons and uncontrollable reasons. The
following mentioned below are the general reasons for delay over the period of 6
months i.e. October’10 to March11:
CONTROLLABLE REASONS:
• Late delivery :
Many a times the customers delay the payments because we made a delay in
delivering the glass to them. Our customers are such that they use this
product for a certain project. Any delay made by us puts their project on
hold.
•Transportation documents not received on time :
Normally goods are transported to the customers place via road. In this
process the transporter carries a lorry receipt which is acknowledged by the
customer and then the transporter brings the receipted Chillan back to us. It
has been observed that the transporter in many cases has taken more time to
bring the receipted Chillan back to the office. If the receipted Chillan is not
received on time we cannot send the proof documents to the customers. The
issue is that the customers do not release the payment unless all the
necessary proof documents are submitted. ..
•
Quality issues :When an order is placed the customers expect a certain standard quality for
the product. There are situations where we have not been able to manufacture
according to the expected quality levels. Customers have returned the glass and
stopped the payment until the glasses are remanufactured according to their
specifications and re-supplied to them. Also lot of time is wasted until the
products are manufactured again and delivered. This time is crucial for the
40
8/4/2019 Intership Project Report (2)
http://slidepdf.com/reader/full/intership-project-report-2 41/44
company. Such delay cause huge financial loss and in turn affects the cash flow
in the organization...
• Inspection report not submitted :
Each Order comes with certain terms. Customers ask for various reports likeInspection Report, Type Test Report etc. These documents need to be
prepared and sent to the customers then on receipt of these documents the
customers release the payment. In many cases these reports were not
prepared on time and not sent on time to the customers. The delay affected
the timely receipt of payment from the customers. The administrative
efficiency is checked in this case. If these cases are not avoided then there
are chances of spoiling the customer relations.
• Quantity supplied more than tolerance level :
In each order terms related to Tolerance levels are mentioned anything moreor less to those units is not accepted. There has been a situation where in we
submitted more than the tolerance level it was around 5feets which were
rejected. After lot of persuasion the units were accepted and the payment
was made. Due to the mere 5 feet payment for the rest of the glass was held
up which caused a huge interest cost to the company.
UNCONTROLLABLE REASONS:
• :
In this current market situation lot of companies are facing cash flow
problem. Due to unavailability of funds they have not been able to pay their
creditors on time. We have no control over this situation. We could take
action against late payment but it would only spoil our relations with the
customer.
• Internal documentation problem :
When a consignment reaches the factory of the customer there is a certain
document prepared to intimate their accounts department about the arrival of
Goods. Once the accounts department gets the intimation, it then releases the
payment. There has been a situation where in there was a problem with in
the customers office where this internal office document (like GRN/SRN
etc.) was not prepared and the payment was delayed.
41
8/4/2019 Intership Project Report (2)
http://slidepdf.com/reader/full/intership-project-report-2 42/44
• No further sale done :
Some of our customers are dealers. These dealers do not pay us unless there
is a further sale done of the cables. We have no control over this situation;
however we could change the payment terms of such customers and demand
advance payment so as to avoid such a situation.
• Government budget limitations :
We have a huge government customer base. There is a short fall in this case
that government departments have quarterly budget. Due to unavailability of
funds we have to wait for the funds to be allotted until the next quarter. This
causes huge financial loss but it is purely out of our hands to reduce such
delays.
• Software issues in the customers office :
Each company has its own way of recording its activities. One company had
a new software i.e. SAP system installed which was not that user friendly.
The employees involved were not accustomed to this system so recording of
all the transactions was delayed. If proper recording of the receipt of order is
not done, the payment is not cleared by the company. This is something
which is not in our hands.
42
8/4/2019 Intership Project Report (2)
http://slidepdf.com/reader/full/intership-project-report-2 43/44
CONCLUSION
Overall after the study it has been observed that there is a lot of procedural
delay in the system which has caused huge amounts of interest loss to the
company. The company needs to concentrate on improving its efficiency inresponding to the customer requests. There has to be a more smooth documentation
process. Even though there are lot of recommendations provided for the company’s
receivables situation there are some constraints that come to our notice as we make
an analysis which are as follows:
Limitations of the Company:
• Due to the competitive market we cannot have strict payment terms. We
have to mould according to the customers demand simply to provide
customer satisfaction so as to ensure repeat orders.• Many customers are associated with this company for many years, so
SAINT GOBAIN LTD cannot take legal action case they delay the
payments. This would only spoil their customer relationships.
The company is currently not producing at its maximum capacity which is
affecting its delivery schedule agreed with the customers & the customers in turn
delay their payments if the cables are not delivered on time.
43

8/4/2019 Intership Project Report (2)
http://slidepdf.com/reader/full/intership-project-report-2 44/44
BIBLOGRAPHY
WEBSITES
• www.wikipedia.com
• http://www.saint-gobain.com/en
BOOKS
• FINANCIAL MANAGEMENT – IM PANDEY
•
FINANCIAL ACCOUNTING -- TULSIAN