Embed Size (px)
Citation preview
Interrogatory CSC-III-1 The United Illuminating Company Witness: Raina Huebner Bohdan Katreczko Petition 1120 Page 1 of 1
Q-CSC-III-1: Was the proposed substation expansion area surveyed for wetlands? If so,
describe the methodology used. A-CSC-III-1: UI delineated wetlands on the existing substation property and a parcel identified
to the west of the existing substation. The parcel west of the existing substation was investigated in the field on September 5, 2014, using a crisscrossing pattern, walking the property, noting changes in hydrology, vegetation, and soils. No wetlands were identified on these parcels. A partial boundary of a wetland off of the site was delineated in the field. The methodology was in accordance with the USDA Soil Survey Manual and the ACOE Northcentral Northeast Regional Supplement to the Corps of Engineers Wetland Delineation Manual: Northcentral and Northeast Region. The wetland report titled “Wetland Identification and Delineation Report” dated September 10, 2014 further describes the methodology used to determine the presence or absence of wetlands and watercourses. The investigation was completed and conducted by a wetland scientist and qualified soil scientist in accordance with the United States Department of Agriculture Soil Survey Manual (1993). The September 2014 Report states, “Vegetation, soils, and hydrology were observed and documented during the site investigation in order to meet the criteria of state and federal delineation methodologies. Soil types were identified by observing soil morphology (soil texture, color, structure, etc.). To observe the morphology of the soils, numerous test pits and/or hand borings (generally to a depth of at least two feet) are completed. If wetland and/or watercourses were determined to be present, their boundaries were identified with flags hung from vegetation or stakes. These flags are labeled “Wetland Boundary” and are generally spaced a maximum of approximately 50 feet apart. It is important to note that flagged wetland and watercourse boundaries are subject to verification by regulatory agencies.”
Interrogatory CSC-III-2 The United Illuminating Company Witness: Raina Huebner Bohdan Katreczko Petition 1120 Page 1 of 1
Q-CSC-III-2: Were soil augerings performed to assess the wet area located on the north side
of the proposed substation expansion area? If yes, please provide field test data. If no, please provide the rationale used to arrive at such a decision.
A-CSC-III-2: Yes, numerous hand augers were taken in the field, both during the initial
September field visit and also again on April 14, 2015. Soil hand auger pits were performed to determine the wetland boundary located on the north side of the existing substation. No data sheets were generated for the wet area located on UI property as the area was determined non-wetland through field investigation of soils, hydrology and vegetation in accordance with USDA Soil Survey Manual and the Regional Supplement to the Corps of Engineers Wetland Delineation Manual: Northcentral and Northeast Region.
Interrogatory CSC-III-3 The United Illuminating Company Witness: Raina Huebner Bohdan Katreczko Petition 1120 Page 1 of 1 Q-CSC-III-3: How was the determination reached that the onsite wet area is not a wetland or
intermittent watercourse? How does that reconcile with what was observed in the field on March 31, 2015 including presence of standing/seeping water, saturated soils, and the condition of tree trunks and roots that indicate seasonal saturation of the soil?
A-CSC-III-3: The onsite wet area was investigated during the September 5, 2014 field visit.
Hand auger pits were performed at that time and it was determined the soil value and chroma did not meet hydric soil criteria as defined in USDA Soil Survey Manual and the Regional Supplement to the Corps of Engineers Wetland Delineation Manual: Northcentral and Northeast Region. As stated in CSC-III-2, if an area was determined to be non-wetland, an ACOE data sheet is not generated.
This area was reinvestigated on April 14, 2015. Although surface water, seeps and buttressed Red maple tree trunks were present in this area, soils investigations confirmed initial findings in September 2014 that soil value and chroma in this area did not meet the hydric soils criteria. Red Maples, although present, were located along the outside perimeter of the “wet area” in question. Red maples are a facultative species and are opportunistic, inhabiting a range of soils and hydrologic conditions. Overall, all three parameters for the area to be considered a federal wetland were not met. In regards to the intermittent watercourse criteria, the area contained no defined bed and bank, and no evidence of scour or deposition or accumulated detritus. Therefore, neither the federal or state wetland criterion were met, nor were the criteria for an intermittent watercourse.
Interrogatory CSC-III-4 The United Illuminating Company Witness: Matthew Cloud Ron Rossetti Petition 1120 Page 1 of 1 Q-CSC-III-4: How does the wet area, whether or not it is classified as a wetland, affect the
plan to install fill? Are the soils sufficiently stable enough to accommodate the weight of the proposed fill and new substation equipment?
A-CSC-III-4: The area in question will not affect the plan to install fill at the site as the existing
soil in the expansion area will have a negligible impact from a general grading standpoint. During preliminary design the soils are assumed to have adequate stability, but a Geotechnical Engineer will perform a stability analysis on the soil within the substation expansion area during the detail design phase of the project to determine whether modifications to the foundation are required.
Interrogatory CSC-III-5 The United Illuminating Company Witness: Raina Huebner Bohdan Katreczko Petition 1120 Page 1 of 1 Q-CSC-III-5: If the wet area is classified as a wetland, would filling require an Army Corp of
Engineers permit? A-CSC-III-5: The wet area is not a wetland and therefore does not require an ACOE permit.

Interrogatory CSC-III-6 The United Illuminating Company Witness: Raina Huebner Bohdan Katreczko Petition 1120 Page 1 of 1 Q-CSC-III-6: Does the wet area extend to the northeast, connecting to the previously
delineated wetland on the adjacent GE property? How does the proposed filling of the wet area affect storm water run-off to this delineated wetland?
A-CSC-III-6: The area in question appears to contribute to the hydrology of the delineated
wetland during certain times of the year, however, it is important to note that no evidence of such hydraulic inputs were present during the wetland delineation. Therefore, there only appears to be a seasonal connection between these two areas.
The storm water pollution control plan specifies use of erosion control blankets and sedimentation barriers that will be used to minimize any adverse impacts associated with stormwater runoff. No adverse impacts due to stormwater runoff are anticipated long-term, and short term impacts will be avoided and minimized via the use of proper erosion and sedimentation controls identified in the Project’s stormwater pollution control plan approved by DEEP.
Interrogatory CSC-III-7 The United Illuminating Company Witness: Dennis Quinn Bohdan Katreczko Petition 1120 Page 1 of 1 Q-CSC-III-7: If the previously delineated wetland is a vernal pool, is filling and disturbance
occurring within the 100-foot vernal pool envelope? A-CSC-III-7: The previously delineated wetland is not a vernal pool. See Attachment CSC-III-
7, Assessment for the Presence of Vernal Pool Breeding Amphibians.
Interrogatory CSC-III-8 The United Illuminating Company Witness: Dennis Quinn Bohdan Katreczko Petition 1120 Page 1 of 1 Q-CSC-III-8: If the previously delineated wetland is a vernal pool, how does the proposed
project affect the critical upland terrestrial habitat (100-750 feet) of the vernal pool?
A-CSC-III-8: Please see UI’s response to Interrogatory CSC-III-7.
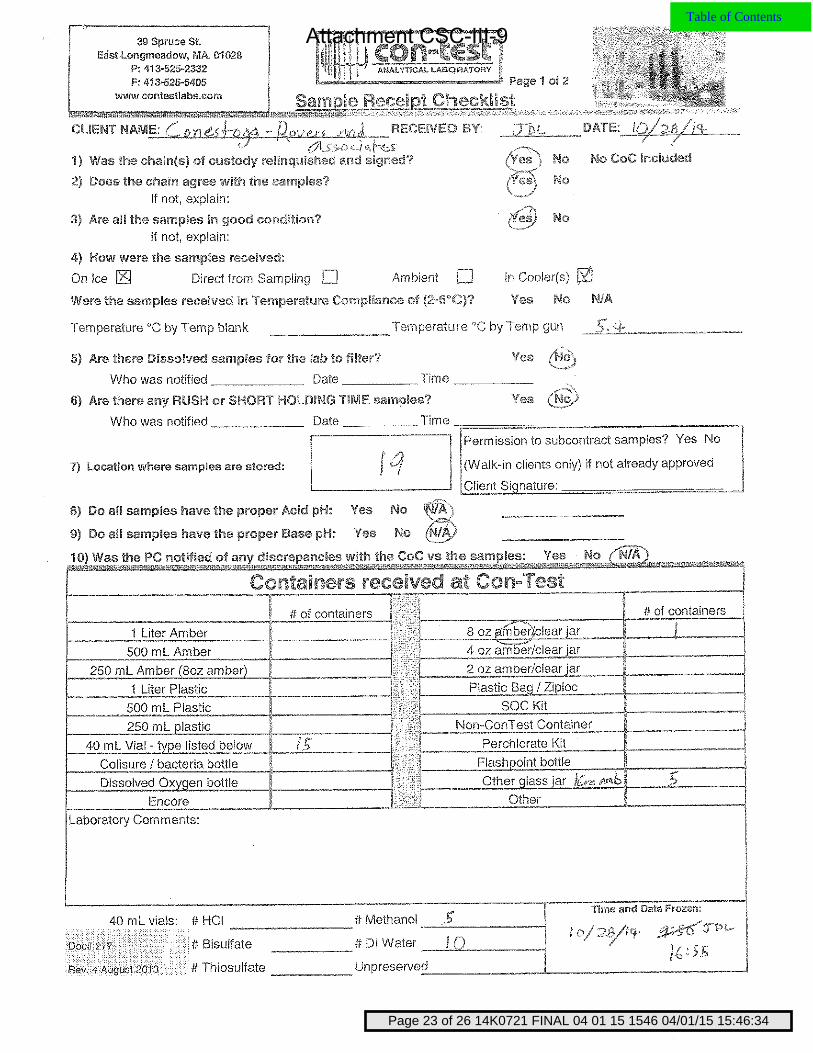
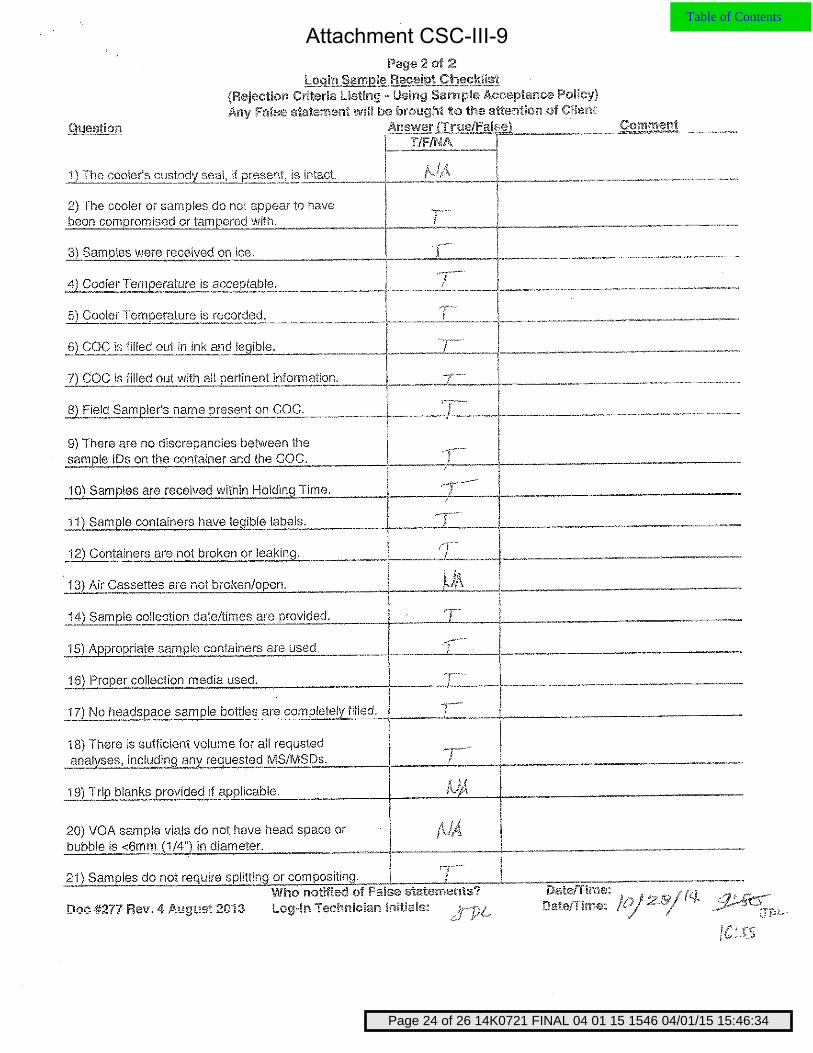
Interrogatory CSC-III-9 The United Illuminating Company Witness: Bohdan Katreczko Petition 1120 Page 1 of 1 Q-CSC-III-9: In regards to the Response to Town of Fairfield Interrogatories, dated March 16,
2015, Response 3 - Phase II Environmental Assessment, please clarify the Chain of Custody information on the last page of the document - items 1A and 5B, as discussed at the March 31, 2015 hearing.
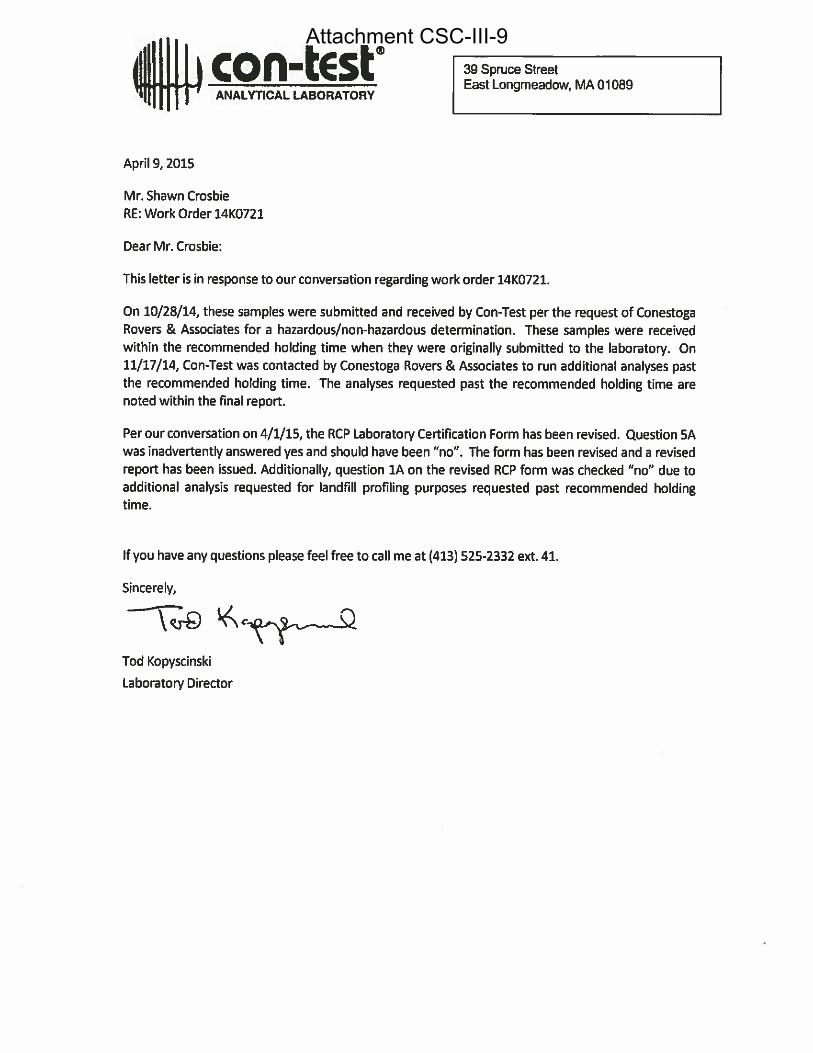
A-CSC-III-9: On October 28, 2014, the original soil samples were submitted to and received
by Con-Test Analytical Laboratory, meeting method-specified preservation and holding time requirements. This initial round of constituents included: VOCs, SVOCs, PCBs, Total & RCRA 8 Metals, and Pesticide/Herbicide. Both the original Chain of Custody Record and the primary Reasonable Confidence Protocol (RCP) Laboratory Analysis QA/QC Certification Form associated with these samples were filled out properly. These are found within the Phase II Environmental Site Assessment report.
The secondary RCP Laboratory Analysis QA/QC Certification Form on the last page of the Phase II Environmental Site Assessment is specific only to the RCP methods (e.g. ETPH) used for additional analyses that were requested on November 17, 2014 from the original samples. The reason that Con-Test checked “No” in question 1-A is because this additional analysis - for landfill profiling purposes only - was requested after the recommended holding time had passed. It was also determined that Con-Test inadvertently answered “Yes” to question 5A when it should have been “No”. This secondary RCP Laboratory Certification Form has been revised and a revised laboratory report was re-issued April 1, 2015. See Attachment CSC-III-9, Clarification to Response 3 – Phase II Environmental Assessment.
Interrogatory CSC-III-10 The United Illuminating Company Witness: Amy Williams Petition 1120 Page 1 of 1 Q-CSC-III-10: At the March 31, 2015 hearing, UI offered to submit a revised version of the
Electric and Magnetic Field Assessment: The Hawthorne Substation prepared by Exponent that does not contain Critical Energy Infrastructure Information (CEII) Please submit a revised version or a summary of findings that does not contain CEII.
A-CSC-III-10: See Attachment CSC-III-10, CEII Compliant EMF Assessment.
Hawthorne Substation 180 Hawthorne Drive, Fairfield, Connecticut
Connecticut Siting Council Petition No. 1120
Assessment for the Presence of Vernal Pool Breeding Amphibians
Prepared for: Prepared by: Dennis P. Quinn - Owner
180 Marsh Hill Rd. 40 Pine Street Orange, CT 06477 Plantsville, CT 06479
Attachment CSC-III-7
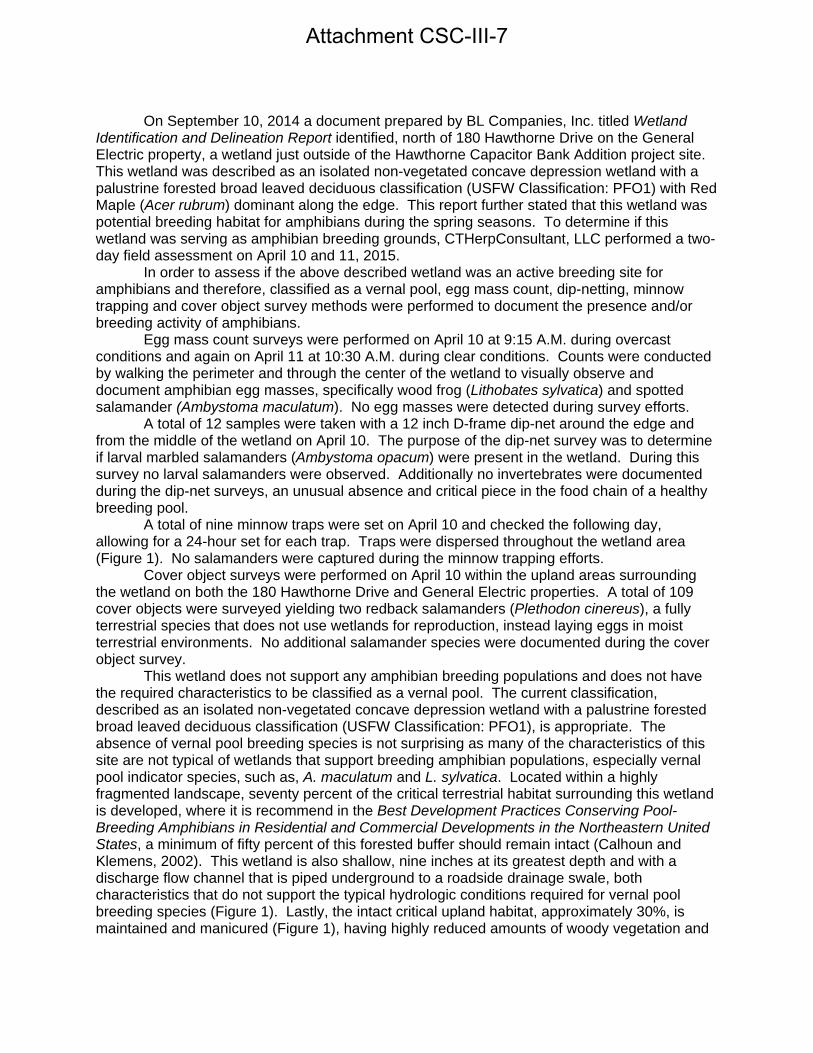
On September 10, 2014 a document prepared by BL Companies, Inc. titled Wetland Identification and Delineation Report identified, north of 180 Hawthorne Drive on the General Electric property, a wetland just outside of the Hawthorne Capacitor Bank Addition project site. This wetland was described as an isolated non-vegetated concave depression wetland with a palustrine forested broad leaved deciduous classification (USFW Classification: PFO1) with Red Maple (Acer rubrum) dominant along the edge. This report further stated that this wetland was potential breeding habitat for amphibians during the spring seasons. To determine if this wetland was serving as amphibian breeding grounds, CTHerpConsultant, LLC performed a two-day field assessment on April 10 and 11, 2015. In order to assess if the above described wetland was an active breeding site for amphibians and therefore, classified as a vernal pool, egg mass count, dip-netting, minnow trapping and cover object survey methods were performed to document the presence and/or breeding activity of amphibians. Egg mass count surveys were performed on April 10 at 9:15 A.M. during overcast conditions and again on April 11 at 10:30 A.M. during clear conditions. Counts were conducted by walking the perimeter and through the center of the wetland to visually observe and document amphibian egg masses, specifically wood frog (Lithobates sylvatica) and spotted salamander (Ambystoma maculatum). No egg masses were detected during survey efforts. A total of 12 samples were taken with a 12 inch D-frame dip-net around the edge and from the middle of the wetland on April 10. The purpose of the dip-net survey was to determine if larval marbled salamanders (Ambystoma opacum) were present in the wetland. During this survey no larval salamanders were observed. Additionally no invertebrates were documented during the dip-net surveys, an unusual absence and critical piece in the food chain of a healthy breeding pool. A total of nine minnow traps were set on April 10 and checked the following day, allowing for a 24-hour set for each trap. Traps were dispersed throughout the wetland area (Figure 1). No salamanders were captured during the minnow trapping efforts. Cover object surveys were performed on April 10 within the upland areas surrounding the wetland on both the 180 Hawthorne Drive and General Electric properties. A total of 109 cover objects were surveyed yielding two redback salamanders (Plethodon cinereus), a fully terrestrial species that does not use wetlands for reproduction, instead laying eggs in moist terrestrial environments. No additional salamander species were documented during the cover object survey. This wetland does not support any amphibian breeding populations and does not have the required characteristics to be classified as a vernal pool. The current classification, described as an isolated non-vegetated concave depression wetland with a palustrine forested broad leaved deciduous classification (USFW Classification: PFO1), is appropriate. The absence of vernal pool breeding species is not surprising as many of the characteristics of this site are not typical of wetlands that support breeding amphibian populations, especially vernal pool indicator species, such as, A. maculatum and L. sylvatica. Located within a highly fragmented landscape, seventy percent of the critical terrestrial habitat surrounding this wetland is developed, where it is recommend in the Best Development Practices Conserving Pool-Breeding Amphibians in Residential and Commercial Developments in the Northeastern United States, a minimum of fifty percent of this forested buffer should remain intact (Calhoun and Klemens, 2002). This wetland is also shallow, nine inches at its greatest depth and with a discharge flow channel that is piped underground to a roadside drainage swale, both characteristics that do not support the typical hydrologic conditions required for vernal pool breeding species (Figure 1). Lastly, the intact critical upland habitat, approximately 30%, is maintained and manicured (Figure 1), having highly reduced amounts of woody vegetation and
Attachment CSC-III-7
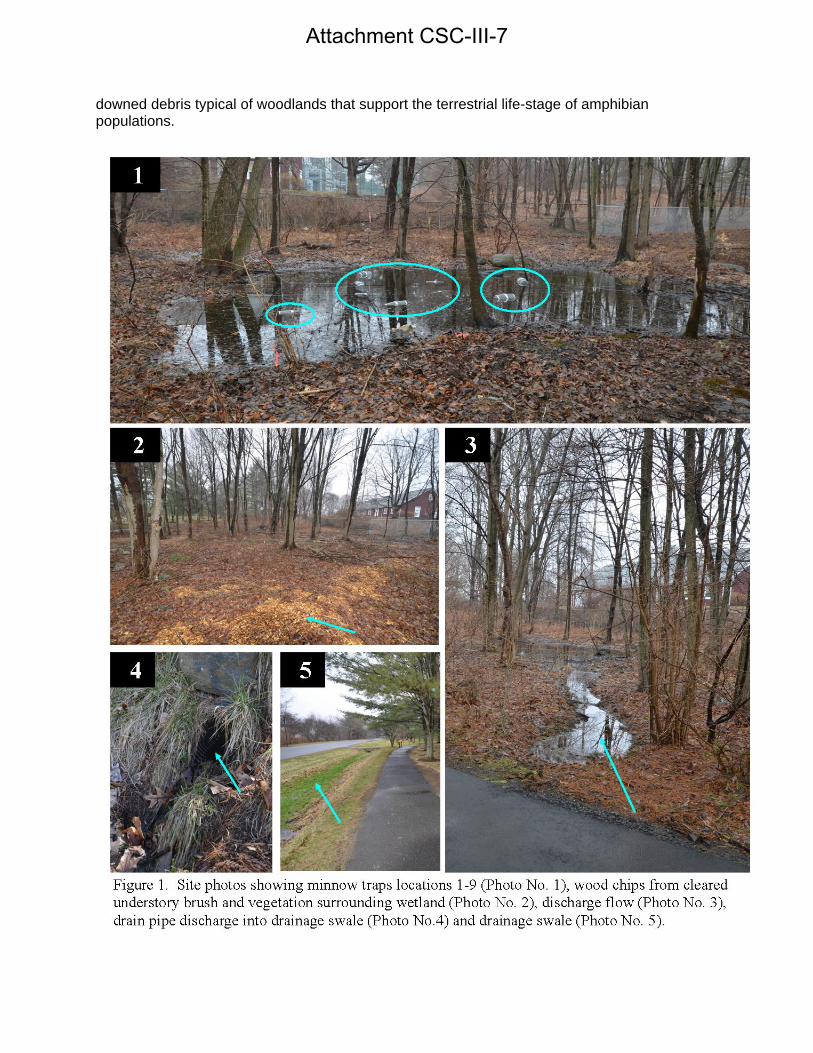
downed debris typical of woodlands that support the terrestrial life-stage of amphibian populations.
Attachment CSC-III-7

Literature Cited: Calhoun, A. J. K. and M, W. Klemens. 2002. Best development practices conserving pool-breeding amphibians in residential and commercial developments in the northeastern United States. MCA Technical Paper No. 5, Metropolitan Conservation Alliance, Wildlife Concervation Society, Bronx, New York.
Attachment CSC-III-7

EDUCATION
University of Massachusetts, Amherst, MA.
New England Regional Soil Science Certificate Program. (2014)
Central Connecticut State University (CCSU), New Britain, CT.
Masters in Ecology and Environmental Science. Thesis research: Radio-telemetry of eastern box turtles to determine home-range, habitat use and hibernacula selection in CT. (2008)
Bachelors in Biology with a concentration in Ecology, Biodiversity and Evolutionary Biology. (2002) PADI Certified Scuba Diver. (1999) EMPLOYMENT Owner – CTHerpConsultant, LLC. Plantsville, CT. (2007 – present) CTHerpConsultant, LLC was founded in 2007 to facilitate the pursuit and passion I have for reptile and amphibian research, conservation and preservation. A wide variety of ecological services are offered by my company, ranging from general wildlife and habitat characterization surveys, to detailed environmental impact assessments complete with land use planning, mitigation design and monitoring. I have worked directly with a variety of State and Federally threatened and endangered species, ranging from the bog turtle and spadefoot toad, to the slimy salamander. Currently, I am the consulting herpetologist for the CTDEEP where I coordinate state and northeast regional amphibian and reptile projects. Additionally, I am coordinating for the CTDEEP Regional Conservation and Competitive State Wildlife Grant Projects involving long-term wood turtle monitoring, leopard frog genetics and distribution and SFD prevalence in snakes across CT. Additional SFD sampling is taking place with the Roger Williams Park Zoo to investigate the rate of occurrence, effect and cause of Snake Fungal Disease (SFD) in timber rattlesnake populations across the northeast. Clients: CT Department of Energy and Environmental Protection CT Department of Transportation Farmington River Watershed Association Fitzgerald & Halliday, Inc. Michael W. Klemens, LLC
O & G Industries, Inc. Parsons Corporation Regional Water Authority Simsbury Land Trust Wildlife Management Institute
Creator and maintainer of www.ctherpetolgy.com: A photographic atlas to the amphibians and reptiles of Connecticut. Wildlife Photographer – photographs can be viewed at www.dennisquinnphotography.com Associate Scientist, Parsons Corporation East Berlin, CT. (2005 - 2007)
Radio-telemetric study of eastern box turtles and eastern hog-nosed snakes for ConnDOT CT Route 7 Bypass. Responsible for data collection, terrestrial mitigation design, assist with culvert design and placement, data analysis, and report preparation.
Northern slimy salamander presence/absence survey for ConnDOT CT Route 7 Bypass. Responsibilities included field surveys and assist in report preparation.
Environmental Scientist, Maguire Group Inc. New Britain, CT. (2005) Field surveys for proposed Route 11 corridor and assisted in preparation of the environmental impact statement. Impact Assessment for emergency by-pass pipeline, data analysis, technical writing and mitigation planning.
Herpetological Field Surveyor, Farmington River Watershed and Wildlife Conservation Society (2002)
Surveyed local reptile and amphibian populations throughout the Farmington River Valley. Identification, data collection, photography.
EMPLOYMENT IN EDUCATION Adjunct Instructor, Naugatuck Valley Community College Waterbury, CT. (2004 - present) Courses Taught: Bio 105 Introductory Biology - Lec/Lab Bio 171 Field Biology - Lec/Lab
Bio 145 General Zoology - Lec/Lab
Dennis P. Quinn 40 Pine Street Plantsville, CT 06479 Phone: (203) 430-7830 E-mail: [email protected]
Attachment CSC-III-7
Technical Advisor, CCSU New Britain, CT. (2011 - present) Serve as a technical research advisor to undergraduate and graduate students working on research in the field of
herpetology. Graduate Thesis Committee – serve as an expert external committee member for herpetological theses.
Environmental Science Instructor, Post University Waterbury, CT. (2006)Courses Taught: Bio 134 General Biology - Lab Bio 200 Ecology - Lec
Env 200 Sustainable Development - Lec Env 230 Environmental Policy - Lec
Received honors for outstanding service to students in environmental science instruction. Graduate Teaching Assistant, CCSU New Britain, CT. (2003) Courses Taught: Bio 121 General Biology I - Lab Bio 202 Principles of Ecology and Evolution - Lab
PUBLICATIONS
Gruner, H. and Quinn, D. 2012. Project 18-113/129 U.S. Route 7 Bypass Brookfield, Connecticut, Slimy Salamander (Plethodon glutinosus) Ridge-wide Habitat Study, Kent to Bethel, Connecticut. Connecticut Department of Transportation, Newington, CT.
Quinn, D. 2011. The Timber Rattlesnake: A Modern Day Legend. Connecticut Wildlife. Volume 31, No. 1, Jan/Feb 2011.
Quinn, D. and Gruner, H. 2010. Project 18-113 U.S. Route 7 Bypass Brookfield, Connecticut, Eastern Box Turtle and Eastern Hog-nosed Snake Monitoring Report 2009. Connecticut Department of Transportation, Newington, CT.
Quinn, D. 2009. Project 131-190 Removal of Bridge No. 00518 and Intersection Improvements Route 10 and Route 322 Southington, Connecticut: Eastern Box Turtle and Wood Turtle Presence/Absence Surveys and Report. Connecticut Department of Transportation, Newington, CT.
Quinn, D. 2008. A radio-telemetric study of the Eastern Box Turtle (Terrapene carolina carolina) home range, habitat use, and hibernacula selection in Connecticut. M. Sc Thesis. Central Connecticut State University, New Britain, CT. 84 pp.
PRESENTATIONS, RADIO and VOLUNTEER WORK Seminars:
WNPR Where We Live hosted by John Dankosky Everything You Want to Know About Turtles. (2014) WNPR An Atlas to Track Connecticut Critters that Slither, Hop and Crawl. (2014) UCONN Department of Pathobiology and Veterinary Science Seminar Series. CT Amphibians and Reptiles and thier
Conservation Challenges. (2014) CT Department of Energy and Environmental Protection. CT Salamanders and their Conservation Challenges. (2014) CT Department of Energy and Environmental Protection. Natural History of the Northern Copperhead. (2013) CT Department of Energy and Environmental Protection. Natural History of the Hog-nosed Snake. (2013) Simsbury Land Trust 25th Anniversary Celebration. Connecticut Reptiles and Amphibians. (2006) Biological Sciences Seminar Series. CCSU. Land Management and Conservation Strategies for the Reptiles and
Amphibians of the Farmington River Valley (2002)
Volunteer: Nutmeg Big Brothers Big Sisters. Big Brother Mentor. (2007 – 2010) Regional Water Authority. A Walk with Connecticut’s Reptiles and Amphibians. Pine Hill Recreational Area. (2010) Connecticut Bio Blitz.
Keney Park and Goodwin College. Hartford, CT. (2009) Wilbert Snow School. Middletown, CT. (2007) Two Rivers Magnet School. East Hartford, CT. (2005)
Wethersfield Nature Center. Reptile Day. Gave interactive talk with school children on reptiles and amphibians. (2005) Simsbury Land Trust. Educational walk on vernal pools and the fauna that depend on them for survival. (2003, 2004 & 2005) COMPUTER EXPERIENCE Microsoft Office: Word, Excel, Access, Power Point; PC-ORD, ArcGIS, Graphical Analysis, Sigma Plot, Adobe Photoshop.
Attachment CSC-III-7
AWARDS and HONORS Leeds M. Carluccio Award: For outstanding student service and leadership in Biological Sciences (2002) Member Tri-beta National Honor Society (2002) REFERENCES Dr. Michael Klemens. Research Associate in Herpetology. American Museum of Natural History. [email protected].
(203) 448-8068. New York, NY 10024
Hank Gruner, Vice President of Programs. Connecticut Science Center, Hartford, CT. 06106. [email protected]
(860) 712-1308.
Dr. Barbra Nicholson, Professor. Central Connecticut State University, New Britain, CT. 06050. [email protected].
(860) 832-2706.
Cynthia Donaldson, Naugatuck Valley Community College, Waterbury, CT. 06708.
[email protected] (203) 596-8703.
Attachment CSC-III-7
Attachment CSC-III-9
39 Spruce Street * East Longmeadow, MA 01028 * FAX 413/525-6405 * TEL. 413/525-2332
April 1, 2015
Kathy Shaw - CRA
United Illuminating Company
180 Marsh Hill Road
Orange, CT 06477
Project Location: Hawthorne Substation Phase II - Fairfield, CT
Client Job Number:
Project Number: 086111-001
Laboratory Work Order Number: 14K0721
Enclosed are results of analyses for samples received by the laboratory on November 17, 2014. If you have any questions
concerning this report, please feel free to contact me.
Sincerely,
James M. Georgantas
Project Manager
Page 1 of 26 14K0721 FINAL 04 01 15 1546 04/01/15 15:46:34
Table of Contents
Attachment CSC-III-9

Table of Contents
Sample Summary 3
Case Narrative 4
Sample Results 5
14K0721-01 5
14K0721-02 7
14K0721-03 9
14K0721-04 11
14K0721-05 13
Sample Preparation Information 15
QC Data 17
Petroleum Hydrocarbons Analyses 17
B110040 17
Conventional Chemistry Parameters by EPA/APHA/SW-846 Methods (Total) 18
B109943 18
B109968 18
B109971 18
B109973 18
B109991 18
B110298 19
Flag/Qualifier Summary 20
Certifications 21
Chain of Custody/Sample Receipt 22
Page 2 of 26 14K0721 FINAL 04 01 15 1546 04/01/15 15:46:34
Table of Contents
Attachment CSC-III-9
39 Spruce Street * East Longmeadow, MA 01028 * FAX 413/525-6405 * TEL. 413/525-2332
ANALYTICAL SUMMARY
4/1/2015
United Illuminating Company
180 Marsh Hill Road
Orange, CT 06477
ATTN: Kathy Shaw - CRA
086111-001
14K0721
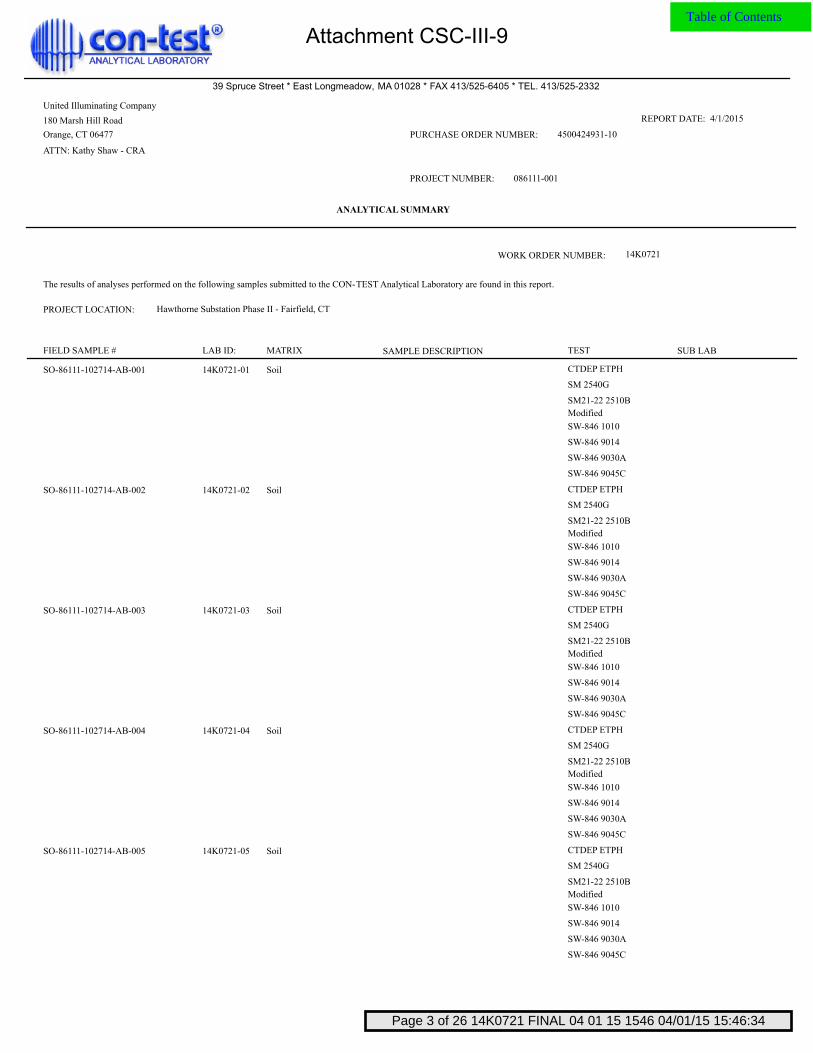
The results of analyses performed on the following samples submitted to the CON-TEST Analytical Laboratory are found in this report.
PROJECT LOCATION:
PURCHASE ORDER NUMBER:
PROJECT NUMBER:
REPORT DATE:
WORK ORDER NUMBER:
FIELD SAMPLE # LAB ID: MATRIX TESTSAMPLE DESCRIPTION SUB LAB
Hawthorne Substation Phase II - Fairfield, CT
4500424931-10
SO-86111-102714-AB-001 14K0721-01 Soil CTDEP ETPH
SM 2540G
SM21-22 2510B
Modified
SW-846 1010
SW-846 9014
SW-846 9030A
SW-846 9045C
SO-86111-102714-AB-002 14K0721-02 Soil CTDEP ETPH
SM 2540G
SM21-22 2510B
Modified
SW-846 1010
SW-846 9014
SW-846 9030A
SW-846 9045C
SO-86111-102714-AB-003 14K0721-03 Soil CTDEP ETPH
SM 2540G
SM21-22 2510B
Modified
SW-846 1010
SW-846 9014
SW-846 9030A
SW-846 9045C
SO-86111-102714-AB-004 14K0721-04 Soil CTDEP ETPH
SM 2540G
SM21-22 2510B
Modified
SW-846 1010
SW-846 9014
SW-846 9030A
SW-846 9045C
SO-86111-102714-AB-005 14K0721-05 Soil CTDEP ETPH
SM 2540G
SM21-22 2510B
Modified
SW-846 1010
SW-846 9014
SW-846 9030A
SW-846 9045C
[TOC_1]Sample Summary[TOC]
Page 3 of 26 14K0721 FINAL 04 01 15 1546 04/01/15 15:46:34
Table of Contents
Attachment CSC-III-9
39 Spruce Street * East Longmeadow, MA 01028 * FAX 413/525-6405 * TEL. 413/525-2332
CASE NARRATIVE SUMMARY
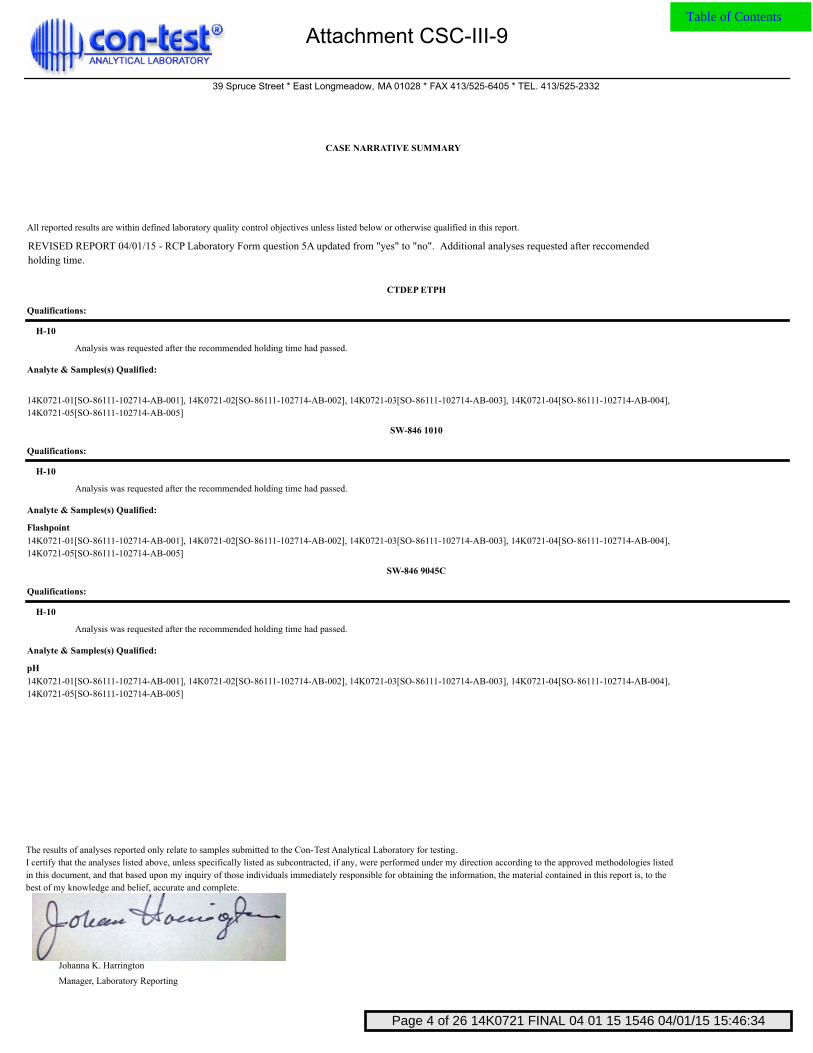
All reported results are within defined laboratory quality control objectives unless listed below or otherwise qualified in this report.
REVISED REPORT 04/01/15 - RCP Laboratory Form question 5A updated from "yes" to "no". Additional analyses requested after reccomended
holding time.
[TOC_1]Case Narrative[TOC]
CTDEP ETPH
Qualifications:
Analysis was requested after the recommended holding time had passed.
Analyte & Samples(s) Qualified:
H-10
14K0721-01[SO-86111-102714-AB-001], 14K0721-02[SO-86111-102714-AB-002], 14K0721-03[SO-86111-102714-AB-003], 14K0721-04[SO-86111-102714-AB-004],
14K0721-05[SO-86111-102714-AB-005]
SW-846 1010
Qualifications:
Analysis was requested after the recommended holding time had passed.
Analyte & Samples(s) Qualified:
H-10
Flashpoint
14K0721-01[SO-86111-102714-AB-001], 14K0721-02[SO-86111-102714-AB-002], 14K0721-03[SO-86111-102714-AB-003], 14K0721-04[SO-86111-102714-AB-004],
14K0721-05[SO-86111-102714-AB-005]
SW-846 9045C
Qualifications:
Analysis was requested after the recommended holding time had passed.
Analyte & Samples(s) Qualified:
H-10
pH
14K0721-01[SO-86111-102714-AB-001], 14K0721-02[SO-86111-102714-AB-002], 14K0721-03[SO-86111-102714-AB-003], 14K0721-04[SO-86111-102714-AB-004],
14K0721-05[SO-86111-102714-AB-005]
The results of analyses reported only relate to samples submitted to the Con-Test Analytical Laboratory for testing.
I certify that the analyses listed above, unless specifically listed as subcontracted, if any, were performed under my direction according to the approved methodologies listed
in this document, and that based upon my inquiry of those individuals immediately responsible for obtaining the information, the material contained in this report is, to the
best of my knowledge and belief, accurate and complete.
Johanna K. Harrington
Manager, Laboratory Reporting
Page 4 of 26 14K0721 FINAL 04 01 15 1546 04/01/15 15:46:34
Table of Contents
Attachment CSC-III-9

39 Spruce Street * East Longmeadow, MA 01028 * FAX 413/525-6405 * TEL. 413/525-2332
Date Received: 11/17/2014
Work Order: 14K0721Sample Description:Project Location: Hawthorne Substation Phase II - F
Sample ID: 14K0721-01
Field Sample #: SO-86111-102714-AB-001
Sample Matrix: Soil
Sampled: 10/27/2014 09:15
[TOC_2]14K0721-01[TOC]
AnalystAnalyzedDilution Flag/QualRLResultsAnalyte
Date/Time
Units
Date
PreparedMethod
Sample Flags: H-10 Petroleum Hydrocarbons Analyses
ND 11 11/19/14 15:09 SCSmg/Kg dry 11/18/14CTDEP ETPH1CT ETPH
Surrogates % Recovery Recovery Limits Flag/Qual
o-Terphenyl 61.9 11/19/14 15:0950-150
[TOC_1]Sample Results[TOC]
Page 5 of 26 14K0721 FINAL 04 01 15 1546 04/01/15 15:46:34
Table of Contents
Attachment CSC-III-9
39 Spruce Street * East Longmeadow, MA 01028 * FAX 413/525-6405 * TEL. 413/525-2332
Date Received: 11/17/2014
Work Order: 14K0721Sample Description:Project Location: Hawthorne Substation Phase II - F
Sample ID: 14K0721-01
Field Sample #: SO-86111-102714-AB-001
Sample Matrix: Soil
Sampled: 10/27/2014 09:15
AnalystAnalyzedDilution Flag/QualRLResultsAnalyte
Date/Time
Units
Date
PreparedMethod
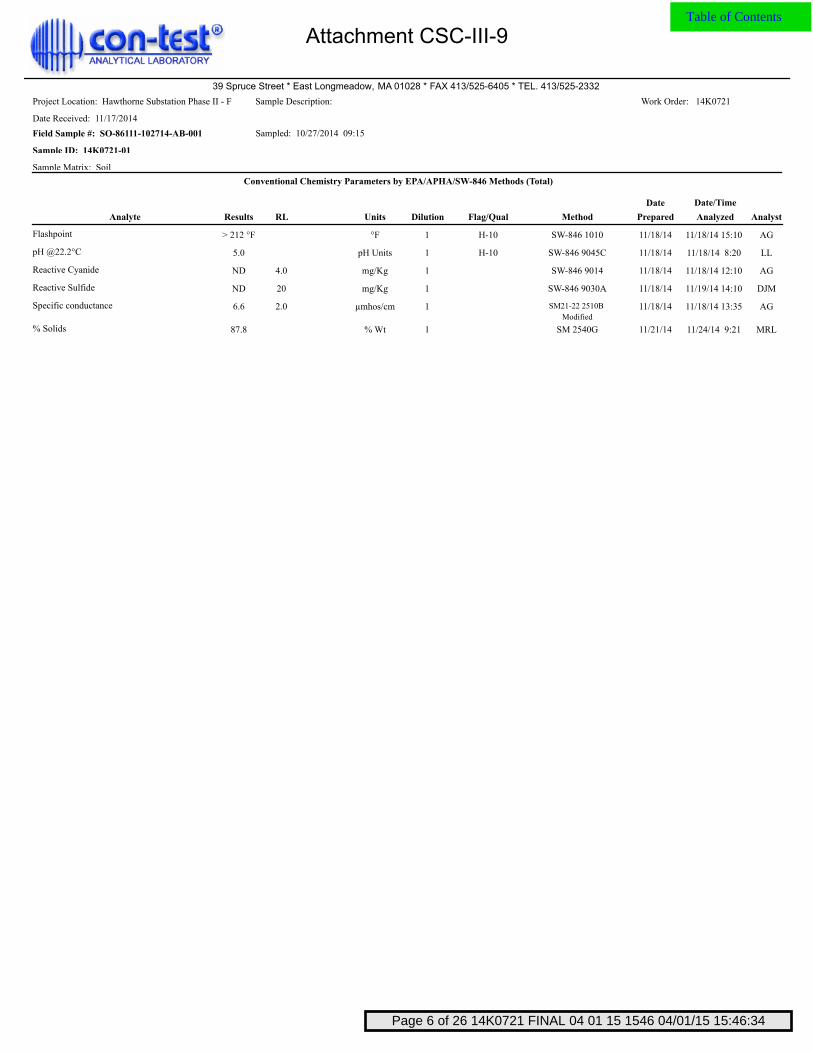
Conventional Chemistry Parameters by EPA/APHA/SW-846 Methods (Total)
> 212 °F 11/18/14 15:10 AG°F 11/18/14SW-846 10101 H-10Flashpoint
5.0 11/18/14 8:20 LLpH Units 11/18/14SW-846 9045C1 H-10pH @22.2°C
ND 4.0 11/18/14 12:10 AGmg/Kg 11/18/14SW-846 90141Reactive Cyanide
ND 20 11/19/14 14:10 DJMmg/Kg 11/18/14SW-846 9030A1Reactive Sulfide
6.6 2.0 11/18/14 13:35 AGµmhos/cm 11/18/14SM21-22 2510B
Modified
1Specific conductance
87.8 11/24/14 9:21 MRL% Wt 11/21/14SM 2540G1% Solids
Page 6 of 26 14K0721 FINAL 04 01 15 1546 04/01/15 15:46:34
Table of Contents
Attachment CSC-III-9

39 Spruce Street * East Longmeadow, MA 01028 * FAX 413/525-6405 * TEL. 413/525-2332
Date Received: 11/17/2014
Work Order: 14K0721Sample Description:Project Location: Hawthorne Substation Phase II - F
Sample ID: 14K0721-02
Field Sample #: SO-86111-102714-AB-002
Sample Matrix: Soil
Sampled: 10/27/2014 10:30
[TOC_2]14K0721-02[TOC]
AnalystAnalyzedDilution Flag/QualRLResultsAnalyte
Date/Time
Units
Date
PreparedMethod
Sample Flags: H-10 Petroleum Hydrocarbons Analyses
ND 10 11/19/14 15:27 SCSmg/Kg dry 11/18/14CTDEP ETPH1CT ETPH
Surrogates % Recovery Recovery Limits Flag/Qual
o-Terphenyl 70.6 11/19/14 15:2750-150
Page 7 of 26 14K0721 FINAL 04 01 15 1546 04/01/15 15:46:34
Table of Contents
Attachment CSC-III-9
39 Spruce Street * East Longmeadow, MA 01028 * FAX 413/525-6405 * TEL. 413/525-2332
Date Received: 11/17/2014
Work Order: 14K0721Sample Description:Project Location: Hawthorne Substation Phase II - F
Sample ID: 14K0721-02
Field Sample #: SO-86111-102714-AB-002
Sample Matrix: Soil
Sampled: 10/27/2014 10:30
AnalystAnalyzedDilution Flag/QualRLResultsAnalyte
Date/Time
Units
Date
PreparedMethod
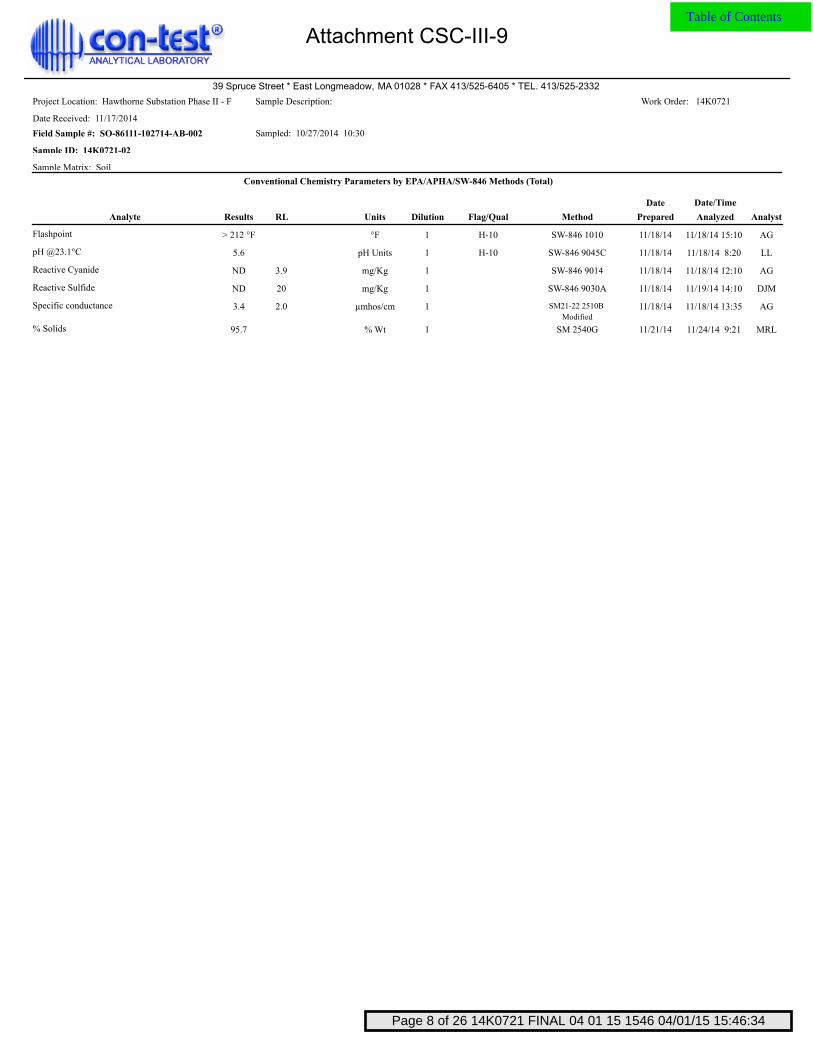
Conventional Chemistry Parameters by EPA/APHA/SW-846 Methods (Total)
> 212 °F 11/18/14 15:10 AG°F 11/18/14SW-846 10101 H-10Flashpoint
5.6 11/18/14 8:20 LLpH Units 11/18/14SW-846 9045C1 H-10pH @23.1°C
ND 3.9 11/18/14 12:10 AGmg/Kg 11/18/14SW-846 90141Reactive Cyanide
ND 20 11/19/14 14:10 DJMmg/Kg 11/18/14SW-846 9030A1Reactive Sulfide
3.4 2.0 11/18/14 13:35 AGµmhos/cm 11/18/14SM21-22 2510B
Modified
1Specific conductance
95.7 11/24/14 9:21 MRL% Wt 11/21/14SM 2540G1% Solids
Page 8 of 26 14K0721 FINAL 04 01 15 1546 04/01/15 15:46:34
Table of Contents
Attachment CSC-III-9

39 Spruce Street * East Longmeadow, MA 01028 * FAX 413/525-6405 * TEL. 413/525-2332
Date Received: 11/17/2014
Work Order: 14K0721Sample Description:Project Location: Hawthorne Substation Phase II - F
Sample ID: 14K0721-03
Field Sample #: SO-86111-102714-AB-003
Sample Matrix: Soil
Sampled: 10/27/2014 11:00
[TOC_2]14K0721-03[TOC]
AnalystAnalyzedDilution Flag/QualRLResultsAnalyte
Date/Time
Units
Date
PreparedMethod
Sample Flags: H-10 Petroleum Hydrocarbons Analyses
ND 10 11/19/14 15:44 SCSmg/Kg dry 11/18/14CTDEP ETPH1CT ETPH
Surrogates % Recovery Recovery Limits Flag/Qual
o-Terphenyl 82.5 11/19/14 15:4450-150
Page 9 of 26 14K0721 FINAL 04 01 15 1546 04/01/15 15:46:34
Table of Contents
Attachment CSC-III-9

39 Spruce Street * East Longmeadow, MA 01028 * FAX 413/525-6405 * TEL. 413/525-2332
Date Received: 11/17/2014
Work Order: 14K0721Sample Description:Project Location: Hawthorne Substation Phase II - F
Sample ID: 14K0721-03
Field Sample #: SO-86111-102714-AB-003
Sample Matrix: Soil
Sampled: 10/27/2014 11:00
AnalystAnalyzedDilution Flag/QualRLResultsAnalyte
Date/Time
Units
Date
PreparedMethod
Conventional Chemistry Parameters by EPA/APHA/SW-846 Methods (Total)
> 212 °F 11/18/14 15:10 AG°F 11/18/14SW-846 10101 H-10Flashpoint
5.6 11/18/14 8:20 LLpH Units 11/18/14SW-846 9045C1 H-10pH @25.9°C
ND 4.0 11/18/14 12:10 AGmg/Kg 11/18/14SW-846 90141Reactive Cyanide
ND 20 11/19/14 14:10 DJMmg/Kg 11/18/14SW-846 9030A1Reactive Sulfide
2.7 2.0 11/18/14 13:35 AGµmhos/cm 11/18/14SM21-22 2510B
Modified
1Specific conductance
98.4 11/24/14 9:21 MRL% Wt 11/21/14SM 2540G1% Solids
Page 10 of 26 14K0721 FINAL 04 01 15 1546 04/01/15 15:46:34
Table of Contents
Attachment CSC-III-9

39 Spruce Street * East Longmeadow, MA 01028 * FAX 413/525-6405 * TEL. 413/525-2332
Date Received: 11/17/2014
Work Order: 14K0721Sample Description:Project Location: Hawthorne Substation Phase II - F
Sample ID: 14K0721-04
Field Sample #: SO-86111-102714-AB-004
Sample Matrix: Soil
Sampled: 10/27/2014 11:25
[TOC_2]14K0721-04[TOC]
AnalystAnalyzedDilution Flag/QualRLResultsAnalyte
Date/Time
Units
Date
PreparedMethod
Sample Flags: H-10 Petroleum Hydrocarbons Analyses
24 11 11/19/14 16:02 SCSmg/Kg dry 11/18/14CTDEP ETPH1CT ETPH
Surrogates % Recovery Recovery Limits Flag/Qual
o-Terphenyl 75.6 11/19/14 16:0250-150
Page 11 of 26 14K0721 FINAL 04 01 15 1546 04/01/15 15:46:34
Table of Contents
Attachment CSC-III-9

39 Spruce Street * East Longmeadow, MA 01028 * FAX 413/525-6405 * TEL. 413/525-2332
Date Received: 11/17/2014
Work Order: 14K0721Sample Description:Project Location: Hawthorne Substation Phase II - F
Sample ID: 14K0721-04
Field Sample #: SO-86111-102714-AB-004
Sample Matrix: Soil
Sampled: 10/27/2014 11:25
AnalystAnalyzedDilution Flag/QualRLResultsAnalyte
Date/Time
Units
Date
PreparedMethod
Conventional Chemistry Parameters by EPA/APHA/SW-846 Methods (Total)
> 212 °F 11/18/14 15:10 AG°F 11/18/14SW-846 10101 H-10Flashpoint
5.7 11/18/14 8:20 LLpH Units 11/18/14SW-846 9045C1 H-10pH @23.5°C
ND 3.9 11/18/14 12:10 AGmg/Kg 11/18/14SW-846 90141Reactive Cyanide
ND 19 11/19/14 14:10 DJMmg/Kg 11/18/14SW-846 9030A1Reactive Sulfide
3.3 2.0 11/18/14 13:35 AGµmhos/cm 11/18/14SM21-22 2510B
Modified
1Specific conductance
93.3 11/24/14 9:21 MRL% Wt 11/21/14SM 2540G1% Solids
Page 12 of 26 14K0721 FINAL 04 01 15 1546 04/01/15 15:46:34
Table of Contents
Attachment CSC-III-9
39 Spruce Street * East Longmeadow, MA 01028 * FAX 413/525-6405 * TEL. 413/525-2332
Date Received: 11/17/2014
Work Order: 14K0721Sample Description:Project Location: Hawthorne Substation Phase II - F
Sample ID: 14K0721-05
Field Sample #: SO-86111-102714-AB-005
Sample Matrix: Soil
Sampled: 10/27/2014 12:30
[TOC_2]14K0721-05[TOC]
AnalystAnalyzedDilution Flag/QualRLResultsAnalyte
Date/Time
Units
Date
PreparedMethod
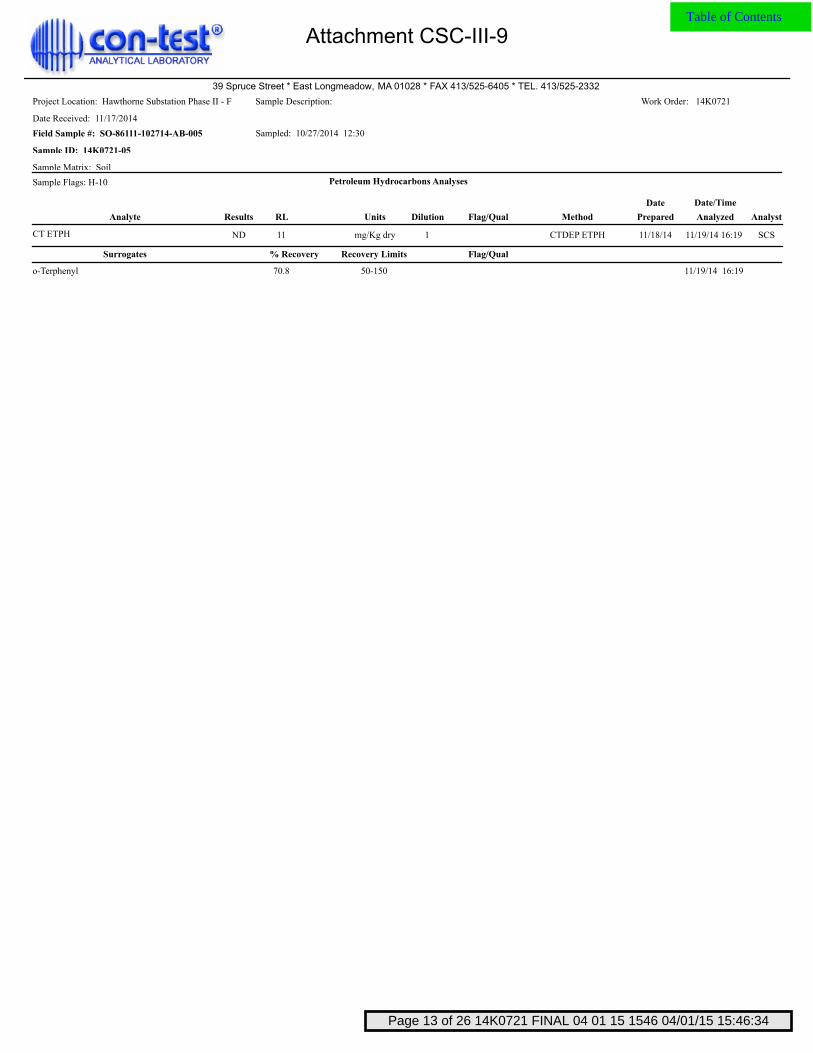
Sample Flags: H-10 Petroleum Hydrocarbons Analyses
ND 11 11/19/14 16:19 SCSmg/Kg dry 11/18/14CTDEP ETPH1CT ETPH
Surrogates % Recovery Recovery Limits Flag/Qual
o-Terphenyl 70.8 11/19/14 16:1950-150
Page 13 of 26 14K0721 FINAL 04 01 15 1546 04/01/15 15:46:34
Table of Contents
Attachment CSC-III-9

39 Spruce Street * East Longmeadow, MA 01028 * FAX 413/525-6405 * TEL. 413/525-2332
Date Received: 11/17/2014
Work Order: 14K0721Sample Description:Project Location: Hawthorne Substation Phase II - F
Sample ID: 14K0721-05
Field Sample #: SO-86111-102714-AB-005
Sample Matrix: Soil
Sampled: 10/27/2014 12:30
AnalystAnalyzedDilution Flag/QualRLResultsAnalyte
Date/Time
Units
Date
PreparedMethod
Conventional Chemistry Parameters by EPA/APHA/SW-846 Methods (Total)
> 212 °F 11/18/14 15:10 AG°F 11/18/14SW-846 10101 H-10Flashpoint
6.5 11/18/14 8:20 LLpH Units 11/18/14SW-846 9045C1 H-10pH @23.4°C
ND 3.9 11/18/14 12:10 AGmg/Kg 11/18/14SW-846 90141Reactive Cyanide
ND 20 11/19/14 14:10 DJMmg/Kg 11/18/14SW-846 9030A1Reactive Sulfide
2.7 2.0 11/18/14 13:35 AGµmhos/cm 11/18/14SM21-22 2510B
Modified
1Specific conductance
93.8 11/24/14 9:21 MRL% Wt 11/21/14SM 2540G1% Solids
Page 14 of 26 14K0721 FINAL 04 01 15 1546 04/01/15 15:46:34
Table of Contents
Attachment CSC-III-9

39 Spruce Street * East Longmeadow, MA 01028 * FAX 413/525-6405 * TEL. 413/525-2332
Sample Extraction Data
Prep Method: SW-846 3546-CTDEP ETPH
Lab Number [Field ID] Batch DateInitial [g] Final [mL]
B110040 11/18/1430.0 1.0014K0721-01 [SO-86111-102714-AB-001]
B110040 11/18/1430.0 1.0014K0721-02 [SO-86111-102714-AB-002]
B110040 11/18/1430.1 1.0014K0721-03 [SO-86111-102714-AB-003]
B110040 11/18/1430.0 1.0014K0721-04 [SO-86111-102714-AB-004]
B110040 11/18/1430.3 1.0014K0721-05 [SO-86111-102714-AB-005]
Prep Method: % Solids-SM 2540G
Lab Number [Field ID] Batch Date
B110298 11/21/1414K0721-01 [SO-86111-102714-AB-001]
B110298 11/21/1414K0721-02 [SO-86111-102714-AB-002]
B110298 11/21/1414K0721-03 [SO-86111-102714-AB-003]
B110298 11/21/1414K0721-04 [SO-86111-102714-AB-004]
B110298 11/21/1414K0721-05 [SO-86111-102714-AB-005]
SM21-22 2510B Modified
Lab Number [Field ID] Batch DateInitial [g]
B109968 11/18/141.0014K0721-01 [SO-86111-102714-AB-001]
B109968 11/18/141.0014K0721-02 [SO-86111-102714-AB-002]
B109968 11/18/141.0014K0721-03 [SO-86111-102714-AB-003]
B109968 11/18/141.0014K0721-04 [SO-86111-102714-AB-004]
B109968 11/18/141.0014K0721-05 [SO-86111-102714-AB-005]
SW-846 1010
Lab Number [Field ID] Batch DateInitial [g] Final [mL]
B109973 11/18/1450.0 50.014K0721-01 [SO-86111-102714-AB-001]
B109973 11/18/1450.0 50.014K0721-02 [SO-86111-102714-AB-002]
B109973 11/18/1450.0 50.014K0721-03 [SO-86111-102714-AB-003]
B109973 11/18/1450.0 50.014K0721-04 [SO-86111-102714-AB-004]
B109973 11/18/1450.0 50.014K0721-05 [SO-86111-102714-AB-005]
SW-846 9014
Lab Number [Field ID] Batch DateInitial [g] Final [mL]
B109971 11/18/1425.3 25014K0721-01 [SO-86111-102714-AB-001]
B109971 11/18/1425.4 25014K0721-02 [SO-86111-102714-AB-002]
B109971 11/18/1425.2 25014K0721-03 [SO-86111-102714-AB-003]
B109971 11/18/1426.0 25014K0721-04 [SO-86111-102714-AB-004]
B109971 11/18/1425.4 25014K0721-05 [SO-86111-102714-AB-005]
SW-846 9030A
Lab Number [Field ID] Batch DateInitial [g] Final [mL]
B109991 11/18/1425.3 25014K0721-01 [SO-86111-102714-AB-001]
B109991 11/18/1425.4 25014K0721-02 [SO-86111-102714-AB-002]
B109991 11/18/1425.2 25014K0721-03 [SO-86111-102714-AB-003]
B109991 11/18/1426.0 25014K0721-04 [SO-86111-102714-AB-004]
[TOC_1]Sample Preparation Information[TOC]
Page 15 of 26 14K0721 FINAL 04 01 15 1546 04/01/15 15:46:34
Table of Contents
Attachment CSC-III-9
39 Spruce Street * East Longmeadow, MA 01028 * FAX 413/525-6405 * TEL. 413/525-2332
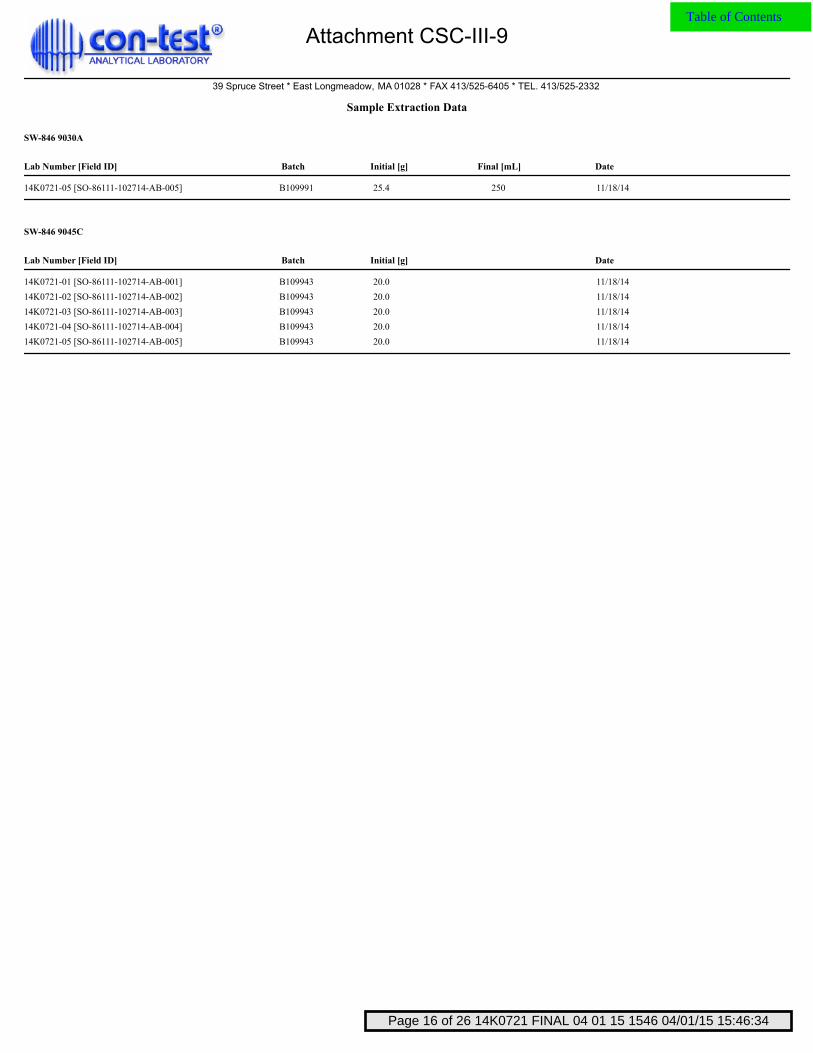
Sample Extraction Data
SW-846 9030A
Lab Number [Field ID] Batch DateInitial [g] Final [mL]
B109991 11/18/1425.4 25014K0721-05 [SO-86111-102714-AB-005]
SW-846 9045C
Lab Number [Field ID] Batch DateInitial [g]
B109943 11/18/1420.014K0721-01 [SO-86111-102714-AB-001]
B109943 11/18/1420.014K0721-02 [SO-86111-102714-AB-002]
B109943 11/18/1420.014K0721-03 [SO-86111-102714-AB-003]
B109943 11/18/1420.014K0721-04 [SO-86111-102714-AB-004]
B109943 11/18/1420.014K0721-05 [SO-86111-102714-AB-005]
Page 16 of 26 14K0721 FINAL 04 01 15 1546 04/01/15 15:46:34
Table of Contents
Attachment CSC-III-9

39 Spruce Street * East Longmeadow, MA 01028 * FAX 413/525-6405 * TEL. 413/525-2332
Result Limit
Reporting
Units Level
Spike
Result
Source
%REC
%REC
Limits RPD
RPD
Limit Notes Analyte
Petroleum Hydrocarbons Analyses - Quality Control
QUALITY CONTROL
[TOC_2]Petroleum Hydrocarbons Analyses[TOC]
Batch B110040 - SW-846 3546[TOC_3]B110040[TOC]
Blank (B110040-BLK1) Prepared: 11/18/14 Analyzed: 11/19/14
CT ETPH mg/Kg wet10ND
mg/Kg wet 3.33 50-150Surrogate: o-Terphenyl 81.52.72
LCS (B110040-BS1) Prepared: 11/18/14 Analyzed: 11/19/14
CT ETPH mg/Kg wet10 33.3 60-12075.825.3
mg/Kg wet 3.33 50-150Surrogate: o-Terphenyl 79.62.65
LCS Dup (B110040-BSD1) Prepared: 11/18/14 Analyzed: 11/19/14
CT ETPH mg/Kg wet10 33.3 3060-12080.1 5.4026.7
mg/Kg wet 3.33 50-150Surrogate: o-Terphenyl 90.13.00
[TOC_1]QC Data[TOC]
Page 17 of 26 14K0721 FINAL 04 01 15 1546 04/01/15 15:46:34
Table of Contents
Attachment CSC-III-9

39 Spruce Street * East Longmeadow, MA 01028 * FAX 413/525-6405 * TEL. 413/525-2332
Result Limit
Reporting
Units Level
Spike
Result
Source
%REC
%REC
Limits RPD
RPD
Limit Notes Analyte
Conventional Chemistry Parameters by EPA/APHA/SW-846 Methods (Total) - Quality Control
QUALITY CONTROL
[TOC_2]Conventional Chemistry Parameters by EPA/APHA/SW-846 Methods (Total)[TOC]
Batch B109943 - SW-846 9045C[TOC_3]B109943[TOC]
LCS (B109943-BS1) Prepared & Analyzed: 11/18/14
pH pH Units 6.00 98.5-1021016.04
Batch B109968 - SM21-22 2510B Modified[TOC_3]B109968[TOC]
Blank (B109968-BLK1) Prepared & Analyzed: 11/18/14
Specific conductance µmhos/cm2.0ND
LCS (B109968-BS1) Prepared & Analyzed: 11/18/14
Specific conductance µmhos/cm2.0 286 86.9-10695.8270
Duplicate (B109968-DUP1) Prepared & Analyzed: 11/18/14 Source: 14K0721-05
Specific conductance µmhos/cm2.0 24.720.03.3 2.7
Batch B109971 - SW-846 9014[TOC_3]B109971[TOC]
Blank (B109971-BLK1) Prepared & Analyzed: 11/18/14
Reactive Cyanide mg/Kg0.40ND
LCS (B109971-BS1) Prepared & Analyzed: 11/18/14
Reactive Cyanide mg/Kg0.40 10.0 81.3-11399.49.9
Batch B109973 - SW-846 1010[TOC_3]B109973[TOC]
Blank (B109973-BLK1) Prepared & Analyzed: 11/18/14
Flashpoint °F> 212 °F
LCS (B109973-BS1) Prepared & Analyzed: 11/18/14
Flashpoint °F 81.0 98.8-10110081
LCS Dup (B109973-BSD1) Prepared & Analyzed: 11/18/14
Flashpoint °F 81.0 0.26498.8-101100 0.0081
Batch B109991 - SW-846 9030A[TOC_3]B109991[TOC]
Blank (B109991-BLK1) Prepared: 11/18/14 Analyzed: 11/19/14
Reactive Sulfide mg/Kg2.0ND
LCS (B109991-BS1) Prepared: 11/18/14 Analyzed: 11/19/14
Reactive Sulfide mg/Kg2.0 14.8 24.3-13586.513
Page 18 of 26 14K0721 FINAL 04 01 15 1546 04/01/15 15:46:34
Table of Contents
Attachment CSC-III-9
39 Spruce Street * East Longmeadow, MA 01028 * FAX 413/525-6405 * TEL. 413/525-2332
Result Limit
Reporting
Units Level
Spike
Result
Source
%REC
%REC
Limits RPD
RPD
Limit Notes Analyte
Conventional Chemistry Parameters by EPA/APHA/SW-846 Methods (Total) - Quality Control
QUALITY CONTROL
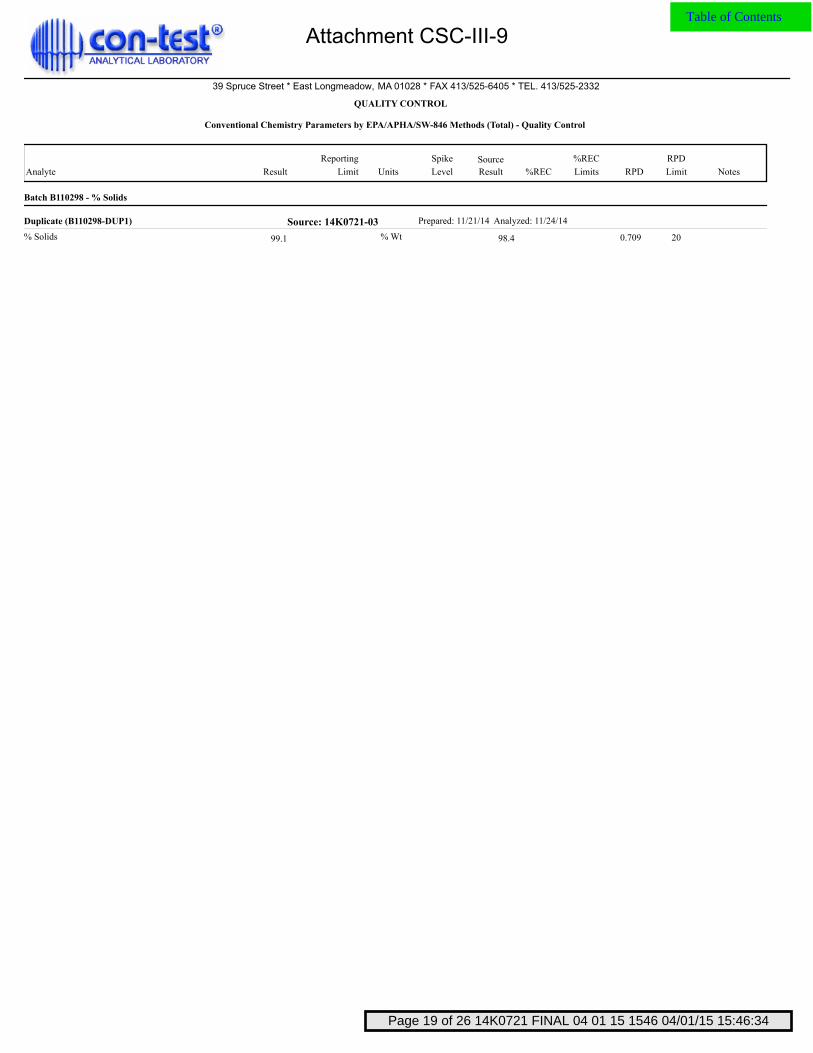
Batch B110298 - % Solids[TOC_3]B110298[TOC]
Duplicate (B110298-DUP1) Prepared: 11/21/14 Analyzed: 11/24/14 Source: 14K0721-03
% Solids % Wt 200.70999.1 98.4
Page 19 of 26 14K0721 FINAL 04 01 15 1546 04/01/15 15:46:34
Table of Contents
Attachment CSC-III-9

39 Spruce Street * East Longmeadow, MA 01028 * FAX 413/525-6405 * TEL. 413/525-2332
FLAG/QUALIFIER SUMMARY
* QC result is outside of established limits.
� Wide recovery limits established for difficult compound.
� Wide RPD limits established for difficult compound.
# Data exceeded client recommended or regulatory level
Percent recoveries and relative percent differences (RPDs) are determined by the software using values in the
calculation which have not been rounded.
No results have been blank subtracted unless specified in the case narrative section.
Analysis was requested after the recommended holding time had passed.H-10
[TOC_1]Flag/Qualifier Summary[TOC]
Page 20 of 26 14K0721 FINAL 04 01 15 1546 04/01/15 15:46:34
Table of Contents
Attachment CSC-III-9
39 Spruce Street * East Longmeadow, MA 01028 * FAX 413/525-6405 * TEL. 413/525-2332
CertificationsAnalyte
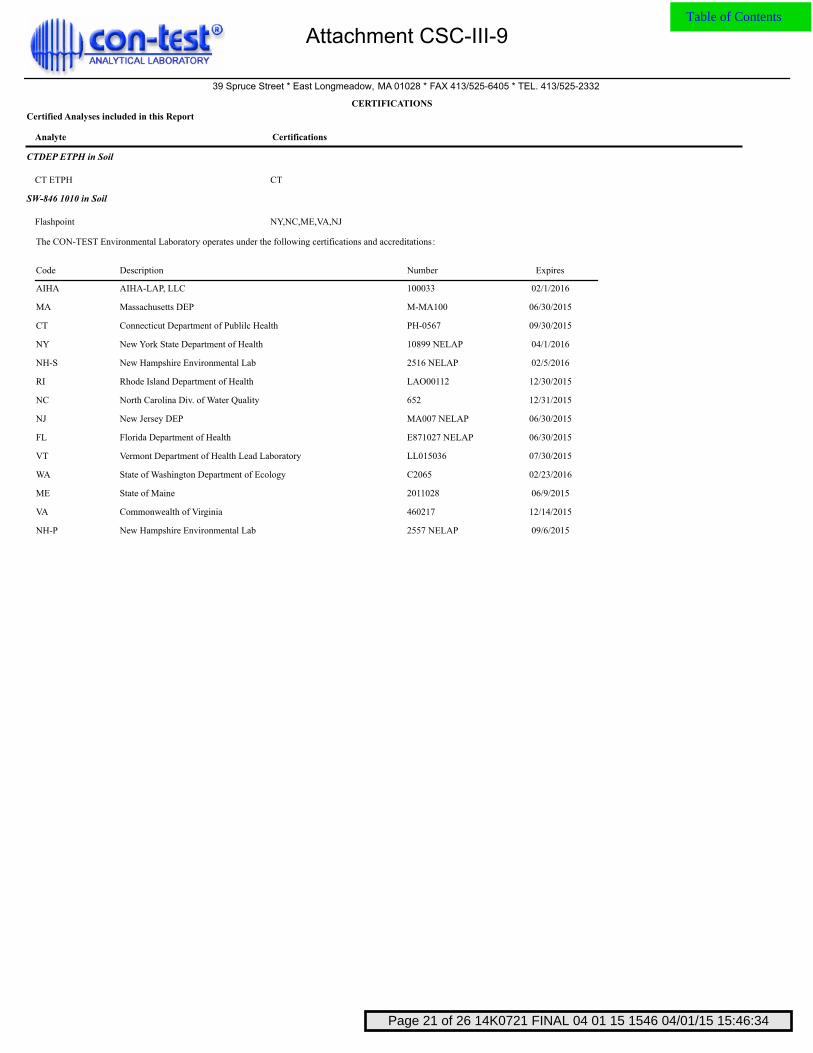
CERTIFICATIONS
Certified Analyses included in this Report
CTDEP ETPH in Soil
CTCT ETPH
SW-846 1010 in Soil
NY,NC,ME,VA,NJFlashpoint
[TOC_1]Certifications[TOC]
The CON-TEST Environmental Laboratory operates under the following certifications and accreditations:
Code Description Number Expires
100033AIHA-LAP, LLCAIHA 02/1/2016
M-MA100Massachusetts DEPMA 06/30/2015
PH-0567Connecticut Department of Publilc HealthCT 09/30/2015
10899 NELAPNew York State Department of HealthNY 04/1/2016
2516 NELAPNew Hampshire Environmental LabNH-S 02/5/2016
LAO00112Rhode Island Department of HealthRI 12/30/2015
652North Carolina Div. of Water QualityNC 12/31/2015
MA007 NELAPNew Jersey DEPNJ 06/30/2015
E871027 NELAPFlorida Department of HealthFL 06/30/2015
LL015036Vermont Department of Health Lead LaboratoryVT 07/30/2015
C2065State of Washington Department of EcologyWA 02/23/2016
2011028State of MaineME 06/9/2015
460217Commonwealth of VirginiaVA 12/14/2015
2557 NELAPNew Hampshire Environmental LabNH-P 09/6/2015
Page 21 of 26 14K0721 FINAL 04 01 15 1546 04/01/15 15:46:34
Table of Contents
Attachment CSC-III-9

Page 22 of 26 14K0721 FINAL 04 01 15 1546 04/01/15 15:46:34
Table of Contents
Attachment CSC-III-9
Page 23 of 26 14K0721 FINAL 04 01 15 1546 04/01/15 15:46:34
Table of Contents
Attachment CSC-III-9
Page 24 of 26 14K0721 FINAL 04 01 15 1546 04/01/15 15:46:34
Table of Contents
Attachment CSC-III-9
Page 25 of 26 14K0721 FINAL 04 01 15 1546 04/01/15 15:46:34
Table of Contents
Attachment CSC-III-9

REASONABLE CONFIDENCE PROTOCOL
LABORATORY ANALYSIS QA/QC CERTIFICATION FORM
Laboratory Name: Con-Test Analytical Laboratory United Illuminating CompanyClient:
Project Number:Project Location:
Laboratory Sample ID(s):
List RCP Methods Used:
14K0721
Sample Date(s):
14K0721-01 thru 14K0721-05 10/27/2014
CTDEP ETPH
Hawthorne Substation Phase II - Fairfield,
CT
ü 1Yes No
For each analytical method referenced in this laboratory report package, were all specified QA/QC
performance criteria followed, including the requirement to explain any criteria falling outside of
acceptable guidelines, as specified in the CTDEP method-specific Reasonable Confidence Protocol
documents?
ü1AYes No
Were the method specified preservation and holding time requirements met?
ü
1BYes No
N/AVPH and EPH Methods only: Was the VPH and EPH method conducted without significant
modifications (see Section 11.3 of respective RCP methods)?
ü 2Yes No
Were all samples received by the laboratory in a condition consistent with that described on the
associated chain-of-custody document(s)?
ü
3Yes No
N/AWere samples received at an appropriate temperature (< 6 degrees C.)?
ü 4Yes No
Were all QA/QC performance criteria specified in the CTDEP Reasonable Confidence Protocol
documents achieved?
ü5AYes No
Were reporting limits specified or referenced on the chain-of-custody?
5BYes No
Were these reporting limits met?
ü 6Yes No
For each analytical method referenced in this laboratory report package, were results reported for
all constituents identified in the method-specific analyte lists presented in the Reasonable
Confidence Protocol documents?
ü 7Yes No
Are project-specific matrix spikes and laboratory duplicates included in this data set?
Notes: For all questions to which the response was "No" (with the exception of question #7), additional information
must be provided in an attached narrative. If the answer to question #1, #1A, or #1B is "No", the data package does not
meet the requirements for "Reasonable Confidence."
This form may not be altered and all questions must be answered.
This certification form is to be used for RCP methods only.
I, the undersigned, attest under the pains and penalties of perjury that, to the best of my knowledge
and belief and based upon my personal inquiry of those responsible for providing the information
contained in this analytical report, such information is accurate and complete.
Authorized Signature: Position: Manager, Laboratory
Reporting
Printed Name: Johanna K. Harrington Date: 04/01/15
CTDEP RCP Laboratory Analysis QA/QC Certification Form - November 2007
Laboratory Quality Assurance and Quality Control Guidance Reasonable Confidence ProtocolsPage 26 of 26 14K0721 FINAL 04 01 15 1546 04/01/15 15:46:34
Table of Contents
Attachment CSC-III-9
Electric and Magnetic Field Assessment: The Hawthorne Substation
CEII Compliant Version
Attachment CSC-III-10

Electric and Magnetic Field Assessment: The Hawthorne Substation Prepared for The United Illuminating Company 180 Marsh Hill Rd. Orange, CT 06477 Prepared by Exponent 420 Lexington Ave. Suite 1740 New York, NY 10170 April 10, 2015 Exponent, Inc.
1501008.000 - 5483
Attachment CSC-III-10

Contents
Page
List of Figures ii
List of Tables iv
Notice v
Executive Summary vi
Existing and Proposed Configurations 8
Methods 13
Three-dimensional modeling 15
Two-dimensional modeling 17
Measurements 17
Loading 18
Results and Discussion 21
1501008.000 - 5483
Attachment CSC-III-10

List of Figures
Page
Figure 1. Simulated aerial view of the proposed Hawthorne 115 kV capacitor bank addition. 9
Figure 2. 115 kV transmission system diagram showing the proposed capacitor banks on the Line “C” terminal bus. THIS FIGURE CONTAINS CEII DATA AND HAS BEEN REMOVED. 9
Figure 3. Plan view of the proposed Hawthorne Substation, showing the existing and proposed substation perimeter and the location of calculated profiles. 10
Figure 4. Profile view of double-circuit monopole and dead-end structures X1 and X2. 12
Figure 5. Overview of the three-dimensional SUBCALC model used to calculate perimeter and perpendicular magnetic-field profiles for the existing configuration of the Hawthorne Substation. 16
Figure 6. Overview of the three-dimensional SUBCALC model used to calculate perimeter and perpendicular magnetic-field profiles for the proposed configuration of the Hawthorne Substation. 17
Figure 7. Calculated magnetic-field profiles around UI property line for average-load conditions in the year 2021. 27
Figure 8. Calculated magnetic-field profiles around UI property line for peak-load conditions in the year 2016. 28
Figure 9. Calculated magnetic-field profiles around proposed fence line of the Hawthorne Substation for average-load conditions in the year 2021. 29
Figure 10. Calculated magnetic-field profiles around proposed fence line of the Hawthorne Substation for peak-load conditions in the year 2016. 30
Figure 11. Calculated and measured magnetic-field levels along Profile 1. 31
Figure 12. Calculated and measured magnetic-field levels along Profile 2. 32
Figure 13. Calculated and measured magnetic-field levels along Profile 3. 33
Figure 14. Calculated and measured magnetic-field levels along Profile 4. 34
Figure 15. Calculated and measured magnetic-field levels along Profile 5. 35
Figure 16. Calculated and measured magnetic-field levels along Profile 6. 36
Figure 17. Calculated and measured magnetic-field levels along Profile 7. 37 ii
1501008.000 - 5483
Attachment CSC-III-10

Figure 18. Calculated and measured magnetic-field levels along Profile 8. 38
Figure 19. Calculated magnetic-field levels along Cross Section 1 for average-load conditions in 2021. 39
Figure 20. Calculated magnetic-field levels along Cross Section 2 for average-load conditions in 2021. 40
Figure 21. Calculated electric-field levels along Cross Section 1. 41
Figure 22. Calculated electric-field levels along Cross Section 2. 42
Figure 23. Location of electric field-measurements 43
iii 1501008.000 - 5483
Attachment CSC-III-10
List of Tables
Page
Table 1. ICNIRP and ICES guidelines for EMF exposure 14
Table 1. Circuit and equipment loading for average case in 2021 (Dispatch 4). THIS TABLE HAS BEEN EDITED TO REMOVE CEII DATA. 19
Table 2. Circuit and equipment loading for 90/10 peak load case in 2016 (Dispatch 4a). THIS TABLE HAS BEEN EDITED TO REMOVE CEII DATA. 19
Table 3. Summary of calculated magnetic fields for Profiles 1-8 for average load conditions in 2021 24
Table 4. Summary of calculated magnetic fields for Profiles 1-8 for peak load conditions in 2016 25
Table 5. Summary of calculated magnetic fields from existing “A” and “B” Lines for XS-1 and XS-2 26
Table 6. Summary of calculated electric fields for from existing “A” and “B” Lines for XS-1 and XS-2 26
Table 7. Summary of measured electric fields 44
iv 1501008.000 - 5483
Attachment CSC-III-10

Notice
At the request of The United Illuminating Company, Exponent modeled the electric and magnetic field associated with the addition of 115 kV capacitor banks at the Hawthorne Substation in Fairfield, Connecticut. This report summarizes work performed to date and presents the findings resulting from that work. In the analysis, we have relied on geometry, material data, usage conditions, specifications, and various other types of information provided by the client. We cannot verify the correctness of this input data, and rely on the client for the data’s accuracy. Although Exponent has exercised usual and customary care in the conduct of this analysis, the responsibility for the design and operation of the project remains fully with the client. The findings presented herein are made to a reasonable degree of engineering and scientific certainty. Exponent reserves the right to supplement this report and to expand or modify opinions based on review of additional material as it becomes available, through any additional work, or review of additional work performed by others. The scope of services performed during this investigation may not adequately address the needs of other users of this report, and any re-use of this report or its findings, conclusions, or recommendations presented herein are at the sole risk of the user. The opinions and comments formulated during this assessment are based on observations and information available at the time of the investigation. No guarantee or warranty as to future life or performance of any reviewed condition is expressed or implied. At the request of United Illuminating Exponent has removed references to specific line numbers and loadings, which United Illuminating regards as data for which distribution is restricted and subject to protection under the federal Critical Energy Infrastructure Information program.
v 1501008.000 - 5483
Attachment CSC-III-10

Executive Summary
The United Illuminating Company (UI) proposes to expand the Hawthorne Substation at 180 Hawthorne Drive in Fairfield, Connecticut. The proposed expansion includes installation of two capacitor banks on the west side of the substation and connected to the existing 115kV Transmission Line “A” that exits the substation to the south and proceeds west along the adjoining right-of-way (ROW).
At the UI property line, the calculated magnetic fields from the existing and proposed configurations of the Hawthorne Substation are nearly indistinguishable under future average and peak station loadings. The greatest change in the calculated magnetic field occurs on the south side of the property, beneath the conductors of the existing 115 kV Transmission Line “B” from the adjacent substation, to the east. At this location, the calculated magnetic field is 2 mG higher in the proposed configuration than in the existing configuration. This change reflects the small increase in average loading of the 115 kV line (Line “A” loading > Line “B” loading by 19 amperes) associated with operation of the Project. Under peak load conditions, the calculated magnetic field is 4 mG higher in the proposed configuration, again beneath the conductors of Line “B” and reflecting an increase of load from the adjacent substation(of only 40 amperes with the Project). The proposed changes to the substation yard include an expansion of the existing fence. Evaluated at the proposed perimeter, which is located well within the boundary of the UI property, the calculated magnetic fields for the existing and proposed configurations of the Hawthorne Substation differ by less than 1.0 mG at the majority of locations. The effect of the new capacitor bank and ancillary equipment is discernible on the west and south sides of the expanded substation perimeter. On the west side of the expanded perimeter, the calculated magnetic field is 4 mG to 7.2 mG higher at some locations, depending on whether one or two capacitors are in operation.
Moving away from the proposed perimeter, and again comparing existing and proposed configurations of the substation, the calculated magnetic fields are within 0.2 mG at distances of 150 feet or more from the new fence line (average loading). Under peak loading conditions, calculated magnetic fields are within 0.4 mG at these same locations. Along the ROW adjoining the Hawthorne Substation to the south, the post-Project magnetic field decreases slightly moving west from the substation, and increase slightly moving east from the substation. To the east, the calculated magnetic field levels increase by 1.8 mG directly beneath the conductors of the “B” Line at average loading. Moving west, the calculated magnetic field decreases by 1.4-2.7 mG with one or two capacitor banks online. These changes reflect the increase or decrease in loading of Lines “B” and “A”, respectively, associated with operation of the Project.
The highest calculated electric field modeled outside the substation fence is 0.91 kV/m directly beneath the phase conductors of the “B” and “A” Lines. The electric fields from
vi 1501008.000 - 5483
Attachment CSC-III-10

transmission-line sources will not change significantly with operation of the Project, since overhead 115 kV conductors are not modified as part of the proposed additions to the Hawthorne Substation.
In summary, the addition of the proposed capacitor banks to the existing Hawthorne Substation will not cause any significant change to the existing levels of electric and magnetic fields at the boundary of the site. Levels of electric and magnetic fields under existing and proposed conditions would be far below levels recommended by the International Committee on Electromagnetic Safety and the International Commission on Non-Ionizing Radiation Protection for the general public and are similar to those found in homes not near substations.
vii 1501008.000 - 5483
Attachment CSC-III-10
Existing and Proposed Configurations
As part of the Hawthorne 115 kV Capacitor Bank Addition Project, UI proposes the installation of two 115 kV Capacitor banks installed on the “A” Line Terminal at Hawthorne Substation in Fairfield, Connecticut. The proposed changes to the substation yard include the expansion of the existing fence to establish a larger yard perimeter (see Figure 1). The proposed capacitor banks and ancillary equipment are located within the western portion of the expanded substation perimeter. The capacitor banks are connected to the “A” Line terminal bus in an ungrounded wye configuration. Ancillary equipment – including circuit breakers, disconnects, circuit switchers – allow one or both capacitor banks to be switched into and out of the 115 kV transmission system.
The existing substation consists of two 115 kV incoming circuits, designated Line “B” and Line “A”, with a 115 kV tie breaker (see Figure 2). The tie breaker is connected between the terminal buses of Lines “B” and “A”. In the loading conditions provided by UI Transmission Planning for this report, power is transferred from Bridgeport and Milford load pockets west to Norwalk. Pass-through load enters the Hawthorne Substation on Line “B”, passes through the tie breaker to the Line “A” terminal bus, and exits on the “A” Line.
The major substation yard equipment includes: two station power transformers, a 115kV tie breaker, two 115kV breaker isolation disconnect switches, two transmission circuit disconnect switches, two transformer high side disconnect switches, a 115kV circuit switcher, a 115kV series reactor, and various potential transformers (PT’s), current transformers (CT’s) and station service transformers. In addition, the station has three 13.8 kV distribution buses with a total of 15 feeder breakers along with four main breakers and one tie breaker.
To the north of the site is the General Electric property. To the south and east of the site are residential neighborhoods. The nearest existing equipment is approximately 210 feet away from the closest house.
8 1501008.000 - 5483
Attachment CSC-III-10
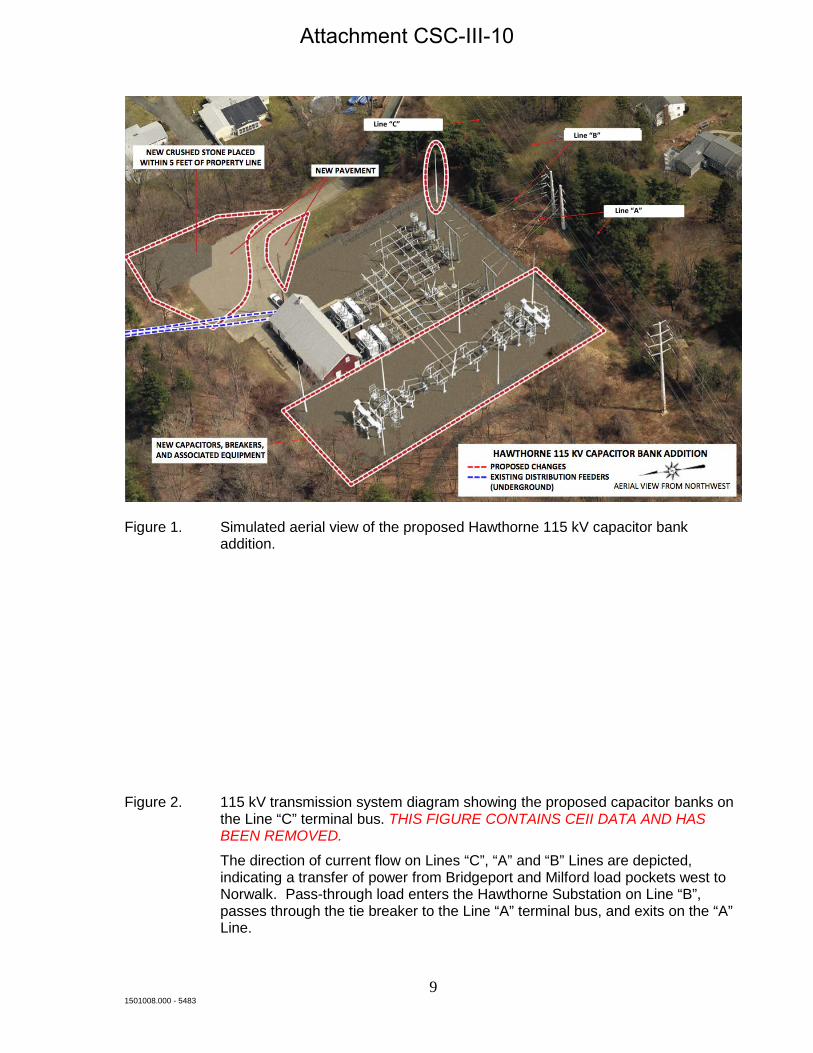
Figure 1. Simulated aerial view of the proposed Hawthorne 115 kV capacitor bank addition.
Figure 2. 115 kV transmission system diagram showing the proposed capacitor banks on the Line “C” terminal bus. THIS FIGURE CONTAINS CEII DATA AND HAS BEEN REMOVED.
The direction of current flow on Lines “C”, “A” and “B” Lines are depicted, indicating a transfer of power from Bridgeport and Milford load pockets west to Norwalk. Pass-through load enters the Hawthorne Substation on Line “B”, passes through the tie breaker to the Line “A” terminal bus, and exits on the “A” Line.
Line “C”
Line “A”
Line “B”
9
1501008.000 - 5483
Attachment CSC-III-10
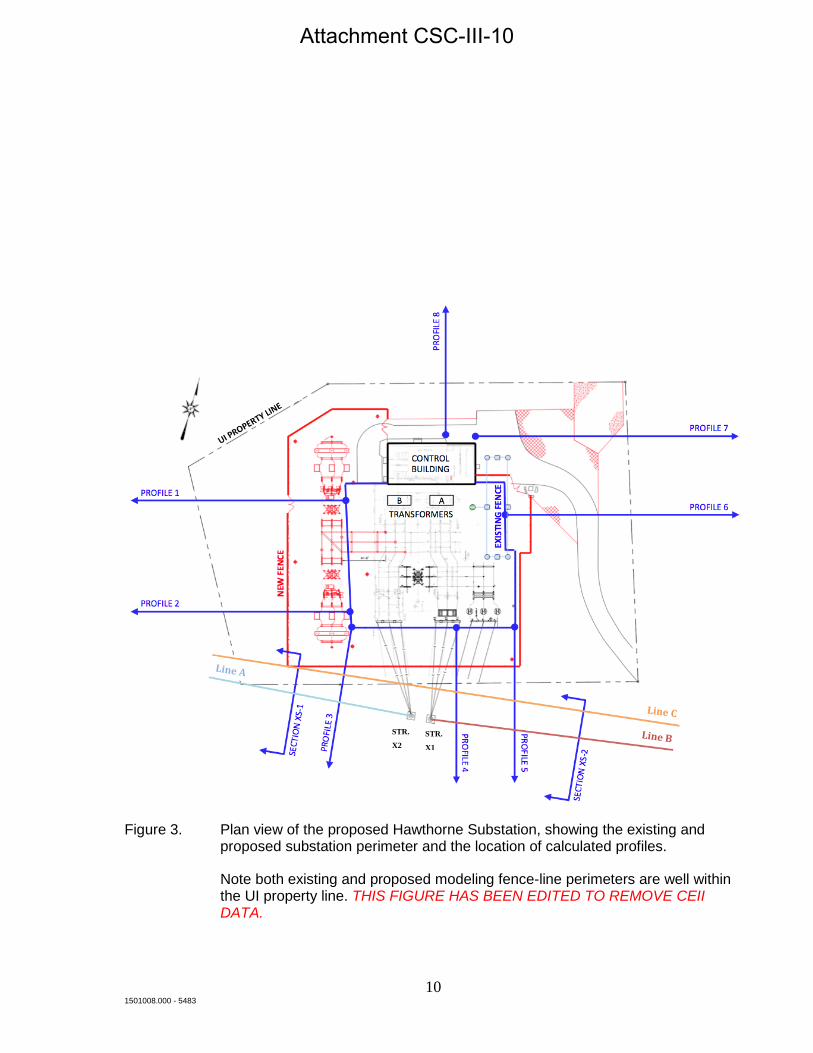
Figure 3. Plan view of the proposed Hawthorne Substation, showing the existing and proposed substation perimeter and the location of calculated profiles.
Note both existing and proposed modeling fence-line perimeters are well within the UI property line. THIS FIGURE HAS BEEN EDITED TO REMOVE CEII DATA.
STR.
X2
STR.
X1
10 1501008.000 - 5483
Attachment CSC-III-10

In addition to calculations of magnetic field around the perimeter of the proposed site of the Hawthorne Substation, Exponent calculated the magnetic field along eight profiles perpendicular to the existing substation perimeter, directed outward onto adjoining property as shown in Figure 3.
Profile 1 starts at the existing substation fence nearest substation transformer B, and proceeds west.
Profile 2 is aligned with terminal structures of the “A” and “B” line and runs perpendicularly away from the existing substation fence to the west.
Profile 3 begins near the southwest corner of the existing substation fence, and crosses the “C” circuit centerline in a perpendicular transect.
Profile 4 begins at the existing substation fence underneath the conductors of the “B” Line conductors and runs south onto adjoining property.
Profile 5 begins at the southeast corner of the existing substation fence and proceeds south onto adjoining property.
Profile 6 starts at the existing substation fence near substation transformer A, and proceeds east.
Profile 7 begins near the northeastern corner of the substation control building and proceeds east over underground 13.9 kV distribution feeders. See Figure 1.
Profile 8 begins at the north wall of the substation control building and proceeds north.
The right-of-way south the proposed substation fence is elevated approximately 8 feet above the yard grade. To account for this change in elevation, Profiles 3-5 were modeled with rising elevation as they proceed south.
Cross sections XS-1 and XS-2, identified in Figure 3, characterize the magnetic field at transects perpendicular to the route of the “C”, “A”, and “B” Lines. Cross section XS-1 models the span between dead-end Structure 873A and the double-circuit monopole to the east, which supports conductors of the “C” and “A” Lines (see Figure 1). Section XS-2 models the span west of dead-end structure 872A and the double-circuit monopole to the east, which bears conductors of Lines “C” and “A”. Structure dimensions for both the dead-end structures and the double-circuit monopoles are shown in Figure 4. In XS-1, the modeled height of the lowest phase above ground (phase C of Line “A”) is 30.3 feet. In XS-2, the height of the lowest phase above ground (phase C of Line “B”) was modeled at 30.6 feet. The conductors of the “C” Line are higher, 60.1 feet above ground in Sections XS-1 and XS-2. From dead-end Structures 873A and 872A, the conductors of the “C” and “B” Lines pass beneath the conductors of the “C” Line to terminal structures within the substation perimeter. To account for the rising elevation south of the Hawthorne Substation perimeter, the structures shown in Figure 4 were modeled with an additional height of 8 feet.
11 1501008.000 - 5483
Attachment CSC-III-10
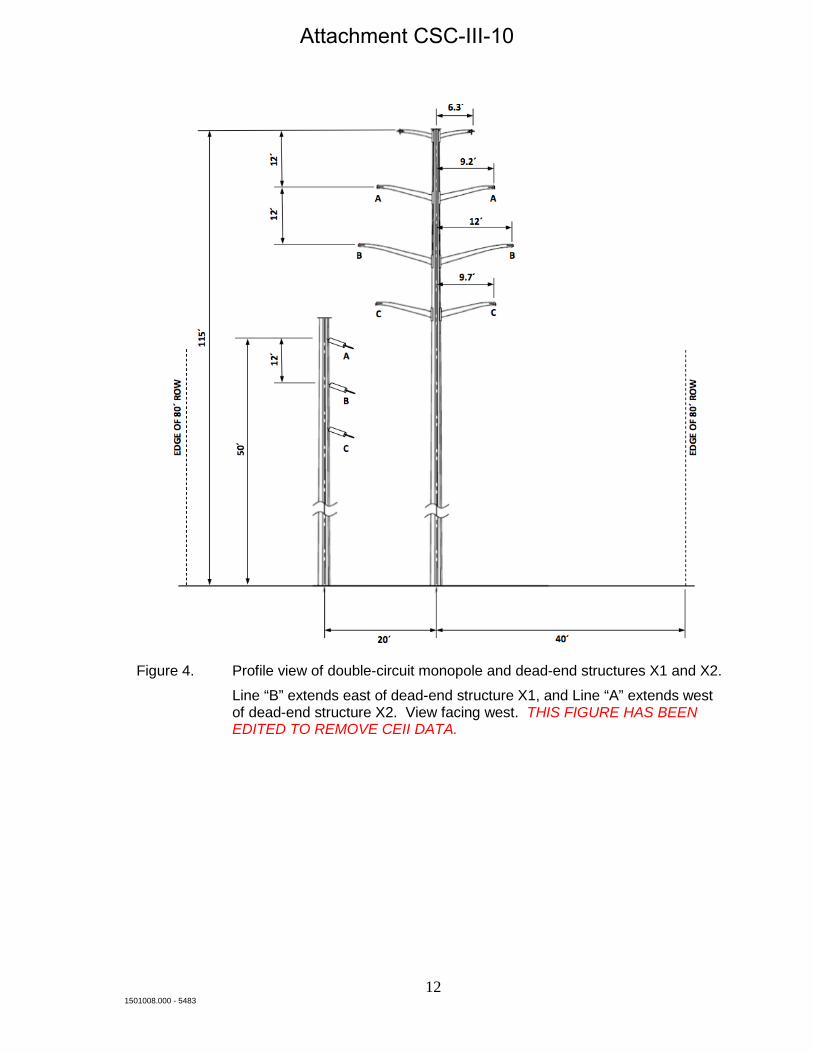
Figure 4. Profile view of double-circuit monopole and dead-end structures X1 and X2.
Line “B” extends east of dead-end structure X1, and Line “A” extends west of dead-end structure X2. View facing west. THIS FIGURE HAS BEEN EDITED TO REMOVE CEII DATA.
12 1501008.000 - 5483
Attachment CSC-III-10
Assessment Criteria
Neither the federal government nor Connecticut has enacted standards for magnetic fields or
electric fields from power lines or other sources at power frequencies. The Connecticut Siting
Council has, however, adopted “EMF Best Management Practices for the Construction of
Electric Transmission Lines in Connecticut” (BMP) in 2014 based upon a consensus of health
and scientific agencies that the scientific evidence “reflects the lack of credible scientific
evidence for a causal relationship between MF [magnetic field] exposure and adverse health
effects.” (CSC, p. 3). Nevertheless, the CSC concluded that precautionary measures for the
siting of new transmission lines in the state of Connecticut are appropriate and should include
“the use of effective no-cost and low-cost technologies and management techniques on a
project-specific basis to reduce MF [magnetic field] exposure to the public while allowing for
the development of efficient and cost-effective electrical transmission projects” (CSC, p. 11).
Several methods are articulated in Section C (CSC, p. 8-9). The engineering control which
applies most to the expansion of the Hawthorn Substation is maximizing the horizontal distance
to surrounding residences from new electrical sources. This is accomplished by placing the new
equipment on the western side of the substation and maintaining a buffer zone between the
fence line of the substation and the UI property line.
Other EMF assessment criteria include the exposure limits recommended by scientific
organizations. These exposure limits are included in guidelines developed to protect health and
safety and are based upon reviews and evaluations of relevant health research. These guidelines
include exposure limits for the general public recommended by the International Committee on
Electromagnetic Safety (ICES) and the International Commission on Non-Ionizing Radiation
Protection (ICNIRP) to address health and safety issues (ICES, 2002; ICNIRP, 2010).
In a June 2007 Factsheet, the World Health Organization included recommendations that policy
makers should adopt international exposure limit guidelines, such as those from ICNIRP or
ICES (Table 1), for occupational and public exposure to EMF.
13 1501008.000 - 5483
Attachment CSC-III-10
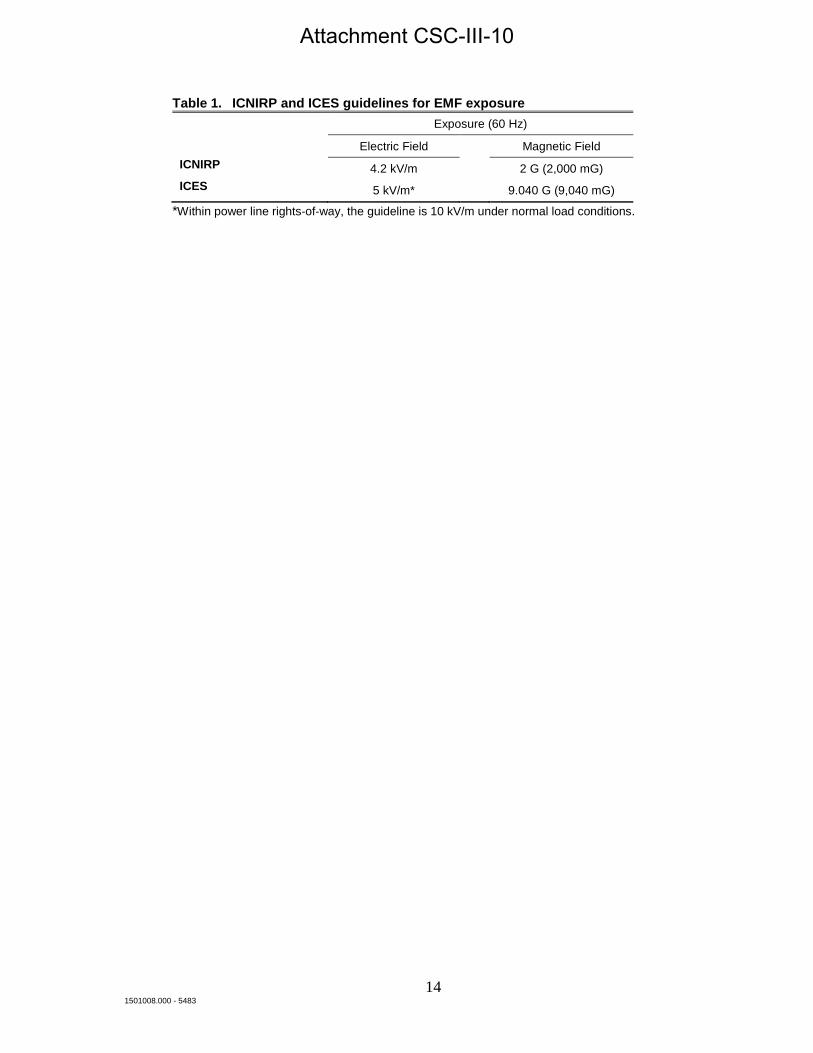
Table 1. ICNIRP and ICES guidelines for EMF exposure
Exposure (60 Hz)
Electric Field Magnetic Field ICNIRP 4.2 kV/m 2 G (2,000 mG) ICES 5 kV/m* 9.040 G (9,040 mG)
*Within power line rights‐of‐way, the guideline is 10 kV/m under normal load conditions.
14 1501008.000 - 5483
Attachment CSC-III-10
Methods
Exponent modeled EMF levels associated with the existing and proposed configurations of the Hawthorne Substation and 115 kV Transmission Lines “B”, “A”, and “C” using two methods:
(1) Three-dimensional modeling of magnetic fields, accounting for the arrangement of buswork, transmission-line interconnections, and other equipment inside the substation fence;
(2) Two-dimensional modeling of electric and magnetic fields, accounting only for the conductors of the “B”, “A”, and “C” Lines.
Magnetic field levels were calculated for peak loading conditions anticipated in 2016, as well as average loading conditions anticipated in 2021. In addition, electric and magnetic field measurements were recorded outside the existing perimeter of the substation.
Three-dimensional modeling
Magnetic fields along the UI property line, the internal fence-line perimeter of the proposed Hawthorne Substation, and along perpendicular profiles 1-8 were modeled using SUBCALC. SUBCALC, which is part of the Enertech EMF Workbench Suite, models the magnetic fields in and around substation equipment, accounting for the three-dimensional arrangement of breakers, transformers, reactors, capacitors, buswork, and transmission lines.
Two SUBCALC models were constructed using substation plan and profile data, and accounting for grade south the proposed substation internal fence-line perimeter. The inputs to the program include data regarding voltage, current flow, circuit phasing, and conductor configurations, which were provided by UI.
The first SUBCALC model was used to calculate magnetic fields for the existing configuration of the Hawthorne Substation (Figure 5). This model does not include proposed capacitors, reactors, breakers or buswork on the west side of the expanded substation perimeter. The second SUBCALC model includes new equipment within the proposed perimeter (Figure 6). Both three-dimensional models were used to calculate magnetic fields under average-load conditions in 2021 and peak-load conditions in 2016, as discussed further below. Based on these two models, changes in the calculated magnetic fields associated with the operation of the Project are provided in the Results section, below.
Along each profile and perimeter, magnetic-field levels were calculated at 1 meter (3.28 feet) above ground as the root mean square value of the field in accordance with IEEE Std. C95.3.1-2010 and IEEE Std. 644-1994.1 To account for changes in elevation, Profiles 3-5 were modeled
1 The resultant magnetic field is the Euclidian norm (square root of the sum of the squares) of the component magnetic-field vectors calculated along vertical, transverse, and longitudinal axes.
15 1501008.000 - 5483
Attachment CSC-III-10
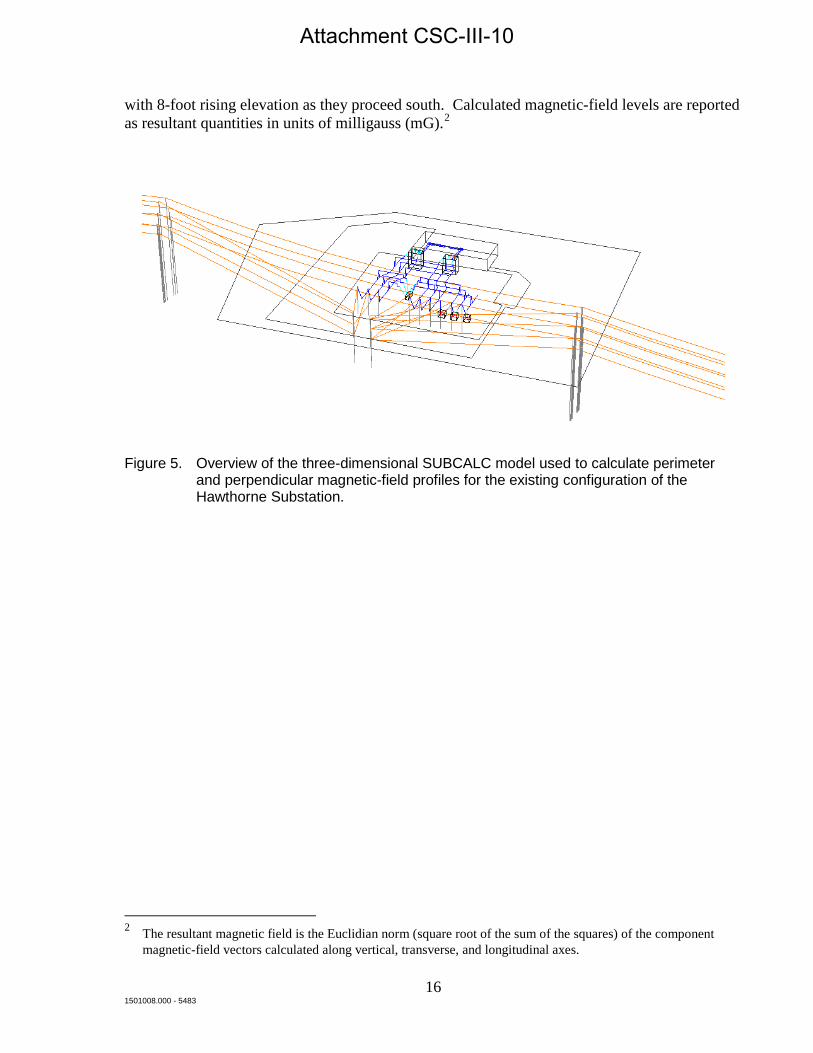
with 8-foot rising elevation as they proceed south. Calculated magnetic-field levels are reported as resultant quantities in units of milligauss (mG).2
Figure 5. Overview of the three-dimensional SUBCALC model used to calculate perimeter
and perpendicular magnetic-field profiles for the existing configuration of the Hawthorne Substation.
2 The resultant magnetic field is the Euclidian norm (square root of the sum of the squares) of the component magnetic-field vectors calculated along vertical, transverse, and longitudinal axes.
16 1501008.000 - 5483
Attachment CSC-III-10
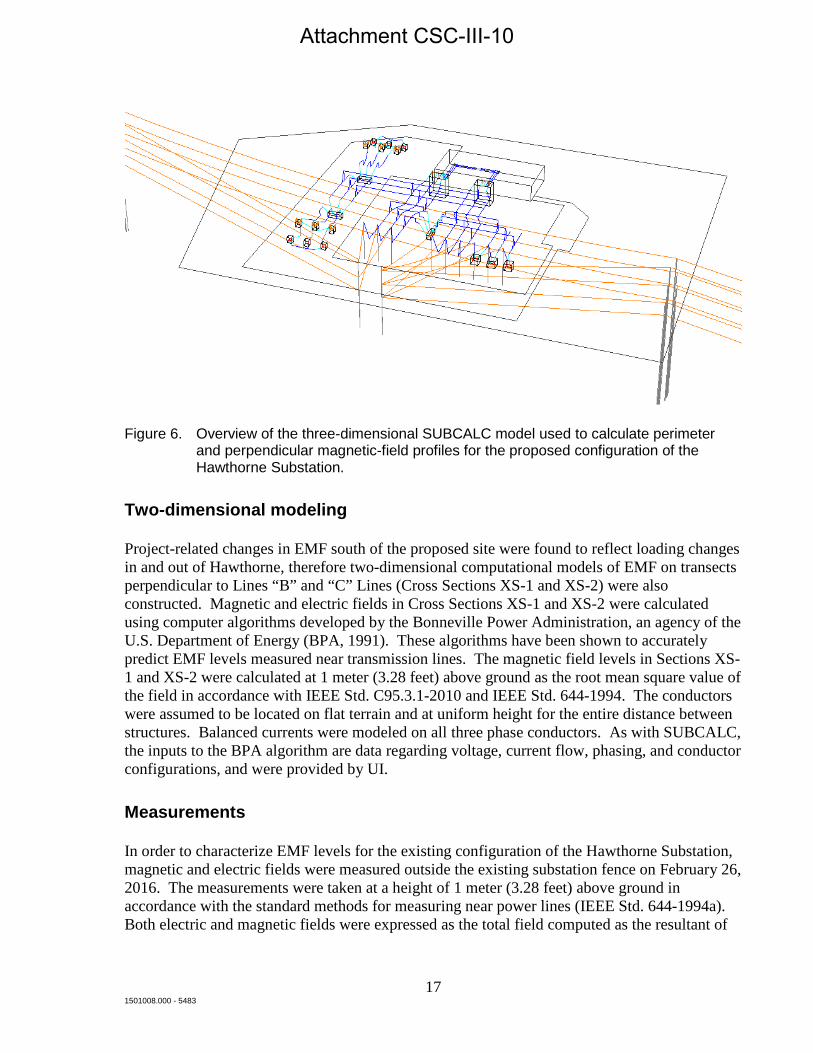
Figure 6. Overview of the three-dimensional SUBCALC model used to calculate perimeter and perpendicular magnetic-field profiles for the proposed configuration of the Hawthorne Substation.
Two-dimensional modeling
Project-related changes in EMF south of the proposed site were found to reflect loading changes in and out of Hawthorne, therefore two-dimensional computational models of EMF on transects perpendicular to Lines “B” and “C” Lines (Cross Sections XS-1 and XS-2) were also constructed. Magnetic and electric fields in Cross Sections XS-1 and XS-2 were calculated using computer algorithms developed by the Bonneville Power Administration, an agency of the U.S. Department of Energy (BPA, 1991). These algorithms have been shown to accurately predict EMF levels measured near transmission lines. The magnetic field levels in Sections XS-1 and XS-2 were calculated at 1 meter (3.28 feet) above ground as the root mean square value of the field in accordance with IEEE Std. C95.3.1-2010 and IEEE Std. 644-1994. The conductors were assumed to be located on flat terrain and at uniform height for the entire distance between structures. Balanced currents were modeled on all three phase conductors. As with SUBCALC, the inputs to the BPA algorithm are data regarding voltage, current flow, phasing, and conductor configurations, and were provided by UI.
Measurements
In order to characterize EMF levels for the existing configuration of the Hawthorne Substation, magnetic and electric fields were measured outside the existing substation fence on February 26, 2016. The measurements were taken at a height of 1 meter (3.28 feet) above ground in accordance with the standard methods for measuring near power lines (IEEE Std. 644-1994a). Both electric and magnetic fields were expressed as the total field computed as the resultant of
17 1501008.000 - 5483
Attachment CSC-III-10
field vectors measured along vertical, transverse, and longitudinal axes.3 The electric field was measured in units of kV/m with a single-axis field sensor and meter manufactured by Enertech Consultants. The magnetic field was measured in units of mG by orthogonally-mounted sensing coils whose output was logged by a digital recording meter (EMDEX II) manufactured by Enertech Consultants. These instruments meet the Institute of Electrical and Electronics Engineers (IEEE) instrumentation standard for obtaining accurate field measurements at power line frequencies (IEEE Std.1308-1994b). The meters were calibrated by the manufacturer by methods like those described in IEEE Std. 644-1994a.
Underground 13.8 kV distribution sources were not included in the SUBCALC or BPA models in order to characterize the effects of the new substation equipment. Magnetic fields from these underground sources were measured in the vicinity of the substation control building (Profiles 7 and 8), as described in the Results section below.
Loading
UI Transmission Planning provided the pre- and post-Project loadings for Lines “B”, “A”, and “C”, which are provided in Table 1 and Table 2 for average and peak-load conditions, respectively. Reference directions of current are shown in Figure 2.
UI is required by the CSC 2007 Electric and Magnetic Best Management Practices to provide line loadings for “pre and post project conditions under 1) peak load level at the time of the application filing and 2) at the projected seasonal maximum 24-hour average load level anticipated within five years” of operational in service date. As provided by UI transmission planning, the term “seasonal maximum 24-hour average” load level was replaced by the term “average daily peak.” In this report, “average load” refers to this case.
For peak load analysis, UI modeled the system to reflect transmission topology changes that were already approved by ISO-New England with an in service date of June 2016 or earlier. This included both Hawthorne capacitors to be in-service for the peak-load, post-project analysis. In addition, the study year 2021 was used for average daily peak load level analysis to satisfy the CSC requirement for obtaining EMF data within a five-year horizon. The average daily peak load for post-project conditions simulated a shoulder load scenario and therefore, one of the two capacitor banks was assumed online. In order to determine the scenario with the highest line loadings, generation dispatches were chosen that caused the highest projected flows. Dispatch 4 was selected for the average-load case, and Dispatch 4a was selected for the peak-load case.
The series reactor on the “B” line was assumed to be offline for both the peak and average load analysis. This methodology was conservative and provided results generally reflecting higher loadings of these transmission lines.
3 Measurements along the vertical, transverse, and longitudinal axes were recorded as root-mean-square magnitudes. Root mean square refers to the common mathematical method of defining the effective voltage, current, or field of an AC system.
18 1501008.000 - 5483
Attachment CSC-III-10

Table 2. Circuit and equipment loading for average case in 2021 (Dispatch 4). THIS
TABLE HAS BEEN EDITED TO REMOVE CEII DATA.
Circuit or Equipment
Voltage (kV) Notes
Current
Condition MW MVAR Magnitude Angle
“A” 115 pre-Project
post-Project
“C” 115 pre-Project
post-Project
“B” 115 pre-Project
post-Project
A, B 115/13.8 Primary, transformers A and B
pre-Project
post-Project
Tie breaker 115 “B” to “A” terminal bus pre-Project
post-Project
Capacitor bank 115 Single bank
pre-Project post-Project
Total capacitor 115 “A” terminal bus west
to capacitors pre-Project post-Project
Table 3. Circuit and equipment loading for 90/10 peak load case in 2016 (Dispatch 4a). THIS TABLE HAS BEEN EDITED TO REMOVE CEII DATA.
Circuit or Equipment
Voltage (kV) Notes
Current
Condition MW MVAR Magnitude Angle
“A” 115 pre-Project
post-Project
“C” 115 pre-Project
post-Project
“B” 115 pre-Project
post-Project
A, B 115/13.8 Primary, transformers A and B
pre-Project
post-Project
Tie breaker 115 “B” to “A” terminal bus pre-Project
post-Project
Capacitor bank 115 Single bank
pre-Project post-Project
Total capacitor 115 “A” terminal bus west
to capacitors pre-Project post-Project
19 1501008.000 - 5483
Attachment CSC-III-10

20 1501008.000 - 5483
Attachment CSC-III-10

Results and Discussion
Figure 7 depicts the calculated magnetic-field levels along the UI property line at 180 Hawthorne Drive for average-load conditions in 2021. The profile begins at the southwest corner of the substation, and proceeds counter-clockwise around the site when viewed from above. The x-axis of Figure 7 is labeled with the cumulative distance along the property perimeter. Comparing the results for the existing and proposed configurations of the Hawthorne Substation, the calculated magnetic field for these two configurations is within 0.5 mG at the majority of locations on the property line. The greatest change in the calculated magnetic field occurs beneath the conductors of Line “B” where they pass below the conductors of the “C” line. At this location, calculated magnetic fields are 2 mG higher in the proposed configuration compared to the existing configuration. This change reflects the increase in loading of Line “B” of 19 amperes associated with operation of the Project. Figure 8 depicts the calculated magnetic-field levels along the UI property line for peak-load conditions in 2016. Calculated magnetic fields are within 1 mG at the majority of locations. Beneath the conductors of Line “B”, the calculated magnetic field is 4 mG higher in the proposed configuration, again reflecting the increase of Line “B” load of 40 amperes, compared to the loading before operation of the Project). Figure 9 depicts the calculated magnetic-field levels around the proposed fence line of the Hawthorne Substation for average-load conditions in 2021. In addition, Figure 9 depicts the measured magnetic field along the same path. The x-axis of Figure 9 is labeled with the cumulative distance along the proposed fence line, starting in the southwest corner and proceeding counter-clockwise. Comparing the results for the existing and proposed configurations of the Hawthorne Substation, calculated magnetic fields are within 1 mG at the majority of locations. In the average-load model, one capacitor bank is online, and the south bank was chosen for this purpose. The effect of the new capacitor bank and ancillary equipment is discernible on the west and south sides of the expanded substation internal fence-line perimeter. On the west side of the new internal fence-line perimeter, the calculated magnetic field is 4 mG higher near the proposed extension of the Line “A” terminal bus. On the south side of new fence line, the calculated magnetic field is 2.6 mG higher nearest the south capacitor bank and associated equipment. The measured magnetic field along the proposed internal fence-line perimeter follows the trend of the calculated profile (existing conditions), but are generally lower. This relationship reflects the load in and out of the Hawthorne Substation at the time of measurements, which was below the shoulder peak loading used in the SUBCALC model. At some locations near the substation control building, the measured magnetic fields are higher than the calculated profiles. At these locations, 13.8 kV distribution lines not included in the SUBCALC models exit the control building underground and proceed north. See Figure 1. Figure 10 depicts the calculated magnetic-field levels around the proposed internal fence-line perimeter of the Hawthorne Substation for peak-load conditions in 2016. Comparing the results for the existing and proposed configurations, calculated magnetic fields are within 1 mG at the majority of locations. In the peak-load model, both capacitor banks are online. Comparison with the average-load profile in Figure 9 shows these additional sources cause a small but
21 1501008.000 - 5483
Attachment CSC-III-10
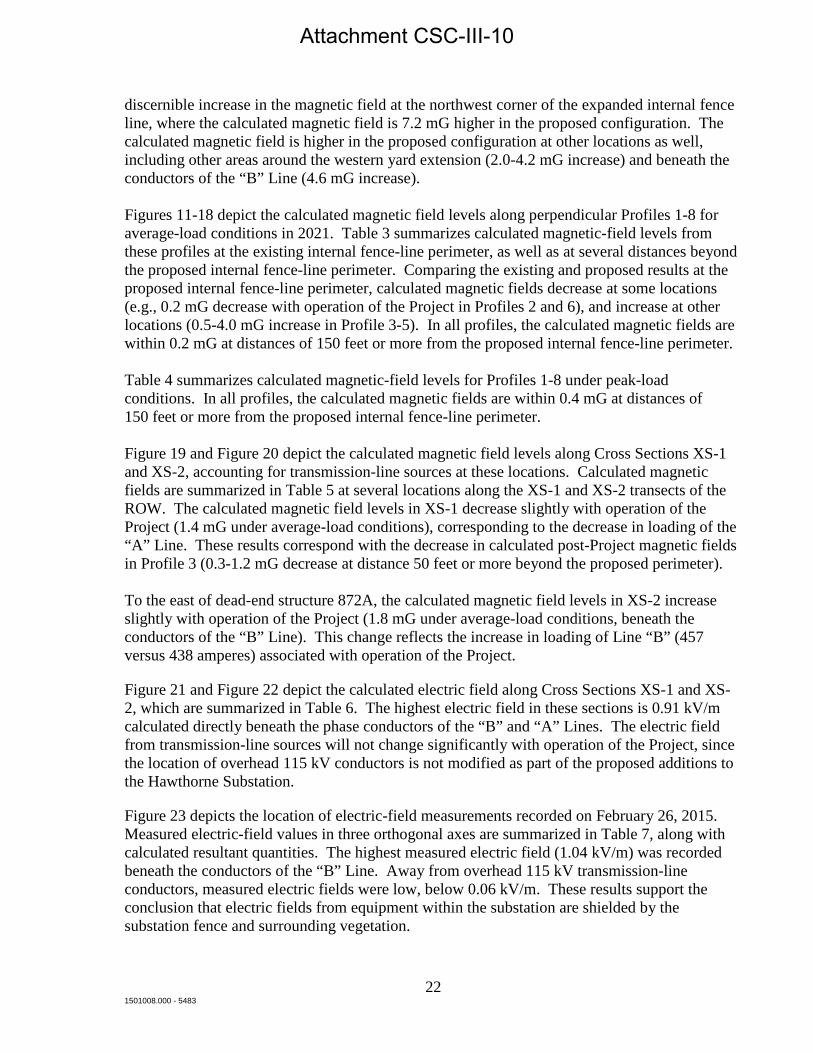
discernible increase in the magnetic field at the northwest corner of the expanded internal fence line, where the calculated magnetic field is 7.2 mG higher in the proposed configuration. The calculated magnetic field is higher in the proposed configuration at other locations as well, including other areas around the western yard extension (2.0-4.2 mG increase) and beneath the conductors of the “B” Line (4.6 mG increase). Figures 11-18 depict the calculated magnetic field levels along perpendicular Profiles 1-8 for average-load conditions in 2021. Table 3 summarizes calculated magnetic-field levels from these profiles at the existing internal fence-line perimeter, as well as at several distances beyond the proposed internal fence-line perimeter. Comparing the existing and proposed results at the proposed internal fence-line perimeter, calculated magnetic fields decrease at some locations (e.g., 0.2 mG decrease with operation of the Project in Profiles 2 and 6), and increase at other locations (0.5-4.0 mG increase in Profile 3-5). In all profiles, the calculated magnetic fields are within 0.2 mG at distances of 150 feet or more from the proposed internal fence-line perimeter. Table 4 summarizes calculated magnetic-field levels for Profiles 1-8 under peak-load conditions. In all profiles, the calculated magnetic fields are within 0.4 mG at distances of 150 feet or more from the proposed internal fence-line perimeter. Figure 19 and Figure 20 depict the calculated magnetic field levels along Cross Sections XS-1 and XS-2, accounting for transmission-line sources at these locations. Calculated magnetic fields are summarized in Table 5 at several locations along the XS-1 and XS-2 transects of the ROW. The calculated magnetic field levels in XS-1 decrease slightly with operation of the Project (1.4 mG under average-load conditions), corresponding to the decrease in loading of the “A” Line. These results correspond with the decrease in calculated post-Project magnetic fields in Profile 3 (0.3-1.2 mG decrease at distance 50 feet or more beyond the proposed perimeter). To the east of dead-end structure 872A, the calculated magnetic field levels in XS-2 increase slightly with operation of the Project (1.8 mG under average-load conditions, beneath the conductors of the “B” Line). This change reflects the increase in loading of Line “B” (457 versus 438 amperes) associated with operation of the Project.
Figure 21 and Figure 22 depict the calculated electric field along Cross Sections XS-1 and XS-2, which are summarized in Table 6. The highest electric field in these sections is 0.91 kV/m calculated directly beneath the phase conductors of the “B” and “A” Lines. The electric field from transmission-line sources will not change significantly with operation of the Project, since the location of overhead 115 kV conductors is not modified as part of the proposed additions to the Hawthorne Substation.
Figure 23 depicts the location of electric-field measurements recorded on February 26, 2015. Measured electric-field values in three orthogonal axes are summarized in Table 7, along with calculated resultant quantities. The highest measured electric field (1.04 kV/m) was recorded beneath the conductors of the “B” Line. Away from overhead 115 kV transmission-line conductors, measured electric fields were low, below 0.06 kV/m. These results support the conclusion that electric fields from equipment within the substation are shielded by the substation fence and surrounding vegetation.
22 1501008.000 - 5483
Attachment CSC-III-10

Conclusions
Electricity is an integral part of our infrastructure (e.g., transportation systems, homes, and
businesses) and people living in modern communities are therefore surrounded by sources of
EMF. Where the existing “C”, “A” and “B” transmission lines run overhead adjacent to the
Hawthorne Substation, the electric-field levels are approximately 20% or less of recommended
exposure limits and magnetic-field levels are approximately 3.5% or less of that recommended
for the general public by international health-based standards (ICES and ICNIRP). The load on
the “B” line will increase by a slight amount so that the magnetic field beneath the transmission
lines increases by a similarly slight amount, less than 2 mG (3.7%) from existing conditions for
average loading and by less than 4 mG (5.9%) for peak loading.
Because the design of the addition to the substation and because fields attenuate quickly with
distance, the calculated and measured magnetic and electric fields are very low at the internal
fence line around the substation and are still lower at the UI property line, consistent with IEEE
Standard 1127-1990. The proposed equipment would not significantly increase the electric field
beyond the property line because of shielding by metallic fences and surrounding vegetation.
Although the magnetic field from existing and proposed equipment within the substation is not
similarly shielded, the magnetic field diminishes from these sources so that at 50 feet from the
internal substation fence the calculated magnetic field from existing and proposed
configurations of the Hawthorne Substation differ by less than 1 mG at the majority of
locations. The highest calculated magnetic-field level at the UI property line of the Hawthorne
Substation at either peak or average loading is where the existing transmission lines pass
overhead and is less than 3% of that recommended for the general public in international
standards. Away from the transmission lines, the highest magnetic field level is less than 1%
that of the recommended reference level (at either peak or average loading).
23 1501008.000 - 5483
Attachment CSC-III-10
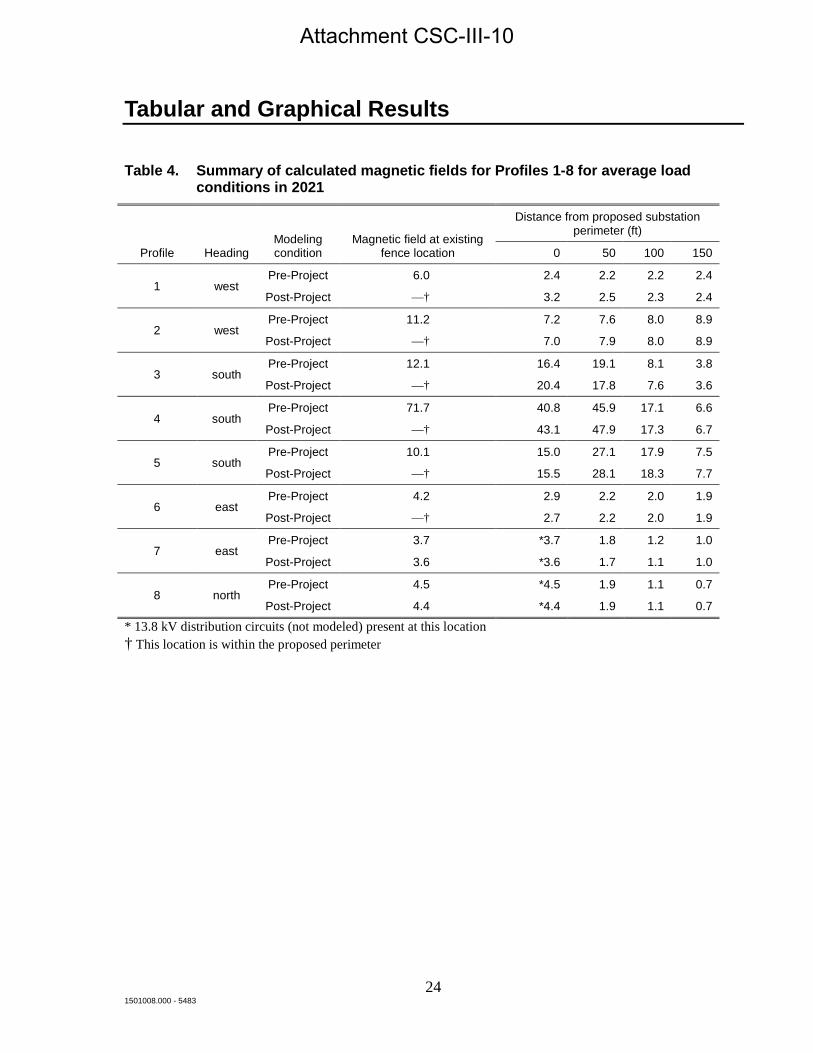
Tabular and Graphical Results
Table 4. Summary of calculated magnetic fields for Profiles 1-8 for average load conditions in 2021
Profile Heading Modeling condition
Magnetic field at existing fence location
Distance from proposed substation perimeter (ft)
0 50 100 150
1 west Pre-Project 6.0 2.4 2.2 2.2 2.4
Post-Project —† 3.2 2.5 2.3 2.4
2 west Pre-Project 11.2 7.2 7.6 8.0 8.9
Post-Project —† 7.0 7.9 8.0 8.9
3 south Pre-Project 12.1 16.4 19.1 8.1 3.8
Post-Project —† 20.4 17.8 7.6 3.6
4 south Pre-Project 71.7 40.8 45.9 17.1 6.6
Post-Project —† 43.1 47.9 17.3 6.7
5 south Pre-Project 10.1 15.0 27.1 17.9 7.5
Post-Project —† 15.5 28.1 18.3 7.7
6 east Pre-Project 4.2 2.9 2.2 2.0 1.9
Post-Project —† 2.7 2.2 2.0 1.9
7 east Pre-Project 3.7 *3.7 1.8 1.2 1.0
Post-Project 3.6 *3.6 1.7 1.1 1.0
8 north Pre-Project 4.5 *4.5 1.9 1.1 0.7
Post-Project 4.4 *4.4 1.9 1.1 0.7
* 13.8 kV distribution circuits (not modeled) present at this location † This location is within the proposed perimeter
24 1501008.000 - 5483
Attachment CSC-III-10
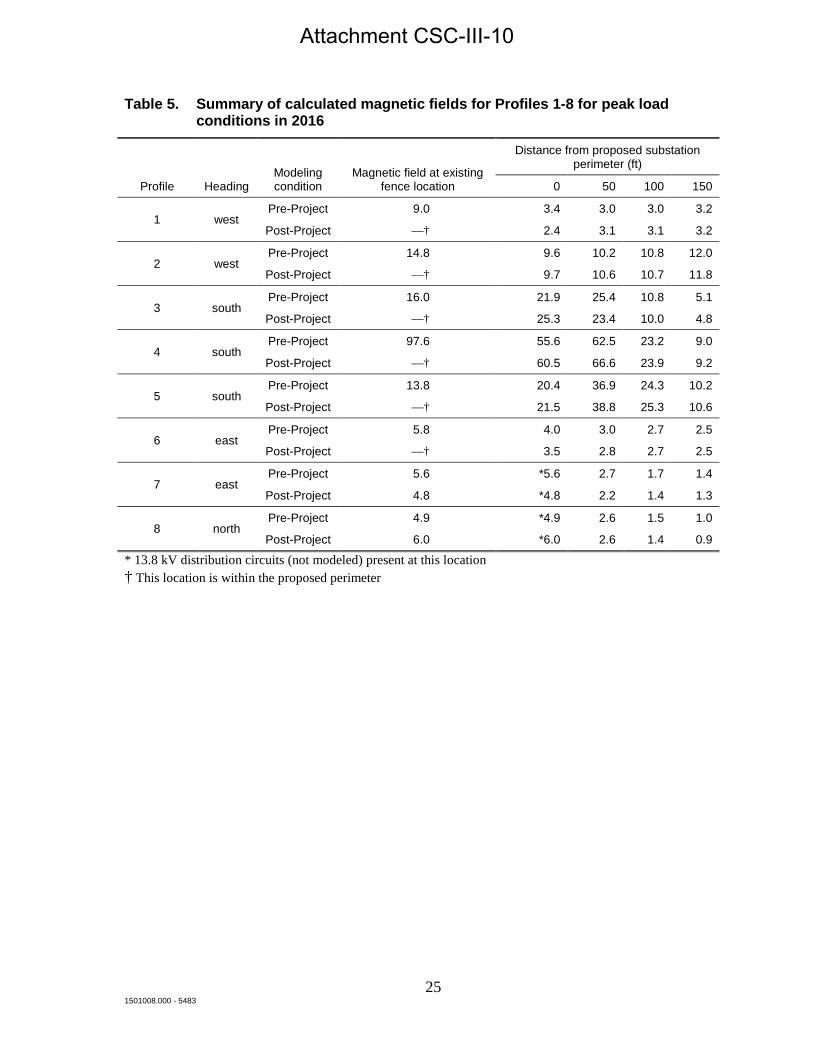
Table 5. Summary of calculated magnetic fields for Profiles 1-8 for peak load conditions in 2016
Profile Heading Modeling condition
Magnetic field at existing fence location
Distance from proposed substation perimeter (ft)
0 50 100 150
1 west Pre-Project 9.0 3.4 3.0 3.0 3.2
Post-Project —† 2.4 3.1 3.1 3.2
2 west Pre-Project 14.8 9.6 10.2 10.8 12.0
Post-Project —† 9.7 10.6 10.7 11.8
3 south Pre-Project 16.0 21.9 25.4 10.8 5.1
Post-Project —† 25.3 23.4 10.0 4.8
4 south Pre-Project 97.6 55.6 62.5 23.2 9.0
Post-Project —† 60.5 66.6 23.9 9.2
5 south Pre-Project 13.8 20.4 36.9 24.3 10.2
Post-Project —† 21.5 38.8 25.3 10.6
6 east Pre-Project 5.8 4.0 3.0 2.7 2.5
Post-Project —† 3.5 2.8 2.7 2.5
7 east Pre-Project 5.6 *5.6 2.7 1.7 1.4
Post-Project 4.8 *4.8 2.2 1.4 1.3
8 north Pre-Project 4.9 *4.9 2.6 1.5 1.0
Post-Project 6.0 *6.0 2.6 1.4 0.9
* 13.8 kV distribution circuits (not modeled) present at this location † This location is within the proposed perimeter
25 1501008.000 - 5483
Attachment CSC-III-10
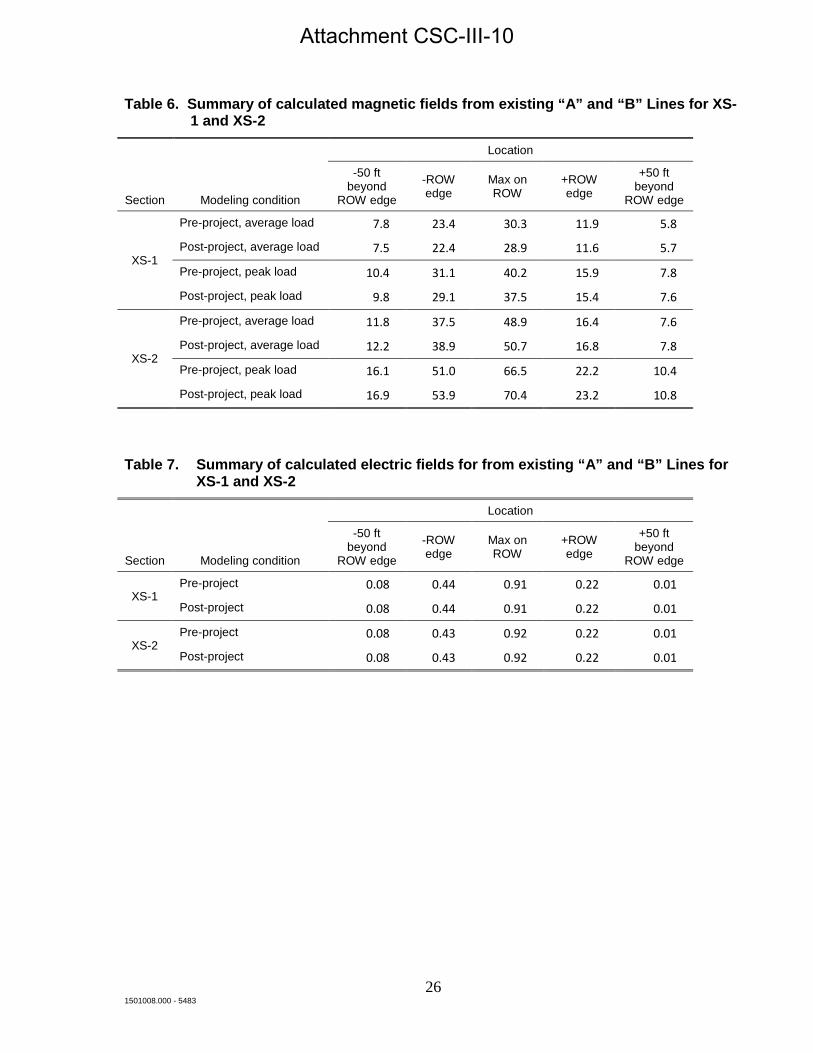
Table 6. Summary of calculated magnetic fields from existing “A” and “B” Lines for XS-1 and XS-2
Section
Location
Modeling condition
-50 ft beyond
ROW edge
-ROW edge
Max on ROW
+ROW edge
+50 ft beyond
ROW edge
XS-1
Pre-project, average load 7.8 23.4 30.3 11.9 5.8
Post-project, average load 7.5 22.4 28.9 11.6 5.7
Pre-project, peak load 10.4 31.1 40.2 15.9 7.8
Post-project, peak load 9.8 29.1 37.5 15.4 7.6
XS-2
Pre-project, average load 11.8 37.5 48.9 16.4 7.6
Post-project, average load 12.2 38.9 50.7 16.8 7.8
Pre-project, peak load 16.1 51.0 66.5 22.2 10.4
Post-project, peak load 16.9 53.9 70.4 23.2 10.8
Table 7. Summary of calculated electric fields for from existing “A” and “B” Lines for XS-1 and XS-2
Section
Location
Modeling condition
-50 ft beyond
ROW edge
-ROW edge
Max on ROW
+ROW edge
+50 ft beyond
ROW edge
XS-1 Pre-project 0.08 0.44 0.91 0.22 0.01
Post-project 0.08 0.44 0.91 0.22 0.01
XS-2 Pre-project 0.08 0.43 0.92 0.22 0.01
Post-project 0.08 0.43 0.92 0.22 0.01
26 1501008.000 - 5483
Attachment CSC-III-10
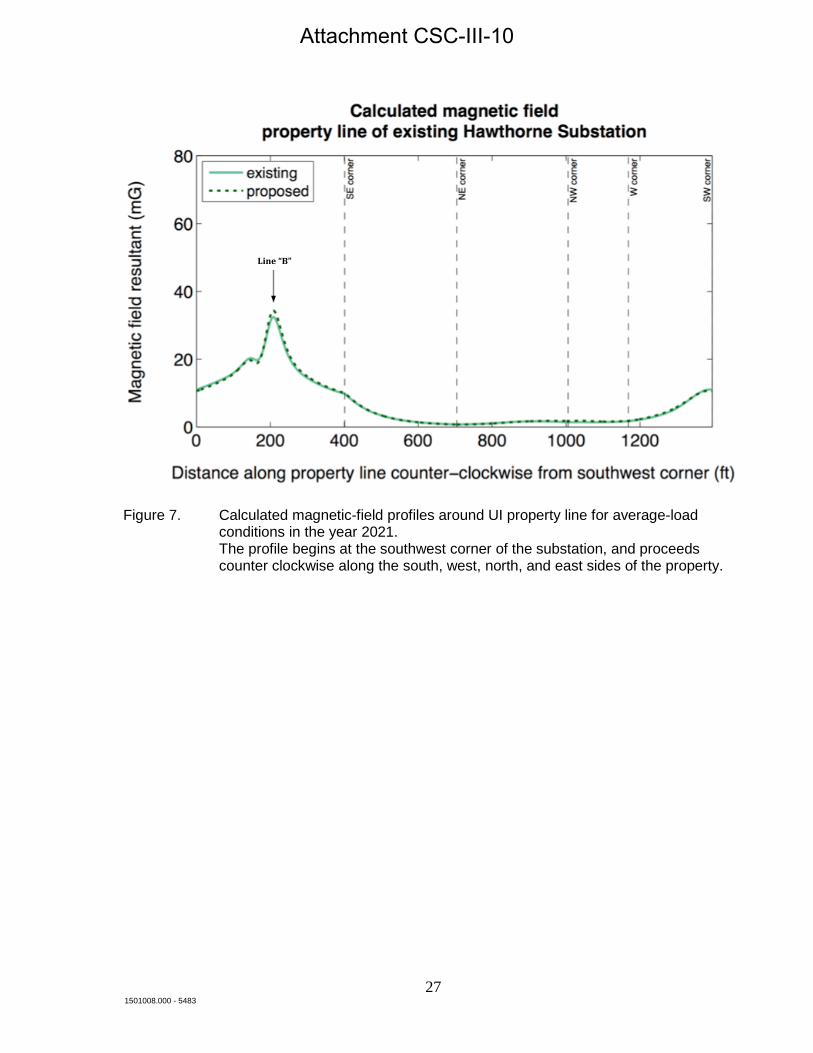
Figure 7. Calculated magnetic-field profiles around UI property line for average-load
conditions in the year 2021. The profile begins at the southwest corner of the substation, and proceeds
counter clockwise along the south, west, north, and east sides of the property.
Line “B”
27 1501008.000 - 5483
Attachment CSC-III-10

Figure 8. Calculated magnetic-field profiles around UI property line for peak-load
conditions in the year 2016. The profile begins at the southwest corner of the substation, and proceeds
counter clockwise along the south, west, north, and east sides of the property.
Line “B”
28 1501008.000 - 5483
Attachment CSC-III-10
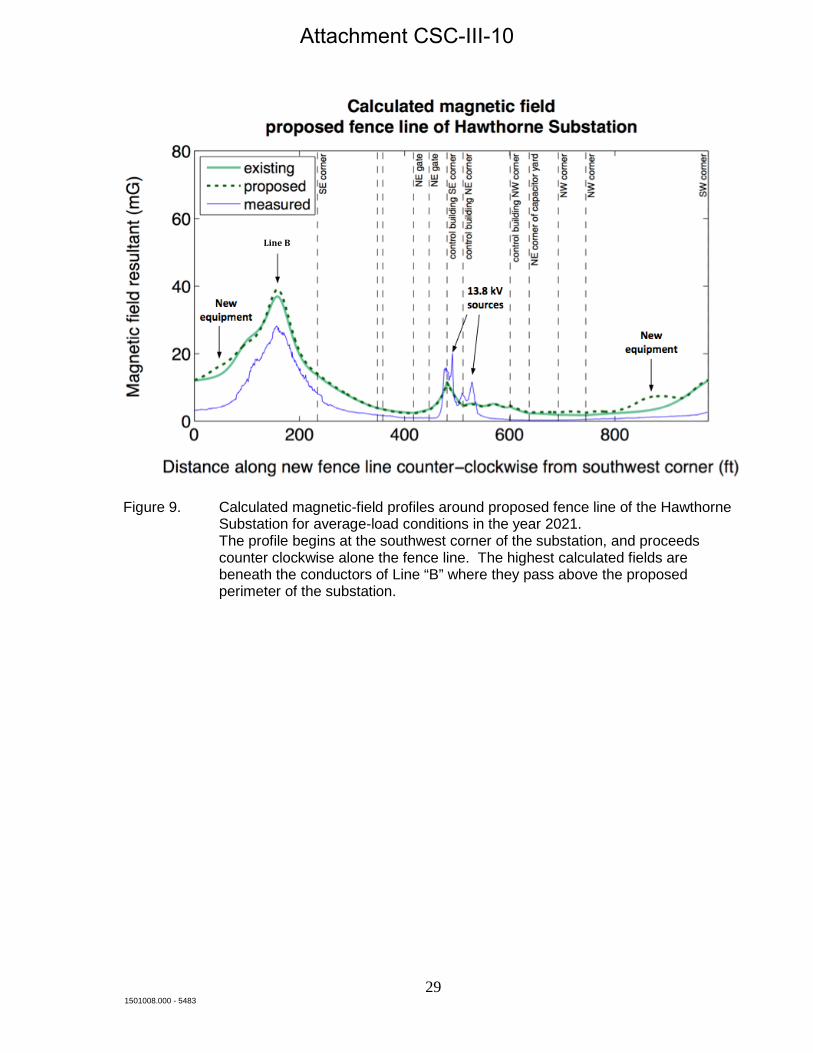
Figure 9. Calculated magnetic-field profiles around proposed fence line of the Hawthorne
Substation for average-load conditions in the year 2021. The profile begins at the southwest corner of the substation, and proceeds
counter clockwise alone the fence line. The highest calculated fields are beneath the conductors of Line “B” where they pass above the proposed perimeter of the substation.
Line B
29 1501008.000 - 5483
Attachment CSC-III-10
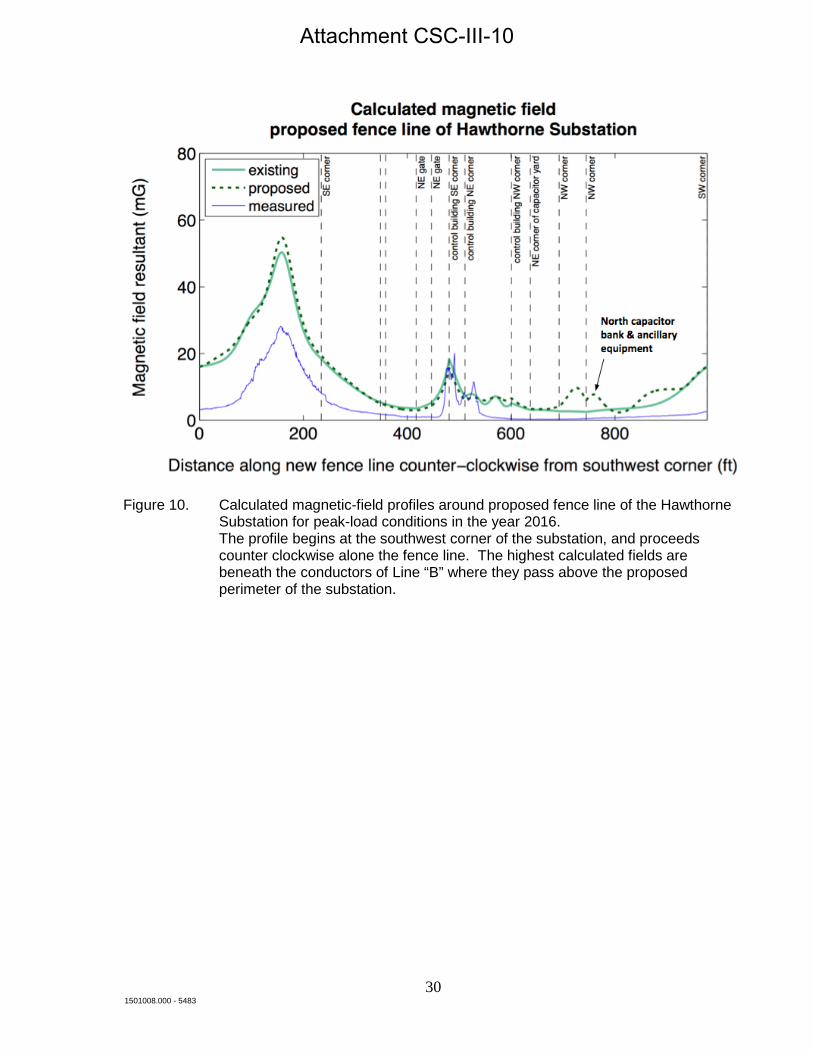
Figure 10. Calculated magnetic-field profiles around proposed fence line of the Hawthorne
Substation for peak-load conditions in the year 2016. The profile begins at the southwest corner of the substation, and proceeds
counter clockwise alone the fence line. The highest calculated fields are beneath the conductors of Line “B” where they pass above the proposed perimeter of the substation.
30 1501008.000 - 5483
Attachment CSC-III-10

Figure 11. Calculated and measured magnetic-field levels along Profile 1.
The calculated magnetic-field levels are for existing and proposed configurations of the Hawthorne Substation under average-load conditions in 2021.
31 1501008.000 - 5483
Attachment CSC-III-10

Figure 12. Calculated and measured magnetic-field levels along Profile 2.
The calculated magnetic-field levels are for existing and proposed configurations of the Hawthorne Substation under average-load conditions in 2021.
32 1501008.000 - 5483
Attachment CSC-III-10

Figure 13. Calculated and measured magnetic-field levels along Profile 3.
The calculated magnetic-field levels are for existing and proposed configurations of the Hawthorne Substation under average-load conditions in 2021.
33 1501008.000 - 5483
Attachment CSC-III-10
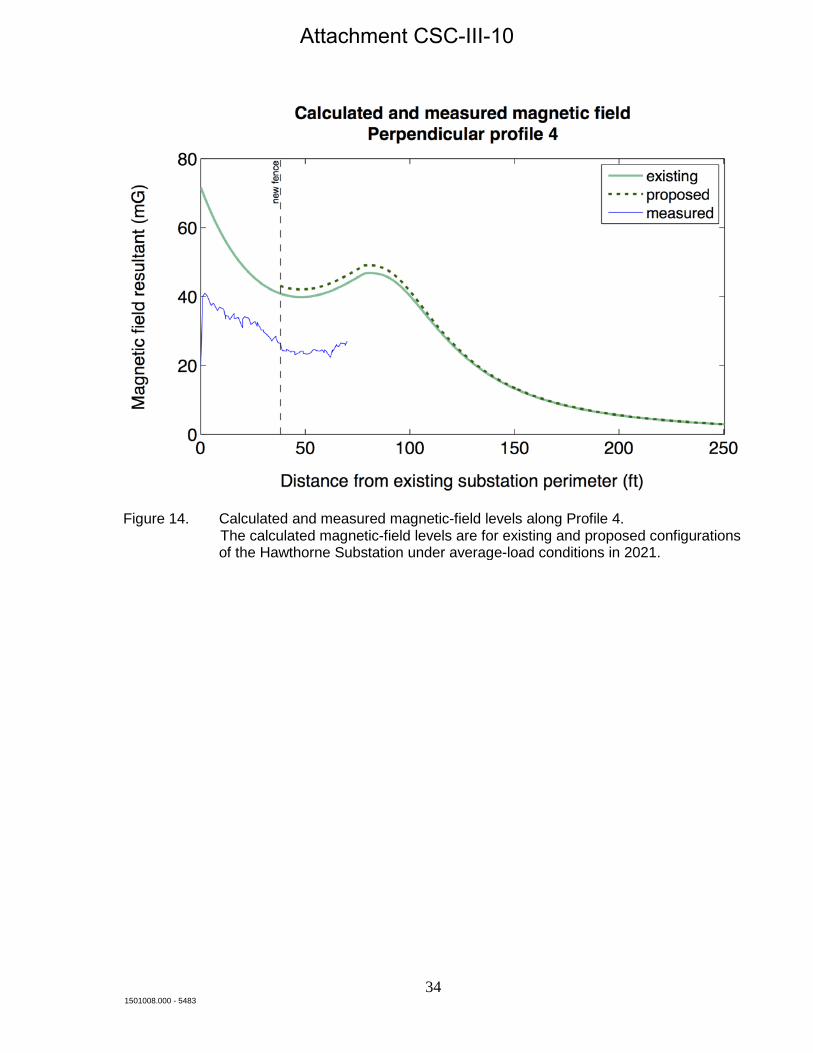
Figure 14. Calculated and measured magnetic-field levels along Profile 4.
The calculated magnetic-field levels are for existing and proposed configurations of the Hawthorne Substation under average-load conditions in 2021.
34 1501008.000 - 5483
Attachment CSC-III-10
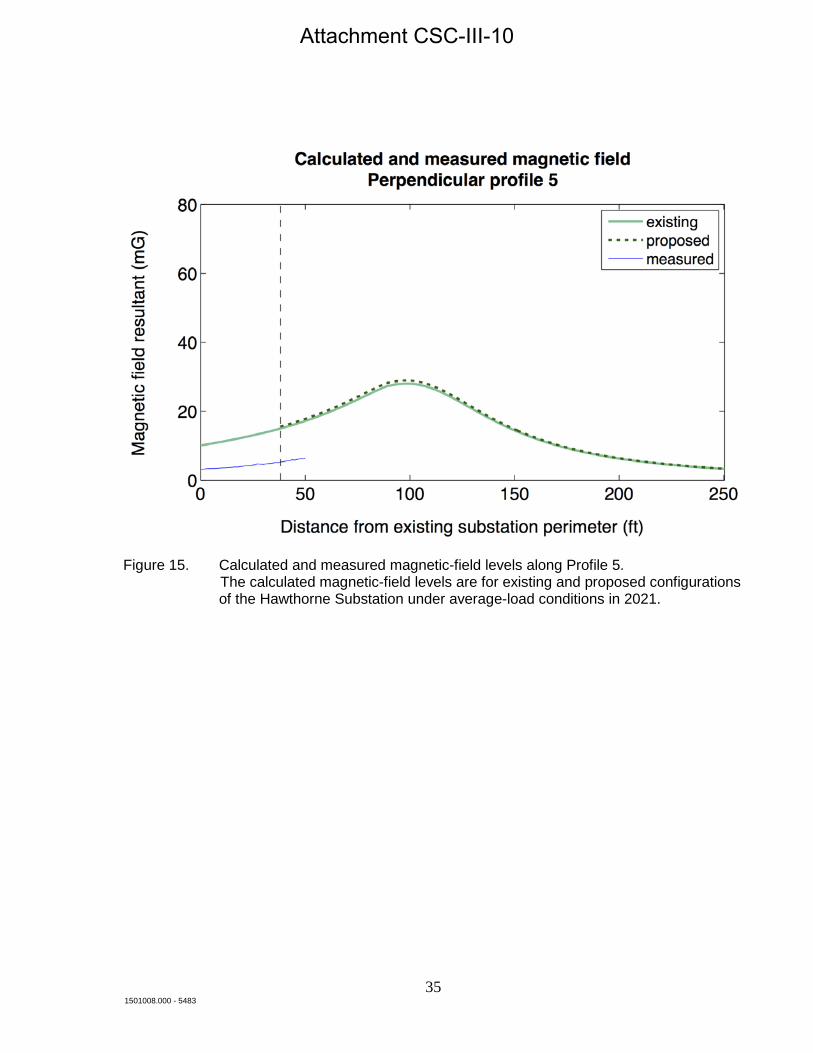
Figure 15. Calculated and measured magnetic-field levels along Profile 5.
The calculated magnetic-field levels are for existing and proposed configurations of the Hawthorne Substation under average-load conditions in 2021.
35 1501008.000 - 5483
Attachment CSC-III-10

Figure 16. Calculated and measured magnetic-field levels along Profile 6.
The calculated magnetic-field levels are for existing and proposed configurations of the Hawthorne Substation under average-load conditions in 2021.
36 1501008.000 - 5483
Attachment CSC-III-10
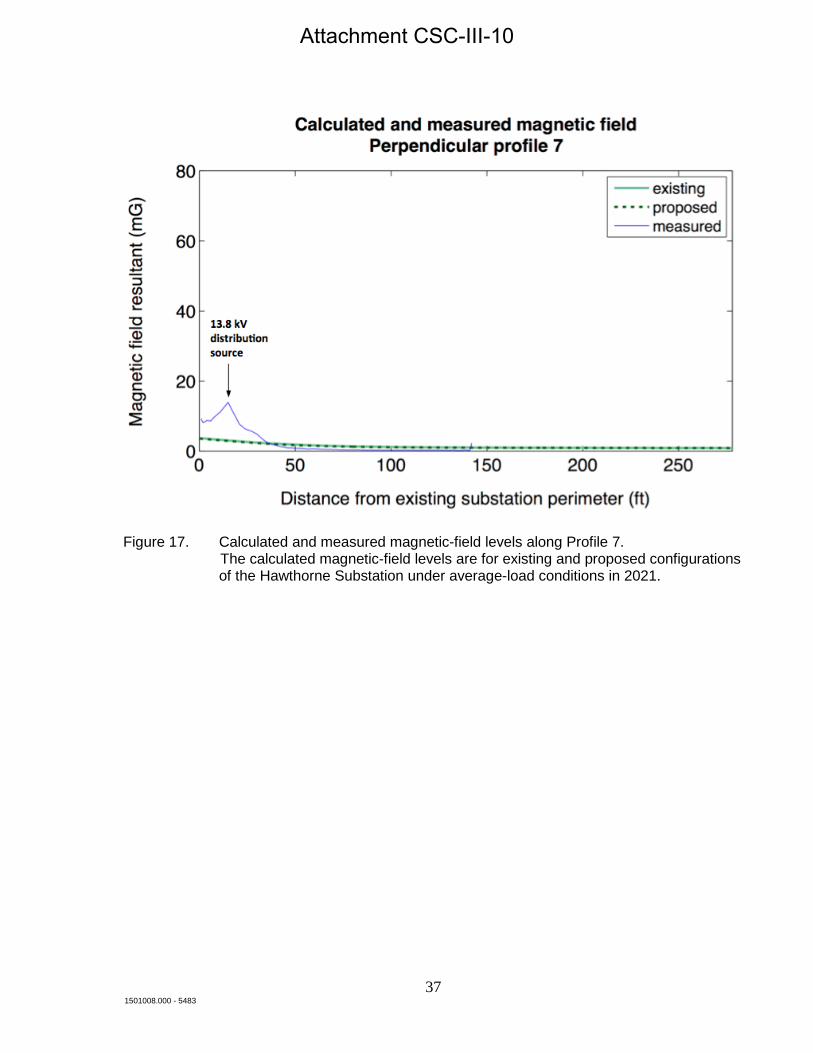
Figure 17. Calculated and measured magnetic-field levels along Profile 7.
The calculated magnetic-field levels are for existing and proposed configurations of the Hawthorne Substation under average-load conditions in 2021.
37 1501008.000 - 5483
Attachment CSC-III-10
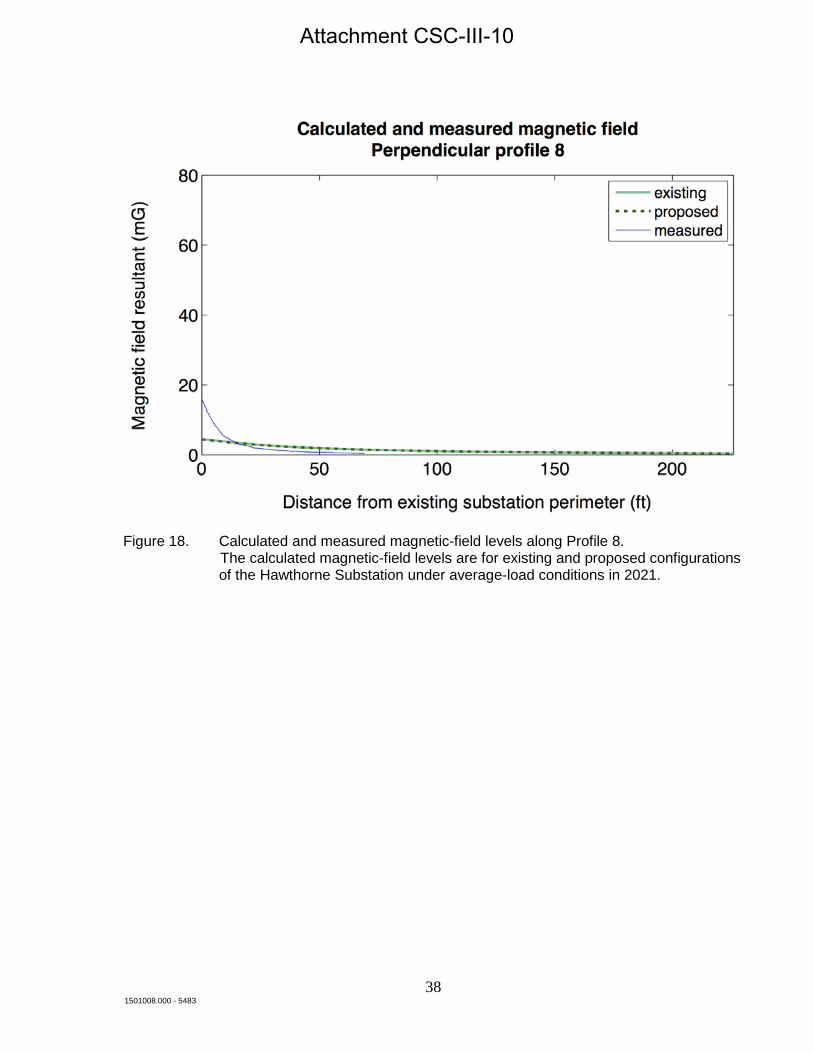
Figure 18. Calculated and measured magnetic-field levels along Profile 8.
The calculated magnetic-field levels are for existing and proposed configurations of the Hawthorne Substation under average-load conditions in 2021.
38 1501008.000 - 5483
Attachment CSC-III-10
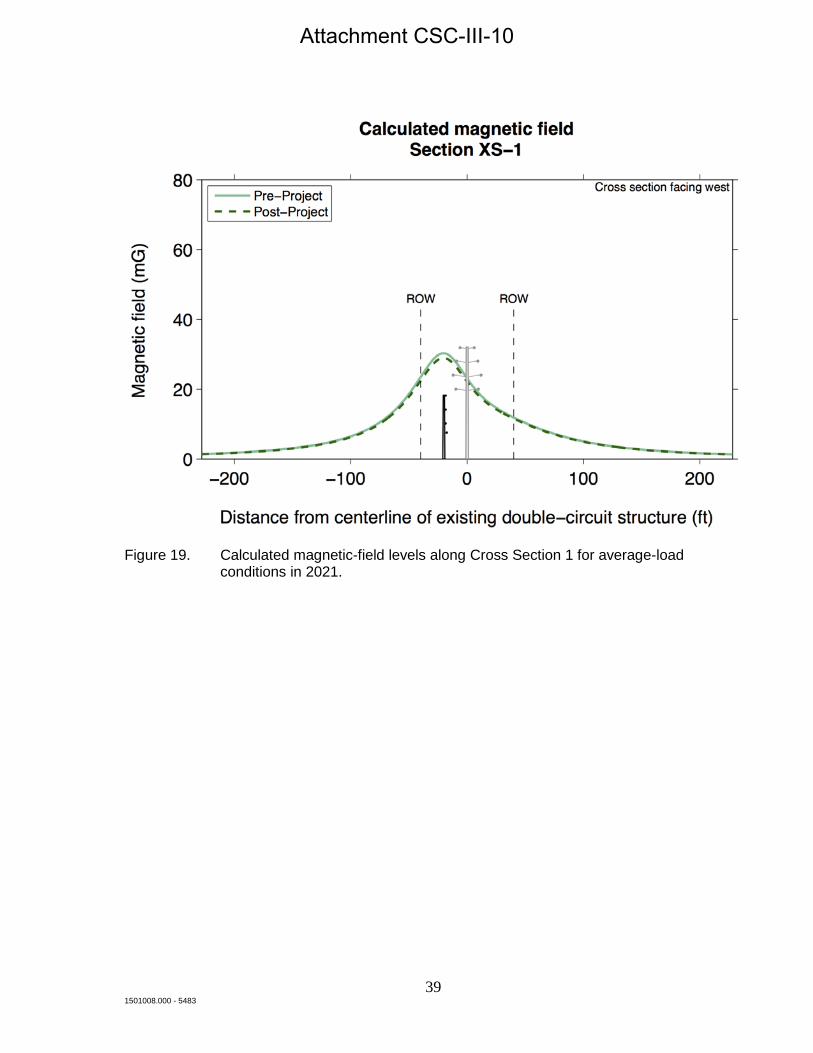
Figure 19. Calculated magnetic-field levels along Cross Section 1 for average-load
conditions in 2021.
39 1501008.000 - 5483
Attachment CSC-III-10

Figure 20. Calculated magnetic-field levels along Cross Section 2 for average-load
conditions in 2021.
40 1501008.000 - 5483
Attachment CSC-III-10
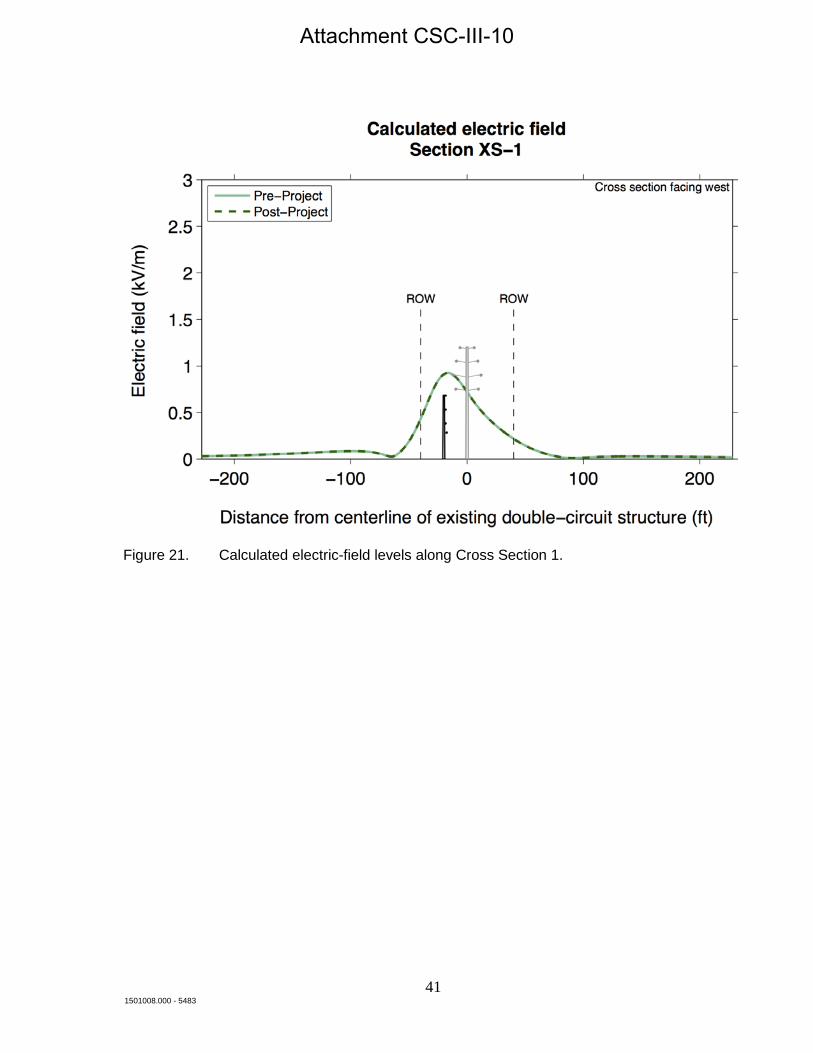
Figure 21. Calculated electric-field levels along Cross Section 1.
41 1501008.000 - 5483
Attachment CSC-III-10
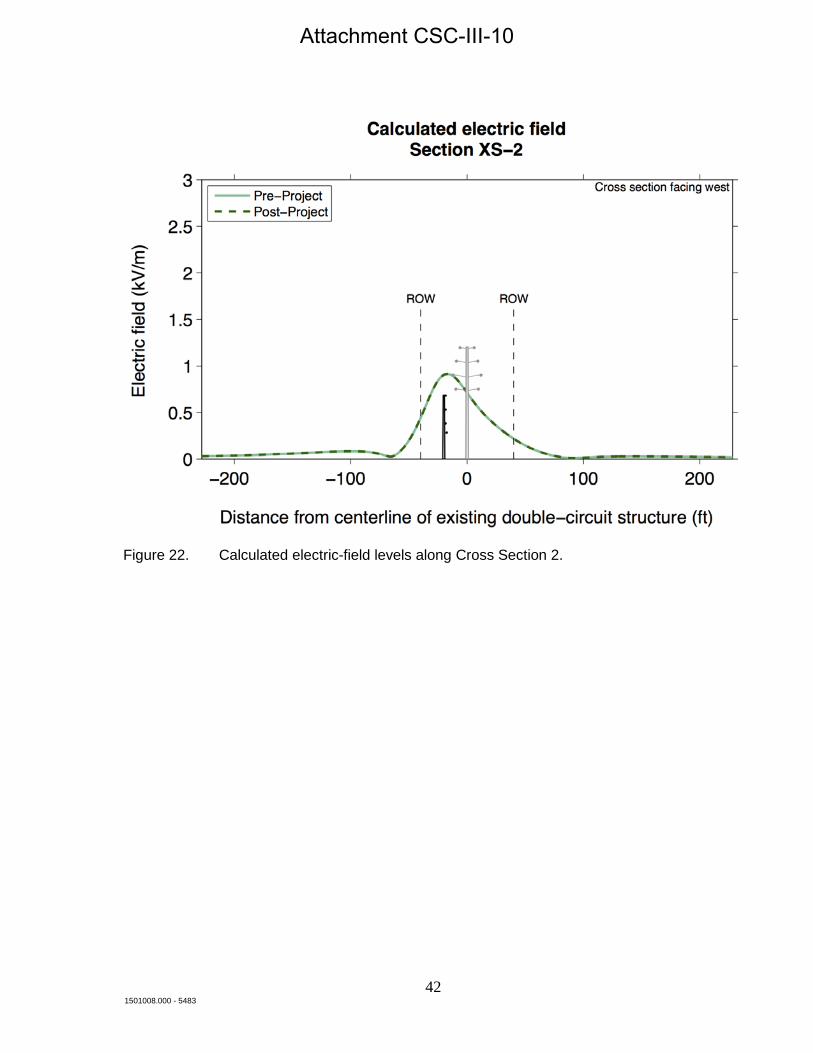
Figure 22. Calculated electric-field levels along Cross Section 2.
42 1501008.000 - 5483
Attachment CSC-III-10

Figure 23. Location of electric field-measurements
43 1501008.000 - 5483
Attachment CSC-III-10
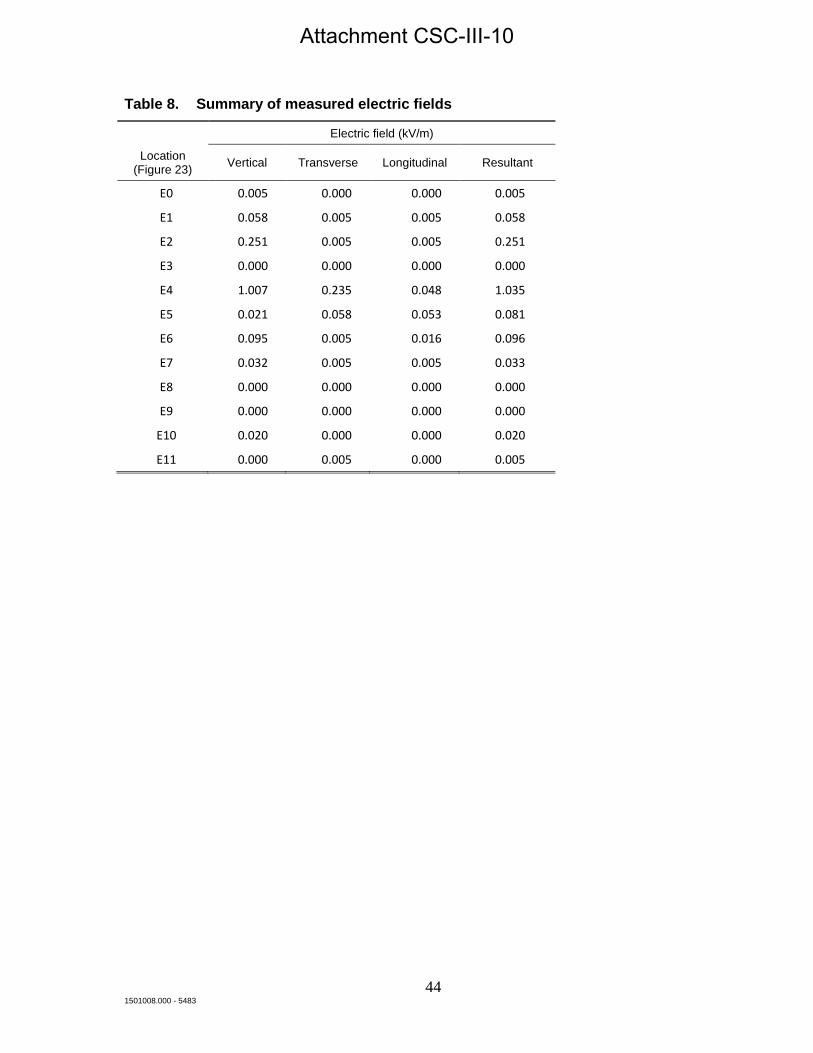
Table 8. Summary of measured electric fields
Electric field (kV/m)
Location (Figure 23) Vertical Transverse Longitudinal Resultant
E0 0.005 0.000 0.000 0.005
E1 0.058 0.005 0.005 0.058
E2 0.251 0.005 0.005 0.251
E3 0.000 0.000 0.000 0.000
E4 1.007 0.235 0.048 1.035
E5 0.021 0.058 0.053 0.081
E6 0.095 0.005 0.016 0.096
E7 0.032 0.005 0.005 0.033
E8 0.000 0.000 0.000 0.000
E9 0.000 0.000 0.000 0.000
E10 0.020 0.000 0.000 0.020
E11 0.000 0.005 0.000 0.005
44 1501008.000 - 5483
Attachment CSC-III-10
![IN THE UNITED STATES DISTRICT COURT - Civil Rights … · IN THE UNITED STATES DISTRICT COURT ... [118] should be DENIED as withdrawn, and plaintiffs' Motion to Compel Interrogatory](https://img.pdfslide.us/doc/110x75/5b0d68097f8b9abc0a8d94b8/in-the-united-states-district-court-civil-rights-the-united-states-district-court.jpg)