Embed Size (px)
Citation preview

STATE HIGHWAY ADMINISTRATION
RESEARCH REPORT
INTERRELATIONS BETWEEN VARIABLE MESSAGE SIGNS AND DETOUR OPERATIONS IN THE I-95 CORRIDOR
UNIVERSITY OF MARYLAND
SP007B4G FINAL REPORT
August 2002
Maryland Department of Transportation State Highway Administration
Parris N. Glendening Governor John D. Porcari Secretary Parker F. Williams Administrator
MD-02-SP007B4G

Interrelations Between Variable Message Signs
and
- Detour Operations in the I-95 Corridor -
(Final Report) to
Maryland State Highway Administration by
Gang-Len Chang and Xiang Fei
Department of Civil and Environmental Engineering,
University of Maryland, Maryland, College Park, MD 20742
and
Jean Yves Point-du-Jour Maryland State Highway Administration
August, 2002

Technical Report Documentation Page
4. Title & Subtitle Interrelations between variable message signs and detour operations in the I-95 corridor
5. Report Date August 2002
6. Performing Organization Code
7. Author/s Gang-Len Chang, Xiang Fei, and Jean Yves Point-du-Jour
8. Performing Org. Report No.
9. Performing Organization Name and Address University of Maryland College Park, MD 20742
10. Work Unit No. (TRAIS)
11. Contract or Grant No. SP007B4G
12. Sponsoring Organization Name and Address Maryland State Highway Administration Office of Policy & Research 707 N. Calvert Street Baltimore, MD 21202
13. Type of Report Final report
14. Sponsoring Agency Code
15. Supplementary Notes
16. Abstract To best use existing VMS to contend with both recurrent and non-recurrent congestion, this study has investigated various critical issues associated with their potential applications on the I-95 corridor between Baltimore and Washington Beltways, including appropriate messages to be displayed under recurrent and non-recurrent congestion; interrelations between VMS and traffic detour operations during severe accidents; and coordination between the targeted detour volume and signal control on surface streets. The research results have indicated that both recurrent and non-recurrent congestion delay can be reduced substantially with properly displayed messages on VMS and effectively integrated operations between the freeway and its detour routes. 17. Key Words variable message signs, detour operations
18. Distribution Statement This document is available from the Research Division upon request
19. Security Classification (of this report) None
20. Security Classification (of this page) unclassified
21. No of pages
22 Price
Form DOT F1700.7 (8-72) Reproduction of form and completed page is authorized.
1. Report No. MD-02-SP007B4G
2. Government Accession No 3. Recipient’s Catalog No.

1
Table of Contents Table of Contents .......................................................................................................................... 1 Chapter 1 Introduction................................................................................................................. 3
1.1 Background ............................................................................................................................ 3 1.2 Research Objectives............................................................................................................... 3 1.3 Organization of the Report .................................................................................................... 4
Chapter 2 VMS Classification and Evaluation - for Non-Recurrent Congestion................... 6
2.1 Introduction............................................................................................................................ 6 2.2 A1 - Report of Incidents and Detour Information................................................................. 7 2.3 A2 - Display of Advisory Speed Information during Non-Recurrent Congestion.............. 10 2.4 A3 - Report of Incidents and the Resulting Delays ............................................................. 12
Chapter 3 VMS Classification and Evaluation - for Recurrent Congestion ......................... 16
3.1 Category B: Display of Recurrent Congestion Information................................................ 16 3.2 B1 - Report of Recurrent Congestion Locations and Traffic Queues ................................. 16 3.3 B2 - Report of Recurrent Congestion Locations and Delays .............................................. 19 3.4 B3 - Report of Speed Related Information during Recurrent Congestion........................... 21 3.5 B4 - Display of General Traffic Conditions during Recurrent Congestion......................... 22 3.6 B5 - Display of Work Zone Traffic Conditions ................................................................... 24
Chapter 4 VMS Classification and Evaluation - General Advisory Information................. 27
4.1 Introduction.......................................................................................................................... 27 4.2 C1 - Advising Motorists of Proper Driving Behavior ......................................................... 27 4.3 C2 - Providing Route Guidance Information....................................................................... 29 4.4 C3 - Informing Drivers of the Roadway Surface and Environmental Conditions .............. 30 4.5 C4 - Displaying Estimated Travel Time between Key Locations ....................................... 31 4.6 C5 - Display of the Available Channel for Highway Advisory Radios (HAR) .................. 32 4.7 C6 - Offering the Information of Special Events related Traffic Impacts and Navigation . 33 4.8 Effectiveness of VMS Applications in the I-95 Corridor .................................................... 34
Chapter 5 Optimal Diversion Control in Freeway Corridors with VMS.............................. 43
5.1 Introduction.......................................................................................................................... 43 5.2 Formulations of Dynamic Traffic State Evolution on both the Freeway and Detour Routes ...................................................................................................................... 44
Traffic State Evolution on Surface Streets........................................................................... 46 Traffic State Evolution on Freeway and Ramp Links.......................................................... 48

2
5.3 On-Line Estimation of Model Parameters ........................................................................... 51 Estimation and Prediction of Turning Proportions ............................................................. 51 Estimation and Prediction of Diversion Compliance Rates ................................................ 51
5.4 An Optimal Control Model.................................................................................................. 52
Objective Function............................................................................................................... 52 Model Constraints................................................................................................................ 52
5.5 The Solution Algorithm....................................................................................................... 54
Inner-Loop Iteration ............................................................................................................ 55 Successive Linear Programming (SLP) Algorithm.............................................................. 57 Outer-Loop Iteration............................................................................................................ 57
5.6 Numerical Examples............................................................................................................ 59 5.7 Conclusion ........................................................................................................................... 61
Chapter 6 Optimal Detour Rates with VMS during Non-Recurrent Congestion in the I-95 Corridor ................................................................................................. 63
6.1 Introduction.......................................................................................................................... 63 6.2 Distribution of Incidents in the I-95 Corridor between Two Beltways ............................... 64 6.3 Methodology for Simulation Experiments .......................................................................... 68 6.4 Optimal Detour Rates from Simulation Experiments.......................................................... 69
Chapter 7 Conclusions and Recommendations ........................................................................ 73
7.1 Summary of Research Findings ........................................................................................... 73 7.2 Recommendations for Further Research ............................................................................. 75
References.................................................................................................................................... 77

3
Chapter 1
Introduction
1.1 Background
Despite the emergence of various technologies and products for Advanced Traveler Information Systems (ATIS), variable message sign (VMS) remains the most popular ATIS components for real-time display of traffic conditions to en route drivers. Through properly designed messages, operators for traffic control can inform motorists about the traffic speed, delay, or queue length under either recurrent or non-recurrent congestion. Traffic control centers may use VMS to provide detour suggestions or instructions to drivers during severe congestion. VMS may also be used to direct motorists to tune into Highway Advisory Radio (HAR) for additional traffic information or incident reports.
The effectiveness of VMS with respect to mitigating congestion and increasing safety,
however, depends on a variety of factors, including: credibility and timeliness of displayed messages, the location of VMS, preference of driving populations, and proper integration between VMS and traffic control strategies such as ramp metering and detour operations. For instance, a message that is poorly structured, lengthy, or unreliable is doomed to fail in achieving its desired effect. In fact, it may cause unexpected slow down of traffic as drivers are attempting to comprehend the displayed messages. Also, one may not expect drivers to comply with the detour suggestion if VMS is not placed in a proper sequence of locations. Therefore, prior to the construction of a comprehensive VMS ne twork, it is essential that a rigorous investigation of the following critical issues be conducted: • What messages should be displayed for non-recurrent congestion? • What messages should be displayed for day-to-day recurrent congestion? • What are the optimal locations for VMS, given the current budget? • What is the optimal detouring rate under different levels of congestion at different network
locations? • How to best integrate the potential VMS impacts with traffic control operations so as to
minimize traffic delay during severe incidents? 1.2 Research Objectives
This study is proposed to investigate all the above critical VMS issues; however, its scope is limited to the I-95 corridor between the Baltimore and Washington Beltways. To explore the potential benefits of detouring freeway traffic during severe accidents, this study will also model the interrelations between reduced freeway capacity, the optimal detour rate, and the resulting optimal signal settings on surface streets. More specifically, the objectives of this research include:

4
• Review and evaluation of potential VMS applications on the I-95 corridor; • Estimation of the optimal detouring rate for various types of severe accidents that may incur
on the I-95 corridor between the Baltimore and Washington Beltways; and • Modeling of the interrelations between the capacity reduction due to lane blockages, the
optimal detour rate for a selected route, and the signal adjustment needed to accommodate the increased traffic flow on surface streets.
1.3 Organization of the Report
Research results with respect to the above critical issues have been organized into the following Chapters:
Chapter 2 focuses on the review and evaluation of VMS related literature for non-
recurrent congestion and those VMS used in the I-95 corridor, including messages for:
• Reporting incidents and detour suggestions; • Reporting incidents and advisory speed; and • Reporting incident and resulting delay.
Chapter 3 presents the assessment results for VMS reported in the literature and those
used in the I-95 corridor for contending with recurrent congestion, including:
• Reporting recurrent congestion location and traffic queue; • Reporting recurrent congestion location and resulting delay; • Reporting recurrent congestion location and advisory speed; • Reporting recurrent congestion location and general advice; and • Reporting work zone traffic conditions.
Chapter 4 intends to evaluate those commonly displayed messages designed mainly to
offer general information to roadway users but not in the above two categories. It includes the following topics:
• Advising motorists of proper driving behavior; • Providing route guidance for target destinations; • Informing drivers about roadway surface conditions; • Displaying estimated travel time between key locations; • Indicating the available channel for HAR; and • Providing the information for special events that may impact traffic flow.
The results of a pilot survey for the use of VMS to report recurrent and non-recurrent
traffic congestion along the I-95 corridor are presented in this chapter. Responses of drivers regarding some VMS messages commonly displayed by Maryland State Highway

5
Administration (MSHA) during work-zone operations will also be included in the evaluation report.
Chapter 5 presents the development of a theoretical framework that will enable traffic operators in the control center to implement an optimal detour plan, including the time-varying ramp metering rate, signal timings on proposed detour routes, and the anticipated detour rate under the displayed VMS messages. The developed model for integrated traffic diversion control during non-recurrent congestion is based on the following information:
• Incident location and the resulting capacity reduction; • Time-varying traffic volume on the freeway and detour routes during the incident period; • Projected duration to clear a target incident; • Number of signalized intersections on the proposed detour route; and • Available capacity on the detour route.
It is expected that the proposed model, after improving computing speed, can be used for
on- line operations. Operators in the traffic control center will be able to adjust signal timings and ramp metering rate in a timely manner, and to minimize the total system delay during severe incidents.
Chapter 6 reports the simulation results of two vital issues: the optimal detour rate for
various types of incidents that may incur at different locations in the I-95 corridor between two Beltways, and the resulting benefits due to proper detour operations. The extensive set of simulation experiments was executed with the I-95/Route 1 simulator developed by this research team for MSHA.
All incident scenarios explored by the simulator were based on actual incident data
collected by the MSHA CHART program over the past 3 years. The available data include the number of lanes blocked, incident durations, locations, and traffic volumes on both I-95 and Route 1. The simulation results will enable traffic operators to better estimate the benefits of using VMS to detour traffic during various types of incidents. MSHA may also employ such information to perform a cost-benefit analysis when planning for additional VMS on the I-95 corridor.
Chapter 7 summarizes the research findings, experimental results, and potential
applications of the developed models. Conclusions along with further research needs and potential implementation issues will also constitute the core of this chapter.

6
Chapter 2
VMS Classification and Evaluation - for Non-Recurrent Congestion
2.1 Introduction
In review of the existing literature, it is evident that most VMS related studies tend to be qualitative in nature due to difficulties associated with field data collection. Over the past two decades, very limited research has been conducted on empirical work such as performing surveys of drivers under hypothetical traffic scenarios or simulated highway environments. The findings from those surveys vary with the design of experiments, but are often inconclusive or even inconsistent. Thus, despite the wide use of variable message signs on both freeways and surface streets over the past decade, a rigorous evaluation of their effectiveness under various traffic conditions remains to be a difficult yet imperative task.
While the development of effective guidelines for VMS operations awaits the availability
of reliable and comprehensive field data, this chapter is focused on analyzing various VMS applications in practice and assessing their effectiveness according to those reported in the literature. Through such a systematic analysis, it is expected that critical research issues associated with effective VMS applications as well as their priority of investigation can be identified.
To facilitate the analysis, this study has classified all existing VMS applications in
highway traffic management into the following categories: Category A: Display of non-recurrent congestion information, including:
A1- Report of incidents and detour suggestions; A2- Report of incidents and advisory speed; and A3- Report of inc ident and resulting delay.
Category B: Display of recurrent congestion information, including: B1 - Report of recurrent congestion location and traffic queue; B2 - Report of recurrent congestion location and resulting delay; B3 - Report of recurrent congestion location and advisory speed; B4 - Report of recurrent congestion location and general advice; and B5 - Report of work zone traffic conditions.

7
Category-C: Display of work-zone control and traffic conditions, including: C1 - Advising motorists of proper driving behavior; C2 - Providing route guidance for target destinations; C3 - Informing drivers about the roadway surface conditions; C4 - Displaying estimated travel time between key locations; C5 - Indicating the available channel for highway advisory radios (HAR); and C6 - Offering the information of special events related traffic impacts. Analysis of the aforementioned VMS systems will start with an illustration of their
information display structures in each category, followed by a presentation of some example messages used in practice. Research findings reported in the literature will be presented along with a pilot survey result for the effectiveness of VMS in the I-95 corridor between Baltimore and Washington D.C.
This chapter will first focus on the VMS application under non-recurrent congestion. The
other two categories of VMS systems will constitute the core of Chapters 3 and 4, respectively. 2.2 A1 - Report of Incidents and Detour Information
Most existing VMS designed for reporting incidents and detour information have been
displayed with either one of the following structures:
Type-1 structure: Type-2 structure:
1st line Incident messages Incident messages 2nd line Location Location 3rd line Detour information Additional location message, or without this line
As is notable from the above illustration, Type-1 messages, featuring their inclusion of
detour suggestions, are structured into three lines that explicitly separate the information regarding an incident, its location, and the suggested detour route. The location message may not be displayed if the detour information takes more than one line. Some examples of such VMS systems are presented below:

8
The primary difference between Type-1 and Type-2 VMS messages is in the provision of
detour information. As can be seen from all example applications presented below, the core information conveyed through the Type-2 design is a reported incident and its detailed location. These messages are designed to assist motorists in determining whether it is necessary to take detour routes. Drivers are supposed to make their decisions regarding the necessity of taking any detour routes.
Note that some Type-2 messages, as shown below, may be presented in one single line if the precise incident location data and its impact area are not available.
ACCIDENT AHEADKYLE STADIUM
USE ROWLAND AVE
ACCIDENT AHEADUSE I-95 TEMP BYPASS
NEXT EXIT
TO BYP ACCIDENTUSE SERVICE ROADTO CARTER CREEK
(see Dudek, 1986)
(used in Texas, see Dudek, 1986)
MAJOR ACCIDENT AHEADLEFT 2 LANES BLOCKED
ACCIDENT ATMERCER STREET EXIT
ACCIDENT XX MILE AHEAD
(used in Ontario, see Yim and Ygnace, 1995)
(used in Texas, see Dudek, 1986)
(used in Washington State)
ACCIDENT AHEADFREEWAY CLOSED
(used in California, see Miller, 1996;George et al., 1979)
ACCIDENT AHEAD
(used in Houseton, German and Dutch, see Wenger et. al., 1991)

9
The current practice of MSHA CHART program seems to favor the use of Type-2 VMS structure. This practice is as evidenced in the following examples which primarily report incidents and their locations, but do not provide detour suggestions.
Research Findings:
Most related studies in the literature reported that commuters are more willing to divert to alternative routes during accidents rather than during recurrent congestion (Heathington et al., 1971). Also, motorists generally prefer to see the VMS detailing the cause of congestion, rather than a vague message stating “congestion ahead.”
For instance, Jansen and Horst (1993) evaluated the Ringroad of Amsterdam and
concluded that commuters are more likely to correctly interpret the message when presented with specific information rather than a generic text. They were also more likely to correctly interpret the message when the reason was presented before task. In addition, most commuters also prefer to see the accident location information on the VMS. In a survey of commuters in Arlington, Virginia, Benson found that there was overwhelming support (i.e., 97 percent) for posting the “precise accident location” on VMS, so that motorists can best select their detour routes (Benson, 1996).
With respect to the necessity of offering the detour information, some experimental
results conducted in Virginia have shown that under heavily congested traffic conditions, approximately 60 percent of the respondents indicated that they would be “very likely” to try the alternative route posted on the VMS (TranSafety Reporter, 1997).
Approximately 35 percent of the respondents pointed out that they were not so confident
about following the detour suggestion due to the “fear of getting lost.” Similar findings have also been reported in other literature (Dudek, 1986; Wenger, 1993; Yves, 1994).
Aside from the lack of familiarity to the suggested route, several studies have also
discovered that some drivers prefer to be provided with traffic information rather than specific instruction as they appreciate their freedom of making choices (Jansen and Horst, 1993; Pedic et. al, 1999). Note that the discrepancy in responses to VMS messages may actually offer the
ACCIDENT AHEAD ON WWBRIDGE LEFT LANE BLOCKED
ACCIDENT AHEAD SOUTH OFEXIT 15 LEFT LANE CLOSED
ACCIDENT AHEAD NORTH EXIT15 MD 214
RIGHT LANE BLOCKED
(used in Maryland)

10
potential for better traffic management during the incident clearance period, as an excessively large detour volume may result in undesirable traffic conditions on the alternative route (Lyons, 1996).
Thus, the general guidelines with respect to the report of accidents with VMS can be
stated as follows (Yim, 1995):
• Clearly display the cause of congestion if it is due to an incident (i.e. ACCIDENT AHEAD, LEFT 2 LANES BLOCKED);
• Indicate the accident location as precisely as possible (i.e. 1 KM BEFORE AVENUE ROAD); and
• Provide the detour advice only if the accident is severe and the alternative route is familiar to drivers.
Note that traffic operators may replace the message of “accident” as “major accident” if
large volumes of drivers are expected to follow the displayed advice (Smiley, 1988). The timely display of appropriate messages for VMS may also serve to minimize the potential rubbernecking effect during an incident period.
2.3 A2 - Display of Advisory Speed Information during Non-Recurrent Congestion
The primary discrepancy between this category of messages for VMS and those in category A-1 results from the advice offered to drivers. While the latter provides the detour guidance to motorists in addition to the incident information, the messages in this category aim at informing drivers of the slow traffic ahead and the necessity of reducing their speed. Depending on the available details associated with an incurred incident, one may classify those VMS commonly seen in nationwide highway networks into the following structures:
Type-1 structure Type-2 structure Type-3 structure
1st line Incident message Incident message & location Advisory speed 2nd line Location Roadway condition (none) 3rd line Advisory speed Advisory speed (none)
As is notable from the above classification, Type-1 messages in this category are
designed to inform drivers about the incident location and the need to properly adjust their speeds. Examples of such Type-1 VMS systems are presented below:
ACCIDENT AHEADREDUCE SPEED
DELAYS AHEADAT TOLL PLAZAREDUCE SPEED
(used in Malaysia, see Hamid & Steed, 1998) (used in Maryland)

11
The potential effectiveness of offering the speed advice has not been well received. The
success of such advice depends on whether drivers can actually perceive the traffic queue when they are informed by the VMS system. In an empirical study by Smiley (1988), it has been found that about 50 percent of respondents were willing to reduce their speeds in response to a message advising for speed reduction, but only when they could actually observe the traffic backup. In contrast, drivers are less likely to comply with the advice to reduce speed if encountered with the message, such as “Speed 20-40 km/h next 10 km”, but the roadway condition observed by drivers does not motivate them to take any action.
In view of such concerns, Type-2 structure intends to display not only the accident
information but also the resulting roadway condition. This structure assumes that drivers will more likely comply with the suggestion if they have better knowledge of the incurred incident. Some examples of such Type-2 messages are presented below:
Although data relating to the effectiveness of such a VMS structure is not yet available in the literature, most researchers believe that it shall have the potential to reduce rubbernecking effects and secondary incidents. For instance, Benson (1996) in one of his studies indicated that the VMS information such as “ACCIDENT AHEAD/ALL LANES OPEN/MAINTAIN SPEED” could be an effective anti-rubbernecking message if it is posted when the impacts of an accident can be seen along the road but all travel lanes have been cleared.
Messages in the Type-3 structure differ significantly from those in the previous two
types, intending to convey simply the information of slow traffic conditions without any specific detail. These messages are believed to be sufficient for incidents that do not incur lane closure, or for minor incidents that cause shoulder blockage. An empirical study conducted by Yim (1995) has indicated that most motorists will reduce approximately 5 mph after receiving such messages. Some examples of Type-3 messages are presented below:
ACCIDENT AHEADALL LANES OPENMAINTAIN SPEED
TUNNEL ADVISORYACCIDENT AHEAD
REDUCE SPEED
ACCIDENT AHEADLEFT LANE BLOCKED
REDUCE SPEED
(used in Arlington, VA, see Benson,1996) (used in Minnesota)
(used in Maryland)

12
2.4 A3 - Report of Incidents and the Resulting Delays
Similar to those in the previous two categories, one can structure commonly used messages for reporting incidents and resulting delay into the following types:
Type-1 structure Type-2 structure Type-3 structure
1st line Incident location Incident location Delay information 2nd line Delay information Delay information (none) 3rd line Detour instruction (none) (none)
Conceivably, the above Type-1 structure, recommended by Dudek (1979; 1986), contains
the most detailed message for detouring traffic during the period of incident operations. Some examples of such messages are presented below:
ACCIDENT AHEAD, 4KM,AVOID DELAYUSE ROUTE 14
ACCIDENT AHEAD20 MIN DELAY
USE SERVICE ROAD
ACCIDENT AHEADUSE SERVICE ROAD
SAVE 20 MIN
SLOWING AHEAD
SLOW DOWNACCIDENT AHEAD
(used in Santa Monica Freeway, CA)

13
In investigating effective ways for displaying real-time motorist information, Dudek (1986) regarded the messages for Type-1 structure as those designed for diversion and description of the traffic condition. He indicated that when surveillance and prediction capabilities are reliable, messages describing traffic conditions as “XX minutes delay “ could be used to convince drivers that using an alternate route will be better than remaining on the current freeway. The same study also points out that messages that report traffic conditions, which imply a comparison between the primary and alternate routes, should be presented along with a message providing the direction to an alternate route.
The aforementioned messages may be replaced with more specific quantitative traffic
condition information if the agency responsible for traffic management has effective surveillance systems that offer reliable travel time information. The need to have a reliable surveillance system is precisely the reason that such messages, although theoretically appealing, have not been widely used in practice. An alternative to this is to use the Type-2 structure that replaces the “specific delay or extra travel time,” with a warning such as “expect delays,” or “long delays.” Some example messages for the Type-2 structure are presented below:
As is noted in the examples above, this type of messages only informs motorists that an incident has incurred and caused traffic delay, but does not provide suggestions for them to take necessary actions. Thus, despite the popular use of such messages, their effectiveness with respect to detouring traffic remains a challenging research issue.
CAMDEN TOWNACCIDENT
EXPECT DELAYS
ISLINGTONACCIDENT
LONG DELAYS
ACCIDENT AHEADXX MIN DELAY
(used in London since 1994, see Hounsell and Bonsall, 1998)
(used in CA, see Miller, 1996)
ACCIDENT AHEADAT EXIT 25
EXPECT DELAYS
ACCIDENT US 50WEST OF EXIT 5 MD 410
EXPECT DELAYS
(used in MD)

14
A recent study conducted by Hounsell (1998) in central London at Archway and North
London, has revealed that when faced with a message of “CAMDEN TOWN ACCIDENT EXPECT DELAYS,” 54 percent of the survey respondents stated that they would divert at the very next opportunity, and 14 percent of them expressed the likelihood of delaying their diversion decision until encountering traffic problems. In contrast, 32 percent of respondents stated that they would not divert at all for fear that traffic conditions would be just as bad on alternate routes. The respondents consisted of males (82 percent) and drivers who were very familiar with the roads in north London and frequently traveled the area.
Wagner et al. (1997) performed an evaluation of the content for VMS, and found that the
“delay” information may be considered more useful to motorists than the associated travel time. The display of expected travel time is problematic because motorists may often question its accuracy unless a reliable system for predicting traffic conditions is available (Dudek, 1992). Thus, alternatively, one may provide only the approximate delay due to incidents to motorists. Several studies in the literature (Huchungston and Duedek, 1979; Heathington, Worrall and Hoof, 1970) have also reported similar research findings, indicating that drivers prefer to see messages stating “EXTRA DELAY-10 TO 20 MINUTES/NEXT 3 MILES” than that of “TRAVEL TIME 15-25 MINUTES/NEXT 3 MILES.”
Messages for Type-3 can be viewed as a simplified version of those for Type-2. This type
of message, providing only the estimated delay times but not the incident location, has been used in California, but not very common in other states. This is mainly due to the concern that without indicating the cause of delay, motorists may question the credibility of such messages and consequently degrade their effectiveness (Wong, 1999; Pedic et. al., 1999). Some examples of Type-3 messages are presented below:
ONE HOUR DELAY
XX MI DELAY
EXPECT LONG DELAY

15
Concluding Comments:
It is clear that properly incorporating the delay related information onto a VMS remains a challenging and on-going issue in the traffic control community. Some research findings reported in the recent studies regarding this critical issue are summarized below:
• Travelers are more likely to respond to quantitative delay information, and are relatively
insensitive to demographic data displayed on VMS (Benson, 1996; Polydoropoulou, 1996); • Motorists prefer to have the numerical delay information rather than qualitative delay
statements (Wong, 1999); and • Messages displayed on VMS should be clear and specific, but not so detail that require
drivers to slow down and result in traffic backups.
It should be noted that the above conclusions are grounded on the assumption that the numerical delay information is sufficiently reliable and has established its credibility among drivers. Otherwise, motorists may prefer to see the message such as "accident ahead, expect long delays,” rather than unreliable estimations of delay or travel time (Benson 1996; Smiley, 1988; Yim, 1995).

16
Chapter 3
VMS Classification and Evaluation - for Recurrent Congestion
3.1 Category B: Display of Recurrent Congestion Information The purpose of VMS in this category is designed to inform motorists of the upcoming
recurrent congestion. This may include traffic conditions on alternate routes for potential detour operations. Different from incident scenarios, it is more likely that no specific “cause” can be reported to motorists for day-to-day recurrent congestion. Thus, messages for VMS used in practice for reporting recurrent traffic congestion and the resulting delay or queue, are structured along the following lines:
• B1 - report of recurrent congestion location and resulting traffic queue; • B2 - report of recurrent congestion location and resulting delay; • B3 - report of recurrent congestion location and the advisory speed; • B4 - report of recurrent congestion location and general advice; and • B5 - report of work-zone traffic conditions and the implemented control.
The basic structure of commonly used messages in each category, along with example
systems, are presented in sequence in the ensuing sections. 3.2 B1 - Report of Recurrent Congestion Location and Resulting Traffic Queue
As reported in the previous chapter, messages available for display on VMS may vary with the function of the traffic control center and the capabilities of its surveillance system. Depending on the availability of information associated with detected recurrent congestion, one can classify most messages for VMS for this category of applications into the following three distinct types: Type-1 Type-2 1st line An upcoming location An upcoming location 2nd line Downstream traffic queue Downstream traffic queue 3rd line Queue on the alternative route
Type-3 1st line An upcoming location and queue message 2nd line Suggestion of alternative route

17
In the previous illustration, Type-1 structure offers motorists a comparison of traffic conditions between the current and the alternate routes, and allows them to make their own decision. Examples of these message types presented below can be seen in Amsterdam, Netherlands (Eden, 1996; Kraane and Nanne, 1999).
RING-SOUTH 4 KM QUEUERING-WEST NO QUEUE
DIRECTION SCHIPHOLVIA A10 4 KM QUEUE
VIA A9 NO QUEUE
(used in Amsterdam, Netherlands)
RING-SOUTH 4 KM QUEUERING-WEST NO QUEUE
DIRECTION SCHIPHOLVIA A10 4 KM QUEUE
VIA A9 NO QUEUE
(used in Amsterdam, Netherlands)
The first line of such VMS systems, as used in Netherlands, always displays the name of
a place that is in the vicinity of a convergence point, and is well known to frequent road users. The second line describes the upcoming queue length on the current route, and the third line presents the traffic condition on the alternate route.
The logic behind such a design is that drivers are more likely to take a detour plan if they
are given with the comparison between the upcoming congestion and the smooth traffic condition on the alternate route. A study for drivers in the Paris region indicates that a large number of motorists were willing to take longer trips even on routes not normally traveled to avoid congested areas when they were provided with reliable real-time traffic queue information (Yves, 1993, 1994). A similar conclusion has also been reported in an earlier study by Smiley for commuters in Ontario (Smiley, 1988).
It should be noted that the effectiveness of the above Type-1 messages depends on
whether the traffic control center can reliably estimate traffic queues on the current and alternate routes. Without extensive surveillance and traffic prediction capabilities, most highway agencies are not able to offer this type of real-time traffic information, and therefore should not adopt this type of message structure.
Due to the lack of advanced traffic surveillance systems, many agencies responsible for
traffic management tend to employ Type-2 messages that provide only qualitative queue information. Examples of such messages, popular in both the U.S. and Europe, are presented below:

18
It should be noted that although the above messages do not rely on an advanced
surveillance system, their effectiveness on mitigating traffic congestion has raised increasing concerns among the traffic engineering community. Quite a number of reports on VMS applications have indicated that such messages, providing neither the “cause” of congestion nor the resulting “queue length,” may not be credible and therefore is often ignored by the driving populations (Bonsall et. al, 1992; Wilkie, 1997; Pedic, 1999).
Differing from the two previous message structures, Type-3 structure is designed to
mitigate the traffic congestion by informing motorists about the upcoming queue and suggesting an alternate route. However, Type-3 structure suffers from the same credibility issue as with the Type-2 messages. Most drivers tend to stay on their originally selected route unless they have foreseen a substantial travel time reduction on the alternate route and are confident that the information provided by VMS is accurate. Research findings:
In summary, it is conceivable that the impact of VMS on traffic conditions under day-to-day recurrent congestion is not as significant as expected. Ideally, when sufficient surveillance capabilities are available, the responsible traffic agency shall provide the estimated queue or delay on both the current and alternate routes. This will allow drivers to make the best decision with regard to selecting a route and could potentially reduce the overall congestion in the network. Traffic agencies may choose to display an alternate route on VMS during severe congestion if the target motorists are local commuters who have good knowledge of traffic conditions on the suggested route. However, if the credibility of the VMS information cannot be established, it is suggested that the traffic agency should inform drivers about the approaching congestion with messages such as “SUDDEN SLOWING AHEAD,” or “SLOW TRAFFIC/ 1 MILE AHEAD.”
COENTUNNEL FREE OF QUEUE
SLOW TRAFFIC 1 MILE AHEAD
QUEUE AT QUEENSFERRY
(North Wales, see Overton, Graham and Newton, 1998)
CURRENT BACKUP 1 MILE
(Netherlands, see Buijin and Schouten, 1992)
(used in Minnesota)

19
3.3 B2 - Report of Recurrent Congestion Locations and Resulting Delays
Rather than reporting the traffic queue, some traffic management agencies prefer to inform motorists of the expected delay due to day-to-day recurrent congestion. Such messages for VMS, depending on the both the availability and reliability of information, may include the specific location of congestion, estimated delay, and/or instructions to drivers. Most existing VMS in this category can be classified into the following three categories:
Type-1 Type-2 1st line Delay information Delay information 2nd line Location of congestion Location of congestion 3rd line Instruction to drivers
Type-3 1st line Delay information 2nd line (none)
Note that the above Type-1 VMS structure, containing both delay information and instructions to drivers, are quite popular in the State of Maryland. Some examples of these messages are presented below:
As shown in the above examples, this type of VMS is designed to provide information relating to approaching traffic delays and congested locations. They also provide advice to drivers with respect to a desired driving behavior (e.g., stay alert, or keep left). The effectiveness of such a design depends on how well motorists interpret and trust the messages displayed. Some recent studies on this subject have reported that VMS with such contents may not have any significant impact on drivers and the traffic condition (e.g., Bolelli and Rutley, 1991; McDonald and Richards, 1998). This is due to the fact that the message of “expected delay” does not
EXPECT DELAYSRAMP TO I-695 WEST
STAY ALERTI-95 THRU TRAFFIC KEEP LEFT
EXPECT DELAYS AHEADTO EXIT 3 MD 97
STAY ALERT
DELAYS CONTINUETO EXIT 31 MD 97
STAY ALERT DELAYS TO AND ONI-270 NORTH STAY ALERT
THRU TRAFFICKEEP LEFT TO
AVOID DELAYS AHEAD

20
indicate the congestion level clearly to the motorists, and the advice of “stay alert” is too general to be useful. The Type-1 VMS structure also contains too many words that may result in an unexpected slow down of traffic flow when drivers attempt to comprehend the displayed message.
Some researchers strongly argue that the approximate delay time and location of
congestion should be provided to the motorists if responsible traffic agencies are able to do so with their available surveillance and traffic prediction capabilities. Examples of these Type-2 messages are presented below:
The resulting impacts of the above Type-2 messages on traffic conditions may vary with
drivers’ interpretation and assessment of the reported delay time. According to one study by Dudek (1992), drivers often interpret the message, “delay X minutes” as X minutes of extra travel time. This could be different from the information intended to be conveyed by traffic engineers who may consider X minutes of delay as the X amount of time traffic is stopped before it can move again. Thus, the actual amount of extra travel time may be longer than the displayed delay time.
To enhance the credibility of a VMS system, some researchers suggest that the message
of ‘EXTRA DELAY- 10 TO 20 MINUTES/NEXT 3 MILES’ may be replaced with ‘EXTRA TRAVEL TIME 15-25 MINUTES/NEXT 3 MILES’. But the research results by Heathington and Worral (1970) have indicated that the former message remains the preferred one, based on response to their surveys. Similar research findings have also been reported in the works by Smiley (1998) and Beers (1972).
It should be noted that a reliable estimate of delay or extra travel time is conditioned on
the availability of a comprehensive traffic surveillance system that may not exist in many highway networks. Thus, a commonly use alternative is to inform motorists of the approaching recurrent congestion with the following Type-3 messages:
EXPECT DELAY - 10 TO 20MINUTES/NEXT 3 MILES
VERTRANGING (DELAYS)/A10-W > A8 = 12 MIN/A10-C > A8 = O MIN
(see Eden & Lieshout, 1996)(see Dudek, 1992: Heatherington, Worall& Hoff, 1970)

21
A variety of studies with respect to the impact of Type-3 messages on the traffic condition have been reported in the literature. Most research findings indicate that such messages may not affect the traffic flow speed and drivers’ choice of route. For instance, the results of a comprehensive survey conducted by McDonald and Richards (1998) from Southampton, UK indicate that most respondents (about 68%) would take the same route even upon receiving the VMS warning of “LONG DELAY AHEAD” or “EXPECT DELAY” unless more specific information, such as “X MINUTES OF DELAY”, is also provided. In fact, many participants in the survey by Benson (1996) revealed their resentment toward the distraction of messages such as “CONGESTION AHEAD” which is actually a day-to-day experience for commuters.
Some researchers suggest that the message of “EXPECT DEALY” may be replaced with
a more complete message such as “DELAYS/QUEUES EXPECTED” or “EXPECT MAJOR DELAYS”. The advantage of having such messages, however, has not yet been investigated. A related study by Yim (1995) indicated that most motorists prefer the delay warning messages to be placed 2 to 3 km ahead of the congested location. 3.4 B3 - Report of Speed Related Information During Recurrent Congestion
In addition to the display of queue and/or delay, traffic speed related information has also been used as the core of messages on VMS. For instance, the following two types of speed related messages have been commonly employed by highway agencies:
Type-1 Type-2 1st line Current traffic flow speed Advisory speed 2nd line and/or location
Type-1 message is intended to inform motorists about the upcoming traffic flow speed,
allowing them to respond to the recurrent congestion. Examples of such messages are presented below:
LONG DELAY AHEAD EXPECT DELAYS
(used in North Wales, see Overton, Gram andNewton, 1998)
(used in Houston, see Wenger, 1991)

22
SPEED 20-40 KM/HNEXT 3 KM SPEED XX MPH
(Ontario, Canada: see Yim and Ygance, 1995) (used in CA, see Miller, 1996)
SPEED 20-40 KM/HNEXT 3 KM SPEED XX MPH
(Ontario, Canada: see Yim and Ygance, 1995) (used in CA, see Miller, 1996)
The above messages are often misinterpreted by drivers due to the concise format. For instance, Smiley (1988) conducted a study on the message of “SPEED 20-40KM/H, NEXT 3 KM”, and discovered that approximate 42 % of respondents correctly interpreted it as the average coming traffic flow speed. However, as many as 39% of those survey participants viewed the message as the advisory speed over the next 3km. The remaining respondents misinterpreted the speed limit to be 40km/h for the next 3km. Such a wide variation in interpreting this type of message clearly reflects its deficiencies. In fact, Yim and Ygance (1995) performed a VMS study in Toronto and found that the message, “SPEED 20-40KM/H, NEXT 3 KM” resulted in less diversion flow than with the message, “HEAVY CONGESTION, NEXT 3 KM”.
3.5 B4 - Display of General Traffic Conditions during Recurrent Congestion
In addition to reporting delay, queue length, or traffic flow speed, some highway agencies also employ the VMS to keep motorists informed of the upcoming traffic conditions with the following types of message:
Type-1 Type-2 1st line Congestion level Congestion level 2nd line Location
Similar to all previous categories of messages, the information in the Type-1 structure is intended to inform motorists of the congestion level and the approximate distance from the VMS location. Since the reported traffic congestion is recurrent in nature, responsible highway agencies can often identify the congested highway segments without relying on extensive surveillance systems. Thus, it is quite popular for highway agencies to display such messages on their VMS. Some examples of Type-1 messages are presented below:

23
These examples of messages intend to inform drivers of the congestion. However, since such messages are so concise, drivers often do not interpret them correctly. For instance, the message, “HEAVY CONGESTION/NEXT 3 KM”, is often interpreted by motorists as that the congestion will end in 3 km (see Smiley, 1988). A possible solution to this misinterpretation is to clearly state the traffic condition as: “HEAVY CONGESTION/ BEGINS NEXT 3 KM” (Dudek, 1986). Despite the likelihood of being misinterpreted, most motorists still prefer the message of “HEAVY CONGESTION/ NEXT 3 KM” rather than “SPEED 20-40 KM/H, NEXT 3 KM” (e.g., see Yim, 1995).
In addition to indicating the precise downstream location of congestion, this type of messages may also be placed directly ahead of the congested segment to serve as a reminder to drivers to take a necessary action. Examples of such messages are presented below:
Rather than indicating the precise location of congestion, some highway agencies may
choose to present the upcoming traffic conditions with a variety of messages. Examples of these messages include the following:
HEAVY TRAFFIC AHEAD BE PREPARED TO STOP
HEAVY TRAFFIC AHEAD USE CAUTION
(used in MD) (used in MD)
FILE (congestion)
A10-W > A8 = 6 KM A10-C > A8 = 6 KM
HEAVY CONGESTION NEXT 3 KM
(used in Toronto, Ontario Freeway) (used in Amsterdam Beltway)
CONGESTION BEGINS 1 MILE
(see Dudek, 1986)
HEAVY CONGESTION BEGINS AT GRIGGS AVE
(see Dudek, 1986)
CONGESTIONCONTINUES I-495 WEST
TO EXIT 31 MD 97
(used in MD)

24
These types of messages are quite concise, and do not rely on a comprehensive traffic
surveillance system. Their primary function is to remind drivers of the recurrent traffic condition that in most cases is quite familiar to commuters. Thus, the need to display these messages has often been questioned by both researchers and practitioners in the traffic management community (Venglar, 1993; Proffitt, 1998; Broken, 1991; Hounsell, 1998; Rutley, 1992).
3.6 B5 - Display of Work Zone Traffic Conditions Work zones are likely to cause shockwaves, traffic queues, and speed variations in the
traffic flow. It is a special type of bottlenecks that may incur not only day-to-day recurrent congestion but also traffic incidents. Highway agencies often use some types of messages for VMS in their highway work zones, intending to either warn drivers of the approaching roadway conditions or to enforce certain control to minimize the speed variances.
Depending on the level of capacity reduction in the work zone, respons ible highway
agencies may display the following messages to inform the approaching traffic about the current roadway condition:
• Type-1: Displaying the advisory or enforced speed limit in the work zone; and • Type-2: Informing motorists about those lanes being blocked and/or the detouring
alternative. The primary focus of Type-1 messages is to inform the approaching vehicles about work
zone operations, and encourage them to follow the traffic control instructions. This type of messages is generally viewed as essential in work zones regardless of the resulting capacity reduction. Examples of such messages commonly used by state highway agencies are presented below:
HEAVY CONGESTION NORMAL STOP AND GO
(see Miller et al., 1995; Yim, 1995; Bolelli and Rutley, 1991)
HEAVY TRAFFIC CONGESTION EXPECTED
SLOW TRAFFIC TRAFFIC NORMAL

25
Note that unlike some other types of VMS, the above messages are reasonably effective with respect to reducing the traffic speed in a work zone, especially when speed-monitoring devices are properly placed for displaying messages such as “YOU ARE SPEEDING SLOW DOWN”. For instance, Garber (1995) performed an evaluation of VMS at seven sites in Virginia, and concluded that the VMS displayed proper messages and speed monitors were more effective than the static MUTCD signs with respect to altering driver behavior in work zones. In contrast, some commonly used messages in work zones, such as “ROAD WORK AHEAD” and “ROAD WORK NEXT X MILES”, have been reported to have no impact on the traffic flow.
In addition to informing drivers of the required speed reduction, most highway agencies also use VMS to advise the approaching traffic about the merging operations. Some common examples of such applications are shown below:
ROAD WORK AHEAD MERGE LEFT
ROAD WORK AHEAD RIGHT LANES CLOSED
MERGE LEFT
(see Dudek, 1984)
(used in MD)
ROAD WORK AHEAD AT EX 29 AND MD 212
RIGHT LANE CLOSED
ROAD WORK AHEAD AT ROWLAND AVE
LEFT LANE CLOSED
(used in VA, see Miller, 1993)
(used in MD)
REDUCE SPEED IN WORK ZONE
ROAD WORK AHEAD SLOW 45 MPH
(see Miller, 1991)
(used by MnDOT) (see Richards, 1985; Wunderlich, 1986)
MAX SPEED 45 SLOW TO 45 MPH
REDUCE SPEED CONSTR AHEAD
HIGH SPEED SLOW DOWN
(see Miller, 1993)
(see Miller, 1993) (see Banner, 1990)

26
Note that if the roadway capacity in the work zone has been substantially reduced, a detour operation may be needed to mitigate the potential queue impact on the traffic flow. Under such circumstances, the VMS placed in advance of the work zone shall function to provide detour guidance to the approaching drivers. Some examples of these Type-2 messages are presented below:
Note that the above messages in work zones, in general, are more effective than other
messages, provided that drivers do not misread the messages due to a lengthy structure of the VMS. This is likely due to the fact that most drivers have experienced congestion and delay in work zones, and are more willing to fo llow the advice or instruction displayed.
ROAD WORK AHEAD EXIT 19 US 50 EAST RAMP CLOSED
FOLLOW POSTED DETOUR
SAT 15 MARCH A1 ARCHWAY ROADWAY WORKS
AVOID AREA
(used in London, see Hounsell and Bonsall, 1998)
(used in VA, see Miller, 1995)

27
Chapter 4
VMS Classification and Evaluation - General Advisory Information
4.1 Introduction
In addition to displaying recurrent and non-recurrent congestion related traffic conditions or route guidance, VMS may also be used to provide general advisory information to roadway users for the following purposes:
C1 - advising motorists of proper driving behavior; C2 - providing route guidance for target destinations; C3 - informing drivers about the roadway surface conditions; C4 - displaying estimated travel time between key locations; C5 - indicating the available channel for highway advisory radios (HAR); and C6 - offering the information of special events related traffic impacts. Examples of each aforementioned VMS application, along with their effectiveness
evaluation, are presented in sequence below.
4.2 C1 - Advising motorists of proper driving behavior
Under normal traffic conditions, some highway agencies often choose to display the following types of general advisory information on VMS:
KEEP YOUR DISTANCE DON'T DRINK AND DRIVE
SIGNAL BEFORE
CHANGING LANES
PLEASE DRIVE CAREFULLY
LIGHTS ON BAD WEATHER
BUCKLE UP

28
Although the above safety-related messages are commonly seen in most interstate highway systems, the necessity to do so is constantly being questioned by traffic control researchers. For instance, a report from INFORM (Information FOR Motorists) indicated that displaying messages, such as “NORMAL TRAFFIC CONDITION ADEAD”, are ineffective (Yim, 1995). The report also stated that there is a concern that motorists may not react to important messages if VMS are activated at all times.
Participants in a survey conducted in Virginia with respect to VMS applications also
expressed that displaying obvious traffic information such as “CONGESTION AHEAD” during rush hours would be a distraction rather than a benefit (TranSafety Reporter, 1997). Due to similar reasons, the VMS in the London highway network remain “blank” if there is no special information available.
In fact, many countries in Europe do not display safety advice messages, such as “KEEP
YOUR DISTANCE,” on VMS due to the concern that the display of such messages will reduce the effectiveness of traffic messages on other VMS (Jeffrey, 1996). Thus, to maintain the credibility, some researchers suggested that VMS should only be used to transmit essential information regarding changes in traffic conditions, and be used only when necessary (Wenger and Spyridakis, 1991).
For instance, Miller and Newman (1995) argued that VMS should be left blank if there
are no unusual traffic conditions to report. Washington State Transportation Center recommends that all messages on VMS should relate to real-time traffic conditions, avoiding “filler” messages such as “DRIVE TO SURVIVE” and “HAVE A NICE DAY” (Wilson, 1992).
However, some researchers in their studies argued that it would be beneficial to post
safety related advice such as “BUCKLE UP” and “LIGHTS ON BAD WEATHER” (Benson, 1996; Pedic, 1999). For example, Jeffrey (1999) found that 82 % of drivers in Scotland responding to his survey believed that a message should always be shown on VMS. Cummings and Fournier (1994) also reported some concerns raised by drivers that the blank display on a VMS may be interpreted as a system malfunction.
In brief, the discussion of whether messages related driving behavior and safety should be
displayed on VMS or not remains an on-going issue. The discrepancies of research findings from different geographical areas as well as different driving populations reveal that the answer for this issue may be location-dependent, and may vary across states. Therefore, it may be necessary to perform a location-specific driver opinion survey prior to the implementation of a comprehensive VMS system.

29
4.3 C2 - Providing Route Guidance Information Unlike the previous type of advisory messages for driving behavior, most researchers and
roadway users acknowledge that displaying route guidance information at proper locations will be appreciated. This type of messages can be used to inform drivers of a direction to a given destination, or to advise them of available detour routes under various traffic conditions. For instance, the following messages for route guidance have been commonly seen on most state highway systems:
Despite the recognized effectiveness of the above messages, it should be noted that only
those motorists who are not commuters will benefit most from such information, but their attempt to read the long messages on the VMS may cause traffic to significantly slow down, especially during peak hours. The above type of messages may also be used during detour operations due to either accidents or some special events. Some examples of these messages are shown below (Miller, 1996):
BEST ROUTE TO KYLE STADIUM INFORMATION 1 MILE AHEAD
BEST ROUTE TO KYLE STADIUM
USE OXFORD AVE
(see Dudek, 1984)
BEST ROUTE INFORMATION TO BEAUMONT
I-10 OR I-610 1 MILE AHEAD
KYLE STADIUM BEST ROUTE
OXFORD AVE 1 MILE
RAMP TO I-95 CLOSEDUSE ALTERNATIVE ROUTE
I-XXX AT EXIT XX CLOSEDFOLLOW DETOUR
(see Miller, 1996)
RAMP CLOSED AHEADEXIT 11 MD 124
USE ALTERNATIVE ROUTE
I-95 TUNNEL CLOSEDUSE I-895 SOUTH OR I-695 EAST

30
The above types of information are essential for the target group of motorists who would benefit if they are able to comprehend these displayed messages in a timely manner. As such, it is critical to keep these types of messages concise, and understandable to general public. When multiple routes are available to detour traffic and commuters are familiar with the area, it is suggested that highway agencies allow them to select their own alternate route by displaying the message, “USE ALTERNATIVE ROUTE”, or by clearly indicating the alternative route such as “USE I-895 SOUTH”. 4.4 C3 - Informing Drivers about the Roadway Surface and Environmental Conditions
This type of messages is intended to warn drivers of unexpected roadway surface conditions resulting from either changes in geometric design or some operational activities. Although the effectiveness of these messages has not been thoroughly investigated in the literature, most traffic professionals agree that such information is critical and should be conveyed to the upcoming motorists in a timely manner. Examples of such messages are presented below:
Such VMS may also be used to inform drivers of changes in the roadway environment that relate to unfavorable weather conditions. Some examples of such applications are presented below:
LOOSE GRAVEL ON ROAD POSSIBLY SLIPPERY
DEBRIS REMOVAL AHEAD DISABLED VEHICLES ON WW BRIDGE LEFT LANE
BLOCKED
ICY CONDITIONS ON BRIDGE USE CAUTION
ICY ROAD ADHEAD

31
A large body of literature in the study of VMS has consistently indicated that the above types of messages are under constant demand by roadway users, especially during severe winter conditions (Pouliot, 1994; Wilson, 1992; Proffitt, 1998; Rama, 2000). In general, drivers are more likely to have a strong desire to receive information about the impacts of weather on the roadway conditions and the resulting visibility along their travel route. Thus, the key research issue in this regard is how to concisely describe the hazardous conditions to get the attention of drivers. 4.5 C4 - Displaying Estimated Travel Time between Key Locations
During either congested or normal traffic conditions, VMS may be integrated with traffic surveillance systems to inform drivers about the estimated travel time between selected locations. This type of messages for VMS has not been used limitedly in the U.S. (e.g., San Antonio, Texas) due to the credibility concerns and the need to have comprehensive as well as effective surveillance systems. Such messages, however, would be quite beneficial to travelers if they can be reliable as those used in some European cities (Eden and Lieshout, 1996; Keatherington, 1970; Lai, 1999). Some example applications of such messages are presented below:
REDUCED VISIBILITYBLOWING SNOW AHEAD MAINTAIN 15 IN FOG
DENSE FOG AHEADSTAY ALERT
WIND GUSTS TO XX MPH
CAUTION: SLICK SPOTS SLIPPERY ROAD AHEAD

32
Aside from providing travel time information, the displayed messages, such as those used in Hong Kong, may serve to influence drivers’ choice of route, and consequently mitigate traffic congestion on major commuting routes. This type of applications can be used during either recurrent or non-recurrent congestion as long as the displayed travel time messages are viewed as credible. It, however, should be mentioned that most of these applications are limited to normal traffic conditions or recurrent congestion as travel times under those scenarios are relatively predictable, and need not to rely on advanced surveillance systems and prediction models.
In contrast, travel times during incidents are mostly unstable, varying with a variety of
factors, such as the number of blocked lanes, response of drivers to detour suggestions, and the incident clearance duration. Providing a reliable estimate of travel time under non-recurrent congestion has been well recognized as a difficult task even with an advanced sensor system. Thus, most highway agencies tend to select other messages such as “delay” or “queue length” rather than estimated travel time during non-recurrent congestion. 4.6 C5 - Display of the Available Channel for Highway Advisory Radios (HAR)
Although VMS are commonly used by most state highway agencies, such systems are quite limited in their capacity to precisely convey traffic related information to motorists. When detailed information is desired by motorists during either recurrent or non-recurrent congestion, VMS may function as a supplemental system to HAR and focus on informing drivers about
TRAVEL TIME 15-25 MINUTES NEXT 3 MILES
REISTIJD (TRAVEL TIME) A10-W > A8 = 19 MIN A10-C > A8 = 12 MIN
(used in San Antonio, Texas)
ESTIMATED JOURNEY TO CENTRAL
VIA: WESTERN KNOWLOON CORRIDOR AND CHT: 35 MINS
VIA: ROUTE 3 AND WHC: 15 MINS
(used in Amsterdam Beltway)
(used in Hong Kong)

33
where to receive a more detailed report or instructions from traffic management agencies. Some commonly displayed messages for these types of applications are presented below:
Note that the above VMS messages are commonly seen on most interstate highways.
Their effectiveness with respect to mitigating traffic congestion, however, has not been thoroughly explored. For such messages to be effective the HAR should be capable of providing meaningful and credible information that can be appreciated by drivers. In addition, these types of messages should only be displayed when drivers can benefit from listening to the HAR information. Otherwise, messages such as “TUNE INTO HAR” will be ignored unless most roadway users have the desire to listen to HAR news.
4.7 C6 - Offering the Information of Special Events related Traffic Impacts
and Navigation One of the most valuable functions of VMS is to provide traffic information during
special events, and offer alternate route information when available. According to an extensive field observation conducted in Dallas, Texas (Dudek, 1992), about 71 percent to 85 percent of drivers followed the alternate route suggestion displayed on the VMS during special events. Only less than 30 percent of drivers ignored the recommendations. The reasons for not following the suggestion of VMS were; (1) not understanding the message; (2) anticipating unsatisfactory traffic conditions on the suggested routes; (3) unfamiliar with the suggested alternate route; and (4) lack of confidence in the messages. Examples of such messages for special events are presented below:
RADIO TRAFFIC ALERT TUNE TO XXX AM
DELAY AHEAD TUNE RADIO 1630 AM
(used in Maryland)
US 20 ROAD CLOSURE PRIOR TO DC LINE
TUNE RADIO 1630 AM
ROADWORK AHEAD EXIT 19 US 50 EAST
TUNE RADIO 1630 AM

34
In summary, this type of messages can always achieve some level of effectiveness.
Regardless of drivers’ familiarity to the vicinity of the special event, traffic agencies should always place a series of such coordinated messages in proper locations of the suggested detour routes so that the expected congestion can be dissipated within the projected time horizon.
4.8 Effectiveness of VMS Applications in the I-95 Corridor
In addition to the above review and assessment of VMS applications, this study has also performed a pilot survey (Arricta, Clements, Rakas, Zhou, 1999) to evaluate the effectiveness of some typical messages for VMS operated by SHA in the I-95 corridor. Survey participants were sampled from employees with the University of Maryland, College Park who use I-95 as their primary commuting route. The preliminary results of this exploratory survey along with research findings are summarized below: • Survey response rate:
- 27.2 percent - A total of 427 questionnaires were distributed with a systematic sampling strategy,
and 116 were completed and returned for analysis. • Overall attention to messages for VMS:
- 58 percent: always pay attention to displayed VMS messages; - 40 percent: sometimes pay attention to displayed VMS messages; and - 2 percent: never pay attention to any VMS messages.
STADIUM TRAFFIC STAY RIGHT THRU TRAFFIC STAY LEFT
U. OF MD EVENT USE EX 25 US 1 SOUTH
EXPECT DELAYS
STADIUM BUSES AND DOWNTOWN TRAFFIC
USE EX 55 STADIUM TRAFFIC USE EX 53
ARMY NAVY GAME AND DOWNTOWN TRAFFIC
USE EX 55 STADIUM TRAFFIC USE EXIT 53

35
• Responses to messages for non-recurrent congestion: Message-A Message-B
- Is the message understandable: Message-A Message-B Yes: 91.6 % 98.8 % No : 8.2 % 1.2 % - Is the message useful to: - Ensure safety Yes: 54 % 48 % No : 44 % 48 % - Predict travel Yes: 42 % 46 % time No : 52 % 52 % - Help you select Yes: 51 % 64 %
a detour route No : 47 % 34 % - Reduce stress Yes: 38 % 37 % No : 48 % 57 % - Not useful Agree: 2 % 2 % No : 92 % 91 % In the second part of the survey, all survey respondents were asked to indicate if they would like to be provided with the following additional information during non-recurrent congestion:
ACCIDENT 495 WEST EXIT 33 MD 185
LEFT LANE
ACCIDENTS I-95 SOUTH PRIOR WW BRIDGE ALL LANES CLOSED

36
Message-A Message-B
- the length of delay: Yes: 54 % 43 % - alternate route: Yes: 64 % 69 % - the length of queue backup: Yes: 51 % 51 % - the average speed: Yes: 26 % 18 % Based on the above preliminary results, one may draw the following tentative conclusions regarding the effectiveness of the above pair of messages commonly displayed by SHA for non-recurrent congestion in the I-95 corridor:
• Both messages are quite understandable (> 90%) and desirable (> 95%) to survey participants, representing sample I-95 commuters.
• Approximately half of the survey respondents regarded the above pair of messages as
informative for selecting alternate routes and improving driving safety. However, they did not believe that these messages are useful for predicting travel time and reducing driving stress.
• In addition to the message providing accident locations, over 50 percent of the survey
respondents indicated that the alternate routes and the queue back-up lengths are the most desired information. Estimated traffic delay due to the accident is equally desirable to the motorists, but not the average speed.
• Responses to messages for work zones:
Message-A Message-B
ROADWORK AHEAD AT EXIT 43 MD 100
RIGHT LANE
ROADWORK AHEAD AT EXIT 33 AND EXIT 29 EXPECT MAJOR DELAY

37
- Is the message understandable: Message-A Message-B Yes: 92.3 % 89.3 % No : 7.2 % 1.1. % - Is the message useful to: - Ensure safety Yes: 52 % 51 % No : 43 % 48 %
- Predict travel Yes: 38 % 50 % time No : 42 % 42 % - Help your route Yes: 56 % 56 % selection No : 43 % 44 % - Reduce stress Yes: 42 % 36 % No : 48 % 37 % - Not useful Agree: 4 % 2 % No : 92 % 91 % In the second part of the survey, all survey respondents were asked to indicate if they would like to have the following information in addition to the above work-zone messages. The summary of survey results is presented below:
Message-A Message-B - the length of delay: Yes: 55 % 55 % - alternate route: Yes: 65 % 64 % - the length of queue backup: Yes: 56 % 57 % - the average speed: Yes: 27 % 24 %

38
The above results seem to reflect the following vital views from those survey respondents:
• Both work-zone messages are equally effective: understandable (> 90%), improving driving safety (> 50%), and assistance with route selection (> 50%).
• Both work-zone messages are sufficient to help reduce the stress of motorists, but not
informative for them to make a reliable prediction of travel time.
• The display of both work-zone messages should be accompanied by the information providing direction of alternate routes (> 60%), the estimated length of queue backup (> 55%), and the expected delay time (>50%).
• Responses to the following delay messages during traffic congestion:
Message-A Message-B - Is the message understandable: Message-A Message-B Yes: 78.8 % 80.9 % No: 20.2 % 15.5 % - Is the message useful to: - Ensure safety Yes: 48 % 33 % No: 43 % 58 %
- Predict travel Yes: 39 % 36 % time No: 52 % 52 % - Help your route Yes: 43 % 45 % selection No: 53 % 44 % - Reduce stress Yes: 32 % 33 % No: 58 % 57 % - Not useful Agree: 10 % 10 % No: 82 % 81 %
DELAY AHEAD PRIOR EXIT 29 MD 212
STAY ALERT
DELAY I-495 EXIT 27 TO EXIT 31 MD 97

39
Similarly, in the second part of the survey, all respondents were asked to indicate if they would like to have any of the following additional information provided along with delay messages:
Message-A Message-B - the length of delay: Yes: 58 % 51 % - alternate route: Yes: 61 % 54 % - the length of queue backup: Yes: 51 % 44 % - the average speed: Yes: 31 % 21 % The above messages that report the approaching traffic delay but not explaining its cause are not so well received as those messages for accidents and work-zone operations. This is consistent with research findings reported in the previous chapters. One may conclude the following observations from the above survey results:
• Both messages that offer a general description of delay are viewed by survey respondents as understandable (over 90 percent), but not informative. Most survey respondents regarded these types of general delay messages useless, especially for travel time prediction, route selection, and reducing stress.
• Given such delay messages, most motorists showed a strong desire to be provided with
additional information, including available alternative routes, estimated delay times, and the queue backup lengths.
• Responses to messages during traffic congestion:
Message-A Message-B
CONGESTION CONTINUES I-495 WEST
TO EXIT 31 MD 97
SLOW TRAFFIC I-495 WEST
MD 650 TO MD 97

40
- Is the message understandable: Message-A Message-B
Yes: 83.3 % 89.9 % No: 14.3.% 9.5 % - Is the message useful to: - Ensure safety Yes: 35 % 36 % No: 43 % 48 %
- Predict travel Yes: 42 % 44 % time No: 42 % 42 % - Help your route Yes: 49 % 43 % selection No: 43 % 44 % - Reduce stress Yes: 33 % 33 % No: 48 % 37 % - Not useful Agree: 8 % 10 % No: 92 % 91 % In the second half of the survey, participants were asked to indicate if they would like to be provided with the following information along with the above general traffic congestion messages:
Message-A Message-B - the length of delay: Yes: 54 % 49 % - alternate route: Yes: 57 % 54 % - the length of queue backup: Yes: 51 % 44 % - the average speed: Yes: 24 % 25 % Similar to the previous general delay message, this pair of congestion messages informs drivers of the approaching congestion, but not the cause of current traffic conditions. Thus, as shown in the survey results, such messages were not so favorable to the motorists. The preliminary conclusions about the effectiveness of such VMS messages can be stated as follows:

41
• Messages for general delay or those for describing congestion are comprehensible, but not informative to motorists. This is especially true with regard to improving driver safety, predicting travel times, selecting routes, and reducing driver stress.
• Most drivers would like to have some additional information such as available alternate
routes, estimated delay time, and approximated queue backup length.
• Responses to the following VMS messages during major delay.
Message
- Is the message understandable: Message Yes: 55.9 % No : 37.2 % - Is the message useful to: - Ensure safety Yes: 26 % No : 43 %
- Predict travel Yes: 33 % time No : 42 % - Help your route Yes: 37 %
selection No : 43 % - Reduce stress Yes: 19 % No : 48 % - Not useful Agree: 20 % No : 92 % The summary of survey respondents’ comments regarding their desire to have additional information along with the above message are presented below:
TRAFFIC DRAGSI-895 NORTH
MAJOR DELAYS

42
Message - the length of delay: Yes: 48 % - alternate route: Yes: 61 % - the length of queue backup: Yes: 45 % - the average speed: Yes: 25 % Unlike other VMS, this type of delay messages apparently was viewed by most survey respondents as too vague to understand, and not useful (i.e., less than 60%). This can be seen from the survey results regarding the use of this message for the following purposes: ensuring safety (26%), predicting travel time (33%), selecting alternate route (37%), and reducing stress (19%). All these positive response rates are much lower than the same statistics for other types of messages. It should also be mentioned that most survey respondents did not show strong desire to have other traffic information displayed along with the above general delay message. For instance, except for the alternate route information, more than 50 percent of survey respondents indicated that they have no desire to have additional information such as delay times or queue backup length. This is likely due to the fact that most survey respondents did not believe the above delay messages to be useful, and thus did not see the need of to have any supplemental information.
43
Chapter 5
Optimal Diversion Control in Freeway Corridors with VMS 5.1 Introduction
To contend with non-recurrent congestion in most freeway corridors, both state and federal agencies have implemented various traffic management strategies, including ramp metering, diversion guidance, and control of surface street signals. As is widely recognized, those individual traffic management and control measures need to be efficiently integrated and coordinated so as to provide an optimal environment for traffic operations. However, the development of such models for their integrated applications remains a challenging task.
This chapter is focused on presenting the basic formulations of an optimal freeway
diversion model during non-recurrent congestion with the potential for on- line applications. The model development is grounded on the assumption that a comprehensive VMS system has been installed at critical locations and that it can effectively advise drivers for proper detour operations.
To reliably capture the flow interactions during freeway incidents, we have embodied the
proposed diversion control model with the following three unique features: (1) modeling traffic state evolution on surface streets with flow conservation within sections, flow transition between sections, and flow discharging at downstream intersections; (2) estimating time-dependent model parameters adaptively with real-time traffic measurements, rather than assuming as pre-determined in most studies; and (3) having an efficient solution algorithm. Our preliminary numerical tests have demonstrated that both the proposed model and algorithm have the potential for use in on- line diversion control in commuting traffic corridors.
In general, the formulation of integrated corridor control turns out to be a large-scale,
nonlinear, non-differential optimization model (Cremer and Schoof, 1989), and is thus very difficult to develop an efficient algorithm for on- line applications. To circumvent such difficulties, an alternative is to trade modeling complexity with computing efficiency, that is, to approximate the traffic dynamics with simplified formulations, which can render a tractable solution for use in practice. This is a particularly promising direction under an on- line control environment, as new traffic measurements will be continuously fed back to the operational center for strategy or parameter adjustments. Chang et al. (1994) has conducted a preliminary exploration along this direction. This study is to pursue the formulation along the same line, but with an integrated, dynamic updating process.
This chapter is organized as follows. A set of equations for dynamic traffic state
evolution is presented in the next section. Critical issues regarding model parameter estimation are discussed in Section 5.3. The optimization model for integrated corridor control is

44
formulated in Section 5.4. The algorithm development and its convergence property analysis are presented in Section 5.5, followed by a numerical example in Section 5.6. Summary of the research results and further research direction are reported in Section 5.7. 5.2 Formulations of Dynamic Traffic Relations on both the Freeway and Detour Routes
To optimize the freeway corridor control, one needs to mathematically describe the complex interactions between traffic state evolution and all control parameters. One of the critical issues is to formulate traffic state evolution equations that constitute the core of system constraints. Traditionally, both traffic density and speed are taken as system state variables, and used along with the classic hydrodynamic traffic flow theory to represent the dynamic state evolution. Since such a modeling concept usually leads to a highly complex nonlinear system that has little potential to be solved in real time, some simplifications without loss of its critical interrelations becomes necessary.
This section presents a set of traffic models that use the traffic density as the primary
state variable. The interrelations between density and flow rate as well as speed are represented with the existing traffic flow theory, as the main focus of this study is to derive the operational relations under an integrated control environment, rather than to pursue further advance in traffic flow theory. For modeling convenience, continuous variables are discretized and all corridor links are divided into small sections. The key variables and notation used hereafter are defined below. A graphical illustration of the link decomposition and primary model variables are shown in Figure 5-1.
Figure 5-1 Link Partitioning Configuration

45
Key Variables and Notation ∆t: duration of a unit time interval k: time interval index λ: link index m: section index L λ
m : length of section m in link λ
n λm : number of lanes in section m of link λ
A( λ): the set of links connected to the upstream node of link λ B( λ): the set of outgoing approaches from the downstream node of link λ N(λ): number of small sub-sections divided for link λ q λ
m (k): flow rate entering section m+1 from section m of link λ during interval k, m = 1, 2,..., N(λ)-1
q λ0 (k): flow rate entering link λ at its upstream node during interval k
q λN ( λ )(k): flow rate exiting link λ from its downstream node during interval k
d λm (k): mean traffic density in section m of link λduring interval k
q λm (k): average flow rate in section m of link λduring interval k
fλm : flow-density function in section m of link λ
X λ(k): average effective green time/cycle length (g/C) ratio for link λat its downstream intersection during interval k. It is an aggregate g/C ratio for the flows discharging at the end of link λfor all turning movements
s λ: saturation flow rate for queue discharging at the downstream end of link λ ri λ(k): decimal fraction of leaving flows at the downstream end of link i∈ A( λ) turning
to link λ Q λ(k): average number of vehicles queuing on link λduring interval k α: constant model parameter R λ(k): metering flow rate at downstream end of on-ramp link λ Z λ(k): diversion control flow rate at freeway off-ramp link λ for relieving downstream
congestion λ λ(k): compliance rate of diversion control, i.e., the decimal fraction of Z λ (k) that
actually follows the diversion control and exits the freeway d(k) = {d λ
m (k),∀m, λ} X(k) = {X λ(k), ∀ street and off- ramp link λ} R(k) = {R λ(k), ∀ on-ramp link λ} Z(k) = {Z λ(k), ∀ off-ramp link } r(k) = {ri λ(k), ∀ i, λ} λ(k) = {λ λ(k), ∀ m, λ}
E(k) = {q λ0 (k), ∀ corridor entry link λ}

46
Traffic State Evolution on Surface Streets:
Assuming that a given surface link λ can be conceptually divided into N( λ) subsegments as shown in Figure 5-1, the flow in its last subsegment must be interrupted and controlled by the signal operation. Thus, the interactions between all subsegments are assumed to be primarily through shockwave and queue effects. With such macroscopic relations, one can employ the conservation law to approximate the mean density evolution within each sub-section (see Figure 5-1). More specifically, the temporal variation of mean section density from one time slice to the next is determined by the difference between the input and output flows at the section boundaries, i.e.,
)*/(*)]()([)()( 11
lm
lm
lm
lm
lm
lm nLtkqkqkdkd ∆−+= −− ∀ m, λ (5-1)
Note that depending on the geometry and location, the computation of flow rate, )(kq i
m , may vary under the following three cases.
Case 1: For 1 ≤ m < N(λ)
This is the case where q λ
m (k) is the transition flow from section m to section m+l within link λ. In this case, the transition flow between the two adjacent sections can be viewed as a weighted-average of the two neighboring sections flows, i.e.,
q λ
m (k) = α q λm (k) + (1-α)q m+1
λ (k) 1 ≤ m < N(λ), ∀ λ (5-2) Where q λ
m (k) is the average flow of section m in link λ during interval k, and α is the weighting parameter.
The average section flow rate, )(kqmλ , is supposedly determined by an equilibrium flow-density
relation as: q λ
m (k) = f λm [dλ
m (k)] 1 ≤ m < N(1), ∀ λ (5-3) Where fλ
m [⋅] represents the functional form of the flow-density model in section m of link λ. Such a simplified traffic model has also been adopted by Stephanedes and Chang (1993)
and Stephanedes and Liu (1993) for studying freeway corridor control.

47
Note that this flow-density relation, lmf , may be incorporated with the impact of incidents
in terms of the reduced percentage of capacity. For an exit link λ, Equation (5-3) is also valid for m = N( λ). However, one may not assume such a flow-density relation for the last section of any link λ due to the operation of signal control. The computation of q kN ( ) ( )λ
λ should be
approximated with the link discharge flow, q kN ( ) ( )λλ , as to be discussed in Case 3.
The weighted-average model, Equation (5-2), has been extensively utilized in
formulating freeway traffic flow evolution (e.g., Cremer and May, 1986; Cremer and Schoof 1889; Stephanedes and Chang, 1993; Stephanedes and Liu, 1993). Though Equation (5-2) is an approximation, it is rather general in describing the sectional flow transition. In fact, several existing studies (e.g., Payne et al., 1987; and Papageorgiou et al., 1990) simply take
)]([)( kdfkq lm
lm
lm = , which is its special case with α = 1. In general, α value should lie within
interval [0.5, 1.0]. It was calibrated to be 0.95 with field data by Cremer and May (1986). Case 2: For m = 1
This is the case where ))(( )( 01 kqkq ll
m =− is the flow entering the upstream boundary of link λ. If link λis an entry link of the corridor network, this entry flow is given externally by the total O-D flows originating from its entrance. Otherwise, link λis an internal link, and q k0
λ( ) is equal to the total entering flows discharged from its upstream adjacent links. Mathematically,
q k0λ( ) = ∑
∈
⋅i
Aii
iiN
i
krkq )()()( λ , ∀λ (5-4)
Case 3: For m = N(λ)
This is the case where )(kq l
m is the discharging flow at the downstream node of link λ.
If link λis an exiting link of the corridor network, )()( kq llm can simply be taken as the average
section flow, q kN ( ) ( )λλ , computed with Equation (5-3). Otherwise, link λ is an internal link
having signal control at its downstream intersection, and q kN ( ) ( )λλ may vary with the signal
settings at its downstream intersection and the queuing pattern. If the queue length is sufficiently long, the discharging flow rate from such a link should be the saturation flow rate during the green phase. Otherwise, the upcoming flows adding to the queue during the time interval must also be taken into account. More specifically, the average discharging flow, q kN ( ) ( )λ
λ , can be expressed as follows:
q kN ( ) ( )λλ = )](t/)1([ ),({min kPkQkXs λλλλ +∆−⋅ ∀λ (5-5)

48
Where s λ: saturation flow rate of link λ; X λ (k): average effective g/C ratio assigned to link λat its downstream
intersection; Q λ (k-1): average queue length on link λduring time interval k-1; and P λ (k): upcoming flows adding to the downstream queue, or reaching the
downstream node of link λ when the queue is not sufficiently long to maintain the saturation flow rate.
Note that both )1( −kQl and )(kPl are difficult to model precisely. To project the discharging flow, )1( −kQl , one can approximate it with the 'content' (average number of
vehicles) in section )(lN , which equals λλ
λλ
λλ )()()( NNN nLd ⋅⋅ . Moreover, one may approximate
P λ(k) with the section boundary flow, q kN ( ) ( )λλ
−1 , with a fraction determined by the time lag for traffic to go through the last section, N( λ). Assuming that the travel time to traverse section N(λ) without delay, denoted by tλ , is smaller than ∆t, then the maximum decimal fraction of
q kN ( ) ( )λλ unable to join q kN ( ) ( )λ
λ is approximately equal to tλ /∆t. As a result, one can
approximate P λ(k) with (1- tλ /∆t)⋅ q kN ( ) ( )λλ
−1 . Thus, Equation (5-5) is replaced as:
q kN ( ) ( )λλ = min {s λ⋅X λ(k), )/)()/1( )()()(1)( tnLdkqtt nNNN ∆⋅⋅+∆− −
λλλ
λλ
λλλ } (5-5a)
In summary, we have formulated the traffic density evolution on surface street links with Equations (5-1) – (5-5). Traffic State Evolution on Freeway and Ramp Links:
Using a similar concept, all freeway and ramp links, as shown in Figure 5-2, can be divided into a number of small sections, and the flow interactions between neighboring sections within each link can be modeled with the same logic applied to surface street links.
Assuming that all junctions between off-ramps and surface streets are signal-controlled,
the discharging flows at the downstream node of each off-ramp can be tackled in the same manner with Equation (5-5a), except those ramp merging and exiting nodes.
Since discharging flow at the downstream end of each on-ramp link is subject to the ramp
metering rate, the actual flow rate entering the freeway can be modified from Equation (5-5a) as:
q kN ( ) ( )λλ = min { ( ),( / ) ( ) / }( ) ( ) ( ) ( )R k t t q k d L n tN N N Nλ λ λ
λλ
λλ
λλ
λ1 1− + ⋅ ⋅−∆ ∆
∀ on-ramp λ (5-5b)

49
Where, R kλ ( ) is the metering flow rate for control, while the other term represents the ramp flow rate
when the on-ramp traffic is not sufficiently heavy to maintain its saturation flow rate. Since there is no signal control for mainline traffic, the boundary transition flows among
freeway link λ, its downstream link λ ', and the connecting ramp link λ '' are different from those at street intersections. The computation of such transition flows is thus based on the following weighted-average concept:
For an on-ramp as shown in Figure 5-2, the mainline transition flow can be computed as: q k0
λ( ) = α α[ ( ) ( )] ( ) ( )( ) ( ) ( )q k q k q kN Nλλ
λλ
λλ+ + − ⋅′′ ′′1 (5-4a)
q k q k q k q kN N N( ) ( ) ( )( ) ( ) ( ) [ ( ) ( )]λ λ λ
λλ
λ= ⋅ + − ⋅ −′′′
′′α α1 (5-5c)
Where, the entry flow q kN ( ) ( )′′′
λλ is computed with Equation. (5-5b).
If the adjoining ramp is an off-ramp as shown with in Figure 5-3, the transition flows needs to include the diversion flow, Z kλ( ) . Note that if the fraction of exiting flow at the node prior to diversion is given by r ''λλ (k), the actual flow rate leaving the off- ramp will be:
)()()()()( )( 0 kZkkqkrkq N λλλ
λλλλ
′′′′′′ ⋅+⋅= λ (5-4b)
Where, λ λ(k) is the compliance rate of diversion flow.
Figure 5-2: Flow Transition at an On-Ramp Merging Node.

50
The transition flows at the off-ramp can also be computed with the similar weighted-average expression as:
q kN ( ) ( )λλ = )]()([)1()(
''
)( kqkqkN λλ
λλ
λλ +⋅−+⋅ ′αα (5-5d)
Excluding q k0′′λ ( ) from q kN ( ) ( )λ , one may have the following boundary flow for the
downstream freeway section: q k r k q k r k q k q k k Z kN0 1 1 1′
′′ ′′′ ′′
′′= − ⋅ + + − ⋅ + − ⋅λλλ λ
λλ λ λ
λλλ
λ λ( ) [ ( )] ( ) ( )[ ( )] [ ( ) ( )] ( ) ( )( )α α λ
Given the above formulations for traffic flow evolution, the entire corridor model for traffic state evolution from time interval k-1 to k can be written in the following compressed form:
d(k) = F[d(k-1), X(k), R(k), Z(k), λ(k), r(k), E(k)] (5-6)
Where,
F: functional form determined by Equations (5-1)-(5-5); d(k): density distribution vector; X(k), R(k), Z(k): control parameter vectors denoting signal g/C ratios, ramp
metering rates, and mainline diversion flow rates, respectively; and λ(k), r(k), E(k): system input variables representing diversion compliance rates,
turning movement patterns, and network entry flows.
Figure 5-3: Flow Transition at an Off-Ramp Merging Node

51
5.3 On-Line Estimation of Model Parameters
To project the forthcoming traffic conditions with the state evolution, the current density distribution, d(k), and the system input parameters, {λ(k), r(k), E(k)}, must be obtained in advance. Several methods for estimating the current d(k), based on on- line traffic measurements, are available in Payne et al. (1987). In this study, the entry flows, {E(k)}, representing time-varying travel demands, is assumed to be given externally from roadway sensors. Thus, only the estimation and prediction of model parameters, λ(k) and r(k), are discussed in this section.
Estimation and Prediction of Turning Proportions:
Assuming that real-time traffic measurements at all intersection entrances and exits can be provided by a surveillance system, several recursive algorithms, based on the least-squared estimation and the Kalman filtering techniques, are available for estimating such special simple OD flows. One may refer to Bell (1991) for a detailed discussion of available methods for such applications.
Prediction of the upcoming turning flow pattern may be performed through the
construction of some time-series model such as ARIMA. However, one must consider the vital factor of flow diversion control. Since diverting flows vary with time and depend on the turning proportions, there will be a feedback relation between predicted turning proportion and computed diversion flow. Such a logical loop will be detailed in Section 5.
Estimation and Prediction of Diversion Compliance Rates:
Given the estimated turning proportions with the above procedures, one may compute the diversion compliance rate, λ1(k), based on the ratio between the actually observed diverting flow and the assumed diversion flow, i.e.,
λ λ (k) = })(/])()()({ '')( 0 ′′⋅−′ ′′′′ kZkqkrkq N λ
λλλλ
λ
Where,
)(''
0 ′kqλ and q kNλ ( )′ : on- line measurements of q k0
′′λ ( ) and q kNλ ( ) , respectively, from
detectors; and Z k′′ ′λ ( ) : computed diversion flow rate based on the control model’s
solutions.

52
5.4 An Optimal Control Model With the above formulations, we can construct the following model to concurrently
optimize diversion flow rates, ramp metering rates, and intersection g/C ratios on the surface street.
Objective Function:
The performance of a traffic control system can be evaluated with various measures of effectiveness (MOEs), such as total travel time, total waiting (queuing) time, total delay, total vehicle-hours, total vehicle-miles, as well as total emission. This study selects total travel time (TTT) as the objective function for integrated corridor control. Note that the minimization of total travel time is equivalent to the minimization of total delay for a given travel demand pattern.
Conceivably, the total vehicle travel time in a corridor over a control period consists of
vehicle travel time on all link sections and over all time intervals within the control period. Mathematically, the total travel time can be expressed as follows:
TTT = ∑k {∑ λ ∑=
)(
1
λN
m
[dmλ (k)⋅L λ
m ⋅n λm ]}⋅∆t (5-9)
Where, d λ
m (k)⋅L λm ⋅n λ
m : average number of vehicles on section m of link λ during time interval k (5-10)
Model Constraints:
Equations (5-l)-(5-5), including (5-4a-c) and (5-5a-d), for describing the dynamic traffic state evolution, are the principal system constraints. Moreover, the densities, )}({ kd l
m , and the
control variables, )},({ kZ l )},({ kRl and )}({ kX l , are all subjected to their respective physical constraints. More specifically, the following natural constraints are needed to ensure that the section densities, diversion flow rates, ramp metering rates, and g/C ratios are all within a realistic range:
0 ≤ d λ
m (k) ≤ dmax ∀ m, λ (5-11)
0 ≤ λ λ (k)⋅ Z k s r q kN′′ ′′ ′′≤ −λ λ λλ λλ( ) ( )( ) ∀ off-ramp λ '' (5-12)
Where, λ: upstream freeway link of off- ramp λ '' (see Figure 3)

53
R R k Rλλ
λ,min ,max( )≤ ≤ ∀ on-ramp λ (5-13) Where,
min,lR , max,lR : minimum and maximum metering rates for on-ramp link λ
X λ , min ≤ Xλ (k) ≤ X λ , max ∀ λ (5-14)
Where, min,lX , max,lX : minimum and maximum g/C ratios for the downstream intersection
of link λ
The other set of constraints concerns the interactions among the g/C ratios, and )(kX l associated with a common downstream intersection. Note that those control variables )}({ kX l are defined as the set of average effective g/C ratios, and serve only as the basis for
microscopic adaptive signal design. One may employ the following general equation to describe the green signal splits among the approaches at the downstream intersection of link l :
X λ (k) + ′∈ ′∑ λ λB k( ) ( ) = 1 + σ λ - φλ ∀ λ (5-15)
Where,
B'( λ): set of approaches to the downstream intersection of link λ; σ λ: parameter representing the green phase overlapping factor among the approaches
in signal phasing; and φλ: decimal fraction of lost time due to start-up delays as well as signal changes
Due to the differences in intersection configurations and phasing plans, the overlapping factor (σ) and the lost time fraction (φ) can be determined only on a location-by- location base.
In summary, the optimization control model with respect to )}({ kZ l , )}({ kRl , and
)}({ kX l can be recapitulated as:
Min. TTT = { [ ( ) ]}( )
d k L n tm m mm
N
kλ λ λ
λ
λ
λ⋅ ⋅ ⋅
=∑∑∑ ∆
s.t. Equations (5-1)-(5-5) and (5-11)-(5-15) (5-16)

54
5.5 The Solution Algorithm
Note that the above optimal control model would be piece-wise linear in nature if the flow-density relation is also piece-wise linear, because all other functions involved in the model are linear or piece-wise linear. Fortunately, an inverted, V-shaped, two-segment linear function as shown in Figure 5-4 has been reported to be an acceptable approximation to the traffic flow-density relation in several recent field studies data (e.g., Banks, 1989; Hall et al., 1986, 1992,
1993). Consequently, the optimization model, Equations (5-16), is equivalent to a set of linear programming (LP) models, and LP techniques can thus be used to construct an iteration algorithm.
As the total number of LP equations may be very large due to various possible
combinations, one should not enumerate all such LPs and solved. An efficient algorithm is thus necessary for automatically selecting and solving a LP that can produce an improved control scenario over each previously selected LP control solution. When such an improvement is below a given significance threshold, or a specified number of LPs have already been solved, the current LP solution can be taken as the best solution for the control model (Equation (5-16)). Such procedures with a successive LP approximation constitute the inner loop iteration algorithm under a given set of turning movement patterns.
To handle the interactions between diversion flow rates and the turning proportions, an
outer- loop iteration procedure has also been provided. After a set of control solutions has been obtained from the inner-loop iteration, the turning proportions need to be updated based on the diverted flow rates from the latest LP solution. With such updated information, the inner-loop can then be executed again to search for an optimal solution. One may employ similar stopping rules for this level of computation. A detailed discussion regarding the proposed algorithm is presented below:
Figure 5-4: Two-Segment Flow-Density Relation

55
Inner-Loop Iteration:
The primary function of the inner- loop is to solve the optimal control parameters under a given set of turning proportions over the specified time horizon (Figure 5-5). To facilitate the description, the control model is restated in the following concise form:
Min DTY (5-17) s. t. Ai
TY + ai = min {BiTY + bi, Ci
TY + ci} (5-18) Ai
TY ≤ ai i = I + 1, ..., I + I λ (5-19) Ai
TY = ai i = I + I1 + 1, ..., I + I1 + I2 (5-20) L ≤ Y ≤ U (5-21)
Figure 5-5: Solution Algorithm

56
Where,
T: transpose of the corresponding vector or matrix; Y = [{d λ
m (k)}, {X λ (k)}, {R λ (k), {Z λ (k)}]T : vector of traffic state and control variables;
Ai, Bi, Ci : constant coefficient vectors of the linear functions; ai,bi,ci : scalars representing the constant terms of the corresponding linear
functions, respectively; L, U: two constant vectors representing the lower and upper bounds of the
vector variable, Y, respectively; and I, I1, I2 : numbers of those different types of constraints, respectively.
The two-segment linear flow-density function, as presented in Figure 5-4, can also be expressed as:
q = (q*/d*) d, if 0 ≤ d ≤ d*; = q*(d - dmax)/(d*- dmax), if d* ≤ d ≤ dmax.
which can be further expressed as:
q = min {q*/d*) d, q*(d - dmax)/d*- dmax)}, 0 ≤ d ≤ dmax. Hence, it has the format of constraints for Equation (5-18).
With such expressions, we have developed a solution algorithm for the initial
optimization model (Equation (5-16)) which is a standard LP problem with each of the two-piece linear constraint in Equation (l8) being fixed at a linear regime. To facilitate the computation, we further introduce a set of binary variables:
δ i = 1, if Bi
TY + bi ≤ CiTY + ci (5-22)
= 0, otherwise. Then, Equation (l 8) can be converted into the following two constraints:
Ai
TY + ai = δ( BiTY +bi)+ (l-δ i)(Ci
TY + ci) (5-18a) (δ i-0.5) (Bi
TY + bi) ≤ (δ i-0.5)(CiTY + ci) (5-18b)

57
Given a definite value for δ i, Equations (5-3a)-(5-3b) are two linear constraints, and the model (5-17)-(5-21) is a LP depending on the δ i, i = 1, 2, ..., I. By replacing Equations (5-18) with Equations (5-18a)-(5-18b), one can employ the following algorithm for solving the general optimization model with the multiple-LP structure.
Successive Linear Programming (SLP) Algorithm:
Step 0: Given an initial feasible solution, Y0, determine the respective values of
δ i, = 1, 2, , I, according to Equation (5-22); Specify a precision threshold ∈; Set n = 1.
Step 1: Under the current values of {δ1
n-1 }, solve the LP sub-problem of Equations (5-17)-(5-(5-21) to obtain its optimal solution Yn.
Step 2: Check whether or not
DTYn - DTYn-1 ≤ -∈
If not, stop this procedure with the current LP solution, Yn.
Step 3: Determine the index set
En = {i|BiTY + Ci
TYn + ci, i = 1, ..., I}
Step 4: Let δ in = 1 - δ i
n-1 for all i∈ En Set n = n + l and return to Step 1.
Apparently, the total number of relevant LP sub-problems is the total possible {δ i}
combinations, which has an upper bound limit, 2I. Therefore, the validity of the proposition is proved.
Conceivably, every LP sub-problem to be solved has a feasible solution as long as given
a reasonable initial solution. However, one cannot guarantee Equation (5-16) to have feasible solutions especially under over-congested traffic conditions. For such special cases, some heuristic local traffic-responsive strategies may be employed to override the integrated optimal control logic.
Outer-Loop Iteration:
As shown in Fig. 5-5, the outer loop iteration functions to revise intersection turning proportions due to new control solutions for diversion flows from the inner loop. Apparently, if a new set of diversion flow solution is sufficiently close to the one resulting from the last outer

58
loop iteration, the algorithm should terminate, and the current control solution can be adopted. This is a natural rule for checking the outer loop convergence.
The major issue of concern is how to modify the turning proportions at each step when
convergence has not been reached. Theoretically, this problem involves a complicated dynamic traffic assignment, which is rather difficult to solve. However, for simple freeway-arterial corridors, it can be handled easily in a heuristic manner because, in general, only one or a few major alternative routes - the parallel arterials, may exist for diversion. The returning of diverted traffic back to the mainline via downstream ramps can be assigned consecutively based on upstream-to-downstream order, while taking into account the capacity of available ramps. As such, link flow changes along the diversion paths can be projected approximately with new diversion flow solution, and the turning proportions at affected intersections can be modified accordingly.
For instance, considering a link on the diversion flow path, where there exist three
turning movements approaching the link's downstream intersection with the turning proportions for left turn, through, and right turn being denoted as r1, r2, and r3, respectively. The projected link flow prior to the impact of diversion control is q. When an additional flow ∆q is diverted via this link, then the turning proportions can be revised as follows:
r1 = r1q / (q+∆q); r2 = (r2q+∆q) / (q+∆q); r3 = r ± q / (q+∆q)
As none of the existing traffic simulation models has all the required features for dealing
with on- line diversion control, the macroscopic model, Equation (5-6), was used as a simulation tool. As exploratory in nature, we focus mainly on the control effectiveness with given model parameters and diversion compliance rates. A detailed description of all numerical analyses is available elsewhere (Wu, 1995).

59
5.6 Numerical Examples
An example corridor network as shown in Figure 5-6 was selected for exploratory
analysis Assuming that an incident has occurred on section 8, the responsive traffic control measures include ramp metering at ramp segments 22 and 27, signal timing at the intersection of street segment 15 and ramp segment 25, and flow diversion at the off-ramp from freeway segment 4. The entire incident scenario covers about 35 minutes, starting with a 5-minute incident-free condition, followed by 20 minutes incident duration, along with the 5-minute incident-free recovery period. We have selected four traffic conditions, referred as Case 1 to Case 4, representing four increasing levels of congestion. Each experimental case is defined as follows:
Case 1:
- Flow level: 75% of the freeway saturation flow rate; - Incident level: 25% capacity reduction.
Case 2: - Flow level: 75% of the saturation flow rate; - Incident level: 45% capacity reduction.
Case 3: - Flow level: 90% of the saturation flow rate; - Incident level: 25% capacity reduction.
Figure 5-6: Example Network for Numerical Experiments

60
Case 4: - Flow level: 90% of the saturation flow rate; - Incident level: 45% capacity reduction.
The following three control strategies were selected for comparison:
Control A: - Baseline control with g/C ratios for approaches 15 and 25 being fixed at 0.6 and 0.4,
respectively, and without ramp metering and diversion control at all.
Control B: - The Long Island two-layer control logic (Reiss et al, 1981, 1991) with:
- flow diversion at the corridor level based on the static user-equilibrium traffic assignment;
- demand-capacity ramp metering for both on-ramp meters; and - signal g/C ratios assigned according to flow/capacity ratios of segment 15 and
segment 25. Control C:
- The proposed integrated control approach.
Simulation Results:
The simulation results of total travel time (TTT) in the above four experimental scenarios and three control strategies are summarized in Table 5-1. It can be seen that even during a very short incident period of 35 minutes both ontrol strategies B and C yielded significant reductions in the total travel time, compared to the baseline scenario of Control A, but our proposed control strategy, Control C, significantly outperforms Control B in all four cases with respect to the average flow speed and total travel time that is consistent with our control objective of travel time minimization.
Note that Control C does not always yield the highest total travel distance (TTD) even
with the diversion. For instance, Control C resulted in a slightly less TTD than with Control B in Case 2, had an approximately equal TTD in Case 4. Certainly, the effectiveness of our proposed control may vary with the network structure, flow level, and incident severity. But it is quite promising in terms of substantially reducing the total travel time without causing significant increase in total travel distance under various incident scenarios.

61
Table 5-1: Simulation Results for an Incident Period of 35 Minutes Traffic Condition
Control Scenario
TTT (veh-min)
TTT Saving (veh-min)
TTD (veh-mile)
TTD Extra (veh-mile)
AFS (Mile/Hour)
A 3445.3 0 3175.4 0 55.3 B 3416.2 29.1 3711.1 1.6 55.8
Case 1
C 3341.9 103.4 3241.6 66.2 58.2 A 3788.7 0 3163.6 0 50.1 B 3654.4 134.3 3222.0 58.4 52.9
Case 2
C 3589.0 199.7 3218.1 54.6 53.8 A 4375.5 0 3463.9 0 47.5 B 4348.3 27.2 3580.1 116.2 49.4
Case 3
C 4169.4 206.1 3627.4 163.4 52.2 A 4826.0 0 3458.6 0 43.0 B 4451.2 374.8 3672.2 213.6 49.5
Case 4
C 4245.5 580.5 3672.4 213.7 51.9 * AFS: the average flow speed during the entire incident period.
5.7 Conclusion
As is widely recognized, integrated real- time control for freeway corridor systems is one of the most promising strategies for developing ATMS. However, existing studies on this subject is still at its infancy, and many critical issues regarding both modeling and solution strategies remain to be explored. This study has presented a systematic modeling framework along with formulations for optimal integrated, real-time corridor control. As an enhancement of our previous research work, the proposed modeling approach has the following unique features: • The formulations for dynamic traffic state evolution at surface streets and ramp links take
into account the flow transitions between adjacent roadway sections. It relieves the commonly used assumption of having constant link travel times.
• Intersection turning propositions are no longer assumed as given in advance. In particular,
their temporal variations, including the diversion control effects, are explicitly captured in the modeling and its solution algorithm.
• The preliminary results from experiments have demonstrated the promising properties of our
presented approach, especially in reducing total travel time under non-recurrent congestion.

62
Further research along this line will be to enhance and develop the estimation logic using any available ATIS data for turning proportions, compliance rates, as well as the flow transition parameter. In addition, more extensive numerical tests for the proposed modeling approach can be conducted after a reliable and efficient microscopic simulation tool for on- line diversion becomes available.

63
Chapter 6
Optimal Detour Rate with VMS under Non-Recurrent Congestion in the I-95 Corridor
6.1 Introduction
As discussed in the previous chapters, VMS have emerged as one of the most popular traveler information systems, functioning not only to inform commuters of traffic conditions but also to provide them with detour suggestions during severe incidents that cause lane blockages on freeway segments. In response to severe accidents, operators in the traffic control center can estimate the capacity reduction during the emergency operations, and thereby guide some portion of en route motorists via pre-planed detour routes.
Executing a well-designed detour plan in a timely and effective manner can minimize
both the queue length on the partially blocked freeway and the total delay of all roadway users during the incident impact period. The traffic control center can also base on the optimal detour flow rate to manage the congestion level on both the freeway and the detour route. This is to avoid over detouring traffic and cause excessive delays to those following the detour suggestion. The potential application of VMS for congestion management, however, has not been fully explored by most highway agencies due to a variety of reason such as:
• Having insufficient VMS at major detour junctions to guide traffic flow; • Lacking the mechanism to reliably estimate the response of motorists to detour suggestions
displayed on VMS; • Being incapable of computing the optimal detour rate for various types of incidents and the
required detour duration; and • Experiencing difficulties associated with the required coordination between agencies
responsible for freeway and surface-street operations during the traffic detouring period.
This chapter intends to address the critical issue of the optimal detour rate for a detected incident based on the estimated duration for traffic recovery operations. Due to the exploratory nature of this study, the research results reported in this chapter are limited to the optimal detour rates with VMS for major accidents distributed along the I-95 corridor between Baltimore and Capital Beltways. The ensuing sections of this chapter will be organized as follows:

64
Next section will briefly describe the distribution of incidents and major accidents along the I-95 corridor between Baltimore and Capital Beltways, including the locations and incident clearance durations. In addition, the I-95/Route-1 simulator designed to model all geometric features of both I-95 and Route-1, including all eight pre-planed detour routes between these two major commuting freeways, will be presented. Section 6-3 will be focused on illustrating the research methodology used to explore the optimal detour rate for incidents at various locations of the I-95 corridor with the I-95/Route 1 simulator. Preliminary experimental results along with concluding findings will be discussed in the last section.
6.2 Distribution of Incidents in the I-95 Corridor between Two Beltways
As one of the primary commuting corridors between Baltimore and Washington metropolitan areas, I-95 has long been plagued by a large number of traffic incidents. For instance, due to increasingly aggressive driving populations and congested traffic cond itions, the I-95 segment between two beltways in the year 1999 and 2000 had 1948 and 2779 incidents, respectively. Some of those incidents resulted in multiple- lane blockages and long traffic queues. The spatial distribution of those incidents on I-95 freeway is shown in Figure 6-1, and the distribution of incident types can be seen from Figure 6-2.
454 49
8
190
61 42
79
158
267
424
171
31 3 2 14
368
590
178
34 17 17 15 25 41
125
41
0 0 0
0100200300400500600700800
Exits
27 &
29Ex
its 29
& 33
Exits
33 &
35Ex
its 35
& 38
Exits
38 &
41Ex
its 41
& 43
Exits
43 &
46Ex
its 46
& 47
Exits
47 &
49Ex
its 49
& 50
Exits
50 &
51Ex
its 51
& 52
Exits
57 &
58Ex
its 64
& 67
Num
ber o
f Inc
iden
ts
2000 1999
Figure 6-1: Spatial Distribution of Incidents on I-95 between Two Beltways in the year
2000 and 1999

65
1,307
319 245 71 36
0
2,000
4,000
6,000
8,000
Num
ber o
f Inc
iden
ts
I-95 (2000)
Road
Lane Blockage by Road
Shoulder 1 Lane 2 Lanes 3 Lanes >=4 Lanes
Figure 6-2: Distribution of Major Incidents by Lane Blockage in the year 2000
In contending with so frequent incidents, SHA has designated 9 routes between I-95 and Route-1 to detour traffic during severe non-recurrent congestion. To avoid detouring too many vehicles (e.g., Route 1) and cause congestion on the detour routes, traffic control operators often face a challenge, that is, to determine the optimal detour rate based on a detected incident and estimated duration for recovering the traffic condition.” Unfortunately, no analytically convenient model is available for such applications, and most operations in practice are conducted on a try-and-observation basis. Thus, the study intends to take advantage of the traffic simulator developed for the target I-95 corridor, and use its simulation capability to generate optimal detour information for incident management. I-95/Route 1 Simulator:
The traffic simulator is a computer program that employs graphics, mathematics, and animation to replicate the actual traffic system. The I-95/Route 1 simulator has the following distinct features:
- consisting of both the I-95 and Route-1 segments between Baltimore and Capital
Beltways as well as all detour routes between these two principal commuting routes (see Figure 6-3);
- capable of using actual design plans to model the geometry of both freeway and
surface street segments, such as interchanges, horizontal alignments, and turning lanes at intersections (see Figure 6-4);
- can reflect the actual signal operations on both Route 1 and all detour routes using
either actuated control or coordinated signal systems (see Figure 6-5);
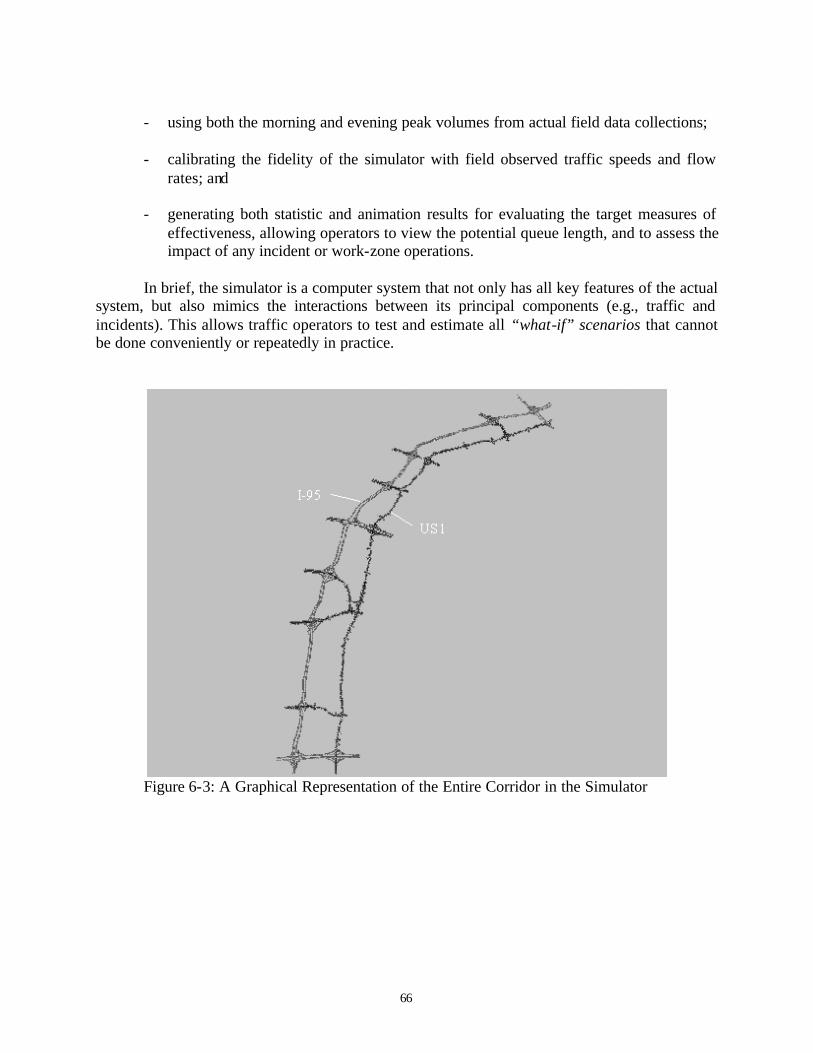
66
- using both the morning and evening peak volumes from actual field data collections;
- calibrating the fidelity of the simulator with field observed traffic speeds and flow
rates; and
- generating both statistic and animation results for evaluating the target measures of effectiveness, allowing operators to view the potential queue length, and to assess the impact of any incident or work-zone operations.
In brief, the simulator is a computer system that not only has all key features of the actual
system, but also mimics the interactions between its principal components (e.g., traffic and incidents). This allows traffic operators to test and estimate all “what-if” scenarios that cannot be done conveniently or repeatedly in practice.
Figure 6-3: A Graphical Representation of the Entire Corridor in the Simulator

67
Figure 6-4: A Graphical Representation of the Interchanges and Detour Route
Figure 6-5: A Graphical Representation of the Signalized Intersection on the Surface Street.

68
6.3 Methodology for Simulation Experiments
As discussed in the previous section, the simulator offers a convenient platform for investigating time-varying interactions between the detoured freeway flows and surface street traffic, including the resulting travel times, delays, and potential queues under various detour rates during incident clearance operations. To take full advantage of the simulator’s functions and its embedded information (such as volume, geometric and control), the research team has performed an extensive set of simulation experiments based on the following variables:
1. Incident type:
- Accidents causing one- lane, two- lane, and 3- lane blockages; 2. Incident duration:
- Average incident duration for each type of accident, and one standard deviation over and below the average duration;
3. Incident incurred time:
- 7 to 9 a.m. in the southbound;
4. Incident locations: - I-95 mainline between exit 25 and exit 27; MD 212 and Route 1 are the detour routes; - I-95 mainline between exit 27 and exit 29; MD 212 and Route 1 are the detour routes; - I-95 mainline between exit 29 and exit 33; MD 212, MD 198, and Route 1 are the
detour routes; - I-95 mainline between exit 33 and exit 35; MD 216, Route 1, and MD 198 are the
detour routes; - I-95 mainline between exit 35 and exit 38; MD 216 and Route1 and MD 32 are the
detour routes; - I-95 mainline between exit 38 and exit 41; MD 32 and Route 1 and MD 175 are the
detour routes; - I-95 mainline between exit 41 and exit 43; MD 175 and Route 1 and MD 100 are the
detour routes; - I-95 mainline between exit 43 and exit 47; MD 100 and Route 1 and I-195 are the
detour routes; and - I-95 mainline between exit 47 and exit 49; I-195 and Route 1 and I-695 are the detour
routes.
5. Detour rate: - From 5 percent to 30 percent at an increment of 5 percent;
6. Duration of simulation: - One hour in addition to the average duration for each type of incidents; and

69
7. Measures of effectiveness: - Total system user delay (including roadway users on both I-95, and Route 1) for the
entire I-95 corridor from the onset of an incident to complete recovery of the traffic conditions.
Based on the above list of variables, a sampling plan, including a total of 270 traffic
scenarios, was developed and simulated with the I-95/Route-1 simulator. The total system delay for each traffic scenario was based on the average of 3 simulation replications with different random number seeds so as to minimize potential stochastic variations resulting from differences in driving populations.
6.4 Optimal Detour Rates from Simulation Experiments
The simulation results with respect to the total system delay (vehicle-hours) under different types of lane-blockages and detour rates are illustrated in Figures 6-6, 6-7, and 6-8.
Figure 6-6: Total System Delay by Detour Route during One-Lane Blockage Accidents under Different Detour Rates.

70
Figure 6-7: Total System Delay by Detour Route during Two-Lane Blockage Accidents under
Different Detour Rates.
Figure 6-8: Total System Delay by Detour Route during Three-Lane Blockage Accidents under
Different Detour Rates.

71
According to the SHA plan, traffic should be detoured through MD212 to US-1 and back to I-495 when any lane incurred on the southbound of I-95 during morning peak hours between exits 27 and 29. The optimal detour rate for this detour route, named Detour 2, under one to three lane-blockage incidents, based on the simulation results, are presented below: One-lane blockage Two-lane blockage Three-lane blockage Optimal detour rate for Detour 2: 0% 5% 5%
It appears that detouring traffic through MD-212 to Route-1 will not significantly ease
the congestion caused by any accident on I-95. This is most likely due to the limited capacity of MD-212 and Route-1 through where over-detoured traffic volumes may quickly saturate the entire surface street segment and result in excessive delays. Thus, VMS detour messages may not be needed for accidents incurred in this segment of I-95, unless the entire freeway trave l lanes have been blocked.
In contrast, MD-198 clearly has more capacity than MD-212 for accommodating
additional traffic volume detoured from I-95 during severe incidents. The optimal detour rate raises from 5% to 20 % when the number of lane blockages increases from one to three lanes. A comparison of the optimal detour rate under the presumed incident period is shown below:
One-lane blockage Two-lane blockage Three-lane blockage Optimal detour rate for Detour 3: 5% 10 - 15% 20%
The optimal traffic detour rates for all other detour routes during 1 to 3 lane blockages, based on results of extensive simulation experiments are presented in sequence below. Most of those detour routes are pre-planed by SHA, and seem to have sufficient capacity to accommodate 15 %to 20% of I-95 traffic flow. To detour the I-95 traffic volume within this optimal range will result in a minimum total delay for the entire corridor during the period of incident operations.
One-lane blockage Two-lane blockage Three-lane blockage Optimal detour rate for Detour 4: 15% 15% 20%
One-lane blockage Two-lane blockage Three-lane blockage Optimal detour rate for Detour 5: 10% 15% 15%

72
One-lane blockage Two-lane blockage Three-lane blockage Optimal detour rate for Detour6: 10% 15% 20%
One-lane blockage Two-lane blockage Three-lane blockage
Optimal detour rate for Detour 7: 15% 15 - 20% 15 - 20%
One-lane blockage Two-lane blockage Three-lane blockage Optimal detour rate for Detour 8: 5% 10% 15%
In evaluating of the above distribution of optimal detour rates among pre-planed detour routes in the I-95 corridor, it should be noted that:
- the optimal rate is based on incident duration of 45 minutes (the average blockage
duration in the year 2000); - only the nearest upstream ramp prior to the accident site is assigned to detour the I-95
traffic flow; and
- the signal timings and phasing on all surface streets were not dynamically adjusted and coordinated to accommodate the detoured traffic volume.
Conceivably, the optimal detour rate may vary slightly if any of the above conditions
embedded in the simulation experiments has been changed. The experimental results with the Traffic Simulator, however, have indicated that there exists an optimal range of detour rates for incident response and traffic management. Such optimal rates may vary with a variety of factors, including the location and nature of incidents, required duration for incident clearance, and traffic volume on both the freeway and those pre-planed detour routes. Hence, to minimize the impact of accidents on delay, fuel consumption, and emissions, it is essential to manage the detour traffic volume around the optimal range.
73
Chapter 7
Conclusions and Recommendations 7.1 Summary of Research Findings
To best use existing VMS to contend with both recurrent and non-recurrent congestion, this study has began with a rigorous investigation of various critical issues associated with their potential applications on the I-95 corridor between the Baltimore and Washington Beltways, including: ♦ Appropriate messages to be displayed under recurrent and non-recurrent congestion; ♦ Interrelations between VMS and traffic detour operations during severe accidents; and ♦ Coordination between the expected detour volume and signal control on surface streets.
In response to identified critical issues, the research team has conducted the core of this
study with three principal methods: review and evaluation of VMS related research and practices reported in the literature; simulation exploration of the optimal detour rate for various types of accidents that occur at different I-95 segments; and analytical development of the interrelations between the optimal detour rate and the surface street signal settings during severe accidents.
Grounded on the results of an extensive review of the literature, the study has also
performed a survey of sample local drivers, focusing on their experience with VMS displayed in the I-95 corridor. Thus, despite the exploratory nature of this study, the following research findings shall serve as a valuable basis for further studies on the effective use of VMS:
♦ VMS have been widely regarded as one of the essential traveler information systems for en-
route drivers, but its credibility is often questioned by both traffic professionals and roadway users.
♦ The most desirable messages to be displayed on VMS during various congestion scenarios
are highly dependent of the driving populations. A comprehensive survey of roadway user preference would be essential for achieving the target level of effectiveness;
♦ Commuters are more willing to divert to alternate routes under accidents than under recurrent
congestion (Heathington et al., 1971). Also, motorists generally prefer to see messages detailing the cause of congestion, rather than a vague message of “Congestion Ahead”;
♦ The messages for VMS should clearly display the cause of congestion if it is due to some
accidents (e.g., ACCIDENT AHEAD, LEFT 2 LANES BLOCKED);

74
♦ The messages for VMS for non-recurrent congestion should indicate the accident location as precisely as possible (e.g., 1 MILE BEFORE AVENUE ROAD);
♦ The messages for VMS for non-recurrent congestion should provide the detour advice only if
the accident is severe and the alternate route is familiar to drivers; ♦ During either recurrent or non-recurrent congestion, drivers are more likely to respond to
specific quantitative delay information, rather than qualitative messages displayed on the VMS system;
♦ When a reliable surveillance system is available, messages displayed on VMS for either
recurrent and non-recurrent congestion should be clear and specific but not too wordy, because that may cause the traffic to unexpectedly slow down;
♦ The impact of VMS on traffic conditions during day-to-day recurrent congestion is often not
as significant as expected. Ideally, the responsible traffic agency, having a sufficient surveillance capability, shall provide a reliable estimation of queues or delays on both the current and alternative routes. This will assist drivers in making the best decision that in turn may reduce the overall congestion in the network;
♦ VMS for highway work zones, either for traffic control or detour operations, are generally
viewed as essential and effective, provided the messages are properly structured to facilitate motorists’ comprehension during the driving process;
♦ Whether messages related to driving behavior and safety should be displayed or not remains
an on-going issue. The discrepancies of research findings by researchers from different locations as well as driving populations, however, reveal that the answer for this issue may be location-dependent and may vary across states;
♦ The effectiveness of messages, designed to warn drivers of unexpected roadway conditions
resulting from changes in geometry or traffic operations, has not been rigorously investigated in the literature. However, it is generally recognized as essential regardless of their potential impacts on the driving population;
♦ Due to the credibility concern and the lack of advanced traffic surveillance systems, most
traffic management agencies choose not to provide estimated travel times on VMS, especially during non-recurrent traffic congestion.
♦ Travel times during incidents are most likely to be unstable, varying with a variety of factors
such as the reduced level of capacity, response of drivers to detour suggestions, and the incident clearance duration. Thus, providing a reliable estimate of travel times during non-recurrent congestion has been well recognized as a difficult task even with an advanced sensor system. This is one of the main reasons that most highway agencies often display the messages such as “delay” or “queue length” rather than the estimated travel times.

75
♦ In general, drivers have a strong desire to receive information about the impacts of weather on the pavement conditions and the visibility along their traveling routes. Thus, the key research issue in this regard is not whether drivers will like such messages rather how to concisely describe the hazardous conditions to increase their attention;
♦ One of the most well received VMS functions is to inform drivers of a special event,
including its impacts on traffic conditions and the available alternate routes. In general, this type of messages can always achieve some level of effectiveness.
♦ Regardless of a driver’s familiarity to the vicinity of a special event, traffic agencies should
always properly place a sequence of coordinated VMS along the suggested detour routes so that the expected congestion can be dissipated within the projected time horizon;
♦ In detouring traffic to surface streets during severe accidents, operators in the traffic control
center should carefully monitor the total detour flow, and ensure that the detour volume will not exceed the capacity of the detour route. Otherwise, detour messages displayed on the VMS or reported via HAR may lose their credibility;
♦ The optimal detour rate during non-recurrent congestion actually varies with the reduced
roadway capacity, the required duration for clearance, traffic volume on the freeway and the surface street. The simulator developed by the research team for SHA offers a convenient tool for computing the optimal detour volume and for estimating the resulting traffic conditions; and
♦ To best accommodate the detoured flow, it is essential to dynamically adjust the signal
settings on surface streets so that drivers following the detour suggestion will not experience excessive delay and lose their confidence in messages displayed on VMS.
7.2 Recommendations for Further Research
As indicated previously, this study is exploratory in nature, and serves only to identify critical issues associated with an effective application of VMS for mitigating both recurrent and non-recurrent traffic congestion. This study has also investigated the potential of formulating an operational model that will enable traffic control operators to best develop an integrated control strategy in response to a detected incident, including the display of appropriate messages, estimation of the target detour rate, and computation of signal settings to accommodate the detoured traffic flow. Further research along this line shall focus on:
♦ Performing a comprehensive survey of local drivers to understand their preferred messages
(e.g., delay, or travel time) during both recurrent and non-recurrent traffic congestion; ♦ Constructing a knowledge base for VMS applications that can effectively assist traffic center
operators in selecting appropriate messages in response to traffic conditions and the needs of local drivers;

76
♦ Developing an effective system to coordinate messages displayed at different locations but
within the same impacted area caused by the same incident so as to mitigate the rapid formation of traffic queues;
♦ Conducting a study to investigate the dynamic aspects of VMS applications in response to a
severe accident, including the messages to be displayed at the onset of a detected accident, during operations of the incident response team, near the end of incident clearance work, and in the traffic recovery period; and
♦ Integrating the incident response plan with Traffic Simulator that will enable traffic operators
to compute the optimal detour rate under various types of traffic congestion and estimate the resulting traffic impacts on both the freeway and the surface street.
♦ Formulating an operational model for traffic operators to dynamically adjust the signal
timings during incident detour operations, based on the dynamic interrelations between the reduced roadway capacity, the required duration for incident clearance, the target detour rate, and traffic volume on both the freeway and the surface streets.
Finally, it should be mentioned that all aforementioned research issues are interrelated,
and are critical not only to the success of incident response operations, but also to an effective implementation of advanced traffic management systems.

77
References 1 Atkins, Wootton, and Jeffrey (1996), Traffic optimization by the integration of information
and control (TROPIC), Feasibility study, Research Review Report, 1-91, Birmingham, UK. 2 Banks, J. H. (1989), Freeway speed-flow-concentration relationships: more evidence and
interpretations, Transportation Research Record 1225, TRB. 3 Baxter, Daniel H. (1989), Changeable Message Signs for Freeway Operations - Preliminary
Results of Sign Usages in the Long Island Freeway Corridor, ITE 1989 Compendium of Technical Papers.
4 Beers, J, Hulbert, S and Case, H. W. (1972), Judgments of vehicle speeds and traffic
patterns, UCLA-ENG-7281. 5 Bell, M. G. H. (1991), The real time estimation of origin-destination flows in the presence of
platoon dispersion, Transportation. Research, 25B, pp. 115-125. 6 Benson, G. (1996), Motorist attitudes about content of variable-message signs,
Transportation Research Record 1550, pp. 48-57. 7 Bolelli, A., and Rutley, K. (1991), The VAMOS white book for variable message signs
applications, DRIVE Conference (1991: Brussels, Belgium), Advanced Telematics in Road Transport.
8 Bonsall, P.W., and Schofield, M. J. (1993), VMS and route choice- driver response
assessment, Advanced Transport Telematics: Proceedings of Technical Days, Brussels, 8- 9-10, March 1993, Vol. 2.
9 Brocken, G. M., Martie J. M. and Van der Vlist (1991), Traffic control with variable message
signs, Vehicle Navigation and Information Systems. 10 Buijn, H. R., and Schouten, W. J. (1992), Route information in Amsterdam (RIA),
International Conference on Road Traffic Monitoring and Control (6th: 1992: London, England). 6th International Conference on Road Traffic Monitoring and Control, pp. 163-167.
11 Carden, P. J., Beck, I., and Meekums, R. J. (1997), The Midlands driver information system:
operational experience and findings, Computing and Control Division Colloquium on Strategic Control of Inter-Urban Road Networks (London, England), March 1997.
12 Catchpole, l., Hancock, A., and Cairney, P. (1995), Driver comprehension of formats for
presenting traffic information on dynamic signs, Res. Rep. ARR 269, ARRB Transport Research, Vermont South, Victory, Australia.

78
13 Chang, G.-L., and Tao, X. (1997) Estimation of large-scale network O-D flows with decomposition and parallel computing methods, working paper, Department of Civil Engineering, University of Maryland at College Park.
14 Chang, G.-L., and Tao, X (1997), Estimation of dynamic O-Ds for urban networks,
Proceedings of 13th ISTAT Symposium, Leon, France. 15 Chang, G.-L., Wu, J. and Lieu, H. (1994), Real-time incident-responsive system for corridor
control: modeling framework and preliminary results, Transportation Research Board 1452, Washington, DC.
16 Chang, G.-L., and Wu, J. (1995), Integrated real-time control for urban corridors: solution
algorithm and sensitivity analysis, working paper, Department of Civil Engineering, University of Maryland at College Park.
17 Cremer, M., and Schoof, S. (1989), On control strategies for urban traffic corridors,
Proceedings of IFAC Control, Computers, Communications in Transportation, Paris, France. 18 Cremer, M., and May, A. D. (1986), A new scheme for traffic flow estimation and control
with a two-component model, Proceedings of the 3rd IFAC/IFIP/IFORS Conference on Control in Transportation Systems, Pergamon, Oxford, pp.29-37.
19 Cummings, M., and Fournier, P. (1994), Electronic sign strategies, The European
perspective, 1st World Congress on Applications of TT and IVHS, V5, pp. 2683-90 Brussels, Ertico.
20 Dudek, C. L. (1979), Changeable message signs, NCHRP Synthesis of Highway Practice 61. 21 Dudek, C. L. (1986), Manual on real- time motorist information displays, Report No. FHWA-
IP-86-16. 22 Dudek, C. L. (1991), Guidelines on the use of changeable message signs. Report No. FHWA-
TS-90-043. 23 Dudek, C.L. (1992), Guidelines on the use and operation of changeable message signs, Texas
Transportation Institute, Research No. FHWA/TX-92/1232-9. 24 Eeden, P. G. M. A. van (1996), Dynamic route information in the Netherlands: effects and
research, Eighth international conference on road traffic monitoring and control, pp. 23-25, Institution of Electrical Engineers, London.
25 Ells, J. G., and Dewar, R. E. (1979), Rapid comprehension of verbal and symbolic traffic
sign messages, Human factors, 21(2), pp.161-168.

79
26 Garber, N. J., and Patel, S.T. (1995), Control of vehicle speeds in temporary traffic control zones (work zones) using changeable message signs with radar, Transportation Research Record 1509.
27 Hall, F. L., Allen, B. L., and Gunter, M. A. (1986), Empirical analysis of freeway flow-
density relationships, Transportation Research, Vol. 20A, pp. 197-210. 28 Hall, F. L., Hurdle, V. R., and Banks, J. H. (1992), A synthesis of recent work on the nature
of speed-flow and speed-occupancy (or density) relationships on freeways, Transportation Research Record 1365, pp. 12-18.
29 Hall, F. L., Pushkar, A., and Shi, Y. (1993), Some observations on speed-flow and flow-
occupancy relationships under congested conditions, Transportation Research Record 1398, pp. 24-30.
30 Hamid, Syed A, and Steed, Julian, J. (1998), The Introduction of traffic surveillance and
control on the privatized expressways in Malaysia, Ninth International Conference on Road Transport Information and Control, 21-23 April 1998, London, pp. 200-206.
31 Heathington, K.W., Worrall, R. D., and Hoff, G. C. (1970), An analysis of driver preference
for alternative visual information displays, Highway Research Record 303, pp. 1-11. 32 Helliar-Symons, R.D., and Wheeler, A.H. (1984), Automatic speed warning sign-Hampshire
trials, TRRI, Report 1118, Transportation and Road Research Laboratory, Crown Thorne, England.
33 Hobbs, A, Fraser, I, and et al. (1993), The Use Of VMS For Strategic Network Management
- The PLEIADES Experience, Advanced transport telematics: proceedings of technical days, Brussels, 8- 9-10 March 1993. Vol. 2.
34 Horst, Richard van der, and J. Wiel (1991), Measuring Effects of Variable Message Signing
on Route-Choice and driving Behavior, VTI Report, 372 A, Part 1, Proceedings of the conference Strategic Highway Research Program and Traffic Safety on two continents in Gothenburg, Sweden, Sep. pp. 18-20.
35 Housel, N. B., Chatterjee, K., and Bonsall, P. W. (1998), Variable message signs in London:
Evaluation in CLEOPATRA, Road Transport Information and Control, 21-23 April 1998. 36 Hutchinson, R.D., and Dudek, C. L. (1979), Delay, time saved, and travel time information
for freeway traffic management, Transportation Research Record 722, pp. 36-40. 37 Hulbert, S., and Beers, J. (1971), Research development of the changeable message concept
for freeway traffic control, Highway Research Board Special Report, No. 129, pp. 24-25. 38 Hustad, W., and Dudek, C., L. (1995), Driver understanding of abbreviations on changeable
message signs in New Jersey, Transportation Research Record 1689.

80
39 Janssen, W., and Horst, R. van. (1991), An evaluation of different forms of variable route
guidance messages, 24th ISATA International Symposium on Automotive Technology and Automation, Florence, Italy, 20-24th May 1991, pp. 593-598.
40 Janssen, W., and Horst, Richard van (1995), Presenting descriptive information in variable
message signing, Transportation Research Record 1403, pp.83-87. 41 Kline, D., W., and Fuchs, P. (1993), The visibility of symbolic highway signs can be
increased among drivers of all ages, Human factors, 35, pp. 25-34. 42 Kraane, M., Zijpp, N. van, and et al, (1999), Evaluating Networkwide effects of Variable
Message Signs in the Netherlands, Transportation Research Record 1689, pp. 60-67. 43 Lai, K., and Wong, W. (2000), SP approach toward driver comprehension of message format
on VMS, Journal of Transportation Engineering, May 2000, pp. 221-227. 44 Lyons, A., Richards, G., and McDonald, M. (1996), Network routing effects of variable
message signs, Intelligent Transportation: Realizing the Future, Abstracts of the Third World Congress on Intelligent Transport Systems.
45 McDonald, M. A., Richards, M. R., and Sharpe, J. (1998), The Development of VMS
strategies, Ninth International Conference on Road Transport Information and Control, April 1998, London, pp. 21-23
46 Miller, J. S., Smith, Brian L., and et al. (1993), Effective use of variable message signs:
lessons learned through development of users’ manuals, Transportation Research Record 1495.
47 Miller, J. S., Newman, B. L., and Demetsky, M. J. (1995) Development of Manuals for the
Effective Use of Variable Message Signs, Final Report, January 1995. 48 Miller, J. S. (1996), Guidelines for the effective operation and control of VDOT permanent
variable message sign and highway advisory radio units: state of the practice and recommendations, VTRC 96-TAR4, June 1996.
49 Overton, D. T., Graham, A. W., and Newton, D. W. (1996), The effect of Dynamic Setting of
VMS in Routing Traffic Around Chester, Eighth international conference on road traffic monitoring and control, 23-25 April 1996. Institution of Electrical Engineers, London.
50 Papageorgou, M., and et al. (1990), Modeling and real time control of traffic flow on the
southern part of Boulevard Peripherique in Paris: Part II: coordinated on-ramp metering, Transportation Research, Vol. 24A, pp. 361-370.
51 Payne, H. J., Brown, D., and Cohen, S. L. (1987) Improved techniques for freeway
surveillance, Transportation Research Record 1112, pp. 52-60.

81
52 Pedic, F., and Ezrakhovich, A. (1999), A literature review: the content characteristics of
effective VMS, Road & transport research, Vol. 8, no. 2, pp. 3-11. 53 Polydoropoulou, A., and Ben-Akiva, M. (1996), Case studies of user’s responses to advanced
traveler information systems (ATIS), Intelligent Transportation: Realizing the Future. Abstracts of the Third World Congress on Intelligent Transport Systems.
54 Polydoropoulou, A., Ben-Akiva, M., Khattak, A., and Lauprete, G. (1989), Modeling
revealed and state en-route travel response to advanced traveler information systems, Transportation Research Record 1537, pp. 38-45.
55 Pouliot, S. G., and Wilson, E. M. (1985), Motorist Information Needs and Changeable
Message Signs for Adverse Winter Travel, Transportation Research Record 1403, pp. 45-48. 56 Proffitt, D. R. (1998), Creating Effective Variable Message Signs: Human Factors Issues,
Report No. VTRC 98-CR31, Project No.9816-040-940, March 1998. 57 Ramah, P., and Kulmala, R. (2000), Effects of variable message sings for slippery road
conditions on driving sped and headways, Transportation Research Part F, March, 2000, pp. 85-94.
58 Reiss, R. A., and et al. (1981), Algorithm development for corridor traffic control, Traffic,
Transportation, and Urban Planning (Vol. 2), George Goodwin, London. 59 Reiss, R. A., and et al. (1991), Dynamic control and traffic performance in a freeway
corridor: simulation study, Transportation. Research, Vol. 25A, pp. 267-276. 60 Rultey, K.S. (1992), A review of motorway signals, TRRI, Research Report 339,
Transportation and Road Research Laboratory, Crownthorne, England. 61 Schouten, W. J. J. P., and Lieshout, M. J. van. (1998), VMS in the polder, International
Conference on Road Transport Information and Control, Ninth International Conference on Road Transport Information and Control, 21-23, April 1998, London.
62 Smiley, A., and Dewer, R. (1998), Changeable Message signs- A Driver Preference Survey,
Ontario Ministry of Transportation, Research and Development Branch, Ontario Canada. 63 Smulders, S. A. (1989) Applications of stochastic concepts to a freeway control Problem,
Proceedings of IFAC Control, Computers, Communications in Transportation, Paris, France. 64 Stephanedes, Y. J., and Chang, K.-K. (1993) Optimal Control of freeway corridors, ASCE
Journal of Transportation Engineering, Vo. 119, No 4, pp. 504-514. 65 Stephanedes, Y. J. and Liu, X. (1993), Neural networks in freeway control, Proceedings of
Pacific Rim TransTech Conference, July 25-28, Seattle, WA.

82
66 Stockton, W.R., Dudek, C.L., Fambro, D.B., and Messer, C.J., (1975), Evaluation of a
changeable message sign system on the inbound gulf freeway, Texas Transportation Institute, Research Report 2005.
67 TranSafety, Incorporated, Virginia Motorists Favor Variable Message Signs that are simple,
Reliable, and Useful, TranSafety Reporter, Nov 1997, pp. 7-8. 68 Upchurch, J., Thomas, G. B., and et al (1996), The use of Variable Message Signs in
advanced traffic management systems: An example of human factors considerations in IVHS, Vehicle systems for roads.
69 Vecellio, R.L., and Culpepper, T. H., Work area traffic control: Evaluation and Design,
Journal of transportation Engineering, 110, pp. 412-430. 70 Venglar, S. P. (1993), Using Changeable Message Signs on Arterial Streets for Incident
Management, Texas A& M University. 71 Vercruyssen, M., Wagner, D. G., Hancock, P. A., Briggs, A., and Williams, G. (1995),
Variable message signage content: survey test of meaning and simulation test of usability, University of Minnesota, Center for Transportation Studies.
72 Wagner, D., Vercruyssen, M., and Hancock (1997), A computer-based methodology for
evaluating the content of variable message signs, ITS JOURNAL Vol. 3, No. 4, pp. 353-373. 73 Wagner, D. R. (1978), Speed advisory information for reduced visibility conditions, Federal
Highway Administration Report No.FHWA-RD-78-18, May 1978. 74 Wenger, M., and Spyridakis, J., (1979), Motorist Behavior and the Design of Motorist
Information Systems, Transportation Research Report 1281, pp.159-167. 75 Wertjes, J. M. (1996), Use of Speed Monitoring and Communications Display for Traffic
Control, SD Department of Transportation Office of Research, Study SD 95-10, Final Report. 76 Wilson, E. M., and Pouliot, S. G. (1992), Motorist information needs and changeable sign
messages for adverse winter travel, MPC Report, No. 92-11. 77 Wilkie, J. K. (1997), Using variable speed limit signs to mitigate speed differentials upstream
of reduced flow locations, Graduate Student Paper, Department of Civil Engineering, Texas A & M University.
78 Wong, W.-G., and Lai, K.-H. (1999), Driver Attitudes Towards Display Formats of Real-
Time Traffic Information system, Transportation Planning and Technology, Vol. 23, pp. 1-19.

83
79 Wright, D. A., and Withill, R. A. (1992), Variable message signing-measure of effect, 6th International Conference on Road Traffic Monitoring and Control. London: Institution of Electrical Engineers.
80 Wu, J., and Chang, G.-L. (1996), Estimation of time-varying O-D matrices with dynamic
screenline flows, Transportation Research. Vol. 30B, pp. 277-290. 81 Yim,Y., and Ygnace, J. (1995), Variable message signs and link flow evaluation: A Case
study of the Paris Region, California PATH working paper; UCB-ITS-PWP-95-5. 82 Yves, D., Yim, Y., and Ygnace, J. (1993), Traffic Information and Driver Behavior in Paris
Region, Pacific Rim TransTech Conference (Seattle, Wash.) Proceedings, Vol. 1, pp. 166-169.
83 Yves, D. (1994), Traffic Information and Driver Behavior in the Paris Region, Moving
Toward Deployment, Proceedings of the IVHS AMERICA 1994 Annual Meeting, pp. 776-779.