Embed Size (px)
Citation preview

Interrelated modeling of land use and habitat for the design of an ecological corridor
A case study in the Yungas, Argentina
Daniel J. Somma
Promotor:Prof. dr. ir. H.N. van Lier,
Co-promotoren:Dr. ir. R.H.G. Jongman,Dr. ir. R.J.A. van Lammeren
Promotiecommissie:Prof. dr. ir. A. Veldkamp. Wageningen UniversityProf. dr. A. Skidmore. ITC, Enschede and Wageningen UniversityProf. dr. J. H. Morello Wyler, University of Buenos Aires, Argentina.Prof. dr. E. B Zoomers, Radboud University, Nijmegen, Nederland
Dit onderzoek is uitgevoerd binnen de onderzoekschool WIMEK

Interrelated modeling of land use and habitat for the design of an ecological corridor
A case study in the Yungas, Argentina
Daniel J. Somma
Proefschriftter verkrijging van de graad van doctor
op gezag van de rector magnificusvan Wageningen Universiteit,
prof. dr. M. J. Kropff,in het openbaar te verdedigenop woensdag 6 december 2006
des namiddags te vier uur in de Aula.
Author: Somma, D.J.
Title: Interrelated modeling of land use and habitat for the design of an ecological corridor A case study in the Yungas, Argentina
Thesis Wageningen University, Wageningen, the Netherlands – with references – with summaries in English, Dutch, and Spanish.
Publication year: 2006
ISBN: 90-8504-534-7
Subject headings: nature conservation, habitat fragmentation, connectivity, planning, Yungas, Argentina.
This thesis research is a joined cooperative effort by Wageningen University (The Netherlands) andUniversidad de Buenos Aires (Argentina)

Para Mariana, Natalia y Emilia
Para mis viejos: Olga y Miguel
Para Germán


“...nunca me creo en la cima o en la gloria, eso es un gran fantasma...”
(...I never believe in the summit or the glory, it is a great ghost...)
León Gieco (La colina de la vida)Contemporary argentine singer
(1951; Cañada Rosquín, Santa Fe Province, Argentina)


FOREWORD The Planning and the people
In this thesis we are principally dealing with physical planning applied to nature conservation. Physical planning is one of the four principles currents of planning which also includes: social, public policy and economic planning (Fabos 1985). The interaction with the other three dimensions should be taken into account.
Recent evolution of the concepts and tools (proactive approach, Decision Support Systems, GIS, etc.) for physical planning have improved the possibilities of the planners for successful results. There is encouraged a proactive attitude towards planning, avoid biodiversity and habitat loss through proper sitting and design; post-implementation mitigation is a last recourse (Treweek 1999, Leitâo and Ahern 2002). In the Netherlands is furthered this proactive strategic planning: to communicate the spatial landscape consequences of specific policy decisions (Harms et al. 1993, von Haaren and Warren-Kretschmar 2006). Among the tools scenarios modeling are particularly useful for attaining this purpose.
All present land-use planning is stressed between two seemingly contradictory dimensions: ecological conservation and economic existence (van Lier 1998). Both dimensions are, in someway or another, related to sustainability.
Sustainable development is defined as that development style that meets the needs of the present without compromising the ability of future generations to meet their own needs (UN 1987). Little literature on sustainability exists at the landscape and regional scales. Yet these scales may be the most relevant for accomplishing sustainability. (Forman 1995). Slowly changing attributes as assays for sustainability are the most appropriate since they are compatible with the necessary time frame to plan sustainably, e.g. biodiversity, water, soils, etc. (Forman 1995). And, Sustainability should be seen as a direction, rather than a concrete goal (Forman 1995, Zonneveld 1995).
We are here working in a landscape syntheresis approach (from the greek word syntereo: “to preserve”). These are plans and actions defined in order to prevent future negative impacts on the landscape and to assure their sustainable functioning (Leitâo and Ahern 2002).
Finally, for us the public participation in the planning processes is essential. It is a “must be” to successful planning. Research has demonstrated that people are more likely to accept an issue purposed when they had an active voice in the decision-making processes (Decker and Chase 1997). Validation by a representative group of stakeholders is needed before policy decisions are actually made. A democratic way of decision-making that can go beyond political and economic interests, and that may be able to acknowledge and solve land use planning problems and social injustices is probably the only way to achieve sustainable development (Seghezzo et al. 2003).


ACKNOWLEDGMENTSThe work described in this thesis was mainly developed in National Parks Administration of Argentina and specifically in its Planning Department and the national parks Calilegua ( Jujuy province) and Baritú (Salta province). Wageningen University (WUR, the Netherlands), the Netherlands Foundation for the Advancement of Tropical Research (Wetenschappelijk Onderzoek van de Tropen en Ontwikkelingslanden, WOTRO), the Canon National Parks Science Scholars Program and Universidad de Buenos Aires, Facultad de Filosofía y Letras (FFyL-UBA) funded this work.
I am deeply grateful to many people who supported me in getting data and writing this thesis.
Firstly, special thanks are due Professor Hubert van Lier, who was generous with his time and insights, and who did much to present and explain the impressive model of spatial planning and sustainable land use policies that the Netherlands represents. I would like to thank my “promotor”, Prof. Dr. ir. Hubert van Lier, for his motivating direction throughout this research. His deep sense about land use planning, his experience on the dilemma between development and sustainability worldwide and his commitment to sustainable development and global justice encouraged me to start and go on with the long process of doing a Ph.D. thesis on this subject. Huub, your support allowed me to continue beyond the (somes) ups and downs of my thesis development. Your kind visits and talks at Calilegua, Salta and Buenos Aires were energy subsidies to continue in my effort. Thanks a lot to you and Elly for your support!
I also want to vividly express my sincere gratitude to my “co-promotoren”, Dr. Rob Jongman and Dr. Ron van Lammeren. Rob encouraged me during both the proposal presentation stage and the whole research. Rob lighted me with the needed energy during my dark periods visiting several times at Buenos Aires. Thanks a lot, “Maestro”, to you and Annet!Ron generously advised me during my first contact to Wageningen University: Cordoba, Spain, 1992; and then during my M.Sc. thesis (1994-1996). He showed me the spirit of Wageningen and its sinful environment for research and science. Thanks a lot, Dr., I discovered the WUR because you!Rob and Ron managed to supervise my work in a framework of friendship, creativity, and receptiveness.Without their support and helpful comments and criticisms of the typescript at various stages in its development, this thesis would never have been completed. Thanks a lot to all of you, Huub, Rob and Ron!
Thanks are also due to Ankie Lamberts, Jeanine Hermans and Joeri Kalwij for helping me with practical and financial matters.
During my M Sc I received a great feedback from the ITC people, my special thanks to the warm hospitality and friendship of Johan and Lucero de Meijere, Sergio Gonzalez, Graciela Metternicht, Fabio Fussi and Paola Napolitano. My colleagues from that M.Sc. course were also a support later. Thanks to Peter and Yngrid Bergmann, Eduardo Santos, Isabel Bielsa and Menno Schleppel, and Hawa Sekhela Msham.

My thanks to my colleagues and students from Buenos Aires whose input helped to shape this thesis, especially to my Professor and Mentor in National Parks and University of Buenos Aires (UBA), Prof. Dr. Jorge Morello (¡Gracias por siempre Jorge!) and my Counselor, Dr. Claudia Natenzon and to Dr. Silvia Matteucci for her kindness and enthusiasm. Also, my special thanks to Dr. Hugo Trinchero, the dean of FFyL-UBA and Dr. Silvia Llomovatte, they helped me a lot with all the procedures of the University. Special thanks also to Dr. Sandra Luque from CEMAGREF (Grenoble) who always encouraged me to continue this research. My colleagues from UBA, Claudio Daniele (gracias por tu apoyo y amistad siempre, Claudio), Lia Bachmann, Andrea Frassetto and María Isabel de Andrade (¡gracias Isa por tu generosidad!) enriched my research and supported me with their friendship. I also thanks to Professor Andy Millington (University of Leicester), thanks a lot for his support to this research during the Bio Andes project.
My deepest gratitude goes to Pablo Perovic and Sandra Caziani. Pablo generously shared his feline’s data from his PhD thesis, gave me a first view of the region and widely supported me with his friendship. Sandra, a bright scientist, backed me with her kindness and comments. This thesis is also a humble tribute to her.
Special thanks go to my old friends from the Agronomy school - UBA, Jose Luis Licciardo (¡gracias Ruso!), Roberto (¡Hermano del Alma: Tío!) and Graciela Ateiro, Horacio Delgadino (¡“Hermano del Alma: Cabezón!”), Angela Fattigati (¡Tana!), Victor Sadras (¡Victorino Viejo nomás, Hermano del Alma: ¡gracias de corazón, hermano, por el aguante, las traducciones y el aliento!), Ana Ruben and Gabriela Nuñez. Thanks all of you for your enduring friendship. Thanks also to Métodos Cuantitativos Aplicados – Facultad de Agronomía - UBA, to Susana Perelman and especially to Alexis Cerezo, who generously supported me with statistical background, rich discussions on methods, a careful revision of the whole manuscript and his friendship (¡Gracias Hermano Alexis y Mimi!). Also my special thanks goes to Thorsten Wiegand (University of Leipzig) for a very relevant course (December 2005) and his generous advisoring.
I acknowledge the continuing support of the National Parks Administration of Argentina (APN), thanks to all the Parques people. Specially to my old friends: Rodolfo Burkart (my counselor), Raúl Romero (¡gracias Cofla!), Roberto Molinari (¡gracias Cofla!2), Graciela Antonietti, Leonor Cusato, Lucía Ruiz, Aristóbulo Maranta and Estela Ochoa, Silvina Melhem, Héctor Agostinelli, Ana Balabusic, Diana Simonetti, María Ruiz, Marta Arias Cuenca, Carmen Riquelme, Salvador Vellido, Juan Salguero, Raúl Ovalle, Gustavo Machado, Mario Bracco, Pablo Kunzle, Federico Bava, Roberto Cerdá, Marcela Gutiérrez, María Barreto, Florencia Lance, Martín Rodríguez, Norma Sanchez, Alfredo Fragas, Mabel Parisi, Catalina Coali, Rosa Bernardo, Patricia Mansilla, Alicia Liva, Marcelo Almirón, Adrián Georgopoulos, Sergio Domber, Justo Herrera, Anabel Yacianci and Horacio Paradela. Thanks, not only for allowing my mental flights but also for your friendship. Thanks to Claudia Longo and Javier Beltrán, an advisor on English style and conservation (¡Gracias Javier!). A special gratitude goes to Miguel La Blanca and Oscar De Paoli, friend from the life roads. As well, thanks to Pepe Cisternas and Claudia Ferri for their friendship. My gratitude goes also to Leo Gonzalez, Manolo Amorino, Jorge Aicardi, Victor De Gennaro, Marcelo Frondizi, Luis Opromolla, Carlos Girotti and Pablo Micheli, my friends from ATE (“este trabajo, es pa` Germán que nos mira desde arriba”).

Also from APN, my special thanks are also due to my Yungas team. Antonio Temporetti (¡gracias Antonio, Mónica, y Baltasar por vuestro apoyo de siempre!), Eloy López (el amigo baqueano que compartió toda su sapiencia sobre las Yungas), Ricardo Guerra, Mónica Menini (¡Hermano Ricardo, gracias a Mónica y tu hermosa familia!), my brothers Fernando Dobrotinich and Ximena Garibaldi, Fidel, Camilo and Ernesto (my friends from Baritú National Park), and the brothers of the Tinkunaku Kolla People Community: David Sarapura and Héctor Nieba (¿vamos pal Angosto?) and to Ariel and Lourdes Lopez (El Bananal, Jujuy) for their kindness. Thanks also to Félix and Nilda Vera, Simón Juárez, Gerardo Carreras, Silvia Rodriguez, Guillermo Nicolossi, Mario Nina and Daniel Bravo. Very special thanks to Bettina Aued, who classified some of the Landsat TM images and did part of the fieldwork checking program. Thanks a lot to Marcelo Fernandez and Alejandra Forguez for your long-lasting support and hospitality (¡gracias por todo siempre!). My gratitude also goes to the school of Valle Grande ( Jujuy), to Lita Litti and Graciela Fernandez for their kindness. Thanks are also due to the National Inventory Forest team, Pablo Horak, Roberto Benítez, Nora Clemente, Fernando Salvaré, Luciana Ingaramo, Mirta Larrieu and José L. Darraidou, for their friendship.
A number of people of INTA (National Institute of Agricultural Technology) helped make this thesis deeper than it may have been, from the very beginning. I am particularly grateful to the people of Instituto de Clima y Agua, especially to César Rebella, Martín Grondona and Carlos Di Bella. Also I want to thank to Jorge Walberg (INTA San Pedro, Jujuy) and José Volante (INTA Salta) for their collaboration and fruitful talks. They broadened my comprehension of the Yungas and Northwest farming systems.
I enjoyed the stimulating working atmosphere at the CGI in Wagenigen. During this May 2006 Philip Wenting was more than a partner, he was a friend that shared all at hand to make me feel better, thanks a lot, Sir!. Also, I had interesting conversations, especially with Peter Verburg, Sabine van Rooij, Sander Mücher, Hans Baveco, and Michiel van Eupen (Thanks a lot, Michiel, for the Osiris crash course!). Thanks also to Truus van de Hoef, Frans Rip, Sytze de Bruin (¡Gracias, Hermano!) and Shirley de Bruin (¡grande los Ticos!), Joep Crompvoets (¿vamos a Sevilla, Hombre?), Antoinette Stoffers, Jan Hein Loedeman (¡gracias professor!), Lena Elings, Arnold Bregt, Michael Schaepman and my old GIS teacher, John Stuiver.
Thanks are also due to the Canon National Parks Science Scholars Program and the US National Parks Service, especially to Gary Machlis, Mike Soukup, Terry and Susan Boyle (¡gracias siempre!). The Canon Program was more than financial support; the seminars were also a life school (¡Gracias Gary y Mike!).
I would also like to express my gratitude to my colleagues of the Richard Plant GIS Lab, College of Agronomy and Range Sciences, University of California Davis. That year (2001 – 2002) that was possible by a Fulbright - H.H. Humphrey Program was amazing. Special thanks to my mentor: Richard Plant (¡gracias, Maestro!), Alvaro y María Roel (¡Grande Oriental!), Jorge y Rosario Pérez Quesada, Daniel and Gabriela Calanni, Aibek and Gulzat Moldogaziev, Katoyishi Kabongo, Alberto and Patricia Iandolino, Tina and José Castillo, and Alex Thorn. Thanks to the Fulbright Commission of Argentina, especially to Norma González and Graciela Abarca. Deep thanks to my program Director, Dennis Dutschke, the UC Davis Chancellor Larry Vanderhoef, Bill Lacy, Bob Kerr and Parvin Damania. Very special thanks to Wolfgang Pittroff and Freddy Garcia Castro. Thanks to all of you, I will never forget Davis and your friendship!
Also special thanks to the indigenous people, who, in a way or another, made a contribution to my work or well-being during my different stays in the Yungas. They taught me about their special relationship

with the “Tigers”. Guaraníes of Calilegua (Cuapé Yayembuate), Kolla people of Valle Colorado and Valle Grande ( Jujuy), Tinkunaku (Orán) and Finca Santiago (Iruya) and Guarani people from Algarrobito (Tape Iguapegui, San Martín, Salta). Specially my gratitude goes to Onorato Cardozo, Bautista Arias, David Ontiveros, Valentín Mamaní, Nilo Mamaní, Eusebio and Isabel Ocampo, Julio Simón (Río Cortaderas), Gerardo and Rosalia García, Cecilia Bolívar, Abel Palacios, Esteban Zárate, Ceferino Zárate, Adolfa Canabire, Marcos Canabire, Lorenzo Canabiri, Martín Calapeña, Jorge Canchi, and Roberto Barraza. My special thanks to Jorge Nahuel (¡gracias!), Roberto Ñancucheo, Daniel Quilapán and Veronica Willipan from the Mapuche people and their special vision of sustainable development.
From the INAI (Instituto Nacional de Asuntos Indígenas) I thank to all the staff and specially to Jorge Pereda (My teacher and friend, we shared a lot of dusty roads and we will share more in the future!), Nazareno Adami, Beatriz Cachero, Jenny Amaya, Daniel Slutzky, Inés Quilici, Majo Chena, Natalia Vázquez, Antonio Dell`Elce, Martín Correa, Viviana Cané, Mauricio Boivin, Julio Sosa, Valeria Marabert, Marita Acosta and Jorge Córdoba. Thanks, I learned a lot with all of you. Also, my deep gratitude to the team of the Strategic Action Plan of the Bermejo River: Hector Martinez, Carlos Brieva and Juan Carlos Ruscio. They generously shared with me all their data and enriched my views with analysis and discussions. As well, thanks to my Brother, Emiliano Ezcurra (Greenpeace), for his courage and friendship.
Thanks also to Nicolas Ray (University of Bern) for his very kind support with PATHMATRIX, to Alex Hagen (RIKS), and to Trevon Fuller (University of Texas at Austin) for his kind support about graph theory and LQGraph. Thanks also to Josefina Chocobar and Jacki Eliano (UBA) and Natalia Fracassi (INTA) for their kindness and support.
Always I will be deeply indebted to my parents Olga and Miguel, my family (Miguel and Tina: ¡Gracias siempre Mingo!, Fabricio, Belén and Bianca, Samantha, Antonella, and Mirta), my family in law (Yuyo, Daniela, Paula and Martín!, also to Lucio, Bárbara, Emilio, Claudio, Sofi, Mica, Emilito, and Jere), and my friends in Argentina and elsewhere, for their love, care, and guidance. Thanks to Victor Acosta, Nancy and Catalina Castillo, Daniel Garcete, Lilian Hernandez, Guille Manrique, Beto Herrera, Kelo Alderete and Pilar Roque. Thanks, Calzada People!.My special thanks to my oldest Brother: Ricardo Drago, Monica Rey, Riki and Facu, thanks a lot to all of you for all these years, the mates, the talking in Wilde and the dreams! Thanks a lot, always!
I would like to take this opportunity to very deeply thank to our friends in Wageningen: Adriana Alvarez and Lucas Seghezzo (and to Natalia and Mateo, the Seghezzo- Alvarez family generously supported me during several times at home: thanks always!), Susana García and Francisco “Chiche” Sassano (Gracias Chichizola!), Sofia Méndez and Julián Chambouleyron, Noel Cazolla and Pablo Chilibroste (and to Elena and Pedrito), Gabriela Perrone and Santiago Dogliotti (and to Vera, Juan and Gina), Mabel Bregliani, Gustavo Figari, Lilián Galán and Guillermo Galván (and to Estefanía and Sofía), Fernanda Dreccer and Daniel Rodríguez, Sandra and Ronaldo Pereira de Oliveira, Leo Pantimena, and Kofi Owusu.
My deepest and greatest thanks are to my wife, Mariana, for her love, patience, companionship, and integrity, and to our lovely daughters, Natalia and Emilia, simply for their wonderful existence. You change everything better for me. You made possible this research and you move me every morning. Forgive all this time; I am coming back from the Thesis planet!¡Mis amores: ustedes son el camino de mi vida!
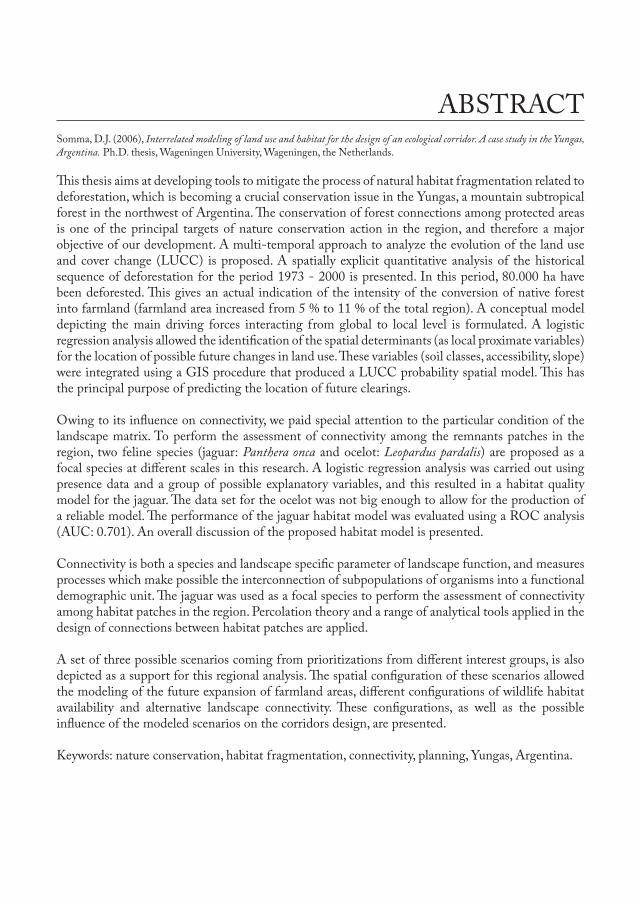
ABSTRACTSomma, D.J. (2006), Interrelated modeling of land use and habitat for the design of an ecological corridor. A case study in the Yungas, Argentina. Ph.D. thesis, Wageningen University, Wageningen, the Netherlands.
This thesis aims at developing tools to mitigate the process of natural habitat fragmentation related to deforestation, which is becoming a crucial conservation issue in the Yungas, a mountain subtropical forest in the northwest of Argentina. The conservation of forest connections among protected areas is one of the principal targets of nature conservation action in the region, and therefore a major objective of our development. A multi-temporal approach to analyze the evolution of the land use and cover change (LUCC) is proposed. A spatially explicit quantitative analysis of the historical sequence of deforestation for the period 1973 - 2000 is presented. In this period, 80.000 ha have been deforested. This gives an actual indication of the intensity of the conversion of native forest into farmland (farmland area increased from 5 % to 11 % of the total region). A conceptual model depicting the main driving forces interacting from global to local level is formulated. A logistic regression analysis allowed the identification of the spatial determinants (as local proximate variables) for the location of possible future changes in land use. These variables (soil classes, accessibility, slope) were integrated using a GIS procedure that produced a LUCC probability spatial model. This has the principal purpose of predicting the location of future clearings.
Owing to its influence on connectivity, we paid special attention to the particular condition of the landscape matrix. To perform the assessment of connectivity among the remnants patches in the region, two feline species (jaguar: Panthera onca and ocelot: Leopardus pardalis) are proposed as a focal species at different scales in this research. A logistic regression analysis was carried out using presence data and a group of possible explanatory variables, and this resulted in a habitat quality model for the jaguar. The data set for the ocelot was not big enough to allow for the production of a reliable model. The performance of the jaguar habitat model was evaluated using a ROC analysis (AUC: 0.701). An overall discussion of the proposed habitat model is presented.
Connectivity is both a species and landscape specific parameter of landscape function, and measures processes which make possible the interconnection of subpopulations of organisms into a functional demographic unit. The jaguar was used as a focal species to perform the assessment of connectivity among habitat patches in the region. Percolation theory and a range of analytical tools applied in the design of connections between habitat patches are applied.
A set of three possible scenarios coming from prioritizations from different interest groups, is also depicted as a support for this regional analysis. The spatial configuration of these scenarios allowed the modeling of the future expansion of farmland areas, different configurations of wildlife habitat availability and alternative landscape connectivity. These configurations, as well as the possible influence of the modeled scenarios on the corridors design, are presented.
Keywords: nature conservation, habitat fragmentation, connectivity, planning, Yungas, Argentina.

CONTENTS
Chapter 1: Problem statement and conceptual background 1
Chapter 2: Land use and cover change in the Yungas region 17
Chapter 3: Habitat condition for focal species in the Yungas region 47
Chapter 4: The design of biological corridors and the landscape connectivity 77
Chapter 5: Alternatives for a decision framework for landscape 101 connectivity in the Yungas region
Chapter 6: General synthesis and future research 129
Chapter 7: General summary – Algemene samenvatting – Resumen general 141
Mini Summary 151
References 153
Curriculum Vitae 177


ABSTRACT
This chapter presents the biogeographic context and the conceptual background of the thesis, which aimed at developing tools to analyze the process of habitat fragmentation related to deforestation and propose alternatives of mitigation or prevention. Deforestation, particularly in tropical rainforest, is a crucial conservation issue worldwide. Here this fragmentation process is expressed in the Yungas: a mountain subtropical rainforest in the northwest of Argentina (and South of Bolivia), which is the richest biodiversity ecoregion of the country. Conversion of native forest to farmland is occurring in the region. There is analyzed how is considered the conceptual background of landscape connectivity and habitat management in the national parks system of Argentina. Particularly in the study region, the persistence of connections among the existing protected areas (national and provincial parks) is threatened and, constitutes one of the principal targets for nature conservation. The application of spatial concepts as theoretical foundation for the design of ecological infrastructure that can guarantee these connections is analyzed. There, the design of biological corridors through a connectivity analysis supported in percolation theory and graph theory and focal species application is outlined. Finally a discussion about the kind of interactions (social and technological) to be considered at the time of inclusion of a corridor plan in a conservation policy is exposed.
CHAPTER 1Problem statement and general background
A previous version of this chapter was published in Somma, D.J., Aued, M.B., and Bachman, L., 2004. The ecological network development in the Yungas, Argentina: planning, economic and social aspects. pp. 207-220. In: R. Jongman and G. Pungetti (eds.): Ecological Networks and Greenways. Concept, design, implementation. Cambridge University Press, Cambridge. 345 pp
1

CONTENTS
DESCRIPTION OF THE STUDY REGION: THE ARGENTINE YUNGAS SUBTROPICAL RAINFOREST 3 Biogeography of the region 4 The planning context: the protected areas system of Argentina. Brief synthesis and elements for an updated strategy 7THE APPLICATION OF SPATIAL CONCEPTS 9 Application of percolation theory 13 The design of the biological corridors 13
FIGURESFigure 1. 1. The Yungas region: general location of the study area, parks, and principal Rivers 3Figure 1. 2. Ecoregions and rainfall distribution in the Yungas region 4 Figure 1. 3. A typical eastern hillside of the Yungas 6 Figure 1. 4. Dynamic of the conversion process in tropical forest (from Dirzo 2001, with permission) 7 Figure 1. 5. Model of territorial planning (according to Ruzicka and Miklos 1990) 9Figure 1. 6. Digital Elevation Model (DEM) at the regional scale (altitude values are presented in meters above sea level) 10Figure 1. 7. The landscape matrix and its relevance for connectivity (from Harrison and Fahrig 1995 with permission) 12
TABLESTable 1. 1. Summary of protected areas in the Argentinean sector of the Yungas under study (Provinces of Salta and Jujuy) 8
2
Problem statement and general background

DESCRIPTION OF THE STUDY REGION: THE ARGENTINE YUN-GAS SUBTROPICAL RAINFOREST
This research focused on the northern sector of the Yungas ecoregion or Tucuman - Bolivian forest, in the Argentinean provinces of Salta and Jujuy (Figure 1.1). It is the more extensive of the two richest biodiversity ecoregions of the country (Paranaense forest in the Northeast). Additionally, the Yungas ecoregion is considered one of the Terrestrial Global 200 Ecoregions (Dinerstein et al. 2000) that contain exceptional levels of beta diversity (beta diversity: the change in species composition from one site to another, or along environmental gradients). Montane forest is the predominant land cover type, still expanding over a large proportion of the ecoregion`s original extension. It penetrates from Bolivia into the north-west of Argentina as a continuity of the tropical forests of the eastern slopes of the Andes Mountains. However, different activities are competing intensively for land and natural resources in the region.
3
Chapter 1 – Problem statement
Figure 1. 1. The Yungas region: general location of the study area, parks, and principal Rivers.

These include nature conservation, agriculture, recreation, tourism, industrial forestation, water storage and regulation of the hydrological regime, oil, gas and mining (Burkart 1994a, Burkart 1994b, Reboratti 1998). To accommodate all these activities, and to ensure the economic and environmental sustainability of the region, a land use planning effort that considers the continuity of the natural processes at a regional scale is essential. Owing to scarce planning, however, the current situation in the region is unsustainable in the long term. Even more, the effects of the fragmentation of natural landscapes start to show serious effects: the deforestation rate has doubled in the last 4 years and a severe flood occurred (Somma et al. 2004). This research therefore aims at applying spatial concepts of land use planning (ecological networks, corridors and regional frameworks) as a blueprint for long-term planning.
Biogeography of the regionThe South American cloudy forest is a long strip along the Andes oriental slope from Venezuela (8 ° N) to the Northwest of Argentina (28° S). These Andean slope forests are considered among the richest on earth in terms of diversity and endemism (Conservation International, 2000). Animal species use the Yungas ecoregion as an enormous natural corridor for their dispersal. The planning of this area is, therefore, of great significance for the objectives of nature conservation in South America. Their protection is also essential for the maintenance of the natural processes in the subcontinent. The Argentinean sector of the Yungas, in the Northwest of the country, extends from the south of Bolivia, beginning north of the Tropic of Capricorn (Figure 1.2).
4
Problem statement and general background
Figure 1. 2. Ecoregions and rainfall distribution in the Yungas region.

It is a mountainous wedge that borders the well-known semi-arid and cold grasslands of the Puna plateau at the highest elevations to the west, and a semi-arid resinous shrub and dune communities’ ecoregion to the south, which is known as the Western Monte. It is limited by the great Chaco savannas and shrublands to the east.
The Argentinean Yungas are easternmost ridges of the Andes mountains, situated in the geomorphologic formations known as Sub Andean ranges and Eastern Cordillera. This portion of the Yungas occupies about 4.500.000 hectares (Burkart et al. 1999) of which approximately 80 % are within the provinces of Salta and Jujuy in an altitude range from 500 to 2500-3500 masl (Cabrera and Willink 1973). The Northern portion of this sub-region, where forest fragmentation is most intense, constitutes the study area.
The ecoregion is called Southern Andean Yungas (Olson et al. 2000, Dinerstein et al. 2000) and it contains what may be the last of the isolated ‘evergreen’ forests resulting from Quaternary glaciations (Nores 1992). According to Olson et al. (2000), it is characterized as Tropical and Subtropical Moist Broadleaf Forests. Annual rainfall ranges from 1000 - 2000 mm, and it has marked longitudinal, altitudinal and seasonal patterns. Most of the rain is concentrated in summer, between October and April. Under the influence of easterly winds that transport clouds and humidity, precipitation is distributed progressively through the Eastern boundary of the Yungas, with the Western hillsides receiving less rainfall. The spatial configuration of the ecoregion in Argentina confers very singular characteristics. It has a peninsular shape that also strongly influences the biogeographical pattern (Ojeda 1999, Tabeni et al. 2004).
The region is also characterized by cold and possibly icy winters. The vegetation generally seems like a dense jungle (Lavilla and Gonzalez 2001). Cabrera (1976) developed a floristic description of the Argentinean Yungas in their different strata and altitudinal districts. These are: piedmont forest, montane subtropical forest, temperate montane forest, montane grassland and high Andean grassland (Figure 1.3). These forests are stout, ranging in height between 4 and 30 m depending on the stratum. They are laden with epiphytes, ferns, mosses and lianas in the lower forest types. The higher elevations are characterized by high andean grasslands, dominated by Agrostis and Stipa spp. Descending in elevation, the vegetation is characterized by low, stunted forests (4 – 6 m) of Queñoa (Polylepis australis) followed (1200 and 2500 m) by a forest composed mostly by Andean alder (Alnus acuminata), Parlatore’s Podocarp or Cerro pine (Podocarpus parlatoreii), Tropical walnut ( Juglans australis) and Sauco (Sambucus peruviana), which rise up to 4-8 m. In the lower strata, the montane jungle is dominated by the Myrtaceae and Lauraceae families with a subtropical appearance. This ecosystem also includes Cedar patches (Cedrella lilloi and other Cedrella species) the most commercially valuable forest species of the Yungas. The toposequence then finishes with the transition or piedmont jungle dominated by species of the genus Phyllostylon, Calycophylum and Patagonula (Figure 1.3). These strata average 20 – 30 m with different interior layers. Lastly, some western and drier hillsides are characterized by an additional vegetation stratum, Sierran Chaco, which represents only 5 % of the study area.
This ecoregion hosts 60 % of the total bird species and 35 % of the terrestrial mammal species of the country (Ojeda 1999). It shelters some singular species like the Jaguar (Panthera onca) and the North Andean deer or Taruca (Hippocamelus antisensis), a mountain deer, both with the special
5
Chapter 1 – Problem statement

protection status of National Natural Monument, a recognition from the Argentinean National Parks Administration (Administración de Parques Nacionales, APN) of their endangered condition. From different analyses (Ojeda 1999, Somma and Perovic 1999), there is a common opinion that the Yungas National Parks are not large enough to shelter the Jaguar (Panthera onca) and other species that are suffering the fragmentation process: White-Lipped Peccary (Tayassu pecari), Agouti (Dasyprocta punctala), Brazilian tapir (Tapirus terrestris), Little Tiger cat (Leopardus tigrinus), Margay cat (Leopardus wiedii), and Crab-eating Racoon (Procyon cancrivorus) (Ojeda 1999).
The Argentinean Yungas have a verified process of fragmentation. During the period 1975 - 1988 about 1,250,000 hectares were converted to agriculture in the ecotone Yungas - Chaco (Burkart 1994a, Burkart 1994b, Reboratti 1989, Reboratti 1998). Recent research found that in the last 4 years, the rate of deforestation in the Yungas region, between Calilegua and Baritu National Parks, increased two-fold from 1000 ha/year and reaching over 3000 ha/year in some areas (Somma et al. 2004). This deforestation process is focused on the piedmont forest, the Yungas ecosystem with very gentle slopes most suitable for agriculture (Figure 1.4). It is also poorly represented in the current Yungas protected areas and is definitely the most threatened ecosystem of the region (Malizia 2001, Pacheco et al. 2005).
The study area of the Argentine Yungas is part of the High Bermejo River watershed. The Bermejo River is one of the principal affluents of the Paraná - Plata Basin. The management and conservation of natural assets and biodiversity in the Yungas has a direct influence on the Paraná – Plata system. This aspect will be expanded in Chapter 5.
6
Problem statement and general background
Figure 1. 3. A typical eastern hillside of the Yungas.

In South America, this fragmentation process is particularly affecting jaguars and other large felines (Quigley and Crawshaw 1992). Currently, the jaguars are registered in only 62% of their original South American territorial range. Their habitat continues to quickly diminish despite their status of international protection (Perovic 2002b).
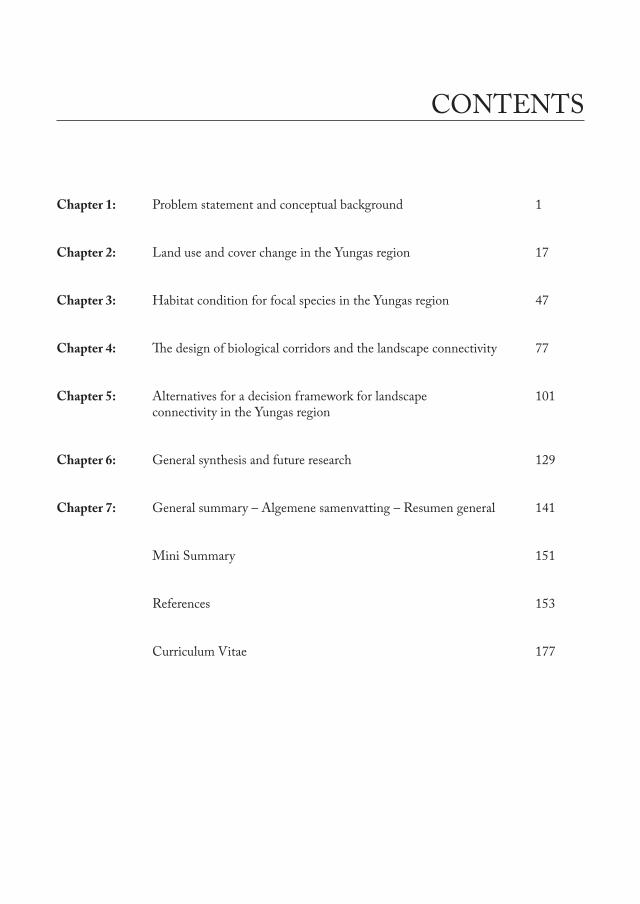
The planning context: the protected areas system of Argentina. Brief synthesis and elements for an updated strategyNature conservation through a system of natural reserves began in Argentina in the 1920s. It was the third conservation system in the world after those in the USA and Canada. Reserves aimed at preserving the scenic beauty of some natural landscapes (e.g.: Iguazú National Park), and also addressed three major strategic needs: to populate Patagonia (the immense sub-continental space that occupies the southern portion of the country), to consolidate urban nuclei in areas of international conflicts and to protect several watersheds (Sarobe 1935). In the 1940s, the system was enlarging its perspective by including areas of subtropical forests such as National Park “El Rey”, established in 1948 (Table 1.1).From hindsight, the historical context shows that this approach was doomed to fail in its objectives of nature conservation, as no account was made for the integration of natural processes at different spatial scales, from local to regional and sub continental. This failure appears to be a common feature of the protected areas systems worldwide (Stattersfield et al. 1998).
7
Chapter 1 – Problem statement
Figure 1. 4. Dynamic of the conversion process in tropical forest (from Dirzo 2001, with permission)
The persistence in time of this approach based on reserves (Bennett 1997) or National Parks model (Thiele and Prober 2000) lead to the current situation, whereby poorly planned diversification of land use, evidenced by a higher proportion of agricultural lands, dominates the landscape and constitutes the matrix that surrounds several reserves. These fragmentation processes are affecting the viability of several National Parks and reserves (Vervoorst 1982, Burkart 1994a) by generating growing conditions of isolation. Furthermore, they reveal some inadequacies in the former policy carried out by the National Parks Administration (APN).The potential connections and flows (e.g.: fauna movements, seed transporting) among reserves were barely considered in the development of regional plans. As a consequence, management programs of natural reserves were formulated on the basis of each individual reserve’s condition, with little attention to the regional context. Bennett (1999) pointed out the shortcomings of management systems based on reserves. It would be proper to explore the possibilities of the approach based on ecological networks ( Jongman 1995, Jongman and Pungetti 2004). However, this has not been totally incorporated or even accepted in the Argentinean system of protected areas. On the other hand, it is not always feasible to consolidate an ecological network of reserves, including core areas, corridors, and buffer zones. Limitations determined by competing land use alternatives, financial restrictions, etc. usually hamper the eco-network option.
In ecological networks, significance is placed on preserving natural patterns at the regional scale and the interaction between reserves and habitats, more than in establishing isolated conservation islands. The objective is to achieve connectivity of various sorts and to address habitat linkage at multiple scales (Bennett 1999). This territorial planning process (Ruzicka and Miklos 1990: Figure 1.5) includes the development of a system of habitat reserves with special attention to the conditions in the landscape matrix.
8
Problem statement and general background
Table 1. 1. Summary of protected areas in the Argentinean sector of the Yungas under study (Provinces of Salta and Jujuy).
Nature Type Province IUCN Area (ha) YearReserves location Management
category of
establishment
Parks in the study area
Baritu National Park Salta II 72,439 1974Calilegua National Park Jujuy II 76,000 1980
El Pantanoso** Private reserve Jujuy II 5,000 2000Pintascayo Lagoon Provincial Park Salta II 10,000 2001
Parks located in Yungas but outside of the study area
El Rey National Park Salta II 44,162 1948Potrero de Yala Provincial Park Jujuy IV 4,292 1952
Acambuco Provincial Reserve Salta IV 8,266 1979El Nogalar National reserve Salta IV 8,000 2001
** There are no approved cadastral or lim its of this private reserve yet.
This landscape matrix is “the complex of natural, and semi-natural lands converted to other uses inside which the system of reserves is itself insert” (Franklin 1993). In this matrix, ecological processes of larger scale take place that integrate the reserve inside a mosaic where the reserve itself is contained (Merriam et al. 1993). This approach, based on an integrative landscape (Bennett 1997), analyzes the situation of each reserve as a function of the set of reserves and habitat sites in a region. It considers their spatial interactions with other uses of the territory. The objective is to assure certain exchange capacity of flora and fauna, and the continuity of populations, communities and natural processes among the different points of this system of connected habitat sites (Bennett 1999).
The application of spatial conceptsFrom the previous discussion, it follows that in the Argentinean Yungas, a land use strategy (sensu Harms 1995) is necessary. Some concepts of physical planning can be functional to a land use strategy and to the design of different spatial strategies for the region. These include 1) Regional frameworks, and 2) Ecological networks.
The regional framework is a segregation of uses of the territory at a small scale (farm level or individual property), and integration at a large scale (regional level). This concept is based on a distinction
9
Chapter 1 – Problem statement
Society needs and landrequirements for territory
Landscape - ecologicalproperties
Ecological dataon the landscape
Landscapeelements
Landscape - ecologicalproposal
1. Determination of aims anddelimitation of territory
of interest
2. Landscape - ecologicalanalysis and synthesis
3. Ecological optimization andevaluation of
landscape - ecological data
Figure 1. 5. Model of territorial planning (according to Ruzicka and Miklos 1990)

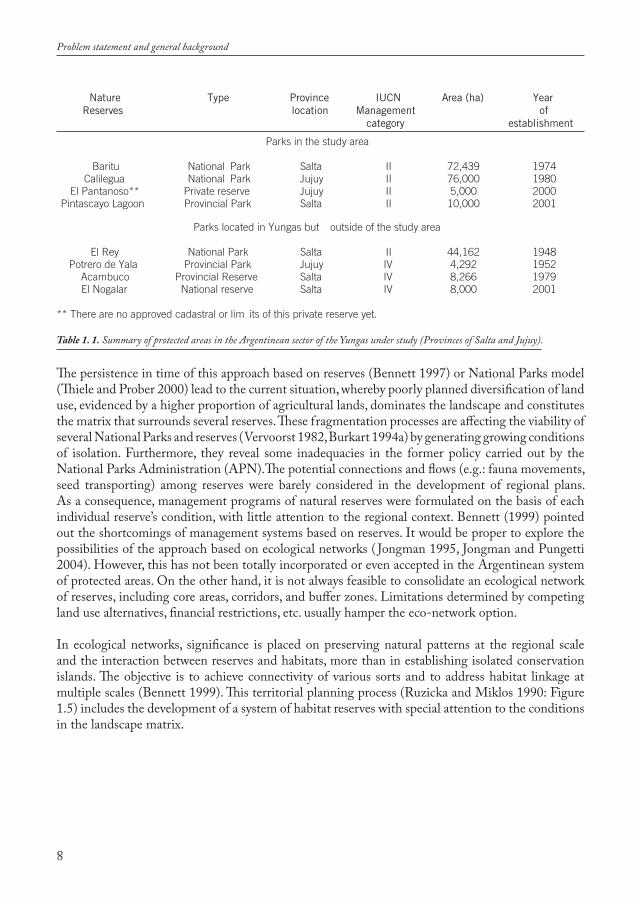
among the regional phases according to their dynamics of land cover change. We can classify the natural ecosystems as regional phases in the category of low dynamics, and agroecosystems, urban systems, recreation and transport activities as phases of high dynamics. The regional framework segregates in space among the intensive uses of high dynamic phases, requiring a flexible design, and the most extensive uses in the territory requiring stability (low dynamic phases: natural ecosystems). The objective is to modify an inadequate assignment of uses of the land considering not only its productive potential but also its nature conservation and biodiversity values (van Lier 1998).
The dynamic phases, e.g. agricultural areas, need short-term planning cycles to be adapted to the common, rapid changes in production styles, international markets, etc. The most dynamic phases can be defined as the driving forces (the “engine”) of the process of land use change. The low dynamic types, including nature conservation, require a long-term planning horizon, with continuity in space and time. These uses of the territory traditionally depend on government policies.In the landscape, the opposed forces of high and low dynamics are in continuous stress. They present conflicting characteristics in their temporal and spatial relationships. That could be resolved, or mitigated, by applying the concept of regional framework. This concept implies the planning of a land use pattern with interconnected areas in which long-term, sustainable conditions are provided for protection of natural processes (van Buuren and Kerkstra 1993). A natural process, or a combination of several processes, works as a control variable. It determines the outline of land use allocation. This outline will imply carefully conceived objectives and long-term planning. The regional framework establishes a balanced interaction among uses of the territory, physiographic conditions and ecological characteristics (Kerkstra and Vrijlandt 1990).In the Yungas, the control variable is the altitudinal variation at the regional scale (as the expression of natural processes). To make this analysis possible and to determine the regional physiographic conditions, our team completed a digital elevation model (DEM) at a 1: 100,000 scale (Figure 1.6).
10
Problem statement and general background
Figure 1. 6. Digital Elevation Model (DEM) at the regional scale (altitude values are presented in meters above sea level)

The Ecological Networks concept can be considered as a constellation of landscape elements that is functional to the dispersal of a species in that particular landscape (van Lier 1995). These elements are:
• Core areas • Buffer zones • Corridors
These other elements can be also considered: • Natural recovery areas • Habitat patches
And as a general background: • Landscape matrix
The core or nuclear areas are generally those of greatest ecological value, already recognized and usually with a protection status. In the Yungas, that legal figure is mainly represented by the existent national Parks and provincial reserves (National Parks Calilegua, Baritu and the new provincial reserve: Pintascayo Lagoon provincial Park). Natural recovery areas are those that offer potential for habitat recovery. The buffer zones are sectors surrounding the core areas and its main functions are to filter negative effects for the core from the exterior (e.g.: the new private reserve “El Pantanoso” in Jujuy province that was created in 2000. It comprehends 5000 ha and is adjacent to the northern border of Calilegua National Park.). The buffer zones also can minimize the fragmentation and isolation of the core areas ( Jongman and Troumbis 1995).
Biological corridors, of varying shapes and sizes, have as principal function the connection of the different core areas. They have deserved diverse opinions, for and against their implementation (Noss 1987, Simberloff and Cox 1987, Saunders et al. 1991, Simberloff et al. 1992, Beier 1993, Rosenberg et al. 1998, Estrada and Coates Estrada 2001, Freudenberger and Brooker 2004). We assume that the corridors´ role is positive for landscape connectivity, and that they provide useful connections among patches (Beier and Noss 1998).
The habitat patches are landscape fragments where the survival of a given species is possible but contingent upon the relationship between area and number of individuals; thus defined, habitat is a concept referred to a specific species (Merriam 1988).
The ecological networks are thus a technical response to the habitat fragmentation process, which is a key topic in conservation biology (Harris 1984, Saunders and Hobbs 1991, Simberloff 1995, Urban and Keitt 2001, Jongman et al. 2004). Fragmentation behavior is similar to other processes generating landscape patterns. It is not expressed in a particular scale, but it rather encompasses a hierarchy of scales (Urban et al. 1987). Just as land use patterns are analyzed according to the spatial relationships between agricultural and natural ecosystems, the fragmentation process should be assessed as a multi-scale problem. The different intervening distances will determine if the landscape is, for example, a fragmented forest, a group of forest fragments, or an insular habitat fragment. It must be considered in function of species-specific dispersal characteristics (Harris and Silva Lopez 1992).
11
Chapter 1 – Problem statement
The landscape fragments are connected if patterns or processes that link them somehow exist (Green 1994). These links can be originated for static patterns (landforms, soil types, vegetation cover, etc.) or for dynamic processes (dispersal, fire, flooding, etc.). The animals’ dispersal, one of these dynamic processes, is in direct relationship with connectivity: “the relative degree of easiness with which the animals and genes can move through the landscape” (Forman and Godron 1986). In this context, one of our main problems in the Argentinean Yungas is how to increase the levels of current connectivity and to mitigate the effects of fragmentation, recovering the historical levels of landscape connectivity (Noss 1987, Keitt 1995). The reestablishment of connections among groups to overcome the local decline of sub-populations (in a metapopulation context, see Opdam 1987, Hanski and Gilpin 1997) and the “demographic rescue” effect are key functions of natural corridors (Hanski 1985, Soulé 1996, Estrada and Coates-Estrada, 2001).
This research will particularly focus in one of the principal elements of an ecological network: the biological corridors.
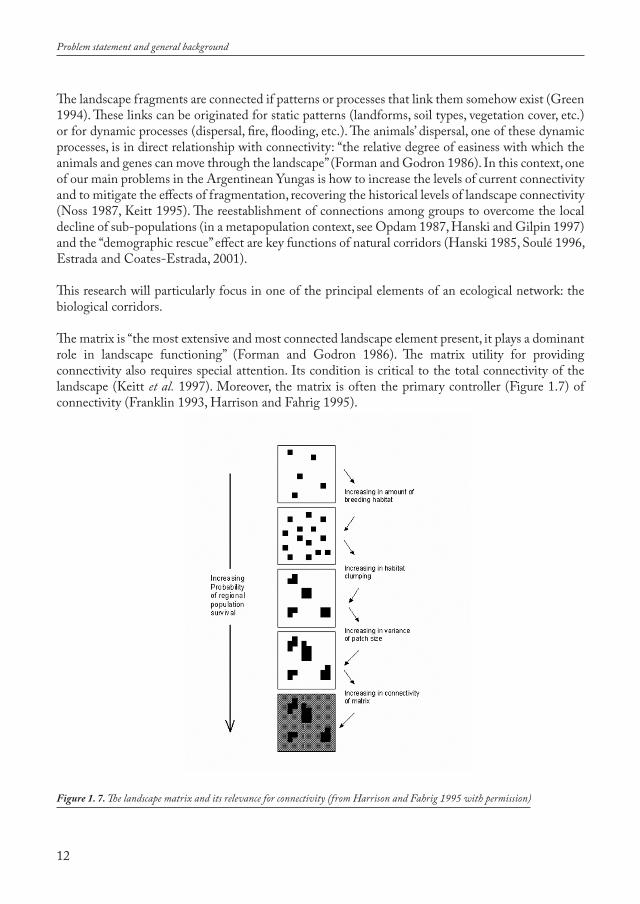
The matrix is “the most extensive and most connected landscape element present, it plays a dominant role in landscape functioning” (Forman and Godron 1986). The matrix utility for providing connectivity also requires special attention. Its condition is critical to the total connectivity of the landscape (Keitt et al. 1997). Moreover, the matrix is often the primary controller (Figure 1.7) of connectivity (Franklin 1993, Harrison and Fahrig 1995).
12
Problem statement and general background
Figure 1. 7. The landscape matrix and its relevance for connectivity (from Harrison and Fahrig 1995 with permission)
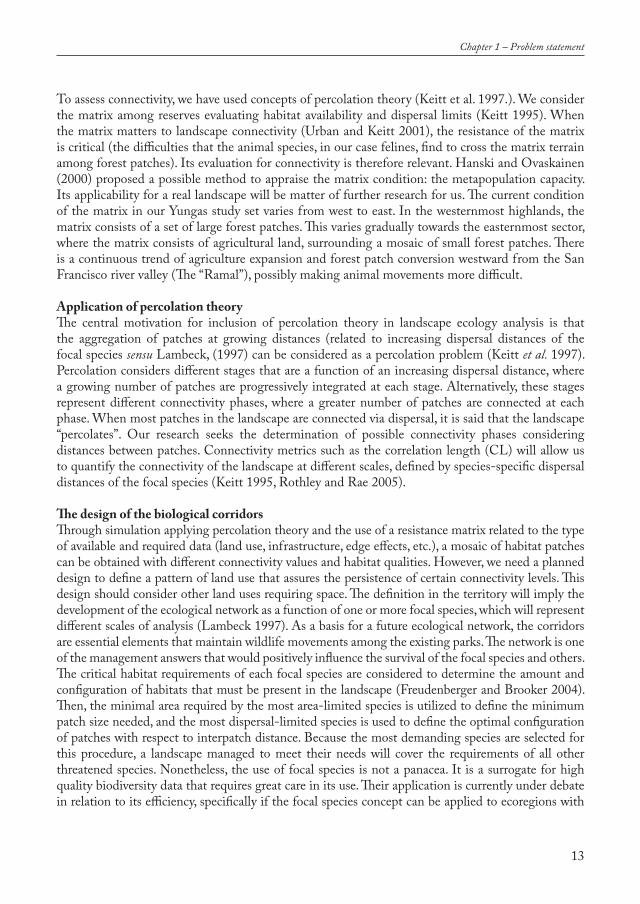
To assess connectivity, we have used concepts of percolation theory (Keitt et al. 1997.). We consider the matrix among reserves evaluating habitat availability and dispersal limits (Keitt 1995). When the matrix matters to landscape connectivity (Urban and Keitt 2001), the resistance of the matrix is critical (the difficulties that the animal species, in our case felines, find to cross the matrix terrain among forest patches). Its evaluation for connectivity is therefore relevant. Hanski and Ovaskainen (2000) proposed a possible method to appraise the matrix condition: the metapopulation capacity. Its applicability for a real landscape will be matter of further research for us. The current condition of the matrix in our Yungas study set varies from west to east. In the westernmost highlands, the matrix consists of a set of large forest patches. This varies gradually towards the easternmost sector, where the matrix consists of agricultural land, surrounding a mosaic of small forest patches. There is a continuous trend of agriculture expansion and forest patch conversion westward from the San Francisco river valley (The “Ramal”), possibly making animal movements more difficult.
Application of percolation theoryThe central motivation for inclusion of percolation theory in landscape ecology analysis is that the aggregation of patches at growing distances (related to increasing dispersal distances of the focal species sensu Lambeck, (1997) can be considered as a percolation problem (Keitt et al. 1997). Percolation considers different stages that are a function of an increasing dispersal distance, where a growing number of patches are progressively integrated at each stage. Alternatively, these stages represent different connectivity phases, where a greater number of patches are connected at each phase. When most patches in the landscape are connected via dispersal, it is said that the landscape “percolates”. Our research seeks the determination of possible connectivity phases considering distances between patches. Connectivity metrics such as the correlation length (CL) will allow us to quantify the connectivity of the landscape at different scales, defined by species-specific dispersal distances of the focal species (Keitt 1995, Rothley and Rae 2005).
The design of the biological corridorsThrough simulation applying percolation theory and the use of a resistance matrix related to the type of available and required data (land use, infrastructure, edge effects, etc.), a mosaic of habitat patches can be obtained with different connectivity values and habitat qualities. However, we need a planned design to define a pattern of land use that assures the persistence of certain connectivity levels. This design should consider other land uses requiring space. The definition in the territory will imply the development of the ecological network as a function of one or more focal species, which will represent different scales of analysis (Lambeck 1997). As a basis for a future ecological network, the corridors are essential elements that maintain wildlife movements among the existing parks. The network is one of the management answers that would positively influence the survival of the focal species and others. The critical habitat requirements of each focal species are considered to determine the amount and configuration of habitats that must be present in the landscape (Freudenberger and Brooker 2004). Then, the minimal area required by the most area-limited species is utilized to define the minimum patch size needed, and the most dispersal-limited species is used to define the optimal configuration of patches with respect to interpatch distance. Because the most demanding species are selected for this procedure, a landscape managed to meet their needs will cover the requirements of all other threatened species. Nonetheless, the use of focal species is not a panacea. It is a surrogate for high quality biodiversity data that requires great care in its use. Their application is currently under debate in relation to its efficiency, specifically if the focal species concept can be applied to ecoregions with
13
Chapter 1 – Problem statement

high environmental variation (Lindenmayer et al. 2002, Lambeck 2002, Lindenmayer and Fischer 2003, Freudenberger and Brooker 2004). In the Yungas setting, considering the relative homogeneity of the ecoregion, it seems acceptable to apply the focal species concept to perform the connectivity analysis, while attention is paid to the whole set of ecosystems (Yungas vegetation layers).
The focal species are those most sensitive to variation in different processes, not only to habitat fragmentation (e.g. sensitivity to pollution, border effects, etc.). This expanded focal species concept, as well as more extended species data sets considering other processes rather than only connectivity, demand much more information. They require more extensive knowledge and survey on species and natural processes of the target region. Occasionally, there is shortage of both funding and time to achieve a more comprehensive knowledge, and the decision about a regional connectivity plan in the Yungas is urgent. Therefore, our application of the focal species concept will be focused only in relation to landscape connectivity.
The corridors (and the future ecological network) constitute a possible conservation strategy to the fragmentation of the natural landscape. There are two well-known examples of ecological networks: the Natural Policies Plans in the Netherlands (LNV 1989, Hootsmans and Kampf 2004, Jongman and Pungetti 2004); and, the Florida Ecological Network in the southeastern USA (Harris and Scheck 1991, Hoctor et al. 2000, Hoctor et al. 2004). In Argentina, a corridors project was proposed for the northeast of the country. The national park Iguazú would be the axis of a spatial strategy that would also include key provincial reserves (Uruguaí, Puerto Península, and Yabotí are the most important) and the homonym national park of Brazil (national park do Iguaçu). Unfortunately, this plan did not consider the matrix of agricultural and forest ecosystems among the reserves. The design process only pertains to the priorities of nature conservation as a clear example of separatism - “ecological apartheid” (Main 1993, Keefe 1995, Saunders 2000). Instead, planning in nature conservation should regard the socio-political issues that influence the implementation, management and ecological effectiveness of the habitat linkages contained in the network (Bennett 1997, Wilshusen et al. 2002). The ecological networks are a combination of ecological, political, planning, land use and awareness components ( Jongman and Smith 2000).
We are managing a “real world” conservation dilemma: both the Yungas ecoregion and the jaguar population are currently highly threatened. Thus, it is considered a more complex problem than the usual theoretical analysis on reserve selection (Briers 2002). Our objective is to focus on the different Yungas ecosystems (the vegetation stratum) and their biodiversity and simultaneously evaluate the habitat connectivity needs of Jaguars (as our focal species and possibly other focal species at smaller scale: ocelot). Otherwise, we could possibly protect a high percentage of the region species, but, lose the “big cats”. With them, the Yungas ecoregion would lose the foremost predator with subsequent effects on ecosystem functions.
We propose a conservation action plan that combines three aspects: a) organization (the political and social support), b) a focus on ecosystems and habitat sites and c) actions oriented to protect threatened species ( Jongman and Smith 2000). We consider the need of designing for persistence and retention of pattern. It intends to buffer the long-term negative impacts on biodiversity from changes in the land use surrounding the reserves and to minimize habitat loss, prioritizing the areas with high irreplaceability and vulnerability (Cowling 1999). From this long term perspective the connectivity of individual sites is critical (Briers 2002).
Problem statement and general background
14

15


ABSTRACT
This chapter analyzed the landscape matrix condition among the parks. The deforestation process and its spatial determinants were evaluated. A spatially explicit quantitative analysis of the historical sequence of the deforestation for the period 1973 – 2000 is presented. In this period, 80.000 ha were deforested. This gives an actual measurement of the intensity of the conversion of the native forest to farmland (farmland area increased from 5.5 % to 11 % as percentage of the total region). Then, a conceptual model, to depict the principal driving forces interacting from global to local level is sketched. An accessibility analysis was performed to get a time travel regional evaluation of the markets influence areas. Furthermore, a logistic regression analysis allowed the identification of spatial determinants (as local proximate variables) of location of land use change. These variables (soil capability classes, accessibility and slope) were integrated by a GIS procedure that produced a LUCC probability spatial model. It has as principal purpose to predict location of future clearings. It is also presented an evaluation of the discriminatory ability of the logistic regression model applying the receiver operating characteristics test (ROC). The potential influence of new changes and their locations on the landscape connectivity and spatial configuration of habitat patches concerning the parks is discussed.
A modified version of this chapter have been submitted to Landscape and Urban Planning as: Somma, D.J., van Lier, H., Jongman, R. and Plant, R. Land use and cover change in the Yungas region.A previous version has been published as: Daniele, C., Somma, D., Aued, B., Bachmann, L., and Frassetto, A., 2002. Land Use Planning and Nature Conservation in the Northwest of Argentina: Evolution of the Landscape Fragmentation and its Consequences. In: Proceedings of 29th International Symposium on Remote Sensing of Environment “Information for Sus-tainability and Development” (Paper Reference 8.71). Buenos Aires, Argentina.
CHAPTER 2Land use and cover change in the Yungas region
17

CONTENTSINTRODUCTION 19
MATERIALS AND METHODS 19 The Conceptual Model 20 Spatial data compilation 24 The Zoning scheme 24 Remote sensing, GIS and statistical analysis 27 Remote sensing 27 GIS: accessibility analysis 27 Statistical analysis 30
RESULTS 32 Analysis of LUCC during period 1973 - 2000 32 Accessibility analysis 37 Statistical analysis 39 Mantel test 39 Logistic Regression Analysis 39 Model Information 39
DISCUSSION AND CONCLUSIONS 42
FIGURESFigure 2. 1. Conceptual model of LUCC in the study area 23Figure 2. 2. Study area and the Ecological - Administrative Zones (EAZs) 25Figure 2. 3. Accessibility analysis 29Figure 2. 4. The LUCC process in the Yungas (1973 - 1986 - 1997 - 2000) 33Figure 2. 5. Habitat availability and agriculture changes in the Yungas by EAZ (1973 - 2000) 34Figure 2. 6. Availability of crop lands and soil classes not converted by 2000 in the region -a- and distribution in the EAZs referred to the total regional (Class II) -b- 36Figure 2. 7. Agricultural areas (2000) and potential new conversions 37Figure 2. 8. Travel time to markets, parks and populated places 38Figure 2. 9. LUCC regression function by EAZ 41Figure 2. 10. ROC curve for the logistic regression analysis 42
TABLESTable 2. 1. Ecological - Administrative Zones (EAZs) 26Table 2. 2. Relative speed of surface elements 28Table 2. 3. GIS database 30Table 2. 4. Land use change for the period 1973 - 2000 32Table 2. 5. Evolution of the number of patches by land use class (1973 - 2000) 32Table 2. 6. Evolution of land use classes (%) by EAZ (1973 - 2000) 34Table 2. 7. EAZs: attractors, precursors and possibilities of expansion 35Table 2. 8. Mantel test of the LUCC sample points coverage 39Table 2. 9. AIC analysis of the LUCC logistic regression model 39Table 2. 10. Global null hypothesis tests of the Beta coefficients (a) and residual test (b) 40Table 2. 11. Regression analysis of the selected explanatory variables 40Table 2. 12. Wald confidence limits for parameters (a) and for adjusted odds ratios (b) 40
18
Land Use and cover change in the Yungas region

INTRODUCTION
The Yungas is one of Argentina’s most important regions in terms of the biodiversity it supports. Two major assets of the region, agricultural productivity and oil and natural gas reserves, are also threats to the integrity of its ecosystems. Thus, in recent years the region has suffered increasing rates of deforestation to open agricultural areas (Burkart 1994a. Daniele et al. 2001, Brown et al. 2002, Somma et al. 2004, Volante et al. 2005). The development of facilities for exploration and utilization of energy resources, including new roads crossing large forest remnants, contribute to increased forest fragmentation.
The objective in this chapter is to analyze the process of land use and cover change (LUCC) in the region and its spatial determinants (Veldkamp and Lambin 2001). We also want to precisely establish the temporal and spatial variations of native forest conversion, and its dimensions.This analysis will serve as a basis for land use planning for nature conservation, and sustainable management of natural resources, as discussed in Chapter 1. Throughout this planning process, we will strive to maintain continuity of natural processes and connections among native forest patches. It is essential to locate and select key patches that allow the maintenance of connectivity among habitat sites, and particularly, between the Parks whose principal purpose is biodiversity and cultural heritage conservation and watershed protection (National Parks Baritu and Calilegua and Provincial Park Pintascayo Lagoon, from here we refer them as Parks). This research will focus on this essential goal in the next two chapters.
In this chapter, it is considered relevant:
a) To develop a conceptual model to help identify the main driving forces determining the conversion of Yungas native forest and land use change at the global, national, regional and local scales.b) To identify where the conversion process (LUCC) was more intense in the last three decades.c) To perform a prognosis of future changes and principally, where these changes can threaten the biological connectivity between the Parks.
MATERIALS AND METHODS
To carry out the three relevant aspects referred to before we structured our methodological approach in four steps:1- A conceptual model based on a holistic view that integrated ecological, economical and socio-political aspects at five different scales from previous research. It allowed us to understand the characteristics of the decision making process operating at a regional level.2- Spatial data compilation: diverse sources of remote sensing and GIS data were analyzed and adjusted so that these could be analyzed jointly.3- A zoning scheme: this scheme allowed us to disaggregate locally the LUCC regional process and to evaluate the differences in intensity.4- A combination of remote sensing, GIS and statistical analysis allowed us to assess the principal spatial determinants (proximate, local variables) of the LUCC process.
Considering the current trends in LUCC analysis, our research is based on an inductive pattern-
19
Chapter 2 - Land Use and cover change
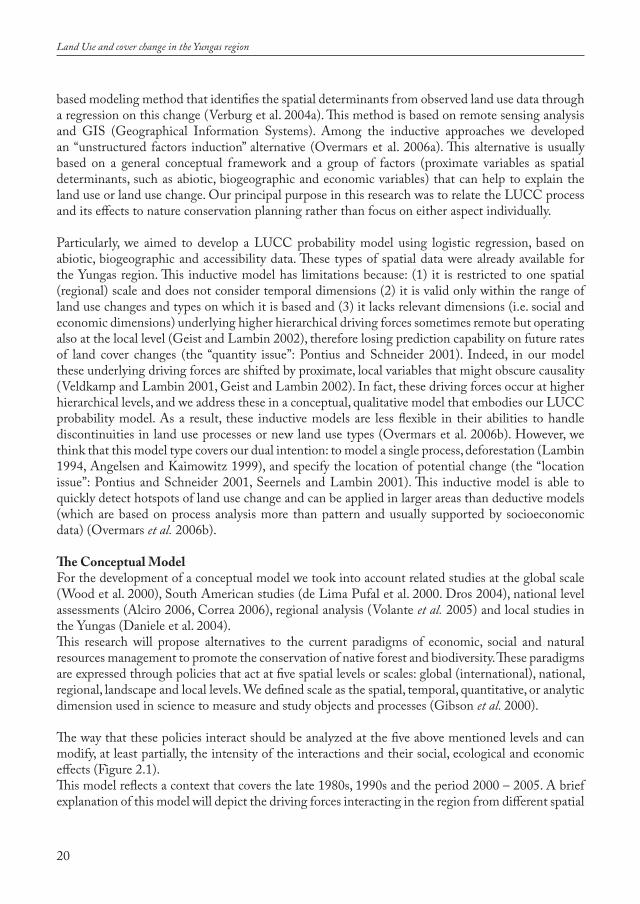
based modeling method that identifies the spatial determinants from observed land use data through a regression on this change (Verburg et al. 2004a). This method is based on remote sensing analysis and GIS (Geographical Information Systems). Among the inductive approaches we developed an “unstructured factors induction” alternative (Overmars et al. 2006a). This alternative is usually based on a general conceptual framework and a group of factors (proximate variables as spatial determinants, such as abiotic, biogeographic and economic variables) that can help to explain the land use or land use change. Our principal purpose in this research was to relate the LUCC process and its effects to nature conservation planning rather than focus on either aspect individually.
Particularly, we aimed to develop a LUCC probability model using logistic regression, based on abiotic, biogeographic and accessibility data. These types of spatial data were already available for the Yungas region. This inductive model has limitations because: (1) it is restricted to one spatial (regional) scale and does not consider temporal dimensions (2) it is valid only within the range of land use changes and types on which it is based and (3) it lacks relevant dimensions (i.e. social and economic dimensions) underlying higher hierarchical driving forces sometimes remote but operating also at the local level (Geist and Lambin 2002), therefore losing prediction capability on future rates of land cover changes (the “quantity issue”: Pontius and Schneider 2001). Indeed, in our model these underlying driving forces are shifted by proximate, local variables that might obscure causality (Veldkamp and Lambin 2001, Geist and Lambin 2002). In fact, these driving forces occur at higher hierarchical levels, and we address these in a conceptual, qualitative model that embodies our LUCC probability model. As a result, these inductive models are less flexible in their abilities to handle discontinuities in land use processes or new land use types (Overmars et al. 2006b). However, we think that this model type covers our dual intention: to model a single process, deforestation (Lambin 1994, Angelsen and Kaimowitz 1999), and specify the location of potential change (the “location issue”: Pontius and Schneider 2001, Seernels and Lambin 2001). This inductive model is able to quickly detect hotspots of land use change and can be applied in larger areas than deductive models (which are based on process analysis more than pattern and usually supported by socioeconomic data) (Overmars et al. 2006b).
The Conceptual ModelFor the development of a conceptual model we took into account related studies at the global scale (Wood et al. 2000), South American studies (de Lima Pufal et al. 2000. Dros 2004), national level assessments (Alciro 2006, Correa 2006), regional analysis (Volante et al. 2005) and local studies in the Yungas (Daniele et al. 2004).This research will propose alternatives to the current paradigms of economic, social and natural resources management to promote the conservation of native forest and biodiversity. These paradigms are expressed through policies that act at five spatial levels or scales: global (international), national, regional, landscape and local levels. We defined scale as the spatial, temporal, quantitative, or analytic dimension used in science to measure and study objects and processes (Gibson et al. 2000).
The way that these policies interact should be analyzed at the five above mentioned levels and can modify, at least partially, the intensity of the interactions and their social, ecological and economic effects (Figure 2.1).This model reflects a context that covers the late 1980s, 1990s and the period 2000 – 2005. A brief explanation of this model will depict the driving forces interacting in the region from different spatial
20
Land Use and cover change in the Yungas region

hierarchies (global, national, regional and local: Hoshino 2001). Driving forces are those that cause observed landscape changes (Bürgi et al. 2004). Five major types of driving forces were identified: socioeconomic, political, technological, natural, and cultural (Brandt et al. 1999). We also applied two concepts related with driving forces: attractors and precursors of landscape change. An attractor of change is a site characteristic which attracts a driving force likely to induce change. There are two groups of attractors: site conditions, and adjacency or neighborhood relationships. Precursors are factors that can trigger landscape change: improvement of accessibility, subsidy policies, or technical innovations (Bürgi et al. 2004).
At a global level the market economy, globalization of information, financial and commercial flows and the effects of the WTO (World Trade Organization) agreements are especially strong drivers. These driving forces are interacting with national and local factors in the Yungas region. But, the influence from these global forces are mostly out of control from physical planners acting at the national and regional levels: the condition of the international sugar market, the external debt, international agricultural markets and globalization itself are imposing very strong constraints on the national economy. Moreover, the liberal policies applied in Argentina during the nineties have left the federal government with fewer regulation tools in comparison with the seventies (Tanner 2003).
Another important global driving force is the soybean crop. It is currently referred to as a key global commodity. Influenced by population growth and increase in per capita income (mainly in Asia), global demand for soybean is expected to rise to 300 million tons by 2020 (soybean world use in 2004 was 205 million tons -USDA 2006- ). In relation with a continuing production growth, Argentina and Brazil have progressively increased market shares. Brazil displaced USA as the world’s biggest soybean exporter in 2003, when it reached a 31% market share. USA and Argentina have shares of 29% and 28% respectively (Alciro 2006, Correa 2006). In the recent past, Argentina supplied half of European soybean meal imports. Because of the change to genetically modified crops (up to 98% of the Argentinean soybean is genetically modified -GM-), exportation to Europe practically ceased. In 2003, almost all of Argentina’s soybean exports were re-oriented to Asian markets. (Dros 2004).The current area under soybean will not be sufficient to meet its increasing demand. Therefore, additional farmland will be necessary to accommodate soybean production. Globally, areas for a considerable expansion of farmland are only available in Sub-Saharan Africa and South America. Specifically, these new areas are located in Angola, Argentina, Bolivia, Brazil, Colombia, Congo and Sudan. Thirty percent of this ‘global farmland reserve’ is forest. Since available land is getting insufficient in Asia and Europe, soybean planted areas are expected to decline or remain stable in these regions (Dros 2004).Cheap land, favorable climate and soil, infrastructure (transport networks, seaports) and finance could favor the expansion of soybean in Argentina and other South American countries at the expense of ecologically fragile natural areas (Steininger et al. 2001, Correa 2006).
At the national level, there are contradictory situations when we analyze government interventions: public institutional capabilities related with land use planning and natural resources stewardship (at national and provincial level) became very weak and unsystematic after the 1990s. This derived in different expressions of natural resource degradation (Hall et al. 2001). On the other hand, state regulations permit (without any temporal interruption from the seventies) the survival of sugarcane
21
Chapter 2 - Land Use and cover change
corporations by an externally protected national market. This situation has a major explanation: the lobbying capability of the sugarcane corporations is a strong political driving force at national and regional level.
The recent expansion of soybean acreage in Argentina relates to favorable international prices and cost-reducing technology including no tillage, glyphosate herbicide and genetically modified soybean. Nearly 60 % of argentine soybean crops are under this production system. The social and environmental impacts of these practices are largely unknown (Hall et al. 2001). The concentration and availability of capital, even where soybean is not the most suitable crop from an ecological or food security perspective, are factors reinforcing the conversion process.
At the regional level, farmland demand for soybean production has promoted extreme land use decisions by the local authorities: Salta provincial government disaffected the previously protected Pizarro nature reserve (Department of Anta, Yungas-Chaco ecotone, southeast of the study area), and sold this land in public offer. Also at this level, sugarcane and soybean corporations are lobbying to shape transport networks and land use policies to transform the Yungas into mechanized agriculture wherever this is possible. Moreover, at this regional level, the oil and gas industry is another important driving force: it promotes the opening of new roads and also small forest clearings. However, its effects are a minor impact compared with the forest deforestation process to enlarge agricultural areas. Therefore, we will not consider their effects in this research.
At the local scale, we distinguish contrasting types of exploitations ranging from capital-intensive, large corporations to small subsistence farms. Sugarcane corporations are diversifying their crops progressively incorporating tropical fruits and improving their commercial chain in citrus. Cash crops (soybean principally but also tobacco) are the most important factors in medium size farms related with extra-regional investors, chiefly soybean trader corporations. These corporations are the strongest factor in the deforestation process of Piedmont Forest (“Selva Pedemontana”) (Brown and Grau 1999. Daniele et al. 2004).
Small farms located around small towns like Santa Rosa, Yuto, Caimancito, and El Talar, are aggregated in spatially unified sets of small rural units or “colonies”. These keep a diversified production structure including vegetables, banana, tobacco, etc. Two Kolla indigenous communities practice subsistence agriculture plus extensive cattle ranching in 260,000 ha at Finca Santiago and Tinkunaku -Finca San Andres- (Brown and Grau 1999). The farming approach of Colonies and Kollas aims at achieving high food security; hence the value attributed by Kollas to their forests. A World Bank agriculture development project in Finca Santiago is currently challenging the Kolla community and the technical staff about sustainable ecological, economical and social answers.
Concerning land tenure, private ownership is the norm except for the national parks and the community territories. The Finca Santiago Kolla Community has full legal rights to its land, but the Tinkunaku Kolla Community is struggling for their territory in the provincial court. Nature conservation plans need to be sensitive to the differential impacts (Figure 2.1) determined by the different types of ownership and how these impacts are spatially distributed across the region (Ortega Huerta and Medley 1999).
22
Land Use and cover change in the Yungas region

23
Chapter 2 - Land Use and cover change
Figure 2. 1. Conceptual model of LUCC in the study area.
The width of the arrows indicates the intensity of influence.Dotted line arrows imply lesser influence

Spatial data compilationThe temporal evolution of land use in the region was evaluated with historical land use maps (OEA - Comisión Regional del Bermejo 1973, scale 1: 250.000), historical aerial photographs (Secretaría de Minería de la Nación -National Mining Secretariat- 1973, scale 1: 60.000) and Landsat TM satellite images (1986, 1997 and 2000). Satellite images were analyzed with platforms like Erdas Imagine®, and geographic analysis was performed using Arc/Info®, Arc-View®, and Arc GIS®.
The digital background had integrated coverages for rivers, roads, contour lines and towns at the 1:100.000 and 1:250.000 scales, provided by the Military Geographical Institute (Instituto Geográfico Militar IGM). Regional soil and land capability classes (sensu Klingebiel and Montgomery 1966), rainfall isolines and an additional evaluation of land use (2000) at the 1:250.000 scale were provided by the Bermejo River Strategic Action Plan -SAP- (OAS 2000). The Yungas Biosphere Zoning Project (“Zonificación de la Reserva de la Biosfera de las Yungas”) provided limits for Kolla territories, a vegetation map and a 2002 land use evaluation at the 1:250.000 scale (SEMADES unpublished data). The location of some villages in the region, an update of the road network system, and the digital elevation model (DEM) were developed by our team.
The Zoning schemeLand use and land cover change (LUCC) is a complex and multi-causal process with singular characteristics if it is related to tropical deforestation (Walker 2004). To establish a zoning that accounts for this multi-causal quality using proximate variables (accessibility, soil classes, topographic attributes: Veldkamp and Lambin 2001) it is appropriate to combine aspects of political and administrative decisions. These decisions can imply a relative homogeneity of policies at the major district scale with aspects that define a relative ecological and biogeographic homogeneity. At this scale, we distinguish two Argentine provinces, Salta and Jujuy, and Tarija Department in Bolivia. In this way, we integrate zones with a relative homogeneity of natural resources, productive capabilities and markets access. We are considering only the sectors of the departments that are inside the study area, not the whole departments’ district. Then, we define a set of zones called Ecological - Administrative Zones (EAZs: Table 2.1 and Figure 2.2). There, the Argentine national routes 34 and 50, Argentine railway General Belgrano and Bolivian national route 1 form the primary transport axis. These routes are connecting the study area with regional centers as Tarija (Bolivia) in the north and Jujuy city and Salta city in the south. The South transport flow connects with the principal Argentine seaports (Rosario and Buenos Aires).
24
Land Use and cover change in the Yungas region
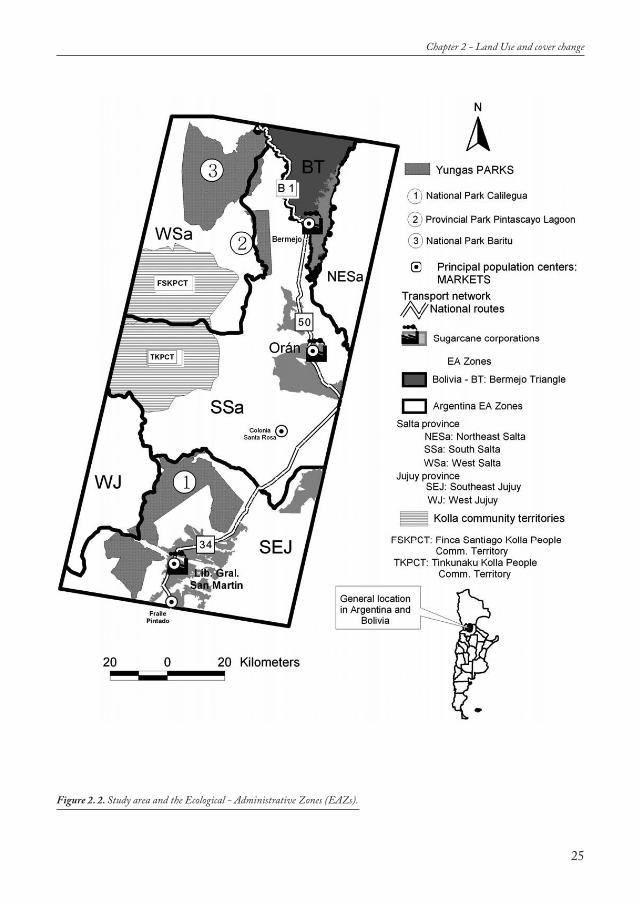
25
Chapter 2 - Land Use and cover change
Figure 2. 2. Study area and the Ecological - Administrative Zones (EAZs).

26
Land Use and cover change in the Yungas region
EcologicalAdministrative Zone (EAZ)
PRINCIPAL ACTORS (if these exist)
Bermejo Triangle(BT)
SUGARCANECORPORATION
West Salta(WSa)
KOLLAS TERRITORIES
Northeast Salta (NESa)
South Salta(SSa)
SUGARCANEFRUITINDUSTRIALCORPORATION
FRUITCORPORATIONS
SOYBEAN
“Colonies”
KOLLAS TERRITORIES
Southeast Jujuy (SEJ)SUGARCANEFRUITINDUSTRIALPAPERCORPORATION
West Jujuy (WJ)
Departments(Argentina)
Province (Bolivia)
TotalPopulationDensity
Arce (Bolivia)
34.000 inhab. (83 % urban)
Santa Victoria - Iruya
2.000 inhab. (100 % rural) 1.7 inh./ km2
General San Martín
400 inhab. (100 % rural) 0.53 inh./ km2
Oran
100.000inhab.(80 % urban) 8.5 inh./km2
Ledesma - SantaBarbara
70.000 inhab. (94 % urban) 21.2 inh./km2
Valle Grande - Tilcara
2.000 inhab. (100 % rural) 2.1 inh./km2
DominantYungasvegetation strata
Dry Chaco TransitionPiedmontForestMontaneSubtropicalForest
MontaneSubtropicalForest Montane Forest
Dry Chaco Transition - PiedmontForestMontaneSubtropicalForest PiedmontForest Montane SubtropicalForest
PiedmontForestMontaneSubtropicalForest TemperateMontane Forest Sierran Chaco MontaneSubtropicalForest TemperateMontane Forest Sierran Chaco
%of
study area
Extent (ha)
Farm-lands
(% of
eachEAZ)
TARIJA Department - Bolivia 5 % 72.040 75
SALTA Province - Argentina 20% 269.889 15
8 % 112.963 17
35 % 483.527 44
JUJUY Province – Argentina25 % 338.132 41
7 % 102.417 7
Topography
Flat and hilly
Flat and hilly
Flat
Flat andhilly
Flatandhilly
mountainous
Accessi-bility
high
moderate
Difficult
high
high
Difficult
TotalLength
ofRoads
TotalLength
ofpavedRoads
Km
266.86
55.69
95.72
NOPAVED
84.16
NOPAVED
871.33
129.42
762.64
146.12
143.50
NOPAVED
Distanceto
Center
= center
far
far
= center
= center
far
Table 2. 1. Ecological - Administrative Zones (EAZs).

These zones are also related from the perspective that the district political authorities have about the provincial territories (Varela 2001).Tarija Department in Bolivia as well as Salta and Jujuy provincial planners have defined a zoning scheme that is followed here because it has a relationship with: department divisions (called Provinces in Bolivia), the existing transport network and, the availability of natural resources, principally crop lands. The concept of local development poles based around small to middle size towns that have the role of service centers for farm and oil-gas production activities is applied in the region (Varela 2001). EAZs were used as the more detailed scale where, by zooming in on the LUCC process, it was possible to analyze the land use changes with more detail. At the EAZ scale it was also possible to find some answers to the main spatial determinants of land use change. To focus on each EAZ instead of the whole study area allowed us to disaggregate specific determinants of conversion that are operating (or not) locally.
Remote sensing, GIS and statistical analysisRemote sensingThe period analyzed comprised nearly thirty years and four time windows: 1973 was covered by an historical map based on aerial photo interpretation; 1986, 1997 and 2000 were based on Landsat TM satellite images. This allowed us to explore the evolution of the LUCC and habitat availability (Parks and native forest). We used the Land Capability Classification of the USDA (Klingebiel and Montgomery 1966) because it is very well known in the natural resources research community. The contrast of satellite images (Images Landsat TM 231/076 from years 1986, 1997 and 2000 provided by CONAE -Comisión Nacional de Actividades Espaciales-) was improved to analyze textures, shapes and spectral signatures. Through this analysis we produced the differentiation of land use classes of the region by visual interpretation and an unsupervised classification of the images. Interviews with regional experts and meetings with community leaders were carried out to gather additional information.Field checking allowed us to confirm the initial land use classification. The overall classification accuracy was evaluated using an independent sample of 149 observations from the field. The accuracy for the classification was 85 %.
GIS: accessibility analysisTransportation is a critical function for an economy as it affects the barriers to social facilities. It contributes to the economic movement of people, goods and services, and development. To reflect the current transportation condition of the Yungas we performed an accessibility analysis. We applied the common definition of accessibility: the ability for interaction or contact with sites of economic or social opportunity (Deichmann 1997a, Deichmann 1997b, Deichmann and Bigman 2000). This is as an application founded on von Thünen analysis of marginal productivity (Walker 2004). In this research, the selection of destinations and transport means were based on the current land use of the area and the actual opportunities that the regional actors have to make best use of the Yungas transport network (Verburg et al. 2004b).A travel-time to markets analysis was performed using the Accessibility extension for Arc View 3.x (Farrow and Nelson 2001). Market centers are important destinations for most agricultural practices: for buying inputs such as seeds, fertilizer, spare parts, and food, for selling agricultural products and banking transactions, for major medical assistance and also to access communications with the principal cities. The Accessibility extension for Arc View produces a friction surface considering the so called “friction values” of the input layers: roads, rivers, slope, land use, and urban areas as the targets to access (markets), and a possible barrier theme. It reflects the easiness for movement on the different surfaces. Differential speeds are assigned to each “surface” (Table 2.2). With these elements
27
Chapter 2 - Land Use and cover change

and through a reclassification routine using the cost-distance function (from the GRID module of Arc Info), Accessibility produces three outputs: an allocation grid (indicating the catchment’s area of each target: markets in our case), a direction (indicating the direction of travel through each cell) and the main output: time to market. This grid indicates the cost of travel from each cell to the nearest target. We incorporated all the possible input themes that the routine of Accessibility allows, except a barrier theme.In our case, we expressed accessibility as the time taken to reach these particular locations: the regional markets or market centers (Farrow and Nelson 2001, Walker 2004). We consider the following causal factors of rural accessibility in the Yungas: slope, rivers, roads and land use in the year 2000 (Figure 2.3). The accessibility extension works by making a reclassification of these digital coverages and produces three outputs: cost direction, cost allocation zones and travel time. We perform an analysis that considers only the dry season. During the wet season -5 months- the strong rains determine that the widest and deepest rivers act as total barriers (some of the areas are inaccessible for 4 - 8 days till a short dry period, and after a rain the location is again inaccessible; this occurs principally in Tinkunaku and Finca Santiago Kolla territories).
We defined (considering the reference values given by Farrow and Nelson) these values adjusted to the Yungas context:
The very low value assigned to the principal rivers indicates that these land features are very difficult to cross in the dry season as well because the crossing surface is very sinuous and stony. The buses, trucks and pick ups must cross these areas very slowly to avoid damages.Then, we confirmed the calculated time trip values with actual time values from the field (buses, trucks and national parks vehicles are permanently moving across the region and the time trip values are very well known). With some iterations and adjustments we successively refined the estimates until they approached time distances calculated in the field.Accessibility was considered indeed a key factor to evaluate the LUCC process (Farrow and Nelson 2001, Menon 2001, Geist and Lambin 2002). Five cities were considered as market centers (Figure 2.2) in our analysis: Bermejo (28.000 inhabitants), Oran (73.000 inhab.), Colonia Santa Rosa
28
Land Use and cover change in the Yungas region
Surface elements speed (km/h)
Transport network
principal paved roads (national routes) 90
secondary paved roads 70
maintained unpaved roads 60
trails 40
Rivers (dry season)
creeks 50
principal rivers 2
Land use
Urban areas 9
Agriculture 30
Native forest (it includes the core areas) 2
Table 2. 2. Relative speed of surface elements.
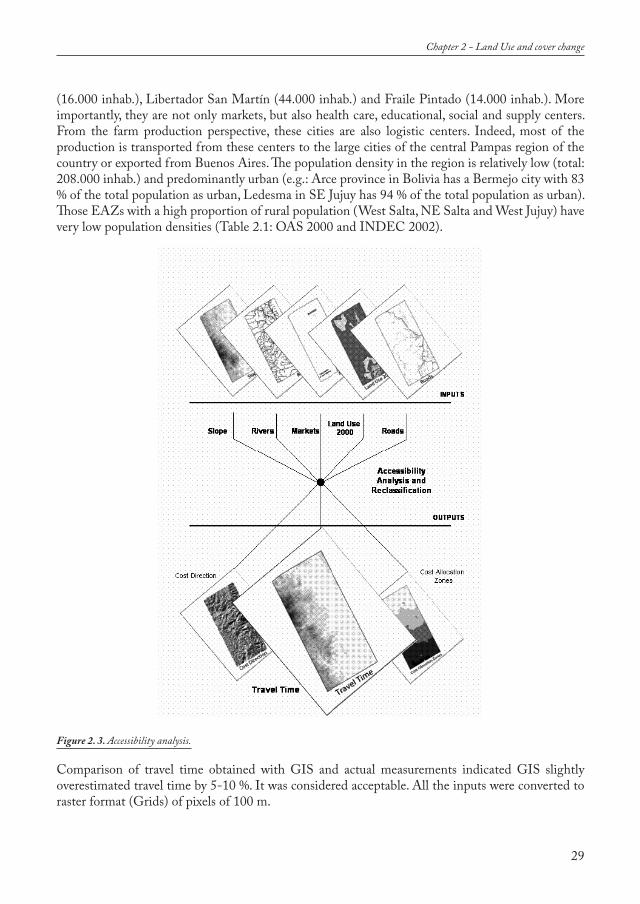
(16.000 inhab.), Libertador San Martín (44.000 inhab.) and Fraile Pintado (14.000 inhab.). More importantly, they are not only markets, but also health care, educational, social and supply centers. From the farm production perspective, these cities are also logistic centers. Indeed, most of the production is transported from these centers to the large cities of the central Pampas region of the country or exported from Buenos Aires. The population density in the region is relatively low (total: 208.000 inhab.) and predominantly urban (e.g.: Arce province in Bolivia has a Bermejo city with 83 % of the total population as urban, Ledesma in SE Jujuy has 94 % of the total population as urban). Those EAZs with a high proportion of rural population (West Salta, NE Salta and West Jujuy) have very low population densities (Table 2.1: OAS 2000 and INDEC 2002).
Comparison of travel time obtained with GIS and actual measurements indicated GIS slightly overestimated travel time by 5-10 %. It was considered acceptable. All the inputs were converted to raster format (Grids) of pixels of 100 m.
29
Chapter 2 - Land Use and cover change
Figure 2. 3. Accessibility analysis.

Statistical analysisWe wanted to develop a quantitative assessment of land use change aspects already described. Our purpose was to evaluate which factors could be more relevant as spatial determinants of deforestation in the LUCC process up to the year 2000. For this analysis we again considered the region as a whole because of the numerous interactions that exist between the different EAZs and the knowledge of the transport network that integrates all the EAZs. A multiple logistic regression analysis was used to explore the association between the key response variable, land use change, and some potential explanatory variables (Seernels and Lambin 2001, Verburg et al. 2004b, Verburg and Veldkamp 2004). The goal was to obtain a probability model capable of explaining the location of conversion (deforestation) and predicting new clearings. As proxy independent variables we included: soils (ordinal discrete land use capability classes), topography (continuous slope grid), accessibility (travel time: continuous distance grid to markets), distance to rivers (a continuous grid obtained through an Arc View distance function) and rainfall (TIN interpolation from isolines, then converted to a 100 m pixel size grid). Explanatory variable selection was based on literature (Veldkamp and Lambin 2001, Seernels and Lambin 2001, Farrow and Nelson 2001, Menon et al. 2001, Muller and Zeller 2002, Walker 2004, Overmars and Verburg 2005) and expert knowledge. Concerning the soil classes (Klingebiel and Montgomery 1966), the original sequence was inverted: thus, the better classes have higher values in a scale of 6 possible soil classes in the Yungas (from 2 to 6). As mentioned before, land use change in the region has been driven by mechanized agriculture. Variables related to population density were not included because we did not have reliable information on number of inhabitants of the smaller towns and villages.
Logistic regression evaluates the functional relationship (equation 1) between a binomial dependent variable (change or no change) and one or multiple independent variables (Vi), which may be discrete or continuous in their distribution (Trexler and Travis, 1993).
In the regression function a is the intercept and ßi the regression coefficients of the explanatory variables and P the probability of finding a land use change.
30
Land Use and cover change in the Yungas region
Table 2. 3. GIS database.
Variable Type Unit scale source
Dependent variable Change binary 0 - 1 1:250.000 (100 m pixel size grid) (own , OAS 2000)
Independent variablesSoils Ordinal discrete II - VI 1:250.000 PEA-OAS 2000Slope (Topography) Continuous Degree 1:100.000 IGM 1997 Travel time (Accessibility) Continuous Hours 1:100.000 (100 m pixel size grid) own developmentDistance to rivers Continuous hm 1:100.000 IGM 1997 Rainfall Continuous mm 1:250.000 (100 m pixel size grid) PEA - OAS 2000

The analysis involved a random sample of 400 points (200 in each class: change and no change, i.e. forest persistence versus deforestation) from the entire study region under investigation, contrasting land use between 1973 and 2000. Points were obtained using the Random Point Generator 1.3 ( Jenness 2005) for Arc View, with a minimum distance 500 m between points.
The Mantel Test was used to assess a potential spatial autocorrelation among points of the response variable (LUCC). The Mantel Test evaluates the null hypothesis of no relation between two similarity or dissimilarity matrices (Urban 2003). We obtained a similarity matrix for observation points and another for the geographical location of the points. The similarity among observation points can be measured as the similarity among points in a one-dimensional presence-absence space. Thus, in the matrix, pairs of points where cover change occurred have a similarity of 1 or 100% similarity, and pairs of points where in one case, change occurred and in the other it did not, would have 0% similarity. The second matrix was constructed from the geographical location of points; thus, points closer together in the bidimensional space have greater similarity. Both distance measures, for the first and the second matrix, were Euclidean (Pythagorean).To check for possible multicollinearity effects among predictive variables in each set we used the point-product (Pearson) coefficient of correlation. The presence of positive spatial autocorrelation in model residuals (spatial dependency) tends to increase the likelihood of type I error (Betts et al. 2006). To assess model goodness of fit, a test for the global null hypothesis (beta coefficients of the explanatory variables -ßi- = 0) was performed. We also used the Akaike information criterion (AIC) to choose the best-fitting model from the set of candidate models (Burnham and Anderson 1998). The AIC belongs to a family of model selection criterions that have the virtue of considering the fit as well as the complexity of the model, and permits comparison of several models at the same time ( Johnson and Omland 2004).
Once the LUCC probability model was constructed, we generated a map of probability of change based on our regression analysis function and we calculated it using the Raster map calculator syntaxes in Arc GIS.We used the Receiver Operating Characteristic (ROC) curve as an independent measure of model accuracy (Guisan and Zimmerman 2000, Pearce and Ferrier 2000, Pontius and Schneider 2001, Verburg et al. 2004b). An ROC curve was obtained by plotting the true positive proportion of correctly predicted occurrences (sensitivity) on the y axis against the false positive proportion of correctly predicted absences (1 - specificity) on the x axis. The area under the ROC curve (AUC) was used to test a greater significance than the area under a random model, with AUC crit.= 0.5, i.e., the chance performance of a model lies on the positive diagonal in the ROC graph (Schadt et al. 2002). An AUC value between 0.7 and 0.9 indicates a reasonable discriminatory ability of the model (Pearce and Ferrier 2000). We applied the public domain software ROC Plotting (Schröder 2004) to obtain the graph.
31
Chapter 2 - Land Use and cover change

RESULTS
Analysis of LUCC during period 1973 - 2000Regionally, the land area devoted to agriculture doubled during the period analyzed (Table 2.4 and Figure 2.4). In this context, parks and native forest were considered together as a continuum of wildlife habitat.
LUCC was also evaluated by a landscape ecology metric (Number of Patches: NP) to get a picture about the evolution of the fragmentation process in a regional approach. A growing fragmentation originated by the expansion of agricultural areas was evident (Table 2.5, Figures 2.4 and 2.5). It affected the integrity of the Yungas forest increasing the number of native forest patches. However, the creation of the parks (Baritu: 1974, Calilegua: 1979 and Pintascayo: 2000) partially compensated the conversion process in relation to wildlife habitat availability and quality.
Particularly, the increase in the number of patches (negatively related to total patch area: see Table 2.4) is depicting a condition related to a growing and early stage in the fragmentation process (McGarigal and Marks 1995). The increase in percentage of farmland class in a regional approach refers to a regional trend (Figure 2.4).
32
Land Use and cover change in the Yungas region
1973 1986 1997 2000
Land Use Class ha % ha % ha % ha %
Farmland 75237 5.5 121631 8.8 145145 10.5 155611 11.3
Parks
Not existing
Not existing 149682 10.8 149682 10.8 160257 11.6
Native forest 1300518 94.3 1104149 80.1 1080556 78.4 1059251 76.8
Urban Areas 3213 0.2 3506 0.3 3585 0.3 3849 0.3
Total 1378968 100 1378968 100 1378968 100 1378968 100
Table 2. 4. Land use change for the period 1973 - 2000.
Number of Patches Land use class
Farmland
Parks
Native forest
Urban areas
Total
1973
67Not created at
that time
3
27
97
1986
274
3
18
27
322
1997
360
3
22
27
412
2000
423
4
31
26
484
Table 2. 5. Evolution of the number of patches by land use class (1973 - 2000).
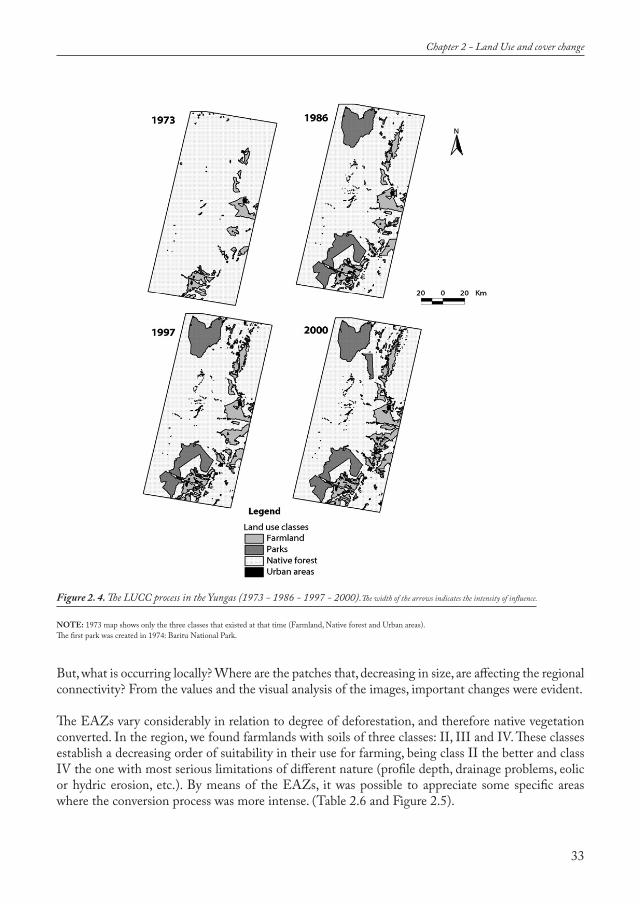
But, what is occurring locally? Where are the patches that, decreasing in size, are affecting the regional connectivity? From the values and the visual analysis of the images, important changes were evident.
The EAZs vary considerably in relation to degree of deforestation, and therefore native vegetation converted. In the region, we found farmlands with soils of three classes: II, III and IV. These classes establish a decreasing order of suitability in their use for farming, being class II the better and class IV the one with most serious limitations of different nature (profile depth, drainage problems, eolic or hydric erosion, etc.). By means of the EAZs, it was possible to appreciate some specific areas where the conversion process was more intense. (Table 2.6 and Figure 2.5).
33
Chapter 2 - Land Use and cover change
Figure 2. 4. The LUCC process in the Yungas (1973 - 1986 - 1997 - 2000).The width of the arrows indicates the intensity of influence.
NOTE: 1973 map shows only the three classes that existed at that time (Farmland, Native forest and Urban areas).The first park was created in 1974: Baritu National Park.

We can synthesize this diagnosis by combining the analysis of attractors and precursors of landscape change (Table 2.7) in the current regional conditions (2005-06) of infrastructure and investments:
34
Land Use and cover change in the Yungas region
LU class * Ecological Administrative Zone (% of area)
CLASS
Farmland
Parks
Native forest
BERMEJOTRIANGLE
1973 2000
5 24
- -
94 76
W SALTA
1973 2000
- 0.4
- 26
100 73.6
NE SALTA
1973 2000
- 1
- -
100 99
S SALTA
1973 2000
7 16
- 3
92 80
SE JUJUY
1973 2000
10 17
- 22
89 61
W JUJUY
1973 2000
- -
- 1
100 99
Table 2. 6. Evolution of land use classes (%) by EAZ (1973 - 2000).
* Urban areas class is not presented here because it is always under 0.5 %
Figure 2. 5. Habitat availability and agriculture changes in the Yungas by EAZ (1973 - 2000).

35
Chapter 2 - Land Use and cover change
A T T R A C T O R S PRECURSORS
for
and
Generalconditions
developmentof productive activities
Very good conditions (state support: transport
communicationsdevelopment)
Regular: state support for tourism activities and development plan of Finca Santiago Kolla Community
very poor
Very good: privateinvestments and some state support
Very good: privateinvestments and some state support
Poor: some state support to the tourism
Feasibility of Farmlandsexpansion
feasibility limited by soil type
partially feasible
feasibility limited by accessibility conditions
highly feasible
highly feasible
feasibility very limited by soil type
TransportinfrastructureandServices
Very good: new paved road from Bermejo to Tarija (principalregionalcenter)
Poor: state effort, new bridge on Bermejo river: the gate toLos Toldos town
very poor
Good: situated on the principaltransport axis national route 34 – national route 50Good: situated on the principaltransport axis national route 34 – national route 50Poor: state effort,developmentof the route Humahuaca - Valle Grande - Lib. Gral. San Martín
Technologicalassistance
(governmentand/or private)
Good
Scarce
Very Scarce
Good
Good
Scarce
*
EAZ
Agricultural use year 2000 (as %
of Total EAZ)
BT (Bolivia)
24 %
W SALTA
0.4 %
NE SALTA
1 %
S SALTA
16 %
SE JUJUY
17 %
W JUJUY
0 % %)
Crop lands availability with forest cover (% crop lands not deforested / Total EAZ)
54 %, with severe limitations by class:48 %, are soils class IVs: strong restrictions for use3 % of both soils classes: II and III14 %: Soils class II (13%) and III (1%)
Reduced: 16 % of soils class II
Significant: 28 %: soils class II (25 %) and soils class III (3 %)
Significant: 22 %: soils class II (14 %) and class III (8 %)
very reduced: 7 %: soils class II (1 %) and class III (6
Use 2000: 0 % of WJ
Length of roads
Paved roads (2005)
Km
266.86
55.69
95.72
No paved roads
84.16
No paved roads
871.33
129.42
762.64
146.12
143.50
No paved roads
Table 2. 7. EAZs: attractors, precursors and possibilities of expansion.
*: agriculture Use 2000: in some cases the use is established in unsuitable soils (classes V and VI)

Two EAZs, South Salta and SE Jujuy, appear particularly sensitive in relation to the intensity of the conversion process (deforestation) for crop expansion (Figures 2.5, 2.6 and 2.7). These two have the highest potential for extension of farmland based upon the quality of land and the accessibility conditions defined by the transport network.
It is clear that both EAZs are the most threatened in relation to the conditions for conversion. Inversely, W SALTA and W JUJUY compose a corridor with low conversion potential in the current conditions. Particularly, W SALTA could present a different context depending on political decisions (state investments) at the national and provincial levels concerning infrastructure, technological assistance and subsidies. These state investments would operate as precursors of landscape change.Without a regional plan setting conservation priorities (i.e. a network of biological corridors connecting the parks), a possible increase of farmland use is reflected in Figures 2.7 and 2.9.
36
Land Use and cover change in the Yungas region
Figure 2. 6. Availability of crop lands and soil classes not converted by 2000 in the region -a- and distribution in the EAZs referred to the total regional (Class II) -b-.
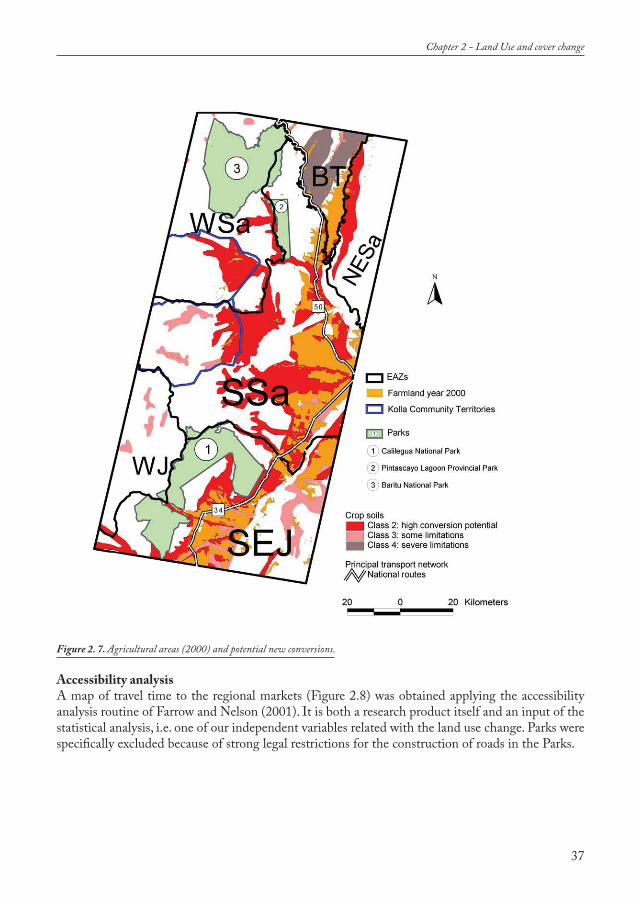
Accessibility analysisA map of travel time to the regional markets (Figure 2.8) was obtained applying the accessibility analysis routine of Farrow and Nelson (2001). It is both a research product itself and an input of the statistical analysis, i.e. one of our independent variables related with the land use change. Parks were specifically excluded because of strong legal restrictions for the construction of roads in the Parks.
37
Chapter 2 - Land Use and cover change
Figure 2. 7. Agricultural areas (2000) and potential new conversions.

It is evident that without land-use planning actions, the Parks will suffer a progressive isolation because the possible agriculture expansion in the EAZs S SALTA and SE JUJUY with the conversion potential that these EAZs have (similar situations can take place in W SALTA). In a regional conservation strategy, the role that local communities could play is crucial. However, other potential situations of isolation of the regional Parks, equally visible by its possible effects (Figures 2.7 and 2.9) exist at the south of the community territories. Precisely, in the Southeast of EAZ South SALTA and its fringe with the EAZ SE JUJUY: the north sector of Calilegua National Park.
38
Land Use and cover change in the Yungas region
Figure 2. 8. Travel time to markets, parks and populated places.

Statistical analysisMantel testThe results of the Mantel test indicate a weak correlation between the presence-absence and physical location similarity matrices, indicating that there is no spatial autocorrelation among sample points.
Logistic Regression AnalysisWe considered five explanatory variables (Soil capability classes as a semi-quantitative variable, and slope, distance -travel time to markets-, distance to rivers and rainfall as quantitative variables) in the multiple logistic regression. The selected model contained three significant variables: soil capability, distance and slope (Table 2.11). Distance to rivers and rainfall were not significant predictive variables in this model.
Model InformationData Set Yungas ProjectResponse Variables CHANGE vs. NOT CHANGENumber of Response Levels 2Number of Observations 400Model binary logitOptimization Technique Fisher’s scoring
We used the Akaike information criterion (AIC) analysis to check the fitness of the model with 2 or with 3 explanatory variables. Because the difference is more than 2 units we did not took the option for the more parsimonious model and we used the 3 variables: soil capability, distance and slope.
The global null hypothesis for the beta coefficients (ß) was performed using Likelihood ratio, Score and Wald tests:
39
Chapter 2 - Land Use and cover change
MANTEL TEST RESULTS: Randomization (Monte Carlo test) method
r = Standardized Mantel statistic 0.138692Observed Z (sum of cross products) 0.530840E+10Variance of Z from randomized runs 0.575518E+14Minimum Z from randomized runs 0.492167E+10Maximum Z from randomized runs 0.498089E+10p (type I error) 0.001000
Table 2. 8. Mantel test of the LUCC sample points coverage.
Table 2. 9. AIC analysis of the LUCC logistic regression model.
Criterion
AICSC
- 2 Log L
Intercept Only
556.518560.509554.518
Intercept and Covariates
245.111261.076237.111

All the tests produced the same answer: the probability of the null hypothesis (ß=0) was very low.We considered three explanatory variables (Soil capability classes as a semi-quantitative variable, Slope and Distance -Accessibility: travel time to markets- as numerical variables) for the multiple logit regression. With the results we evaluated that two of them can be considered as having an actual relation with the land use change: Soil capability and Distance. Slope appears as having less significance. Distance to rivers and Rainfall were considered not relevant for the model.
We also calculated the confidence limits for the selected explanatory variables: Soil capability classes, Slope and Distance:
a) Wald Confidence Interval for Parameters
b) Wald Confidence Interval for Adjusted Odds Ratios
According to model results, soil capability had a positive relationship with the probability of change, and slope and distance from markets were negatively related to it. That fact that each pixel had an associated value of all variables included in the model, we were able to generate aprobability of change map based on our regression analysis function. We employed the Raster map calculator
40
Land Use and cover change in the Yungas region
TestLikelihood Ratio
ScoreWald
Chi-Square317.4072189.180367.5212
Degree of Freedom333
Probability > Chi Square <.0001 <.0001 <.0001
Chi-Square1.7164
DF2
Pr > Chi-Square0.4239
Table 2. 10. Global null hypothesis tests of the Beta coefficients (a) and residual test (b).
Parameter
InterceptSoil capability classes DistanceSlope
Degree ofFreedom
1111
Estimate
2.25540.5815-1. 9957-1.5353
Standard Error
0.91810.09820.38750.6291
Wald Chi-Square 6.034835.099226.52875.9559
Chi-Square Probability
0.0140<.0001 <.0001 0.0147
a)
b)
Table 2. 11. Regression analysis of the selected explanatory variables.
95% Confidence Limits PARAMETER InterceptSoil capability classes SlopeDistance
Estimate2.25540.5815
-1.5353-1.9957
0.45590.3891
-2.7683-2.7551
4.05480.7739
-0.3023-1.2363
Effect 95% Confidence Limits1.476 2.1680.063 0.739
Soil capability classesSlopeDistance
Unit 1.001.001.00
Estimate1.7890.2150.136 0.064 0.290
Table 2. 12. Wald confidence limits for parameters (a) and for adjusted odds ratios (b).

module of Arc GIS (ESRI ®). The actual syntax (equation 2) in Arc GIS was:
p = Exp(2.2554 + 0.5815 * [Soil capability classes] + ( - 1.9957) * [distance] + ( - 1.5353) * [slope) / (2)(1 + Exp(2.2554 + 0.5815 * [Soil capability classes] + ( - 1.9957) * [distance] + ( - 1.5353) * [slope])
In the Yungas, there are more than 300,000 ha of suitable farmland with native forest cover. The probabilities of change appear concentrated (Figure 2.9) in three EAZs: the Bermejo triangle, Southeast JUJUY and South SALTA. Northeast SALTA also has some probability of change in neighboring areas with the Bermejo triangle.
41
Chapter 2 - Land Use and cover change
Figure 2. 9. LUCC regression function by EAZ.

The value for the area under the ROC curve obtained from our model was 0.929 (Figure 2.10), indicating that the overall discriminatory ability of the model was very high (Schröder 2004).
DISCUSSION AND CONCLUSIONS
The Land use and cover change process is reshaping the native forest and the whole landscape in the Yungas region. A duplication of the farmland area in a 30 year period should be interpreted as a call to attention for a need to develop management plans for the coming decades. The rich biodiversity harbored by in this subtropical forest deserves it.
Considering this region from a global perspective, the particular combination of infrastructure, relative state support and a good technological level situates it as a suitable area for farmland expansion (Dros 2004). This expansion would be based in the continuity of conversion of forest to agricultural areas.
It is evident that without land-use planning actions, the parks will suffer a progressive isolation because of the possible agriculture expansion in the EAZs in South SALTA and SE JUJUY, with the conversion potential that these EAZs have (similar situations can take place in W SALTA). In a regional conservation strategy, the role that local communities could play is crucial. However, other potential situations of isolation of the parks (Figure 2.9) are occurring at the south of the community territories. Specifically, in the Southeast portion of EAZ South SALTA and its border with the EAZ SE JUJUY (the northern sector of Calilegua National Park).
42
Land Use and cover change in the Yungas region
Figure 2. 10. ROC curve for the logistic regression analysis.
From a regional perspective, this conversion process of the native forest to agriculture is already in its earlier stages. From the land use analysis and its evolution (Tables 2.4 and 2.6, Figures 2.4 and 2.5) it is evident that zones with suitable soils, predominance of gentle slopes (Piedmont Forest) and that are located in proximity to the principal transport axis of the “Ramal” (national routes 34 and 50, General Belgrano Railway and national route 1 in Bolivia) have been the most affected by conversion processes.
In SE JUJUY the conversion process was initiated in the seventies (10 % of total area destined to agricultural uses in 1973). However, the conversion process has been accelerated due to the promoting effect of a dominant sugarcane corporation and soybean investors (Departments of Ledesma and Santa Barbara). In S SALTA (Department of Oran), the conversion has recently been intensified (Volante et al. 2005), the context is similar to SE JUJUY (sugarcane and soybean corporations) and the business climate is more attractive in the present (Varela 2001, Dros 2004).
Inversely, conversion did not progress or retreat despite suitable soils in NE SALTA (Department of San Martin). Its isolation with respect to the transport network, the seasonal floodings by Itaú and Grande de Tarija Rivers, and the need to cross through Bolivian territory to reach the markets probably determined the current land use condition. Nevertheless, the probability of change is high in some locations: proximity to markets, availability of crop lands and gentle slopes in the Grande de Tarija riverside areas could strongly influence these results.
The Bolivian sector (BERMEJO Triangle) reflects a growing trend in the conversion process from the eighties, but this process now finds strong limitations because it is dominated by poor soils corresponding to land capability use classes IV s (with depth limitations in the soil profile) and class III sw (with depth and drainage limitations). As a precursor of landscape change, it is possible to identify the improvement in accessibility: a recently paved national route (number 1) dramatically enhanced the connection between Tarija, the principal commercial center of the department, and South Bolivia.
For different reasons, there is a low proportion of land devoted to agriculture in the other EAZs (W SALTA: Santa Victoria and Iruya and W JUJUY: Valle Grande and Tilcara). In W SALTA, the lack of an efficient transport network plus the absence of investments and technological assistance could have lead to the situation observed in the year 2000.
In W JUJUY the situation seems to interact with other factors: the availability of crop lands is lower than in W SALTA (only 7 % of this zone is suitable for agriculture). It is a mountainous area and this condition appears as a determinant of a very low conversion.
Statistical analysis points out the soil class capability and accessibility to markets as the principal spatial determinants that are related with LUCC. Slope appears as having less importance, but nonetheless a significant effect. This is obviously related to mountainous terrain. Similar results have been obtained in previous research on spatial determinants of conversion (Veldkamp and Lambin 2001).
Hence, the LUCC process could be managed to counteract negative consequences on the connectivity between the parks. The design of a set of biological corridors (as a base for an ecological network)
43
Chapter 2 - Land Use and cover change
in the Yungas region is already occurring at early stages of expansion of the agricultural frontier. Therefore, opportunities exist to safeguard the most important connections (Steininger et al. 2001). Specifically, only a small portion of the native forest matrix between Calilegua and Baritu has been converted to agriculture. Therefore, this large forest remnant could function as a suitable connection zone between the core areas. But, at a local scale, the conversion is already very intense in the south of the Bermejo Triangle, where the shoreline of the Bermejo River appears highly transformed. Only the riparian environments (the creeks that are tributaries of the Bermejo River) could work as linear corridors, thus maintaining connection functionality. There, specific restoration plans or particular measures should be encouraged to recover connections (South sectors of BERMEJO triangle: BT and the Northeast of Baritu National Park) and mitigate the effects of the conversion. Moreover, the agricultural expansion in South SALTA (S Sa) and Southeast JUJUY (SEJ) has taken place at the cost of the Piedmont Forest (“Selva Pedemontana”) (Brown et al. 2002). This specific Yungas forest stratum should be targeted as a nature conservation regional objective. The final goal of this research is to generate a regional planning proposal for conservation purposes, and it would strive to counteract the change potential of certain areas exposed in Figure 2.9. Meanwhile, in the west of the study area the mountainous environment restrains the conversion to agriculture. This strip could help to maintain the stability of the native forest cover and serve as a habitat corridor that would be easier to implement than in the center and eastern sector of the matrix (the forest space between Calilegua and Baritu).
We recognize that the rate of land use change is driven by demands for land-based commodities (Stephenne and Lambin 2001, Stephenne and Lambin 2004). This rate is often modeled using an economic framework (Fischer and Sun 2001) that is beyond the scope of our research. The rate of change is usually controlled by underlying driving forces which are often remote in space and time, and operate at higher hierarchical levels. They often involve macro-economic transformations and policy changes. Modeling of these driving forces often require the combination of system, actor-based and narrative approaches (Veldkamp and Lambin 2001). Nonetheless, we identified some of these forces in the conceptual model (Figure 2.1). We also mentioned the limitations of the inductive model i.e. its lack of flexibility. Still our LUCC model appears capable of dealing with the location issue (to predict the spatial pattern of change) and particularly in identifying hotspots of land use change as long as the current regional context (conceptual model) remains the same. The location of potential changes was one of our principal research interests in the analysis of LUCC. This model capability was tested by a validation procedure and is described in Chapter 5.
Finally, from statistical analysis, it was possible to identify the relevant role of slope, soil capability classes and accessibility to markets in the conversion process. As discussed in Chapter 5, these characteristics (principally soil classes and accessibility) should be kept in mind when alternative designs of biological corridors linking the parks are going to be discussed with the regional stakeholders (van Rooij et al. 2003).
44
Land Use and cover change in the Yungas region

45

ABSTRACT
Our aim was to evaluate habitat availability at regional and local scales for selected felines taken as focal species, the jaguar (Panthera onca) and the ocelot (Leopardus pardalis). Published and original data were combined for the analysis, new data was obtained through fieldwork transects, meetings with park rangers, scientist, teachers, farmers, ranchers and special interviews to a singular and species-specific local group: the trackers (“tigreros”). This data source is based on a special character of the local communities of the Northwest of Argentina with similarities in Brazil, Central America and Mexico. A logistic regression analysis was carried out using presence data and a group of possible explanatory variables (distance to temperate montane forest, distance to montane subtropical forest, aspect, and a spatial autocorrelation term), and this resulted in a habitat quality model for the jaguar. The problem of autocorrelation was resolved by the application of a scale dependent - random labeling methodology for point pattern analysis. The data set of ocelot was not enough to allow the production of a reliable model. The performance of the jaguar habitat model was evaluated with ROC analysis (AUC: 0.701). An overall discussion of the proposed habitat model is presented. It includes a solution for the autocorrelation problem, the limitations and potentials of the habitat model and its spatial relationship with the existing protected areas.
A modified version of this chapter was published in US IALE Chapter – Annual Meeting 2005, held in Syracuse, NY, as: Somma, D.J., Jongman, R., and van Lammeren, R., 2005. Landscape connectivity evolution in the Yungas Forest, Argentina. It was distinguished with a NASA – Michigan State University professional enhancement award.This chapter is being submitted to Conservation Biology.
CHAPTER 3Habitat condition for focal species in the Yungas region
47
CONTENTSINTRODUCTION 49MATERIALS AND METHODS 52 GIS information 53 Species data 53 Feline habitat characterization 56 Natural and human variables 57 Neighborhood analysis (NA) 59 Distance analysis (DA) 62 Statistical analysis 63 Spatial representation of the habitat regression function 65 Jaguar mortality model 65RESULTS 66 Statistical evaluation 66 Logistic Regression Analysis: Natural Variables - NA and DA models comparison 66 Distance model 69 GIS spatial interpolation 69 Human variables 70 Mixed model: natural and human variables 70 Jaguar mortality preliminary model 71 Logistic Regression Analysis for jaguar mortality (as a special case of the DA model) 71 ROC for the mortality preliminary model 72
DISCUSSION 72
FIGURESFigure 3. 1. Study area context and location of meeting points (Interviews with trackers) 54Figure 3. 2. Jaguar data structure (from Perovic 2002a and Somma unpublished data) 55Figure 3. 3. Fieldwork samples: a) jaguar footprints, b) jaguar footprint chalk samples, c) jaguar hide, d) ocelot hide 56Figure 3. 4. The habitat model analysis 59Figure 3. 5. ROC curve for the Distance model 69Figure 3. 6. Jaguar habitat probability map of the DA model 70
TABLESTable 3. 1. Home range references of jaguar 56Table 3. 2. Home range references of ocelot 57Table 3. 3. Natural variables considered as pure (position value) variables 58Table 3. 4. Human and natural variables considered in neighborhood analysis (NA) 61Table 3. 5. Human and natural variables considered in distance analysis (DA) 63Table 3. 6. Mantel test for jaguar data 66Table 3. 7. Mantel test for ocelot data 66Table 3. 8. AIC analysis 67Table 3. 9. Global null hypothesis tests of the Beta coefficients of jaguar models 67Table 3. 10. Global null hypothesis tests of the Beta coefficients of ocelot models 67Table 3. 11. Regression analysis of the selected explanatory natural variables in the two models for jaguar 68Table 3. 12. Wald confidence limits for parameters of Distance Analysis model (DA) 68Table 3. 13. Association of predicted probabilities and observed responses 68Table 3. 14. Mantel test for jaguar mortality data 71Table 3. 15. AIC analysis 71Table 3. 16. Global null hypothesis tests of the Beta coefficients 71Table 3. 17. Regression analysis of the selected explanatory natural variables for mortality71Table 3. 18. Wald confidence limits for parameters 72
48
Habitat condition for focal species in the Yungas region

INTRODUCTION
Chapter 2 gave us a perspective about the evolution of natural forest conversion in the Yungas. The aim of Chapter 3 is to analyze the availability of wildlife habitat existing across the study area. A number of natural and human variables are considered, a statistical validation of the analysis and a regional model of habitat availability are presented (Austin 2002). In this chapter, “habitat” is considered a species-specific concept. It is defined as the place where an animal normally lives and the collection of resources and conditions necessary for its occupancy (Garshelis 2000). As a species-specific concept, the availability of habitat will be analyzed with a focus on two species of felines: jaguar (Panthera onca) and ocelot (Leopardus pardalis).
This and the following chapter are intended to establish a set of working hypotheses about the spatial distribution of high quality habitat for both jaguars and ocelots. We aim to identify 1) areas of high conservation value (this chapter), 2) which of these are in potential conflict with human presence or uses, and 3) possible habitat strips as linking corridors between core areas (e.g. Baritu and Calilegua National Parks, and Laguna de Pintascayo Provincial Park: chapter 4). These two species are used as “primers” in the identification of key sites for biodiversity conservation across the Yungas region, an approach similar to the case of brown bears in northern Spain (Naves et al. 2003).
The efficacy of planning for biodiversity and nature conservation relies heavily on the quality of the available basic biological information (Pressey et al. 1999, Wilson et al. 2005). As it has been mentioned before, a complete evaluation of the Yunga´s native biota is difficult to carry out. Thus, problems can arise if incomplete biological survey data is used as a basis for reserve and biological corridors planning (Burgman and Lindenmayer 1998, Ferrier et al. 2002a). As a trade off, consistent methods for appraisal and modeling the spatial distribution of wildlife habitat are decisive inputs in conservation planning procedures (Wintle et al. 2005).
In a conservation planning procedure the jaguar could be a focal species. It is considered a landscape species, i.e.: a) it requires a large area to meet its ecological needs, b) it relies on a heterogeneous array of habitats, c) it is threatened by human resource-use practices, d) it plays important roles in ecosystem structure and function, e) it is culturally and economically significant, and f ) in combination with other selected species, it could constitute a complementary conservation umbrella (Coppolillo et al. 2004, Sanderson et al. 2002a). As an example, the jaguar has been already selected as a landscape species (with other species: andean condor, white-lipped peccary, spectacled bear, vicuña, surubi) in the Madidi – Tacana Landscape analysis for conservation in Bolivia (WCS 2002). Also, jaguars are currently threatened by habitat destruction and fragmentation, illegal hunting and prey depletion (Silver et al. 2004). The estimated current distribution of the jaguar across the Americas is thought to encompass an area that is less than 50% of its historical distribution in the 1900s. However, around 70% of the area within their current range may be capable to sustain viable populations of jaguars (Sanderson et al. 2002b).
With regard to jaguar conservation in the Yungas, a conflict between big felines and the cattle production system exists, specifically through cattle predation by jaguars. The Yungas ranchers (creoles or indigenous people) practice a transhumance system. The conflicts with felines (cattle predation) occur principally in winter when the cattle have only a little (if any) attention. If the
49
Chapter 3 – Habitat condition for focal species

conflicts between cattle ranchers and jaguars are located in distant locations from the protected areas and the damage is important, the usual procedure is try to kill the felines (cougar or jaguar). It’s a general case in Latin America: jaguars and cougars are sympatric across much of the Neotropics (Taber et al. 1997, Scognamillo et al. 2003). In these regions, jaguars are endangered, primarily because of habitat loss and persecution prompted by depredation on livestock (Farrell et al. 2000, Polisar et al. 2003, Michalski et al. 2006). Besides, jaguars are considered usually as varmints among the local people (Lopez Gonzalez, C. in Friederici 1998). However, a recent declaration by the Argentine Congress of the jaguar as National Natural Monument in 2001 (Federal Law No. 25463) has slightly modified these perceptions. Nowadays, trackers usually look for park rangers before they proceed to track down and kill jaguars. Together, they try to articulate a solution. In practice, the solution is usually the displacement of cattle packs to other grazing areas.
From Lambeck´s approach of focal species we can also distinguish the jaguar as a possible candidate. Lambeck (1997) indicates that the species identified as being most sensitive to a threat at the landscape level is designated as the ‘focal’ species. These focal species can be employed to identify the appropriate spatial and functional parameters that should be present in a landscape if it is to retain the flora and fauna that it sustains (Lambeck 1999). As an example, the most area-limited species is employed to define the minimum areas required for various habitat patches, and the most dispersal-limited species defines the configuration of patches and characteristics of connecting vegetation, and the same would occur with other limiting processes. The underlying assumption is that because the most demanding species are selected, a landscape designed and managed to meet their needs will cover the requirements of all other species similarly threatened. The jaguar is one of the most habitat area - demanding species of the Yungas.
At the regional scale, an innovative strategy based on jaguars was recently presented in a workshop on jaguar conservation held in Argentina (WCS and APN 2004). This strategy considers some large species as “landscape detectives” and has become another landscape approach to the conservation of the jaguar. The author, Larry Cullen, poses the question: “can the animals’ dispersal and travel routes reveal what lands should be protected as wildlife corridors?” He refers to large, interconnected core reserves with their full complement of native prey species. This work links spatial data with population viability analysis and uses the jaguar as a landscape detective for the Atlantic Forest in Brazil using data from camera traps and radio telemetry. Landscape detective species are thus defined as organisms which can show how to plan and manage reserves and large interconnected eco-regions, because their requirements for survival reveal factors important to maintaining ecologically healthy conditions. The central hypothesis is that by using jaguars as a landscape detective it is possible to identify and assess three important and independent features that characterize large carnivores and large scale conservation planning: (1) prey diversity and density, (2) large core areas and important habitat patches for biodiversity conservation, and (3) biological corridors and landscape connectivity.
Points 2 and 3 will be developed in this research: the second in this chapter and the third in Chapter 4. We will use a GIS and statistical approach from fieldwork observations to identify priority habitat for jaguars and ocelots. Of the three jaguar populations of Argentina, Yungas, Paranaense forest and Chaco, the first is the largest. The Paranaense populations are undergoing a strong decline (jaguar density estimates for this population in the early 1990s are 5-9 times higher: Paviolo et al. 2005) and the Chaco population’s status is currently unknown but most of the potential habitat areas in
50
Habitat condition for focal species in the Yungas region

the Chaco are being converted to agriculture more intensely than in the Yungas. The Yungas was also evaluated as a important jaguar conservation unit in a symposium of jaguar experts (Sanderson et al. 2002). The region was characterized by frequent dispersal to and from other regions (south of Bolivia), high habitat quality and as a shelter of a stable jaguar population.
Accordingly, at a local scale, the ocelot is also used as a focal species (while the jaguar will principally serve at a regional scale). This alternative approach was conceived as an assessment of habitat patches and corridors at a finer scale than with the jaguar.
Although a regional planning of biodiversity conservation units and land use areas may be very inefficient if based on a species-by-species approach (Carroll et al. 2001), it can allow for a first prioritization if focal species are selected for the priority-setting analysis. A similar assessment has been developed for brown bears in Spain (Naves et al. 2003). Habitat selection assessments must be performed at various spatial levels ( Johnson 1980, Thomas and Taylor 1990, Manly et al. 1993, Harveson 2004). Thus, a habitat assessment is related to concepts of scale, extent, grain (see Wiens 1989, Kotliar and Wiens 1990) and hierarchy (see Allen and Starr 1982). This is because animals may select habitats at several spatial scales: geographic (1st order), landscape (2nd order), home range (3rd order), and microsite (4th order; Johnson 1980). The third order selection (individual home range) limits inferences on selection only to an individual’s home range, the first and second order selection (species range and group range, respectively) allows for inferences on selection in a whole study area.
In our study area, the Argentine Yungas, different activities (e.g., deforestation for new farmland areas) leave existing forest patches isolated from each other, creating “islands” of native forest. These islands are prime quality habitat areas for the majority of resident species. To assess the habitat condition at the landscape level two main aspects should be taken into account conjointly: fragmentation and connectivity (Fagan 2002). Fragmentation is an alteration of the spatial configuration of habitats that involves external disturbance that alters the large patch so as to create isolated or tenuously connected patches of the original habitat (Wiens 1989). It is perhaps the most important contemporary conservation issue (Wiens 1996). Connectivity can be defined as the degree to which the landscape facilitates or impedes movement between habitat patches (Taylor et al. 1993). These aspects will be expanded in the next chapter.
In order to manage large areas for enhancing habitat connectivity, knowledge on the specific conditions that are relevant to wildlife habitat for breeding, refuge and movements must be known (Naves et al. 2003). Some of these conditions are related with the fact that both habitat quality and habitat connectivity are species-specific landscape concepts. Therefore, the analysis performed here is referred to two feline species: jaguar (Panthera onca) and ocelot (Leopardus pardalis). The reasons for selecting these two cats (Linders et al. 2004) are: a) they have large area needs at two different scales: regional for jaguar and local for ocelot, and are sensitive to habitat loss (Vynne et al. 2005); b) their habitat is likely to change under current development conditions and without management; c) both felines are species of concern and are of priority for conservation purposes (specially jaguar); and lastly d) there is available data (principally for jaguar) from a historic record series that allows the analysis (Perovic 2002).
Nonetheless, available information about the ecology, pattern of habitat use, and movement of
51
Chapter 3 – Habitat condition for focal species

jaguars is poor or lacking. This lack of information hinders the development of habitat models for the species. However, a regional probability model has been developed with selected variables, using a goodness-of-fit testing procedure in Mexico (Ortega Huerta and Medley 1999), and two rule-based models of potential habitat areas have been developed using GIS in Arizona (Hatten et al. 2002) and New Mexico (Menke and Hayes 2003).
Models have been developed for ocelots based on radio telemetry in Texas (Tewes 1986, Fischer, 1998, Harveson et al. 2004) and in Pantanal (Crawshaw and Quigley 1989). Although a habitat model has not been developed for the Yungas region, previous research carried out by Perovic (2002) contains information on georreferenced presences of ocelots in the region. However, this study does not contain a detailed characterization and analysis of ocelot habitat.
The main use of habitat modeling in conservation planning is in predicting the spatial distribution of suitable habitat for species of interest in a landscape. Therefore, model interpretability should determine the choice of modeling method because a model can only be tested for its realism if it is interpretable (Wintle 2005). Two key features of ecological realism are the selection of explanatory variables included in the model and the shape of the response fitted for those variables (Austin 2002).
Some methods (neural networks, genetic algorithms) are difficult to interpret on both aspects. Ennis et al. (1998) found that logistic regression provided as good, or better, performance than more complicated methods including multivariate adaptive regression splines (Friedman 1991) and back-propagated neural networks (Ripley 1995). Other comparisons have obtained similar results (Elith and Burgman 2002, Moisen and Frescino 2002).
We constructed the habitat models with logistic regression from home range information of both species (Rabinowitz and Nottingham 1986, Steinitz et al. 2003), their natural history in the region (Perovic 2002a, Perovic 2002b,), metapopulation theory (Hanski and Gilpin 1991, Verboom et al. 1991, Opdam et al. 1993, Hanski and Simberloff 1997, Ovaskainen and Hanski 2004) and landscape ecology theory (Opdam 1988, Vos and Opdam 1993, Hargis et al. 1998, Vos et al. 2001, Opdam et al. 2002, McGarigal 2003). We took into account a hierarchy of spatial scales (from the patch to the landscape scale) and levels of ecological complexity (McAlpine et al. 2004). From each scale different aspects were considered. At landscape (100s - 1000s ha) scale we evaluated aspects like proportion of each habitat type, distance to roads, distance to human settlements, etc. At patch scale (1 – 100s ha) we assessed aspects like patch habitat type, proximity to felines presence data location, etc.
MATERIALS AND METHODS
We used GIS capabilities to relate feline species habitat requirements to landscape digital maps that contain information about: land cover and vegetation classes, topographic ruggedness, hydrological systems, urban and rural human populations, and the transport network. We used these digital coverages to recognize areas of prime habitat quality. Habitat availability is the most crucial factor for continued survival of threatened species (Olson, Holmen and Angelides 1997, Liu and Taylor 2002). Identifying habitat areas and using GIS to contrast these to potential new farmland areas is a first step to determining key habitat areas. Then, it is crucial for a regional conservation plan to maintain these areas protected from the deforestation process (considering the current context).
52
Habitat condition for focal species in the Yungas region

Following this plan, the habitat analysis mapping outputs can serve as a planning base to reach a viable compromise with the local stakeholders. Such a compromise could provide medium- to long- term sustainability for key habitat areas (van Rooij et al. 2003).
GIS informationThe habitat condition assessment was carried out by combining a number of different data layers. The change of land use pattern across the region through time was performed through comparison of historic land use maps (OEA - COREBE 1973), aerial photographs (Secretaría de Minería 1973) and Landsat TM satellite images (1986, 1997 and 2000) (see Chapter 2). Original sources of information consists of digital covers at different scales (from 1:100.000 to 1:250.000) provided by Instituto Geográfico Militar (IGM), and the “PEA del Río Bermejo” (SAP - OAS 2000) and the “Zonificación de la Reserva de la Biosfera de las Yungas” projects (SAP - OAS 2003). Other digital layers (e.g. villages within the Yungas region, commonly used tracks, roads network system, etc.) were prepared and incorporated by the research team.
Species dataJaguar and ocelot records were obtained from a previous and very relevant study performed by Perovic (2002b), and new presence data for both species was collected from field work carried out in 2004. Perovic´s study was based on: a) species´ presence data collected from transects and selected sites; and b) survey interviews to park rangers, natural resources professionals and other inhabitants of the region. A similar research approach was adopted in our study, with additional interviews to key informants, namely local people with experience in tracking jaguars and pumas (locally known as “tigreros”). Interviews were based on some 20 villages and ranchs in the region, of which Isla de Cañas is the largest with 1,800 people, followed by Valle Grande, Rio Blanquito and San Francisco, with 750, 700 and 570 inhabitants, respectively. The other settlements vary in population between 300 and 30 inhabitants. The villages are in a strategic condition, located in immediate surroundings of the Parks in the almost uninhabited large forest tract (forest matrix) between them (Figure 3.1). The approach was previously analyzed with a special group of park rangers. The rangers that participated in this research have been born in the region. Moreover, some of them are from indigenous communities. Only reliable trackers were consulted. For the park rangers, these trackers are very well known and are respected in the region. A similar approach was performed by researchers in Mexico (Ortega Huerta and Medley 1999, Brown and Lopez Gonzalez 2000).
It is important to state that the trackers took great pride in sharing their knowledge with our team, and only made references to unequivocal jaguar sightings (i.e. in some villages -Baritu, Media Luna- we did not obtain recent feline references either from the local trackers or park rangers). They also cited predation events by cougars, which are more prone to roam in village neighborhoods. In case of predation by cougar, the usual agreement was to organize hunting parties to kill them. Then, trackers usually proceeded without consultation. Some trackers showed our team several jaguar, cougar and ocelot hides and other testimonies of the feline’s presence (some damaged articles by jaguars from their high Andean houses: “puestos”). From transects we took footprint pictures. As a complementary procedure, we also checked the data obtained from trackers. We arranged interviews with ranchers that have been living and producing for a long time period in the region. Presences of jaguars or cougars in the Yungas (being these cattle predation, sights, footprints or also personal, direct encounters) are widely commented and most of the ranchers and local people have a clear memory of these events in the villages.
53
Chapter 3 – Habitat condition for focal species

Ocelot references are usually hunted individuals because they often come near the barns and villages. Ocelot sightings are also a normal source of reference data.
54
Habitat condition for focal species in the Yungas region
Figure 3. 1. Study area context and location of meeting points (Interviews with trackers)

Yungas ranchers, who usually manage few heads of cattle (20 – 50 individuals), are essentially transhumance peasants based on subsistence agriculture with a savings resource: the cattle itself. They have historically handled their cattle packs in a very extensive manner. Usually, livestock is grazing alone or with sporadic surveillance. The cattle are rounded up when they’re going to be sold or moved to another place. The production system presents vulnerability to predation by cougar and jaguar. Therefore, predation is one of the principal conflicting factors between jaguar conservation and ranchers.
The data collection procedure allowed us to differentiate (Figure 3.2) between dead felines, predation, sightings and reproduction evidence (e.g. a female with cubs; unfortunately, this evidence was not systematically registered in previous research). In some cases, evidence of dead individuals is registered by hides or pictures (Figure 3.3). Some sightings are also registered by the footprint (photograph or chalk footprint samples taken by our park rangers’ team).
55
Chapter 3 – Habitat condition for focal species
Figure 3. 2. Jaguar data structure (from Perovic 2002 and Somma unpublished data).
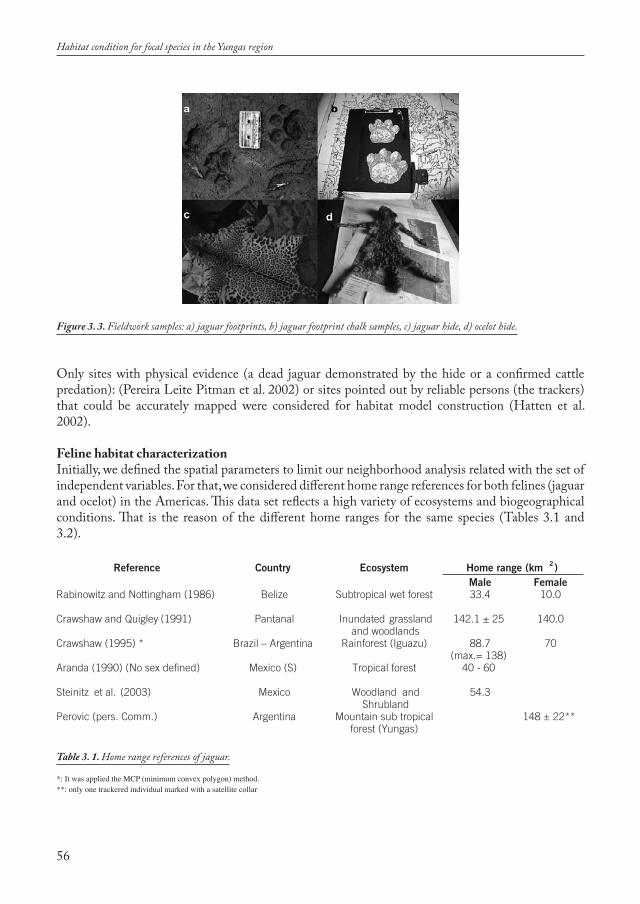
Only sites with physical evidence (a dead jaguar demonstrated by the hide or a confirmed cattle predation): (Pereira Leite Pitman et al. 2002) or sites pointed out by reliable persons (the trackers) that could be accurately mapped were considered for habitat model construction (Hatten et al. 2002).
Feline habitat characterizationInitially, we defined the spatial parameters to limit our neighborhood analysis related with the set of independent variables. For that, we considered different home range references for both felines (jaguar and ocelot) in the Americas. This data set reflects a high variety of ecosystems and biogeographical conditions. That is the reason of the different home ranges for the same species (Tables 3.1 and 3.2).
56
Habitat condition for focal species in the Yungas region
Home range (km 2)Reference
Rabinowitz and Nottingham (1986)
Crawshaw and Quigley (1991)
Crawshaw (1995) *
Aranda (1990) (No sex defined)
Steinitz et al. (2003)
Perovic (pers. Comm.)
Country
Belize
Pantanal
Brazil – Argentina
Mexico (S)
Mexico
Argentina
Ecosystem
Subtropical wet forest
Inundated grasslandand woodlands
Rainforest (Iguazu)
Tropical forest
Woodland andShrubland
Mountain sub tropical forest (Yungas)
Male33.4
142.1 ± 25
88.7(max.= 138)
40 - 60
54.3
Female10.0
140.0
70
148 ± 22**
Figure 3. 3. Fieldwork samples: a) jaguar footprints, b) jaguar footprint chalk samples, c) jaguar hide, d) ocelot hide.
Table 3. 1. Home range references of jaguar.
*: It was applied the MCP (minimum convex polygon) method.**: only one trackered individual marked with a satellite collar
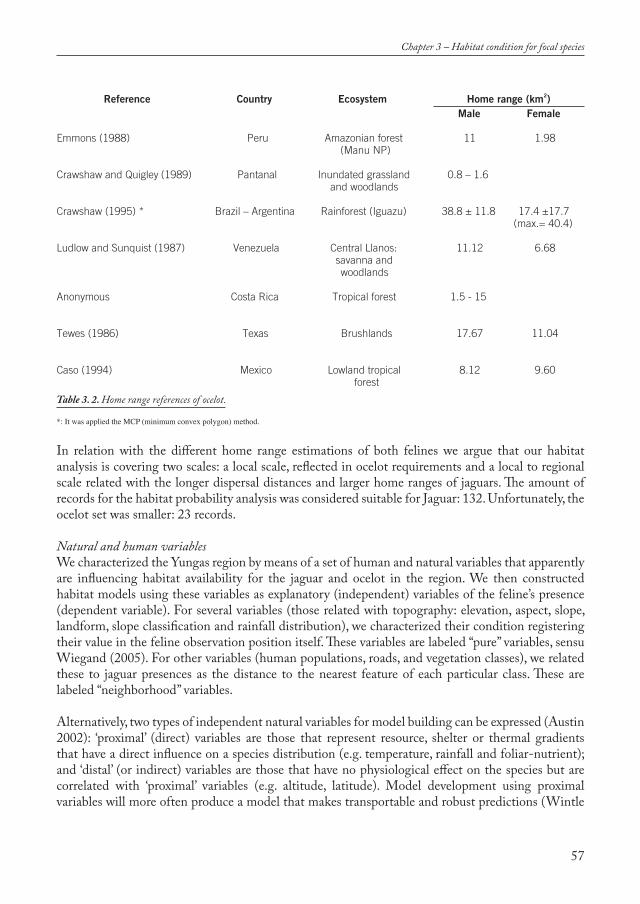
In relation with the different home range estimations of both felines we argue that our habitat analysis is covering two scales: a local scale, reflected in ocelot requirements and a local to regional scale related with the longer dispersal distances and larger home ranges of jaguars. The amount of records for the habitat probability analysis was considered suitable for Jaguar: 132. Unfortunately, the ocelot set was smaller: 23 records.
Natural and human variablesWe characterized the Yungas region by means of a set of human and natural variables that apparently are influencing habitat availability for the jaguar and ocelot in the region. We then constructed habitat models using these variables as explanatory (independent) variables of the feline’s presence (dependent variable). For several variables (those related with topography: elevation, aspect, slope, landform, slope classification and rainfall distribution), we characterized their condition registering their value in the feline observation position itself. These variables are labeled “pure” variables, sensu Wiegand (2005). For other variables (human populations, roads, and vegetation classes), we related these to jaguar presences as the distance to the nearest feature of each particular class. These are labeled “neighborhood” variables.
Alternatively, two types of independent natural variables for model building can be expressed (Austin 2002): ‘proximal’ (direct) variables are those that represent resource, shelter or thermal gradients that have a direct influence on a species distribution (e.g. temperature, rainfall and foliar-nutrient); and ‘distal’ (or indirect) variables are those that have no physiological effect on the species but are correlated with ‘proximal’ variables (e.g. altitude, latitude). Model development using proximal variables will more often produce a model that makes transportable and robust predictions (Wintle
57
Chapter 3 – Habitat condition for focal species
Reference
Emmons (1988)
Crawshaw and Quigley (1989)
Crawshaw (1995) *
Ludlow and Sunquist (1987)
Anonymous
Tewes (1986)
Caso (1994)
Country
Peru
Pantanal
Brazil – Argentina
Venezuela
Costa Rica
Texas
Mexico
Ecosystem
Amazonian forest (Manu NP)
Inundated grassland and woodlands
Rainforest (Iguazu)
Central Llanos: savanna and woodlands
Tropical forest
Brushlands
Lowland tropical forest
Home range (km2)Male
11
0.8 – 1.6
38.8 ± 11.8
11.12
1.5 - 15
17.67
8.12
Female
1.98
17.4 ±17.7 (max.= 40.4)
6.68
11.04
9.60
Table 3. 2. Home range references of ocelot.
*: It was applied the MCP (minimum convex polygon) method.
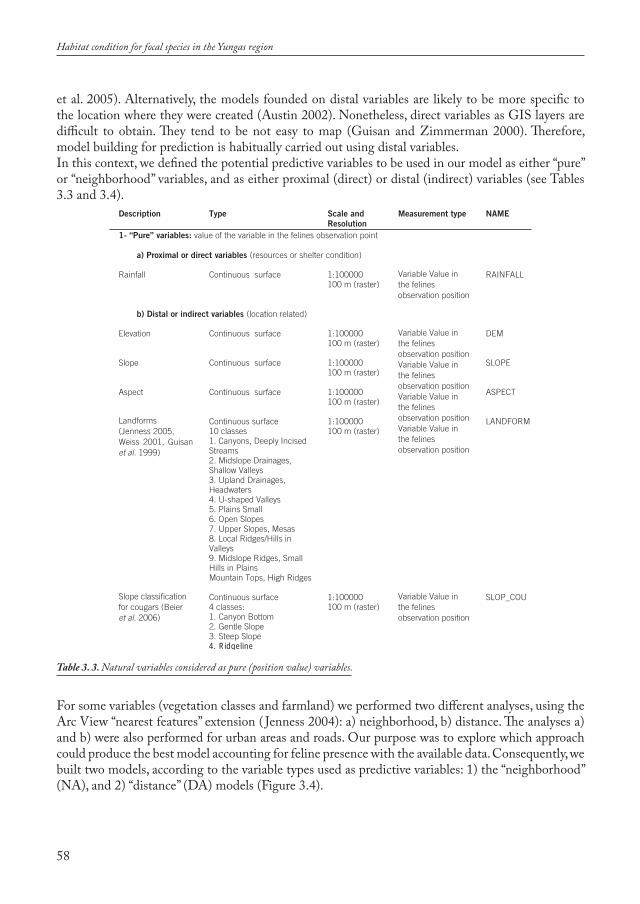
et al. 2005). Alternatively, the models founded on distal variables are likely to be more specific to the location where they were created (Austin 2002). Nonetheless, direct variables as GIS layers are difficult to obtain. They tend to be not easy to map (Guisan and Zimmerman 2000). Therefore, model building for prediction is habitually carried out using distal variables.In this context, we defined the potential predictive variables to be used in our model as either “pure” or “neighborhood” variables, and as either proximal (direct) or distal (indirect) variables (see Tables 3.3 and 3.4).
For some variables (vegetation classes and farmland) we performed two different analyses, using the Arc View “nearest features” extension ( Jenness 2004): a) neighborhood, b) distance. The analyses a) and b) were also performed for urban areas and roads. Our purpose was to explore which approach could produce the best model accounting for feline presence with the available data. Consequently, we built two models, according to the variable types used as predictive variables: 1) the “neighborhood” (NA), and 2) “distance” (DA) models (Figure 3.4).
58
Habitat condition for focal species in the Yungas region
Table 3. 3. Natural variables considered as pure (position value) variables.
Type
Continuous surface
Continuous surface
Continuous surface
Continuous surface
Continuous surface 10 classes 1. Canyons, Deeply IncisedStreams2. Midslope Drainages, Shallow Valleys3. Upland Drainages, Headwaters 4. U-shaped Valleys5. Plains Small 6. Open Slopes7. Upper Slopes, Mesas 8. Local Ridges/Hills inValleys9. Midslope Ridges, Small Hills in PlainsMountain Tops, High Ridges
Continuous surface 4 classes:1. Canyon Bottom 2. Gentle Slope 3. Steep Slope 4. Ridgeline
Scale and Resolution
1:100000100 m (raster)
1:100000100 m (raster)
1:100000100 m (raster)
1:100000100 m (raster)
1:100000100 m (raster)
1:100000100 m (raster)
NAME
RAINFALL
DEM
SLOPE
ASPECT
LANDFORM
SLOP_COU
Measurement type
Variable Value inthe felinesobservation position Variable Value inthe felinesobservation position Variable Value inthe felinesobservation position Variable Value inthe felinesobservation position
Variable Value inthe felinesobservation position
Variable Value inthe felinesobservation position
Description
Rainfall
Elevation
Slope
Aspect
1- “Pure” variables: value of the variable in the felines observation point
Landforms(Jenness 2005,Weiss 2001, Guisanet al. 1999)
Slope classification for cougars (Beieret al. 2006)
b) Distal or indirect variables (location related)
a) Proximal or direct variables (resources or shelter condition)

Neighborhood analysis (NA)For some variables (human populations, roads, and vegetation classes) we define two different radii to analyze the neighborhood of each species: 7 km for jaguars (we used 7 km instead of the actual value: 6.8 km, i.e. the radius of a circle of 148 km2, Table 3.1) and 4 km for ocelots (the radius of a circle of approximately 50 km2, Table 3.2). These radii are based on estimations of the largest values of home range estimations, (Table 3.1 and Table 3.2) as a conservative approach to home range size. The potential effect of water resources was represented by a variable that measured the distance from the nearest permanent or transitory river to the feline’s observation points.
59
Chapter 3 – Habitat condition for focal species
VARIABLES (Natural and Human)
INPUTS
OUTPUTS
Pure variables
(Elevation, Slope,Aspect, Rainfall,Landforms, Slope
classes for Cougars)
Neighborhood analysisvariables (four derived
variables: average, sum,weighted av., w. sum)
Natural var.: Vegetation,Rivers,
Human var.: Urban areas,roads, farmland.
Distance analysisvariables
Natural var.: Vegetation,Rivers,
Human var.: Urban areas,Roads, farmland.
Model 1 NA
Neighborhood Analysis(without spatial
expression)
Model 2 DA
-Distance Analysis-(a regression function
with spatial expression:probability surface)
LogisticRegression
Analysis (LRA)
LRA
Figure 3. 4. The habitat model analysis.

The “Nearest Features” Arc View extension ( Jenness 2004) served to characterize the neighborhood around each feline observation. The weighting operation was always performed considering the distance between feline observations and the nearest edge of features (nearest centroid in case of point variables like urban areas and the nearest edge for polygons like farmland areas) of the explanatory variables analyzed.For the human and natural variables (except vegetation) we defined the search operation as the identification of the 10 nearest class events in the search radius (7 or 4 km) and the distance of each one of these events to the observation points (Table 3.4).For vegetation classes we performed a slightly different search operation. We determined patch area for the 15 nearest events of each class of the vegetation coverage and the distance of each one of these events to the observation points.Usually, the procedure found less than 10 or 15 events inside the search radius defined. Subsequently, we used all the events effectively located.
60
Habitat condition for focal species in the Yungas region

61
Chapter 3 – Habitat condition for focal species
HUMAN VARIABLES Description Type Resolution Measurement type NAME
Roads Line 1:100000 (vecto r) Nearest paved road to the felines observation
DISTROADS
Population4 variables
1. SUM_PO 2. WSUM_PO 3. AVER_PO 4. WAVER_PO
Points6 density classes:
1. < 100 inhab. 2. 500 < inhab. < 100 3. 500 < inhab. < 2000 4. 2000 < inhab. < 5000 5. 5000 < inhab. < 20000 6. > 20000 inhab.
1:100000 (vector) Neighborhoodanalysis by nearest distance to centroid 10 events
SUM of nearest villages (points)
Neighborhoodanalysis by nearest distance to centroid 10 events
SUM_PO
Weighted sum of nearest villages
Neighborhoodanalysis by nearest distance to centroid Idem SUM_PO but weighted by distance
WSUM_PO
Average density class
Neighborhoodanalysis by nearest distance to centroid Idem SUM_PO and averaged
AVER_PO
Weighted Average density class
Neighborhoodanalysis by nearest distance to centroid Idem SUM_PO but averaged and weighted by distance
WAVER_PO
Agriculture4 variables
Polygons 1:100000 (vector) Neighborhoodanalysis
SUM of nearest agricultural areas (Polygons)
Polygons 1:100000 (vector) Neighborhoodanalysis by nearest distance to centroid 15 events
SUM_AG
Weighted SUM of nearest agricultural areas (Polygons)
Polygons 1:100000 (vector) Idem SUM_AG butweighted by distance
WSUM_AG
Average of nearest agricultural areas (Polygons)
Polygons 1:100000 (vector) Neighborhoodanalysis by nearest distance to centroid 15 eventsand averaged
AVER_AG
Weighted average of nearest agricultural areas (Polygons)
Polygons 1:100000 (vector) Idem AVER_AG but weighted by distance
WAVER_AG
Table 3. 4. Human and natural variables considered in neighborhood analysis (NA).
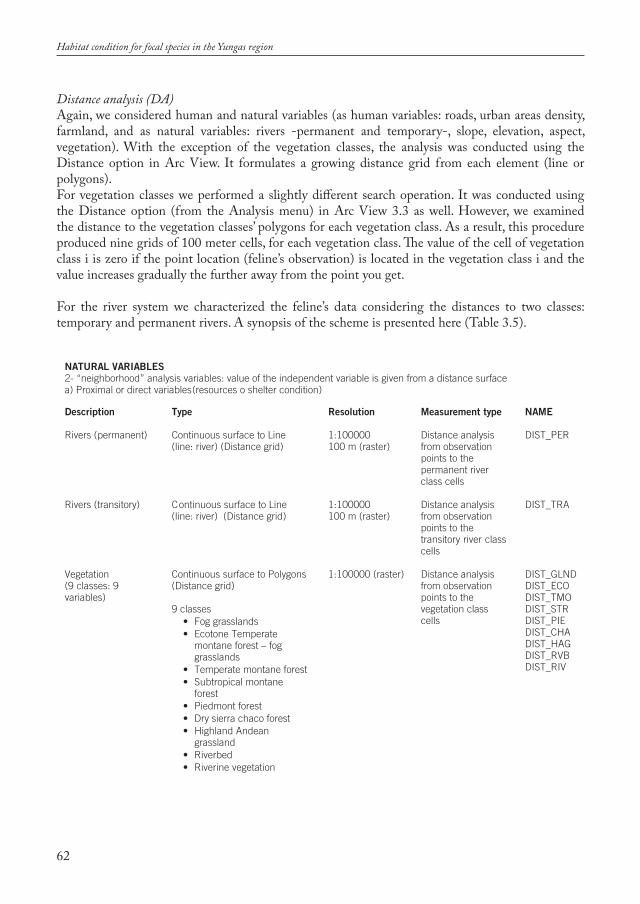
Distance analysis (DA)Again, we considered human and natural variables (as human variables: roads, urban areas density, farmland, and as natural variables: rivers -permanent and temporary-, slope, elevation, aspect, vegetation). With the exception of the vegetation classes, the analysis was conducted using the Distance option in Arc View. It formulates a growing distance grid from each element (line or polygons).For vegetation classes we performed a slightly different search operation. It was conducted using the Distance option (from the Analysis menu) in Arc View 3.3 as well. However, we examined the distance to the vegetation classes’ polygons for each vegetation class. As a result, this procedure produced nine grids of 100 meter cells, for each vegetation class. The value of the cell of vegetation class i is zero if the point location (feline’s observation) is located in the vegetation class i and the value increases gradually the further away from the point you get.
For the river system we characterized the feline’s data considering the distances to two classes: temporary and permanent rivers. A synopsis of the scheme is presented here (Table 3.5).
62
Habitat condition for focal species in the Yungas region
NATURAL VARIABLES 2- “neighborhood” analysis variables: value of the independent variable is given from a distance surface a) Proximal or direct variables (resources o shelter condition)
Description Type Measurement type NAME
Rivers (permanent) Continuous surface to Line (line: river) (Distance grid)
Distance analysis from observation points to the permanent river class cells
DIST_PER
Rivers (transitory) Continuous surface to Line (line: river) (Distance grid)
Distance analysis from observation points to the transitory river class cells
DIST_TRA
Vegetation(9 classes: 9 variables)
Continuous surface to Polygons (Distance grid)
9 classes • Fog grasslands • Ecotone Temperate
montane forest – fog grasslands
• Temperate montane forest • Subtropical montane
forest• Piedmont forest • Dry sierra chaco forest • Highland Andean
grassland• Riverbed • Riverine vegetation
Resolution
1:100000100 m (raster)
1:100000100 m (raster)
1:100000 (raster) Distance analysis from observation points to the vegetation class cells
DIST_GLNDDIST_ECODIST_TMODIST_STRDIST_PIEDIST_CHADIST_HAG DIST_RVBDIST_RIV
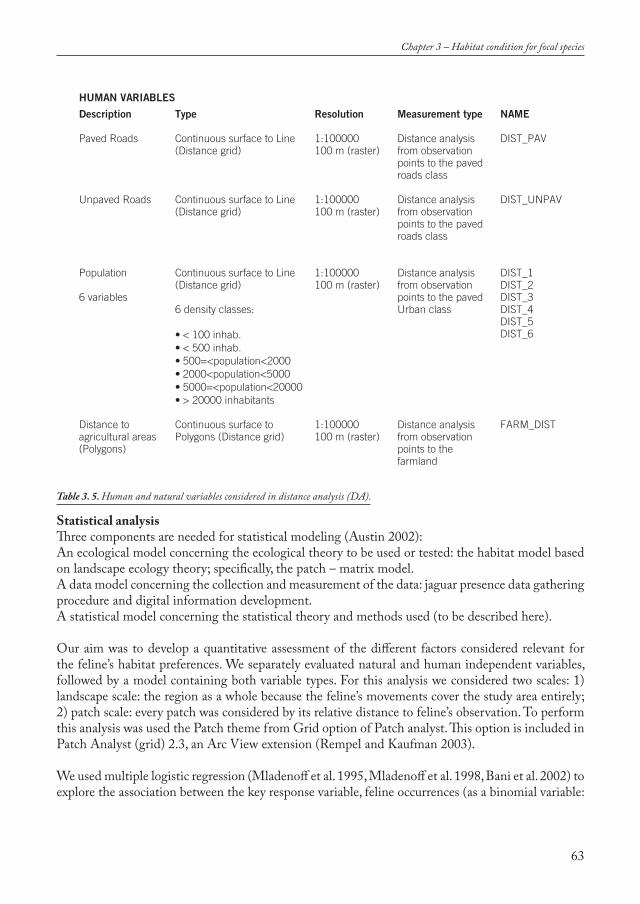
Statistical analysisThree components are needed for statistical modeling (Austin 2002):An ecological model concerning the ecological theory to be used or tested: the habitat model based on landscape ecology theory; specifically, the patch – matrix model.A data model concerning the collection and measurement of the data: jaguar presence data gathering procedure and digital information development.A statistical model concerning the statistical theory and methods used (to be described here).
Our aim was to develop a quantitative assessment of the different factors considered relevant for the feline’s habitat preferences. We separately evaluated natural and human independent variables, followed by a model containing both variable types. For this analysis we considered two scales: 1) landscape scale: the region as a whole because the feline’s movements cover the study area entirely; 2) patch scale: every patch was considered by its relative distance to feline’s observation. To perform this analysis was used the Patch theme from Grid option of Patch analyst. This option is included in Patch Analyst (grid) 2.3, an Arc View extension (Rempel and Kaufman 2003).
We used multiple logistic regression (Mladenoff et al. 1995, Mladenoff et al. 1998, Bani et al. 2002) to explore the association between the key response variable, feline occurrences (as a binomial variable:
63
Chapter 3 – Habitat condition for focal species
HUMAN VARIABLES
Description Type Resolution Measurement type NAME
Paved Roads Continuous surface to Line (Distance grid)
1:100000100 m (raster)
Distance analysis from observation points to the paved roads class
DIST_PAV
Unpaved Roads Continuous surface to Line (Distance grid)
1:100000100 m (raster)
Distance analysis from observation points to the paved roads class
DIST_UNPAV
Population
6 variables
Continuous surface to Line (Distance grid)
6 density classes:
• < 100 inhab. • < 500 inhab. • 500=<population<2000 • 2000<population<5000 • 5000=<population<20000 • > 20000 inhabitants
1:100000100 m (raster)
Distance analysis from observation points to the paved Urban class
DIST_1DIST_2DIST_3DIST_4DIST_5DIST_6
Distance to agricultural areas (Polygons)
Continuous surface toPolygons (Distance grid)
1:100000100 m (raster)
Distance analysis from observation points to the farmland
FARM_DIST
Table 3. 5. Human and natural variables considered in distance analysis (DA).

presence and absence), and the potentially explanatory variables (natural and human) described above. The analysis involved a random sample of “pseudo” absence points from the entire study region. We created this pseudo-absent data record of equal size (132 points) with some restrictions: these “absence” data should be at a minimum distance of 1000 m of other “absence” data and at least 500 m of actual jaguar presence data. Thus, the logistic regression analysis involved a sample of 264 points (132 in each class: presence and pseudo-absence) from the entire study region.
In the regression function (equation 1) a is the intercept and ßi the regression coefficients of the explanatory i variables and θ (or P) the probability of a feline’s presence:
Spatial autocorrelation of the jaguar observations was tested via the Mantel Test, which evaluates the null hypothesis of no relation between two similarity or dissimilarity matrices (Urban et al. 2002). We used the Euclidean (Pythagorean) distance measure for both matrices constructed from presence-absence points and the physical location of points. The approach above has important limitations, mainly, that it accounts for broad-scale spatial pattern but no for the finer-scale autocorrelation that induces non-independence among errors (Lichstein et al. 2002). Also, the presence of positive spatial autocorrelation in model residuals (spatial dependency) tends to increase the likelihood of type I error (Betts et al. 2006). Scale dependent spatial autocorrelation was evaluated using the bivariate random labeling procedure available in the Programita software (Wiegand and Moloney 2004). Bivariate random labeling investigates whether or not two labels, type “1” and type “2”, have a random structure within the given spatial structure of the joined pattern. In this case, the two types of labels correspond to points where feline species were present and absent. According to Wiegand and Moloney (2004), numerical implementation of the random labeling null model involves repeated simulations using the fixed n1 + n2 locations (points of feline presence and absence), and therefore, the expected bivariate function under random labeling is the univariate g- or L- function of the joined pattern. In our example, this procedure allows to test the null model for absence of interaction between the points corresponding to feline presences and absences. To assess departure from random labeling, variant 3 of the random labeling procedure was used (see Wiegand and Moloney 2004). This variant corresponds to the difference g21(r)-g11(r). A negative difference indicates that type 1 points are more frequent in rings around other type 1 points than in rings around type 2 points, at radius r, and thus would indicate a spatial autocorrelation of type 1 points at this radius (for a detailed discussion of this and other spatial point pattern analysis procedures, see Wiegand and Moloney 2004, and Wiegand et al. 2006).
Once the scale (radius r) at which the spatial autocorrelation phenomenon was discovered, the “Nearest Features” extension for Arc View 3.3 was used to produce a spatial autocorrelation variable that would be included as a predictive variable in the model. The autocorrelation variable consisted of the proportion of jaguar presence points of both presence and absence points around the focal point in radius r. Including an autocorrelation variable in the models permits the evaluation of spatial autocorrelation processes in model parameter coefficient values, through the comparison of models with and without the spatial autocorrelation variable.
64
Habitat condition for focal species in the Yungas region
(a + ß1 * V1 + ß2 * V2+ ß3 * V3 + …+ ßn * Vn)
= e (1)(a + ß1 * V1 + ß2 * V2+ ß3 * V3 + …+ ßn * Vn)
1 + e
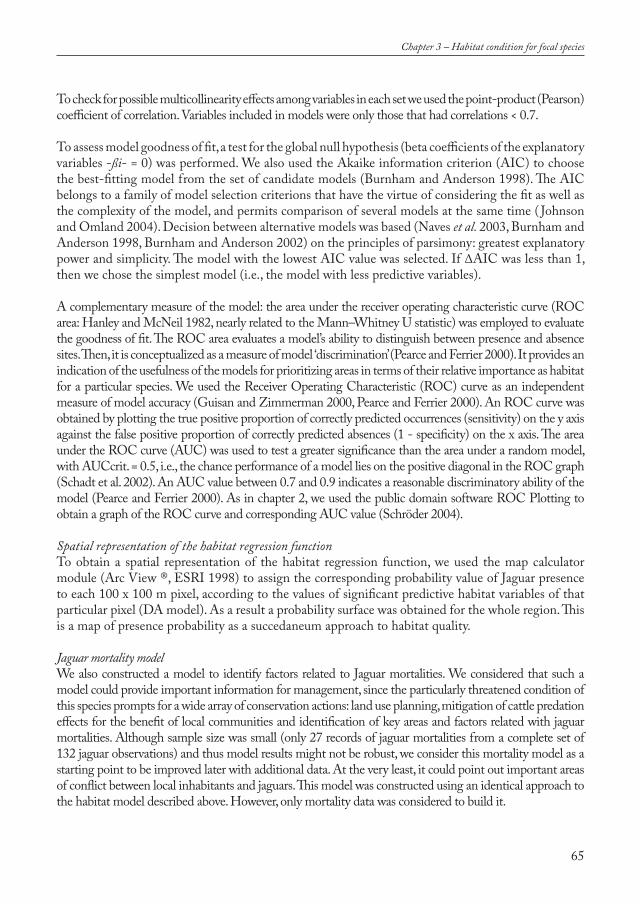
To check for possible multicollinearity effects among variables in each set we used the point-product (Pearson) coefficient of correlation. Variables included in models were only those that had correlations < 0.7.
To assess model goodness of fit, a test for the global null hypothesis (beta coefficients of the explanatory variables -ßi- = 0) was performed. We also used the Akaike information criterion (AIC) to choose the best-fitting model from the set of candidate models (Burnham and Anderson 1998). The AIC belongs to a family of model selection criterions that have the virtue of considering the fit as well as the complexity of the model, and permits comparison of several models at the same time ( Johnson and Omland 2004). Decision between alternative models was based (Naves et al. 2003, Burnham and Anderson 1998, Burnham and Anderson 2002) on the principles of parsimony: greatest explanatory power and simplicity. The model with the lowest AIC value was selected. If ΔAIC was less than 1, then we chose the simplest model (i.e., the model with less predictive variables).
A complementary measure of the model: the area under the receiver operating characteristic curve (ROC area: Hanley and McNeil 1982, nearly related to the Mann–Whitney U statistic) was employed to evaluate the goodness of fit. The ROC area evaluates a model’s ability to distinguish between presence and absence sites. Then, it is conceptualized as a measure of model ‘discrimination’ (Pearce and Ferrier 2000). It provides an indication of the usefulness of the models for prioritizing areas in terms of their relative importance as habitat for a particular species. We used the Receiver Operating Characteristic (ROC) curve as an independent measure of model accuracy (Guisan and Zimmerman 2000, Pearce and Ferrier 2000). An ROC curve was obtained by plotting the true positive proportion of correctly predicted occurrences (sensitivity) on the y axis against the false positive proportion of correctly predicted absences (1 - specificity) on the x axis. The area under the ROC curve (AUC) was used to test a greater significance than the area under a random model, with AUCcrit. = 0.5, i.e., the chance performance of a model lies on the positive diagonal in the ROC graph (Schadt et al. 2002). An AUC value between 0.7 and 0.9 indicates a reasonable discriminatory ability of the model (Pearce and Ferrier 2000). As in chapter 2, we used the public domain software ROC Plotting to obtain a graph of the ROC curve and corresponding AUC value (Schröder 2004).
Spatial representation of the habitat regression functionTo obtain a spatial representation of the habitat regression function, we used the map calculator module (Arc View ®, ESRI 1998) to assign the corresponding probability value of Jaguar presence to each 100 x 100 m pixel, according to the values of significant predictive habitat variables of that particular pixel (DA model). As a result a probability surface was obtained for the whole region. This is a map of presence probability as a succedaneum approach to habitat quality.
Jaguar mortality modelWe also constructed a model to identify factors related to Jaguar mortalities. We considered that such a model could provide important information for management, since the particularly threatened condition of this species prompts for a wide array of conservation actions: land use planning, mitigation of cattle predation effects for the benefit of local communities and identification of key areas and factors related with jaguar mortalities. Although sample size was small (only 27 records of jaguar mortalities from a complete set of 132 jaguar observations) and thus model results might not be robust, we consider this mortality model as a starting point to be improved later with additional data. At the very least, it could point out important areas of conflict between local inhabitants and jaguars. This model was constructed using an identical approach to the habitat model described above. However, only mortality data was considered to build it.
65
Chapter 3 – Habitat condition for focal species
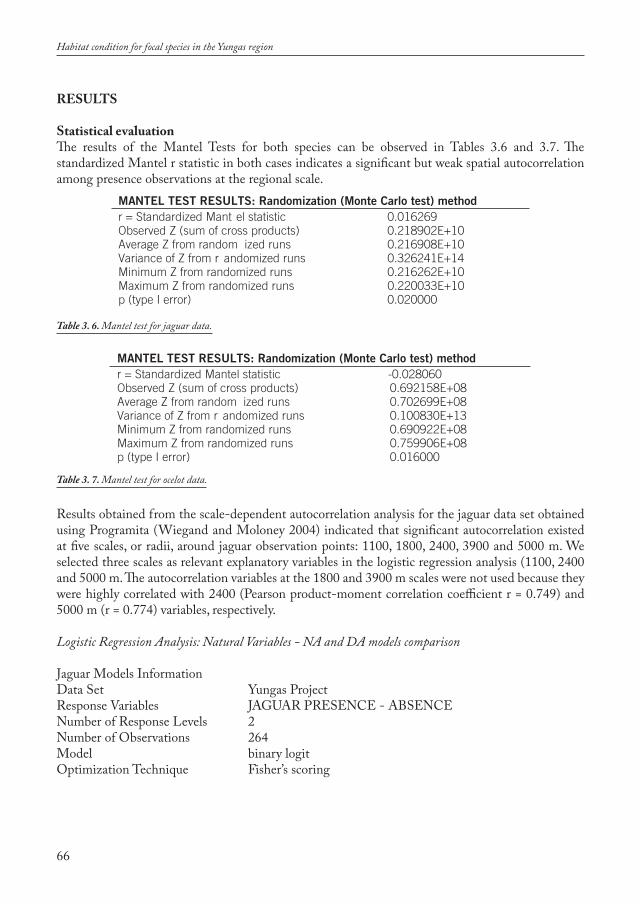
RESULTS
Statistical evaluationThe results of the Mantel Tests for both species can be observed in Tables 3.6 and 3.7. The standardized Mantel r statistic in both cases indicates a significant but weak spatial autocorrelation among presence observations at the regional scale.
Results obtained from the scale-dependent autocorrelation analysis for the jaguar data set obtained using Programita (Wiegand and Moloney 2004) indicated that significant autocorrelation existed at five scales, or radii, around jaguar observation points: 1100, 1800, 2400, 3900 and 5000 m. We selected three scales as relevant explanatory variables in the logistic regression analysis (1100, 2400 and 5000 m. The autocorrelation variables at the 1800 and 3900 m scales were not used because they were highly correlated with 2400 (Pearson product-moment correlation coefficient r = 0.749) and 5000 m (r = 0.774) variables, respectively.
Logistic Regression Analysis: Natural Variables - NA and DA models comparison
Jaguar Models InformationData Set Yungas ProjectResponse Variables JAGUAR PRESENCE - ABSENCENumber of Response Levels 2Number of Observations 264Model binary logitOptimization Technique Fisher’s scoring
66
Habitat condition for focal species in the Yungas region
MANTEL TEST RESULTS: Randomization (Monte Carlo test) method r = Standardized Mant el statistic 0.016269Observed Z (sum of cross products) 0.218902E+10 Average Z from random ized runs 0.216908E+10 Variance of Z from r andomized runs 0.326241E+14 Minimum Z from randomized runs 0.216262E+10 Maximum Z from randomized runs 0.220033E+10 p (type I error) 0.020000
Table 3. 6. Mantel test for jaguar data.
MANTEL TEST RESULTS: Randomization (Monte Carlo test) method r = Standardized Mantel statistic -0.028060 Observed Z (sum of cross products) 0.692158E+08 Average Z from random ized runs 0.702699E+08 Variance of Z from r andomized runs 0.100830E+13 Minimum Z from randomized runs 0.690922E+08 Maximum Z from randomized runs 0.759906E+08 p (type I error) 0.016000
Table 3. 7. Mantel test for ocelot data.

The global null hypothesis for the beta coefficients (ß) was performed using Likelihood ratio, Score and Wald tests:
In all Jaguar models, the null hypothesis that ßi = 0 was rejected, providing evidence for goodness of fit.With respect to the ocelot, neither the NA nor the DA model provided evidence for rejection of this null hypothesis, indicating lack of fit (Table 3.10).
We attribute this lack of fit to our small data set for this species (23 presence points). Our intention was to use the ocelot as focal species at a lower hierarchical level than jaguar. Therefore, we would construct two habitat models at two scales covering both regional (jaguar) and local (ocelot) levels. Unfortunately, it was not possible to obtain a reliable model with our data set of ocelot presence and we decided to continue the research development only with the jaguar habitat model (Table 3.11).
67
Chapter 3 – Habitat condition for focal species
InterceptOnly
Intercept and Covariates
Criterion NA DA
AIC 367.98 328.24 325.37- 2 Log L 365.98 314.24 315.37
Table 3. 8. AIC analysis.
Test Chi-Square Degree ofFreedom
Probability > Chi Square
NA model Likelihood Ratio 51.7417 6 <.0001 Score 47.5162 6 <.0001 Wald 40.0483 6 <.0001
DA model Likelihood Ratio 50.6119 4 <.0001 Score 45.2920 4 <.0001 Wald 36.6212 4 <.0001
Table 3. 9. Global null hypothesis tests of the Beta coefficients of jaguar models.
Table 3. 10. Global null hypothesis tests of the Beta coefficients of ocelot models.
Test Chi-Square Degree of Fr eedom Probability > Chi Square NA model
Likelihood Ratio 6.0909 7 0.5292Score 5.7566 7 0.5684Wald 5.1168 7 0.6457
DA model Likelihood Ratio 3.7424 4 0.4420
Score 3.6152 4 0.4606Wald 3.3667 4 0.4984

In all two models for the jaguar, the global null hypothesis ßi = 0 was rejected, thus indicating global goodness of fit. The NA model does not have a spatial representation (the variables built by the “nearest features” extension cannot be portrayed for the whole study region). Thus, we will restrict the references to the DA model from here. However, it is interesting to compare the resulting set of explanatory variables between this and the other model (Table 3.11). The NA model confirms the relevance of temperate montane forest as a significant explanatory (independent) variable. Furthermore, a significant negative relationship to the riverbed class could indicate that these open and wide valley areas could be low quality (and dangerous) habitat for jaguars.
Table 3.11 also shows the model with greatest support based on AIC values, for the DA model. Using a cut-off level of 0.1 for individual model coefficients, we included four explanatory variables in the DA model.
We calculated the confidence limits for the selected explanatory variables:
68
Habitat condition for focal species in the Yungas region
Parameter Degree ofFreedom
Estimate StandardError
Wald Chi-Square
Neighborhood Analysis model Intercept 1 -2.1745 0.6528 11.0949Spatial Autocorrelation 2400M 1 0.9149 0.3529 6.7208Aspect 1 -0.00198 0.00124 2.5508DEM 1 0.000635 0.000236 7.2277Rainfall 1 0.00126 0.000477 6.9532Aver. Temp. Mont. Forest patch area 1 0.000013 4.585E-6 7.6946Average Riverbed patch area 1 -0.00020 0.000078 6.4214
Distance Analysis model Intercept 1 0.7327 0.2601 7.9341Spatial Autocorrelation 2400 m 1 0.9874 0.3444 8.2221Temperate Montane Forest distance 1 -0.00005 0.000012 13.6539 Subtropical Forest distance 1 -0.00010 0.000038 6.9149Aspect 1 -0.00206 0.00123 2.8148
Pr > ChiSq
0.00090.00950.11020.00720.00840.00550.0113
0.00490.00410.00020.00850.0934
Table 3. 11. Regression analysis of the selected explanatory natural variables in the two models for jaguar.
DA model Odds ratio estimates
Effect Point estimate Spatial Autocorrelation 2400 m 2.684Temperate Montane Forest distance 1.000Subtropical Forest distance 1.000Aspect 0.998
95 % Wald confidence limits 1.367 5.2711.000 1.0001.000 1.0000.996 1.000
Table 3. 12. Wald confidence limits for parameters of Distance Analysis model (DA).
Distance model Item Value Index Value Percent Concordant 73.4 Somers' D 0.471Percent Discordant 26.3 Gamma 0.472Percent Tied 0.3 Tau-a 0.236Pairs 17424 c 0.735
Table 3. 13. Association of predicted probabilities and observed responses.

Distance modelA complementary measure of the regression function capability: the ROC curve assessment, gave us additional insights of the models performance.ROC statistics in this case produced an AUC of 0.701 (Figure 3.5). An alternative interpretation of this value is that in 70 % of all cases for a randomly chosen area with presence, a greater presence probability is being calculated than for a randomly chosen area with non-presence (Fielding and Haworth 1995, Pearce and Ferrier 2000, Schadt et al. 2002).
It implies a model with a reasonable capability to predict the occurrences (and non-occurrences) of jaguars. However, this value should be taken cautiously. Moreover, local considerations related with habitat quality should be taken into account to improve the model. Nonetheless, the probability map associated to the model (Figure 3.6) can serve as a preliminary orientation to identify priority areas at a regional scale. It also permits a region-wide analysis and the design of a potential network of corridors among reserves (Chapter 4). The model discrimination, measured by the AUC, assesses the level to which the model successfully ranks presence sites higher than absence sites across the region as predicted probability of presence. Models presenting high AUC values will provide reliable ranking of areas in terms of habitat value. This evaluation is appropriate when the objective of the model is to rank or prioritize areas of interest in terms of their relative value as habitat for a species (Wintle et al. 2005). It is our case in Yungas.
GIS spatial interpolationAs a final output of the logistic regression models (both built only with natural variables) a probability function P for the Distance model was obtained (equation 2):
69
Chapter 3 – Habitat condition for focal species
Figure 3. 5. ROC curve for the Distance model.

From this function, we produced a probability occurrence map (as a base to assess Jaguar habitat areas): a grid with a resolution of 100 m x 100 m. With this map, it is possible to identify several zones with high occurrence probability (Figure 3.6).
Human variablesIn this case the explanatory capability of the model was lower. The AUC was 0.6537. It constitutes an intermediate case between the random model (0.5) and models with reasonable explanatory power (0.7 - 0.9).
Mixed model: natural and human variablesFinally, the mixed model with human and natural variables resulted in a selection that only contained natural variables. Thus, these results confirm the capability of the natural variables as explanatory variables of jaguar presence.
70
Habitat condition for focal species in the Yungas region
Figure 3. 6. Jaguar habitat probability map of the DA model.

Jaguar mortality preliminary modelMantel test results indicate a weak spatial autocorrelation between points with Jaguar presence. (Table 3.14).
Scale-dependent spatial autocorrelation analysis, as described in the Methods sections, did not reveal spatial autocorrelation of Jaguar presences at any scale.
Logistic Regression Analysis for jaguar mortality (as a special case of the DA model)
The global null hypothesis for the beta coefficients (ß) was performed using Likelihood ratio, Score and Wald tests. The global null hypothesis in all cases was rejected, thus providing evidence of model goodness of fit.
The model with greatest support (i.e. lowest AIC value) included three significant explanatory variables (Slope classification, Riparian patch area distance and Riverbed patch area distance). We then conclude that these variables have a relationship with jaguar mortality, and indirectly reflect dangerous habitat conditions, or what could be termed “attractive sink” conditions (see Naves et al. 2003, Delibes et al. 2001). Landform appears as having less significance (Table 3.17).
71
Chapter 3 – Habitat condition for focal species
MANTEL TEST RESULTS: Randomization (Monte Carlo test) method r = Standardized Mant el statistic 0.062693Observed Z (sum of cross products) 0.334082E+09 Average Z from random ized runs 0.316901E+09 Variance of Z from r andomized runs 0.102409E+15 Minimum Z from randomized runs 0.291228E+09 Maximum Z from randomized runs 0.357800E+09 p (type I error) 0.054000
Table 3. 14. Mantel test for jaguar mortality data.
Criterion Intercept Only Intercept and Covariates AIC 135.753 132.582SC 138.636 144.114-2 Log L 133.753 124.582
Table 3. 15. AIC analysis.
Test Chi-Square Degrees of Freedom Probability > Chi Square Likelihood Ratio 9.1705 3 0.0271Score 9.5451 3 0.0229Wald 8.6065 3 0.0350
Table 3. 16. Global null hypothesis tests of the Beta coefficients.
Parameter Degree of Freedom Estimate Standard Error Wald Chi-Square Pr > ChiSq Intercept 1 -2.1142 0.5209 16.4747 <.0001Slope classification 1 0.2621 0.1584 2.7381 0.0980Riparian distance 1 0.000039 0.000020 3.7844 0.0517Riverbed distance 1 -0.00009 0.000046 3.7692 0.0522
Table 3. 17. Regression analysis of the selected explanatory natural variables for mortality.

We also calculated the confidence limits for the selected explanatory variables:
ROC for the mortality preliminary modelThe value for the area under the ROC curve (AUC) for this model was 0.63. This result demonstrates low discriminative ability for this model. Nonetheless, the model is considered useful for inferential purposes, that is, to evaluate a statistically significant relationship of model parameters to Jaguar presence.
DISCUSSION
The habitat model presented here should be considered a model of regional applicability. This means that its usefulness is limited to the argentine Yungas context or, as a possible extrapolation, to the neighboring Bolivian rainforest extending to the north. The selected habitat model (DA) is partially based on distal variables (aspect) and it constitutes a model restricted to a specific location, as opposed to a model based on proximal variables.
If we consider the DA model, there is a gradual change in probability (Figure 3.6). The zones identified as having a higher jaguar presence probability (considered also of higher habitat quality, personal observation) are in Calilegua and Baritu National Park and the habitat area strip that crosses the two Kolla community territories (Finca Santiago and Tinkunaku) in a N-S direction. The establishment of a corridor linking these three areas, Baritu, both Kolla territories and Calilegua, should be a priority for a regional plan of habitat sites conservation, in view of the existing evidence generated by the selected model. In chapter 2, we also identified these as areas with a low probability of land use change (Figure 2.9). From the land use analysis we found that the native forest in the Yungas already covers more than 75 % of the study area (Chapter 2). From percolation theory it is inferred that those regions where randomly distributed habitats occupy more than 59% of a landscape, these tend to form large, contiguous patches spanning the landscape (Gardner et al. 1987). This could be the current situation in the Yungas, where a continuous strip percolates the landscape. We will expand on this aspect in Chapter 4. The areas to the E of Baritu NP would be a valuable addition to it and would allow connection with Pintascayo Provincial Park. However, this approach should consider the interests of the Kolla community. Also, an economic compensation from the federal government could pay the opportunity cost linked with a possible special zoning for conservation of the considered areas (attending the special restrictions for land use defined by federal law).
72
Habitat condition for focal species in the Yungas region
Table 3. 18. Wald confidence limits for parameters.
Table 3. 19. Association of predicted probabilities and observed responses.

In relation to conservation zoning, it should be considered that to maintain a “key” population of 200 individuals, i.e. a population that has an extinction probability less than 5 % in 100 years, (Verboom and Pouwels 2004) the demand of habitat in relation to the referred home range would be around 3,000,000 ha. The whole study area is less that half of this requirement. This fact indicates that the connections with Bolivia and to the south of the study area must be seriously considered to maintain population viability. Considering the predictions of more severe higher order effects in the tropics from the loss of key species like the jaguar (potential faunal collapse), it is strongly recommended to ensure the population viability of top predators as a critical aspect of the ecosystem in any conservation scheme (Sanchez Alonso 2002).
Our habitat model included the aspect of independence of observations. It is a central prerequisite for applying most statistical methods. From the three possible solutions (Guisan and Thullier 2005) to this problem: (i) correcting the number of degrees of freedom used in model inference tests; (ii) adding a spatial autocorrelation (SAC) term to the linear predictor until no more spatial structure can be detected in the residuals (Lichstein et al. 2002); or (iii) (re)sampling plots at sufficient spatial distance to avoid autocorrelation (Guisan and Theurillat 2000), we choose the second. We found this solution as a way to deal with the autocorrelation problem but knowing, however, that a SAC term is reflecting either an environmental and/or biological spatial structure not explained by the model. Therefore, these models can hardly be extrapolated to other situations in space and/or time. This is because the spatial arrangement of environmental gradients might differ between ranges (e.g. current and future).
We consider this model an adaptive framework, regarding the habitat assessment obtained from it and its predictive capability. In this framework, the models can be iteratively updated and refined as new data (and more comprehensive data types, like telemetry and resource use data) becomes available (Wintle et al. 2005). However, if we need to identify potential areas relevant for conservation, the model and the probability surface generated by it are a useful starting point. Future work related to the validation of this model would entail the collection of an independent data set within the areas of highest probability of jaguar presence (for example, with the aid of a camera trap network). To deal with habitat availability rigorously, data related with use of particular habitat types by Jaguars (like data from telemetry assessments) would significantly improve the model (Katnik and Wielgus 2005). Also, additional habitat models for other focal species should be developed for the design of an ecological network. In this manner, it could be possible to obtain a more comprehensive scheme for effective regional habitat management (the landscape cohesion approach in van Rooij et al. 2003, Opdam et al. 2006). Also, we need to improve our ocelot data set not only as a base to develop a habitat model (at local scale) but also to assess habitat availability for this species and to search for possible overlaps with jaguar habitat in Subtropical montane forest (Perovic 2002a).
Our model fits with previous research on jaguar habitat preferences covering a larger study area. Temperate montane forest and the Subtropical montane forest were identified as the “vegetation strata” (Chapter 1) where jaguars were most frequently detected. (Perovic 2002a). These two ecosystems are included in our habitat model. The fog grassland stratum also mentioned by Perovic (2002a) did not appear as significant in our model. Aspect is the third variable and could be reflecting a particular forest structure typified by denser vegetation of eastern slopes that are preferred by jaguars.
73
Chapter 3 – Habitat condition for focal species

As mentioned before, an enlarged, improved data set could also augment the chances of building a more powerful jaguar mortality model. This mortality model, together with complementary research on the regional cattle production systems (and their vulnerabilities to predators) could aid in the identification of the principal aspects of the existing jaguar - cattle production conflict. This conflict must be solved or mitigated because it is posing a management dilemma between conservation agencies and the local communities in the entire region (Perovic 2002b).
Considering that the species studied (jaguar and ocelot) and the environmental data were sampled during a limited scope in both dimensions: time and space, our model can only reflect a snapshot view of the relationship species - environmental context (Guisan and Thullier 2005). Hence, a convenient working hypothesis is to consider that the modeled species is in pseudo-equilibrium with its environment (Guisan and Theurillat 2000). Therefore, a monitoring scheme could not only improve the fit of the model (with additional data) but also evaluate potential effects of habitat change due to different causes (e.g., climatic changes, different land use conversion rates, etc.). These changes could modify the species - environment relationship that shaped the current species distribution, reflected in the habitat map. This working hypothesis also highlights the need of a monitoring scheme as an imperative for continuous data gathering to support an adaptive, sustainable, regional conservation planning initiative.
Finally, we want to present some aspects of our model in relation to Austin (2002). We focused on distal variables because the availability of data and the feasibility of model them with GIS. Moreover, the importance of distal and proximal variables varies with the ecological context. The distal variables were shown to be important near the limits of a species distribution while proximal variables assumed more relevance as predictors under more optimal conditions for the species (Austin 2002). For the jaguar the Yungas is referred as the limit of its current distribution (Ojeda 1999, Tabeni et al. 2004). Furthermore, the distal variables are also suited where gradients are steep and environments are extreme, which is also the configuration of our study area. In the cases where the environment is changing slowly and a species is occupying its optimal realized niche, then proximal variables will be more successful predictors.
Finally, as a principle, we agree that the habitat modeling strategy is a context-sensitive design process.
74
Habitat condition for focal species in the Yungas region

75

ABSTRACT
In this chapter, we aimed to evaluate landscape connectivity at regional scale, using the jaguar habi-tat model proposed in Chapter 3. Connectivity was managed as a species and landscape specific parameter. The jaguar was used as a focal species to perform the assessment of connectivity among habitat patches in the region. We applied percolation theory, graph theory and a range of analytical tools based on this conceptual framework. These tools were a landscape ecological metric: correla-tion length -C- and its derived indexes for patch evaluation: I -Normalized Importance Index- and A -per area importance index-. These two indexes were applied to the analysis of individual patch relevance. To carry out the connectivity analysis public domain landscape ecology software and widespread GIS were employed. An evaluation of vulnerability - i.e. conflict areas in association with possible land use conversions-, is included as an additional evaluation of the proposed corridors design (the proposed nature conservation area would increase among 7% or 31% in its size, depend-ing on corridor width). Finally, the implications of the corridor design and the viability analysis in a participatory planning process with involvement of stakeholders are discussed.
This chapter is being submitted to Environmental Modeling and Assessment.
CHAPTER 4The design of biological corridors and the landscape connectivity
77

CONTENTSINTRODUCTION 79METHODS 81Cost matrix design and least cost analysis 81Viability analysis 82Connectivity analysis 83RESULTS 88Resistance Matrix design and least cost analysis 88Connectivity analysis 90DISCUSSION AND CONCLUSIONS 97
FIGURESFigure 4. 1. Biological corridors development and viability analysis 81Figure 4. 2. Connectivity analysis 86Figure 4. 3. The spatial strategy: the parks are connected by biological corridors and habitat patches (as stepping stones) 89Figure 4. 4. The habitat availability: habitat patches selection and biological corridors 90Figure 4. 5. Landscape cluster evolution with increasing threshold distances (high quality habitat patches and biological corridors) 92Figure 4. 6. Evolution of correlation length and number of clusters of habitat patches at increasing threshold (dispersal) distances for the focal species 93Figure 4. 7. Sensitivity profiles: Normalized importance index (I) at increasing distances (10, 20 and 51.3 km). Patches are presented in order by size (ha) 94Figure 4. 8. Relevant patches (indicated by the patch ID number) selected by normalized importance index (I) and per area importance index (A) at 51.3 km (the threshold distance when the landscape percolates and all the patches are connected) 95Figure 4. 9. Viability analysis: corridors, habitat patches and areas with high probability of conversion 96
TABLESTable 4. 1. Dimensions of the corridors 90Table 4. 2. Evolution of number of clusters, total amount of habitat and correlation length with threshold distances 91Table 4. 3. Viability analysis and probability of conversion of the biological corridors and habitat patches 96
78
The design of biological corridors and the landscape connectivity
INTRODUCTION
Our aim in this chapter is to present the design process of a set of biological corridors to link the existing parks in the study region. It constitutes the basis of a future ecological network. Beyond the two-decade debate about the role of corridors (Simberloff and Cox 1987, Noss 1987, Merriam and Lanoue 1990, Simberloff et al. 1992, Beier and Noss 1998, Haddad et al. 2000, Chardon et al. 2003, Haddad and Tewksbury 2005) we conceive them as a way to maintain landscape connectivity (Davies and Pullin 2006). To carry out the design of the corridors we previously analyzed land use in the Yungas (Chapter 2) for the period 1973 - 2000 and formulated a habitat model (Chapter 3). The objective of this chapter is to quantify the landscape connectivity and use this assessment as a complement for decision making.
The current land use trends in Yungas must be taken into account together with the theoretical connectivity model foundations (patch-corridor-matrix, see Forman 1995). In the eastern zone of the study area, the deforestation process for new farmland acts as the principal driving force leaving native forest patches isolated from each other (Chapter 2). These remnant forest islands are prime quality habitat areas for the majority of native fauna species. To assess their habitat condition (at the landscape level) for the development of corridors, two main aspects should be taken into account: fragmentation and connectivity. Habitat fragmentation is defined as a process during which “a large expanse of habitat is transformed into a number of smaller patches of smaller total area, isolated from each other by a matrix of habitats unlike the original” (Wilcove et al. 1986). Habitat fragmentation quantitatively implies four effects (Fahrig 2003) of the process of fragmentation on habitat pattern: (a) reduction in total amount of habitat, (b) increase in number of habitat patches, (c) decrease in sizes of habitat patches, and (d) increasing isolation of patches. These four effects form the basis of most quantitative measures of habitat fragmentation and were partially analyzed in Chapter 2.
Habitat fragmentation is one of the most commonly cited threats to species extinction and ensuing loss of biological diversity, making it perhaps the most important contemporary conservation issue (Wiens 1996). The inverse of landscape fragmentation, landscape connectivity, is considered a vital element of landscape structure (Taylor et al. 1993) because it is so critical to population survival (Fahrig and Merriam 1985, Fahrig and Paloheimo 1988, D`Eon et al. 2002). The capability of wildlife to move between these habitat islands is referred to as connectivity, or in other words: “the degree to which the landscape facilitates or impedes movement among resource patches” (Merriam 1984, Taylor et al. 1993).
From a network perspective, we can also define connectivity (Merriam 1990, van Langevelde 1998) as a property of some locations (habitat patches and corridors) to maintain spatial or functional relationships with other locations in terms of flows of entities (materials, energy, animals, etc.). As a result of the functional relationships (connectivity) among them, the locations constitute an ecological network.
Connectivity assessments can be distinguished in three classes of increasing detail level: structural, potential and actual connectivity (Calabrese and Fagan 2004). Structural connectivity (connectedness) is inferred from physical attributes of the landscape (size, shape, and location of habitat patches) but does not factor in dispersal ability. Potential connectivity combines physical attributes of the landscape with some limited information about dispersal capabilities to predict how connected a specific
79
Chapter 4 – Design of biological corridors and landscape connectivity

landscape or patch will be for a focal species. The type of limited dispersal information can include estimates of mobility derived from body size or energy budgets (Cresswell et al. 2000, Porter et al. 2000), or some measurements with low spatial detail (e.g.: mean or maximum recapture distances from mark-recapture studies -Clark et al. 2001-). Actual connectivity refers to observation of movements of individuals related to the analyzed patches, or through a landscape. It provides a solid estimation of the linkages between landscape elements or habitat patches. Given our specific condition of data availability (presence data and some preliminary information related to the two focal species -jaguar and ocelot- movement) we will focus on potential connectivity.
We also want to effectively manage large areas for habitat connectivity. We already mentioned the need to know which specific qualities are relevant to wildlife habitat not only for movements, but also for breeding and refuge (Naves et al. 2003). These specific qualities are related to the fact that habitat and habitat connectivity are not only species specific (van Langevelde 1999) but also landscape specific concepts (Tischendorf and Fahrig 2000, Theobald 2002). In other words, connectivity depends on the singular interaction between a particular species and the landscapes in which it occurs. In this interaction, species vagility is one of the most relevant determinants of landscape connectivity. Hence, many researchers advocate an organismal perspective when addressing landscape connectivity (Wiens 1989, Fahrig 2000). Therefore, landscape connectivity must be considered at the scale of the interaction between a particular species and the landscape. As a result, a landscape is not inherently fragmented or connected, and can only be assessed in the context of a species` ability to move among patches and at the scale at which the species interacts with the landscape (Davidson 1998, With 1999).
Consequently, we concentrated on two feline species to perform these two analyses: habitat availability (Chapter 3) and connectivity. These species are jaguar (Panthera onca) and ocelot (Leopardus pardalis). Reasons to choose these two felines (Linders et al. 2003) were already presented in Chapter 3. Briefly, they both are target species for the regional conservation strategy -particularly the jaguar-, their habitat will change under current conditions without management, and both felines have relative large area needs and are sensitive to habitat loss (and particularly, in relation to jaguar requirements, an avoidance of highly disturbed areas: Quigley and Crawshaw 1992, Hatten et al. 2005). Owing to scarcity of ocelot data and the impossibility to develop a habitat quality model for this species, hereafter we focus only on jaguar. Our center of attention will be on habitat selection for movements between the parks: Baritu, Pintascayo Lagoon and Calilegua. It is useful to keep in mind that this connectivity analysis is referred to a particular landscape: the north region of the Argentinean Yungas. A specific research may find a remarkable effect of connectivity for a particular species in a particular landscape, but those findings may not hold in other context, even the same species in other landscapes with different structure (Goodwin 2003). Nonetheless, the method developed here could be transferred to other contexts.
The analysis of connections between natural reserves has been a concern in the conservation literature for the past twenty years. In the article that launched the term “connectivity” in landscape ecology, Merriam (1984) defines that a landscape is connected if the structures in the landscape that serve similar functions can be reached from one another. Among the different (and relevant) landscape structure functions, conservation planners usually strive to increase connectivity among habitat patches across the landscape. They try to facilitate seasonal migration or permanent dispersal in the event that some habitat sites in the landscape could be lost by deforestation, urbanization or other ways of conversion. Here, we analyzed this aspect of connectivity.
80
The design of biological corridors and the landscape connectivity

METHODS
Cost matrix design and least cost analysisWe performed a two stage analysis (Figure 4.1). First, we assessed the habitat quality of the landscape matrix among the parks. Then, as a second stage, we appraised the viability of the selected areas in relation with their probability for conversion.Our habitat quality model was the base to analyze possible connections in the study area. It is a product of a logistic regression analysis based on jaguar presence (Chapter 3).
We used the habitat model as a base to develop the resistance surface to obtain the least cost lines (biological corridors). The resistance grid was obtained according to the following syntax in Arc GIS: 1 - (habitat model probability grid). Therefore, the values with the highest probability values of jaguar presence were assumed to have the least resistance to movement. These corridors are considered as having less resistance for jaguar movement. It is important to mention that there are no records of jaguar roadkills in the region.
81
Chapter 4 – Design of biological corridors and landscape connectivity
Figure 4. 1. Biological corridors development and viability analysis.

Considering this surface, we performed a least cost path analysis using Pathmatrix v. 1.2 (Ray 2005 and Ray, unpublished) to obtain the potential corridors. Pathmatrix is an Arc View (ESRI ®) freeware extension. Pathmatrix can use either Euclidean or least cost distance. It requires as inputs a cost matrix (that could be also a set of grids) and targets to connect by least cost polylines. In our case the cost matrix was the probability surface grid (of jaguar presence) from the habitat model but transformed in a resistance grid (as mentioned before) and the targets were the three parks (Baritu, Pintascayo and Calilegua). The final output of the program is a set of polylines linking the polygons (the parks) and the connections are designed connecting all the polygons.
In the Yungas, the forest matrix is not severely fragmented, with the exception of the San Francisco river valley area (along the principal transport axis). There, the conversion to agriculture has created clearly defined and isolated forest patches. Outside the valley, in the gentle transition from the remaining piedmont forest areas to the west mountain ranges, habitat quality varies moderately over the landscape. Aggregating this variability into discrete patches would be inappropriate. In this case a model based on a continuous surface (a field model) could provide a better representation of the landscape (Urban and Keitt 2001). This is fundamental to our selection of a least cost path analysis procedure to define the ecological corridors. Also, the least-cost path technique is useful to land managers, since the cost surface (or cost matrix) can be parameterized with the highest quality available data. Then, the surface can be tailored to features in the landscape for which the manager has direct field knowledge. The surface can be tuned as more and better data becomes available, e.g. satellite collar tracking, camera traps, etc. (Bunn et al. 2000).
An essential aspect of Pathmatrix for our study is that the program considers the border of the polygons instead of their centroids. This is relevant when large patches are evaluated. It adds precision to the determination of the least cost path lines that are the basic definition of the corridors. Pathmatrix delivers both: least cost path but also metric distances along the cost path for each polyline.
Viability analysisThe habitat model grid was then combined with the Land Use and Cover Change model (the final output of Chapter 2: LUCC probability in Figure 4.1). From the LUCC model we identified the probability of change of the selected high quality habitat patches (hereafter: habitat patches). We identified locations that had a high probability of conversion (Probability equal or more than 0.6). We used this probability to develop a viability assessment of the habitat patches in relation to the tendency of the areas to conversion to farmland. It is a singular aspect of our research: the habitat and landscape connectivity considerations are assessed jointly with land use change probabilities for the region to develop a final picture. This analysis aims to integrate both expectations from these divergent interest groups (farmers and corporations versus nature conservationists) regarding land use of the Yungas territory. We employed the Arc View extension Grid Tools ( Jenness 2006) to associate the values of the LUCC probability grid to the corridors and habitat patches by a clipping operation. Then we converted this grid to vector format and combined it with the parks coverage to exclude from the viability analysis the zones that are part of the parks.
We conceived the final output as a set of “viable” ecological corridors. We referred to these as “viable” because we simulated how vulnerable were the corridors (and the habitat patches) to the conversion process, incorporating probabilities of deforestation location from the LUCC analysis (Veldkamp
82
The design of biological corridors and the landscape connectivity

and Lambin 2001). We use the term “simulation” to portray a potential situation where an advanced fragmentation process has occurred, affecting landscape connectivity. This corridor design can be the base for a future ecological network. The viability here is expressed as a location that has a lower probability to land cover conversion (probability based in the LUCC model presented in Chapter 2 confronted with the habitat model of Chapter 3). This conversion process is sensed as a threat to natural places (e.g. Pressey et al. 1996, Cowling et al. 1999, Garson et al. 2002,). Therefore, the final output would be depicting the most stable (less conversion oriented) areas.
Connectivity analysisWe wanted to evaluate how much habitat patches are integrated in the network design, and also (as a management output) to identify which areas are more important in a regional conservation strategy. It is possible to characterize this situation by landscape ecology tools: the landscape metrics that appraise connectivity (also called landscape spatial indices). Regrettably, ecological literature is flooded with different connectivity metrics (Ritters et al. 1995, Gustafson 1998, Hargis et al. 1999, McGarigal 2002). Therefore, the selection of suitable metrics is not simple and should be made cautiously. Beside the different theoretical perspectives, connectivity metrics differ in two important aspects: the data type required and (as an output of the connectivity assessment) the level of detail that the metrics depict (Calabrese and Fagan 2004).
We solved the tradeoff between available information and data type requirements picking out the graph theoretic approach based on percolation theory (Gardner et al. 1987, Gardner et al. 1989, Gustafson and Parker 1992, Cantwell and Forman 1993, Keitt 1995, Keitt et al. 1997, Urban and Keitt 2001). It may yield the greatest benefit to effort ratio for conservation problems that require characterization of connectivity at relatively large scales. Indeed, this approach provides a reasonably detailed picture of potential connectivity with relatively modest data requirements (Calabrese and Fagan 2004).
The connections (regarded as edges in graph theory) between all pair wise combinations of habitat patches are defined by considering the dispersal capability of the focal species. The connections are allowed if the patches are at a distance less than or equal to the measure of dispersal ability. Some measures of dispersal ability include a typical threshold distance for dispersal (Keitt et al. 1997, D’Eon et al. 2002) or a random design from a dispersal kernel. For a given species, the probability of dispersal would decline rapidly for distances beyond the critical threshold (van Langevelde 2000). Alternatively, a dispersal kernel is a function describing the relationship between dispersal distance and a species’ probability of dispersal (e.g. Kot et al. 1996, Havel et al. 2002). An advantage of these methods is that they allow simulation of the loss of habitat patches and dispersal corridors. Then, the results can be used to rank habitat patches by their contributions to landscape-level connectivity (Keitt et al. 1997). The graph-theoretic approach could therefore allow land managers to make decisions based on selected patches identified as most critical to landscape connectivity. We selected the threshold distance option because it could be directly linked to our current knowledge of the autoecology of the focal species.
Our approach builds up from spatial data of occurrences and some preliminary data of dispersal ability based on satellite telemetry (Perovic, pers. comm.) of the focal species (jaguar): daily range movements of the one jaguar female tracked with a satellite collar. This female was tracked during
83
Chapter 4 – Design of biological corridors and landscape connectivity
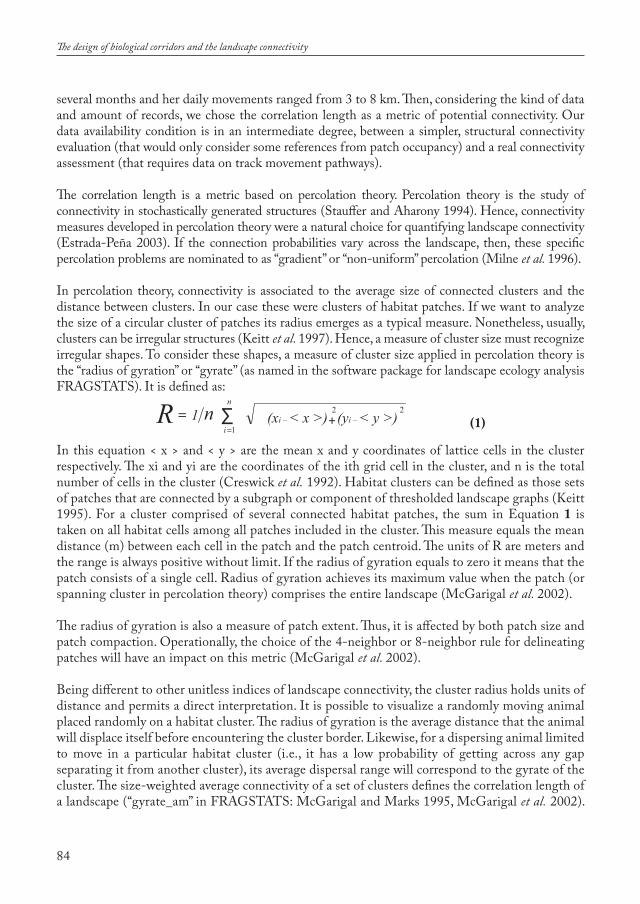
several months and her daily movements ranged from 3 to 8 km. Then, considering the kind of data and amount of records, we chose the correlation length as a metric of potential connectivity. Our data availability condition is in an intermediate degree, between a simpler, structural connectivity evaluation (that would only consider some references from patch occupancy) and a real connectivity assessment (that requires data on track movement pathways).
The correlation length is a metric based on percolation theory. Percolation theory is the study of connectivity in stochastically generated structures (Stauffer and Aharony 1994). Hence, connectivity measures developed in percolation theory were a natural choice for quantifying landscape connectivity (Estrada-Peña 2003). If the connection probabilities vary across the landscape, then, these specific percolation problems are nominated to as “gradient” or “non-uniform” percolation (Milne et al. 1996).
In percolation theory, connectivity is associated to the average size of connected clusters and the distance between clusters. In our case these were clusters of habitat patches. If we want to analyze the size of a circular cluster of patches its radius emerges as a typical measure. Nonetheless, usually, clusters can be irregular structures (Keitt et al. 1997). Hence, a measure of cluster size must recognize irregular shapes. To consider these shapes, a measure of cluster size applied in percolation theory is the “radius of gyration” or “gyrate” (as named in the software package for landscape ecology analysis FRAGSTATS). It is defined as:
In this equation < x > and < y > are the mean x and y coordinates of lattice cells in the cluster respectively. The xi and yi are the coordinates of the ith grid cell in the cluster, and n is the total number of cells in the cluster (Creswick et al. 1992). Habitat clusters can be defined as those sets of patches that are connected by a subgraph or component of thresholded landscape graphs (Keitt 1995). For a cluster comprised of several connected habitat patches, the sum in Equation 1 is taken on all habitat cells among all patches included in the cluster. This measure equals the mean distance (m) between each cell in the patch and the patch centroid. The units of R are meters and the range is always positive without limit. If the radius of gyration equals to zero it means that the patch consists of a single cell. Radius of gyration achieves its maximum value when the patch (or spanning cluster in percolation theory) comprises the entire landscape (McGarigal et al. 2002).
The radius of gyration is also a measure of patch extent. Thus, it is affected by both patch size and patch compaction. Operationally, the choice of the 4-neighbor or 8-neighbor rule for delineating patches will have an impact on this metric (McGarigal et al. 2002).
Being different to other unitless indices of landscape connectivity, the cluster radius holds units of distance and permits a direct interpretation. It is possible to visualize a randomly moving animal placed randomly on a habitat cluster. The radius of gyration is the average distance that the animal will displace itself before encountering the cluster border. Likewise, for a dispersing animal limited to move in a particular habitat cluster (i.e., it has a low probability of getting across any gap separating it from another cluster), its average dispersal range will correspond to the gyrate of the cluster. The size-weighted average connectivity of a set of clusters defines the correlation length of a landscape (“gyrate_am” in FRAGSTATS: McGarigal and Marks 1995, McGarigal et al. 2002).
84
The design of biological corridors and the landscape connectivity

The correlation length: C (equation 2) of a set of clusters is calculated by:
In this equation, m is the number of clusters of patches and ns is the number of grid cells of habitat in the cluster s (Creswick et al. 1992). Correlation length also has distance units, like radius of gyration. The correlation length thus stands for the average distance that an individual is able to disperse before reaching a barrier if localized randomly on the landscape, weighted by the area of patches. The correlation length is a measure of the structural continuity or connectedness of the focal habitat. It is based on a measure of the extensiveness of each patch as measured by the radius of gyration (McGarigal 2003).
Correlation length can be employed as an overall measure of habitat connectivity in a landscape: an increase in its magnitude would reflect an increase of landscape connectivity (Keitt et al. 1997, Binzenhöfer et al. 2005). We calculated correlation length (Figure 4.2) using FRAGSTATS 3.3 (McGarigal et al. 2002).
Initially, we selected high quality habitat patches from the habitat model (developed in Chapter 3). These habitat patches constitute a chained patch structure in the continuity of the forest along the highlands in the western portion of the study area.
To perform the selection we defined two minimum thresholds of habitat quality obtained from the habitat model: 0.85 and 0.90 (the upper limit is 1.0). For the 0.85 class, we defined a minimum patch size of 500 ha. For the 0.90 class, we defined a lowest limit of 1000 ha. These sizes are related to management considerations of the conservation agencies and seem suitable for the Yungas context, the focal species, and the extent of the study area. These “artificial patches” (the existent configuration is a continuous forest cover that extends in a North - South direction, in the western mountainous sector of the study area) could be considered as a spatial working hypothesis. Also, it was viewed as a possible basis to define a scheme of conservation priorities and institutional resource allocation as stepping stones for jaguar movement. Moreover, it reinforces a conservation objective that could become unclear if only the least cost path polylines (the corridors) were visualized. Once this set of high quality habitat patches was defined, we calculated correlation length in two different ways: 1) for the whole study area: landscape correlation length, and, 2) by an iterative removal of particular connections between patches, to determine the individual contribution from each patch to the landscape correlation length.
85
Chapter 4 – Design of biological corridors and landscape connectivity
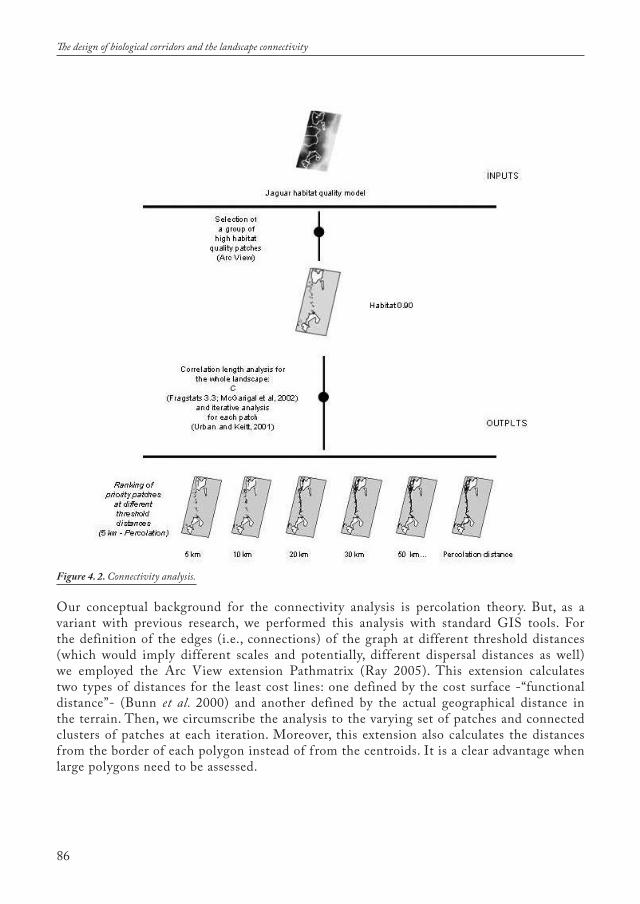
Our conceptual background for the connectivity analysis is percolation theory. But, as a variant with previous research, we performed this analysis with standard GIS tools. For the definition of the edges (i.e., connections) of the graph at different threshold distances (which would imply different scales and potentially, different dispersal distances as well) we employed the Arc View extension Pathmatrix (Ray 2005). This extension calculates two types of distances for the least cost lines: one defined by the cost surface -“functional distance”- (Bunn et al. 2000) and another defined by the actual geographical distance in the terrain. Then, we circumscribe the analysis to the varying set of patches and connected clusters of patches at each iteration. Moreover, this extension also calculates the distances from the border of each polygon instead of from the centroids. It is a clear advantage when large polygons need to be assessed.
86
The design of biological corridors and the landscape connectivity
Figure 4. 2. Connectivity analysis.

Our objective was to assess not only the overall landscape connectivity, but also to obtain local evaluations of patch connectivity. For this purpose, we removed all edges (corridors) to one patch at a time to assess its influence on landscape connectivity (Keitt et al. 1997, Rothley and Rae 2005). Since the effect of disconnecting a patch depended on scale, we replicated the patch disconnection analysis for all the distance thresholds (starting at 5 km) up until the landscape begins to percolate (51 km in our study). Thus, it constituted a multi-scale approach for this assessment. When all connections to a particular patch were removed, a new landscape configuration was obtained. The resulting clusters (subgraphs in graph theory) were then identified and a new correlation length was registered. We evaluated the change as follows: C(d) is the correlation length of the landscape graph, thresholded at distance d, and C(dk) is the correlation length after removal of all edges (connections) to patch k. Then, the Normalized Patch Importance index I(dk) reflects the contribution of patch k to the landscape connectivity for a given maximum dispersal distance d. It was calculated as (equation 3):
There C(dk) is the correlation length of the landscape graph when all connections to patch k are removed. The effect of connection removal is that patch k becomes its own cluster. We applied connection removal rather than patch removal because it is improbable that the habitat patches linked by the biological corridors will be immediately converted to non-habitat (Rothley and Rae 2005). Patches with high I(dk) are considered “stepping stone” or “cut node” patches for distance d because their removal produces a high loss of connectivity in the graph. This normalized, unitless index allows the evaluation of the relative contribution of each patch to landscape connectivity. We selected as priority patches those included in the third quartile.
As a realistic feature, we designed two buffer classes of 1000 and 5000 m of total width to the defined edges (connections) as a simulation of real-life corridors. These two widths are presented as alternatives for planning and potential negotiation starting points with the stakeholders. The dimensions of the buffer are based on preliminary daily jaguar movement values from the Yungas of 3 – 8 km (Perovic, pers. comm.). We analyzed the increase in area designated to nature conservation for the two corridor classes proposed. For the correlation length analysis we only used the 1000 m wide buffer. We looked to avoid a strong influence of the wider corridor type (5000 m width) as additional habitat area. Through this analysis, at each iteration, we could identify each corridor with its corresponding ID analytically and the IDs of the patches linked, from a query database operation (not by visual inspection). A new, improved version of Pathmatrix (version 1.2; Ray, unpublished) was developed specially for this research. This version not only assigns an ID to each corridor but also identifies the origin (“FROM”) and destination (“TO”) patch (considering an N – S order of corridor creation). This special feature of the extension allowed the corridor removal operation. Then, in the analysis of the cluster together with the patch that was “disconnected”, we eliminated the related corridors. The Arc View extension “Buffer theme builder” (O’Malley 1999) transfers attributes from the original features to their buffers, maintaining the IDs of each corridor and the two patches (origin and destination) related.
Patches can contribute to landscape connectivity in two ways. The largest patches contribute by their sheer size, adding habitat area to the set. Other smaller but strategically situated patches can make
87
Chapter 4 – Design of biological corridors and landscape connectivity

a substantial contribution to the correlation length and consequently, to landscape connectivity. The contribution of large patches is self-evident; the smaller, strategically-located patches need to be identified and can become relevant targets in a regional habitat conservation plan.
Mainly, we considered the biological corridors (least cost path lines) that link the habitat patches and allow the connection of the parks, but we also analyzed those corridors connecting other habitat patches not connecting parks. These two perspectives highlight the spatial strategy that represents the parks and corridors and the existing habitat availability in the region (a chain of high quality habitat patches).
We also evaluated a metric that incorporated the importance of the area of patches into our connectivity analysis. We applied the Per Area Importance index, A (Keitt et al. 1997), to quantify each patch’s contribution to overall landscape connectivity per unit area (equation 4):
Here, n ( i ) is the number of habitat cells in patch i and ac is the area of a grid cell. The per area importance index A has units of 1/area, e.g., km-2. Again, we considered as priority patches those included in the third quartile.
RESULTS
Resistance Matrix design and least cost analysisThe outputs from the least cost path analysis are a set of polylines (Figure 4.3). These polylines represent the biological corridors (we show only the 1 km-wide corridors but the design is the same for the 5 km-wide corridors). The corridors run mainly in an N-S direction, partially crossing the Kolla community territories. Table 4.1 summarizes the dimensions of corridors (one km width is presented as a preliminary value suitable for the Yungas context). We also related the increment of land devoted to nature conservation (the current extension is the whole parks areas: 160,500 ha).
88
The design of biological corridors and the landscape connectivity

89
Chapter 4 – Design of biological corridors and landscape connectivity
Figure 4. 3. The spatial strategy: the parks are connected by biological corridors and habitat patches (as stepping stones).

The corridors themselves show the most suitable areas that wildlife and specifically the jaguars could use for movements. However, we realize that these least-cost path linear features should be complemented with areas for refuge and breeding, as well as stepping stones for movement. These paths are designed to approximate the actual distance the focal species covers displacing itself from one patch to another (Bunn et al. 2000).
Connectivity analysisWe performed two selections for habitat quality considering minimum threshold values of 0.85 and 0.90. The lower value (0.85) produced a continuous strip of eleven patches (165,000 ha). It could appear too extensive for a prioritization procedure but nevertheless defines a sub region of critical habitat areas (Figure 4.4). The second selection rendered a set of eighteen patches (29,000 ha) strategically located along the corridors. Most are situated in the corridor that links Calilegua and Baritu.
90
The design of biological corridors and the landscape connectivity
Corridor type Corridor section Length (km) Ha1 km wide corridors
3 - 2 (Baritu to Pintascayo) 6 589
3 - 1 (Baritu to Calilegua) 109 10,186
Total area (ha) 10,775
% increment in conservation area
5 km wide corridors
3 - 2 (Baritu to Pintascayo) 6 3,067
7
3 - 1 (Baritu to Calilegua) 109 47,564
Total area (ha) 50,631
% increment in conservation area 31
Table 4. 1. Dimensions of the corridors.
Figure 4. 4. The habitat availability: habitat patches selection and biological corridors.
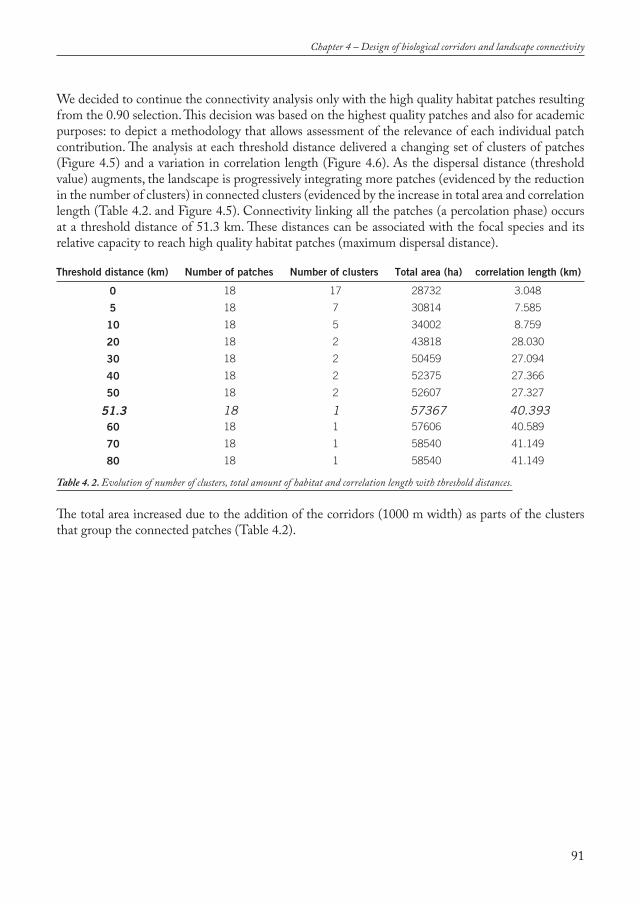
We decided to continue the connectivity analysis only with the high quality habitat patches resulting from the 0.90 selection. This decision was based on the highest quality patches and also for academic purposes: to depict a methodology that allows assessment of the relevance of each individual patch contribution. The analysis at each threshold distance delivered a changing set of clusters of patches (Figure 4.5) and a variation in correlation length (Figure 4.6). As the dispersal distance (threshold value) augments, the landscape is progressively integrating more patches (evidenced by the reduction in the number of clusters) in connected clusters (evidenced by the increase in total area and correlation length (Table 4.2. and Figure 4.5). Connectivity linking all the patches (a percolation phase) occurs at a threshold distance of 51.3 km. These distances can be associated with the focal species and its relative capacity to reach high quality habitat patches (maximum dispersal distance).
The total area increased due to the addition of the corridors (1000 m width) as parts of the clusters that group the connected patches (Table 4.2).
91
Chapter 4 – Design of biological corridors and landscape connectivity
Threshold distance (km)
0
5
10
20
30
40
50
51.360
70
80
Number of patches
18
18
18
18
18
18
18
1818
18
18
Number of clusters
17
7
5
2
2
2
2
11
1
1
Total area (ha)
28732
30814
34002
43818
50459
52375
52607
5736757606
58540
58540
correlation length (km)
3.048
7.585
8.759
28.030
27.094
27.366
27.327
40.39340.589
41.149
41.149
Table 4. 2. Evolution of number of clusters, total amount of habitat and correlation length with threshold distances.
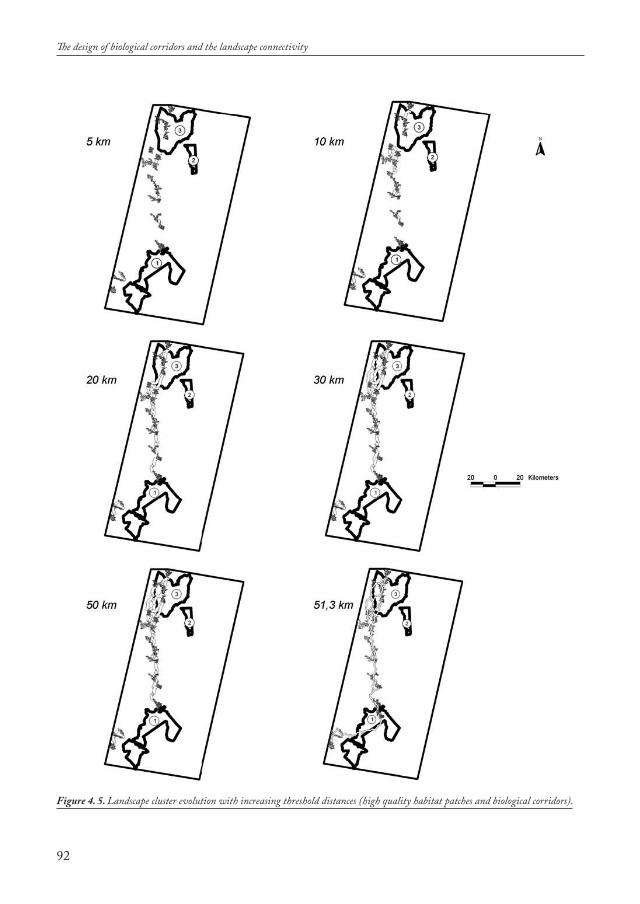
92
The design of biological corridors and the landscape connectivity
Figure 4. 5. Landscape cluster evolution with increasing threshold distances (high quality habitat patches and biological corridors).

We can distinguish three connectivity phases (Figure 4.5 and Figure 4.6):a) Disconnected phase: at a threshold value of 5 to 10 km, the landscape appears disconnected. However grouping is initiated and decreases from 9 to 5 clusters when more patches become connected.b) Transitional phase: at 20 km the number of connected patches increases. Two clusters are defined: one very large and a smaller one to the southwest. The larger cluster already connects the two national parks. This phase is maintained up to a threshold distance of 50 km.c) Connected (percolation) phase: at 51.3 km the whole landscape is connected forming a continuous, spanning cluster.
This changing condition from lower to higher connectivity with a non linear, step-like behavior is usual in the correlation length (Figure 4.6). The non linear response habitually occurs associated with the percolation threshold (Neel et al. 2004).
Taking advantage of the possibilities given by correlation length analysis we identified priority patches at each threshold distance (different scales are implied). We consider the variation of I (normalized importance index: Figure 4.7) and A (per area importance index).
93
Chapter 4 – Design of biological corridors and landscape connectivity
0
2
4
6
8
10
12
14
16
18
0 5 10 20 30 40 51 60 70 80
threshold distance (km)
number of
clusters
0.00
5.00
10.00
15.00
20.00
25.00
30.00
35.00
40.00
45.00 correlation length (km)
number of clusters correlation length (km)
Figure 4. 6. Evolution of correlation length and number of clusters of habitat patches at increasing threshold (dispersal) distances for the focal species.

94
The design of biological corridors and the landscape connectivity
Figure 4. 7. Sensitivity profiles: Normalized importance index (I) at increasing distances (10, 20 and 51.3 km). Patches are pre-sented in order by size (ha).

In relation to the threshold distance that is being evaluated, the patches with highest priority could vary. The comparison of I at different thresholds indicates the relevant patches which, once removed, determine disruptions in the “chain” disaggregating the clusters formed.
We highlighted the results at a threshold distance of 51.3 km as our reference case for the individual patch contribution assessment to landscape connectivity because at this threshold distance all the patches are connected. In the assessment of patch contribution to connectivity by I (normalized importance index), the relevant patches were: 8, 9, 10, 11, and 12 (Figure 4.8). At this threshold, (the threshold distance when the landscape “percolates”), these six patches are essential to maintain the integrity of the whole cluster that crosses the landscape from N to S. When A (per area importance index) was considered, the patches that emerged as critical to landscape connectivity are the same except for patch 8 which is not a priority in the latter analysis (A) but patch 16 is included. All the patches are in a relatively narrow size range (from 1000 to 4400 ha). Therefore, we could think that the different values of I and A are mostly related to the position of these patches to articulate the whole chain and to preserve the integrity of the spanning cluster.
Finally, if we consider that for the focal species (jaguar), the relationship between medium (Perovic, pers. Comm.) and maximum dispersing individuals (Crawshaw 1995) is between 8 to 50 km, it is reasonable to assume that the whole landscape is connected for jaguars. We come to this conclusion because our threshold for percolation of the highest quality habitat patches is 51.3 km. However, this statement should be supported by additional jaguar movement data to get a more sound appreciation of how the
95
Chapter 4 – Design of biological corridors and landscape connectivity
Figure 4. 8. Relevant patches (indicated by the patch ID number) selected by normalized importance index (I) and per area impor-tance index (A) at 51.3 km (the threshold distance when the landscape percolates and all the patches are connected).

focal species is interacting with the habitat and how permeable to movement the habitat is. Moreover, our habitat model was conceived as a continuous gradient of habitat quality. Indeed, organisms most likely perceive habitat suitability along a gradient and travel along routes that facilitate their movement (Taylor et al. 1993, With et al. 1997, D`Eon 2002). Thus, further research on jaguar-habitat interactions should substantially improve understanding of the connectivity condition in the region.
Viability analysisWe combined the set of potential corridors and habitat patches (Figure 4.4: habitat class 0.9) with the LUCC regression model (Chapter 2). We then identified locations that had a high probability of conversion (probability > 0.6).
Our results showed (Figure 4.9 and Table 4.3) that only 37 ha from 57,664 ha that are part of the corridors and the habitat patches have a probability of change equal to or higher than 0.6.
96
The design of biological corridors and the landscape connectivity
Figure 4. 9. Viability analysis: corridors, habitat patches and areas with high probability of conversion.
Table 4. 3. Viability analysis and probability of conversion of the biological corridors and habitat patches.

DISCUSSION AND CONCLUSIONS
The methodology proposed is founded on graph theory, which has been applied to landscape analysis in many studies (Keitt et al. 1997, van Langevelde 2000, Bunn et al. 2000, Fuller et al. 2004). However, this approach was frequently applied only as an experimental basis and with tools that were not accessible for all the conservation planning community. Significantly, in this thesis we demonstrated that standard GIS tools can be applied to the analysis based on graph theory. Moreover, we avoided some of the pitfalls related with previous developments like the use of centroids as a basis to define the edges (corridors). This approach could cause errors in case of large patches overestimating the inter-patch distances, measured between centroids and not between edges (van Langevelde et al. 1998). Our approach overcame this problem by considering the real boundary of each patch to calculate both: Euclidean or least cost path lines as corridors.
Also, beyond the base software used (Arc View), all the extensions used to calculate the corridors (Buffer theme builder by O’Malley 1999 and Pathmatrix by Ray 2005) are free and public domain software. Thus, our approach is open to be applied by other researchers with the only cost charge of Arc View, a relatively inexpensive GIS. This particular combination of a standard GIS and free domain extensions can largely extend the application of the graph theory conceptual scheme to real world contexts.
The correlation length analysis was our basis to investigate individual patch contribution to habitat connectivity. It is important to mention that our patch definition was on the basis of the habitat model created for jaguar: habitat “patches” are those portions of habitat that have a greater probability of presence. Thus, our patch definition from the Yungas context is principally for analytical purposes. In the present, a traditional patch-matrix condition of the landscape is not evident in the western portion of the study region associated to jaguar presences. However, this approach allowed us to define the chain structure that would deserve a protected area status (including high-priority habitat patches and potential corridors between these patches). For conservation-setting applications, this definition is spatially more explicit than the habitat model presented in Chapter 3. It is, ultimately, not only a simple descriptive connectivity analysis but also, permits the determination of a prioritization criterion for the identification of critical habitat patches (Pascual Hortal and Saura 2005). However, we believe that this potential connectivity assessment (limited to only one species) is only an initial appreciation of the regional habitat condition. Jaguar movement data obtained through telemetry (e.g. by satellite collars) and monitoring (e.g. by a camera trap network) is required to corroborate the habitat model developed with logistic regression based on presence data (Chapter 3). Hence, this assessment should be considered with caution until more specific habitat-use data becomes available.
The study area in the Yungas region can be considered as an N-S continuum of montane forest because the elevation shaped vegetation strata have a spatial continuity in the western sector. Natural physical attributes, such as its relief and accessibility, have restrained land use conversion. However, future land use conversion must be monitored to prevent a fragmentation process in key areas. The applied methodology permitted us to identify the “spinal cord” of the chain (from the habitat model). Moreover, we also identified potential “stepping stones” that could allow the maintenance of this “spinal cord”, preserving the areas of highest habitat quality. Consequently, it is of utmost
97
Chapter 4 – Design of biological corridors and landscape connectivity

importance to predict where this habitat strip could be transformed by deforestation or other conversion processes. In these areas, the connections with the high-quality habitat patches and the parks could be threatened because of their farming potential. We can perform this analysis using the LUCC regression model of Chapter 2 and simulations in a Decision Support System. This is the main objective of Chapter 5. Meanwhile we identified those areas of corridors and high quality habitat patches most imperiled to be deforested and converted. This landscape viability analysis (Lambeck 1997, Lambeck 1999) should become a usual procedure in corridor design or ecological network planning (Rothley and Rae 2005), beyond the different procedures available to achieve it. The habitat quality assessment for the design of corridors and habitat patches to be included in an ecological network should be complemented by a parallel appraisal of their values for other land uses. It is a way to avoid a dangerous situation of “ecological apartheid” and unilateral planning formulation.
The selection of alternatives for corridor design (in our case, a corridor width of 1 or 5 km) is a trade off to resolve with a larger knowledge base about the autoecology of the focal species, the species movement pattern and the acceptance of this zoning by the stakeholders in relation to their activities and priorities. The corridor design selection and the designation of high quality habitat patches as habitat areas with a legal protection status is a pending discussion matter in the Yungas. We analyze the farming potential as the principal factor of conversion. However, for the local people the continuity of ranching activities is essential. The coexistence of ranching and conservation appears as a very difficult problem to resolve in the current context. Initially, some management changes could mitigate the principal aspects of vulnerability of the current ranch production system (Perovic, pers. comm.).
The viability analysis employed allowed us to infer how the designed corridors and habitat patches could be affected if the conversion process would progress in the current context. In case of a different result (corridors and habitat patches immersed in areas of high conversion probability) this viability analysis could indicate: a) a different and more viable corridor design, even if these new areas included would be of lower habitat quality or b) the need of a negotiation process with the different interest groups, to assign conservation status to the corridors and habitat patches selected beyond their relevance as farmland areas. Both strategies would be complementary and necessary in a participatory decision process with the stakeholders (Menon et al. 2001, van Rooij et al. 2003).
The different appreciations of stakeholders and conservation institutions concerning the areas with potential for other land uses (e.g.: farming, housing, etc.) that can be included in corridors or habitat patches is a potential source of conflict. Worldwide, (and the Yungas is not an exception) the parks are already regarded by some local communities as a form of “ecological apartheid” (Saunders 2000, Campbell 2000, Sullivan 2001). Therefore, the new ecological infrastructure (corridors and habitat patches as stepping stones) could also be viewed as a new, even more intrusive, top-down intervention. These common interventions by the Argentinean National Parks Administration in the past ignored traditional community socio-economic dependence on wildlife, manifesting itself in an antagonism through illicit use. This is the reason why we suggest the convenience of a viability analysis for corridor implementation, considering the need to identify possible conflict areas for the regional planning process. These areas are usually destined by the stakeholders as future clearings for cropland. A previous identification can prevent conflictive situations.
98
The design of biological corridors and the landscape connectivity

Lastly, a major point is to reach a consensus on the need for the conservation of landscape connectivity. In relation to this concern, the landscape connectivity metric that we selected to rate patch importance, i.e. correlation length, is measured in units of distance (kilometres). It has an additional value in a participatory environment: it is straightforward and easy to interpret. It also provides a visual message when presenting results to a broader audience (Rothley and Rae 2005), mainly for the stakeholders that are participating in the land use planning process. To be sustainable, land use planning can be viewed as a social platform of negotiation and consensus building supported with the best scientific information possible ( Janssen et al. in press). Neither the conservation authority nor the farmers and agribusiness corporations should think of themselves as contenders in a battle (we disagree in this point with Robertson and Hull 2001). We envision land use planning as a shared platform where all the interest groups must work (sometimes earnestly) to reach a management agreement. This agreement fundamentally should aspire for the medium and long term regional sustainability and the continuity of natural processes.
99
Chapter 4 – Design of biological corridors and landscape connectivity


101
ABSTRACT
An analysis by scenario modeling of alternative futures with separate prioritizations for different interest groups (as a support for this regional analysis) is presented. It was conceived as an analysis platform for a participatory process of territorial planning. The three scenarios were developed on the base of potential land uses, different simulated accessibility conditions and visions from regional in-terest groups (farmers, politicians, nature conservationists). Additionally, an evaluation of the prob-ability model of land use change and its predicting capability of possible location of new clearings was performed taking advantage of an independent source. The spatial configuration of the three scenarios allowed the modeling of possible expansion of farmland areas, different configurations of wildlife habitat availability and alternative landscape connectivity. These configurations were evaluat-ed as well as the possible influence of the modeled scenarios on the corridors design (Farmland area would increase 64 and 84 % respectively in two of the scenarios if new developments are allowed). An application of an experimental pattern measure for map comparison is presented.
This chapter is being submitted to Land Use Policy.
CHAPTER 5Alternatives for a decision framework for landscape connectivity
in the Yungas region
CONTENTSINTRODUCTION 103The sub continental dimension of land use planning decisions in the Yungas 105METHODS 106 The Yungas Spatial Decision Support System 110 Analysis of the Corridor viability in the three scenarios 114RESULTS 115 Scenario assessment 116Fuzzy Kappa application – Farmland expansion and pattern comparison 119SCENARIOS OUTCOMES - SPECIFIC ANALYSIS 120 Business as usual 120 Regional Development 121 Accessibility analysis 121 Biodiversity and Ecotourism 121Corridor configuration in the scenarios 122DISCUSSION 124CONCLUSIONS 126
FIGURESFigure 5. 1. The Yungas (high basin of the Bermejo River) as a component of the Paraná - Plata system and the location of the Iruya River sub basin in the study area 106Figure 5. 2. Ecotope design procedure 111Figure 5. 3. Analysis of the performance of the LUCC model to predict farmland areas of 2002 115Figure 5. 4. Scenario design rules and land use status of the final outcomes 117Figure 5. 5. Land use pattern of the scenarios: “business as usual” (BAU: left), “regional development” (RD: centre)and “biodiversity and ecotourism” (BE: right) 118Figure 5. 6. Representation of the major land use classes in the planned scenarios 119Figure 5. 7. Comparison of scenarios: the additional farmland areas are showed in black 120Figure 5. 8. Comparison of accessibility conditions in the scenarios: Business as Usual -BAU- and Biodiversity and Ecotourism -BE- (left); Regional Development -RD- (right) 121Figure 5. 9. Comparison of the corridors conditions (5 km width) in the scenarios: Business as Usual -BAU- (left), Regional Development -RD- (center) and Biodiversity and Ecotourism -BE- (right) 123
TABLESTable 5. 1. Scenarios conception: design rules affecting precursors and attractors 108Table 5. 2. New markets - tourist centers and transport nodes that become accessible by the new transport infrastructure - the rationale of their selection 109Table 5. 3. Farmland areas in 2002 (SEMADES 2003) and validation of LUCC probability model 115Table 5. 4. New farmland areas and correlation length (landscape connectivity metric) by scenario 116Table 5. 5. Comparisons of Fuzzy Kappa values among scenarios for the farmland class 120Table 5. 6. Land use classes representation of the corridors of 1 km width 122Table 5. 7. Land use classes representation of the corridors of 5 km width 122
102
Alternatives for a decision framework for landscape connectivity

INTRODUCTION
The objective of this chapter was to appreciate alternative futures by depicting scenarios of land use. We also evaluated the consequences of these alternative land use scenarios on the regional balance between productive uses and the conservation of nature and ecological processes (focusing on landscape connectivity).
Traditional planning is frequently based upon the belief that the application of professional expertise to attain well-defined goals would guarantee efficient and effective management (Peterson et al. 2003). Nevertheless, such plans sometimes do not consider the variety of local conditions or the propensity for novel and unexpected situations (Scott 1998). This blindness to diversity and surprise, which is often accompanied by a false certainty about the efficacy of management, can lead to costly failures (Holling and Meffe 1996). These failures could be difficult to mitigate if they are related with natural resources management and regional planning.
Particularly, those regions that have a rich availability of natural resources are visualized as opportunities from different interest groups looking for possible business development. Conflicts between these interest groups and uncertainty of future land use are two major problems in decision-making for nature conservation and species protection. Conflicts usually involve nature conservation goals, socio-economic expectations for progress, better quality of life and/or productive goals. These conflicts happen because nature conservation often demands space, but the same space is also an important production factor (Drechsler 2004) for other land uses: farming, ranching, transport infrastructure, dam development, mining, urbanization, and other activities (van Langevelde et al. 2002, Bontkes and Keulen 2003, Zwarts et al. 2006). Frequently, these other uses impose pressure on the conservation of natural landscapes and biodiversity. Moreover, planning of new developments could be at the cost of nature integrity or, inversely, could favor the recovery or at least the mitigation of former impacts on the natural values in a new stage. This future stage of a specific region could come from possible states and conditions that are known as scenarios in the planning terminology. These scenarios are outlines of the hypothetical future of a territory (Steinitz et al. 2003). But the central idea of scenario planning is to consider a variety of possible futures that include the most relevant uncertainties in the system rather than to focus on the accurate prediction of a single outcome (Peterson et al. 2003). In practice, it consists of using a few contrasting scenarios to explore the uncertainty encompassing the future consequences of possible decisions. Ideally, scenarios should be developed by participation of the interest groups in a systematic process of collecting, discussing, and analyzing scenarios that constructs shared understanding for a single, state purpose.
Scenario planning is slightly similar to adaptive management (Walters 1986), an approach to management that also incorporates uncertainty. What distinguishes them is that management experiments are built into land use models. When experimental manipulation is possible, traditional scientific approaches (optimal control, adaptive management) are effective at answering questions (Medawar 1984, Peterson et al. 2003). Scenario planning is most useful when there is a high level of uncertainty about the system of interest and manipulations on the system are difficult or impossible. It has been used in different fields, but has not been used much in conservation (but see Twedt et al. 2005, Drielsma and Ferrier 2006). The major benefits of using scenario planning in conservation are (1) identification and increased understanding of key uncertainties, (2) incorporation of alternatives into conservation planning, and (3) greater resilience of decisions to unexpected conditions (Peterson et al. 2003).
103
Chapter 5 – Alternatives for a decision framework for landscape connectivity
In the planning process the complexity of real world problems and the consideration of relationships in large spatiotemporal scales face the planner to a dilemma. This dilemma is how to deal with the complexity itself and the large areas and/or long periods implied. To circumvent this, the common approach is to simplify the case study focusing on the most substantial relationships only. This complexity reduction renders “models” as a partial, simplified representation of reality. The application of these models to channel a decision is an approach referred to as decision support systems: DSS. The DSSs now serve at least four broad purposes: to aid research, orient management, communicate knowledge, and present the assessment of tradeoffs in an open, public environment. All the DSS share two broad features: simplification and translation. The simplification necessary to understand the model needs the translation between reality and the model system (Bunnel and Boyland 2003). Then the “envisioned futures” in the model are simulated as scenarios. These computer simulated scenarios are a way to investigate the possible outcomes of policy options and decisions.
Evaluating alternative futures by a scenarios-based methodology on a qualitative level is a common procedure. Nevertheless, a presentation including spatial aspects is time consuming and geospatial data demanding. The kinds of models to deal with this particular problem are referred as spatial decision support systems (SDSS). The SDSSs include modeling, visualization, and spatial analysis capabilities. These systems can help planners and policy makers to make choices considering the spatial arrangement of potential land uses. The use of a SDSS also facilitates the evaluation of certain measures and enables the simulation of different actions, potential developments and/or planning targets. This process is known as cyclic planning. Moreover, a SDSS is applicable on different scales, from regional policy-making level (e.g. 1:250.000 - 1:100.000) (Twedt et al. 2005) to local (e.g. 1:10.000) design level (Nidumolu et al. 2006).
A model like a SDSS can be an instrument to present the different trends, driving forces and actors that are part of the decision process in a territory. Thus, some clear definitions are needed to develop such a model. The basic requirements are related with the characterization of the processes that drive the landscape. To carry out this characterization some simplification and schemes have to be developed. Among them, the model characteristics have to be contextualized in a defined space and time. The characterization of the model must allow the description of the landscape by its system attributes. To accomplish the analysis and simulations, a typology of all the attributes is needed. Also, the need to combine these with additional data and calculation rules could be possible ( Jongman 2005).
It should be recognized that only recently the GIS world has integrated specific modeling classes of functionality for decision modeling. These are now included in the core functionality of major GIS software. Some examples comprise location-allocation modules and business-oriented demographic tools (USGS 2001). What has made this possible is the inclusion of the underlying algorithms into the GIS topological data structures. These models can be invoked directly into the GIS interface (with no extensive reprogramming) to work on spatial data and instantly provide the “what if ” functionality that is at the heart of the DSS concept.
Finally, it is considered that SDSS’s do not provide just answers per se; they allow the decision makers to ‘think with the data’. A current DSS will not replace the decision makers, but instead, it should be a tool to promote their participation (Rubiano 2002). It should add more transparency to the decision process, especially (von Haaren and Warren-Kretschmar 2006) at the stage of the participation of administrators, managers and politicians (the moment of “real decisions”).
104
Alternatives for a decision framework for landscape connectivity
The sub continental dimension of land use planning decisions in the Yungas
The immediate geographic framework of this study is the upper basin of the Bermejo River. But, the Bermejo River is actually one of the principal affluents from the Paraná - Plata Basin (the others main rivers are Pilcomayo, Paraguay, and Uruguay). The Paraná and the Uruguay rivers meet at the head of the ‘Rio de La Plata’ (herein after: Plata River), which forms the world’s largest estuary. The Plata Basin drains about one-fourth of the South American continent (Figure 5.1) and, with a surface of 3,100,000 km², is the 5th largest river basin in the world. It covers 17% of the continental surface across five countries: Brazil (which accounts for 46% of the basin), Argentina (27.5%), Paraguay (13.5%), Bolivia (9%), and Uruguay (4%). In addition, it has a combined population of 208.5 million inhabitants (1997). Furthermore, the pool of hydroelectric power of the Paraná - Plata sector has the biggest potential in the world.
The Upper Bermejo River Basin comprehends 53,000 km2 of highlands and mountains in southeast Bolivia and northwest Argentina. The mean annual flow of the Bermejo River in the upper basin is 445 m³/s. The mean sediment concentration of the Bermejo River is 7 - 8 kg/m3 at its outlet in the upper basin. In this upper basin, the Bermejo River specifically has soil conservation problems in the sub basin of the Iruya River. Deforestation for cultivation and widespread overgrazing has already caused severe problems of erosion in some areas of the Iruya River sub basin (Rafaelli 2003b). It is aggravating sediment movement that has contributed to downstream environmental degradation. The soil materials produced by surface erosion only, transported from the upper basin of the Bermejo river, amounts 18.5 million m3/year. The sediment accumulated from the Iruya - Pescado River system constitutes approximately 50% of this total sediment of the Bermejo river system (Del Castillo 2003). The total contribution of fine sediments from the Bermejo to the Paraná - Plata system is approximately 100 million tons/ year (30 % of the total sediment charge of the Paraná river). The sub basin of the Iruya River is subject to different erosion processes with soil saturation, erosion by overland flow and land sliding. It is located in the Kolla community territory of Finca Santiago (Chapter 2), at the heart of the study area (Figure 5.1).
Therefore, conservation of the Argentinean Yungas (upper Bermejo basin) and land use planning to avoid uncontrolled deforestation constitutes one of the principal factors that determine sedimentation processes of the Paraná - Plata Basin. Therefore, this land use planning has influence not only at regional but also at a sub continental scale.
Historically, conservation decisions in the Yungas have been driven primarily by opportunity and the establishment of parks occurred on discrete tracts of land by acquisition or donation. We recognize that opportunity is not necessarily random, but concomitantly, we stress that opportunity is likely not biologically strategic. Intrinsically, conservation and land use planning decisions in the Yungas have lacked strategic landscape-level focus (Twedt et al. 2005).
105
Chapter 5 – Alternatives for a decision framework for landscape connectivity

METHODS
The land use analysis, completed in Chapter 2, and the resultant land use and cover change (LUCC) probability model was one of our inputs for the design of the spatial decision support system. This model did not address questions about the timing and rate of land-cover conversions. Nonetheless, the kind of LUCC model (spatial probability model) developed in Chapter 2 can be employed as a simulation tool to support decision-making and policy formulation (Seernels and Lambin 2001). This LUCC probability model allowed us to predict where land-cover conversions are most likely to take place in the near future and the current regional context. As well, we also incorporated the habitat model of Chapter 3 and the corridor design from Chapter 4 to assess the possible impacts from the scenarios outputs on habitat availability and landscape connectivity.
There are two principal approaches to develop alternative futures (Steinitz et al. 2003). One is based in a small number of alternative plans for future land use/land cover change. These plans are expressed as spatially defined development patterns representing interest group priorities (conservationists, developers, farmers, realtors, etc.) or single dominant policy plans (transport, mining, farming, tourism, etc.). They have an explicit spatial expression and their potential consequences are comparatively assessed. This approach is straightforward and its simplicity is both at the same time, strength (simple
106
Alternatives for a decision framework for landscape connectivity
Figure 5. 1. The Yungas (high basin of the Bermejo River) as a component of the Paraná - Plata system and the location of the Iruya River sub basin in the study area.

and direct to develop) and a weakness (sometimes the simplification results misleading and also, it is difficult to identify the full set of policies needed to achieve the future represented by the scenario). Many planning studies used this approach and we applied it in this research (Steinitz et al. 2003).The other approach attempts to identify the most important issues responsive to planning and policy decisions together with the range of options belonging to each issue. Then, the scenarios are created reflecting different possible combinations of options. The resulting scenarios are used to direct the allocation of land uses employing a model of the process of development. The different alternatives are evaluated for their consequences. This approach is highly demanding in preliminary data. Both approaches are useful to assess the outcomes of plans for regions where political/social tension exists regarding the assignation of land uses and land use policies.
If we define a scenario as a structured account of a possible future (Peterson et al. 2003) then the scenarios depict futures that could be, rather than futures that effectively will be (Raskin et al. 1998, Drielsma and Ferrier 2006). Therefore, our scenarios are feasible according to the current regional context and some specific changes. The convenient number of scenarios is generally considered to be three or four. Two scenarios usually do not enlarge thinking enough, whereas more than four could confuse users and limit their capability to explore uncertainty (van der Heijden 1996, van der Heijden 2005). We designed three scenarios and then we evaluated their possible consequences. We named them “Business as usual”, “Regional Development” and “Biodiversity and Ecotourism”.
We considered some precursors and attractors acting in synergy with the driving forces that are operating at different scales: local, regional and global (Chapter 2). Precursors are some landscape characteristics that can determine limited cause-effect relationships of landscape change. Attractors are site characteristics that attract a driving force likely to induce change. These concepts are especially powerful to include when modeling different scenarios (Bürgi et al. 2004). The scenarios were designed by a combination of different sources (Table 5.1). These are official documents for the Bermejo River Binational Commission (BRBC) (Rafaelli 2003, Cabinet Coordinator Minister - Argentine Government 2004), the National Biodiversity Strategy (Argentinean government 2005) and the planning guidelines from National Parks.
We also considered the influence of current culture and development paradigms as drivers of landscape change promoting different, and sometimes opposite visions about development perspectives for the Yungas in the near future (Paul et al. 2003, Dros 2004, Gasparri et al. 2004, Pacheco et al. 2005). A “control” scenario (without any change) was also included for comparison of landscape connectivity metric values. We intentionally excluded the time dimension. It would require additional (unavailable) data and our focus was on the spatial aspects.
107
Chapter 5 – Alternatives for a decision framework for landscape connectivity

Some additional description can help to grasp the principal characteristics of each scenario and its “flavor”:
Business as usual (BAU): the development of new farmland areas was based on the LUCC probability model. Those areas with probability of conversion ≥ 70 % became new farming areas. The transport infrastructure was maintained without modification and also there were no substantial changes: the native forest was mostly affected in the eastern lowlands but not in the N - S habitat strip that connects the Parks.
Regional Development (RD): an aggressive government policy followed the market driven changes. This policy dramatically modified the accessibility conditions of the areas with potential for farming. The paving and improving of the existing unpaved roads determined that new markets became reachable and new “emerging” transport nodes became functional in the regional context. Therefore, a new accessibility evaluation was performed applying the Arc View based extension of Farrow and Nelson (2001) considering the improved and extended transportation network. Other cities were also included as regional markets (which already were the principal tourist destinations of Jujuy province). Other towns were also included as local development centers (principally as nodes from the transport network of farm production and local supply centers of fuel, agrochemicals, tools, communications, etc.). There is a rationale underlying this process, depicted in Table 5.2.
Alternatives for a decision framework for landscape connectivity
108
Scenarios
Landscapecharacteristics Business as usual (BAU) Regional Development (RD) Biodiversity and Ecotourism
(BE)
Changes in Transportinfrastructure
No change New paved routes cross the whole region. Practically the whole region can be accessed. Improved railway functioning (along the principal transport axis)
Some new routes (scenic, narrow with low impact) are paved to access the most valuable scenic areas
Forest managementpolicy
deforestationallowed in flat and gentle slope areas (“farming hills”: contouring and terracing required)
deforestationallowed in flat and gentle slope areas (“farming hills”: contouring and terracing required)
No deforestation allowed
PRECURSORS
ATTRACTORS
Marketsaccessibility
No change New transport nodes and regional markets are available for commerce and delivery
Two regional tourist centers (asnew regional markets) can be accessed. The interconnection with their tourism flows is increased.
Table 5. 1. Scenarios conception: design rules affecting precursors and attractors.

Implementation of this scenario includes a new probability estimated by the logistic regression model of LUCC (equation 1 and Chapter 2) because the substantial modifications (extension of paved roads was increased 180 %) in the accessibility conditions:
In this model, we modified the factor that can most easily be altered by human activity: travel time. Chapter 2 presented the considerations that link LUCC processes with accessibility conditions.
Following the improvement of the transport network, an intense deforestation process reshaped the region with potentially dangerous environmental outcomes. It mainly affected watershed protection, water storage and water production regional capability. This deforestation also implied geomorphologic hazards threatening the safety of villages and towns in the valleys due to potential landslides and floodings, the preservation of energy infrastructure and, paradoxically, the usage
109
Chapter 5 – Alternatives for a decision framework for landscape connectivity
New accessible regional markets (and tourist attraction centers)
Markets
Humahuaca
Tilcara
Nodes
Isla de Cañas
LosNaranjos
Los Toldos
ValleGrande
Sector
Humahuaca ravine (HR)
World heritage cultural landscape (UNESCO)
Sector
Finca Santiago Kolla Community Territory
Tinkunaku Kolla Community Territory
Baritu National Park influence area
Calilegua Highlands
Selection basis
Transport node centers
Selection basis
Principal tourist centers of Jujuy province: provincial government wants to “redirect” some part of its large tourism flow (2003: 55, 000 visitors) to Yungas (2003: only 20,000 visitors). The HR has the largest number of visitors per year in Jujuy province (Tourism Secretariat – Argentine Gov., 2004) and together with the wineries of the Calchaqui Valley in Salta (outside study area), these are the principal tourist attractions of the Argentine Northwest.
Facilities: primary and secondary school, hospital, municipal-ity headquarters, energy supply, telephone, internet, kolla community center.
Facilities: primary and secondary school, basic medical assistance, VHF radio, pivot location between other Tinkunaku villages (Rio Blanquito, Angosto del Parani and San Andres). It is also the closer village to Oran city.
Largest town in the east of Santa Victoria Oeste Department Facilities: primary and secondary school, hospital, energy supply, municipality headquarters, public telephone, internet.
Administrative center of Valle Grande Department Facilities: primary and secondary school, first medical aids, energy supply, public telephone.
Table 5. 2. New markets - tourist centers and transport nodes that become accessible by the new transport infrastructure - the ratio-nale of their selection.
(a + ß1 * Soil class + ß2 * Travel time + ß2 * Slope)
P = e (1)(a + ß1 * Soil class + ß2 * Travel time + ß2 * Slope)
1 + e
conditions of the newly paved roads system. As well, a state policy carried out the implementation of new irrigation systems in the region. Then, as a result of the expansion of farming areas the gross regional product substantially rose.
Biodiversity and Ecotourism (BE): based on existing binational agreements, Argentina and Bolivia through the Bermejo River Binational Commission (BRBC) decided to carry out a particular nature watersheds conservation policy in the Yungas region overcoming the existence of an international border. Because of its importance for the Bermejo River Upper Basin in particular, and its consequences on La Plata - Paraná system in general, the BRBC defined the conservation of the upper basin as a priority. Therefore, no new deforestations were allowed. In potential farming areas only silvopasture and restricted agroforestry activities were permitted. Complementarily, the BRBC encouraged an ecotourism policy with small grants for development of hostels and cabin complexes in the highlands. The program was exclusively developed for local communities. The program also included a new energy supply system and a water supply infrastructure. Specific restoration programs were also evolved covering riverine sectors and some overgrazed areas in the highlands. New roads connected the Yungas with the Humahuaca ravine, but these were narrow, specially designed scenic routes.
The Yungas Spatial Decision Support SystemOur purpose in developing the Yungas SDSS (YSDSS) was to create a scenarios based model of the study area. The model evaluated the effects of changes in the land use, accessibility, and management measures in relation with potential farmland areas and then, their consequences on the availability of habitat and landscape connectivity. First, and founded on the abiotic regional scene, we carried out the determination of the physiotopes (homogeneous units defined on the basis of abiotic patterns and processes) (Verweij 2005). Then, combining the physiotopes with the vegetation classes and the land use current condition (some classes were used as masks: urban, current farmland -updated at 2002-, riverbed and parks) we delineated the ecotopes: homogeneous units defined on basis of land cover or vegetation types and physiotopes (Figure 5.2). We carried out the analysis in OSIRIS (Verweij 2005). The OSIRIS environment resulted as a very flexible framework to formalize the different alternatives that are included in the scenarios. It was also a platform to define the typologies of measures, physiotopes and ecotopes.
The typology for the Yungas ecotopes is based on:• The regional topography as principal background defining the different sub basins, slope class areas and the drainage network with its river systems.• The soil classes and their potential for farming.• The vegetation types and their related potentials for wildlife habitat (particularly for the focal species: jaguar), resource management and possibilities for production of commodities. We generalized the original types of natural vegetation and farmland in four classes: native forest, grasslands, riverine vegetation and farmland.• Land use and management.From these principles, the ecotopes were classified considering two general characteristics, influencing vegetation and fauna:• Morphodynamics: mechanical forces exercised by relief, rainfall, water and sediment (erosion, transport and deposit of sediment, flow of water). These morphodynamics for the Yungas new hydrological data were modeled using BASINS, a hydrological system based on Arc View (EPA 2004). It allowed the
110
Alternatives for a decision framework for landscape connectivity

processing and extraction of hydrological parameters: the river network (using the digitized streams as a base), outlets and sub basins. We used the Topographic Position Index (TPI) extension from Arc View to determine the principal slope classes (ridges and steep slopes, canyon bottom and gentle slopes, hill farms, lowlands and flat areas). This classification was carried out defining the two required parameters: 2000 m as small neighborhood circle and 10000 m as the large ( Jenness 2006).
• Land use/vegetation dynamics: to evaluate these dynamics, we focused on the consequences determined by human induced changes (i.e. changes in resource management from extensive grazing to farming). For the Yungas, satellite data was combined with expert knowledge, fieldwork control sampling and existing vegetation maps to model current vegetation (own data -Chapter 2- and SEMADES unpublished data). The modeling of change of vegetation type under scenario conditions was also based in these sources. Some land use classes, i.e., urban, current farmland (updated at 2002 by SEMADES unpublished data), riverbed and parks, were used as masks. By “masking”, we meant that these classes were not allowed to change during the scenario design process.
111
Chapter 5 – Alternatives for a decision framework for landscape connectivity
Figure 5. 2. Ecotope design procedure.

We included a validation of our LUCC model as an additional analysis (Seernels and Lambin 2001). Validation should be an essential part of any model (Kok et al. 2001). This procedure determines what kind of outputs a model produces, produces incorrectly, or does not produce (Borenstein 1998).
We compared areas with high probability of change (P ≥ 70 %) from our model with the independent analysis performed by SEMADES (Salta Province Environmental Secretariat) through a classification of a Landsat 7 ETM scene (farmland areas in 2002). The evaluation by SEMADES covered 80 % of our study area and was produced with a similar methodology that our analysis of years 1986, 1997 and 2000. We performed a GIS overlay procedure in Arc View to assess the difference between our LUCC model and the SEMADES evaluation. We considered areas ≥ 5 ha in the analysis. We performed a predictive validation, which consists of validating models using similar analysis in which the results are known. A model is driven by past input (Borenstein 1998).
We outlined the ecotopes as a generalized classification from a functional point of view. A habitat class definition was already performed in Chapter 3, but now we needed a classification scheme that depicted the potential of ecotopes for land use and cover change (LUCC). The principal change transitions considered were the conversion to farmland or the restoration to natural vegetation. Therefore, at this stage we did not need the detailed classification that could be derived from the vegetation map.
The technological or management measures implemented in OSIRIS to develop the scenario specific characteristics were those considered feasible in the current conditions. The technological changes related to farming that shaped the scenarios, i.e. contouring and terracing, have been already applied in the Yungas extensively in the most technologically advanced farms, (sugarcane corporations, Chapter 2) or evaluated as a possible application in the larger farms or used in some Kolla small farms. As well, some measures were already implemented in the past (irrigation systems with financial and technical support from the state) and can eventually be applied again.
As a final assessment we included the high quality habitat patches from the habitat regression model (chapter 3) in the analysis of the consequences of the scenarios. Then, we carried out two additional analyses:
a) Connectivity assessment: in relation with landscape connectivity each scenario was appraised through the evaluation of the landscape metric already presented in Chapter 4 (mean area weighted correlation length) and the analysis of the variations of farmland area. Only the high quality habitat patches were considered (habitat quality ≥ 0.85, see Chapter 4) as a regional prioritization. Considering that the improved and newly paved road system determines a different landscape condition, we performed an additional analysis of the paved road effect on landscape connectivity. It was only implemented for the scenarios Regional Development (RD) and Biodiversity and Ecotourism (BE). We created a 100 m buffer around the paved roads and then we analyzed the resultant correlation length.
b) Scenario pattern analysis: a comparison of the resultant farmland pattern of the three scenarios was performed with MCK 3.0 (Map Comparison Kit 3.0: Hagen-Zanker et al. 2006). MCK is a program specially developed to evaluate differences between maps using different algorithms.
Our aim was to find a method that could give a consistent evaluation of similarity. There are two
112
Alternatives for a decision framework for landscape connectivity
typical methods of map comparison: Percentage-of-Agreement and the Kappa statistic (Hagen 2003). They are supported on a cell-by-cell map comparison in which the difference between cells is crisp; the cells are either identical or they are not. It does not regard that some categories are considered more similar to each other than others. And nor does it have a certain tolerance for small spatial differences that a person would have.
The Percentage of Agreement can be calculated by dividing the number of cells that are identical in both maps by the total number of cells. A refinement of the Percentage of Agreement is the Kappa statistic (equation 2). The Percentage of Agreement (PA) is corrected for the proportion of agreement statistically expected from a random rearrangement of all cells in both maps (PE).
Frequently, in the real world, the properties of the systems are not sharply defined. Indeed, there are gradations of similarity (Zadeh 1965, Woodcock and Gopal 2000, Prasad et al. 2006). Hence, and as an advanced alternative to these two methods we have the Fuzzy Kappa (herein after FK). The FK method is also applied at comparing categorical maps. A detailed explanation of fuzzy theory and the FK algorithm is beyond the scope of this chapter but we will describe its principles and the reasons to use it. For the comparison of maps, two sources of fuzziness are considered: fuzziness of location and fuzziness of category. In this chapter, fuzziness means a certain level of uncertainty of a map. This fuzziness is not inherently present in a map, but follows from an observer’s interpretation. Fuzziness of category entails the observation that some categories in the legend of a map are more similar to each other than others. The fuzziness of location means that the spatial specification found in a categorical map is not always as precise as appears. It can be explained as a category that in the map is positioned at a specific location, but may be interpreted as being positioned somewhere in the proximity of that location.
FK produces an overall indication of map similarity (Güntner et al. 2004, Hagen-Zanker et al. 2005, Kuhnert et al. 2005). FK scales the average similarity to the expected similarity in the same manner as the (crisp) Kappa statistic. As a matter of fact, the Kappa statistic is a special case of the FK statistic in which the level of fuzziness is zero. The FK comparison method generates a fuzzy representation of each cell. This fuzzy representation does not only depend on the category taken by the cell itself, but to a lesser extent, also on the categories found in its proximity.
The exact extent to which neighboring cells influence the fuzzy representation of a cell is defined by a distance decay function (usually an exponential, linear, or constant decay: Power and Simms 2001, Hagen 2003). In other words, the distance decay function defines the penalty (Wealands et al. 2005) that is given to matching categories located some distance from the pixel of interest (the central pixel in the neighborhood). This is chosen subjectively, in relation to the level of tolerance allowed or expected. The maps are compared cell-by-cell considering both the crisp and the fuzzy representation of each cell. The result of adding fuzziness is that each pixel that previously had a single category value (e.g.: medium), then has a vector stating the likely membership of all the categories (e.g. [0.2, 1.0, 0.3] for high, medium and low respectively). It accounts for categorical and locational fuzziness. When the spatial fields are represented using fuzzy vectors (as opposed to individual pixel values) two fields can be compared. On a pixel-by-pixel basis, the fuzzy vectors for
113
Chapter 5 – Alternatives for a decision framework for landscape connectivity
Kappa = PA - PE (2)1 - PE
common locations (which hold information about the neighborhood of the pixel) are compared. The best match between the vectors represents the similarity of the pixels and is rendered in the fuzzy output map (Wealands et al. 2005). Thus, a Similarity Map is produced, indicating for each cell the similarity with a value between 0 and 1 (equation 3).
Examining a categorical (crisp) map from a raster spatial model, we find that each cell belongs strictly to one category. In a fuzzy set map comparison, an analysis of the map is carried out, indicating in the form of a vector how similar the cell is to each of the categories found on the other map (Iverson et al. 2005). This vector (Hagen-Zanker et al. 2005) is now referred to as the interpretation vector (equation 4). A cell can be similar to multiple categories at the same time. Also, the sum of all its similarity values may be larger than 1. Hence, if we consider similarity to be a degree of belonging, then the interpretation vector constitutes a fuzzy set.
The Fuzzy Set map comparison has a principal purpose: to take into account that there are grades of similarity between pairs of cells in two maps. The Fuzzy Set approach therefore is fundamentally different from its crisp counterpart, the Cell-by-Cell map comparison. This last considers pairs of cells either to be either equal or unequal. Instead, the Fuzzy Set approach expresses similarity of each cell in a value between 0 (distinct) and 1 (identical). Two negative and significant aspects of the Kappa statistics are: a) it cannot consider similarity between categories and b) does not take proximity into account. The FK statistic can do both.
When estimating the locational fuzziness of a class, we wanted the level at which the neighboring cells influenced the target cell to be small because we looked to get a closer analysis of location changes. After testing various parameters and alternative values, we chose the exponential decay function with a radius of neighborhood of 4 cells and halving distance of 2. This appeared as an acceptable approximation of the land use change phenomena considering a comparative view of the similarity of the three scenarios.
The comparison of the three scenarios using MCK was straightforward beyond minimal aspects of required file formats. We consider useful to include a final reference of data management and required formats. MCK uses as valid formats Idrisi images or Arc Info ASCII grids. Therefore, the usual GRID format from Arc View – Arc GIS must be converted. To get a valid input for MCK we had to perform it using Arc Tools (Arc Info Workstation) or the conversion to Idrisi (in Arc View).
Analysis of the Corridor viability in the three scenariosWe also performed an analysis of the two corridor types (presented in Chapter 4): 1000 m and 5000 m width in relation with the three scenarios. We determined which land use classes would be
114
Alternatives for a decision framework for landscape connectivity
Fuzzy Kappa (FK) = P FUZZY, A– P FUZZY, E (3)1 - P FUZZY, E
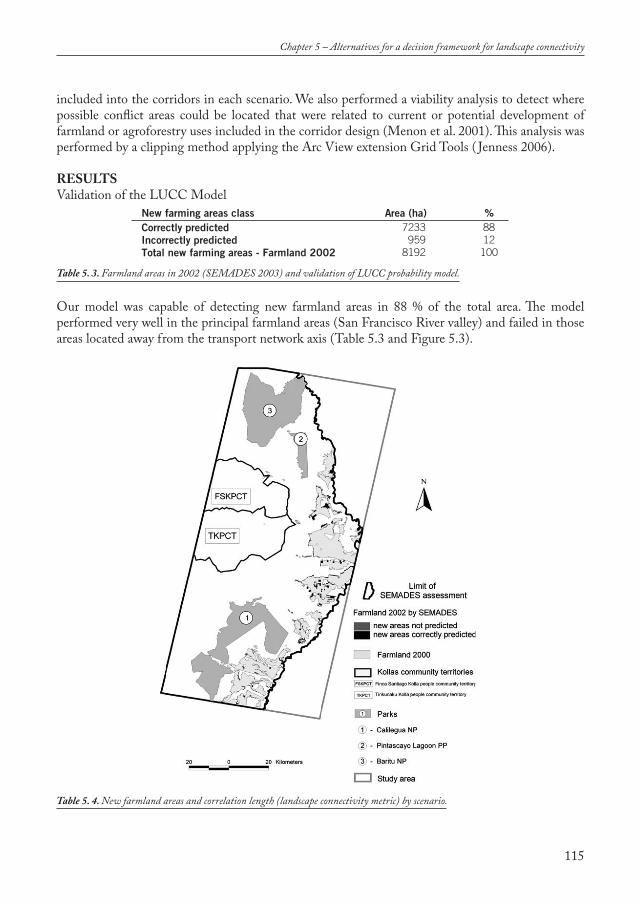
included into the corridors in each scenario. We also performed a viability analysis to detect where possible conflict areas could be located that were related to current or potential development of farmland or agroforestry uses included in the corridor design (Menon et al. 2001). This analysis was performed by a clipping method applying the Arc View extension Grid Tools ( Jenness 2006).
RESULTSValidation of the LUCC Model
Our model was capable of detecting new farmland areas in 88 % of the total area. The model performed very well in the principal farmland areas (San Francisco River valley) and failed in those areas located away from the transport network axis (Table 5.3 and Figure 5.3).
115
Chapter 5 – Alternatives for a decision framework for landscape connectivity
New farming areas class Area (ha) % Correctly predicted 7233 88Incorrectly predicted 959 12Total new farming areas - Farmland 2002 8192 100
Table 5. 4. New farmland areas and correlation length (landscape connectivity metric) by scenario.
Table 5. 3. Farmland areas in 2002 (SEMADES 2003) and validation of LUCC probability model.
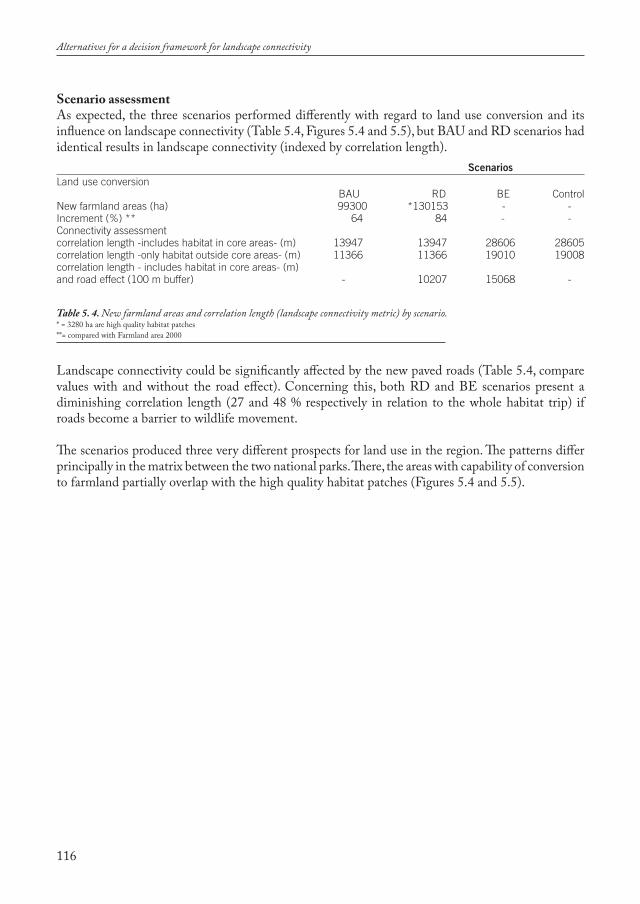
Scenario assessmentAs expected, the three scenarios performed differently with regard to land use conversion and its influence on landscape connectivity (Table 5.4, Figures 5.4 and 5.5), but BAU and RD scenarios had identical results in landscape connectivity (indexed by correlation length).
Landscape connectivity could be significantly affected by the new paved roads (Table 5.4, compare values with and without the road effect). Concerning this, both RD and BE scenarios present a diminishing correlation length (27 and 48 % respectively in relation to the whole habitat trip) if roads become a barrier to wildlife movement.
The scenarios produced three very different prospects for land use in the region. The patterns differ principally in the matrix between the two national parks. There, the areas with capability of conversion to farmland partially overlap with the high quality habitat patches (Figures 5.4 and 5.5).
116
Alternatives for a decision framework for landscape connectivity
ScenariosLand use conversion
New farmland areas (ha) Increment (%) ** Connectivity assessment correlation length -includes habitat in core areas- (m) correlation length -only habitat outside core areas- (m) correlation length - includes habitat in core areas- (m)and road effect (100 m buffer)
BAU 99300
64
1394711366
-
RD*130153
84
1394711366
10207
BE-
-
2860619010
15068
Control--
2860519008
-
Table 5. 4. New farmland areas and correlation length (landscape connectivity metric) by scenario.* = 3280 ha are high quality habitat patches**= compared with Farmland area 2000

117
Chapter 5 – Alternatives for a decision framework for landscape connectivity
Figure 5. 4. Scenario design rules and land use status of the final outcomes.

118
Alternatives for a decision framework for landscape connectivity
Figure 5. 5. Land use pattern of the scenarios: “business as usual” (BAU: left), “regional development” (RD: centre) and “biodiversity and ecotourism” (BE: right).

The land use class representation was something similar among BAU and RD (Figure 5.5). The main difference was in the “new farmland areas” class. This class plays a kind of balance with “Agroforestry-Silvopasture”. “Agroforestry-Silvopasture” represents areas with suitable soils for farming, but these areas are affected by different characteristics (low accessibility, greater slope than “new farmland areas”) that diminish their probability of conversion. Because no new deforestation or agroforestry practices are allowed in BE, this scenario has no representation of either class.
Fuzzy Kappa application – Farmland expansion and pattern comparisonWe performed a comparison between the three scenarios focusing on the farmland class. This comparison of scenario outcomes by FK produces noteworthy results (Figure 5.7 and Table 5.5). These not only confirmed the increment in farmland (Table 5.2) but also highlighted the intensity of changes. The outstanding contrast presented by the FK value from the RD vs. BE comparison demonstrated a fragmentation process in the RD scenario where landscape connectivity changed abruptly and was seriously affected, particularly in the high quality N-S habitat strip that connects Baritu and Calilegua parks. However, the comparison between BAU vs. BE also showed an important change in connectivity that defined a greater isolation of some areas.
119
Chapter 5 – Alternatives for a decision framework for landscape connectivity
0%
25%
50%
75%
100%
BAU RD BE
Scenarios
Area(%)
Habitat patches in Agroforestry areas withpotential for farming
Riverbed
Habitat patches in current farming
Habitat patches in new farming
Habitat patches
Parks
Grassland management plan
Urban areas
Riverine areas recovering
Agroforestry-Silvopasture
New Farmland areas: deforestation
Current Farmland
Silvopasture
Figure 5. 6. Representation of the major land use classes in the planned scenarios.

The consequences for wildlife, as evaluated from the landscape connectivity assessment (Table 5.4: correlation length) appear difficult to mitigate. Also, the cultural integrity and community cohesion of the indigenous communities could be threatened with a change process of the dimensions proposed by RD.
SCENARIOS OUTCOMES - SPECIFIC ANALYSIS
Business as usualThis scenario did not present substantial changes with the last land use evaluation (Chapter 2) and connectivity assessment (Chapter 4). The conversion process of natural areas to farmland occurred for the most part on the principal transport axis. Therefore, it produced no relevant impact on the jaguar habitat areas and, specifically on the corridor sectors located in the west of the study area. However, if the connection of the parks and the habitat patches in the west with other habitat patches surviving in the NE is a conservation objective (the EAZ –ecological
120
Alternatives for a decision framework for landscape connectivity
Figure 5. 7. Comparison of scenarios: the additional farmland areas are showed in black.
SCENARIOS: comparison of Farmland area increasing Map comparison method RD vs. BAU RD vs. BE BAU vs. BE.
Fuzzy Kappa* 0.797 0.153 0.328
* = Fuzzy Kappa varies between 0 (distinct) and 1 (identical)
Table 5. 5. Comparisons of Fuzzy Kappa values among scenarios for the farmland class.

– administrative zone- NE Salta: Chapter 2), then under the BAU scenario this connection would be difficult to maintain.
Regional Development
Accessibility analysisThe definition of a new transport network determined significant changes in regional accessibility (Figure 5.8). The important tourist centers from the West (Humahuaca ravine) are easily accessible from the study region, creating a different transport flow in the whole region. Besides this, a local circulation of farm products and supplies appears as possible alternative through the Kolla territories (Isla de Cañas and Los Naranjos as local centers) joining the principal transport axis.
In this scenario, the expansion of farmland covered large sectors of both kolla community territories (Chapter 2: Finca Santiago and Tinkunaku). Also, the forested areas linking the parks appear as patches isolated by farm development from the piedmont. This is a potentially threatening situation, since the high quality patches linking the parks were bordered by a farmland frontier advancing from the east. However, the measurement of correlation length (Table 5.4) is the same as the BAU scenario. The remaining spatial continuity of the N-S habitat strip of high quality habitat patches (with some minor losses) explains this result.
121
Chapter 5 – Alternatives for a decision framework for landscape connectivity
Figure 5. 8. Comparison of accessibility conditions in the scenarios: Business as Usual -BAU- (left); Regional Development -RD- (right). The scenario Biodiversity and Ecotourism -BE- (not showed) only incorporates the paved route from Lib. Gral. San Martín to Humahuaca (as an scenic, narrow route).

Biodiversity and EcotourismThis scenario presents the best condition in relation to landscape connectivity (Table 5.4) even if compared with the control scenario. This is because current farming areas located in the habitat strip were included in a restoration program. The recovery of riverine areas could be future reconnections linking current low quality habitats in the northeast of the study area. Moreover, restoration of grasslands and degraded forest plus the ordering of cattle management activities could bring not only a better condition for cattle production but also a reduction in jaguar mortality with as concomitant recovery of the population because the conflict with the ranchers would lose intensity. The important tourist centers from the West (Humahuaca ravine) are now easily accessible from the study region, creating a different transport flow. But this flow is principally by tourism because the characteristics of this new paved, narrow, scenic route (connecting Humahuaca city with Lib. Gral. San Martín). Habitat availability found here its best condition.
Corridor configuration in the scenariosWe extracted the areas that integrated the corridors to examine land use class configuration (Chapter 4). In concordance with the scenarios, the corridors present a structured analogue to the configuration of each scenario. Tables 5.6 and 5.7 show the results (corridors 1 km and 5 km width respectively) and Figure 5.9 presents the configuration of the corridors (5 km in width) and the identification of possible conflict areas that should be avoided for the scenarios BAU and RD.
122
Alternatives for a decision framework for landscape connectivity
SCENARIOS: comparison of land use classes (% of area) Land use classes BAU RD BE
Silvopasture 24.47 24.47 25.96New farmland areas: deforestation - - -Agroforestry-Silvopasture 6.76 1.42 0.00Corridors (actual habitat patches) 68.41 68.41 73.68Corridors in new farming - - -Corridors in current farming - - -Riverbed 0.36 0.36 0.36Habitat patches in areas of potential farming 5 0Total 100 100 100
SCENARIOS: comparison of land use classes (% of area) Land use classes BAU RD BE
Silvopasture 27.19 27.19 29.84New farmland areas: deforestation - - -Agroforestry-Silvopasture 9.05 2.27 0.00Corridors (actual habitat patches) 62.96 62.96 69.41Corridors in new farming - 1 -Corridors in current farming - - -Riverbed 0.65 0.65 0.65Habitat patches in areas of potential farming - 6 -Total area (ha) 100 100 100
Table 5. 6. Land use classes representation of the corridors of 1 km width.
Table 5. 7. Land use classes representation of the corridors of 5 km width.

123
Chapter 5 – Alternatives for a decision framework for landscape connectivity
Figure 5. 9. Comparison of the corridors conditions (5 km width) in the scenarios: Business as Usual -BAU- (left), Regional Devel-opment -RD- (center) and Biodiversity and Ecotourism -BE- (right).The blue circles indicate potential conflict areas.
The condition of the corridors in the scenarios BAU and RD appears compromised. However, currently there are no farming activities where a revegetation program could be implemented in case these were affected. Usually, corridors (unlike large patches) are not totally eliminated by roads or impact zones. If, however, developments and conversion of native vegetation extend over a significant sector of the width of the corridor (e.g.: 50 %), the connectivity could be affected and the functionality of the corridor is mostly lost (Steinitz et al. 2003). Even small amounts of development located in a section of corridor can compromise connectivity among large patches. The loss of corridors results in increases in distance of travel among large habitat patches and/or isolation of some patches. These situations are considered as potentially detrimental to the whole habitat quality.
DISCUSSION
The Scenarios development can be used not only for assessing potential effects of LUCC on ecological processes but also serves for structuring spatial information and knowledge. It can also become an extension – communication tool for a participatory decision process showing possible consequences of management measures ( Jongman and Padovani 2006).
But, from a nature conservation point of view, the results obtained and the spatial expression of land use plans allow the questioning of possible impacts of these plans in habitat availability and more importantly, on the conservation of landscape connectivity and landscape sustainability itself. The current context in the commodities market (Steininger et al. 2001, Dros 2004, Alciro 2006, Correa 2006, Tavares 2006) preludes a very challenging time for the conservation agencies working in the Yungas. The weight of an ecologically sustainable landscape mostly resides with conservation agencies worldwide. The crucial challenge is to develop sustainable management plans under increasing pressures. These pressures operate at local, regional, national and global levels in the Yungas and come from market driven policies, rising human population and heightened sociopolitical and economic liabilities (e.g., budget constraints, regional production profile in debate, employment crisis, etc.). Some of these liabilities function as high level driving forces (global market, government policies, etc.) of the LUCC process. The variation of these forces can not be grasped by the kind of spatial LUCC probability model employed here (Veldkamp and Lambin 2001, Seernels and Lambin 2001, Verburg et al. 2004a). This model type (that can be produced by geographers or landscape ecologists) can only predict location of future changes and it mostly works in a defined range of land uses, within a defined context of the higher driving forces and at its particular (regional) scale. To effectively face the challenge of LUCC modeling and its interrelation with corridors and ecological networks planning, the conservation agencies must increasingly rely on innovative methods and emerging technologies to produce new, more integrated solutions. This involves the consideration of deforestation as a serious concern. The challenge will necessarily imply an enlargement of the current perspectives and incorporation of scientific disciplines that are not included in the conservation community agenda: i.e. economics and politics (some conservation agencies have already incorporated a social dimension in their planning methodologies). This new integrated approach will allow an effective interdisciplinary approach to the LUCC problem as a sound base for sustainable landscape planning (Walker 2004). It will empower conservation managers to diverge from the conventional paradigm of an opportunity-based pursuit of simple habitat gains and adopt an explicit, strategic pursuit of landscape sustainability based on sound ecological and socioeconomic principles (Twedt et al. 2005).
124
Alternatives for a decision framework for landscape connectivity

To achieve a general perception of the need of landscape sustainability, a simplification of the decision problem (as presented in this chapter) is very helpful. Furthermore this decision problem simplification specially functions in situations where there is no agreement about the particular relevance of different aspects in a land use planning process. This kind of stress among interest groups is beginning to appear in Yungas. Developing a progressive, gradual approach then allows us to proceed in the decision process avoiding unnecessary complexity. A very complex presentation of the decision problem can marginalize people who might feel that their concerns are not taken seriously. This simplification also keeps the decision process transparent and focused on the essential questions. It also increases the chance of finding a trade-off solution between infringing interests. Moreover, some aspects of the approach presented here (the OSIRIS application) have been tested in a participative environment in a region with a similar socioeconomic context: the Pantanal ( Jongman 2005, Jongman and Padovani 2006). It has demonstrated to be a valuable tool in participatory and nature conservation - sustainable development oriented decision-making process (van Eupen et al. 2005).
A SDSS can also improve the availability and openness of information to strengthen the communication aspects of a decision process (von Haaren and Warren-Kretschmar 2006). As a model it can also become a powerful detector of knowledge gaps (Verburg et al. 2005). At the same time, and taking into account its value, the role of a SDSS in the decision process should be carefully measured. A model is an abstracted picture of the real world and cannot address the complete situation. Therefore a SDSS as a model is – as Soulé (1987) puts it – “not a crutch for the thoughtless but a tool for the thinkers”. They assist, not replace, a bottom up decision process that requires scientific information, arguments, analysis, discussion and participation.
The participation and discussion is already ongoing in the local committees (Los Toldos, Orán, Calilegua and Palpalá) of the Yungas Biosphere reserve (Gonzalez and Meitner 2005). This intense participatory effort carried out by the stakeholders (local communities, sugarcane corporations, forest industry, ngo`s and the provincial and federal government) is searching for a land use planning strategy that presents zoning alternatives as a discussion background.
Keeping in mind these considerations the final results presented here can be estimated as defining principal, coarse trends of land use and nature conservation in the region. In fact, the connectivity assessment valuated the high quality habitat patches but it can not block out the need of attention on habitat availability, even if it is of lower quality. Conservation planners should consider the priorities this model establishes for jaguar against decision support models that target other species groups and ecosystems (e.g., tapir, birds, fishes, piedmont forest). Indeed, the connections of the Parks by corridors was our primary objective, but landscape cohesion (Opdam et al. 2003) should be assessed to recognize the “carrying capacity” of the landscape, further needs of habitat and also requirements of other species. If this data does not exist, then ecological profiles can be used (van Rooij et al. 2003). Otherwise, we could be in a situation where the connections among the parks (even with the limitations of the corridors as wildlife paths) are guaranteed and functional but the total amount of habitat in the regional context is not large enough to host a viable population of the focal or other species (Verboom and Pouwels 2004). This crucial aspect is out of the scope of this research but it should be carefully considered. However, it is already possible to identify potential threats to landscape connectivity in the Yungas region. These threats, through a simple continuity of the current trends (demonstrated by the BAU scenario) can materialize and would derive in an
125
Chapter 5 – Alternatives for a decision framework for landscape connectivity
increasing fragmentation process where some habitat patches would be isolated. This potential stage should be already avoided by mitigation measures.
The methodology chosen to compare among the farmland patterns of the scenarios is direct in its logistics and application. However, these fuzzy comparisons (which can tolerate locational and categorical errors between spatial fields) require subjective definition of the memberships for each category and the amount of locational tolerance (Wealands et al. 2004). Hagen (2003) recognizes that evaluating the expected similarity is difficult with a fuzzy representation of categories and location. Several problems with the FK statistic are identified and improvements must be made for its use as a measure of comparison. However, for the definition of locational tolerance (the neighborhood parameters) substantial efficiency gains in the calculation can be made by taking opportunity of the fact that there are large groups of neighborhood configurations that lead to an identical similarity value (Hagen-Zanker et al. 2005).
The early detection of possible conflict zones allows an analysis of corridor design viability among interests groups. The final corridor design may not be optimal from a connectivity and habitat quality point of view, but a feasible one. The detection of these zones currently not under threat of deforestation nor currently protected allows the assignment of a protection status with little expenditure of political capital (Menon et al. 2001). If these potential conflict areas are valuable for their conservation status and their contribution to connectivity, then it is advisable to protect them now while it is politically convenient and inexpensive. In the future, these areas might become targets for development, in which case it would be much more difficult to grant them protected status.
CONCLUSIONS
The thematic framework where the decisions on land use in the Yungas should be considered must be broad and should incorporate the new paradigm of landscape sustainability (van Lier 1998) in an interdisciplinary approach. It should include not only a perception about the conservation of biodiversity and scenic values, but also should stress the importance of watershed and water storage capabilities protection and restoration. The significance of conservation of the Yungas evidently includes regional and local assets (biodiversity, natural resources, valuable timber, fisheries, scenic beauty, and cultural heritage) but is an important complement at the sub continental scale to the sustainability of the Plata - Paraná Rivers Basin.
Considering the previous conclusion, what to preserve in the long term should be carefully analyzed. For the decision process, in reality, political and economic considerations are vagile. They mutate with farming systems, commodity prices, and government policies. Instead, biological considerations, if based on sound science, remain relatively constant. Hence, we recommend against incorporating political and economic constraints for long-term conservation planning. The inclusion of political and economic information in the planning process must not be confused with insubstantial restrictions to the ultimate conservation priorities. Consideration of these socio-economic dimensions as real-world constraints will be relevant for short-term implementation of conservation plans, and ultimately for modification of these plans (Twedt et al. 2005). But only a land use policy that maintains the integrity of the native forest beyond circumstantial chances of high revenues from commodities production would constitute a guarantee of sustainability. This sustainable landscape approach would
126
Alternatives for a decision framework for landscape connectivity

cover all the relevant matters: watershed protection and water production, possible limitations for farming and cattle production, cultural and social integrity of indigenous communities and, as an essential background, the natural heritage.
To attain these goals, geographic location of landscape management must be guided by decision support systems that establish priority areas for connectivity. This system is intended to provide science-based objectivity to a decision-making process that includes other factors (e.g., politics and economics) that also influence where conservation practices are ultimately implemented (Twedt et al. 2005). The methodology presented could be improved and enriched. Modeling always implies some simplification and unavoidable trade-offs must be made between generality, realism and precision (Levens 1966). This methodology represents a trade off among conceptual power and applicability. It could be a basis for the development of scenarios planning by conservation agencies. This planning methodology has particular potential in contexts, as in developing countries, where the uncertainties and political instabilities have been shaping and weakening the institutional functioning and relationships. There, the scenario planning methodology presented here could boost both: the participation of the stakeholders and the commitment for a responsible and receptive planning attitude from the governments. When all relevant aspects are engaged together, i.e. natural resources, land use conflicts, and regional sustainability, then a real involvement of the local communities and responsibility from governments can make a great difference. To make this particular planning process possible the simplicity and straightforward characteristics of the tools presented here become a strength and virtue to take into account. These tools not only provide a point of departure for broader discussions and further elaboration of deeper, integrated plans but also give insights, answers and perspectives for participatory decision processes. For processes urgently requiring a perspective on decisions about land use, nature conservation and its relationships, the presented methodology could be helpful.
127
Chapter 5 – Alternatives for a decision framework for landscape connectivity


ABSTRACT
A summary of the research highlights the relevance of the Yungas region as paramount biodiversity ecoregion of Argentina. A synopsis of the Yungas assets and its threatening species (which spotlight the condition of priority biodiversity hotspot) are exposed.This chapter included a reflection on the current planning process procedure in nature conserva-tion, its biases and problems originated in traditional, unilateral views in land use decision-making. The application of the concept of ecological apartheid (incorporated but not recognized enough) in conservation planning is here presented and discussed. We also analyzed the cultural values that local communities and indigenous people are sustaining across the Yungas region. Additionally, a discussion of the current condition of the parks in the region and the relevance for the maintenance of ecological processes (emphasizing on connectivity aspects) is presented. Finally an analysis for fur-ther research highlights the need for extension of the habitat evaluation performed in this research with the incorporation of other species or ecological profiles.
CHAPTER 6General synthesis and future research
129

CONTENTS
GENERAL SYNTHESIS AND FUTURE RESEARCH 131 Significance of this research 131 Research purposes 131 Future research 137 Chapters summary 137
FIGURESFigure 6. 1. Preliminary zoning of the Yungas biosphere reserve 136
130
General synthesis and future research

GENERAL SYNTHESIS AND FUTURE RESEARCH
Significance of this research
The Yungas is one of the major biodiversity assets of Argentina together with the Paranaense forest and the Chaco region. To the west of the Chaco plains, a series of sub-Andean mountain chains aligned in a North - South direction in conjunction with a unique climate form a remarkable geographical feature in north-western Argentina and southern Bolivia. Humid winds from the Atlantic Ocean, unhindered in their high passage over the Chaco, discharge rain upon reaching the eastern slopes, thus favoring the development of this exuberant mountain subtropical rainforest. The local conditions of temperature and humidity vary in accordance with elevation, latitude and orientation of the slopes, which is reflected in the different types of forest structure. Therefore the complex floral communities are grouped by the altitudinal belts that they occupy.
Forming a wedge along the southern Andean chains of Bolivia and northwest Argentina, the Southern Andean Yungas rainforest (also known as cloud forest) holds one of the major biological riches of the Neotropics. For example, the Yungas has high levels of endemicity in birds, supports 36 species of bats (Bárquez et al. 1999) and it is estimated that more than 230 tree species and 3000 vascular plants are present in the region (Grau & Brown, 2000). This large landscape creates a safe oasis for threatened fauna such as the jaguar (Panthera onca), tapir (Tapirus terrestris), pecari (Tayassu albirostris and T. pecari), toucan (Ramphastos toco), Ocelot (Leopardus pardalis), and North Andean deer or taruca (Hippocamelus antisensis), among other species (Perovic 2002a, Dellafiore and Maceira 1998).
This ecoregion shields a wide variety of forests and woodlands which vary in composition with elevation. Wildlife is abundant in this humid environment, where ferns, bromeliads and other epiphytic plants are particularly impressive as they cover every corner of the forest leaving almost no place without some kind of vegetation. Several national parks and natural reserves protect this biological paradise. However, the richness of resources and the availability of water, wood and crop soils are threatening the region. The Yungas encloses a group of highly fragile ecosystems (internally threatened and endangered) all included in the Bermejo River Upper Basin (a component of the Plata - Paraná River system), represented by the piedmont forest, mountain subtropical forest, temperate mountain forests, and high grasslands. Among them, the piedmont forests are considered one of the most threatened ecoregions in Argentina. In southern Bolivia, according to Oldfield et al. (1999) the species faced with extinction in this zone are the Spanish oak (Amburana cearensis) and the cedar (Cedrela fissilis); 18 others are listed as threatened.
Research purposesThis research had a guiding principle and two main purposes. As a principle, we considered that the planning for nature conservation can not be accomplished isolated from the land use processes that are occurring in the considered region. Otherwise, we would be incurring in a new case of ̀ ecological apartheid` (Main 1993, McNeely et al. 1994, Saunders 2000, Sullivan 2001, Carman and Keitumetse 2005, Campbell 2006). Keefe (1995) supports this by highlighting that “the creation of national parks and game reserves has been described as ‘ecological apartheid’ and stems from Western secular culture which rejects the idea of cohabitation between humans and animals.”This concept of ecological apartheid is related with a biased vision of Biodiversity (Box 1). In relation
131
Chapter 6 - General synthesis

with our guiding principle we defined our two purposes: 1) To assess the impacts of deforestation on the Yungas forest through time, the characteristics of this process and particularly how this process affects habitat availability and landscape connectivity; and 2) As a planning response, to design a set of biological corridors that link the existing parks, applying a focal species approach (Lambeck 1997, Freudenberger and Brooker 2004). These corridors are designed to maintain landscape connectivity, joining key habitat patches as stepping stones. Furthermore, these corridors constitute the basis for a future ecological network.
When this research began, the conditions for land use conversion through deforestation in the Yungas were someway different. At that time the perception was that deforestation was a major threat to regional sustainability. The relevant feature at that time (1997) was the conversion of the piedmont forest. The piedmont continues being the most threatened ecosystem in the Yungas. Later on, the conditions of the global commodities market, and specially the irruption of genetically-modified soy, its associated technological packages and attractive prices dramatically changed the scene (Dros 2004). The deforestation process (presented in Chapter 2) imposed a challenge: the need of planning for nature conservation considering the insufficient area of the existing parks (Baritu and Calilegua) to protect the outstanding biodiversity of the region.
This insufficiency of the parks system, nowadays recognized, was not completely accepted by the conservation agencies authorities (national and provincial boards) until few years ago. Sometimes, we were committed to take actions in the day to day operations related to areas connecting the parks. In these operations we needed to negotiate some land use allocation aspects with intermediate and middle sized farmers (> 10,000 ha and < 5,000 ha respectively) and sugarcane corporations (plantations > 60,000 ha), as well as, mining, natural gas and industry sectors, with few legal, institutional or technical support from the conservation agencies. At that time, no legal instruments existed to protect the Yungas beyond the national parks. Similar situations occur in other parts of
132
General synthesis and future research
Box 1. Biodiversity and the `ecological apartheid`Biodiversity is defined as the variety of all life forms and their patterns in space, the different flora and fauna, the genes they contain and the ecosystems that they integrate. There are three structured interactive levels of biodiversity; diversity at the genetic level, the species, and the ecosystem levels (Saunders 2000). This structure comprehends a large array of ecological complexity and is incompletely understood. Commonly, biodiversity is taken to mean species diversity. This wrong interpretation leads to biodiversity being seen in a limited way. In agricultural landscapes, it is frequently assumed that biodiversity is found only on conservation reserves, on uncleared agricultural land, or in remnant patches of native forest on farming land. Ranching and agriculture are totally dependent on ecosystem processes and functions such as soil formation, nutrient cycling, maintenance of hydrological cycles, and pollination of crops. These processes and functions are all driven by interactions between elements of biodiversity. The slanted species-focused view of biodiversity gives rise to the notion that landscapes can be compartmentalized, the existing human population totally excluded and that protection of remnant native vegetation is therefore the primary action required for the conservation of biodiversity. This attitude does not take into account the majority of biodiversity, and is leading to continuing loss of its essential elements. Agricultural and forest landscapes must be managed in an integrated way, rather than following the form of ecological apartheid (Campbell 2000) that often constitutes landscape management (Saunders 2000). Future landscapes must be managed for sustainability; that is, to ensure that the use and management of the natural capital does not reduce its capacity to meet society’s future environmental, social and economic needs.
the world: landscape linkages typically receive no formal regulatory protection (Pyke 2005). This contrasts with the intense legal reinforcement, economic and human resources devoted to the parks. Remarkably, the Netherlands has given legal protection to its National ecological network. It is a unique feature when one considers land use planning for nature conservation and sustainable landscapes approaches worldwide (LNV 1989, Hootsmans and Kampf 2004).
Also, a conservation strategy based only on the existing parks appears itself insufficient in terms of habitat availability (Chapter 3 and Chapter 4). Making reference to this condition, a regional national parks director said: “in the Yungas, without the development of biological corridors and later, an ecological network, the national parks will become two nice flowerpots or a type of large, open zoos” (Temporetti, A., pers. comm.). This vision is possibly exaggerated but the parks of the region are small enough to justify the previous statement. Definitely, these three parks can not ensure the continuity of natural processes in the region.
Meanwhile, the need for sustainable landscape planning and plan implementation is pressing. The deforestation continues from the Ramal sector (San Francisco River valley) advancing to the west, converting the gentle slopes of the piedmont forest. However, a series of logistic, technological, ecological and social factors acting simultaneously are delaying this conversion process. Among them, the value of the forest’s integral properties as an important element of the Kolla communities` cultural coherence is an important deterrent of land use change. Nevertheless, the pressure for better life conditions and access to modern life’s comfort and welfares threaten these traditional values, especially in less structured communities, where the community organization is not very strong. In these communities, the influence from local and regional political structure could force a change. The dominant view in both provincial administrations ( Jujuy and Salta provinces) is to “take advantage” of the current prices in the global commodities market (Dros 2004, Alciro 2006). Thus, these administrations are promoting deforestation measures as land use and economic development policies related to colonization, transportation, or indirect subsidies for new deforestations. The political sector of the provinces is ambiguous: sometimes they show attitudes of unconcern or undervalue towards forest environments, and simultaneously promote biodiversity values and scenic assets of the Yungas and, furthermore, incorporate them as the principal tourist destinations. These ambiguities also encourage the rent-seeking behavior of individual agents motorizing deforestation. In the Yungas, like in other places of the country and Latin America, some interactions amplify the process of deforestation. We conclude that the interaction of infrastructure investments (road construction) and the establishment of new farmland in a frontier area like the Yungas work upon economic factors such as the extraction of wood and food markets. This was the most frequent interaction in Latin America but also has sparked tropical deforestation processes around the world (Geist and Lambin 2002, Walker 2004).
There is a common perception that no universal policy for controlling tropical deforestation can be conceived. Tropical deforestation is determined by dissimilar combinations of proximate causes and underlying driving forces in changing geographical, historical and socio economic contexts throughout the world (Geist and Lambin 2002). Some of these combinations are robust geographically (development of market economies and the expansion of crop land), whereas most of them are region specific. Also, a careful understanding of the complex set of proximate causes and underlying driving forces affecting forest cover changes in a given region is a previous requisite
133
Chapter 6 - General synthesis
for the formulation of policies and further interventions. Therefore, no general, universal policy for deforestation control can be applied (Geist and Lambin 2002).
Other analyses carried out in Argentina covering areas similar to our study region coincided regarding the underlying cause of deforestation: the necessity of cropland principally for soybean and the linkages with the global economy (Volante et al. 2005). The rate observed in this study for Oran department is around 5000 ha/year. It is higher than the 80000 ha (from 75000 to 155000 ha) deforested in our time range (1973-2000; 3000 ha/year). However, beyond these numbers the perspective is bleaker. The Directive 2003/30/EC of the European Parliament emerges as a new possible underlying cause, defining biofuel target shares on the EU transport fuel market by 2010. The EU directive defined that by 2010, 5.75% of all gasoline and diesel used in transport must be based on biofuels (Kavalov 2004). This directive could be supported by employing crop land from the EU but also from imports. As possible sources for biodiesel, vegetable oils like soybean can become candidates. Ethanol, another candidate for biofuel, has sugarcane as its possible source. Both crops and a potentially increasing demand could raise the deforestation pressure in the Yungas. It is clear that the modeling of underlying causes of deforestation is a matter of social and economic factors operating in a multi-level fashion on proximate regional-local determinants. These characteristics necessarily call for multilevel monitoring procedures. These must simultaneously consider the region (because region specific characteristics), as well as higher levels.
Our evaluation of the deforestation process consisted in a temporal analysis (1973-2000) of the land use and cover change process (LUCC) to assess its rate and determine the location of its intensity. We looked to identify the spatial determinants of land use change and the location of future changes in the current context. This analysis produced a spatially explicit logistic regression model which was characterized based on its potentials and limitations (Chapter 2) and was later validated (Chapter 5).
We also evaluated habitat availability for wildlife using a focal species approach, with the Jaguar (Panthera onca) as our focal species (Chapter 3). We built the information base from fieldwork, previous research and interviews with key reporters (“tigreros” or jaguar trackers) from the local communities. With this database, we performed a connectivity analysis (actually a potential connectivity analysis). The objective of this analysis was to identify suitable areas for the design of ecological corridors linking the parks (Chapter 4). Also, we looked to identify high quality habitat patches that could function as stepping stones, connecting zones or movement refuges for wildlife along the corridors. The set of patches and the corridors was considered a potential initial stage for the design of an ecological network. This network will require the analysis of habitat demand from different species groups. These groups should be chosen in such a manner that they represent a variety of area requirements and dispersal distances. These could be real species or ecological profiles representing groups (van Rooij et al. 2003).
Then, our research depicts a set of possible land use scenarios (Chapter 5). These modeled scenarios show that the regional conditions related with landscape cohesion (Opdam et al. 2003) could change dramatically if deforestation continues in some specific locations. These scenarios can be used as starting points for a participative planning process for the Yungas.
134
General synthesis and future research

Like other tropical and subtropical regions in the world, the changes in Yungas could be planned, under a coordinated management or could be directed by “the global market”. The last conversion process in the Argentine Northwest markedly followed the last orientation. There were no local, regional or national plans that determined the characteristics of the transformation of thousands of hectares in Yungas and Chaco to agriculture. Any consideration about connectivity matters and landscape cohesion to keep ecoregional sustainability was not considered beyond the efforts of scientists and staff from Universities, National Parks, stakeholders groups and NGOs. As a recent example, only a massive mobilization of peasants, Greenpeace activists and the National Parks regional administration stopped a new deforestation process in the Chaco - Yungas ecotone.
Through this mobilization, a new reserve was created near the town of Pizarro, Salta. This new reserve was established against the interests of the provincial government, which had recently disaffected a former provincial reserve and sold it in a public bid. The planning effort to achieve a sustainable landscape should reinforce this participatory and knowledge exchange dynamic. A continued feedback and multilevel analysis engaging scientists, managers and stakeholders could produce a sustainable plan for the region. Also, no plan is a final one: land use is a dynamic process and this should be always kept in mind (Veldkamp and Lambin 2001, Walker 2004). It is a matter of iterations and adaptation to a changing and challenging world.
In this changing environment, after four years since the establishment of the Yungas biosphere reserve (created in 2002), the functioning of its general and local committees encourages to envision an active regional planning process and consequent actions in search of landscape sustainability in the region (Figure 6.1). The Biosphere reserve became the backbone of the Yungas Andinas Biological Corridor that will link the Yungas parks with Tariquia nature reserve in Bolivia (Chapter 1 and OAS 2003). The institutional strength of the Biosphere reserve has been demonstrated through the constitution of four local committees, the continuity of their activities, and local capacity building. The local communities` ancestral heritage and their open attitude for cooperation supports the arguments of a mutual benefit of intercultural practices and knowledge exchange when nature conservation engages locals to people outside the region (Sheil and Boissière 2006).
135
Chapter 6 - General synthesis

136
General synthesis and future research
Figure 6. 1. Preliminary zoning of the Yungas biosphere reserve.

Future research
A more integrated, multilevel approach to the analysis of the LUCC process could give more flexibility and capacity to face the dynamics that can promote unexpected changes in the current context in the region. Available modeling tools have been demonstrated to work in different regions worldwide as a multilevel platform, with rate predicting power and capacity to deal with spatial dependencies during the validation processes (Verburg et al. 2004a). We have begun to incorporate these tools as a next step in modeling LUCC that can manage different scales and produce reliable predictions on deforestation rate (CLUE-S). We understand this as a necessary next stage to the characterization of deforestation and land use conversion dynamics in the Yungas. Nevertheless, we give great value to the LUCC model exposed here in relation to our availability of data and financial resources. Our spatially explicit probability model provided information on the viability of the corridor design related with the land use potential of different zones.
The connectivity assessment presented here should be considered a first approach to landscape connectivity status. Continuity of research must enlarge the species scope, adding different ecological profiles and looking at a broader set of requirements. This projection can progressively cover the requirements of an ecological network taking into account the landscape cohesion concept as an ultimate conceptual background (Opdam et al. 2003).
Also, a possible development of an Incidence Metapopulation Function (IMF) based on real jaguar movement data is another aspect to improve (Moilanen and Hanski 2001). Our current habitat model based on presence data could be significantly improved.
The Spatial Decision Support System (SDSS) should integrate the economic dimensions with a dynamic component that can be adjusted in relation to market changes (Veldkamp and Lambin 2001, Walker 2004). The SDSS must also contain an impact valuation of the proposed activities on the cultural integrity of the stakeholders in the region: rural communities, indigenous people and urban settlements. The importance (weight) of the different aspects should be defined with the participation of the stakeholders.
Chapters summary
Chapter 1 describes the characteristics of the Yungas region. Specifically, its biogeography, socioeconomic aspects and the political profile that define the planning context are discussed.
Chapter 2 studies the land use and cover change (LUCC) process in the Yungas during almost 30 years (period 1973 – 2000). Furthermore, a conceptual analysis of the driving forces considering precursors and attractors (sensu Bürgi et al. 2004) helps to visualize regional interactions. An accessibility analysis and a spatially explicit model of LUCC for agricultural intensification based on logistic regression constitute a planning tool to predict possible changes in the region.
Chapter 3 focuses on habitat availability based on a focal species, the jaguar (Panthera onca). The methodology of data gathering combining scientific fieldwork with participatory and intercultural research and knowledge exchange is exposed. A model of habitat quality founded on presence data
137
Chapter 6 - General synthesis

and constructed with logistic regression allows the identification of probable key habitat areas.
Chapter 4 relates the habitat quality model and the LUCC model to identify the best habitat areas for the location of biological corridors and high quality habitat patches. It forms the basis of a future ecological network. A rationale to select the best suited landscape ecological metric (index) is presented. As well a connectivity assessment based on correlation length reveals the current landscape condition and permits the identification of key habitat patches.
Chapter 5 introduces a Spatial Decision Support System (SDSS). It includes the formulation of LUCC scenarios and an analysis of their spatial configuration. Finally, an evaluation of the outcomes from the different scenarios and how it influences landscape connectivity is presented.
138
General synthesis and future research

139

GENERAL SUMMARY
The research contextHabitat fragmentation is a crucial conservation issue worldwide as it is in the Yungas, a mountain subtropical moist broadleaf forest in the northwest of Argentina. Our research aimed at developing tools to analyze the process of habitat fragmentation relating with deforestation in the Yungas forest, one of the richest biodiversity ecoregions in Argentina. A fragmentation process driven by the conversion of native forest into farmland is occurring across the region, and this reduces the connectivity between remnant patches of intact forest, many of which are located within existing protected areas, including national and provincial parks. Maintaining and restoring connectivity constitute one of the principal targets for nature conservation in the country.
A major objective of our project constituted the definition of biological corridors linking protected areas. It has been conceived as a base for the development of a future ecological network. A multi-temporal approach to analyze the evolution of both land use and habitat patches is presented. A complementary analysis of habitat availability indicated the need of implementing active habitat management practices beyond the parks, because these are not large enough to hold sustainable populations of some threatened species of the ecoregion, particularly large mammals.
We paid special attention to identifying the conditions of the landscape matrix which exists among parks. For this, we analyzed the deforestation process and the factors which determined it. One of our aims was to quantify the historical sequence of deforestation, which concluded in the duplication of the farmland area during the studied period (1973 - 2000 see Table 2.4 and Figure 2.4). In a region of 1.4 million ha, this represents an increase in the farmland area from 5.5 % to 11 %. The other aim was to develop a spatial probability model with capabilities for predicting the location of future clearings (Figure 2.9).
Because priority was given to know which areas are more unstable and prone to future deforestation, we focused on describing the location of changes rather on the deforestation rate, which was driven by forces operating at national and global level, instead at local or regional level. We produced a conceptual, qualitative model of land use and cover change (LUCC) by following a blueprint approach to these socioeconomic, institutional and policy drivers at global and national levels, (Figure 2.1).
CHAPTER 7General summary – Algemene samenvatting – Resumen general
141

Further research should integrate the “pattern to process” methodology based on GIS and logistic regression, with a “process to pattern” approach (mostly based on social and economic aspects). This can add some flexibility for handling discontinuities in land use processes and the introduction of new land use types in the region.
Together with the land use analysis in the landscape matrix, we wanted to evaluate the habitat availability and its connectivity using jaguar (Panthera onca) and ocelot (Leopardus pardalis) as focal species. Using data of presence and a set of natural and human variables, we carried out a logistic regression analysis that produced a habitat quality model (Figure 3.6). In order of dealing with the problem of autocorrelation among variables we introduced a spatial autocorrelation term in the regression equation (Table 3.11: Distance analysis model). We obtained this term from a scale dependent - random labeling analysis for points data coverages. We finally used ROC (Receiver Operating Characteristics) for evaluating the overall performance of our habitat model (AUC: 0.701).
Landscape connectivity was a principal research interest of this thesis. Connectivity is a parameter of landscape function, and measures processes that make possible the interconnections of subpopulations of organisms into a functional demographic unit. Connectivity is both a species and landscape-specific parameter. As a species-specific parameter of the landscape, we oriented the analysis towards a group of species, from which we were able to integrate information of value for other groups. The analysis of connectivity among habitat patches in the region was performed using a feline species, the jaguar, which has long habitat requirements. The data set corresponding to the ocelot was not large enough to elaborate a valid habitat model. Percolation theory, graph theory and a range of analytical tools based on this conceptual framework (the landscape metric: correlation length) were applied to the analysis of the corridors and connections between habitat patches and the contribution and relevance of each patch (Figures 4.3, 4.7 and 4.8).
We used public domain landscape ecology software (Pathmatrix, Patch Analyst, Buffer theme builder, Fragstats) and a widespread GIS analysis tool (Arc View) to perform the connectivity analysis. Some of the previous research based on the graph theory and connectivity analysis produced not very clear justifications of methodological aspects followed and software tools used. In contrast, our approach is replicable and extends the value of the connectivity evaluation to other practices relating to nature conservation and landscape ecology. An evaluation of vulnerability - conflict areas associated with land use conversion probability was also included as an additional measure of the proposed corridors design.
Three possible scenarios resulting from distinct priority setting exercises for different stakeholders (in support of this regional analysis) were developed. This scenario modeling may be used as an analysis platform in a participatory process of territorial planning. Stakeholders included farmers, tourism entrepreneurs, planners, politicians and nature conservationists, and scenarios were based on their sectoral views, in combination with data on land use and accessibility. We performed a previous validation of the probability model of LUCC using an independent data source (Table 5.3 and Figure 5.3). The model correctly predicted the location of about 88 % of new clearings.
We recognized that the results of the application of this model are restricted to the context of our study, and is not incorporating the effects of driving forces occurring at higher hierarchical
142
Interrelated modeling of land use and habitat for the design of an ecological corridor
levels. The spatial configuration of the three scenarios allowed predicting the potential expansion of farmland areas, the availability of wildlife habitat and the connectivity between alternative landscape configurations, and also permitted to evaluate the influence of these scenarios on the corridors design. These influences are evaluated as possible conversions of native forest included at the interior of the corridors. A comparison methodology of the farmland pattern resulting from the scenarios is presented.
Finally, we included a reflection on the planning process procedures in nature conservation that are currently used, as well as the deviations and problems which may occur if unilateral views are applied to territorial planning. The concept of ecological apartheid, i.e. the application of a one-side view to territorial ordering, has rarely been included as a subject of analysis, and represents a factor which affects the practice of sound conservation planning. It seems hardly to recognize that there is an underlying prejudgment about the possibility of coexistence of wildlife and human beings. Beyond the consideration of numerous examples about this fact, there seems to be a tendency to come back to old fashion practices in nature conservation (militarism behaviors in the park rangers, discredit to local communities opinions, land use centralized decisions originated in top-down planning processes, etc.).
We analyzed these aspects and also considered how the views and expectations of local communities and indigenous people could be incorporated into the decision making process. Is the territorial planning a battle field where conservationist planners will combat against the interest groups or already remains place to build other kind of relationship and agreement building process? An orientation to consensus building is presented while recognizing the difficulties and barriers (conceptual, technological, cultural and economic) that must be solved when planning for conservation of sustainable landscapes.
The peopleThis research would not be possible without the support of colleagues from Wageningen University, Universidad de Buenos Aires, Administración de Parques Nacionales de Argentina, University of California Davis and to the Canon National Parks Science Scholars Program.This support became in different views that enriched my research:From Wageningen, a very deep perception about the interactions among proactive land use planning, farming styles, global markets and methodological approach determined the principal axis of this thesis.From Buenos Aires, the tuning to the arena where are interrelated the social demands and the conservation matters allowed me to also direct my attention to these research fields.From Parques Nacionales, the feedback from superintendents and park rangers working at the field level helped me to recognize the challenges of the real world that should be faced in the application of the products of this research.From UC Davis, a sense about how different and complex could become be the style of the planning research and applications in an environment where is a very open field for the stakeholders interaction.From Canon National Parks Science Program, a deep valuation of the relevance of the national parks worldwide. This relevance is related not only in terms of biodiversity conservation but also for the ecological services of the protected areas. As well, each seminar retreat supposed an amazing feedback from a brilliant group of colleagues.To all these friends and enthusiastic colleagues my deepest gratitude!
143
Chapter 7 – General summary

SAMENVATTING PROEFSCHRIFT
De context van het onderzoekHabitat fragmentatie is een cruciaal gegeven in de hele huidige wereld en dus ook in de Yungas, een subtropisch montaan regenwoud in het noordwesten van Argentinië. Het hier gepresenteerde onderzoek heeft tot doelstelling instrumenten te ontwikkelen om het proces van fragmentatie te analyseren in het regenwoud van de Yungas, de ecoregio met de hoogste biodiversiteit in Argentinië. In de regio wordt het fragmentatieproces aangedreven door de omzetting van natuurlijk bos in landbouwgrond; dit bedreigt het voortbestaan van de verbindingen tussen bestaande beschermde gebieden met inbegrip van nationale en provinciale parken. Dit vormt daarmee een van de belangrijkste doelstellingen voor de natuurbescherming. Daarom is het ontwerpen van biologische corridors om de parken te verbinden een zeer belangrijke doelstelling van ons werk. Het wordt beschouwd als de basis voor een toekomstig ecologisch netwerk Een multitemporele benadering wordt gepresenteerd om de ontwikkeling te analyseren van zowel landgebruik als habitat patches. Bovendien wordt door een analyse van habitat beschikbaarheid benadrukt dat habitat beheer buiten de parkgebieden noodzakelijk is, omdat deze niet groot genoeg zijn om duurzame populaties van enkele bedreigde soorten van de ecoregio, speciaal grote zoogdieren, te laten voortbestaan.
Wegens de belangrijke rol die het spelt in connectiviteit hebben speciale aandacht besteed aan de landschapsmatrix rond de parken. Met betrekking tot deze matrix hebben we een analyse ontwikkeld van het ontbossingsproces en de daarbij horende ruimtelijke indicatoren. Een van onze doelstellingen was de historische sequentie in ontbossing te kwantificeren: een verdubbeling van de landbouwgrond in de bestudeerde periode (1973-2000 zie Tabel 2.4 en Figuur 2.4). In een studiegebied van 1.4 miljoen ha de landbouwgrond nam toe van 5.5 % tot 11 %. De andere belangrijke doelstelling was om in staat te zijn plaatsen te voorspellen waar toekomstige ontbossingen verwacht kunnen worden (Figuur 2.9). Omdat we het belangrijk vinden om te weten welke gebieden vooral een grote kans hebben ontbost te raken en waar deze tendens het meest waarschijnlijk hebben we geconcentreerd op de locatie van veranderingen meer dan op de mate van ontbossing. Ook, wordt het proces van ontbossing gedreven door krachten op hogere hiërarchische niveaus dan lokaal of regionaal. Niettemin, door een blauwdrukbenadering van de drijvende sociaaleconomische, institutionele en beleidmatige krachten op mondiaal en nationaal niveau, hebben we een conceptueel, kwalitatief model opgesteld (Figuur 2.1). Echter, verder onderzoek zou deze “patroon naar proces “ methodologie, gebaseerd op GIS en logistische regressie moeten integreren met een “proces naar patroon” benadering (meestal op basis van sociale en economische aspecten). Zo kan flexibiliteit worden geïntroduceerd die nodig is om te gaan met discontinuïteit van de processen van landgebruik en de introductie van de types van landgebruik.
Tegelijk met de analyse van de landschapsmatrix wilden we ook de habitatbeschikbaarheid evalueren en de connectiviteit van het landschap en daarvoor de Jaguar (Panthera onca) en de Ocelot (Leopardus pardalis) als doelsoorten gebruiken. Met de totale set van aanwezigheidsgegevens en een aantal potentiële verklarende variabelen hebben we een logistische regressie uitgevoerd, resulterend in een kwalitatief habitat model (Figuur 3.6). Het autocorrelatieprobleem is benaderd door in de regressieformule een term voor ruimtelijk autocorrelatie in te voegen (Tabel 3.11: Model voor afstand analyse). Vervolgens door middel van een ROC analyse (Receiver Operating Characteristics) hebben we de werking van ons habitat model geëvalueerd (AUC: 0.701).
144
Interrelated modeling of land use and habitat for the design of an ecological corridor

Connectiviteit van het landschap was de kern van het onderzoek in deze thesis. Connectiviteit is een landschapsparameter, die het mogelijk maakt processen te meten met betrekking tot de interconnecties van subpopulaties van organismen in een functionele demografische eenheid. Connectiviteit is een parameter die betrekking heeft op zowel soorten als landschappen. Omdat connectiviteit slaat op soortspecifieke kenmerken van het landschap hebben we de connectiviteitsanalyse gekoppeld aan soorten die gebruikt kunnen worden om informatie te integreren met andere groepen omdat ze hoge eisen stellen aan hun habitat. Om de beoordeling van connectiviteit tussen habitateenheden in het gebied uit te voeren, werd de jaguar, gebruikt. De gegevensreeks van ocelot was niet groot genoeg om een bruikbaar habitatmodel te ontwikkelen. Percolatietheorie, Graph theorie en een aantal analytische hulpmiddelen die hierop zijn gebaseerd (landschap metrics: correlatie lengte en de daarvan afgeleide indexen voor patch evaluatie: I - Normalized Importance Index - en A - per area importance index) zijn toegepast op de analyse van de corridors en de verbindingen tussen habitatflarden en de bijdrage en relevantie van elke patch (Figuren 4.3, 4.7 en 4.8). Ons methodologische uitgangspunt om de connectiviteitsanalyse uit te voeren was het gebruik van public domain (Pathmatrix, Patch Analyst) of wijdverspreide landschapsecologische GIS analyse tools te gebruiken (Arc View). Voorafgaande onderzoeken in het gebruik van Graph theory en connectiviteitsanalyse zijn vaak moeilijk en weinig helder beschreven in het gebruik van software. In tegenstelling hiermee is onze benadering volledig reproduceerbaar en maakt het gebruik van connectiviteitsevaluatie beschikbaar voor de wereld van natuurbehoud en landschapsecologie. Voorts is een evaluatie van mogelijke kwetsbaarheid − conflictgebieden waar de mogelijke landgebruiksveranderingen te verwachten zijn − inbegrepen als extra evaluatie van de voorgestelde corridoranalyse.
Drie scenario’s voor alternatieve toekomstscenario’s met verschillende prioriteitenvoor verschillende belangengroepen (ter ondersteuning van de regionale analyse) zijn ontwikkeld als analyse platform in een participatief proces voor ruimtelijke planning. Deze scenario’s zijn gebaseerd op het potentieel voor landgebruik, de toegankelijkheid van het gebied en de visies van de verschillende regionale belangengroepen (boeren, politici, natuurbeschermers). Eerst hebben we een evaluatie uitgevoerd van ons waarschijnlijkheidsmodel voor veranderingen in landgebruik op basis van onafhankelijke gegevens om na te gaan hoe goed het model de locatie van nieuwe ontbossingen zou kunnen voorspellen (Tabel 5.3 en Figuur 5.3). Het model bleek 88% van de nieuwe ontbossingen correct te voorspellen. Echter, we zien in, dat het model beperkt is omdat het gebaseerd is op de settings van de directe omgeving en niet erg flexibel voor de drijvende krachten op hoger hiërarchisch schaalniveau. De ruimtelijke configuratie van de drie scenario’s maakte het mogelijk om potentiële uitbreiding van landbouwgrondgebieden te voorzien, de beschikbaarheid van habitat voor de doelsoorten en de alternatieven voor connectiviteit in het landschap evenals een differentiërende invloed van de scenario’s op de locatie van de corridors. Deze invloed wordt geëvalueerd als mogelijke omzettingen van natuurlijk bos in de potentiële ecologische corridors.
Ten slotte eindigen we met een overweging ten aanzien van het huidige planning procedures in de planning van natuurbeschermingsgebieden, de vooringenomenheid of onbewuste voorkeuren en de problemen die kunnen voorkomen in relatie met eenzijdige gezichtspunten. Het concept van ecologische ‘apartheid’ − dit is de gewoonlijk eenzijdige kijk op ruimtelijke planning − wordt zelden geïncorporeerd in onderzoek als een zaak van nadere analyse en een tegenwicht in de praktijk van natuurbeheersplanning. Het lijkt nauwelijks te leiden tot de erkenning van vooroordelen ten aanzien van het samenleven van mensen en natuurlijke soorten. Naast de beschouwing van de talrijke
145
Chapter 7 – General summary

voorbeelden hiervan schijnt er een schuchtere ontwikkeling te ontstaan om af te komen van de ouderwetse opvattingen in natuurbehoud (militaristisch gedrag bij park beheerders, wantrouwen naar de lokale gemeenschappen, gecentraliseerde beslissingen vanuit een top-down planning proces). We hebben nader geanalyseerd hoe deze zaken en de visies en verwachtingen van de locale gemeenschappen en de indigene groepen betrokken kunnen worden in het besluitvormingsproces. Is ruimtelijke planning een slagveld, waar planners op gebied van natuurbescherming strijden met belangengroepen of blijft er ook plek over om een relatie op te bouwen een proces om het samen eens te worden? Een richting naar het ontwikkelen van consensus wordt gepresenteerd, hoewel we ons realiseren dat er vele moeilijkheden en barrières zijn (conceptuele, technologische, culturele en economische), zie opgelost moeten worden in het planningsproces van de instandhouding van duurzame landschappen.
De mensenDit onderzoek zou niet mogelijk zijn geweest zonder de steun van de collega’s van Wageningen Universiteit, de Universiteit van Buenos Aires, de Administratie van de Parques Nacionales de Argentina, de Universiteit van Davis Californië en de Canon National Parks Science Scholars Program.Hun steun kwam op verschillende wijzen en hebben mijn werk op verschillende manieren verrijkt:Een zeer diepgaand begrip van landgebruiksplanning wereldmarkten en methodische aanpak vanuit Wageningen hebben de hoofdas van dit proefschrift bepaald. Vanuit Buenos Aires was het mogelijk me in wetenschappelijke zin te richten op de afstemming van deze velden in de arena, waar sociale vraagstukken en natuurbehoudsbelang elkaar ontmoeten. Vanuit Parques Nacionales hebben de verbindingen met het land via superintendents en park rangers me geholpen de uitdagingen die de toepassing van de resultaten van dit proefschrift met zich mee kan brengen.Vanuit Davis de bijdrage is het begrip van de complexiteit van planningsonderzoek, en haar toepassing in het veld in open interactie met de stakeholders.Canon NP Science Program heft bevestigd hoe zeer relevant nationale parken in de hele wereld zijn. Deze relevantie is niet alleen verbonden met termen van het behoud van biodiversiteit maar ook aan diensten van ecosystemen die ons geleverd worden door beschermde gebieden. Bovendien, ieder symposium leverde een verbazingwekkende hoeveelheid feedback van een groep briljante collega’s.Aan al deze vrienden, vriendinnen en enthousiaste collega’s: mijn diepste dankbaarheid
146
Interrelated modeling of land use and habitat for the design of an ecological corridor
RESUMEN GENERAL
El contexto de la investigaciónLa fragmentación del hábitat es un tema crucial para la conservación de la naturaleza en todo el mundo así como en las Yungas, una selva latifoliada subtropical nublada de montaña en el noroeste de Argentina. Nuestra investigación apuntó a desarrollar herramientas para analizar el proceso de fragmentación del hábitat relacionado con la deforestación en el Bosque de Yungas, una de las ecorregiones más ricas en biodiversidad de Argentina. Un proceso de fragmentación conducido por la conversión del bosque nativo en áreas para la agricultura está ocurriendo a lo largo de la región, y esto reduce la conectividad entre parches remanentes de bosque intacto, muchos de los cuales están localizados dentro de áreas protegidas existentes, incluyendo parques nacionales y provinciales. Mantener y restaurar la conectividad constituye uno de los principales objetivos para la conservación de la naturaleza en el país.
Un objetivo principal de nuestro proyecto lo constituyó la definición de corredores biológicos conectando áreas protegidas. Esto fue concebido como una base para el desarrollo de una futura red ecológica. Un enfoque multi-temporal es presentado para analizar tanto la evolución del uso del territorio como de los parches de hábitat. Un análisis complementario de disponibilidad de hábitat indicó la necesidad de implementar prácticas proactivas de manejo de hábitat más allá de los parques ya que estos no son lo suficientemente grandes para sostener poblaciones sustentables de algunas especies amenazadas de la ecorregión, particularmente los grandes mamíferos.
Nosotros prestamos especial atención para identificar las condiciones de la matriz del paisaje que existe entre los parques. Para esto, analizamos el proceso de deforestación y los factores que determinaron este proceso. Uno de nuestros objetivos fue cuantificar la secuencia histórica de la deforestación, concluyendo que el área agrícola fue duplicada durante el período estudiado (1973-2000, ver Tabla 2.4 y Figura 2.4). En una región de 1.4 millones de hectáreas esto representó un incremento de 5.5 % a 11 %. El otro objetivo fue desarrollar un modelo espacial de probabilidad con capacidades para predecir la localización de futuros desmontes (Figura 2.9).
Nuestra prioridad estaba dada en conocer cuales áreas eran más inestables y proclives a futuras deforestaciones, para ello centramos la atención en describir la localización de los cambios más que en la tasa de deforestación, la cual es conducida por fuerzas que operan a nivel nacional y global en lugar del nivel local o regional. Producimos un modelo conceptual, cualitativo de uso del territorio y cambio de cobertura siguiendo un enfoque de análisis sustantivo y sintético como aproximación a los conductores de cambio de tipo socioeconómico, institucional y político a nivel global y nacional. La investigación futura debería integrar esta metodología “de patrones a procesos” basada en SIG y regresión logística, con un enfoque de “procesos a patrones” (mayormente basado en aspectos sociales y económicos). Esta integración puede aportar flexibilidad para manejar discontinuidades en los procesos de uso del territorio y en la introducción de nuevos usos de la tierra en la región.
Junto con el análisis de uso del territorio en la matriz de paisaje deseábamos evaluar la disponibilidad de hábitat y su conectividad usando al jaguar (Panthera onca) y el ocelote (Leopardus pardalis) como especies focales. Usando datos de presencia y un conjunto de variables naturales y humanas realizamos un análisis de regresión logística que nos permitió producir un modelo de calidad de hábitat (Figura
147
Chapter 7 – General summary

3.6). Para poder tratar el problema de autocorrelación espacial entre variables introdujimos un término de autocorrelación espacial en la ecuación de regresión (Tabla 3.11: modelo de Distancia). Obtuvimos este término de un análisis escala-dependiente e identificación aleatoria para coberturas de datos de puntos. Finalmente usamos ROC para evaluar el desempeño general de nuestro modelo de hábitat (AUC: 0.701).
La conectividad del paisaje fue un aspecto principal de investigación en esta tesis. Conectividad es un parámetro de funcionamiento del paisaje y mide procesos que hacen posible las interconexiones de sub poblaciones de organismos en una unidad demográfica funcional. Conectividad es a la vez un parámetro especie-específico y paisaje-específico. Como parámetro especie-específico nosotros orientamos el análisis hacia un grupo de especies, los cuales nos servían para integrar información de valor para otros grupos. El análisis de conectividad entre parches de hábitat en la región fue realizado usando un felino, el jaguar, el cual tiene grandes requerimientos de hábitat. Los datos correspondientes a ocelote no fueron suficientemente numerosos para permitir la elaboración de un modelo de hábitat válido. Teoría de percolación, teoría de grafos y un conjunto de herramientas analíticas basadas en este marco conceptual (el índice o métrica de ecología de paisaje: longitud de correlación -C-) fueron utilizados en el análisis de los corredores y conexiones entre parches de hábitat y la contribución y relevancia de cada parche (Figuras 4.3, 4.7 y 4.8).
Usamos programas de dominio público de ecología de paisaje (Pathmatrix, Patch Analyst, Buffer theme builder, Fragstats) y un programa ampliamente difundido de análisis de SIG (Arc View) para desarrollar el análisis de conectividad. Algunas investigaciones previas basadas también en teoría de grafos y análisis de conectividad produjeron justificaciones no muy claras de los aspectos metodológicos utilizados y los programas empleados. En cambio, nuestro enfoque es replicable y extiende el valor de la evaluación de conectividad a otras prácticas relacionadas con conservación de la naturaleza y ecología de paisaje. Una evaluación de vulnerabilidad y áreas conflictivas asociadas con probabilidad de conversión de uso del territorio fue también incluida como una medida adicional del diseño de corredores propuesto.
Tres escenarios posibles fueron desarrollados en relación a las distintas asignaciones de prioridad efectuadas por diferentes actores de interés de la región. Esta modelización puede ser usada como una plataforma de análisis en un proceso participativo de planificación territorial. Los actores de interés comprenden a los productores agropecuarios, empresarios turísticos, planificadores regionales, políticos, conservacionistas y los escenarios fueron basados en sus visiones sectoriales en combinación con datos de uso del territorio y accesibilidad. Previamente, llevamos a cabo una validación del modelo de probabilidad de cambio de uso del territorio y cobertura (modelo de regresión logística LUCC) empleando una fuente independiente de datos (Tabla 5.3 y Figura 5.3). El modelo predijo correctamente la localización de los nuevos desmontes en un 88 % de los casos.
Reconocemos que los resultados de la aplicación de este modelo de uso y cambio del territorio están restringidos al contexto de nuestro estudio, y el modelo no está incorporando los efectos de fuerzas conductoras que funcionan a niveles jerárquicos superiores. La configuración espacial de los tres escenarios permitió predecir la expansión potencial de áreas agrícolas, la disponibilidad de hábitat para la vida silvestre y la conectividad entre configuraciones alternativas de paisaje, y también permitió evaluar la influencia de estos escenarios en el diseño de corredores. Estas influencias son evaluadas
148
Interrelated modeling of land use and habitat for the design of an ecological corridor
como posible conversiones de bosque nativo incluidas en el interior de los corredores. También es presentada una metodología comparativa del patrón agrícola resultante de los escenarios.
Finalmente, nosotros incluimos una reflexión sobre los procedimientos del proceso de planificación en conservación de la naturaleza que son utilizados actualmente así como las desviaciones y problemas que pueden ocurrir si visiones unilaterales son aplicadas en planificación territorial. El concepto de separatismo ecológico: la aplicación de una visión unilateral para el ordenamiento territorial, ha sido raramente incluido como un tema de análisis, y representa un factor que afecta la eficacia en la planificación de la conservación. Parece arduo reconocer que existe un prejuicio subyacente acerca de la posibilidad de coexistencia de la vida silvestre y los seres humanos. Más allá de la consideración de numerosos ejemplos acerca de este hecho parece ser que existe una tendencia a volver a viejas prácticas en conservación de la naturaleza (comportamiento militarista de los guardaparques, descrédito a opiniones de las comunidades locales, decisiones sobre uso del territorio centralizadas y originadas en procesos de planificación verticalista, etc.).
Nosotros analizamos estos aspectos y también consideramos como las visiones y expectativas de las comunidades locales y pueblos indígenas podrían ser incorporadas en el proceso de toma de decisiones. ¿La planificación territorial es un campo de batalla donde los planificadores de agencias de conservación combatirán contra los grupos de interés o todavía hay lugar para construir otra clase de relaciones y procesos de construcción de acuerdos? Una orientación hacia la construcción de consensos es presentada mientras que reconocemos las dificultades y barreras (conceptuales, tecnológicas, culturales y económicas) que deben ser resueltas cuando se planifica para la conservación de paisajes sustentables.
La genteEsta investigación no hubiera sido posible sin el apoyo de colegas de la Universidad de Wageningen, la Universidad de Buenos Aires, la Administración de Parques Nacionales de Argentina, la Universidad de California Davis y el Programa Canon para Investigadores Científicos de Parques Nacionales.Este apoyo devino en diferentes visiones que enriquecieron mi investigación:De Wageningen, una percepción muy profunda acerca de interacciones entre planificación territorial proactiva, estilos de producción agrícola, mercados globales y aspectos metodológicos que determinaron el eje principal de esta tesis.De Buenos Aires, el ajuste al terreno donde están interrelacionados las demandas sociales y los aspectos de conservación que me permitieron orientar mi atención a estas áreas de investigación.De Parques Nacionales, la retroalimentación que provino de Intendentes de parques y guardaparques trabajando a campo y me ayudaron a reconocer los desafíos del mundo real que deben ser contemplados en la aplicación de los productos de esta investigación.De UC Davis, un sentido de cuan diferente y complejo puede ser el estilo de una investigación en planificación y sus aplicaciones en un ambiente donde existe un marco muy abierto para la interacción de los grupos de interés.Del programa Canon, una profunda valoración de la relevancia de los parques nacionales alrededor del mundo. Esta relevancia está relacionada no solamente en términos de conservación de biodiversidad sino también en cuanto a los servicios ecológicos de las áreas protegidas. Asimismo, cada seminario supuso una increíble retroalimentación con un grupo de colegas brillante.¡A todos estos amigos y entusiastas colegas mi más profunda gratitud!
149
Chapter 7 – General summary

Acknowledgements 2 – Agradecimientos 2
150
Interrelated modeling of land use and habitat for the design of an ecological corridor
IALE - Argentine ChapterFirst Meeting.
University of Buenos Aires,November 2005:
Prof. Dr. Jorge Morello, the author,Prof. Dr. Huub van Lier
and Dr. Rob Jongman
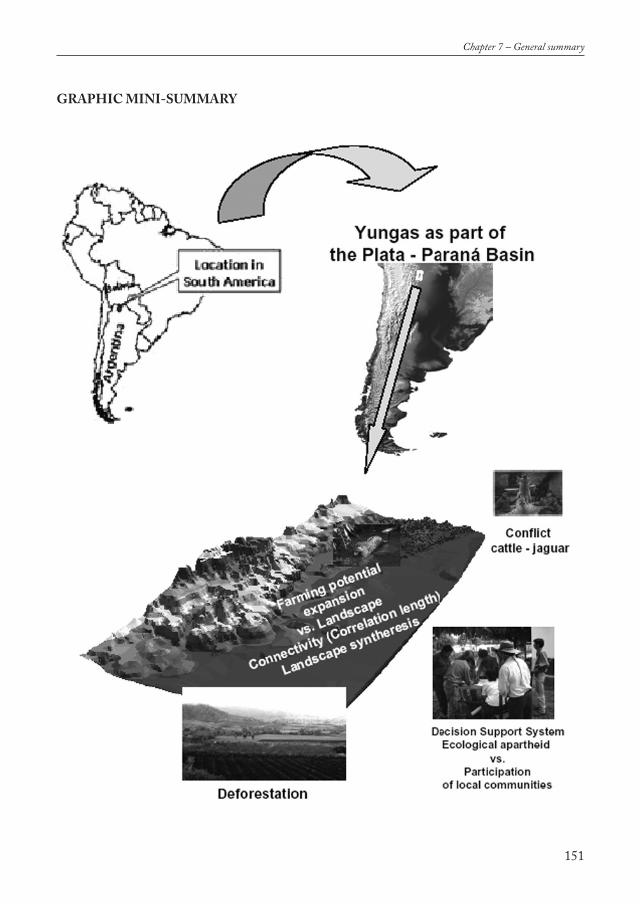
GRAPHIC MINI-SUMMARY
151
Chapter 7 – General summary


References
153

154

REFERENCES
Alciro, D., 2006. Juicio a la Soja (Trial to the Soy). Mercado 1057 (in Spanish). Available at: http://www.mercado.com.ar/mercado/vernota.asp?id_producto=1andid_edicion=1057andid_nota=22
Allen, T.F.H. and Starr, T.B., 1982. Hierarchy: perspectives for ecological complexity. University of Chicago Press, Chicago, Illinois, USA. 310 pp.
Angelsen, A., and Kaimowitz, D., 1999. Rethinking the Causes of Deforestation: Lessons from Economic Models. The World Bank Research Observer 14: 73-98.
Aranda, M., 1990. El jaguar (Panthera onca) en la Reserva Calakmul México: morfometría, hábitos alimentarios y densidad de población. Tesis de Maestría. Universidad Nacional Autónoma de Costa Rica, Heredia, Costa Rica.
Argentinean Government, Environment Secretariat, 2005. Convención sobre la conservación de las especies migratorias de animales silvestres (CMS). Argentine report to COP 8, Buenos Aires, 2005. 69 pp. (in Spanish) Available at: http://www.cms.int/bodies/COP/cop8/documents/meeting_docs/NR/NationalReport_Argentina05.pdf
Austin, M.P., 2002. Spatial prediction of species distribution: an interface between ecological theory and statistical modeling. Ecological Modeling 157: 101-118. Available at: http://www.nwf.org/nationalwildlife/article.cfm?issueID=18andarticleID=144
Bambar, D., 1975. The area above the ordinal dominance graph and the area below the receiver operating graph. Journal of Mathematical Psychology 12: 387-415.
Bani, L., Baietto, M., Bottoni, L. and Massa, R., 2002. The Use of Focal Species in Designing a Habitat Network for a Lowland Area of Lombardy, Italy. Conservation Biology 16, 3: 826-831.
Bárquez, R.M., Mares, M.A., and Braun, J.K., 1999. The bats of Argentina. Special Publications. Museum of Texas Technological University, 42: 1-275.
Beier, P., 1993. Determining minimum habitat areas and habitat corridors for cougars. Conservation Biology 7: 94-108.
Beier, P. and Noss, R., 1998. Do habitat corridors provide connectivity?. Conservation Biology, 12, 6: 1241-1252.
Beier P., Penrod, K., Luke, C., Spencer, W. and Cabañero, C., 2006. South Coast missing linkages: restoring connectivity to wildlands in the largest metropolitan area in the United States. In: Crooks, K.R. and Sanjayan, M.A. (eds.): Connectivity and conservation. Cambridge University Press, London, United Kingdom. 726 pp.
Bennett, A., 1997. Habitat linkages-a key element in an integrated landscape approach to conservation. Parks, 7, 1: 43-49.
Bennett, A.F., 1999. Linkages in the Landscape: The Role of Corridors and Connectivity in Wildlife Conservation. IUCN, Gland, Switzerland. 254 pp.
Betts, M.G., Diamond, A.W., Forbes, G.J., Villard, M.A., and Gunn, J.S. 2006. The importance of spatial autocorrelation, extent and resolution in predicting forest bird occurence. Ecological Modelling. 9: 197-224.
Binzenhofer, B., Schroder, B., Strauss, B., Biedermann, R., and Settele, J., 2005. Habitat models and habitat connectivity analysis for butterflies and burnet moths-the example of Zygaena carniolica and Coenonympha arcania. Biological Conservation 126: 247-259.
Bontkes, T. S. and van Keulen, H., 2003. Modelling the dynamics of agricultural development at farm and regional level. Agricultural Systems 76: 379-396.
155
References
Borenstein, D., 1998. Towards a practical method to validate decision support systems. Decision Support Systems 23: 227–239.
Brandt, J., Primdahl, J. and Reenberg, A., 1999. Rural land-use and dynamic forces-analysis of ‘driving forces’ in space and time,pp. 81-102. In: Krönert, R., Baudry, J., Bowler, I.R. and Reenberg A. (eds.): Land-use changes and their environmental impact in rural areas in Europe, UNESCO, Paris, France.
Briers, R.A., 2002. Incorporating connectivity into reserve selection procedures. Biological Conservation 103: 77-83.
Brown, D.E. and López-González, C.A., 2000. Search for El Tigre. Defenders Magazine, Spring 2000. Defenders of Wildlife, Washington, DC, US. Available at: http://www.defenders.org/magazinenew/Spring2000/eltigre.pdf
Brown, A.D., Grau, A., Lomáscolo, T. and Gasparri, N.I., 2002. Una estrategia de conservación para las selvas subtropicales de montaña (Yungas) de Argentina. Ecotrópicos 15: 147-159.
Bunn, A.G., Urban, D.L. and Keitt, T.H., 2000. Landscape connectivity: A conservation application of graph theory. Journal of Environmental Management 59: 265-278. Available at: http://www.idealibrary.com
Bunnell, F., and Boyland, M., 2003. Decision-support systems: it’s the question not the model. Journal for Nature Conservation 10, 4: 269-279.
Burgman, M.A. and Lindenmayer, D.B., 1998. Conservation Biology for the Australian Environment. Surrey Beatty and Sons, Chipping Norton, Sydney. 380 pp.
Bürgi, M., Hersperger, A.M., and Schneeberger, N., 2004. Driving forces of landscape change-current and new directions. Landscape Ecology 19: 857-868.
Burkart, R., (ed.), 1994a. El sistema nacional de áreas naturales protegidas de la Argentina, Diagnóstico de su Patrimonio Natural y su Desarrollo Institucional (The national system of protected areas of Argentina, Diagnosis of its natural heritage and institutional development). Administracion de Parques Nacionales, Buenos Aires, Argentina. 220 pp. (in Spanish)
Burkart, R., 1994b. Use and management of natural resources in Argentina’s protected areas. Unasylva, 45: 8-14.
Burkart, R., Bárbaro, N.O., Sánchez, R.O. and Gómez, D.A., 1999. Ecoregiones de la Argentina (Ecoregions of Argentina). Administración de Parques Nacionales, Buenos Aires, Argentina, 43 pp. (in Spanish).
Burnham, K.P., and Anderson, D.R., 1998. Model selection and inference: a practical information-theoretic approach. Springer-Verlag, New York, New York, USA. 353 pp.
Burnham, K.P., and Anderson, D.R., 2002. Model selection and multimodel inference: a practical information-theoretic approach. 2nd Edition. Springer-Verlag, New York, New York, USA. 488 pp.
Cabinet Coordinator Minister-Argentine Government, 2004. Memoria Anual del estado de la Nación, Buenos Aires, Argentina. Available at: http://www.jgm.gov.ar/Paginas/MemoriaDetallada04/Anexos2004MinRelaciExteriores.pdf (in Spanish)
Cabrera, A. and Willink, A., 1973. Biogeografía de América Latina. Secretaría General de la OEA, Monografía N°13, Serie de Biología. OEA, Washington DC, USA. 120 pp. (in Spanish)
Cabrera, A.L., 1976. Regiones fitogeográficas argentinas (Phytogeographic Argentinean regions). Buenos Aires, ACME, 85 pp. (in Spanish).
Calabrese, J.M. and Fagan, W.F., 2004. A comparison shoppers’ guide to connectivity metrics: trading off between data requirements and information content. Frontiers in Ecology and the Environment 2: 529-536.
156
References

Campbell, A., 2000. Contrasting Perspectives: young countries in old landscapes and old countries in young landscapes. In: Hamblin, A. (ed.), 2000. Visions of Future Landscapes. Proceedings of 1999 Australian Academy of Science Fenner Conference on the Environment, 2-5 May 1999, Canberra. Bureau of Rural Sciences, Canberra. 328 pp. Available at: http://affashop.gov.au/PdfFiles/PC12831.pdf
Campbell, A., 2006. Landscapes, Lifestyles and Livelihoods. Outlook for young professionals. Land and Water Australia, Canberra, Australia. 21 pp. Available at: http://youngengineers.com.au/vic/news/documents/060509YP.pdf
Cantwell, M.D., and Forman, R.T.T., 1993. Landscape graphs: ecological modeling with graph theory to detect configurations common to diverse landscapes. Landscape Ecology 8, 4: 239-251.
Carman, J. and Keitumetse, S., 2005. Talking about Heritage and Tourism. SAA Archaeological Record 5, 3: 39-41.
Carroll, C., Noss, R. and Paquet, P., 2001. Carnivores as focal species for conservation planning in the Rocky Mountain region. Ecological Applications 11, 4: 961-980.
Caso, A., 1994. Home range and habitat use of three neotropical carnivores in northeast Mexico. M.S. thesis, Texas A&M University, Kingsville, Texas, USA. 78 pp. Available at: http://www2.for.nau.edu/research/pb1/Service/ocelot/Caso_Thesis.pdf
Chardon, J.P., Adriaensen, F. and Matthysen, E., 2003. Incorporating landscape elements into a connectivity measure: A case study for the speckled wood butterfly (Pararge aegeria L.). Landscape Ecology 18: 561-573.
Clark, J.S., Lewis, M., and Horvath, L., 2001. Invasion by extremes: population spread with variation in dispersal and reproduction. American Naturalist 157, 5: 537-54.
Conservation International, 2000. Ecosystem Profile Vilcabamba-Amboró Forest Ecosystem of the tropical Andes. Biodiversity Hotspot. Peru and Bolivia. Final version CEPF Program, Washington DC, USA.ndes Conservation International, CEPF Program, Washington DC, USA. Deecember 14, 2000. 38 pp. Available at: http://www.cepf.net/ImageCache/cepf/content/pdfs/final_2etropicalandes_2evilcabamba_2damboro_2eep_2epdf/v1/final.tropicalandes.vilcabamba_2damboro.ep.pdf
Coppolillo, P, Gomez, H., Maisels, F., and Wallace, R., 2004. Selection criteria for suites of landscape species as a basis for site-based conservation. Biological Conservation 115: 419-430.
Correa, C.M., 2006. La disputa sobre soja transgénica. Monsanto vs. Argentina. (The dispute on genetic modified soy. Monsanto vs. Argentina). Le Monde Diplomatique, South American edition, 82. April 2006. (in Spanish)
Cowling, R., 1999. Planning for persistence-systematic reserve design in southern Africa’s Succulent Karoo Desert. Parks, 9: 1: 17-30.
Cowling, R.M., Pressey, R.L., Lombard, A.T., Desmet, P.G. and Ellis, A.G., 1999. From Representation to Persistence: Requirements for a Sustainable Reserve System in the Species-Rich Mediterranean-Climate Deserts of Southern Africa. Diversity and Distributions 5: 51 -71.
Crawshaw, P.G.J. and Quigley, H.B., 1989. Ocelot movement and activity patterns in the Pantanal region, Brazil. Biotropica, 21, 4: 377-379.
Crawshaw, P.G.J. and Quigley, H.B., 1991. Jaguar spacing, activity and habitat use in a seasonaly flooded environment in Brazil. Journal of Zoology, London, 223: 357-370.
Crawshaw, P.G.J., 1995. Comparative ecology of ocelot (Felis pardalis) and jaguar (Panthera onca) in a protected subtropical forest in Brazil and Argentina. Ph.D. diss. University of Florida, Gainesville, Florida, USA. 189 pp.
Cresswell, J.E., Osbourne, J.L., and Goulson, D., 2000. An economic model of the limits to foraging range in central place foragers with numerical solutions for bumblebees. Ecological Entomology 25, 3: 249-55.
157
References

Creswick, R.J., Farach, H.A. and Poole, C.P. Jr., 1992. Introduction to renormalization group methods in physics. John Wiley, New York, New York, USA. 409 pp.
Daniele, C., Somma, D., Aued, B., Bachmann, L., and Frassetto, A., 2002. Land Use Planning and Nature Conservation in the Northwest of Argentina: Evolution of the Landscape Fragmentation and its Consequences. In: Proceedings of 29th International Symposium on Remote Sensing of Environment “Information for Sustainability and Development” (Paper Reference 8.71). Buenos Aires, Argentina.
Davidson, C., 1998. Issues in measuring landscape fragmentation. Wildlife Society Bulletin 26: 32-37.
Davies, Z.G. and Pullin, A.S., 2006. Do hedgerow corridors increase the population viability of woodland species? Systematic Review No. 8. Part A. Centre for Evidence-Based Conservation, University of Birmingham, Birmingham, UK.
Decker, D.J. and Chase, L.C., 1997. Human dimensions of living with wildlife - a management challenge for the 21st century. Wildlife Society Bulletin 25:788-975.
Deichmann, U., 1997a. Accessibility and Spatial Equity in the Analysis of Service Provision, Workshop on Geographical Targeting for Poverty Reduction and Rural Development, The World Bank, Washington, D.C., USA, November 1997.
Deichmann, U., 1997b. Accessibility indicators in GIS. Department for Economic and Social Information and Policy Analysis. United Nations Statistics Division. 24 pp.
Deichmann, U. and Bigman, D., 2000. Land use change modelling: current practice and research prior Spatial indicators of access and fairness for the location of public facilities. pp. 181-206. In Bigman, D. and Fofack, H. (eds.) Geographic targeting for poverty alleviation, methodology and application. World Bank, Regional and Sectoral Studies, Washington DC, USA. 322 pp.
Del Castillo, L., 2003. The Iruya River Basin: A Severe Erosion Process. Waterweek 21 workshop oral, December, 6th 2003. Sustainable Water Resources Research Center, Korea. Available at: http://www.water21.re.kr/nimage/down/waterweek1-oral.pdf
Delibes, M., Gaona, P. and Ferreras, P., 2001. Effects of an Attractive Sink Leading into Maladaptive Habitat Selection. The American Naturalist. 158: 277–285.
De Lima Pufal, V., Buschbacher, R. and Garcia, A., 2000. Brazil: Cerrado. pp. 95-125. In: Wood, A., Stedman-Edwards, P., and Mang, J. (eds.), 2000. The Root Causes of Biodiversity Loss. World Wildlife Fund and Earthscan Publications Ltd., London, UK. 304 pp.
Dellafiore, C.M. and Maceira, N.O., 1998. Problemas de conservación de los ciervos autóctonos de la Argentina (Conservation problems of Argentinean native deers). Journal of Neotropical Mammalogy 5, 2: 137-145 (in Spanish).
D’Eon, R.G., Glenn, S. M., Parfitt, I. and Fortin, M.J., 2002. Landscape connectivity as a function of scale and organism vagility in a real forested landscape. Conservation Ecology 6, 2: 10. [online] Available at: http://www.consecol.org/vol6/iss2/art10
Dickson, B., Jenness, J. and Beier, P., 2005. Influence of vegetation, topography, and roads on cougar movement in Southern California. Journal of Wildlife Management 69, 1: 264-276.
Dinerstein, E., Powell, G., Olson, D., Wikramanakaye, E., Abell, R., Loucks, C., Underwood, E., Allnutt, T., Wettengel, W., Ricketts, T., Strand, H., O`Connor, S. and Burgess, N., 2000. A workbook for conducting biological assessments and developing biodiversity visions for ecoregion-based conservation. Conservation Science Program, WWF, Washington DC, USA.
Dirzo, R. 2001. Forest ecosystems functioning, threats and value: Mexico as a case study. pp 47-64. In: Hollowell, V. (ed.): Managing Human-Dominated Ecosystems. Monographs in Systematic Botany from the Missouri Botanical Garden Vol 84. Missouri Botanical Garden Press. Saint Louis, Missouri, USA. 371 pp.
158
References
Dickson, B., Jenness, J. and Beier, P., 2005. Influence of vegetation, topography, and roads on cougar movement in southern California. Journal of Wildlife Management 69 (1) : 264-276.
Drechsler, M., 2004. Model-based conservation decision aiding in the presence of goal conflicts and uncertainty. Biodiversity and Conservation 13: 141-164.
Drielsma, M. and Ferrier, S., 2006. Landscape scenario modeling of vegetation condition. Ecological Management and Restoration, 7, 1: 45-52.wellublishi
Dros, J.M., 2004. Managing the soy boom: Two scenarios of soy production expansion in South America, AIDEnvironment, Amsterdam, The Netherlands. 65 pp.
Elith J. and Burgman M.A., 2002. Predictions and their validation: rare plants in the Central Highlands, Victoria, Australia. pp. 303-14. In: Scott, J.M., Heglund, P.J., Morrison, M.L.., Raphael, M.G., Wall, W.A., and Samson, F.B. (eds.): Predicting Species Occurrences: Issues of Accuracy and Scale. Island Press, Covelo, California, USA. 840 pp.
Elkie, P.C., Rempel, R.S. and Carr, A.P., 1999. Patch Analyst User’s Manual: A tool for quantifying landscape structure. Ontario Ministery of Natural Resources, Northwest Science and Technology. Thunder Bay, Notario, Canada. TM-002. 16 pp and appendix.
Emmons, L.H., 1988. A field study of ocelots (Felis pardalis) in Peru. Revue d’Ecologie: (Terre et Vie), 43:133-157.
Ennis, M., Hinton, G., Naylor, D., Revow, M. and Tibshirani, R., 1998. A comparison of statistical learning methods on the GUSTO database. Statistics in Medicine, 17: 2501-2508.
Environment Secretariat, Argentinean Government, 2005. Convención sobre la conservación de las especies migratorias de animales silvestres (CMS). Argentine report to COP 8, Buenos Aires, 2005 (in Spanish). 69 pp. Available at: http://www.cms.int/bodies/COP/cop8/documents/meeting_docs/NR/NationalReport_Argentina05.pdf
EPA, 2004. BASINS, version 3.0, User Manual. United States Environmental Protection Agency. 823 C04-004. 343 pp.
ESRI, 1998. Arc View, User Manual, Environmental Systems Research Institute, Redlands, California, USA, 366 pp.
Estrada, A. and Estrada-Coates, R., 2001, Bat species richness in live fences and in corridors of residual rain forest vegetation at Los Tuxtlas, Mexico. Ecography 24: 94-102.
Estrada-Peña, A., 2003. The relationships between habitat topology, critical scales of connectivity and tick abundance Ixodes ricinus in a heterogeneous landscape in northern Spain. Ecography 26, 5: 661-671.
Fabos, J. G., 1985. Land Use Planning: From Local to Global Challenge, Chapman & Hall, New York. 223 pp.
Fagan, W.F., 2002. Connectivity, fragmentation, and extinction risk in dendritic metapopulations. Ecology 83: 3243-3249.
Fahrig, L. and Merriam, G., 1985. Habitat patch connectivity and population survival. Ecology 66, 6: 1762-1768.
Fahrig, L. and Paloheimo, J.E., 1988. Determinants of local population size in patchy habitats. Theoretical Population Biology, 34: 194-213.
Fahrig, L., 2003. Effects of habitat fragmentation on biodiversity. Annual Review of Ecology, Evolution and Systematics. 34: 487-515.
Farrell, L., Roman, J. and Sunquist, M. 2000. Dietary separation of sympatric carnivores identified by molecular analysis of scats. Molecular Ecology, 9: 1583-1590.
159
References

Farrow, A. and Nelson, A., 2001. Accessibility Modelling in ArcView 3. An extension for computing travel time and market catchment information. International Center for tropical agriculture, Cali, Colombia. pp. Available at: http://www.ciat.cgiar.org/access/pdf/ciat_access.pdf
Ferrier, S., Drielsma, M., Manion, G., and Watson, G., 2002. Extended statistical approaches to modeling spatial pattern in biodiversity in northeast New South Wales. II. Community-level modeling, Biodiversity and Conservation, 11, 12: 2309- 2338.
Fielding, A.H. and Haworth, P.F., 1995. Testing the generality of bird-habitat models. Conservation Biology, 9: 1466-1481.
Fischer, C.V. 1998. Habitat use by free-ranging felids in an agroecosystems. M.S. thesis, Texas A&M University, Kingsville, Texas, USA. 70 pp. Available at http: http://www2.for.nau.edu/research/pb1/Service/ocelot/Fischer_1998_Thesis_Habitat_Use.pdf
Fischer, G., and Sun, L., 2001. Model based analysis of future land use development in China. Agriculture, Ecosystems and Environment 85: 163-176.
Forman, R.T.T. and Godron, M., 1986. Landscape Ecology. John Wiley and Sons, New York. 619 pp.
Forman, R.T.T., 1995. Land mosaics: the ecology of landscapes and regions. Cambridge, New York: Cambridge University Press, 1995. 632 pp.
Franklin, J., 1993, Preserving Biodiversity: species, ecosystems or landscapes? Ecological Applications 3, 2: 202-205.
Freudenberger, D. and Brooker, L., 2004. Development of the focal species approach for biodiversity conservation in the temperate agricultural zones of Australia. Biodiversity and Conservation 13: 253-274.
Friederici, P., 1998. Return of the Jaguar. National Wildlife, Jun/Jul 1998, vol. 36 no. 4. Available at http://www.nwf.org/nationalwildlife/article.cfm?issueID=18andarticleID=144
Friedman, J.H., 1991. Multivariate adaptive regression splines (with discussion). Annals of Statistics. 19, 1-141.
Fuller, T., Mayfield, M. and Sarkar, S., 2004. Establishing Connectivity between Conservation Areas in the Transvolcanic Belt of Central Mexico. Technical Note 9. University of Texas, Biodiversity and Biocultural Conservation Laboratory.
Gardner, R.H., Milne, B.T., Turner, M.G. and O’Neill, R.V., 1987. Neutral models for the analysis of broad-scale landscape pattern. Landscape Ecology 1: 19-28.
Gardner, R.H., O`Neill, R.V., Turner, M.G., and Dale, V.H., 1989. Quantifying scale dependent efects of animal movements with simple percolation models. Landscape Ecology, 3: 217-227.
Garshelis, D.L., 2000. Delusions in habitat evaluation: measuring use, selection, and importance. Pages 111-164 in L. Boitani and T. K. Fuller, editors. Research techniques in animal ecology: controversies and consequences. Columbia University Press, New York, USA.
Garson, J., Aggarwal, A. and Sarkar, S., 2002. ResNet Manual Ver 1.2. Biodiversity and Biocultural Conservation Laboratory, Section of Integrative Biology, University of Texas at Austin. Austin, Texas, USA. 45 pp. Available at: http://uts.cc.utexas.edu/~consbio/Cons/program.html
Gasparri, N.I., Manghi, E., Montenegro, C., Strada, M., Parmuchi, M.G. and Bono, J. 2002. Mapa forestal provincia de Salta. Actualización año 2002. Buenos Aires: Unidad de Manejo del Sistema de Evaluación Forestal (UMSEF). Dirección de Bosques. Secretaria de Ambiente y Desarrollo Sustentable. Buenos Aires, Argentina. (in Spanish)
Gasparri N.I., Manghi, E., Montenegro, C., Strada, M., Parmuchi, M.G. and Bono, J., 2004. Mapa forestal provincia de Jujuy: actualización año 2002. UMSEF-Dirección de Bosques, Secretaria de Ambiente y Desarrollo Sustentable.
160
References
Geist, H. and Lambin, E., 2002. Proximate Causes and Underlying Driving Forces of Tropical Deforestation. Bioscience 52, 2: 143-150.
Gibson, C.C., Ostrom, E. and Anh, T.K., 2000. The concept of scale and the human dimensions of global change: a survey. Ecological Economics 32: 217-239.
Gonzalez, J., and Meitner, M.J., 2005. Working together for environmental management: A collaborative learning approach. Procedures of the GIS-ESRI Conference, San Diego, 2005. Paper 2039. Available at: http://gis.esri.com/library/userconf/proc05/papers/pap1188.pdf
Goodwin, B., 2003. Is landscape connectivity a dependent or independent variable? Landscape Ecology, 18: 687-699.
Grau, A. and Brown, A.D., 2000. Development threats to biodiversity and opportunities for conservation in the mountain ranges of the upper bermejo river basin, nw Argentina and sw Bolivia. Ambio, 29, 7: 455-450.
Green, D.G., 1994. Connectivity and the evolution of biological systems. Journal of Biological Systems 2, 1: 91-103.
Guisan, A., Weiss, S.B. and Weiss, A.D., 1999. GLM versus CCA spatial modeling of plant species distribution. Kluwer Academic Publishers. Plant Ecology. 143: 107-122.
Guisan, A., and Theurillat, J.P., 2000. Equilibrium modelling of alpine plant distribution: how far can we go? Phytocoenologia, 30: 353-384.
Guisan, A. and Zimmermann, N.E., 2000. Predictive habitat distribution models in ecology. Ecological Modelling. 135: 147-186.
Guisan, A. and Thuiller, W., 2005. Predicting species distribution: offering more than simple habitat models. Ecology Letters, 8: 993-1009.
Güntner, A., Seibert, J., and Uhlenbrook, S., 2004. Modeling spatial pattern of saturated areas: An evaluation of different terrain indices. Water Resources Research, Vol. 40, W05114.
Gustafson, E.J. and Parker, G.R., 1992. Relationships between landcover proportion and indices of landscape spatial change. Landscape Ecology 7: 101-110.
Gustafson, E.J., 1998. Quantifying Landscape Spatial Pattern: What Is the State of the Art?. Ecosystems, 1, 2: 143-156.
Haddad, N.M., Rosenberg, D.K. and Noon, B.R.. 2000. On experimentation and the study of corridors: response to Beier and Noss. Conservation Biology 14: 1543-1545.
Haddad, N.M. and Tewksbury, J.J., 2005. Low-quality habitat corridors as movement conduits for two butterfly species. Ecological Applications 15: 250-257.
Hagen, A., 2003. Fuzzy set approach to assessing similarity of categorical maps. International Journal of Geographical Information Science 17, 3: 235-249.
Hagen-Zanker, A., Straatman, B. and Uljee, I., 2005. Further developments of a fuzzy set map comparison approach. International Journal of Geographical Information Science 19, 7: 769-785.
Hagen-Zanker, A., Engelen, G., Hurkens, J., Vanhout, R. and Uljee, I., 2006. Map Comparison Kit 3.0. User Manual. RIKS, January 2006, Maastricht, The Netherlands. 73 pp.
Hall, C.A.S., Matossian, P.D., Ghersa, C., Calvo, J. and Olmeda, C., 2001. Is the Argentine National Economy being destroyed by the department of economics of the University of Chicago? pp. 483-498. In: Ulgiati, S., Brown, M., Giampietro, M., Herendeen, R.A. and Mayumi, K. (eds.): Advances in Energy Studies. Exploring Supplies, Constraints, and Strategies. Modesti Publisher, Padova, Italy, 698 pp.
161
References

Hanley, J.A. and McNeil, B.J., 1982. The meaning and use of the area under a receiver operating characteristic (ROC) curve. Radiology 143: 29-36.
Hanski, I., 1985. Single-species spatial dynamics may contribute to long-term rarity and commonness. Ecology, 66: 335-343.
Hanski, I., and Gilpin, M., 1991. Metapopulation dynamics: brief history and conceptual domain. Biological Journal of the Linnean Society 42:3-16.
Hanski, I., and Simberloff, D., 1997. The metapopulation approach, its history, conceptual domain, and application to conservation. pp. 5-26. In: Hanski, I.A. and Gilpin, M. E. (eds.): Metapopulation Biology. Academic Press, San Diego, California. 512 pp.
Hanski, I., and Gilpin, M.E. (eds.): 1997. Metapopulation Biology: Ecology, Genetics and Evolution. Academic Press, San Diego, California, USA. 512 pp.
Hanski, I., and Ovaskainen, O., 2000. The metapopulation capacity of a fragmented landscape. Nature, 404: 755-758.
Hargis, C.D., Bissonette, J.A. and David, J.L., 1998. The behaviour of landscape metrics commonly used in the study of habitat fragmentation. Landscape Ecology 13, 167-186.
Hargis, C.D., Bissonette, J.A. and Turner, D.L., 1999. The influence of forest fragmentation and landscape pattern on American martens. Journal of Applied Ecology 36, 1: 157-172.
Harms, B., Knaapen, J.P., and Rademakers, J.G., 1993. Landscape Planning for Nature Restoration: Comparing Regional Scenarios. pp. 197-218. In: Vos, C. and Opdam, P. (eds.), Landscape ecology of a stressed environment. Chapman & Hall, London, United Kingdom. 310 pp.
Harms, W.B., 1995. Scenarios for nature development. pp. 391-403. In: Schoute, J.F.T., Finke, P.A., Veeneklaas, F.R., and Wolfert, H.P. (eds.): Scenario Studies for the Rural Environment. Kluwer Ac. Pub, Dordrecht, The Netherlands. 776 pp.
Harris, L.D., 1984. The Fragmented Forest: Island Biogeography Theory and the Preservation of Biotic Diversity. Chicago: University of Chicago Press. 229 pp.
Harris, L.D., and Scheck, J., 1991, From implications to applications: the dispersal corridor principle applied to the conservation of biological diversity, pp. 189-220. In: Saunders, D.A., and Hobbs, R.J. (eds.): The role of corridors, Surrey Beatty, Chipping Norton, New South Wales, Australia. 456 pp.
Harris, L.D. and Silva-Lopez, G., 1992. Forest fragmentation and the conservation of biological diversity: 197-237. In: Fielder, D.L. and Jain, S.K. (eds.): Conservation Biology: The Theory and Practice of Nature Conservation, Preservation, and Management. Chapman and Hall, New York, NY, USA. 507 pp.
Harrison, S., and Fahrig, L., 1995, Landscape pattern and population conservation, pp. 293-304. In: Hansson, L., Fahrig, L, and Merriam, G. (eds.): Mosaic Landscapes and Ecological Processes, IALE Series 2, London, Chapman and Hall, UK, 380 pp.
Harveson, P.M., Tewes, M.E., Anderson, G., and Laack, L., 2004. Habitat use by ocelots in south Texas: implications for restoration. Wildlife Society Bulletin 68: 909-915.
Hatten, J.R., Averill-Murray, A., and van Pelt, W.E., 2002. Characterizing and mapping potential jaguar habitat in Arizona. Nongame and Endangered Wildlife Program Technical Report 203. Arizona Game and Fish Department, Phoenix, Arizona, USA. 32 pp.
Hatten, J.R., Averill-Murray, A. and van Pelt, W., 2005. A spatial model of potential jaguar habitat in Arizona. Journal of Wildlife Management, 69, 3: 1024-1033.
Havel, J.E., Shurin, J.B., and Jones, J.R., 2002. Estimating dispersal from patterns of spread: spatial and local control of lake invasions. Ecology 83: 3306-18.
162
References

Hoctor, T.S., Carr, M.H. and Zwick, P.D., 2000. Identifying a linked reserve system using a regional landscape approach: the Florida ecological network. Conservation Biology 14: 984-1000.
Hoctor, T.S., Carr. M.H., Zwick, P.D., and Maehr, D.S., 2004 The Florida Statewide Greenways Project: its realisation and political context. pp. 222-248. In: Jongman, R.H.G. and Pungetti, G. (eds.): Ecological Networks and Greenways: Concept, Design, Implementation. Cambridge University Press, Cambridge, UK. 368 pp.
Holling, C.S., and Meffe, G.K., 1996. Command and control and the pathology of natural resource management. Conservation Biology 10: 328-337.
Hootsmans, M. and Kampf, H., 2004. Ecological Networks: Experiences in the Netherlands. “A joint responsibility for connectivity”. Working paper, LNV, The Hague, The Netherlands, 12 pp.
Hoshino, S., 2001. Multilevel modeling on farmland distribution in Japan. Land Use Policy 18: 75-90.
INDEC, 2002. Censo Nacional de Población, Hogares y Vivienda 2001 (Nacional Census of Population, Households and Homes 2001). Instituto Nacional de Estadística y Censo (Nacional Census Bureau), Buenos Aires, Argentina. (in Spanish or English). Available at: www.indec.gov.ar
Iverson, L.R., Prasad, A.M. and Schwartz, M.W., 2005. Predicting Potential Changes in Suitable Habitat and Distribution by 2100 for Tree Species of the Eastern United States. Journal of Agricultural Meteorology, 61, 1: 29-37.
Janssen, M., Goosen, H. and Omtzigt, N., in press. A simple mediation and negotiation support tool for water management in the Netherlands. Landscape and Urban Planning. Available at: http://www.public.asu.edu/~majansse/pubs/lup.pdf
Jenness, J., 2004. Nearest features (nearfeat.avx) extension for ArcView 3.x, v. 3.8a. Jenness Enterprises. Available at: http://www.jennessent.com/arcview/nearest_features.htm
Jenness, J. 2005. Random point generator (randpts.avx) extension for ArcView 3.x, v. 1.3. Jenness Enterprises. Available at: http://www.jennessent.com/arcview/random_points.htm
Jenness, J. 2006. Topographic Position Index (tpi_jen.avx) extension for ArcView 3.x, v. 1.2. Jenness Enterprises. Available at: http://www.jennessent.com/arcview/tpi.htm
Jenness, J. 2006. Grid Tools v. 1.7 (grid_tools_jen.avx) extension for ArcView 3.x. Jenness Enterprises. Available at: http://www.jennessent.com/arcview/grid_tools.htm
Johnson, D.H., 1980. The comparison of usage and availability measurements for evaluating resource preference. Ecology 61: 65-71.
Johnson, J.B., and Omland, K. S., 2004. Model selection in ecology and evolution. Trends in Ecology and Evolution 19: 101-108.
Jongman, R.H.G., 1995, Nature conservation planning in Europe: developing ecological networks. Landscape and Urban Planning 32: 169-183.
Jongman, R.H.G., and Troumbis, A.Y., 1995. The wider landscape for nature conservation: ecological corridors and buffer zones. MN2.7 Project Report 1995, submitted to the European Topic Centre for Nature Conservation in fulfilment of the 1995 Work Programme, European Centre for Nature Conservation, Tilburg, 78 pp.
Jongman, R.H.G., and Smith, D., 2000, The European experience: From Site Protection to Ecological Networks. In: Sanderson, J., Harris, L., Landscape Ecology. A Top-Down Approach, Lewis Publishers, Boca Raton, Florida, USA.
Jongman, R.H.G. and Pungetti, G., 2004. Introduction: Ecological Network and Greenways. pp. 1-6. In: Jongman, R.H.G. and Pungetti, G. (eds.): Ecological Networks and Greenways: Concept, Design, Implementation. Cambridge University Press, Cambridge, UK. 368 pp.
163
References

Jongman, R.H.G., Külvik, M. and Kristiansen, I., 2004. European ecological networks and greenways. Landscape and Urban Planning 68: 305-319.
Jongman, R.H.G. (Ed.), 2005. Pantanal-Taquari Tools for decision making in Integrated Water Management. ALTERRA Special Publication 2005/02. Water for Food and Ecosystems Partners for Water, ALTERRA-Wageningen University, Wageningen, The Netherlands. 165 pp.
Jongman, R.H.G. and Padovani, C., 2006. Interaction Between Stakeholders and Research for Integrated River Basin Management. Water Resources Development 22, 1: 49-60.
Katnik, D.D. and Wielgus, R.B., 2005. Landscape proportions versus Monte Carlo simulated home ranges for estimating habitat availability. Journal of Wildlife Management. 69, 1: 20-32.
Kavalov, B., 2004. Biofuel potentials in the EU. Institute for Prospective Technological Studies - IPTS -European Commision. Report EUR 21012 EN, Sevilla, Spain. 35 pp. Available at: ftp://ftp.jrc.es/pub/EURdoc/eur21012en.pdf
Keefe, J., 1995. Disruption and Displacement: Tourism and Land Alienation. pp. 41–57. In: Burns, P. Tourism and Minorities’ Heritage: Impacts and Prospects. Papers in Leisure and Tourism Studies No. 6. University of North London, London, UK.
Keitt, T.H., 1995. Spatial complexity and critical phenomena in ecological systems. Ph.D. dissertation. Department of Biology, University of New Mexico, Albuquerque, USA.
Keitt, T.H., Urban, D.L. and Milne, B.T.. 1997. Detecting critical scales in fragmented landscapes. Conservation Ecology [online] 1 (1): 4. Available at: http://www.consecol.org/vol1/iss1/art4.
Kerkstra, K. and Vrijlandt, P., 1990. Landscape planning for industrial agriculture: a proposed framework for rural areas. Landscape and Urban Planning 18, 3-4: 275-287.
Klingebiel, A.A. and Montgomery, P.H., 1966. Land Capability Classification. Agricultural Handbook Nº 210. Department of Agriculture (USDA), Washington, DC, USA.
Kok, K., Farrow, A., Veldkamp, A. and Verburg, P., 2001. A method and application of multi-scale validation in spatial land use models. Agriculture, Ecosystems and Environment 85: 223-238.
Kot, M., Lewis, M.A., and van den Dreissche, P., 1996. Dispersal data and the spread of invading organisms. Ecology 77: 2027-42.
Kotliar, N.B., and Wiens, J.A., 1990. Multiple scales of patchiness and patch structure: A hierarchical framework for the study of heterogeneity. Oikos 59, 2: 253-260.
Kuhnert, M., Voinov, A. and Seppelt, R., 2005. Comparing Raster Map Comparison Algorithms for Spatial Modeling and Analysis. Photogrammetric Engineering and Remote Sensing 71, 8: 975-984
Lambeck, R.J. 1997. Focal species: a multi-species umbrella for nature conservation. Conservation Biology 11: 849-856.
Lambeck, R.J., 1999. Landscape Planning for Biodiversity Conservation in Agricultural Regions. A Case Study from the Wheatbelt of Western Australia. Biodiversity Technical Paper, No. 2. CSIRO Division of Wildlife and Ecology. Commonwealth of Australia. Available at: http://www.deh.gov.au/biodiversity/publications/technical/landscape/chapter2e.html
Lambeck, R.J. 2002. Focal species and restoration ecology: response to Lindenmayer et al. Conservation Biology 16: 549-551.
Lambin, E.F., 1994. Modelling deforestation processes: a review. TREES Series B. Research Report 1. European Commission, Brussels, EUR 15744 EN.
164
References
Lavilla, E., and Gonzalez, J., 2001, Argentine Biogeography. Lillo Foundation, Tucumán, Argentina. Available at: http://www.surdelsur.com/flora/biogeogr/neotrop/Welcing.htm
Leitão, A.B., and Ahern, J., 2002. Applying landscape ecological concepts and metrics in sustainable landscape planning. Landscape and Urban Planning, 59, 2: 65-93.
Levens, R., 1966. The strategy of model building in population biology. American Scientist. 54: 421-431.
Lichstein, J.W., Simons, T.R., Shriner, S.A. and Franzreb, K.E., 2002. Spatial autocorrelation and autoregressive models in ecology. Ecological Monographs 72, 3: 445-463.
Lindenmayer, D.B., Manning, A.D., Smith P.L., Possingham, H.P., Fischer, J., Oliver, I., and McCarthy, M.A., 2002. The focal species approach and landscape restoration: a critique. Conservation Biology 16: 338-345.
Lindenmayer, D.B., and Fischer J. 2003. Sound science or social hook-a response to Brooker’s application of the focal species approach. Landscape and Urban Planning 62: 149-158.
Linders, M.J., Wilhere, G.F. and Cosentino, B.L., 2004. Evaluating the Effects of Human Development Patterns on Terrestrial Wildlife Habitat Function. In: T.W. Droscher and D.A. Fraser (eds). Proceedings of the 2003 Georgia Basin/Puget Sound Research Conference. March 31-April 3, 2003, Westin Bayshore, Vancouver, British Columbia, Canada. CD-ROM or Online. Available at: http://www.psat.wa.gov/Publications/03_proceedings/start.htm
Liu, J., and Taylor, W.W. (eds.): 2002. Integrating landscape ecology into natural resource management. Cambridge University Press, Cambridge, UK. 500 pp.
LNV, 1989. Natuurontwikkeling, een verkennende studie. Background series Nature Policy Plan no. 6. Ministry of Agriculture, Nature Management and Fisheries. The Hague, The Netherlands.
Ludlow, M. E., and Sunquist, M. E., 1987. Ecology and behavior of ocelots in Venezuela. National Geographic Research, 3, 4:447-461.
Mace, R.D., Waller, J.S., Manley, T.L., Ake, K. and Wittinger, W.T., 1999. Landscape evaluation of grizzly bear habitat in western Montana. Conservation Biology 13:367-377.
Main, A.R., 1993. Landscape Reintegration: Problem definition. pp. 189-208. In: Hobbs, R.J. and Saunders, D. (eds.): Reintegrating fragmented landscapes, towards sustainable production and nature conservation, Springer-Verlag, New York, USA, pp. 332.
Malizia, L.R., 2001. Seasonal fluctuations of birds, fruits and flowers in a subtropical forest of Argentina. Condor 103: 45-61.
Manly, B.F.J., McDonald, L.L., and Thomas, D.L., 1993. Resource selection by animals: statistical design and analysis for field studies. Chapman & Hall, London, UK, New York, USA, 1st edition. 175 pp.
Manly, B.F.J., McDonald, L.L., Thomas, D.L., McDonald, T.L. and Erickson, W.P., 2002. Resource selection by animals: statistical design and analysis for field studies. Kluwer Academic Publishers, Dordrecth, The Netherlands, 2nd. edition. 240 pp.
McAlpine, C.A., Callaghan, J., Bowen, M.E., Lunney, D., Rhodes, J.R., Mitchell, D.L., Pullar, D.V. and Possingham, H. P., 2004. Conserving koala (Phascolarctos cinereus) populations in a fragmented landscape (Noosa Queensland). Technical Report. The University of Queensland, Brisbane, Australia, March 2004, 42 pp. Available at: https://www.savethekoala.com/vulnerabletech1.pdf
McGarigal, K. and Marks, B.J. 1995. FRAGSTATS: spatial pattern analysis program for quantifying landscape structure. US Department of Agriculture, Forest Service, General Technical Report PNW-GTR-351. 122 pp.
165
References

McGarigal, K. 2002. Landscape pattern metrics. In: El-Shaarawi, A. H. and Piegorsch, W.W. (eds.). Encyclopedia of Environmentrics Volume 2: pp. 1135-1142. Vol. 1 to 4. John Wiley and Sons, Sussex, England. 2502 pp. (4 vol.)
McGarigal, K., Cushman, S.A., Neel, M.C., and Ene, E., 2002. FRAGSTATS: Spatial pattern analysis program for categorical maps, version 3.0. University of Massachusetts, Amherst, Massachusetts, USA.
McGarigal, K., 2003. FRAGSTATS Workshop. Case Study Exercise #1 Quantifying habitat fragmentation under alternative land management scenarios. 6th International Association for Landscape Ecology (IALE) World Congress, July, 13th-17th, 2003, Darwin, Australia. Available at http://www.umass.edu/landeco/research/fragstats/workshops/IALE2003/casestudy.pdf
McNeely, J.A., Harrison, J. and Dingwall, P. (eds.): 1994. Protecting nature: Regional reviews of protected areas. Protected Areas Programme. IVth World Congress on National Parks and Protected Areas, Caracas, Venezuela, UICN. 402 pp.
Medawar, P., 1984. The limits of science. Oxford University Press, Oxford, UK. 108 pp.
Menke, K.A. and Hayes, C.L., 2003. Evaluation of the relative suitability of potential jaguar habitat in New Mexico. Earth Data Analysis Center, University of New Mexico, Albuquerque, NM and New Mexico Department of Game and Fish, USA. 31 pp.
Menon, S., Pontius, R.G., Rose, J., Khan, M. L. and Bawa, K. S., 2001. Identifying Conservation-Priority Areas in the Tropics: a Land-Use Change Modeling Approach. Conservation Biology 15, 2: 501-512.
Merriam, G., 1984. Connectivity: a fundamental ecological characteristic of landscape pattern. Pp. 5-15. In: Brandt, J. and Agger, P. (eds.): Proceedings of the 1st International seminar on methodology in landscape ecological research and planning. IALE and Roskilde University, Denmark.
Merriam, G., 1988. Landscape dynamics in farmland. Trends in Ecology and Evolution, 3: 16-20.
Merriam, G., 1990. Ecological processes in the time and space of farmland mosaics. pp.121-133. In: Zonneveld, I. S. and Forman, R.T.T (eds.): Changing landscapes: an ecological perspective. Springer-Verlag, New York:
Merriam, G. and Lanoue, A., 1990. Corridor use by small mammals: field measurement for three experimental types of Peromyscus leucopus. Landscape Ecology 4: 123-131.
Merriam, G., Wegner, J. and Pope, S. 1993. Parklands: Parks in their Ecological Landscapes. Report to Canadian Parks Service, Environment Canada, by the Carleton University Laboratory of Landscape Ecology. Ottawa-Carleton Institute on Biology, Carleton University, Ottawa, Ontario, Canada.
Michalski, F., Boulhosa, R.L.P., Faria, A. and Peres, C.A., 2006. Human-wildlife conflicts in a fragmented Amazonian forest landscape: determinants of large felid depredation on livestock. Animal Conservation 9, 2: 179-188.
Milne, B.T., Johnson, A.R., Keitt, T.H., Hatfield, C.A., David, J. and Hraber¸ P.T., 1996. Detection of critical densities associated with piñon-juniper woodland ecotones. Ecology 77, 3: 805-821.
Mladenoff, D.J., Sickley, T.A., Haight, R.G. and Wydeven, A.P., 1995. A regional landscape analysis and prediction of favorable gray wolf habitat in the northern Great Lakes region. Conservation Biology 9: 279-294.
Mladenoff, D.J., and Sickley, T.A., 1998. Assessing potential gray wolf restoration in the northeastern United States: a spatial prediction of favorable habitat and potential population levels. Journal of Wildlife Management 62: 1-10.
Moilanen, A. and Hanski, I., 2001. On the use of connectivity measures in spatial ecology. Oikos 95: 147-151.
Moisen, G.G., and Frescino, T.S., 2002. Comparing five modeling techniques for predicting forest characteristics. Ecological Modelling 157: 209-25.
166
References

Muller, D. and Zeller, M., 2002. Land use dynamics in the central highlands of Vietnam: a spatial model combining village survey data with satellite imagery interpretation. Agricultural Economics 27: 333–354.
Naves, J., Wiegand, T., Revilla, E. and Delibes, M., 2003. Endangered species contrained by natural and human factors: the case of brown bears in Northern Spain. Conservation Biology 17: 1276-1289.
Neel, M., Mc Carigal, K. and Cushman, S., 2004. Behavior of class-level landscape metrics across gradients of class aggregation and area. Landscape Ecology 19: 435-455.
Nidumolu, U., de Biea, C., van Keulen, H., Skidmore, A., and Harmsen, K., 2006. Review of a land use planning programme through the soft systems methodology Land Use Policy 23, 2: 187-203.
Nores, M., 1992. Bird speciation in subtropical South America in relation to forest expansion and retraction. Auk 109: 346-357.
Noss, R.F., 1987. Corridors in real landscapes: A reply to Simberloff and Cox. Conservation Biology 1, 2: 159-164.
OAS, 2000. Transboundary diagnostic analysis of the binational basin of the Bermejo river. Strategic Action Plan for the Binational Basin of the Bermejo River (PEA). Organization of American States, Buenos Aires, Argentina and Washington DC. USA. 157 pp.
OAS, 2003. Biodiversity Conservation and Management. Organization of American States (OAS), Unit for sustainable development and environment, Policy Series, No. 1, Washington DC. Available at: http://www.oas.org/main/main.asp?sLang=E&sLink=http://www.oas.org/dsd
Ojeda, R., 1999. Biodiversidad y conservación de mamíferos de la interfase tropical-templada de Argentina. pp. 443-462. In: Matteucci, S., Solbrig, O.T., Morello, J. and Halffter, G. (eds.): Biodiversidad y uso de la tierra: conceptos y ejemplos de Latinoamérica (Biodiversity and Land Use: concepts and examples from Latin America), EUDEBA, Buenos Aires, Argentina, 580 pp. (in Spanish).
Oldfield, S., Lusty, C., and MacKinven, A. (compilers), 1999. The World List of Threatened Trees. The World Conservation Press, Cambridge, UK. 650 pp.
Olson, C.M., Holmen, S.P., and Angelides, D.P., 1997. Ecosystem planning in the real world. Presented at the ESRI User Conference. July 1997. San Diego. Available at: http://www.vestra.com/ecosyst.htm.
Olson, D., Dinerstein, E., Hedao, P., Walters, S., Allnutt, P., Loucks, C., Kura, Y., Kassem, K., Webster, A. and Bookbinder, M., 2000. Terrestrial Ecoregions of the Neotropical Realm (map). Conservation Scientific Program, WWF-US, Washington DC, USA.
O’Malley, K., 1999. Arc View 3x extension: Buffer Theme manager. Available at: http://arcscripts.esri.com/details.asp?dbid=10699
Opdam, P., 1987, The metapopulation, model of a population in a fragmented landscape. Landschap 4: 289-306.
Opdam, P., 1988. Populations in fragmented landscape. pp. 75-77. In: Schreiber, K.F. (ed.), 1988. Connectivity in Landscape Ecology. Proceedings of the 2nd international seminar of the International Association of Landscape Ecology (IALE), July 1987. Münstersche Geographische Arbeiten 29, Münster, Germany.
Opdam, P., van Apeldoorn, R., Schotman, A. and Kalkhoven, J., 1993. Population responses to landscape fragmentation. Pages 147-171. In: Vos, C.C. and Opdam, P. (eds.), 1993. Landscape ecology of a stressed environment. IALE Studies in Landscape Ecology 1. Chapman and Hall, London, UK. 310 pp.
Opdam, P., Foppen, R., and Vos, C., 2002. Bridging the gap between ecology and spatial planning in landscape ecology. Landscape Ecology 16: 767-779.
167
References
Opdam, P., Verboom, J., and Pouwels R., 2003. Landscape cohesion: an index for the conservation potential of landscapes for biodiversity. Landscape ecology 18: 113-126.
Opdam, P., Steingrover, E. and Van Rooij, S., 2006. Ecological networks: A spatial concept for multi-actor planning of sustainable landscapes. Landscape and Urban Planning 75: 322-332.
Ortega-Huerta, M.A., and Medley, K.E., 1999. Landscape analysis of jaguar (Panthera onca) habitat using sighting records in the Sierra de Tamaulipas, Mexico. Environmental Conservation 26: 257-269.
Ovaskainen, O. and Hanski, I., 2004. From individual behaviour to metapopulation dynamics: unifying the patchy population and classic metapopulation models. American Naturalist 164: 364-377.
Overmars, K.P. and Verburg, P.H., 2005. Analysis of land use drivers at the watershed and household level: Linking two paradigms at the Philippine forest fringe. International Journal of Geographical Information Science 19, 2: 125-152.
Overmars, K.P., De Groot, W.T., and Huigen, M.G.A., 2006a. Comparing inductive and deductive modelling of land use decisions: Principles, a model and an illustration from the Philippines. Human Ecology (Accepted).
Overmars, K.P., Verburg, P.H., and Veldkamp, A., 2006b. Comparison of a deductive and an inductive approach to specify land suitability in a spatially explicit land use model. Land Use Policy (Accepted).
Pacheco, S., González, J. and Meitner, M.J., 2005. Land Use Planning in the Yungas Biosphere Reserve in Argentina. Proceedings of the ESRI GIS conference, San Diego, California, USA. Available at: http://gis.esri.com/library/userconf/proc05/papers/pap2039.pdf
Pascual Hortal, L. and Saura, S., 2005. Integrating landscape connectivity in broad-scale forest planning: a methology based on graph structure and habitat availability indices. European Forest Institute, Annual Conference and Scientific Seminar: Multifunctional Forest Ecosystem Management in Europe: Integrated approaches for considering the temporal, spatial and scientific dimensions. September, 8th-10th, 2005, Barcelona, Spain. Available at: www.efi.fi/attachment/f5d80ba3c1b89242106f2f97ae8e3894/473cd2cf534b8518e04ccbc9934d139c/Saura.pdf
Paul, H., Steinbrecher, R., Michaels, L., and Kuyek, D., 2003. Hungry Corporations - Transnational Biotech Companies colonize the food chain. Zed Books, London, UK. 256 pp.
Paviolo, A., D’Angelo, C., and Di Bitteti, M., 2005. Jaguar (Panthera onca) population decline in the upper Parana Atlantic forest of Brazil and Argentina. 19th Annual Meeting of the Society for Conservation Biology. 15 - 19 July, 2005, Brasilia, Brazil. Available at http://news.mongabay.com/2005/0724-cbc_jaguar.html
Pearce, J. and Ferrier, S., 2000. Evaluating the predictive performance of habitat models developed using logistic regression. Ecological Modelling 133: 225-245.
Pereira Leite Pitman, M.R., Gomes de Oliveira, T., Cunha de Paula, R., and Indrusiak, C., 2002. Manual de identificação, prevenção e controle de predação por carnívoros.: Edições IBAMA, Brasília, Brazil. 76 pp. (in Portuguese)
Perovic, P., 2002a. Ecología de la comunidad de félidos en las selvas nubladas del noroe ste de Argentina (Ecology of the felids community in the clouded forest of Northwest Argentina). Universidad Nacional de Cordoba, Argentina. PhD Thesis, Director: Ojeda, R.A., 146 pp. (in Spanish).
Perovic, P. G., 2002b. Conservación del jaguar en el noroeste de Argentina. pp. 465-475. In: Medellín, R., Equihua, C., Chetkiewicz, C., Crawshaw, P., Rabinowitz, A., Redford, K., Robinson, J., Sanderson, E., Taber, A., (eds.): El Jaguar en el nuevo milenio, México, Fondo de Cultura Económica, UNAM, Wildlife Conservation Society. 647 pp. (in Spanish)
Peterson, G.D., Cumming, G.S., and Carpenter, S.R., 2003. Scenario Planning: a Tool for Conservation in an Uncertain World. Conservation Biology 17, 2: 358–366.
168
References

Polisar, J., Maxit, I., Scognamillo, D., Farrel, F., Sunquist, M., and Eisenberg, J. F., 2003. Jaguars, pumas, their prey base, and cattle ranching: ecological interpretations of a management problem. Biological Conservation 109: 297-310.
Pontius Jr, R.G., and Schneider, L.C., 2001. Land-use change model validation by a ROC (relative operating characteristic) method. Agriculture, Ecosystems and Environment 85: 239-248.
Porter, W.P., Budaraju, S., Stewart, W.E., and Ramankutty N., 2002. Physiology on a landscape scale: Plant-Animal Interactions. Integrative and Comparative Biology 42, 3: 431-453.
Power, C., and Simms, A., 2001. Hierarchical fuzzy pattern matching for regional comparison of land use maps International Journal of Geographic Information Science 15, 1: 77-100.
Prasad, A., Iverson, L., and Liaw, A., 2006. Newer Classification and Regression Tree Techniques: Bagging and Random Forests for Ecological Prediction. Ecosystems 9: 181-199.
Pressey, R.L., Possingham, H.P., and Margules, C.R., 1996. Optimality in reserve selection algorithms: When does it matter and how much? . Biological Conservation 76: 259-267.
Pressey, R.L., Possingham, H.P., Logan V.S., Day J.R., and Williams, P.H., 1999. Effects of data characteristics on the results of reserve selection algorithms. Journal of Biogeography 26: 179-91.
Pyke, C., 2005. Assessing suitability for conservation actions: prioritizing interpond linkages for the californian tiger salamander. Conservation Biology 19, 2: 492-503.
Quigley, H.B. and Crawshaw, P.G., 1992. A conservation plan for the jaguar Panthera onca in the Pantanal region of Brazil. Biological Conservation 61: 149-157.
Rabinowitz, A.R. and Nottingham, B.G., 1986. Ecology and behaviour of the jaguar (Panthera onca) in Belize, Central America. Journal of Zoology London 210: 149-159.
Rafaelli, S., 2003. Hacia el Plan de Gestión Sustentable del Iruya. Tercer Congreso Latinoamericano de Manejo de Cuencas Hidrográficas. FAO-REDLACH-INRENA. Arequipa. Perú. Available at: http://www.corebe.org.ar/OTROS%20PROYECTOS/ccas%20hidrograficas%202003.pdf
Raskin, P., Gallopin, G., Gutman, P., Hammond, A. and Stewart. R., 1998. Bending the curve: toward global sustainability. PoleStar Series Report no. 8. Stockholm Environment Institute, Stockholm. 144 pp.
Ray, N., 2005. Pathmatrix: a geographical information system tool to compute effective distances among samples. Molecular Ecology Notes 5: 177-180.
Reboratti, C., 1989. La frontera agraria en el Umbral al Chaco. Desarrollo, balance y perspectivas. (The agrarian frontier in the threshold to Chaco. Development, balance and perspectives). Facultad de Filosofía y Letras, Instituto de Geografía, Universidad de Buenos Aires (in Spanish).
Rempel, R.S., 1999. Patch Analyst and Habitat Analyst: Landscape Planning Tools for Sustainable Forest Management. Innovative Applications for Natural Resource Management. The Latest Tools: A Manitoba Model Forest Workshop. Winnipeg, Manitoba, Canada.
Rempel, R.S. and Kaufman, C.K., 2003. Spatial modeling of harvest constraints on wood supply versus wildlife habitat objectives. Environmental Management 32, 3: 334-347.
Ripley, B.D., 1995. Pattern Recognition and Neural Networks. A Statistical Approach. Cambridge University Press, Cambridge, UK. 415 pp.
169
References

Ritters, K.H., O’Neill, R.V., Hunsaker, C.T., Wickham, J.D., Yankee, D.H., Timmins, S.P., Jones, K.B., and Jackson, B.L., 1995. A factor analysis of landscape pattern and structure metrics. Landscape Ecology 10: 23-39.
Robertson, D.P., and Hull, R.B., 2001. Beyond Biology: toward a More Public Ecology for Conservation. Conservation Biology 15, 4: 970-979.
Rosenberg, D.K., Noon, B.R., Megahan, J.W., and Meslow, E.C., 1998. Compensatory behavior of Ensatina eschscholtzii in biological corridors: a field experiment. Canadian Journal of Zoology 76, 1: 117-133.
Rothley, K.D., and Rae, C., 2005. Working backwards to move forwards: Graph-based connectivity metrics for reserve network selection. Environmental Modeling and Assessment 10: 107-113.
Rubiano, J., 2002. Decision support tools for the management of the Sherwood natural area, PhD Dissertation, University of Nottingham, UK.
Ruzicka, M., and Miklos, L. 1990. Basic premises and methods in landscape ecological planning and optimization. pp. 233-260. In: Zonneveld, I.S. and Forman, R.T.T. (eds.). Changing Landscapes: An Ecological Perspective,Springer-Verlag, New York, USA,
Sanchez Alonso, M.C., 2002. Analysis of fragmentation effect on deer population density in relation to quality habitat for large carnivores in the biosphere reserve of Calakmul, Southeast Mexico. Third Year Double Unit Project, UNAM, Ciudad de Mexico, Mexico. 47 pp. Available at: http://carnivorelibrary1.free.fr/CalakmulPredatorPreyDensity.pdf
Sanderson, E.W., Redford, K.H., Vedder, A., Ward, S.E., and Coppolillo P.B., 2002a. A conceptual model for conservation planning based on landscape species requirements. Landscape and Urban Planning 58: 41-56.
Sanderson, E.W., Redford, K.H., Chetkiewicz, C.B., Medellin, R.A., Rabinowitz, R.A., Robinson, J.G., and Taber, A. B., 2002b. Planning to save a species: the jaguar as a model. Conservation Biology 16: 1-15.
SAP - OAS 2000. The strategic action program for the binational basin of the bermejo river. Binational Commission for the Development of the Upper Bermejo River and Grande de Tarija River Basins. Global Environment Facility, United Nations Environment Program, Organization of the American States, Washington DC, USA. 96 pp. Available at: http://plone-dev.unep.org/iwlearn/iw-projects/Fsp_112799468006/File_11286688372
SAP - OAS 2003. SEMADES, unpublished data. GIS data development for the Yungas biosphere reserve. SEMADES (Volante, J. and Frassetto, A. -eds.-) Salta, Salta province, Argentina.
Sarobe, J.M., 1935. La Patagonia y sus problemas. Estudio geográfico, económico, político y social de los territorios nacionales del sur. (The Patagonia and its problems. Geographic, economic, politic and social study of the south national territories). Editorial Aniceto López, Buenos Aires, rgentina, 445 pp. (in Spanish).
Saunders, D.A., and Hobbs, R. J., 1991. The role of corridors in conservation: what do we know and where do we go?. pp. 421-427. In: Saunders, D.A. and Hobbs, R.J. (eds.): Nature Conservation: the role of corridors. Surrey Beatty and Sons, Chipping Norton, New South Wales, Australia. 456 pp.
Saunders, D.A., 2000. Biodiversity does matter. In: Barlow, T. and Thorburn, R. (eds.) 2000. Balancing Conservation and Production in Grassy Landscapes. Proceedings of the Bushcare Grassy Landscapes Conference, 19-21 August 1999, Clare, SA. Environment Australia, Canberra. 202 pp. Available at: http://www.deh.gov.au/land/publications/grasscon/pubs/grascon.pdf
Schadt, S., Revilla, E., Wiegand, T., Knauer, F., Kaczensky, P., Breitenmoser, U., Bufka, L., Cerveny, J., Koubek, P., Huber, T., Stanisa, C., and Trepl, L., 2002. Assessing the suitability of central European landscapes for the reintroduction of Eurasian lynx. Journal of Applied Ecology 39: 189-203.
Schröder, B., 2004. ROC plotting and AUC calculation. Transferability test, version 1.3 (January 2004). Institute for Geoecology, Landscape Ecology, Postdam University. Available at: http://brandenburg.geoecology.uni-potsdam.de/users/schroeder/download.html
170
References

Scognamillo, D., Maxit, I., Sunquist, M., and Polisar, J., 2003. Coexistence of jaguar (Panthera onca) and puma (Felis concolor) in a mosaic landscape in Venezuelan llanos. Journal of Zoology 259: 269-279.
Scott, J.C., 1998. Seeing like a state: how certain schemes to improve the human condition have failed. Yale University Press, New Haven, Connecticut, USA. 464 pp.
Secretaría de Minería de la Nación, 1973. Aerophotographic Survey of Santa Bárbara-Unchimé, Jujuy and Salta provinces. Secretaría de Minería, Ministerio de Economía, Buenos Aires, Argentina.
Seernels, S., and Lambin, E.F., 2001. Proximate causes of land-use change in Narok District, Kenya: a spatial statistical model. Agriculture, Ecosystems and Environment 85: 65-81.
Seghezzo, L., van Vliet, B., Zeeman, G., and Lettinga, G. 2004. Assessment of the sustainability of anaerobic sewage treatment in northwestern Argentina. 10th World Congress of Anaerobic Digestion Montreal, Canada, August, 29th – 30th 2004. PS-I.093.
SEMADES, unpublished data. GIS data development for the Yungas biosphere reserve. SEMADES (Volante, J. and Frassetto, A. -eds.-) Salta, Salta province, Argentina.
Sheil, D., and Boissière, M., 2006. Local people may be the best allies in conservation. Nature 440: 868.
Silver, S., Ostro, L.T., Marsh, L., Maffei, L., Noss, A., Kelly, M.J., Wallace, R., Gómez, H., and Ayala, G., 2004. The use of camera traps for estimating jaguar Panthera onca abundance and density using capture/recapture analysis. Oryx 38, 2: 148-154.
Simberloff, D., and Cox, J., 1987. Consequences and costs of conservation corridors. Conservation Biology 1: 63-71
Simberloff, D., Farr, J.A., Cox, J., and Mehlman, D.W., 1992. Movement corridors: Conservation bargains or poor investments?. Conservation Biology 6: 493-504.
Simberloff, D., 1995. Habitat fragmentation and population extinction of birds. The Ibis 137: S105-S111.
Somma, D.J., and Perovic, P., 1999. Conservación de la biodiversidad y el diseño de redes ecológicas: el caso de la selva de montaña subtropical argentina. pp. 199-224. In: Matteucci, S., Solbrig, O.T., Morello, J. and Halffter, G. (eds.).: Biodiversidad y uso de la tierra: conceptos y ejemplos de Latinoamérica, EUDEBA, Buenos Aires, Argentina. 580 pp. (in Spanish)
Somma, D.J., Aued, M.B., and Bachman, L., 2004. The ecological network development in the Yungas, Argentina: planning, economic and social aspects. pp. 207-220. In: R. Jongman and G. Pungetti (eds.): Ecological Networks and Greenways. Concept, design, implementation. Cambridge University Press, Cambridge. 345 pp.
Somma, D.J., Aued, M.B., van Lier, H., Jongman, R., and van Lammeren, R., 2005. Desarrollo de métodos de planificación y conceptos espaciales para el desarrollo de redes ecológicas sustentables. Primeras Jornadas Argentinas de Ecología de Paisaje. GEPAMA – FADU – UBA, Buenos Aires, November 2nd. - 4th., 2005. Available at: http://www.gepama.com.ar/matteucci/downloads/JJPP-resumenes.pdf
Soulé, M., 1996. Spatial and Temporal Scales (demographic rescue). In: Corridors of Life. Landscape Linkages for wildlife. A GIS based approach to maintain biodiversity in the Northern Rockies. Montana Department of Fish, Wildlife and Parks, Helena, Montana, USA.
Stattersfield, A., Crosby, M., Long, A., and Wege, A., 1998. Endemic bird areas of the world. Priorities for Biodiversity Conservation. Birdlife Conservation Series No. 7. Birldlife International, Cambridge, UK.
Stauffer, D., and Aharony, A., 1994. Introduction to percolation theory. 2nd. edition. Taylor and Francis, London. 181 pp.
Steininger, M.K., Tucker, C.J., Ersts, P., Killeen, T.J., Villegas, Z., and Hecht, S.B., 2001. Clearance and Fragmentation of Tropical Deciduous Forest in the Tierras Bajas, Santa Cruz, Bolivia. Conservation Biology 15, 4: 856-866.
171
References
Steinitz, C., Flaxman, M., Mouat, D., Arias Rojo, H., Goode, T., Peiser, R., Bassett, S., Maddock, T., and Shearer, A., 2003. Alternative Futures for Changing Landscapes. The upper San Pedro River Basin in Arizona and Sonora. Island Press, Washington DC, USA. 222 pp.
Stephenne, N., and Lambin, E.L., 2001. A dynamic simulation model of land-use changes in the Sudano-Sahelian countries of Africa. Agriculture, Ecosystems and Environment 85: 145–161.
Stephenne, N., and Lambin, E.L., 2004. Scenarios of land-use change in Sudano-sahelian countries of Africa to better understand driving forces. GeoJournal 61: 365–379.
Sullivan, S., 2001. How sustainable is the communalizing discourse of ‘new’ conservation? The masking of difference, inequality and aspiration in the fledgling ‘conservancies’ of Namibia. pp. 158-187. In: Chatty, D. and Colchester, M., Conservation and Mobile Indigenous Peoples: Displacement, Forced Settlement and Sustainable Development. Berghahn Press, Oxford, UK. 416 pp.
Swets, J.A., 1986. Indices of discrimination or diagnostic accuracy: Their ROCs and implied models. Psychological Bulleting, 99, 1: 100-117.
Tabeni, M.S., Bender, J.B., and Ojeda, R.A., 2004. Hotspots for the conservation of mammals in Tucumán province, Argentina (Puntos calientes para la conservación de mamíferos en la provincia de Tucumán, Argentina). Journal of Neotropical Mammalogy 11, 1: 55-67 (in Spanish).
Taber, A.B., Novaro A.J., Neris, N., and Colman, F.H., 1997. The food habits of. sympatric jaguar and puma in the Paraguayan Chaco. Biotropica 29, 2: 204-213.
Tanner, T., 2003. Peopling mountain environments: changing Andean livelihoods in north-west Argentina. The Geographical Journal 169 3: 205-214.
Tavares, H., 2006. Ecología y Biocombustibles. Molinos y Rigolleau, dos papeles con futuro (Ecology and Biocombustibles. Molinos and Rigolleau, two stakes with future). Clarín Económico, July, 30th 2006: 8. (in Spanish)
Taylor, P.D., Fahrig, L., Henein, K., and Merriam, G., 1993. Connectivity is a vital element of landscape structure. Oikos 68: 571-573.
Tewes, M.E., 1986. Ecological and behavioral correlates of ocelot spatial patterns. Ph.D. dissertation, University of Idaho, Moscow, Idaho, USA. 128 pp. Available at: http://www2.for.nau.edu/research/pb1/Service/ocelot/Tewes_Dissertation.pdf
Theobald, D., 2002. Modeling functional connectivity. ESRI User Conference 2002, Proceedings. Paper No. 1109. July 7-12, 2002 San Diego, CA, USA. Available at http://gis.esri.com/library/userconf/proc02/pap1109/p1109.htm
Thiele, K.R., and Prober, S.M., 2000, Conservation Management Networks-a model for coordinated protection and management of remnant vegetation. In: Barlow, T., and Thorburn, R. (eds.) Balancing Conservation and Production in Grassy Landscapes. Proceedings of the Bushcare Grassy Landscapes Conference, Clare, South Australia 19-21 August 1999. Environment Australia, Canberra, 2000, Australia. Available at http://www.ea.gov.au/land/bushcare/publications/grasscon/pubs/grascon3.pdf
Thomas, D.L., and Taylor, E.J., 1990. Study designs and tests for comparing resource use and availability. Journal of Wildlife Management 54, 2: 322-330.
Tischendorf, L., and Fahrig, L., 2000. On the usage and measurement of landscape connectivity. Oikos 90: 7-19.
Tourism Secretariat-Government of Argentina, 2004. Strategic Federal Plan of Sustainable Tourism. Base Diagnostic Document: 1st. Phase-Global approach (Plan Federal Estratégico de Turismo Sustentable), Buenos Aires, July 2004. (in Spanish). Available at: http://www.sectur.gov.ar/esp/menu.htm
172
References

Treeweek, J., 1999. Ecological Impact Assessment. London, United Kingdom. Blackwell Science.
Trexler, J.C., and Travis, J., 1993. Non traditional regression analyses. Ecology. 74, 6: 1629-1637.
Twedt, D.J., Uihlein, W.B., and Elliott, A.B., 2005. A Spatially Explicit Decision Support Model for Restoration of Forest Bird Habitat. Conservation Biology 20, 1: 100-110.
UN, 1987. Our Common Future (report of the Brundtland Commission), Oxford University Press, 1987.
Urban, D.L., O’Neill, R.V. and Shugart Jr., H. H., 1987, Landscape Ecology, a hierarchical perspective can help scientists understand spatial patterns. Bioscience 37: 119-127.
Urban, D.L. and, Keitt, T.H., 2001. Landscape Connectivity: A Graph-Theoretic Perspective. Ecology 82, 5: 1205-1218.
Urban, D., Goslee, S, Pierce, K., and Lookingbill, T., 2002. Extending community ecology to landscapes. Ecoscience 9, 2: 200-202.
Urban, D.L., 2003. Spatial Analysis in Ecology: Mantel`s Test [Online]. Available at: http://www.env.duke.edu/landscape/classes/env352/mantel.pdf
USGS, 2001. Current Vision and Implementation Strategy. CBI’s Current Vision, long and short term DSS Direction. Center for Biological Informatics, USGS, Denver, Colorado, USA. Available at: http://biology.usgs.gov/cbi/informatics/dss/cbidssvision.html
USDA, 2006. World Agricultural Supply and Demand Estimates (WASDE). WASDE-439, October 12th 2006. USDA, Washington, USA. 40 pp. Available at: http://www.usda.gov/oce/commodity/wasde
van Buuren, M., and Kerkstra, K., 1993, The framework concept and the hidrological landscape structure: a new perspective in the design of multifunctional landscapes, pp. 219-243. In: Vos, C., and Opdam, P., (eds.): Landscape Ecology of a Stressed Environment. IALE-studies in Landscape Ecology, Vol. 1, Chapman and Hall, London, UK. 310 pp.
van der Heijden, K. 1996. Scenarios: the art of strategic conversation. Wiley, New York, USA. 305 pp.
van der Heijden, K. 2005. Scenarios: the art of strategic conversation, 2nd Edition. Chichester, West Sussex , John Wiley and Sons, Hoboken, New York, USA. 356 pp.
van Eupen, M., van Rooij, S., Padovani, C., Tomas, W., Kawakami de Resende, E., Catella, A.C., and Haasnoot, M., 2005. Impact modelling of scenarios on vegetation and fauna. Chapter 7. In: Jongman, R. (ed.), 2005. Pantanal-Taquari Tools for decision making in Integrated Water Management. ALTERRA Special Publication 2005/02 Water for Food and Ecosystems Partners for Water. ALTERRA-Wageningen University, Wageningen, The Netherlands. 165 pp.
van Langevelde, F., van der Knaap, W.G.M., and Claassen, G.D.H., 1998. Comparing connectivity in landscape networks. Environment and Planning B 25: 849-863.
van Langevelde, F., 1999. Habitat connectivity and fragmented nuthatch populations in agricultural landscapes. PhD thesis, Wageningen Agricultural University, Wageningen, The Netherlands, 205 pp
van Langevelde, F., 2000. Scale of habitat connectivity and colonization in fragmented nuthatch populations. Ecography 23: 614-22.
van Langevelde, F., Claassen, F., and Schotman, A., 2002. Two strategies for conservation planning in human-dominated landscapes. Landscape and Urban Planning 58: 281-295.
van Lier, H.N., 1995. Natural resource management in land use planning. Tessa Program: Protection and Sustainable Development of Rural Areas. Warsaw, Poland, 24 pp.
173
References
van Lier, H. N., 1998. The role of land use planning in sustainable rural systems. Landscape and Urban Planning 41, 2, 15: 83-91.
van Rooij, S.A.M., Steingrover, E.G., and Opdam, P.F.M., 2003. Corridors for life: scenario development of an ecological network in Cheshire County. Alterra, Green World Research, Alterra-Rapport no. 699, Wageningen, The Netherlands, 118 pp.
Varela, R.A., 2001. Survey and Study of regional productive situation and local employment of Salta Province and neighbouring regions (Estudio y Relevamiento de la Situación Productiva Regional y Local del Empleo en el Interior de la Provincia de Salta y Regiones Adyacentes). Federal Investments Council (Consejo Federal de Inversiones -CFI-), Buenos Aires, Argentina. Available at: http://negocios.cfired.org.ar/servlets/textserver?document_id=808andlanguage_code=1andpiece_number=0andusername=andsession_id=0
Veldkamp, A., and Lambin, E.F., 2001. Predicting land-use change. Agriculture, Ecosystems and Environment 85: 1-6.
Verboom, J., Schotman, A., Opdam, P., and Metz, J.A.J. 1991. European nuthatch metapopulations in a fragmented agricultural landscape. Oikos 61: 149-156.
Verboom, J., and Pouwels, R., 2004. Ecological functioning of ecological networks: a species perspective. pp. 56-72. In: Jongman, R. and Pungetti, G. (eds.): Ecological Network and Greenways: Concept, Design and Implementation. Cambridge Studies in Landscape Ecology. Cambridge, UK. 345 pp.
Verburg, P.H., Schot, P., Dijst, M., and Veldkamp, A. 2004a. Land use change modelling: current practice and research priorities. GeoJournal 61, 4: 309-324.
Verburg, P.H., Overmars, K.P., and Witte, N., 2004b. Accessibility and land use patterns at the forest fringe in the Northeastern part of the Philippines. The Geographical Journal 170, 3: 238-255.
Verburg, P.H., and Veldkamp, A., 2004. Projecting land use transitions at forest fringes in the Philippines at two spatial scales. Landscape Ecology 19, 1: 77-98.
Verburg, P., Kok, K., and Veldkamp, T., 2005. PIXELS OR AGENTS? Modelling Land-Use and Land-Cover Change. IHDP UPDATE newsletter 03/2005.
Vervoorst, F., 1982. Noroeste. pp. 9-24. In: Sociedad Argentina de Botánica, Conservación de la vegetación natural en la República Argentina (Conservation of the natural vegetation in the Argentine Republic). Fundación Miguel Lillo, Tucumán, Argentina. 127 pp. (in Spanish).
Verweij, P. J. F. M., 2005. Osiris Manual, Wageningen Software Labs BV. 67 pp.
Volante, J., Bianchi, A.R., Paoli, H.P., Noé, Y.E., Elena, H.J., and Cabral, C.M., 2005. Análisis de la dinámica del Uso del suelo agrícola del Noroeste Argentino mediante teledetección y sistemas de información geográfica (Análisis of land use dynamics of the Northwest of Argentina by remote sensing and GIS). INTA, EERA Salta, PRORENOA, Salta, Argentina. 64 pp. and CD (in Spanish).
von Haaren, C., and Warren-Kretschmar, B., 2006. The interactive landscape plan-Use and benefits of new technologies in landscape planning, including initial results of the interactive Landscape plan Koenigslutter am Elm, Germany. Landscape Research 31, 1: 83-105.
Vos, C.C., and P. Opdam, 1993. Landscape Ecology of a Stressed Environment. IALE Studies in Landscape Ecology 1, Chapman and Hall, London, UK. 310 pp.
Vos, C. C., J. Verboom, Opdam, P.F.M., and ter Braak.,C.J.F. 2001. Towards ecologically scaled landscape indices. American Naturalist 157: 24-51.
174
References
Vynne, C., Silveira, L., Groom, M., and Wasser, S. K., 2005. Land Matrix composition affects distribution of maned wolf, puma and jaguar in a Cerrado ecosystem. SCB abstracts, University of Brasilia, Brasilia, Brasil, July 2005.
Walker, R., 2004. Theorizing Land-Cover and Land-Use change: the case of tropical deforestation. International Regional Science Review 27, 3: 247–270.
Walters, C.J., 1986. Adaptive management of renewable resources. Macmillan Publishing Company, New York, USA. 366 pp.
WCS, APN and Provincia del Chaco, 2004. Resultados del primer taller para la conservación del monumento natural Yaguareté en la Argentina (Results of first workshop on Jaguar natural monument conservation in Argentina), Resistencia, Chaco, Argentina. 20 pp. (in Spanish).
WCS, 2002. Selecting Landscapes species. Living Landscapes program. Bulletin No. 4. Wildlife Conservation Society, New York, May 2002. 4 pp. Available at: http://wcslivinglandscapes.com/media/file/Bulletin4.pdf
Wealands, S.R., Grayson, R.B., and Walker, J.P., 2005. Quantitative comparison of spatial fields for hydrological model assessment-some promising approaches. Advances in Water Resources 28: 15-32.
Weiss, A., 2001. Topographic Position and Landforms Analysis. Poster presentation, ESRI User Conference, San Diego, CA. Wiegand, T., and Moloney, K.A., 2004. Rings, circles, and null-models for point pattern analysis in ecology. Oikos 104: 209-229.
Wiegand, T., Revilla, E., and Moloney, K.A. 2004. Effects of habitat loss and fragmentation on population dynamics. Conservation Biology 19, 1: 108-121.
Wiegand, T. 2005. Spatial pattern analysis. Escuela de Graduados, Facultad de Agronomia-University of Buenos Aires. Special graduate course. November 2005, Buenos Aires, Argentina.
Wiegand, T., Kissling, W.D., Cipriotti, P.A., and Aguiar, M.R. 2006. Extending point pattern analysis to objects of finite size and irregular shape. Journal of Ecology, in press.
Wiens, J.A., 1989. Spatial scaling in ecology. Functional Ecology 3: 385-397.
Wiens, J., 1996. Wildlife in patchy environments: metapopulations, mosaics, and management. Pages 53-84. In: McCullough, D.R., (ed.) Metapopulations and wildlife conservation. Island Press, Washington, DC, USA. 439 pp.
Wilcove, D., McLellan, C. and Dobson, A., 1986. Habitat fragmentation in the temperate zone. In: Soulé, M.E. (ed.): Conservation Biology: The Science of Scarcity and Diversity: pp. 237-256. Sinauer Associates, Massachusetts, USA. 584 pp.
Wilshusen, P.R., Brechin, S.R., Fortwangler, C.L., and West, P.C., 2002. Reinventing a Square Wheel: Critique of a Resurgent ``Protection Paradigm’’ in International Biodiversity Conservation. Society and Natural Resources 15: 17-40.
Wilson, K.A., Westphal, M.I., Possingham, H.P., and Elith, J., 2005. Sensitivity of conservation planning to different approaches to using species distribution data. Biological Conservation 122: 99-112.
Wintle, B.A., Elith, J., and Potts, J.M., 2005. Fauna habitat modeling and mapping: A review and case study in the Lower Hunter Central Coast region of NSW. Austral Ecology 30: 719-738.
With, K., Gardner, R.H., and Turner, M.G., 1997. Landscape connectivity and population distributions in heterogeneous environments. Oikos 78: 151-169.
With, K., 1999. Is landscape connectivity necessary and sufficient for wildlife management? pp. 97-115. In: Rochelle, J.A., Lehmann, L.A., and Wisniewski, J., (eds.): Forest fragmentation: wildlife and management implications. Koninklijke Brill NV, Leiden, The Netherlands.
175
References

Wood, A., Stedman-Edwards, P., and Mang, J. (eds.), 2000. The Root Causes of Biodiversity Loss. World Wildlife Fund and Earthscan Publications Ltd., London, UK. 304 pp.
Woodcock, C.E., and Gopal, S., 2000. Fuzzy set theory and thematic maps: accuracy assessment and area estimation. International Journal of Geographical Information Science vol. 14, 2: 153-172.
Zadeh, L., 1965. Fuzzy Sets. Information and Control 8: 338-353.
Zonneveld, I.S., 1995. Land Ecology, an Introduction to Landscape Ecology as base for Land Evaluation, Land management and Conservation. SPB Academic Publishing, Amsterdam. 199 pp.
Zwarts, L, Beijkering, P. van, Kone, B., Wymenga, E., and Taylor, D., 2006. The Economic and Ecological Effects of Water Management Choices in the Upper Niger River: Development of Decision Support Methods. Water Resources Development 22, 1: 135-156.
176
References

177


The author of this dissertation, Daniel Jorge Somma, was born on June 16th, 1959, in the city of Buenos Aires, Argentina. He is married since 1986 to Mariana Rodriguez and they have two daughters: Natalia (20) and Emilia (12).He started his university studies in Agronomy in 1977 at the National University of Buenos Aires (UBA), Argentina, and obtained his degree in 1983. His graduate thesis was on the production of vegetables in plas-tic tunnels. After that, he did research on Salix and Populus for three years performing as Forest technician in Swedish Match Co. Then, he started as a fellow in National Parks Administration in 1988. In 1994 he obtained a fellowship from the Netherlands Organization for International Cooperation in Higher Educa-tion (NUFFIC) to do a M.Sc. on Geographic Information System, specialization for Rural and Natural Resource applications, in a joined program of ITC Enschede and Wageningen University, the Netherlands. He graduated in 1996 with a thesis on design of a buffer zone in nature conservation applying GIS and landscape ecology concepts (a case study in Álora, Spain). Back in Argentina, from 1998 to 2000, he started his PhD research (design of biological corridors and habitat analysis in the Yungas) and was also part-time GIS advisor of the Forest Inventory of the National Agriculture Secretariat. Then, he was appointed acting national Director of Conservation of Protected Areas at the National Parks Administration during two years. In 2001, he resigned that position to take a Fulbright Commission Fellowship to continue his PhD research as a visiting researcher at University of California Davis in the GIS Lab of Prof. Richard Plant (Col-lege of Agronomy and Range Sciences). He coordinated several projects related with landscape connectivity and planning of biological corridors, and participatory decision processes. He also partially designed the Biodiversity Information System of the National Parks Administration. In 2004 he was awarded a Canon Science Scholars Program fellowship for doctoral research in National Parks. With this financial support for fieldwork and hardware he could re-launch his research. Recently he was elected by his colleagues as Secretary of the Argentine Chapter of the International Association of Landscape Ecology (IALE). His “sandwich” Ph.D. program started officially in 1997 at the Land Use Planning Group, Physical Planning Department of Wageningen University and Institute of Geography – University of Buenos Aires. He con-tinues as staff of the Argentinean National Parks Administration in its planning department.
CURRICULUM VITAE
179
Address in Argentina:Administración de Parques NacionalesAv. Santa Fe 6901059 Capital FederalArgentinaPhone: +54-11-43110303Fax: +54-11-43158412E-mail: [email protected]@yahoo.com.ar
Current address:Treubstraat 776702 BB WageningenThe NetherlandsPhone: +31- (0)317-840350E-mail: [email protected]@yahoo.com.ar