Embed Size (px)
Citation preview

INTERREG III BStrategy for a Regional PolycentricUrban System in Central Eastern EuropeEconomic Integrating ZoneRePUS
finalreportregional polycentric urban system

repus_FINALREPORT.qxd 2007. 09. 20. 16:25 Page 1

repus_FINALREPORT.qxd 2007. 09. 20. 16:25 Page 2

REPUS Project Partners
Lead Partner – ITALY: Emilia-Romagna RegionPaolo MATTIUSSI (RePUS Project Head) • Myriam MATTEUCCI (RePUS co-ordinator)Roberta BENINI (RePUS Scientific Project Director)
HUNGARY: VÁTI – Hungarian Public Non-profit Company for Regional Development and Town Planning, BudapestIstván FERENCSIK (Country project Head) • Géza SALAMIN • Ádám RADVÁNSZKI • Attila SÜTÕ
POLAND: Institute of Urban Development, KrakowGrazyna KORZENIAK (Country project Head) • Katarzyna GORCZYCA • Agnieszka ROZENAU RYBOWICZ
SLOVENIA: Ministry of the Environment and Spatial Planning, LjubljanaJanja KREITMAYER MCKENZIE (Country project Head) • Nataša PICHLER-MILANOVICAlma ZAVODNIK LAMOVŠEK • Metka SITAR
AUSTRIA: ÖIR Austrian Institute for Regional Studies and Spatial Planning, ViennaUrsula MOLLAY (Country project Head)
CZECH REPUBLIC: Czech Technical University in Prague/ Faculty of Architecture, PragueKarel MAIER (Country project Head) • Ondrej Mulícek • Ludek SÝKORA
REPUS STEERING COMMITTEE MEMBERS
Roberta Benini, Nomisma - Economic Research Institute, HeadUnit for Spatial and Regional Development Strategy, International Programmes, Bologna
Roberto Camagni, Polytechnic of Milan, Technical University, MilanIstván Ferencsik, VÁTI, BudapestErzsébet Vajdovich-Visy, Budapest University of Technology and Economics (BME),
Department of Sociology Regional Development and Planning, BudapestGrazyna Korzeniak, Institute of Urban Development, KrakowAndrzej Zborowski, Jagiellonian University Institute of Geography and Spatial Management, KrakowJanja Kreitmayer Mckenzie, Ministry of the Environment and Spatial Planning, LjubljanaAndrej Cerne, University of Ljubljana, Faculty of Arts, Department of Geography, LjubljanaKarel Maier, Czech Technical University in Prague, Faculty of Architecture, PragueJaromír Stejskal, Institute for Spatial Development, Brno
OTHER COLLABORATORS TO REPUS PROJECT ARE THE FOLLOWING:Italy: Manuela Capelli, Celeste Ungaro, Paolo Naldi, Francesco Masi, Alessandro Selva Hungary: Dóra Illés Czech Republic: Irena Pokorná, Filip Drda, Jakub Vorel Austria: Iris WachSlovenia: Dejan Cigale, Marko Krevs, Tadej Zaucer, Vlado Drozg, Petra Gostincar
ˆ ˆ ˆ
ˆ
ˆ
ˆ
ˆ
ˆ
repus_FINALREPORT.qxd 2007. 09. 20. 16:25 Page 3

Foreword This Final Report is a condensed version of the main findings of the INTERREG III B RePUS (Regional PolycentricUrban System, project number: 5C010) that have been achieved during the two year project, on the basis of acommon RePUS methodology by the six Partners Teams. This implies that the individual country analyses thathave been carried out as empirical spatial analyses, pilot studies and policy strategy analyses are not fullypresented in this document. Thus, this report does not go into detail on the methodology employed and on thequantitative results.
This Report is a synthesis that aims at highlighting the main crucial and critical features of the urban settlementsystems and their policy implications in Central and Eastern European countries. It will be a contribution to theongoing debate at European level, about the search for a difficult balance between, on one hand, cohesionpolicy - where polycentric development vision is concentrated on small and medium-sized towns, and on theother hand, competitiveness policy, that primes the central role of the large metropolitan areas and capitals. Theaim was to combine these two different approaches, proposing a positive vision that focuses on the greatpotential of small and medium-sized towns.
repus_FINALREPORT.qxd 2007. 09. 20. 16:25 Page 4

FINAL REPORTEdited by Roberta Benini, RePUS Scientific Project Director
with the support of Paolo Naldi, Emilia-Romagna Region
repus_FINALREPORT.qxd 2007. 09. 20. 16:25 Page 5

6
repusfinalreport
INDEX
1. INTRODUCTION ............................................................................................................................................10
1.1 Project targets and main issues ..........................................................................................................101.1.1 Which Polycentric vision for the project?....................................................................................101.1.2 Polycentrism from three perspectives: as a morphological dimension,
as functional relations, and as a policy target ..........................................................................101.1.3 Small and medium-sized towns: a matter of definition or a policy-choice?..............................12
1.2 Legacy of the past and the impact on the present spatial shaping in Centraland Eastern Europe ............................................................................................................................141.2.1 Which implications for the present spatial development since transition
started in the 1990s? ..................................................................................................................15
1.3 Macro economic framework of the Central Eastern European areas: catching up andgrowing regional disparities ................................................................................................................16
2. SPATIAL ANALYSIS ......................................................................................................................................23
2.1 Spatial/urban patterns of growth in Central – Eastern Europe: some generalcharacteristics and macro-areas ........................................................................................................232.1.1 Macro-areas and sub-systems of urban potential integration ..................................................292.1.2 The question of accessibility, improving connectivity among regions in a
cross-country perspective ..........................................................................................................37
2.2 Hierarchy of the Urban areas ..............................................................................................................43
2.3 Spatial polarisation, inter and intra disparities ....................................................................................522.3.1 Degree of monocentricity / polycentricity by population and economic functions ..................532.3.2 Intra-LLS degree of polarisation ................................................................................................58 2.3.3 Morphology aspects of the spatial urban system in the RePUS areas ....................................58
2.4 Integrated Central Eastern European spaces. The strong areas of spatial integration......................62
2.5 Typology of LLS: (Cluster analysis)......................................................................................................74
3. THE POLICY STRATEGY DIMENSION..........................................................................................................88
3.1 The European context between territorial cohesion and competitiveness ........................................88
3.2 Spatial vision of polycentric development in the RePUS area ............................................................89
3.3 Critical policy issues ..........................................................................................................................101
4. CONCLUSION ............................................................................................................................................104
SELECTED REFERENCES ..........................................................................................................................110
repus_FINALREPORT.qxd 2007. 09. 20. 16:25 Page 6

1. GDP per capita ppp NUTS 3 (100 = EU average) ....................................................................................172. Unemployment rate 2003 ..........................................................................................................................193. Population Density in the EU25 ..................................................................................................................224. Population Density by LLS, RePUS countries ............................................................................................245. Population dynamics by Municipalities, RePUS countries..........................................................................256. GVA per capita index of RePUS countries ..................................................................................................277. Economic Aggregate per capita by LLS in Czech Republic (2001) ..........................................................298. Rate of Unemployment, RePUS countries ................................................................................................309. Functional urban areas against a background of development axes planned in Poland..........................3110. Macro-Areas in Poland ..............................................................................................................................3111. Macro-Areas in Hungary..............................................................................................................................3312. Macro-Areas in the Czech Republic............................................................................................................3313. Macro-Areas in Slovenia ............................................................................................................................3414. Macro-Areas in Austria ................................................................................................................................3415. Strategic macro-areas for integrated development in Italy ......................................................................3616. Macro-Areas in Italy ....................................................................................................................................3617. Trunk road networks in RePUS countries. TEN-T Priority projects (2006) ................................................3818. Railway networks in RePUS countries. TEN-T Priority projects (2006) ......................................................3919. Trunk road networks in RePUS countries with TEN-T networks (2006) ....................................................4020. Railway networks in RePUS countries with TEN-T networks (2006) ..........................................................4121. Urban Hierarchy, RePUS countries ............................................................................................................4522. Budapest metropolitan area ........................................................................................................................5023. Degree of polycentricity by NUTS 2 region in RePUS countries
– Coefficient of variation of LLS’ population ..............................................................................................5424. Intra-Regional (LLS) economic polarisation by NUTS 2 region in RePUS countries
– GVA’s Williamson’s coefficient of variation ..............................................................................................5525. Intra-LLS degree of polarization by population function in RePUS countries
(relative weight of centroid population on LLS population) ......................................................................5626. Typology of LLS............................................................................................................................................5727. PUSHs overlapping in each municipalities ................................................................................................6028. Population within 60 minutes accessibility to the centre of regional capital by car ..................................6129. Potential of the territory for polycentric development at local level ............................................................6130. Efficiency of servicing population................................................................................................................6231. PIA Population..............................................................................................................................................6332. LLS and Cross-Border and neighbouring countries Relationships ..........................................................6533. Potential areas of cross-border cooperation in Poland ..............................................................................6634. Kraków - Upper Silesia Cooperation ..........................................................................................................6635. Cross-border cooperation in the Czech Republic ......................................................................................6736. Cross-border cooperation and Euro-Regions in Austria ............................................................................6737. CENTROPE cooperation..............................................................................................................................6938. Cross-border in Hungary ............................................................................................................................7039. Alps-Adriatic (Alpe-Adria) cross-border region ..........................................................................................7040. Location of selected car production plants in the Czech Republic, Slovakia and in the
neighbouring parts of Poland and Hungary ..............................................................................................7841. Typology by LLS in Poland ..........................................................................................................................7942. Typology by LLS in Hungary ........................................................................................................................8043. Typology by LLS in the Czech Republic......................................................................................................8244. Typology by LLS in Slovenia ........................................................................................................................84
LIST OF MAPS
7
repusfinalreport
repus_FINALREPORT.qxd 2007. 09. 20. 16:25 Page 7

8
repusfinalreport
45. Typology by LLS in Italy ..............................................................................................................................8546. Typology by LLS in Austria ..........................................................................................................................8747. Regional development poles and axes in Hungary ....................................................................................9148. Polycentric development of Polish space ..................................................................................................9449. Development areas, development axes and specific areas in the Czech Republic ..................................9650. “Centres of (inter)national, regional and inter-municipal importance”
(urban network) with city clusters, agglomerations and functional urban areas........................................9951. RePUS Countries – Spatial Vision: Development axes ............................................................................10552. RePUS Countries – Spatial Vision: Cooperation and Development areas ..............................................107
1. City LLS hierarchy up to Regional 1 ............................................................................................................442. RePUS Dynamic trend of the Urban hierarchy (Poland, Hungary, Czech R., Slovenia): a Synthesis........473. Selected indicators of Cluster Analysis ......................................................................................................75
Figures 1 and 2 Coefficient of Variation GDP per capita PPS, NUTS 2 and NUTS 3 Regions in the EU 25 ....20 Figures 3 and 4 Coefficient of Variation GDP per capita PPS, NUTS 2 and NUTS 3
Central-Eastern Europe Regions excluding capital cities ..........................................................................21Figure 5 Economic Performance of Clusters........................................................................................................77Figure 6 The Objective Structure of the National Spatial Development Concept................................................90Figure 7 Poland; the conception of Spatial planning system ..............................................................................93Figure 8 Institutional context of spatial planning of the Czech Republic ............................................................95Figure 9 Spatial Planning integration Scheme in Austria ....................................................................................97Figure 10 The multi-faceted visions of the territories: a new dynamic perspective from
local to global, in Italy ................................................................................................................................100
1. Hungary: a short background of its urban settlement system ..................................................................282. Hungary: the impact of transport improvement on small and medium-sized towns ................................423. Indicators for urban Hierarchy ....................................................................................................................434. The role of small and medium-sized towns in the Budapest metropolitan area........................................495. The centripetal role of Vienna in the largest Central Eastern European space..........................................516. Czech accessibility from a local perspective ..............................................................................................597. Shaping European cooperation centres on the example of Cracow-Upper Silesia Cluster (KRUS) ........648. CENTROPE: An example of cooperation on “Research and Development” ............................................689. Hungary and cross-border areas ................................................................................................................6910. Alpe-Adria Working Community ..................................................................................................................7111. Economic clusters of automotive industry – the case of the Czech and Slovak Republics:
the example of small and medium-sized towns highly specialised and internationally competitive ........76
LIST OF TABLES
LIST OF FIGURES
LIST OF BOXES
repus_FINALREPORT.qxd 2007. 09. 20. 16:25 Page 8

9
repusfinalreport
repus_FINALREPORT.qxd 2007. 09. 20. 16:25 Page 9

10
repusfinalreport
1. Introduction
1.1 Project targets andmain issues
The project has put forward an ambitious target ofproposing a vision of the polycentric development inCentral Eastern Europe, focusing on the role of mediumand small towns, starting from a regional perspective, aspotential way to sustain a more diffused type ofdevelopment. This perspective might favour thedevelopment of functional links and integrationprocesses, fighting the exacerbation of the regionaldisparities that have resulted from the increasing territo-rial concentration of the past two decades in the NewMember countries, since transition started in the 1990s.
The main focus of the project has been the following:• Identifying the potentialities of the regional urban
systems, with the help of a sound spatial analysis,including the analysis of the functional roles andthe identification of the urban hierarchy that hasemerged in this period of rapid changes;
• Identifying the dynamic urban areas/regions wheremedium-sized towns could play the role ofpotential “regional capitals” for developing newfunctional integrating areas, in light of the ongoingslow process of decentralisation;
• Identifying dynamic small towns that can playpositive roles in service provision for highlyurbanised regions or rural areas;
• Analysing the main policy strategy options andidentifying the most critical issues at the forefrontof the present debate on cohesion andcompetitiveness at European level, but lookingfrom the New Member countries perspective.
1.1.1 Which Polycentric vision for the project?
The notion of polycentrism as has been proposed inthe ESDP has been the central innovating vision thathas indicated new avenues for further theoreticalresearch as well as spatial analysis and new policyoptions, looking for a more equitable spatial develop-ment throughout the whole of Europe. However thenotion of “polycentrism” has no unique meaning, butcan be interpreted in different ways, depending on thecontext and the scale in which it is employed: thus it
can acquire different significance having consequentlyalso different policy implications. First of all, polycentrismchanges with the specific scales we are using:
• At European level it is clear that only very largemega-cities represent the counterweight to thedominant Pentagon areas: this perspective of poly-centrism concentrates on the role of the metropolis,and being competitive in the global markets. Thusonly a few competing “global cities” can emerge fromthis layer: in the New Member countries this wouldnecessarily signify only the Capital cities. Followingthis option, the attention given to the metropolitanareas would inevitably imply the exacerbation of thedisparities within the countries, with a few poles ofEuropean importance, leaving the remainingsecondary and tertiary urban layers lagging behind.
• At national level, the capital cities can be therelevant poles of attraction at the expense of thesecondary rank cities that cannot compete withthe “national leaders”;
• At regional and local levels, on the contrary,polycentrism can be brought from below, strengtheningthose local and regional cities that, on the basis ofterritorial proximity, can represent a potential for adenser city/town network, bringing spin-off effects.Thus the territorial contiguity can be beneficial for amore balanced urban development perspective.
This project is focused precisely on the regional scaleanalysis of polycentrism - considering that instead of thedominant trends toward the primacy of the large nationaland global urban poles - the local and regional dimensionis also becoming essential for the consolidation of morediffused creation of wealth. At the same time this visioncan be conducive to improving business conditions andattraction capacity: this in turn will also contribute to theconsolidation of a stable social and economic environment,that is an essential precondition for a more diffuseddevelopment, in order to reduce the effects of excessivespatial and regional gaps, that can represent a costlybrake to economic growth in the long term.
1.1.2 Polycentricism from three perspectives:as a morphological dimension, asfunctional relations and as a policy target
Polycentric development in the framework of thisproject is proposed from three different viewpoints:I. As an empirical observation of the existing urban
structures and their concrete territorial shaping:the morphological dimension;
repus_FINALREPORT.qxd 2007. 09. 20. 16:25 Page 10
II. As functional relations among the different urbansettlements and their related hierarchy, in theframework of the different spatial contexts, eitherregional, national or international.
III. As a policy target in order to pursue a more balanceddevelopment for spatial planning purposes.
As observable phenomena, polycentricity is inevitablyrelated to a given existing urban structure, that in turnis the result of the sedimentation of historic factors, ofold and recent urban policies, of spontaneousprocesses of location and mobility of resources andpopulation: all these historic, socio-economic andinstitutional factors have contributed to the shaping ofthe present urban structures. Thus polycentricismfrom this perspective, is related to its morphologicaldimension: consequently, any policy target thatpursues the objective of a polycentric development,cannot avoid taking into consideration the existingurban structures and their functional relations.
However polycentric development can become anambitious policy target to the extent that it tends toimprove the urban functions associated with theexisting urban settlements, sparsely located in theterritory. Proposing a polycentric vision of an urbanstrategy is meant to improve the conditions for amore efficient allocation of resources in the urbanareas, to up-grade the services delivery to populationand businesses in order to ameliorate the attractioncapacity for residential population or for businesslocation, to favour the regeneration of the cities.One of the most useful instruments for facilitatingthe elaboration and implementation of those targets,is the urban network, which is increasingly consideredas a powerful way to improve a polycentric vision(see ESPON 1.1.1.).
But it is clear that no centralised policy can create theabstract perfect equilibrium of Christaller’s polygons inthe territory, taking into consideration that increasinglydominant forces are pushing toward further spatialconcentration, rather than diffusion. The global networkis also the result of the relative loosening of the physicalcontiguity in the territory, for exerting a function: as far asthe links between institutional and economic actorsbecome intangible, favoured by the globalisation ofthe markets and the changing of the specialisationpatterns, by ICT technologies and information societydevelopment, increasing mobility of factors and persons,proximity is weakening relatively in importance, puttingin a de facto prime position, the dimension of theworld players competitiveness.
Thus, “global cities” exert their dominant functions atworld level (OECD, 2006), far beyond the physicalterritory where they are located. If this trend was theonly dominant dimension, local and regional integration,based on more diffused urban structure – includingsmall and medium urban settlements – would, as aresult, decrease in relative importance.
The alternative vision to the “global cities” was basedon the assumption that strong integration of small andmedium (down from large metropolitan areas) urbanentities - as a lower layer of functional urban relationswith proper internal hierarchy - might be able to optimisethe allocation of resources and attraction capacity, inorder to be capable of competing “as integrated urbansystems” – and not as isolated entities – withmetropolitan areas.
It is clear that these two opposite trends - concentrationversus diffusion - are constantly confronting eachother: the question is to what extent do the assump-tions that are behind these two opposite “models” –“global cities” and “local-regional urban system” –coexists or are they inevitably in conflict, giving rise toa “winner- looser” result. In other words, is competitivenessin the global markets, necessarily related only toconcentration around strong poles or might it also bebased on regional city networks? The costs and thebenefits of these two options are different if we look atthe short or the long term: the balance between themis a difficult policy question.
The hypothesis and the largely shared belief – confirmedalso by the ESDP’s vision of Cohesion targets – is thatthe improvement of the city function delivery, also forsmall and medium urban entities, might facilitate defacto a more equitable development to the extent thatthe urban structures are not much affected but therecould be excessive polarisation towards one core-centre.The weakening of the urban hierarchy, as wasconceived by Christaller - on the basis of the servicespecialisation functions – accelerated by the widespreaddiffusion of the ICT and expansion of welfare systems,propose again at higher levels and by qualitativelydifferent factors, the question of the polarisation andhierarchy among urban settlements. To propose avision of polycentrism at regional level might give theopportunity to test and up-date the analysis of thetraditional hierarchy model, seen from the top of thehierarchy.
It is precisely the scope of the project to propose apolycentric vision from a regional perspective, and from
11
repusfinalreport
repus_FINALREPORT.qxd 2007. 09. 20. 16:25 Page 11

this policy perspective, to mobilise the policy-makingactors from the bottom, but being aware that thesetrends that favour a more equitable spatial shaping ofthe urban areas, cannot represent the only dominanttrend: the exacerbation of competition, which exertstremendous pressure on the urban functions of thecities and their capacity to compete.
The increasing role of the capital-cities in all theRePUS countries, even if at different degrees, showthat the polarisation effects are dominant, but interestingnew trends also indicate that secondary layerscities/urban agglomeration areas are emerging, evenif not at the same pace, and not univocally. Also smalltowns can emerge as dynamic entities, in particularwhen they acquire stronger functions and specialisation.It is on the basis of interesting new findings that thepicture that results from RePUS analysis brings a newinsight on the spatial analysis and the policy debatethat might contribute to suggesting some of the mostcritical issues.
1.1.3 Small and medium-sized towns:a matter of definition or a policy-choice
The term small and medium-sized towns, is primarilyrelated to the “size” as the first criteria retained for theirclassification, in their institutional/administrativedelimitation. There are no standard definitions of smallto medium-sized towns in Europe as such: each countryeither does not refer explicitly to these “size” elements,identifies them by contrast, as result of subtraction ofthe large cities / metropolises - Italy for instance refersonly to “metropolitan areas”, as large agglomerations,but does not mention other urban smaller entities, ordefines them on the basis of the functional criteria –certain degrees and type of functions assigned to acertain urban size, as in Germany (see for details seeESPON 1.4.1.).
The simple ranking of small and medium towns fromthe population size can start from a threshold of 2,000residents, or 5,000 or 10,000 as minimum requirementfor defining an urban settlement as a small town, from30,000 to 60,000 residents up to 120,000-150,000residents, to be defined as a medium-sized town.URBAN-Audit adopted a maximum threshold for asmall town up to 50,000, medium-sized town from51,000 to 250,000 and large city more than 250,000.
The diversity in the individual country definition can berelated to the combination of different factors such as:
12
I. the political scopes of each country, II. the functional scopes of the territorial entities
depending on the degree of consolidation ofspatial planning traditions (stronger in Northernand Central Eastern European countries than inSouthern countries);
III. the size of the country and its population density arealso factors that influence to a large extent the choiceof criteria for the definition of the urban entities;
IV. the geo-physical factors that might influence thedelimitation of the border of the administrative cityentity (e.g. mountains, isles, desert areas etc.)
In this context, RePUS did not raise the question ofdefinition of small and medium-sized towns, but hasassumed implicitly that each country shall apply its owncriteria, as the national urban settlement system hasbeen retained as main reference for the spatial analysis.
Thus, the absence of standardised classification ofsmall and medium sized cites, does not allow oneunique categorization if not combined with othercriteria that identify their role within the urban hierarchyof each national settlement system. The attributes thatqualify them in terms of Function, remain the maindominant criteria, following a vision of spatial urbanstructure that goes beyond the purely administrativecriteria of the city’s administrative delimitation.
The multi-faceted dimensions of urban areas
repusfinalreport
Morphologicalarea
Functional area
Administrativearea
Built-up area
Policy decisionmaking
City- functions ascentral attribute
repus_FINALREPORT.qxd 2007. 09. 20. 16:25 Page 12

The non correspondence between administrativeboundaries, functional role and morphological dimensionof the cities (see also ESPON 1.4.1.) represents themost controversial aspects that make it extremelydifficult to match the different levels that deal withdiverse scopes:
• the morphological aspects that are related to thelocation of the resources and to land use that gobeyond the administrative responsibilities (includingthe sprawl phenomena).
• the attraction capacity for jobs (labour market),service-provision, cultural supply etc. that dependon the dominant or diversified functions that eachcity is able to exert;
• the policy-making function that is formally limitedto its (the city’s) administrative boundaries;
The functional role takes precedence over the twoother components, in the attempt to identify a morerealistic dimension of the influence that the cities exertin their territorial surroundings. The identification of theLocal Labour System (LLS) is thus the commonmethodology that has been most widely employed inmost of the European countries (OECD, 2002; ESPON1.1.1), among the Old Member countries, as a spatialunit for making an approximation of the functional cityspace. Thus the LLS, on the basis of the intensity of thedaily commute from the residential areas to the maincity that provides jobs, gives an approximation of itslabour market size. This becomes an area of influencethat a city can exercise on its neighbouring municipalities,including other minor urban centres. The functionalareas that the New Members identified become thebase for the spatial analysis of the RePUS countries.From this perspective small- medium or large townsplay either the central function as city-centre (centroid)of their respective LLS, or they can be part of largerlabour market system on the basis of reciprocal relationswith the other towns, depending on the internal hierarchyamong the different urban centres.
Small and medium-sized towns, for their size andpeculiarities, inserted into this perspective of LLS –acquire a fundamental role in creating dynamic processesin the territory, in particular for the functions that can exert:
• Facilitation of the pursuit of Cohesion targets, sincethe strengthening of small and medium-sizedtowns favours the improvement of economic activityand service diffusion provision over the territory,becoming a counter-weight to excessive concen-tration on large poles (capital cities/metropolises).
A dense network of small to medium-sized townswith a weak hierarchy can represent a strongpotential polycentric urban structure. For EasternEuropean countries this target is particularly relevant,in light of the heritage of the past urban and spatialplanning experience.
• Contribution to the slowing down of the sub-urbanisation phenomena around large cities, assprawl phenomena, and to creation of attractioncapacity for potential living areas and /or businessattraction investments areas, as alternatives tolarge metropolitan areas. Small towns surroundinglarge cities or metropolitan functional areas, canacquire complementary or specific functionscontributing in many cases to ease the metropolis’scongestion problems and also contributing to thecreation of what are called “urban regions” Thephenomena of sub-urbanisation and sprawl havealso accelerated in the New Member countries, inparticular around the main cities and in somecases there is the interesting phenomena of theemergence of smaller urban centres, becomingalternative attractions for secondary centres.
• The increasing services diffusion over the territoryand the need for higher quality services – forbusinesses and for the resident population –make the question of spatial diffusion more andmore crucial, and small and medium-sized townscan become a fundamental way to improve a moreequitable development of non-central areas, butalso to contribute to a more integrated urbanstructure, counterbalancing excessive polarisationphenomena, essential for service provision to thelocal population spread sparsely in dominantlyrural regions. New secondary and tertiary urbanlayers in the New Member countries seem tosuggest that a slow process has started in thisdirection, as services are becoming increasinglyrelevant over the industry that has rapidly shrunksince the 1990s.
• Rural-urban relations: differing from country tocountry. A process of increasing integrationbetween urban and rural areas is now the prevailingtrend, due to contemporaneous phenomena:
I. the rapid growth of inner and outer areasaround the main city core, encompassinglarger portions of green areas, and further theemergence of “green regions”, developingtourist and ecological functions;
13
repusfinalreport
repus_FINALREPORT.qxd 2007. 09. 20. 16:25 Page 13

II. the increasing importance of recreationalgreen areas as a qualifying factor of highstandards of living and ecologically cleanurban environment, in particular in smaller andmedium-sized towns;
III. the diffusion of provision of services, in particularcommercial services, in the hinterland of majorcities, but also sparsely located in previousagricultural areas, close to small urbansettlements (specialised commercial areas);
IV. the gradual growing of the ICT that can ensureinformation flows access in all remote areas,becoming a powerful channel for spatial inclusion,provided that the necessary pre-conditionsexist as ICT technical assets. The territorialdiffusion of ICT however is very uneven. Thesmallest towns have a particularly sensitive rolefor guaranteeing a certain level of serviceprovision in dominantly rural or agriculturalareas/ regions. Thus a small town can have arelevant function – for basic services – within itssurrounding rural/or agricultural areas despiteits small size.
The rural areas in the New Members countries, areeither sparsely located as in the Czech Republic andHungary, or concentrated as in some regions inPoland. Some are isolated from urban centres and arefacing the problems of segregation of social bracketsexcluded from cities and towns. Thus, the improvementof the urban function of small towns is crucial for thesparse population in those areas, often far away fromthe large urban agglomerations.
1.2 Legacy of the past and theimpact on the present spatialshaping in Central andEastern Europe
The long period of centralised economic system inCentral and Eastern Europe has heavily impacted theshaping of the urban and economic structures,against the backdrop of their respective historicalbackground. The speed by which the catching-upprocess is advancing, since transition started, hashowever brought in turn other social and financialcosts that indicate that still-important processes of
14
adjustment and restructuring are under-way which willnot last for long. Urban regeneration, adjustment anddevelopment is an integral part of this process, sincecities concentrate fundamental functions and play acrucial role within the national economy, for providingconditions that ensure high productivity, skills andqualifications, diversification of services for guaranteeingdurable economic growth.
A few main factors are essential in understanding thedistortions that affected these economies and theirspatial structures, during the past half-century ofcentralised planning:
1. The Industry-based development has favoured themono-functional profile of regions and cities with astrong impact on their spatial structures, leading toa fragmented and vertically based configuration.The loss of their previous role, with the opening upof the economy since 1990s, has broughtwidespread economic crisis phenomena thathave heavily affected entire regions and at locallevel, industrial towns, most of which were builtexclusively for the scope of industrialisation (heavyindustry and mining).
2. Limited services development has contributed tothe decline of some fundamental urban functions,which has a de facto weakening effect on the roleof the cities in the overall national context. It isinteresting to note that Christaller’s theory wastaken - as an implicit or explicit reference- by thecentral planners in Central and Eastern Europe, ashis geometrical hierarchical system of functionsmatch the scopes of the planners: guaranteeing aminimum basic delivery of services to the entirepopulation, depending on settlement layers,considering the fundamentally supply – driveneconomic model (ex-ante identification of thepotential demand for goods and services). Thepolitical and institutional pyramid corresponded,therefore, to the hierarchical pyramidal system ofurban settlements. However, this vision hasbrought on the other side, a more equal distributionof resources all over the country, irrespective ofcost considerations or rarity of the resources: thisis also the reason for the lower relative regionaldisparities in the planning economies, comparedto the Old Member countries.
3. There has been weak infrastructure development withdaily mobility at short distance, many from villages tolarger cities, or as in Poland (for double industrial and
repusfinalreport
repus_FINALREPORT.qxd 2007. 09. 20. 16:25 Page 14

agricultural employment phenomena), even at longdistance – weekly/ monthly commuting. On the otherhand, a widespread scarcity of housing wascomplemented by weekly-monthly commutingpublic hostels – all over the country. Some sprawlphenomena around the main cities in fact started todevelop, even in the 1980s. This situation of transportshortage has badly affected most of the internal(enclaves) or peripheral territories in particular in theEast. The railway system was the public’s prioritymeans of transport, very dense in order to ensureinternal mobility, whilst the road system remainedunderdeveloped, being both a consequence and acause at the same time, of the small dimension of theprivate car market. However road public transport (buses)has been a powerful means for commuting mobility.
4. Political and institutional centralisation that has hada de facto strengthening effect on the pivotal role ofthe capital city and main industrial centres in someregions, but in turn, has not favoured (or weakened)some of the secondary city layers. Country by countrydifferences of course remain large, as for examplePoland remains strongly polycentric with strongregional centres. However, the building of a pyramidaladministrative system has brought a de factopolarisation phenomenon, accompanied on theopposite side, by the identification of smaller territo-rial units – at lower regional/local levels: for instance,Hungary had the Counties; Poland had theVoivodship; Czech Republic had Regions or kraje.Slovenia is a different case, as it was part of the formerYugoslavian Federal system, and enjoyed higherdecentralised units, but without political powers.
5. The intermediary upper level, the Regions (under-stood by European layer, as NUTS 2 or similarsize) was lacking, also because it was seen as apotential counter-weight to central power: this facthas also impacted on the potential role of the“regional capitals”, as balanced urban poles vis-à-vis the capital city. The situations of course differcountry by country, as in the Czech Republic particularattention was given to main regional cities.
1.2.1 Which implications for the present spatialdevelopment since transition startedin the 1990s?
Taking into consideration the distortions that thecentralised planning system has brought, the process
of adjustment has rapidly evolved, bringing importantchanges in the organisation and shaping of theterritory, both at local/regional and national level.
• The inherited spatial polarity between Westernand Eastern parts of the countries or betweenNorth and South, varying country by country,might also change relative to each other,because of the improved accessibility thatmight facilitate new opportunities for investmentsenhancing attraction capacity. The improvementsin accessibility however do not necessarilyautomatically bring the expected benefits; onthe contrary, this might further slow down theperipheral areas by facilitating the out-flow ofpeople, if the local conditions there do notimprove substantially.
• The increasing disparities among regions at differentlayers, is accompanied at the same time by amodification of the “winner-looser” balance of theregion, since the previously wealthy regions(industrial mono-functional region) are declining.So new regional gaps are emerging due in themost part, to the increasing polarisation aroundthe capital.
• The diversification of the economy, away frommono-functional industrial specialisations, oftenconcentrated in small-medium-sized towns, isstrongly related to the development of services.Thus the cities and urban regions become thecore of the new economy and the services providea strong potential for job creation and improvementof the standard of living, facing the increasingsocial distress and high rate of unemployment, inparticular in unfavourable areas or regions.
• The improvement of accessibility at high level, withthe rapid growth of infrastructure for roads andworsening of public transport servicespredominantly in peripheral areas, has startedto modify the speed of the connectionsbetween urban centres, facilitating highermobility of people and goods. Thus the problemof congestion and the rapid growth of privatecar users have negatively affected the environmentand indirectly also fuelled sprawl around themain urban centres.
• New urban functions are developing mainly relatedto the diversification of services both public andprivate, with different implications depending on
15
repusfinalreport
repus_FINALREPORT.qxd 2007. 09. 20. 16:25 Page 15
16
repusfinalreport
the size of the city, as far as markets consolidateand need high quality, effective service provisionfor attraction of investments and job creation.The polarisation phenomena result increased asthe importance of the capital city increased in allthe countries and new specialisation patternsdeveloped, facing pressure from globalisation.
• Increase of the private housing market, renovationand up-grading of old houses - accompanied by acyclical trend with crisis at the beginning of the1990s – has substantially modified the growthpattern of the cities, with the mushrooming of thesub-urbanisation phenomena also bringing sprawlphenomena.
• The changing levels of the spatial disparities withthe emergence of new micro-phenomena of declineareas, even at the border of main urban poles, withhigh rates of unemployment and a concentrationof social distress.
• The creation of the intermediary level, the largeRegions (NUTS 2) – even if at this stage they aremainly for planning purposes and not fullyadministrative entities - as Poland is the onlycountry at this stage, due also to the size of thecountry, having formally this regional dimension,the others being or at the initial implementingphase as Slovenia or still at the stage ofdiscussion as in Hungary – following theNUTS 3 levels. NUTS 2 however for their largerdimension contributes to change the perspectiveof institutional functions and may have animportant impact on future spatial development,as catalyst for economic growth as far as themain urban centres - the potential “regionalcapitals” that can balance the weight of thecapital city- in those regions, reinforce theirfunctions and may bring new spreading effectsin their regional surrounding territory.
• This does not come in contradiction althoughwith the important role that the NUTS 3 have,considering the relatively small size of manyCentral Eastern European countries, withexclusion of Poland. NUTS 3 suggest that is agood layer for lower intermediary territorialmanagement, strengthening the small andmedium-sized towns as their servicing cores,slowing down long-distance commuting. Thiscontributes to smooth development at lowerlevels.
1.3 Macro economic frameworkof the Central EasternEuropean areas: catchingup and growing regionaldisparities
For understanding the stage and the dynamics thatcharacterise the different economic and spatialgrowth pattern in the New Member countries, thereis a need to frame them within the broaderEuropean framework, from different perspectives:from the macro-economic perspective; from theregional perspective both as inter-regional disparitiesat the EU 25, and intra-regional disparities, withineach country; and finally against the background ofa broader picture of the territorial morphology(population density) and accessibility (transportnetwork).
• From the macro-economic perspective: countrydisparities and their catching up process towardconvergence, started since the 1990s. The startingdisparities among countries, between the OldMember States and the New Member States interms of levels, remain relevant even if substantialcatching up has taken place, the New Membersbeing between 50% and 75% of the EU 25 averagein terms of economic performance. Catching-uphas been characterised by different phases andpaces, as the process of restructuring andadjustment does not proceed uniformly, countryby country: more sustained growth rates havebeen recorded since 2000, whilst during the1990s (Landesmann and Romisch, 2006) therate was moderated for the cost of theadjustments – most of the financial andeconomic crisis happened between 1995 and1999, and not comparable to those countries,like Ireland. The hypothetical period for catchingup at the EU average level, changes country bycountry, but for all remains within somedecades everywhere (Third and Fourth CohesionReport, EU).
repus_FINALREPORT.qxd 2007. 09. 20. 16:25 Page 16
17
repusfinalreport
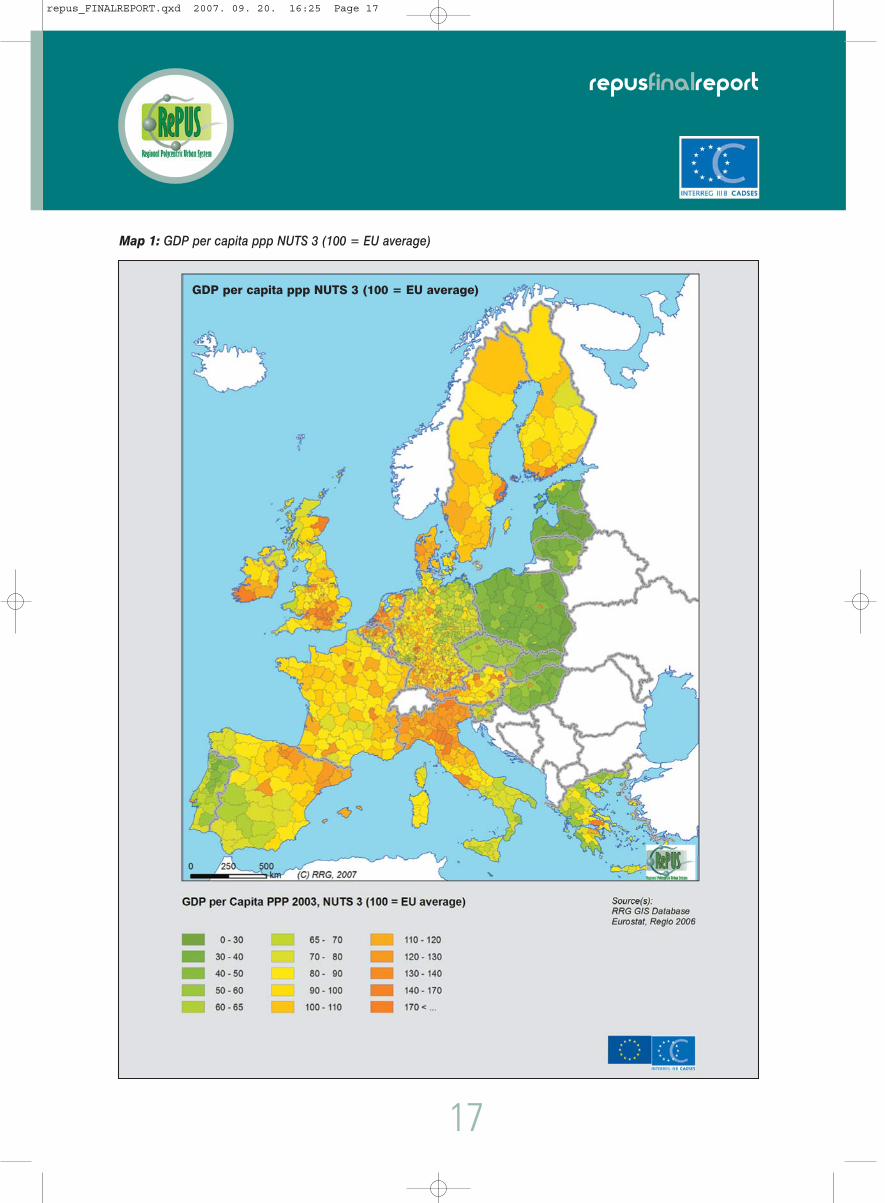
Map 1: GDP per capita ppp NUTS 3 (100 = EU average)
GDP per capita ppp NUTS 3 (100 = EU average)
repus_FINALREPORT.qxd 2007. 09. 20. 16:25 Page 17

18
repusfinalreport
1 In these cross-countries comparison of course the territorial size of their respective regions, in particular NUTS 2 and NUTS 3 but as well as the size of the municipalities, is very relevant when measuring the gaps, but this is an uncertain factor that enter inevitably in all quantitative analysis that deals with diverse territories.
• From a regional perspective: the inter-regionaldisparities among EU countries tend to increase. Ifconvergence occurs at country level, the inter-regionaldisparities tend to increase among regions, as onlythe strongest regions/metropolitan areas are drivenupward by competitiveness. Referring to the NewMember countries this indicates that only fewregions are driving national growth as they becomethe main growth engine of the national economy:important regional gaps vis-à-vis the EU 25 averageat the beginning of 2003 were between 35% and70% of the EU average, but the capital cities emergehigh above the EU 25 average. This emerges clearlyfrom the dichotomy between the capital cities andthe other regions in each national context (seebelow). From the map 1. (GDP per capita ppp atNUTS 3 level), it also appears that the divide East-West remains significant, and crosses the mostperipheral regions on the East side, as in Poland,Czech Republic and Hungary. The territorial proximityto Eastern transition economies remain the mainexplanation of the phenomena together with theheritage of the old industrial and/or agriculturespecialisation, both under strong down-sizingprocesses. The adjustment of the labour market andthe high rate of unemployment also give a strongindication of the difficulties of the process ofrestructuring and the need for alternative jobcreation strategies/relocation of human resources(see the Map 2.)
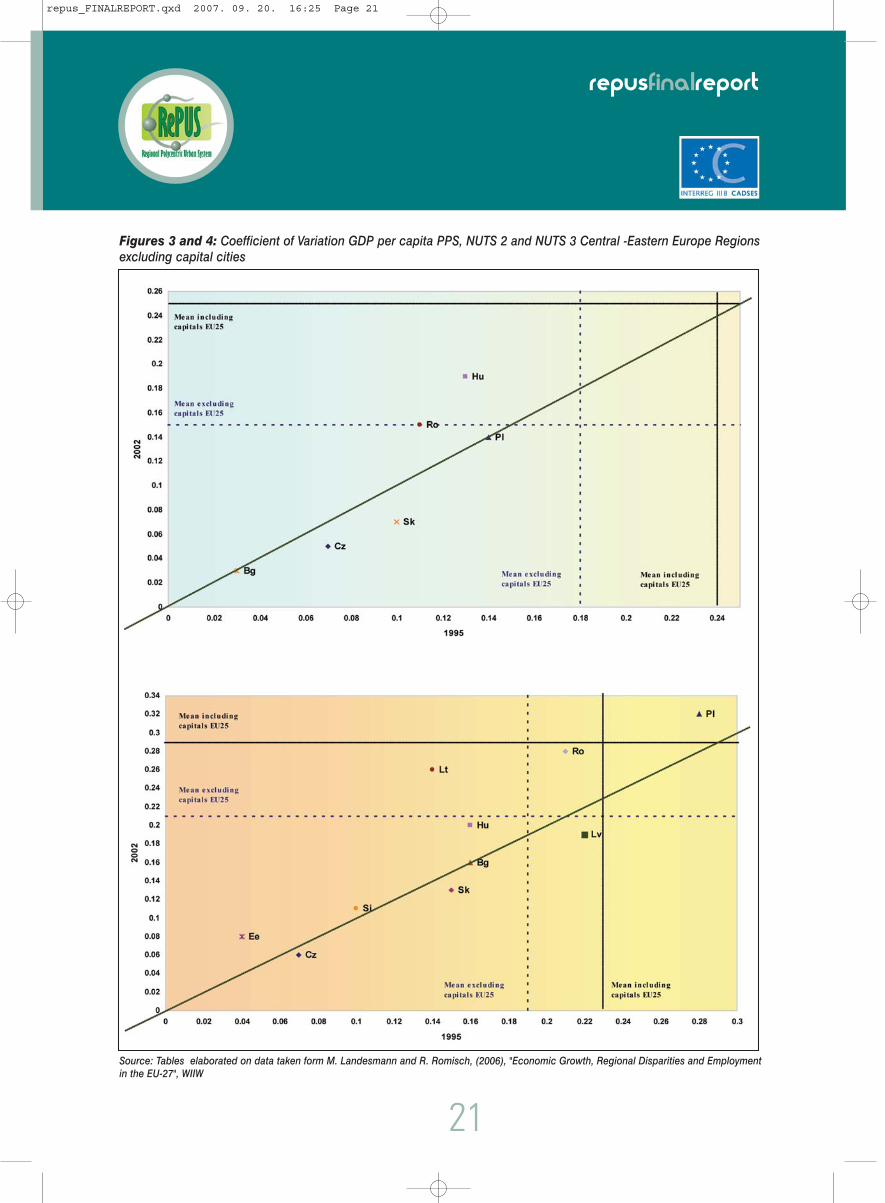
• From an intra-regional perspective: the regionaldisparities within each country increase as sign of apolarisation process. Looking at the regionaldisparities within each country (see Fig.1 and 2), itis evident that a new process of polarisation hastaken place, as regions develop at different pacesand levels. The polarisation around the capitals inall the New Member countries is also coupled withthe decline of the previous prosperous regions(old industrialisation) and the decline of agriculture(low productivity) areas that affect large parts ofthe regions, in particular in Poland and Hungary.
Looking closely at the measure of disparities (thecoefficient of variation for NUTS 2 and NUTS 3 levels)1
in 1995 and 2002, gives interesting indications:
I. The disparities at both levels in Central - EasternEurope tend to increase, even in cases where the
starting levels are below those existing in Westerncountries, as for Poland; Slovakia and the CzechRepublic, the disparities are in absolute terms higherthan all the other countries, including Western Europe.The increase in the level of disparities between thetwo years (1995 and 2002) is extremely high in theCzech Republic, followed by Hungary for both NUTS2 and NUTS 3; however Poland saw large increasesin disparities at NUTS 3 level, indicating that a catchingup process is taking place only for a few regionswhere more dynamic factors are concentrated.
II. In general, the levels of regional disparities betweenWest and East, in 1995 are much higher for the latterthan for the former, and they tend to increase morefor NUTS 3 for Central - Eastern countries: howevernot for Czech Republic and Slovakia, where theNUTS 2 disparities are higher than the NUTS 3 level,and it can be ascribed to the fact that the problemsof adjustment are relatively concentrated in a fewregions affected by decline, rather than dispersed atlower levels through out the country (NUTS 3).
III. If the weight of the capital is removed from therespective regional balance (see Fig. 3 and 4), thelevels of disparities are significantly reduced, andfor the case of the Czech Republic and Slovakia,even very strongly, whilst for Poland the gaps arevery small, confirming a very different degree ofpolarisation among the countries. Among theRePUS countries, the Czech Republic results as thecountry most highly polarised around the capital,with a striking increase between the two years,whilst the regions have a strong even level amongthemselves. This indicates that Prague is leadingthe economic growth of the country at an increasingpace, leaving behind the remaining regions that areat relatively similar levels of performance.
The exacerbation of the disparities are also primarilyrelated to the relative performance of their urbancentres as they concentrate the highest quality humanand financial resources: conversely, increasing gapsare also the results of the difficulties of the main urbancentres in becoming dynamic centres of economicexpansion, attraction and innovation.
From the morphological point of view, looking at thepopulation density (see Map 3) in the New Membercountry areas the average densities remain relatively
repus_FINALREPORT.qxd 2007. 09. 20. 16:25 Page 18

Map 2: Unemployment rate 2003
19
repusfinalreport
UNEMPLOYMENT RATE 2003
repus_FINALREPORT.qxd 2007. 09. 20. 16:25 Page 19

20
repusfinalreport
Source: Tables elaborated on data taken form M. Landesmann and R. Romisch, (2006), "Economic Growth, Regional Disparities and Employmentin the EU-27", WIIW
Figures 1 and 2: Coefficient of Variation GDP per capita PPS, NUTS 2 and NUTS 3 Regions in the EU 25
repus_FINALREPORT.qxd 2007. 09. 20. 16:25 Page 20
Source: Tables elaborated on data taken form M. Landesmann and R. Romisch, (2006), "Economic Growth, Regional Disparities and Employmentin the EU-27", WIIW
21
repusfinalreport
Figures 3 and 4: Coefficient of Variation GDP per capita PPS, NUTS 2 and NUTS 3 Central -Eastern Europe Regionsexcluding capital cities
repus_FINALREPORT.qxd 2007. 09. 20. 16:25 Page 21

22
repusfinalreport
Map 3: Population Density in the EU25
Population Density in the EU25
repus_FINALREPORT.qxd 2007. 09. 20. 16:26 Page 22

I. The basic positioning of the areas from thesocio-economic- demographic and accessibilityperspective on the basis of selected indicatorsincluding some dominant pattern by macro-areasin the respective national urban system in order toidentify where peculiar aspects and integrationpotential exist on the basis of different factors suchas proximity, urban settlement features, socio-economic peculiarities;
II. The hierarchy of the urban system on the basis ofstandard methodology as one of the dimension ofthe urban system, in static and dynamic terms;
III. An attempt to measure the degrees of polycentricism/polarisation of the urban settlement systems amongthe Member countries from two perspectives: fromthe population function and from the economicperspective;
IV. The cross-border areas as potential for spatialintegration in an European perspective
V. An attempt to identify a typology of the urban areason the basis of the identification of the small-mediumsized towns in order to suggest which aspects andfactors can explain their relative performances andpositions in the context of the national urbansystem.
Some of the main findings of the project are illustratedbelow.
2.1 Spatial/urban patterns ofgrowth in Central - EasternEurope: Some generalcharacteristics andmacro-areas
As mentioned in the introduction, the identificationof the LLS as been taken as the basis unit for thespatial analysis, in order to cover the wholecountry territory, also encompassing the lessurbanised areas/rural areas, for verifying how thelocal levels perform and how they are integratedinto the urbanised regions, depending on thescale and on the scope of the analysis. The fourNew Member Countries have calculated the LLSas new territorial entity on which the spatialanalysis has been drawn.
23
repusfinalreport
modest, if compared with the high density in NorthernItaly and in Germany, in most of the territory: it ismainly around the large metropolitan areas of thecapitals and around a few important centres that ahighest demographic critical mass exists. The overallpicture, seen from a European perspective of course,suggests that the existing potential in terms ofpopulation size and concentration remains limited,especially if compared with the very high populationdensity in the core areas of Europe, within thePentagon areas. However the scale of the analysis isimportant: NUTS 3 are large territorial entities and forthe New Member countries, their dimension is evenrelatively larger than for most of the Old Membercountries: this factor might represent a relativedistortion in the country-comparison. However formeasuring the existing potential at national andregional levels of the RePUS area, the analysis will bedeveloped further, in order to highlight those areasthat disappear from a too remote picture.
2. Spatial Analysis
The main scopes of the spatial analysis are of identifyingthe specificities of the national urban settlementsystems and their pattern of growth, in the first instance,irrespective of the relative level of development in aEuropean comparison. This choice has been necessaryin order to be able to better catch those aspects of theurban structures of the New Member countries that, bycontrast with the most advanced Old Member countries,would lose in relevance and peculiarities, given thedifferent level of startind conditions, from the economicand urban point of view. Thus, the quantitative analysishas been carried out precisely keeping the nationallevels as reference. Then, after highlighting thepeculiarities of the national urban systems, a furtherstage has been reached for making a final synthesisable to incorporate the dimension of the cross-bordercomparison from a European perspective. Thus acertain level of compromise, for ensuring consistency,has been inevitable for the necessity of matching thenational analysis with the cross country comparison.
The spatial analysis has been composed of five mainblocks, each of them responding to different layersand angles of views, in order to maximise themultiphase dimension of the analysis:
repus_FINALREPORT.qxd 2007. 09. 20. 16:26 Page 23

24
repusfinalreport
* for Czech Rep. and Italy data at 2001; for Poland data at 2003; for Slovenia data at 2002; for Hungary data at 2005
Map 4: Population Density by LLS, RePUS Countries*
repus_FINALREPORT.qxd 2007. 09. 20. 16:26 Page 24

* Rates of growth (%): Czech Rep. 1991-2001; Poland 1995-2003; Italy 1991-2001; Slovenia 2002; Hungary 1995-2005
25
repusfinalreport
Map 5: Population dynamics by Municipalities, RePUS countries*
repus_FINALREPORT.qxd 2007. 09. 20. 16:26 Page 25

Some basic indicators are here presented as aselection from the more comprehensive list of indicatorschosen for combining socio-economic, demographicand accessibility patterns of growth.
The population density and the spatial countrypatterns in static and dynamics trend
The relative low density identified in the map of EU 25,emerges again in that of the RePUS areas but withmore details and contrasts: in the cross-border comparison,the metropolitan areas around the capitals and/or themain national urban centres (in Hungary, Poland andItaly) have among the highest density rates. In Polandthe areas in the South, Upper Silesia, including Kato-wice, Cracow and Ostrava in the Czech Silesia,emerge as large areas of strong population density,due to the close proximity to many important poles, oflarge, medium and numerous small towns (see Box 7).
Most of the patterns identified in these maps will beconfirmed by further levels of spatial analysis. For theCzech Republic and Slovenia, the capital metropolitanareas are below the average, resulting in higherdispersion of population because of the relatively largeterritory of the metropolitan areas. For Hungary, theBudapest metropolitan area at large contrasts with theremaining territory: however the other regional poles canbe identified with relatively moderate density along theNorth side of the country and around the two mainregional poles in the South.
By contrast Italy shows strong concentration axes inthe North, around the capital city Rome and itssurroundings, and the metropolitan area of Naples,and along the East coast: the population density inItaly show the strong base of its polarisation patterns,between North, Centre and South.
In order to better comprehend the importance and theweight of the various city-sizes in the urban systems,the municipalities have been taken as the basic unit ofthe analysis, (see Map 5), in order to see from thesmallest territorial unit (e.g. the municipalities), whatthe population dynamics are. Considering the differentscale, compared with the LLS dimension, of coursethe picture is more diffused all over the countries’territory. Some similar trends that can be depicted asthe phenomena of ageing population and slow-downof the natural growth rate of the population dramaticallyaffect the demographic dynamics of Old Membercountries like Italy, and more moderately affect theNew Member countries, even if at an increasing pace.
26
However migration flows, attraction capacity andspecific socio-economic phenomena explain sometrends that would require more detailed case by caseanalysis. Here in brief, are the most relevant features:
I. In general in all five countries, the mainmetropolitan areas indicate the decrease oftheir respective city population: this denotesalso that the New Member countries arecharacterised by the well known phenomena ofthe mature market economies, the slowingdown of the population in the large agglomerationsfor the typical effects of diseconomies of scale,congestion, real estate price upsurge. At thesame time the sub-urbanisation phenomenaincrease, bringing new resident population inthe surrounding areas, resulting also thesprawl phenomena.
II. This phenomenon occurs to a certain extent, thesecond-layer cities too, in particular in Poland andHungary, less so in the Czech Republic. TheCzech Republic is characterised by greater stability– decline of the population all over the countryshowing less contrast at the macro-area level
III. The areas of stronger decline are sparselylocated, differently country by country; more inEast of Poland, in the East and South- West ofHungary, and in the South-West of the CzechRepublic. These areas generally, but not always,correspond with small towns or rural areas andisolated medium-sized cities, characterised byrelative economic and socio-economic decline,sometimes even with the location of medium-sized towns, as in the Ostrava region, of oldindustrialisation.
IV. Italy, other than the trend of the metropolitanareas’ decline, is characterised by a morehomogenous macro-area trend: most parts ofthe North have a positive increase due to internaland foreign migration attraction capacity thatoverwhelms the natural decrease of the birth rateand the ageing population phenomena, whilstthe Southern regions are characterised by a rapiddecline: most of these areas that see a strongnegative trend, are small urban centres, wherethe population also decreases because of internalmigration toward the Northern regions (inparticular the youngest generations) and theincrease in the ageing population, instead of thestill- higher rate of natural births, compared with
repusfinalreport
repus_FINALREPORT.qxd 2007. 09. 20. 16:26 Page 26
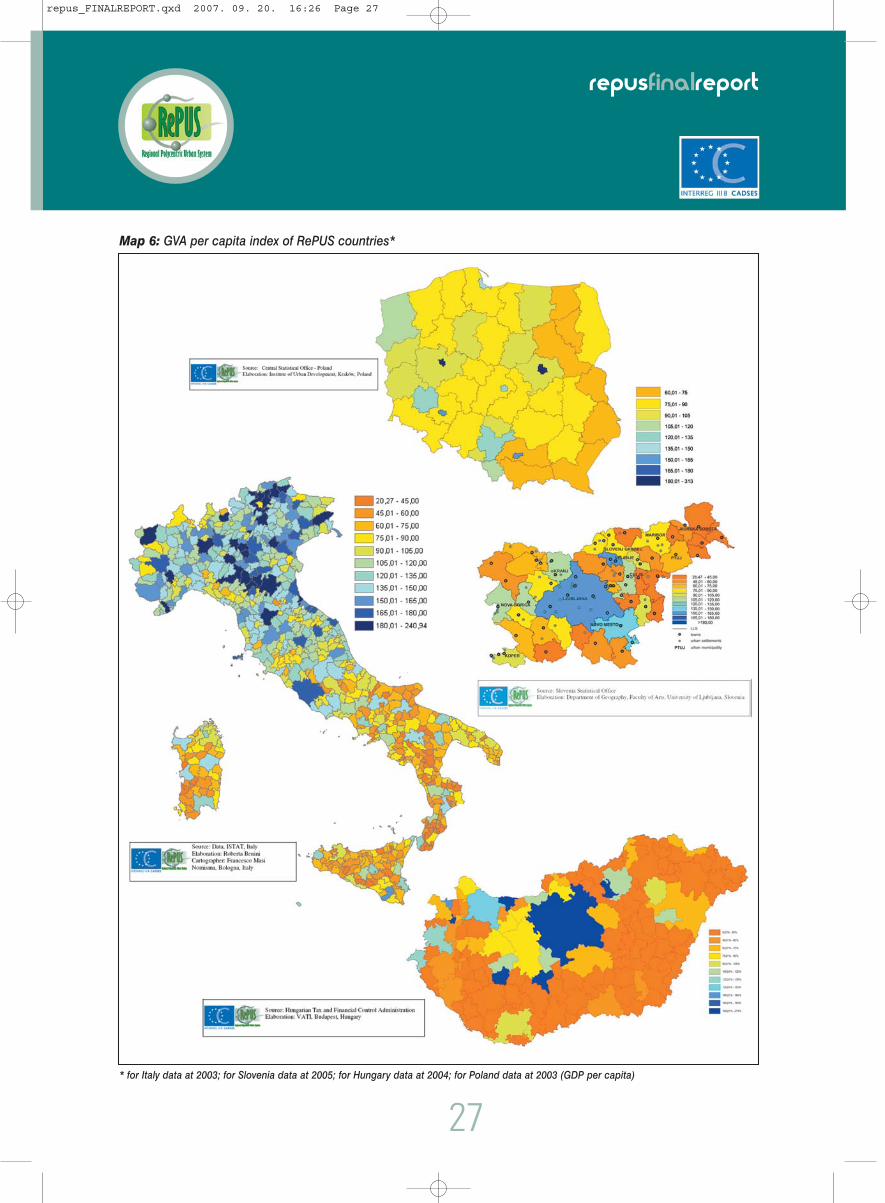
* for Italy data at 2003; for Slovenia data at 2005; for Hungary data at 2004; for Poland data at 2003 (GDP per capita)
27
repusfinalreport
Map 6: GVA per capita index of RePUS countries*
repus_FINALREPORT.qxd 2007. 09. 20. 16:26 Page 27

the North. In the South, but also relatively in theNorth, the medium-sized towns maintain theirattraction as urban poles showing some interestingattraction phenomena as medium centres.
Economic disparities and social distress: towardspatial polarisation pattern
From the economic point of view, GVA per capita orGDP per capita index (see Map 6) has been noted inorder to measure the discrepancies vis-à-vis theaverage. The results are mixed. These patternschange in relative terms with a strong polarisationphenomena around the major urban agglomerations,with the dominance of the capital’s metropolitanareas, with the exception of Poland. The latter doesnot show high internal disparities because of thestatistical effect of the low average GDP per capita asthe majorities of the regions have low value and themain poles (as Warsaw and Poznan) have a smalloverall importance on the national economy, pushingdown the mean. Therefore the high disparity in Polandis towards the highest ranks that are the metropolitanareas such as Warsaw, Wroclaw and Poznan: this iswhy the picture differs from the maps of the othercountries. The comparison with Budapest is clear asits weigh is very high in the national economy pushingup the national mean. The patterns of relativeconcentration are very peculiar in the New Membercountries and indicate the strong concentration of thewealth in one or few locations. Among the NewMember countries there are some main features:
I. Hungary confirms the absolute dominance of theBudapest metropolitan area but is surrounded byemerging urban regions on the border of the largeagglomeration, in particular towards the West,towards Gyõr, against weaker urban areas in theSouth, with Pécs and Debrecen on the East side.The remaining regions remain at a very low levelrelative to the national mean.
II. Similar concentration patterns also characterisesCzech Republic (see Map 7): Prague metropolitanarea emerges as the strongest areas vis-à-vis thecountry, the Eastern part of the country having thelowest levels.
III. In Slovenia, the more economically-advancedmetropolitan area of the capital city Ljubljana iscentrally located, with some other larger urbanareas that are all surrounded by relatively lowlevels of small urban areas in a fragmented way,showing relatively low performances in EastSlovenia.
28
repusfinalreport
IV. Italy, as a peculiar country with strong North-Southdivide, is confirmed by the strong concentration ofthe wealth in the North, based on the dense urbanagglomerations of medium-large and metropolitanareas leaving the South dominated by low andvery low indexes.
Box 1HUNGARY: a short background of the urban
settlement system
The development of the settlement system ofHungary has experienced some substantialchanges during the 20th century. The urbannetwork developed over centuries experienced asignificant shock when several main cities wereseparated from the country after World War I, atthe end of the Austro-Hungarian Empire. Citieslike Bratislava, Košice, Satu Mare, Oradea,Timisoara, which had served as counterweightsto the dynamically growing Budapest, were cutartificially from the urban network by the definitionof new borders, together with the transversal raillines. Thus, the capital of Hungary becameoverweight in the shrunken settlement system.
The centrally-planned economy linked urbandevelopment more likely to central economicplanning, therefore cities along the heavyindustrial axis of the country running fromNortheast to Southwest, including Budapestwere developing the most. The realization of thisharmful territorial polarization led the planners tolimit the development of Budapest and startdevelopment of cities outside the heavy industrialaxes. The explicit settlement development policy ofthe centrally planned economy aimed to create abalanced structure of settlements, but theimplementation resulted in the developmentmostly of cities at a higher hierarchical level.
The former industrial towns experienced declinesince transition, though while some other arediversifying and becoming more dynamic,others are still struggling with the problem ofrestructuring. The development of Budapest hascontinued, which is strengthening the position ofthe Budapest metropolitan area in the competitionof the European MEGAs (as mentioned inESPON 111).
The overall settlement structure today has somebasic characteristics. The Budapest metropolitan
repus_FINALREPORT.qxd 2007. 09. 20. 16:26 Page 28

29
repusfinalreport
mainly the small and medium sized towns. In mostcases higher unemployment is related also to smalltowns in the regions surrounding larger agglomerationsas in the East side of Hungary and Czech Republic,around Brno.
At the same time if unemployment is an indicator ofsocial and economic distress, two other aspects needto be mentioned, which are non-recorded unemploymentas the unofficial labour market is still very pervasive inmost of the countries in transition, and the lowemployment rate, as the weakest social bracketsleave the labour market. Job creation remains themost crucial aspect that affects the urban centres andhas a strong territorial impact, even if non recordedjobs in the shadow economy might have a de factosoftening effect on this phenomena.
Italy as a mature market economy, is chronicallycharacterised by the high unemployment rate in theSouthern regions but the reasons behind this differ,compared with transition countries, since its longterm character is related to structural problems ofeconomic and socio-economic unfavourableconditions.
2.1.1 Macro-areas as sub-systems of urbanpotential integration
The urban settlement systems, on the basis of acombination of different factors such as populationdensity and population critical mass, proximity tourban centres of different dimensions, reciprocal linksin terms of labour markets and service provision,integrating functions and economic potential, can be
area is a highly developed and further developingarea in the northern-middle part of the country. TheNorth-Eastern and South-Western and Westernparts of the country are characterized by smallersettlements, mostly micro-villages with a populationbelow 500, while the Great Plain in the Eastern partof the country is still traditionally characterized bygiant villages, agricultural market towns being largein land area and having dispersed farm systems.
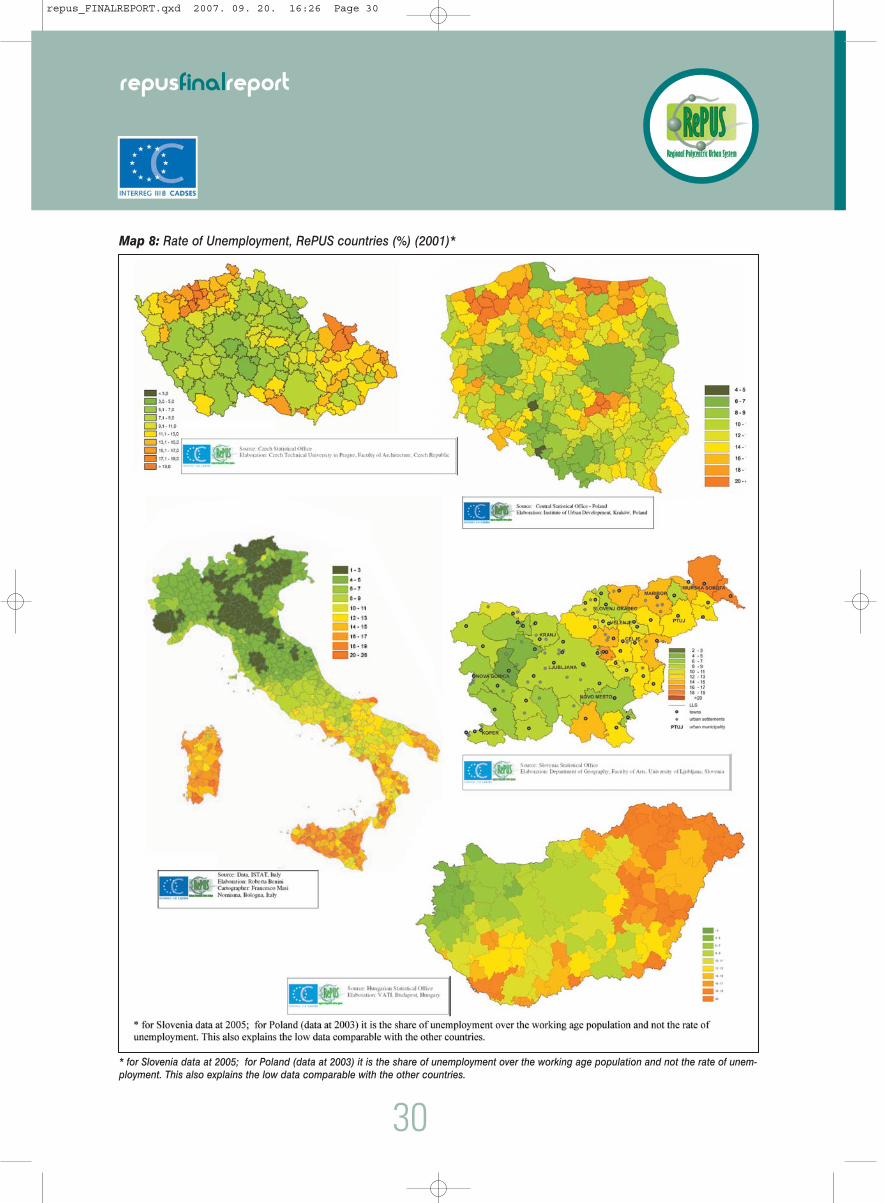
Unemployment as an indicator of social distress
The spatial concentration of the unemployment rate bymacro-areas (see Map 8), follows relatively closely thepatterns of the economic concentration and is relatedto the economically weakest regions that indicatewhere there are either old industrialised areas indecline or rural peripheral areas. There are clear East-West patterns for Hungary, Slovenia and CzechRepublic, but also for the latter it is the North-Westside, and in the North of Poland. Different phenomenaoverlap: on one side the previously prosperousindustrial and mining regions have sharply declined interms of wealth and job creation capacity: it is thecase in North-West of the Czech Republic and UpperSilesian in Poland, whilst the traditional peripheralagricultural regions suffer from the costs of transformationand productivity targets gain with expulsion of labour(e.g. North of Poland). However, this inherited divideseems to have slowed down since the starting of thetransition at the beginning of the 1990s, as re-vitalisationpolicies have been pursued during the last twodecades. Job creation strategies are particularly relatedto the improvement of the cities’ functions as servicedevelopment remains the priority target involving
Map 7: Economic Aggregate per capita by LLS in Czech Republic (2001)
repus_FINALREPORT.qxd 2007. 09. 20. 16:26 Page 29
30
repusfinalreport
* for Slovenia data at 2005; for Poland (data at 2003) it is the share of unemployment over the working age population and not the rate of unem-ployment. This also explains the low data comparable with the other countries.
Map 8: Rate of Unemployment, RePUS countries (%) (2001)*
repus_FINALREPORT.qxd 2007. 09. 20. 16:26 Page 30

Map 9: Functional urban areas against a background of development axes planned in Poland
Map 10: Macro-Areas in Poland
31
repusfinalreport
repus_FINALREPORT.qxd 2007. 09. 20. 16:26 Page 31

characterised by specific macro-areas that might alsobecome references for development strategy in thefuture. This dimension proposes spatial visions that gobeyond the administrative or institutional territoriallayers, and could serve to strengthen the integration ofthe urban settlement sub-system, on the basis ofcommon, similar features and identified potential.
Below are some examples of the different macro-areas by country that serve also as first hypotheses forfurther analytical work to be developed.
In Poland a first hypothesis is based (Map 9) on thedevelopment axes that combines the proximity of theurban agglomerations and connectivity.
The dominant Southern axes that will emerge encom-passing Wroclaw, Katowice and Cracow: this will alsobe the base for the identification of the main areas ofcooperation as synthesis-map. A second main axisencompasses Warsaw-Lodz-Poznan, with severalother smaller areas around the main regional capitals.
The remaining axes are not so dominant, asmentioned above and they are vertically connected tothe two main axes. They are: Wroclaw – Poznan andKatowice – Lodz.
The relative importance by macro-areas:
A further vision, given the large size of Poland and itsregular geometric form with a strong diffused urbansettlement system, seven macro-areas can be identifiedon the basis of proximity to the main urban centresand their reciprocal integration (See Map 10):
I. Central areas with the bipolar system: Warsaw andLodz and secondary regional centres;
II. North-Central areas: Poznan-Zielona-Góra,Szczecin-Koszalin, integrating Western andCentral regions.
III. North area Gdañsk-Bydgoszcz with several regionalcentres where industry and tourism coexist butremain areas of high unemployment;
IV. North-East area: Bialystok-Olsztyn: a peripheraland poorly-populated area, with high employmentrates in agriculture
V. South-Eastern areas: Lublin and Rzeszów as well as othermajor regional centres and traditional industrial centres;
32
VI. The Cracow-Upper Silesian area: the most denselypopulated southern area of Poland with the mostcohesive settlement system with two major metro-politan agglomerations plus other regional centresOpole, Bielsko-Biala, Czestochowa, and Tarnów.
VII. The Wroclaw area: covers the Southern part ofPoland with several regional labour centres.
In Hungary, the large Budapest LLS encompassesseveral surrounding small and medium-sized towns anddominates the spatial structure of Hungary. In order toovercome the extreme concentration in a monocentricstructure, Hungarian national policy has identified five main“growth poles” near the border of the country (See Map 11).
Development started in the 1990s along the twohighways radiating from Budapest, in the direction ofVienna and Lake Balaton and has been going alsoalong the Western border with Austria. Due to thespill-over effects, the North-Western part of Hungarycan be considered as a macro area of developmentwith future potential of a triangle between Budapest,Vienna and Maribor.
The least developed areas (the three rectangles) are:the South-Western peripheries at the border withCroatia, where Pécs, despite its relevance is not able toenhance the development of this problematic region.
The second peripheral area is on the border withRomania, Ukraine and Eastern Slovakia, which suffersfrom social distress.
The last low development and socio-economicproblem is the Central Eastern Great Plain.
For the Czech Republic, on the basis of the analysis ofcommuting flows between centres (Map 12), in order toidentify reciprocal relations between cities in terms of locallabour market, a few macro-areas are identified as theyreflect the relevant structure of the urban settlementsystem in the country. Five main areas have beenidentified, polarised around one or several urban centres,as poles of different sizes. The dominant large areas arearound the metropolitan areas of Prague that shows thecentral position and also relative weight on the nationalurban settlement, encompassing also Plzen. The onlystrong isolated area after Prague is Brno, whilst the othersare the result of relatively smaller urban settlements thatare close to each other: Northern West Bohemia withmedium and small towns, areas in Czech Silesia withOstrava, and in between small towns around Olomuc.
repusfinalreport
repus_FINALREPORT.qxd 2007. 09. 20. 16:26 Page 32

33
repusfinalreport
Map 11: Macro-Areas in Hungary
Map 12: Macro-Areas in Czech Republic
repus_FINALREPORT.qxd 2007. 09. 20. 16:26 Page 33

34
repusfinalreport
Map 13: Macro-Areas in Slovenia
Map 14: Macro-Areas in Austria
repus_FINALREPORT.qxd 2007. 09. 20. 16:26 Page 34
35
repusfinalreport
Slovenia is a small country that has by location andmorphology, a strong potential for integration with thesurrounding countries, both from Old Members suchas Italy and Austria and New Members like Hungary,or future members such as Croatia, and can be dividedinto the three main areas of West, Central and Eastareas. These macro areas correspond also to certaindifferent socio-economic feature as following:
I. the West side is more service and tourism-oriented,with border urban areas with Italy of city clusterKoper-Piran-Portoroz at the Adriatic coast and NovaGorica, and lot of small towns in the hinterland
II. the Central area is dominated by the strongfunctions of Ljubljana metropolitan area surroundedby a few medium-sized towns (Kranj, Novo mesto)and numerous small towns;
III. the East side, traditionally industrial with somemajor urban centres, and Maribor, the secondlarger urban centre in Slovenia, in the process ofdiversification towards the service centre.
In Austria five main large macro-areas can (by analysisat the level of NUTS 2-regions)2 be defined:
I. ViennaVienna shows by far the highest GDP/capita aswell as the highest number of workplaces perinhabitant. Population density is clearly the highestin Austria, total population increases slightly due tomigration, whereas the birth rate is negative.Vienna is located at the junction of main transportroutes of national and international importance,and has an international airport.
II. Medium performing region (type 3): Lower Austriahas a special situation because of the location ofVienna. Without considering Vienna, the regionalinequality lies within the Austrian average.Accessibility is high within the agglomeration ofVienna and along the Danube and Southcorridors, but there are some peripheral areas inthe north (border with Czech Republic and partlySlovakia) and South of the Danube corridorsuffering from poor accessibility.
III. Well performing, centralised regions (type 1): Salz-burg and Upper Austria with high regional inequality: the
regions are highly centralised to the urban agglomerationsof their capitals and their centrally located regions(Salzburg, Linz-Wels) and good performance.
IV. Well-performing, more-balanced regions (type 2):Vorarlberg and Tyrol have low regional inequality:the regions, especially Vorarlberg, show a muchhigher level of polycentricity. Good and very goodaccessibility: both regions are located withinextensions of the main transport corridor in Austria(West-East) with very good links to internationaltransport routes (e.g. Brenner)
V. Poorly performing regions (type 4): Burgenland,Styria and Carinthia These regions generally show low to mediumregional inequality, whereas Carinthia shows amedium concentration, the values in Styria andBurgenland are rather low. Migration is high only incentral areas, where it substitutes the negativebirth rate for a positive population change (e.g.areas of Graz and Klagenfurt-Villach as well asNorthern Burgenland due to its proximity toVienna). Beyond those central areas, populationchange is negative. In general all of the regionsshow considerable lower accessibility.
In Italy two main large macro-areas can be identifiedthat are characterised by high population density basedon the close proximity to and integration of, metropolitanareas, large and medium-sized towns and a lot of smalltowns: the large areas between the two axes in theNorth, encompassing both the West-North with mainmetropolitan areas as Milan, Torino and the North-Eastwith main metropolitan areas as Bologna and Venice.This large triangle that represents the strongestconcentration of population and wealth of the country, isalso the area that ensures the integration into the EUspace as integral part of the Pentagon areas (See Map 15).
The second relevant potential area is represented by thetwo large and important metropolitan areas of Rome, thecapital, and Naples, the second largest city in Italy: theirproximity and the presence of dense network of manymedium and small towns, represent a large space ofgreat relevance at national and international level, providedthat a strategy exists to improve the overall environmentand attractiveness and overcome the serious economicand social problems, for the Naples metropolitan area inparticular (See Map 16).
2 Regional inequality depicts the calculation of the Williamson coefficient over the following indicators (NUTS 3): population 2001 and GDP/capita pps 2004.The description of economic performance takes into consideration GDP/capita pps 2004, density and change of work places 1991-2001.
ˆ
repus_FINALREPORT.qxd 2007. 09. 20. 16:26 Page 35

36
repusfinalreport
Map 15: Strategic macro-areas for integrated development in Italy
Map 16: Macro-Areas in Italy
repus_FINALREPORT.qxd 2007. 09. 20. 16:26 Page 36

The second map (Map 16) however is based on thehypothesis of diverse types of development and urbansettlement systems that characterise the three majormacro-areas (North/Centre / South) that can be split intotwo in the North and in the South respectively, followingalso the vision of DiCoTer (Ministry of Infrastructure).
The North alone has a little less than half of the totalpopulation (45% for 26 million residents) but represents54% of total GDP against the South (see map) that with 20million population (35% of total population) represents only23% of total GDP. These divides have strong spatial andregional implications from the development strategy pointof view, as the socio-economic conditions are very diverse.
These different country hypotheses of macro-areasare relevant as they have at the core the positioning ofthe urban settlement system and the cities as pillars ofeconomic and spatial integration.
2.1.2 The question of accessibility improvementof connectivity among regions in across-country perspective
The unfavourable pre-existing circumstances from theaccessibility point of view, of relative peripheral positionof CCE at large (see ESPON 2.1.1.) from an Europeanperspective, have represented a heavy heritage thathas put forward the problem of accessibility as one ofthe priorities, for strengthening the integration andeconomic development of the New Member countries.Transport infrastructures, per-se cannot be consideredsine-qua-non conditions for development, as improvedaccessibility, great standing disparities among the regionsin socio-economic conditions, might simply lead to quickeroutflow of people from unfavourable areas to centralattraction areas. However – considering that the oldvisions in the 1950s-1970s, where hard infrastructurestargets were the only pillar of the development strategy inthe regions, have been widely criticized and abandoned –the renewed attention to transport responds to a strongnecessity not only for improving the mobility within eachcountry but also to favour the integration – both verticallyand horizontally – at European level, in order to overcomethe fracture between the traditional core of Europe (thePentagon) and the peripheral countries, as CentralEastern Europe was considered. Infrastructuresdevelopment is a challenge for development of the CEE,whilst it is a means, not the end of the scope.
The following four maps give clear indications of theimportance of both European and national sponsored
projects, plus the main existing network. The relevance ofmatching European priorities with national needs isdeterminant for the future perspective of these countries,as the process of development takes place at differentlayers, to ensure a better spatial coverage and downsizingof the increasing process of polarisation around a fewpoles. In fact the still-slow pace of transport networkdevelopment does not completely benefit all cities andregions.
Some brief considerations can be synthesised lookingthe first two maps (TEN-T priorities) and the two mapson existing and new corridors as planned for 2010-2020:
• The railway network is the more diffused type oftransport infrastructure that covers all the territoriesin a relatively even manner, as railway had beenthe main (public) transport mean developed in theprevious planned economies. Whilst the investmentin this sector was worsening in the initial period oftransition, in the last few years railways havegained again in progress.
• The inherited limited development of the road networkthat had strong impacts on connectivity among theurban centres at national and also at regional leveland even more cross-country. The poor net of high-ways at present, is evident from the map, in particularfor Poland that with a much diversified urban structuresuffers evident problems of accessibility, which limit itspotential polycentrism for further development. Fromthe road network, the TEN-T priority project startingfrom Vienna and Bratislava up to the North partiallyimproves the connectivity following the vertical axis ofthe RePUS areas at large. There is a strong need torealise the planned road systems, in particular inPoland: this will improve the accessibility not only inPoland but also the East-West connections.
• In particular the railway development axes willimprove clearly the connectivity among the capitalcities reinforcing the links of the main metropoliseswith the Pentagon areas, but as well the connectivityamong themselves. In this scheme the focal point,apart from the capital-cities, (Budapest; Vienna,Bratislava, Prague) and the large areas of Cracowand Katowice that will emerge strongly, in particulartaking into consideration the present isolatedsituation, even at the cross-border level.
• Slovenia has particularly favourable conditions for itssmall size as it is at the core of ongoing and futuretransport connections: its cross-border areas and internal
37
repusfinalreport
repus_FINALREPORT.qxd 2007. 09. 20. 16:26 Page 37
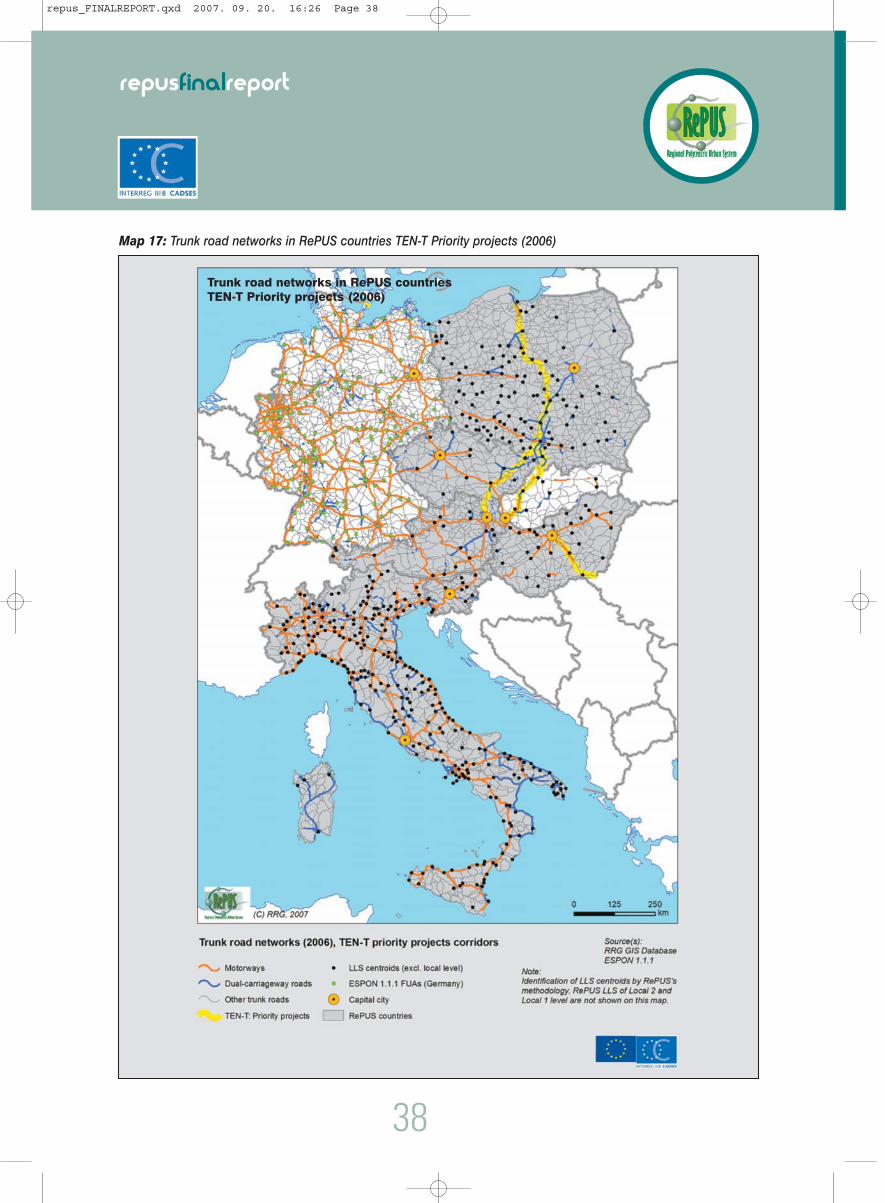
38
repusfinalreport
Map 17: Trunk road networks in RePUS countries TEN-T Priority projects (2006)
Trunk road networks in RePUS countriesTEN-T Priority projects (2006)
repus_FINALREPORT.qxd 2007. 09. 20. 16:26 Page 38

Map 18: Railway networks in RePUS countries TEN-T Priority projects (2006)
39
repusfinalreport
Railway networks in RePUS countriesTEN-T Priority projects (2006)
repus_FINALREPORT.qxd 2007. 09. 20. 16:26 Page 39
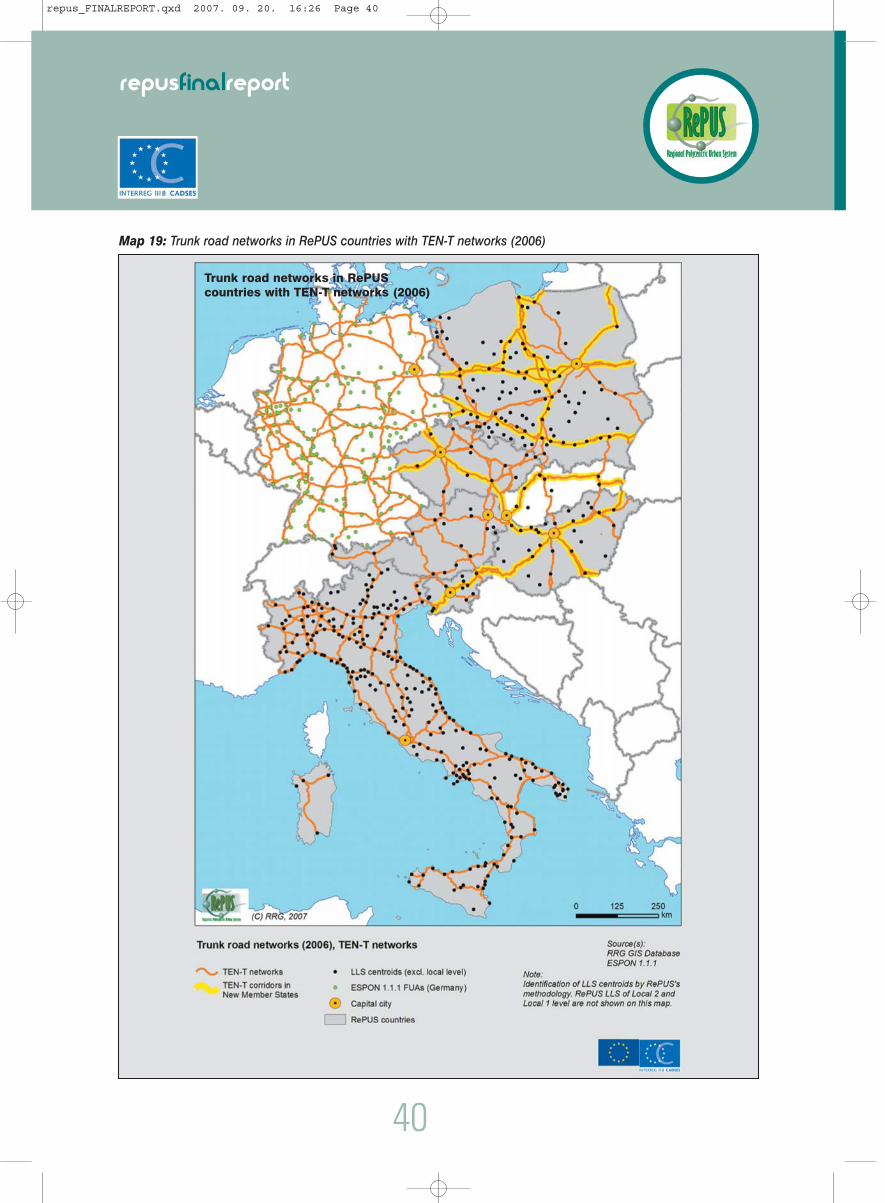
40
repusfinalreport
Map 19: Trunk road networks in RePUS countries with TEN-T networks (2006)
Trunk road networks in RePUScountries with TEN-T networks (2006)
repus_FINALREPORT.qxd 2007. 09. 20. 16:26 Page 40

Map 20: Railway networks in RePUS countries with TEN-T networks (2006)
41
repusfinalreport
Railway networks in RePUS countrieswith TEN-T networks (2006)
repus_FINALREPORT.qxd 2007. 09. 20. 16:26 Page 41

space are strongly inter-related: most of its regionalurban centres will be close to or directly on, the mainaxes and in particular, the new corridors (corr.5 and 10).
• From a national perspective Czech Republic andHungary will benefit from the TEN-T priority projectsas they will add a new axis to the present onesreinforcing the connectivity with other regionalcentres. Many regional centres however, in particularfor Hungary, remain outside the main axes, atpresent. The example of Hungary is relevant andunderlines the necessity of a more diffusedcomplementary transport network in order to avoidthe creation of new enclaves. (see Box 2)
Box 2Hungary: the impact of transport improvement
on small and medium-sized towns
In recent years, large infrastructural invest-ments have been made in Hungary and theprocess is still ongoing at present. The mostprosperous axes of the country, connectingVienna and Budapest was the first motorwaycompleted to reach the border of the country atthe same time also rail investments increasethe quality of this transport axis. The expectedincrease in traffic will be mostly along the axesradiating out from Budapest, mostly belongingto Trans-European corridors, with a mixture ofEuropean funds also for national roads, notbelonging to the TEN-T priorities. The constructionof transversal roads would be extremely importantfor the development of a polycentric developmentof small and medium-sized towns, as the trans-European and radial axes enhance the accessibilityof the capital. The pace of development issignificantly higher in the case of roadnetworks, while depreciation is affecting therailway lines to a great extent as currentinvestments are mostly used for maintenance,not for new development. Development ofmotorways changes the spatial structure to agreat extent and has controversial effects onsmall and medium sized towns:
• On one side, those towns being along themotorway development axes are gaining strength.The most significant effects are foreseen along theaxis in Northeast Hungary, as the development ofthe Budapest-Ukraine main connection allowssmaller and larger towns, like Eger, Miskolc, Deb-recen, Nyíregyháza to be integrated in the
42
European flows. Corridor V (Budapest-Ljubljana),south of Lake Balaton, down to the border withSlovenia/Croatia has potential for extending theprosperous development of northwest Hungaryalong the Budapest-Maribor axis.
• On the other side, small and medium sizedtowns excluded from transport developmentsface the threat of losing position. This is a threatmostly for southern Transdanubia and Pécs, asit falls out of the main axes, though nationaldevelopment in PPP is ongoing to integrate thistown into the network. The main role is dedicatedto roads in Hungary, as railways are so farbehind in competition that even though somemain lines are being developed, the improvementin accessibility is not that significant. As for smalltowns, the opposite is true, as the side lines inperipheral and rural areas (northeast, southwestand party on the Great Plain) are closed, due ofhigh inefficiency.
• Poland on the other hand, for its size and the largenumber of national and regional centres is relativelybetter off regarding railway connections, but mostof its centres remain outside the TEN-T priorities.The situation improves notably with the new corridorsas they will cover most of the country space, connectingthe cities poles; however the Eastern regionsremain still relatively on the periphery of theimproved accessibility. The size of the countryrequires a strong coordinated effort betweendifferent layers of the transport system, to improveaccessibility within the country both horizontallyand vertically and avoiding leaving out the mostperipheral areas.
• Taking into consideration the new corridors (Map19 and 20) both for road and rail, the new axesthat are expected to be built between 2010 and2025, are going to shape the new spaces,improving the long distance connections acrosscountries from South to North and from West toEast: the expected positive impacts will facilitatethe integration processes going also to furtherEast toward potential accession countries, likeCroatia, Serbia, other than the Baltic States, andnon-EU countries such as Ukraine and in the veryNorth, Russia with Kaliningrad. The overall net-work is going clearly to have diffused effects onaccessibility, providing that the local transport willrely on the minor centres.
repusfinalreport
repus_FINALREPORT.qxd 2007. 09. 20. 16:26 Page 42
From the policy perspective, the improvement ofconnectivity on the existing and planned axes,would require a broader strategy (including aninter-modal system) provided that the large projectsof international importance are supplemented byimprovements in accessibility (rail, road includingpublic transport services) at regional and sub-regional levels, especially in the peripheralregions. In the policy perspective, the EU and,consequently, also national governments shouldbalance the support for the infrastructuredevelopment of international, national andregional /sub-regional importance and theyshould also balance rail and road investments tokeep the rail infrastructure competitive forenvironmental and sustainability reasons. Thusthe new transport connections can becomestrong channels through which new processes ofintegration can take place.
2.2 The hierarchy of theurban areas
The urban hierarchy in the context of the RePUShas been achieved with the scope of identifyingthe places and the roles occupied by the differenturban areas layers within the national urbansett lement system. The hypothesis that liesbehind this is that medium and small towns playparticular roles and are differently integrated intothe urban system and the national economy,depending on the specificities of the country, in itsspecific phase of development, its historical andinstitutional background. Thus the hierarchy isunderstood here only as the result of a dynamicprocess that characterises, at a certain stage, theurban settlement system.
As mentioned before the RePUS’s New membercountries (Czech Republic, Hungary and Slovenia)have identified ex-novo the LLS area by a unifiedRePUS method for calculation.
Poland, because of the non available commutingdata, has applied own peculiar methodology foridentifying the local labour markets. Italy and Austriahave the LLS available from their respective StatisticalOffices.
A quantitative analysis has been achieved for identifyinga hierarchy on the basis of a common RePUS methodologybased on the LLS, as unit of spatial analysis.
Selected blocks of indicators have been chosen and arelative weight assigned to them. The box belowshows the synthesis of the indicators:
Box 3Indicators for Urban Hierarchy
Seven blocks of indicators have been chosencovering:• Demography: size / density;• Economy: GDP per capita (or GVA per
capita or equivalent);• Human Capital: university degree over active
population / share of secondary school onactive pop.;
• Knowledge: number of students at university/students at secondary school;
• Accessibility: access to highway/airport/high-speed train;
• Institutional: levels of institutional/administrative responsibilities;
• Decision Making: public and corporatedecision making centres;
However there is the need to highlight that the resultsinevitably face several shortages, due to different factors:
• The non-availability of many statistical data at townand lowest territorial unit levels: this is particularlytrue for the economic data of which there is themost serious dearth, hindering the ability to get anexhaustive indication of the economic functions ofthe city areas. Alternative indicators sometimeshave been used as approximation;
• The country by country different statistical dataavailability: as result it is difficult to have a uniquestandardised statistical data base;
• Following the first results of the scores for thehierarchy, a second adjustment has beenachieved, ensuring a cross-country comparison,from a European perspective.
Six levels have been identified - with scores from 1 to5 - in order to get the most detailed levels of analysisin particular at the intermediary and lowest levels: theregional and the local levels have been split in two asfollows:
43
repusfinalreport
repus_FINALREPORT.qxd 2007. 09. 20. 16:26 Page 43

44
repusfinalreport
In the cases the gaps between the highest scores,the capitals, and the secondary layer, were verysignificant the Trans-regional / National levels havebeen eliminated from the hierarchy and the upperlevel of Regional rank (Regional 2) became thesecondary level: this has been the case for theCzech Republic, Hungary and Slovenia as they hadafter the European level, their respective capitals,the Regional 2 layers. On the other hand, larger countrieslike Poland and further, Italy, composed of numerousmetropolitan areas that had the scores close to the
capital, also have the fifth rank of the Trans-regional/National layer.
The lack of the second rank in the case of Hungary,Czech Republic and Slovenia, indicates that the urbansystem is strongly dominated by a unique pole, notbalanced by other metropolitan areas, below thecapital, having the first secondary layer very differentfrom the capital in both population and economic size.
The results of the hierarchy maps are shown below:
1.
2.
3.
4.
5.
6.
Local
Regional
Trans. Reg. / NATIONAL
EUROPEAN
Trans-regional / National
European
Regional 1
Regional 2
Local 1
Local 2
Country Names LLS Country Names LLSHUNGARY CZECH Rep.European Budapest European Praha
T-R/National T-R/National
Reg. 2 Debrecen, Szeged, Miskolc,Gyõr, Székesfehérvár, Veszprém,Eger, Pécs
Reg. 2 Ostrava, Brno
Reg. 1 Nyíregyháza, Kecskemét, Szom-bathely, Szolnok, Tatabánya, Ka-posvár, Békéscsaba, Zalaegerszeg,Sopron, Dunaújváros, Salgótarján,Szekszárd, Vác, Kazincbarcika,Gyöngyös, Mosonmagyaróvár,Esztergom, Jászberény, Siófok,Tata, Komárom, Tiszaújváros
Reg. 1 Plzen, Olomouc, CeskéBudejovice, Hradec Králové,Jihlava, Zlín, Ústí nad Labem,Liberec, Pardubice
POLAND SLOVENIAEuropean Warszawa European Ljubljana
T-R/National T-R/NationalPoznan, Katowice, Lódz, Kraków,Wroclaw, Gdansk, Szczecin
–
Reg. 2 Opole, Zielona Góra, Bydgoszcz,Rzeszów, Swinoujscie, Radom,Czestochowa, Skierniewice,Zlotoryja, Rybnik, Torun, etc.
Reg. 2 Maribor
Table 1: City LLS hierarchy up to Regional 1
Reg. 1 Bielsko-Biala, GorzówWielkopolski, Inowroclaw, Malbork,Strzelce Opolskie, Wloclawek,Dzierzoniow, Walbrzych, ZdunskaWola, Leszno, Zagan, Jarocin, etc.
Reg. 1 Ptuj, Murska Sabota, Celje, Kranj,Coast, Nova Gorica, Novo mesto,Velenje, Zasavje, Krško, SlovenjGradec, Postojna
ˆ ˆˆ
ˆ
ˆ
ˆ ˆ
ˆˆ ˆ
repus_FINALREPORT.qxd 2007. 09. 20. 16:26 Page 44

45
repusfinalreport
Map 21: Urban Hierarchy, RePUS countries
repus_FINALREPORT.qxd 2007. 09. 20. 16:26 Page 45

From the previous analysis the identification of theurban hierarchy gives interesting indications about thetype and the dynamics that characterise the RePUScountries, taking only the four New Member countriesinto consideration.
From the table below (Tab 2) emerges important dynamicsthat indicate the importance and the trend of the capitalmetropolitan areas that also confirm some generaltrends for the secondary layer urban areas (LLS):
1. All the capital city metropolitan areas, with theexception of Warsaw, increase their population orremain stable; however their economic weightincreases much more than their relative populationweight, between 1,5 times for Budapest andLjubljana, and 1.8 for Prague and Warsaw. ForBudapest the increase is extremely high: theeconomic weight of the Budapest metropolitanarea, with very large LLS, represents more thanhalf (58%) of national GVA of the country in 2004:its economic weight overwhelms its population bya factor of two. But Ljubljana also has an economicweight that represents little less than half of thecountry. Whilst Prague represents 14.5% of thetotal population but only 1/4 of the national wealth.Warsaw instead represents only the 9% of thepopulation but little less than 17% of nationalwealth.
2. The second layer, national or regional centres ofnational importance, shows different performancesand they have diverse population size and economicweights. All second layers, with the exception ofPoland, are relatively far, in terms of economicperformance (calculated by RePUS methodology)from the upper level of the Capital: this indicates therelative weakness of the overall urban structure interms of size and performance, as well as attractiveness.Only a very few cities have their relative economicperformance higher than their population weight:this is also an indicator of the difference in productivitylevels. Poland is an isolated case because of itshistorical polycentric shape, enjoying strong alternativenational cities that are very close to the capital inperformance. This is the reason why CzechRepublic, Hungary and Slovenia do not have thetrans-regional/National layers in their respectivehierarchies, as the first level, after the capital.
However, overcoming this first stage of the analysis,interesting trends emerge from this secondary layerscities analysis:
46
• The relative demographic and economic weight ofthe regional centres increase in several cases:generally in these cities, the increase in populationis greater than the increase in economic terms. InHungary among the better economic performingLLS Szeged emerges, that has in a few yearsachieved higher than average GVA per capita,probably due to strong inward investment in thecity area. Gyõr as second city after Budapest fromthe economic point of view remains relatively farfrom the capital’s economic performance whilstgreatly increasing its economic weight, over-whelming its population weight: this is an indicatorof strong potential for development in the future.Debrecen, the second important urban centre forpopulation but weaker in terms of economicweight, has a positive growth but still remainslower than its demographic weight. Pécssignificantly improved its relative position, even ifits weight remains limited.
• In the case of the Czech Republic, Brno is thesecond important pole, followed by a quite-homo-geneous group of LLSs of regional centres. Brnois quite demographically strong but economicallyweaker but in dynamic terms it is stable. All theremaining LLSs of regional centres have retainedtheir population position in the national contextbetween 1995 and 2004. Besides the dramatically-strengthening Prague, only Brno and HradecKrálové among the analysed LLSs increased theirshare on national economic aggregate. Significanteconomic growth outside the national capital waswitnessed in lower-tier LLSs of Mladá Boleslavwhere large-scale investment in automobileproduction was allocated in the early 1990s.
• Poland, which has a larger secondary layer oftrans-regional/national importance, shows a positivetrend, in particular more in terms of economicperformance than demographic performance.Most of the T-R/National layer cities, that enjoy verylarge LLS, have a positive economic increase andtheir relative weigh is higher than their demographicweight. In particular Katowice, Cracow, Lodz andPoznan have very important population size (over1 million).
• Slovenia at the second layer of national importancehas Maribor that occupies in absolute term impor-tant weight both demographically and economical-ly: it shows however a small decline in populationbut a relative increase in economic terms.
repusfinalreport
repus_FINALREPORT.qxd 2007. 09. 20. 16:26 Page 46

47
repusfinalreport
Trends(various years
1991-2004)Levels
Population GDP or GVA Population (+) GDP or GVA (+)
Metropolitan area/Capitals (LLS)Relative weight over National
indicator(%)
Secondary Urban Layer Nationalor Regional centres of National
importance (LLS)Relative weight over National
indicator (%)
–
=
+
Decreasing
Moderatelydecreasing
Stable
Moderatelyincreasing
Increasing
High H
Medium H
Low L
High H
Medium M
Low L
High H
Medium M
Low L
High H
Medium M
Low L
High H
Budapest H(2004: 28.2%relative weight)
Warsaw L(2003: 9.1%relative weight)
Prague M(2001: 14.5%relative weight)
Ljubljana H(2002: .7.2%relative weight)
Warsaw L(2004: 16.7%relative weight)
Prague M(2004: 25.9%relative weight)
Ljubljana H(2005: 41.6%relative weight)
Budapest ° (v) H(2004: 58.5%relative weight)
CZ- Ostrava M
PL-Katovwice HPL-Lodz MCZ-Ostrava MSI-Maribor HSI-Celje M HU-Miskolc L
SI-Maribor HSI-Kranj M CZ-Plzen MCZ- Liberec LCZ-Usti.LabemLCZ- Pardubice LHU-Szeged MHU-Székesfehérvár MHU-Miskolc LHU-Veszprém LPL-Lodz MPL-Szczecin L
CZ-Brno HCZ- PlzenMCZ- Pardubice LHU-Eger LHU- Pécs MHU-Veszprém LHU-Szeged M PL- Wroclaw MPL-Szczecin LPL-Lublin M
CZ-Olomuc MCZ-Cesk.Budo. LCZ- Zlin LPL -Wroclaw MPL-Lublin MPL-Rzeszow LPL-Krakow M
PL-Krakow MPL-Gdansk MPL-Poznan MPL-Rzeszow LHU-Gyõr LHU-Debrecen LHU-Székesfehérvár MCZ-Cesk.Budo. LCZ-Olomuc LCZ- Liberec LCZ-Usti.LabemLCZ- Zlin LCZ- H.Kralové LSI-Kranj M
PL-Katowice H PL-Poznan MPL-Gdansk M HU-Pécs LHU-Debrecen LCZ- Brno HCZ- H.Kralové L
HU-Eger LHU-Gyõr LSI-Celje M
The Capital cities and the secondary Cities (LLS) layers: the most relevant national or regional centres of national importance, 1991-2004*Sources: Country statistical data; estimations for Poland and Czech Republic by the country Teams.Levels criteria: High: for the Capitals above 25% for population and above 30% for GDP or GVA; for secondary layers: above 6% for the populationand GVA/GDP. For the other levels (medium / low) the shares decrease consistently.° Budapest is identified as Very High for its share on GDP, above all the other countries capitals.+ For the secondary layers of National importance or Regional Centres of National importance, the Levels (H,M,L) are adjusted to their relative
lower weight, not comparable with the capital cities.* Depending on the country. For population: Czech Rep: 1991-2001; Poland: 1995-2003; Hungary 1995-2004; Slovenia: 1991-2002. For GVA or
GDP: Czech Rep.:1995-2004; Poland:2000-2004; Hungary 1995-2004; Slovenia: 2000-2005.
Tab 2: RePUS Dynamic trend of urban hierarchy (Poland, Hungary, Czech Republic, and Slovenia): a Synthesis
repus_FINALREPORT.qxd 2007. 09. 20. 16:26 Page 47

Here below are some more detailed explications of thehierarchy by country:
POLAND HierarchyPoland is a country that from the morphological pointof view and for its regular shape, is strongly polycentric,comprises many large metropolitan areas and denselylocated medium-sized towns surrounded by manysmall towns. The hierarchy shows a relatively regularspacing of the main urban poles of different ranks.The Eastern and the Northern parts of Poland areinstead characterised by smaller urban centres and afew sparsely located large cities.
• Warsaw, as capital is of European significance.The city of Warsaw has the most-stronglydeveloped metropolitan functions as regardsadministration, science, culture, and business.Its spatial structure is characterised by theexistence of strong job centres in the zoneadjacent to the central city, and a wide peripheralarea that lacks strong, developed job centres.Its LLS is marked by the highest national levelof GDP/capita .
• LLS of National significance is an importantrank for Poland as it has numerous large citiesof secondary but strong relevance. That groupincludes LLS of the largest Polish cities ofCracow, Lodz, Wroclaw, Poznañ, Gdañsk, Katowice,and Szczecin. It is rather the reach of LLS thanthe size of the central city that decides thegroup diversification. The average size of thatgroup LLS is 1,616, 855 as regards its residents,and 353, 954 as regards its job places. Thespatial structure of LLS is diversified. The LLSof Katowice is characterized by the existenceof a compact urban agglomeration, withnumerous, strong job centres, highly polycentricLLS. The LLS of Gdañsk is made up of a tri-citysystem of Gdañsk, Gdynia, and Sopot, as wellas the surrounding areas of weak, local centres.Just like Warsaw, Poznan is characterized bythe existence of strong job centres within thering around the central city. All cities belongingto that group have great population and jobpotential, in addition to well-developedmetropolitan functions. Official strategicnational documents consider them to becentres of European significance.
48
• LLS of large cities of a regional significance (R2) The group includes LLS of large and medium-sized cities, with 6 of them (Opole, Zielona Góra,Kielce, Rzeszów, Lublin, Bialystok) being theregions’ capitals (NUTS 2). This group has a highlydiversified population. The average size of thatgroup LLS is around 200,000 residents and 50,000job places. Also diversified are the spatialstructures and extents of poly-centricity of thoseLLS. The economic situation of particular LLS isdiversified. Functions performed by individual LLSare also diversified. Major centres are dominatedby service or service and industrial functions, whilesmaller centres are multi-functional. Typicalindustrial LLS are those of Belchatów and Police.This group of LLS is developed in the South,Central and West Poland, while in the Eastern partof the country there are three large centres andregion capitals located, namely Bialystok, Lublin,and Rzeszów.
• LLS of medium-sized and large cities of a regionalsignificance (R1)That group embraces 68 LLS of medium-sized andseveral large towns. The average size of population inthat group of LLS is 120,000). That group of LLS is alsodiversified as regards its spatial structure and extent ofpolycentricity, as well as the economic situation andfunctions. The group includes industrial, service, andmulti-functional centres, as well as agricultural ones.That group of LLS are located in Central, Western andSouthern Poland. They do not exist in the North andNorth-Eastern parts of the country.
HUNGARY hierarchyAs for macro-areas, it may be concluded that the north-western part of the country (triangle) has a greater ratioof towns with higher scores, together with the axis reachingfrom Budapest to Miskolc-Debrecen-Nyíregyháza. Alsohigher scores are seen on the southern Great Plain,where the growth pole of Szeged is accompanied bynumerous towns on the local 2 level. The lowest scoresare present in all three major problem areas of backwardregions in the central part of the Great Plain, the north-eastern and the south-western peripheries.
• The urban hierarchy of Hungary shows anunbalanced structure, with Budapest differingextremely from its environment, and the nationalurban settlement system (see Box 4)
repusfinalreport
repus_FINALREPORT.qxd 2007. 09. 20. 16:26 Page 48

• The second level of cities (Regional 2) is relatively farfrom Budapest in scores. The regional 2 level citiesare located either in the areas surrounding Budapest,or around borders. Szeged is an island of high valuein the southern Great Plain, serving as an importantregional centre with a high level of education andsubstantial cross-border links to Serbia and Romania.Debrecen, also with high rate of tertiary education andresearch is an important regional centre of the northernGreat Plain, with the complementary centre ofNyíregyháza (which is lower in rank) and Miskolcbeing another regional pole nearby. Debrecen hasalso cross-border links to Romania, Nyíregyháza toRomania and Ukraine and Miskolc to Slovakia. Gyõris a significant centre along the Budapest-Vienna axis,with high rates of cross-border cooperation towardsSlovakia and Austria. Also the national spatial policyhas pointed out the town-pair of Veszprém and Szé-kesfehérvár, which contribute to the polycentricstructure of Central Transdanubia (Közép-Dunántúl).The historical town of Eger is elevating from thesystem of county capitals regarding the overall scoresof the standardized methodology.
• The set of secondary regional (Regional 1) centresis heterogeneous. This group combines thecentres or complementary centres of counties.Counties are the NUTS 3 level regional units, havingan administrative function and have existed for amillennium, though the change of the boundariesof this entity was common, mostly in the 20th
century. The centres of these areas have alwaysserved as real centres for their region and in somecases they have been complemented by anothertown within the county with more than 50,000residents and a special legal status assigned.Except for the complementary county centreNagykanizsa near the border with Croatia andSlovenia, all of the centres have reached scoresrequired to be included in the set of regionalcentres of the standardized methodology.
• Besides the county primary and complementarycentres, a set of smaller towns have reached higherscores therefore are labelled as Regional 1 centres,too. Such smaller towns are situated on the ringsurrounding the Budapest LLS3, characterized bygood accessibility, high output and high educationallevel. These towns usually have the presence ofsome low level of tertiary education, too. Anotherset of smaller towns, with scores reaching the level
of regional 1 are situated along the Budapest-Vienna axis, with substantial cross-border potentialand extremely good accessibility via highways.
• The level of local 2 towns is formed by centres whichare either complementary county capitals, or formersubstantial centres with higher scores in only someindicators, such as high population density oreducational level. The local 1 towns include the reallysmall centres between the areas of LLS with higherrank in the hierarchy. These are found in thepredominantly rural areas, where the distance to alarger centre determines needs for the formation ofsmall local centres to provide their small, local hinterlandwith the functions needed on an everyday basis.
Box. 4The role of small and medium-sized towns
in the Budapest metropolitan area
Budapest is the only metropolis in Hungary, thesecond-layer cities being far smaller in size aswell as in economic terms. The Budapest LLShas a large extension and concentrates around30% of the population, and almost 60% of theGross Added Value of the country. The latterfigure may be overestimated as numerous com-panies register their value added at the head-quarters which are concentrated in the capital.Still, we can see that the LLS of Budapest is out-standing from the country and determines themono-centric pattern of the whole country. Theconcentration has increased in the past tenyears both in terms of population and output.The city of Budapest has though overgrown itsboundaries as from the 1980’s onwards, subur-banisation of population has been a majordemographic trend. As the map shows, the lossof population in the core city is substantial,while the surrounding belt is gaining population.The FUA delimitation based on commutingintensity does not necessarily reflect this. Ascan be noted, a high rate of population growthis present in the South-Western ring of the sub-urbs, however, these areas do not reach the30% threshold of commuters to Budapest. Thereason for such a phenomenon is that there areemployment sub-centres of Budapest emergingin the suburban belt, many of them exactly inthe south-western sector. Two towns in this sec-tor have even more than 10,000 jobs, but there
3 Some towns on the outer ring of the Budapest LLS are also capitals or complementary capitals of counties.
49
repusfinalreport
repus_FINALREPORT.qxd 2007. 09. 20. 16:26 Page 49

50
repusfinalreport
Map 22: Budapest metropolitan area
are numerous small centres with jobs between1,000 and 10,000. Substantial centres still with-in the Budapest LLS can be found.
Sprawl of functions is going beyond the boundariesof the local labour system, as also seen in the clusteranalysis; the surrounding LLSs are either cities fromthe second row or industrial engines. These laboursystems have important engines as their centres;however there are numerous smaller towns with higheconomic activity as well. Signs of polycentricity havearisen as the metropolitan region is growing togetherwith the nearby county capitals (Székesfehérvár,Tatabánya, Szolnok, Kecskemét), but also in thedirect ring of the capital there are numerous functionsdeveloping, mostly in the fields of logistics and retail,
but there are also signs of tertiary education bothwithin and outside of the LLS. Small and mediumsized towns within and on the edge of the metropoli-tan area have a crucial role in achieving a sustainableand polycentric metropolitan area and have a greatrole in enhancing the competitiveness of the wholecapital region. Even though a large population andseveral functions have moved to the suburbs, caus-ing some internal problems of the city there is still ahuge dominance by the capital city itself within its reg-ion, and as the metropolis is growing, the environ-mental challenges are increasing very rapidly which isbeing not handled efficiently enough, as there aresevere problems in cooperation among villages,small and medium towns within the metropolis regionand the capital.
repus_FINALREPORT.qxd 2007. 09. 20. 16:26 Page 50

Czech Republic hierarchy
On a national level, the Czech Republic splits into twohierarchical systems of centres.
• Bohemia – strictly dominated by Prague, with asystem of regional “satellite” centres of Plzeñ,Hradec Králové – Pardubice, Ceské Budejovice,Liberec, Ústí nad Labem – Teplice and rather weakerKarlovy Vary and Jihlava. Except for Liberec, theBohemian urban system has developed rather asautonomous, without closer links outside thecountry. The regional spatial policy of the period ofthe Cold War even emphasised the island-likeautonomy of the system.
• Moravia and Czech Silesia – rather polycentricpattern of centres: supra-regional centre of Brno,Ostrava agglomeration, Olomouc and Zlín; except forstrong mono-centre of Brno, all other regionalcentres are parts of own polycentric systems withsatellite smaller centres. Unlike Bohemia, Moraviahas much stronger geographic potential for cross-borderintegration to Polish Upper Silesia in the north-eastand to Vienna and Lower Austria in the south.
• On regional levels, apart from the hierarchies withinthe macro-scale urbanization systems describedabove, also local urban systems exist in the areasless exposed to the influence of a metropolis orregional centres. These mostly consist of severallocal centres, interconnected by functional relationships.These spontaneous networks help to provide amore diversified offer of jobs and secondaryeducation than a single local centre could do.
• However the size of regions, which refer to NUTS 3units and have often less than a million residents, andregional centres may seem small and, consequently,inefficient, the network of regional centres as it developedespecially in the second half of the 20th century, fullyresponds to the scale of the country. The position ofthe regional centres has remained preserved in thenational context in the period after 1990s´ liberalisationchanges, while the position of Prague has increased.Thus the regional centres maintain a stabilising role inthe national hierarchy. (Hampl, 2006).
• Apparently, the growth of the significance ofPrague has been on the account of smaller centresand peripheral rural areas in general. The viabilityof small centres in peripheral areas may be questioned
in the long term wherever the long-term negativeimpacts of ageing population, job decrease andservice decline coincide.
SLOVENIA hierarchyThe Slovenian urban settlement system is dominated byLjubljana, which plays the central role: its weight is very highboth in terms of population and economic weight. Numerousmedium and small towns are located in the different part ofthe country making a certain balanced structure.
• Ljubljana has the highest scores as metropolitanurban area, as the capital city of European importance.
• Maribor is the second city after Ljubljana and emergesas a strong development pole of Eastern Slovenia.
• LLS of regional significance (R1) Most of the followinglayer LLS Celje as development pole of Savinjska region,LLS Kranj as development pole of Gorenjska region,LLS Coast (Koper-Izola-Piran) as development pole ofObalno-kraška region, LLS Novo mesto as developmentpole of South-Eastern Slovenia region, LLS NovaGorica as development pole of Goriška region.According to the overall scores LLS Velenje also belongsto strong regional poles (from year 2009 Velenje will bethe centre of new NUTS 3 region). LLS Zasavje, part ofZasavska NUTS 3 region, LLS Slovenj Gradec asdevelopment pole of Koroška region, and LLS Krško asthe development pole of Spodnjeposavska regionbelong to industrial areas under restructuring and arealso part of city clusters of regional importance: Trbovje-Hrastnik-Zagorje, Slovenj Gradec-Ravne na Koroškem-Dravograd, Krško-Brezice-Sevnica.
• With the lower overall LLS Murska Sobota, regional poleof agricultural NUTS 3 Pomurska region and LLSPostojna, regional pole of forestry NUTS 3 Notranjsko-kraška region, as well as LLS Ptuj, regional poles of a newNUTS 3 region near Maribor, are labelled as Regional 1.
Box 5The centripetal role of Vienna in the
largest Central Eastern European space
In comparison with European countries, theAustrian urban system is relatively small. Thelargest city (by far) – Vienna – has about 1.55million residents, whereas the population size
51
repusfinalreport
ˆ ˆ
ˆ
repus_FINALREPORT.qxd 2007. 09. 20. 16:26 Page 51

52
repusfinalreport
of all the other cities in Austria is below250,000 residents.
The structure of the Austrian urban system withVienna as the main urban pole and several minorurban poles has been laid down in the „AustrianSpatial Development Concept 2001“: The model ofpolycentric development, defined in the ESDP, isstated to be relevant also in Austria, but with onemajor difference: The important urban regions shallfurther develop, but Vienna shall be able to hold itsdominant position within the Austrian urban structure(that means, there is no aim of a counterbalancedurban system at the highest level in Austria)4.
Within Austria (especially within the eastern half ofAustria), there is a strong centralisation trendtowards the urban agglomeration of Vienna. Alsosome important medium and small towns – concerningpopulation size and economic potential – are locatedwithin this agglomeration, mainly in the east and southof Vienna. In contrast to all of the other smaller Austrianagglomerations, the Viennese agglomeration coverssuburban regions as well as towns, which are locatedespecially in the south of Vienna.
Further important urban agglomerations in Austriacan be divided into two types:
• Some have one clearly-dominating urban node(core city), as there is e.g. Graz (Styria), Salzburg,Innsbruck and partly St. Pölten (together withKrems, Lower Austria). • And there are agglomerations, which showpolycentric structures to some extent, e.g. Rhinevalley (Dornbirn, Bregenz, Feldkirch), Linz-Wels(Steyr) (Upper Austria) and Klagenfurt-Villach(Carinthia).
ITALY hierarchyStrongly polycentric, the Italian hierarchy reflects the existenceof many large as well many medium-sized towns that makethe urban structure extremely dense in the Northern regionsin particular and partly on the upper part of the Centre.Additionally the importance of several strong metropolitanareas makes Italy a strongly polycentric country, from bothperspectives: from the national as well as regional perspective,as the mature decentralisation had favoured powerful
regional capitals, however with different patterns from Northto South. The urban centres performing best are located inthe North, few in the Centre and sparsely in the South,where lower layers are mostly diffused: from this point ofview the Centre and the South results are less polycentric,but rather monocentric around a few poles as the urbandensity is relatively low on average.
• Rome and Milan are the formal and the economiccapitals at European level for the importance oftheir respective weight and relevance in the Italiansettlement system hierarchy.
• The main characteristics of the Italian urban settlementsare the high economic performance of many largecities that make the second layers very close tothe upper levels: thus eight metropolitan areas arethe second layer by the RePUS hierarchy of trans-regional/national importance: Turin, Bologna,Venice, Genoa, Naples, Bari and Palermo, five ofwhich are in the North of Italy, as the pillar of theurban skeleton.
• A second selected layer of Regional 2 as the mainRegional centres that also contribute to theNorthern urban density with few sparsely locatedin the Centre and the South.
• The third layer (Regional 1) is instead morediffused all over the country as it covers theregional centres of secondary importance relatedto numerous small towns (Local 2).
• The Locals (Local 1), those performing worse, aremainly located in the Southern part and they aremainly the small towns of weak potentials.
2.3 Spatial polarisation inter andintra disparities
In order to advance in the comprehension of spatial patternsand to attempt to go more into the specifics of the differentcountries, the various degrees of demographic and economicpolarisation / and or polycentricity at upper levels (NUTS 3 orNUTS 2) and at intra-LLS level, have been calculated by theemployment of simple indicators, as rough measures of thedifferent degrees of concentration/ diffusion.
• Two levels have been identified: at the regionallevel, NUTS 2 (for Poland, Hungary Slovenia and
4 Source: Austrian Spatial Development Concept 2001 (page 117)
repus_FINALREPORT.qxd 2007. 09. 20. 16:26 Page 52

areas, because of the numerous urban centres that areencompassed in its region. The other regions wheresecondary layers centres are located are relatively lesspolycentric, such as Brno in the Czech Republic,Katowice and Gdañsk and the other main centres inPoland. While Hungary again confirms relativelypolycentric patterns, an indication of the numerousurban centres of average size located all over the country.
The economic polarisation shows different results (seeMap 24). Poor regional context can explain strongerconcentration because of one single or fewer economicpoles; instead a developed region can have anextremely strong centre that inevitably explains the highconcentration (size effect) even in a wealthy region.
For four countries, Poland, Hungary, Slovenia and Italy,the degree of economic polarisation, compared withthe demographic polarisation, is much more pronounced.This shows that economic centres tend to beconcentrated against more dispersed pattern for thepopulation.
On the other hand, the Czech Republic shows anextremely even level against the large pole aroundPrague and its region: these results might also due tothe specifics of the economic indicator taken, as“economic aggregate”, which remains relatively flatthroughout the regions in the country.
Hungary shows diverse degrees of economic polarisation.The lowest level, with very polycentric structure, is theCentral Region with Budapest that has many adjacentstrong economic poles that make the disparities of itsregion very low. There is also low polarisation on theSouthern Great Plain owing to the presence of severallarge cities, whilst the remaining ones are relativelypolycentric with many medium-sized urban poles. Themost strongly polarised regions are in the SouthWestern Transdanubia with Pécs and Northern Hunga-ry that both have a single isolated strong centre.
Poland has its foremost polarisation around the maincities that are also strong economic centres, as theRegions where Warsaw, Cracow, Wroclaw are. Theremaining have different degrees of polarisation: theEastern regions and partially the North-East insteademerge as relatively polycentric as they have moresparsely located economic centres, also explained bythe more rural economy. Slovenia, apart from the relevantpolarisation due to the capital has the strongestpolarisation around the main economic pole in theEast whilst the Western side is highly polycentric.
53
repusfinalreport
Italy) and NUTS 3 (Czech Republic) the coefficientof variation for the population function, and thecoefficient of variation by Williamson for theeconomic function.
• For looking at intra-LLS disparities, the simple ratioof the centroid over the LLS population, gives anindication of the local labour market polycentricity.
The results below are interesting for identifying specificpatterns that change country by country, but also giveinsights about the peculiarities that are related to thecombination of various factors such as:
• The density of the urban settlements and theproximity of different centres of various hierarchicallevels;
• The dimension of the municipalities in terms ofsize of territory, as this can change the degree ofproximity of one municipality to another;
• The size of the labour market that is often indirectlyrelated also to the degree of population densityand proximity of many centres.
2.3.1 Degree of monocentricity/polycentricityby population and economic functions
The comparison between levels of polarisation of thepopulation with the degree of economic polarisation isextremely interesting since it can indicate very diverseresults: the two do not coincide, on the contrary thereare significant discrepancies that are related to thecombinations of different factors: in general, economicfunctions result in much more polarised thanpopulation functions, as clearly the degree ofeconomic performance of the economic poles has amultiplier effect, whilst population can be sparselylocated in urban centres having non necessarilyeconomic functions, but exclusively residential areasfunction, with basic provision of services.
In fact, the degree of polycentricity of the urban settlementsin the five countries has relatively strong results, with thehighest polarisation around the respective mainmetropolitan areas: this clearly applies to Poland, CzechRepublic, Slovenia and to a lesser extent to Italy (addi-tionally for the strong centres of Milan and Naples). Hungaryemerges as the most polycentric on average, comparedwith the others, as the population polarisation is lesspronounced even around the Budapest metropolitan
repus_FINALREPORT.qxd 2007. 09. 20. 16:26 Page 53
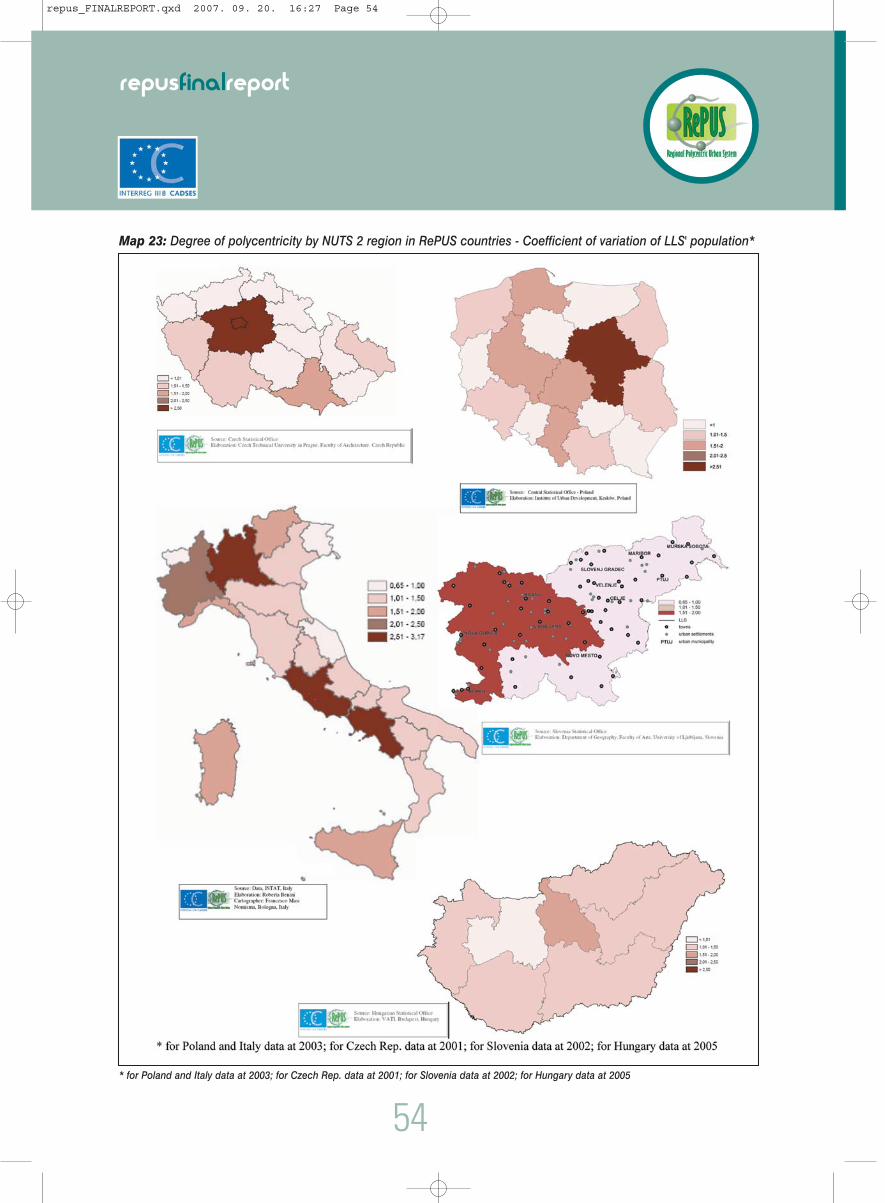
54
repusfinalreport
* for Poland and Italy data at 2003; for Czech Rep. data at 2001; for Slovenia data at 2002; for Hungary data at 2005
Map 23: Degree of polycentricity by NUTS 2 region in RePUS countries - Coefficient of variation of LLS' population*
repus_FINALREPORT.qxd 2007. 09. 20. 16:27 Page 54

* for Poland and Italy data at 2003; for Czech Rep. data at 2001; for Slovenia data at 2005; for Hungary data at 2004
55
repusfinalreport
Map 24: Intra-Regional (LLS) economic polarisation by NUTS 2 region in RePUS countries - GVA's Williamson'scoefficient of variation*
repus_FINALREPORT.qxd 2007. 09. 20. 16:27 Page 55
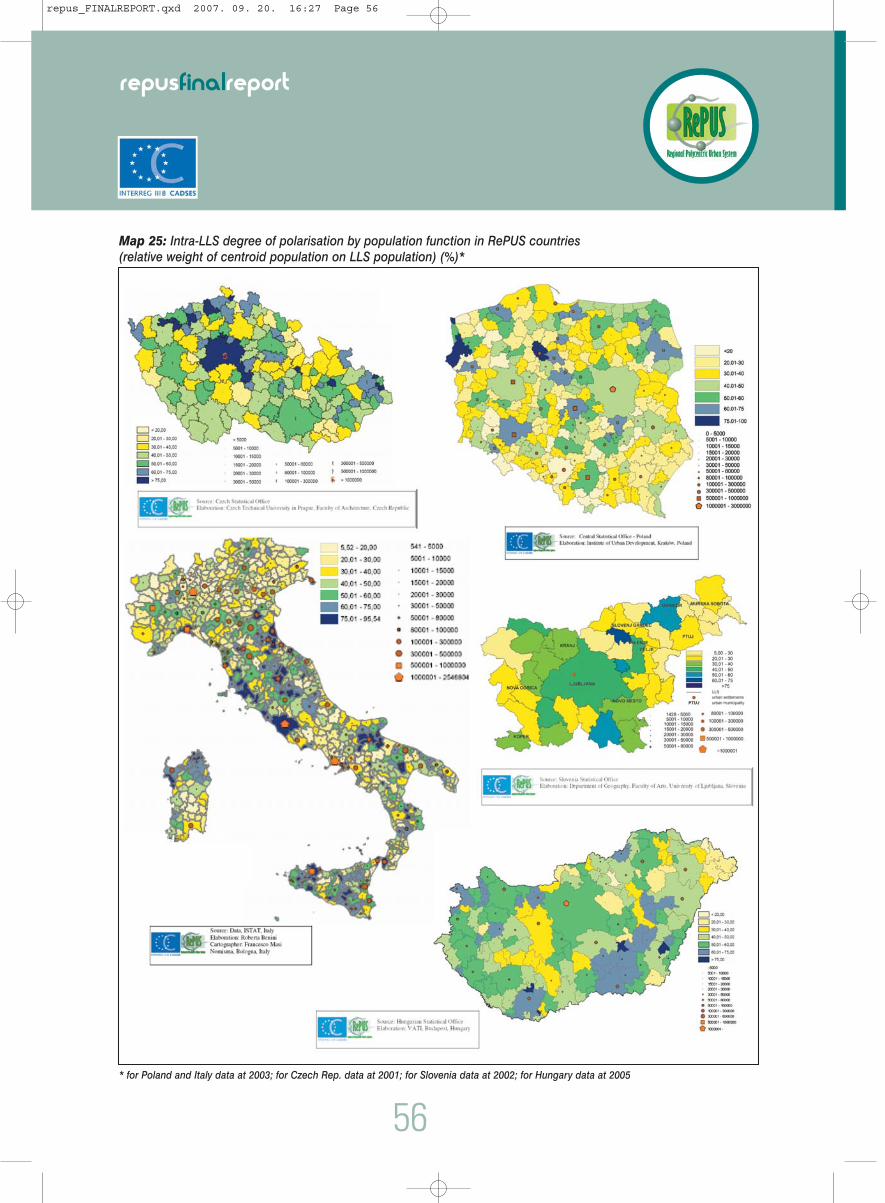
56
repusfinalreport
* for Poland and Italy data at 2003; for Czech Rep. data at 2001; for Slovenia data at 2002; for Hungary data at 2005
Map 25: Intra-LLS degree of polarisation by population function in RePUS countries(relative weight of centroid population on LLS population) (%)*
repus_FINALREPORT.qxd 2007. 09. 20. 16:27 Page 56
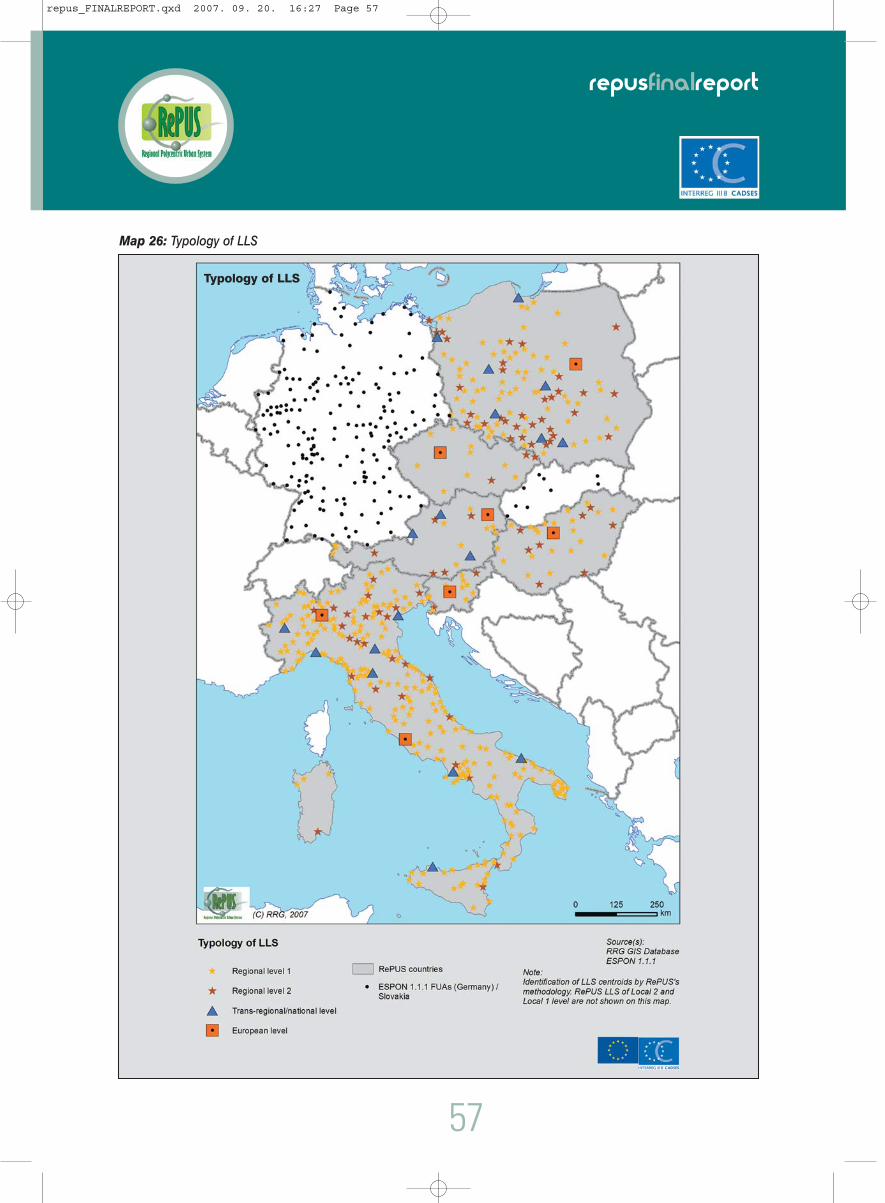
Map 26: Typology of LLS
57
repusfinalreport
Typology of LLS
repus_FINALREPORT.qxd 2007. 09. 20. 16:27 Page 57

58
repusfinalreport
Italy shows very marked high polarisation patterns in theSouthern regions, whilst the North and part of the centreis rather polycentric, apart from the region which includesMilan. The explanations are of different origins: thepolarisation of the North is explained by the higheconomic dimension of the Milan agglomeration whilst inthe South, by poor background and few economic poles.
2.3.2 Intra-LLS degree of polarization
Looking at the intra-degree of polarisation of the urbansettlement by LLS (see Map 25), as simple weight ofthe population centroid over the LLS population, theresults are the combination of simultaneous factors:
• The size of the labour market and their respectivepopulation (size of the LLS)
• The size of the LLS’s population centroid • The number of secondary urban centres within
each LLS
From the comparison of the five countries, it emerges thatthe countries as large as Poland and Italy, in terms of pop-ulation, are characterised by relatively polycentric internalstructure, as they enjoy many different-sized citiesrelatively close to each other, within each LLS. In factwhere the LLS are small in size, there is higher polarisation,as in the Central part of Italy (small size LLS with few centres)and those sparsely located in Poland, with mediumpolarisation in the LLS around strong metropolitan areasas Warsaw, Cracow and several others major centres.
The other three countries, Hungary, Czech Republic andSlovenia, show relatively high levels of internal polarisationas their internal urban structures have relatively few urbancentres. Prague shows the highest level of internalpolarisation, while Budapest shows an average concentration,explained by the simultaneous existence of othernumerous small urban centres in its large conurbation.(See map 25)
2.3.3 The morphology aspects of the spatialurban system in the RePUS areas
To better comprehend the morphological aspects ofthe settlement systems, the PUSH (Potential UrbanStrategic Horizons) areas on the basis of the densityof the LLS reached by 45 minutes isochrone car travel,have been calculated. The identification of the PUSHis based on the methodology developed in ESPON111 and applied to the RePUS areas. The PUSH is the
attempt to give an analytical picture of the combinationof two main factors.
I. Accessibility, characterised by the quality and the speedof the main road transport network (both of Europeanand National importance), updated to 2006 information.
II. The proximity to urban centres as a measure ofdensity: the closer the municipalities, the higher theexisting potential for urban integration areas in termsof labour market, provision of services and functions.
However the different territorial sizes of the municipalitieshave an important influence on the density: The CzechRepublic has smaller municipal territory and consequentlyless cities can be reached by transport connection in agiven time distance, if they are not closely located. Poland,on the other hand, has larger municipalities and the resultis that it is easier to reach a given number of municipalities.(See map 26)
The results of the RePUS hierarchy identified in eachcountry, is the starting base from which the elaboration ofthe PUSH areas have been calculated. The choice hasbeen that of taking into consideration from the upper levelsdown to the intermediary level (in RePUS methodologycalled Regional 1), excluding the Local LLS (Local 2 andLocal 1), in order to stress a certain critical level of urbanfunction for policy makers and also for getting a morecontrasting picture. This choice in fact, weakens thoseareas that are characterised by dispersed urban centres(weak proximity) under-evaluating a possibly morediffused type of urban settlement, as for instance might bethe case for the Czech Republic, which has more sparselydispersed cities. The rationale for this approach has beenthat of underlining the areas in which stronger potentialexists, considering population size and density, twoimportant factors that can facilitate growth, although theyare not per sé sufficient conditions for development.
The map below describes the synthesis of the overlapping of thePUSH areas taking the municipalities as basic units: thus theintensity of the colours, from yellow to orange and red, is givenby the number of PUSH that overlap in each municipality. Thehigher the proximity of different urban centres, the more PUSHcan be reached this has consequently an impact on the serviceprovision and the labour market, as proximity can improve theconsumer’s and the supplier’s choice and opportunities.
The identification of the density of the PUSH areas clearlyindicates the existing gaps between the Old membercountries, within the Pentagon, in particular Germany andItaly, and the other countries. From the morphological pointof view, some determinant features can be highlighted:
repus_FINALREPORT.qxd 2007. 09. 20. 16:27 Page 58

1. Poland is the country that shows the most importantpotential in terms of density and proximity of largecities/medium-sized towns surrounded by manysmall towns. The South of Poland, seems to indicatethe place where there is high potential and wherethere is a large, strong conurbation along theSouthern border, Upper-Silesia, including the denseagglomeration of Ostrava in the Czech Republic.
2. On the other side, there is also an interesting continuousdense area on the North of Hungary that includes thelarge Budapest metropolitan area. This space is clearlyalong the line toward the West side going to the largeVienna-Bratislava conurbation, indicating a strong potentialfor future development in an integrated perspective.
3. Slovenia emerges very densely in the middle of thefour neighbouring countries, as it also enjoysdensely located small towns and few medium-sized towns, other than the capital Ljubljana.Slovenia has a particularly favourable conditionsdue to its small size and its location at the core ofongoing and future transport connections
4. The Czech Republic shows less density as the munici-palities are smaller (territorial size) and its total number ofLLS up to Regional 1, are fewer in proportion to the otherRePUS countries. Taking into consideration thesefactors, the map shows that the density of PUSH areasis higher in Central and North-Western Bohemia and,particularly, along the Brno – Olomouc – Ostrava axiswith prolongation to Upper Silesia in Poland. (See alsofor comparison the Box 6 on Czech accessibility, ascomplementary analysis taken from a local perspective).
5. Austria’s results show strong density on its East sidewhere Vienna, Linz, Graz and Salzburg are located.
6. Italy is the country where the intensity is the highest,with Germany, in particular in the North axes and inthe metropolitan areas of Naples.
See map 27!
Box 6.Czech accessibility from a local perspective
Accessibility of centres as a factor of polycentricdevelopment and efficiency of servicing population
The analyses were made for the accessibility ofregional centres (Map 28), multiplicity of choices ofaccessibility of local FUA/LLS centres (Map 29) andthe efficiency of servicing the population describedas the number of people that can be reached froma centre of a LLS/FUA within 60 minutes (Map 30).These different expressions of attractiveness basedon accessibility show very different pictures. (Seemap 28–29–30)
In order to better apprehend the demographicpotential of the proximity and the overlapping of theLLS’s centroids, many PUSH areas consequentlyoverlap and the areas of overlapping are called PIA(Polycentric Integration Area) by the methodologyproposed In ESPON 1.1.1. (See Map 31). The centre ofeach PIA is assumed by the most important centroidof LLS that are the basis of the PUSH area. In the mapbelow, the population size of each PIA have beenmeasured in order to indicate the population criticalmass.
• The large PIA, with a population at least from 7.5million residents up to 15 million, is in the Centraland the Southern part of Poland, in the East sideof Austria around Vienna, and in the North of Italy.
• The other countries show smaller PIA areas: this isin line with their respective population densitiesand urban centres diffusion. In the North ofHungary, however there are two large PIAs indicatingthe important proximity of the capital metropolitanareas and important regional centres that mergewith the large PIA of the Vienna-Bratislavaconurbation, almost making a continuous space.
The relative intensity of the colour indicates wherehigher population critical mass exists, or conversely,less intensity, red and yellow colours, where lowerpopulation is concentrated: Thus the areas that enjoyhigh density and proximity of urban centres havebenefits in terms of higher opportunity for integration,alternative service provision choice, high accessibilityand mobility, all factors that in the modern economyare fundamental for attraction and competitiveness,provided that other socio-economic conditions exist.Thus the most populated areas can receive greatadvantages from stronger cooperation. Converselythe less densely populated areas or sparsely locatedurban centres would require adapted policy in order toaddress the limited opportunity for choice of servicesprovision. Here the policy makers need to tailor thepolicies to the specifics of the urban settlement typeand proximity for finding adequate solutions andincreasing the attractiveness of the centres. Thedensity di-per-sé does not bring development butbecomes a positive feature when the other fundamental(economic, social, institutional, environmental)constituents exist both as hard and soft factors.
Cross-border cooperation also plays a particularlyimportant role in the integration process, taking intoconsideration the urban proximity and density.
59
repusfinalreport
repus_FINALREPORT.qxd 2007. 09. 20. 16:27 Page 59

60
repusfinalreport
Map 27: PUSHs overlapping in each municipalities
PUSHs overlapping ineach municipalities
repus_FINALREPORT.qxd 2007. 09. 20. 16:27 Page 60

61
repusfinalreport
© CVUT in Praha Source data © Czech Statistical Office; © Czech Institute for Geodesy and Cartography
© CVUT in Praha Source data © Czech Statistical Office; © Czech Institute for Geodesy and Cartography
ˆ
ˆ
Map 28: Population within 60 minutes accessibility to the centre of regional capital by car
Map 29: Potential of the teritory for polycentric development on local level
repus_FINALREPORT.qxd 2007. 09. 20. 16:27 Page 61

62
repusfinalreport
© CVUT in Praha Source data © Czech Statistical Office; © Czech Institute for Geodesy and Cartography
2.4 Integrated CE Europeanspaces. The strong areasof spatial integration
In the perspective of spatial integration of the Centraland Eastern European areas, cross-border co-operationplays a strategic role in facilitating the wider process ofintegration. Important urban centers along the bordersof the countries enhance cooperation, often facilitatedby their common historical or cultural background.
Various pre-existing circumstances have an influenceon the importance of and the potentialities fordevelopment:• Size and functions of towns and related urban areas
that go beyond the labour market dimension, becausethey are also based also on the type of service provi-sion and attraction capacity that the cities can exert, vis-à-vis neighbouring centres in the bordering countries.
• The proximity of towns along the borders and theirrelative accessibility in term of transport infrastructure
• The historical and cultural background ofneighbouring regions as the geo-political bordersin Central and Eastern Europe have changedthrough the decades in the past century, andmany populations have been split betweencountries, due to state borders being moved.Towns too have been assigned to differentcountries, imposing a strong impact on the relativestructure of urban settlements.
Taking into consideration the combination of thesedifferent economic, socio-economic and culturalaspects, the urban dimension plays a central rolebecause economic, institutional service provision is achannel for improving spatial integration from a cross-border perspective, in order to overcome politicalborder fragmentation.
Thus, cross-border integration can be understood asan opportunity to speed up the processes ofconvergence and integration and, at the same time, tofacilitate the re-composition of state borders which inmany cases have undergone change and toameliorate problems relating to minorities.
ˆ
Map 30: Efficiency of servicing population
repus_FINALREPORT.qxd 2007. 09. 20. 16:27 Page 62

63
repusfinalreport
Map 31: PIA Population
PIA Population
repus_FINALREPORT.qxd 2007. 09. 20. 16:27 Page 63

The map below (see Map 32) identifies somemajor cross-border linkages classified by theirEuropean, regional and local importance. Theareas coloured in yellow correspond to the areasof the PUSH (45 minutes isochrones) which are inthe cross-border area. This gives an importantinsight into the relevance of this cross-borderarea and indicates their local potentialities, interm of proximity and number of urban centres aspotential areas of cooperation, from the perspec-tive of accessibility also.
Links of European importance on this map are stronglyconcentrated around Austria, the Czech Republic,Hungary and Slovenia, because these have historicallybeen well-integrated regions within the Austro-Hungarian Empire.
These links are not exhaustive of all links or potentiallinks existing in the Central Eastern region, rather theyonly give an initial picture of the most relevant. Amore detailed list of cross-border areas can be foundat the end of this chapter. Furthermore, other additionalmaps by countries in this chapter, integrate the picturein relative terms.
Below are further, detailed maps of individual countries,where the main cross-border areas are highlighted.
Poland with its large size and its regular shape hasmany potential and existing cross-border areas,bordering EU countries: Germany, the CzechRepublic and the Baltic states, as well non-EUcountries: Ukraine, Belarus and Russia.
There is great potential in both cases: on the onehand in the east for softening political divisions andfacilitating cooperative development, also in lightof the expected improvement of accessibility, withthe new transport corridors that will link majorPolish metropolitan areas with Kiev, Kaliningradand Minsk (strong historical factors also indicatethat it is necessary to improve integration, as theexample of L’viv and other, now Ukrainian citieswhich were historically part of Poland); on the otherhand in the west and south, toward Germany,Czech Republic, Slovakia and Romania, moreintensive exchange exist already.
64
repusfinalreport
Box 7Shaping European cooperation centres based on theexample of the Cracow-Upper Silesia Cluster (KRUS)
The areas comprising Cracow, Czêstochowa,Opole, Ostrava and Bielsko-Biala make up theUpper Silesia Metropolitan Area. This denselyurbanised system of towns and cities is apolycentric area. It has been called the Cracow-Upper Silesia (KRUS) Cluster. Such well-integratedand co-operating areas existing in polycentricEurope have primarily an opportunity to increasetheir competitive position, with respect to otherregions. Some examples worth considering asrole models would be the Delta Metropolis(Amsterdam, Rotterdam, the Hague andUtrecht), the Centropa (Vienna and Bratislava)and the Saxon Triangle (Chemitz, Dresden, Halle,Leipzig and Zwickau) (See Map 34).
The Polish part has a population of approximately 7million people. The average population density is331 inhabitants /km2; however, in the major partof the area, there are places with much higherdensity. The settlement system of the area ischaracterized by high cohesion, resulting from itshistorical development, which is today strengthenedby the area’s location on the route of the A4motorway and A1 national road connections.
The greatest level of job concentration is to be foundin the three region capitals: Cracow, Katowice andOpole, as well as in a dozen other strong regionalcentres. The settlement structure within the area isdiverse. The Upper Silesia area forms a cohesiveurban agglomeration with many cities and towns,including large, medium-sized and small ones. TheCracow region is marked by strong domination on thepart of the city of Cracow itself, with the existence ofsmaller urban units. The city of Opole dominates in thewest of the area. The area’s labour market iscomposed of approximately 1,600,000 non-farming jobs,including about a million in services. In the UpperSilesia region there is still a high rate of employment inindustry, because of problems arising from the restruc-turing of traditional heavy industry and these are themain reasons for social distress and unemployment.
The whole area is characterized by high scientificand educational potential. There are strongresearch centres which are of national and internationalsignificance, such as Cracow, Katowice-Gliwiceand Opole, as well as smaller, regional centres.
repus_FINALREPORT.qxd 2007. 09. 20. 16:27 Page 64

65
repusfinalreport
Map 32: LLS and Pothencial for Cross-border Relationships
LLS and Pothencial forCross-border Relationships
repus_FINALREPORT.qxd 2007. 09. 20. 16:27 Page 65

Map 33: Potential areas of transborder cooperation in Poland
Map 34: Kraków - Upper Silesia Cooperation
66
repusfinalreport
repus_FINALREPORT.qxd 2007. 09. 20. 16:27 Page 66
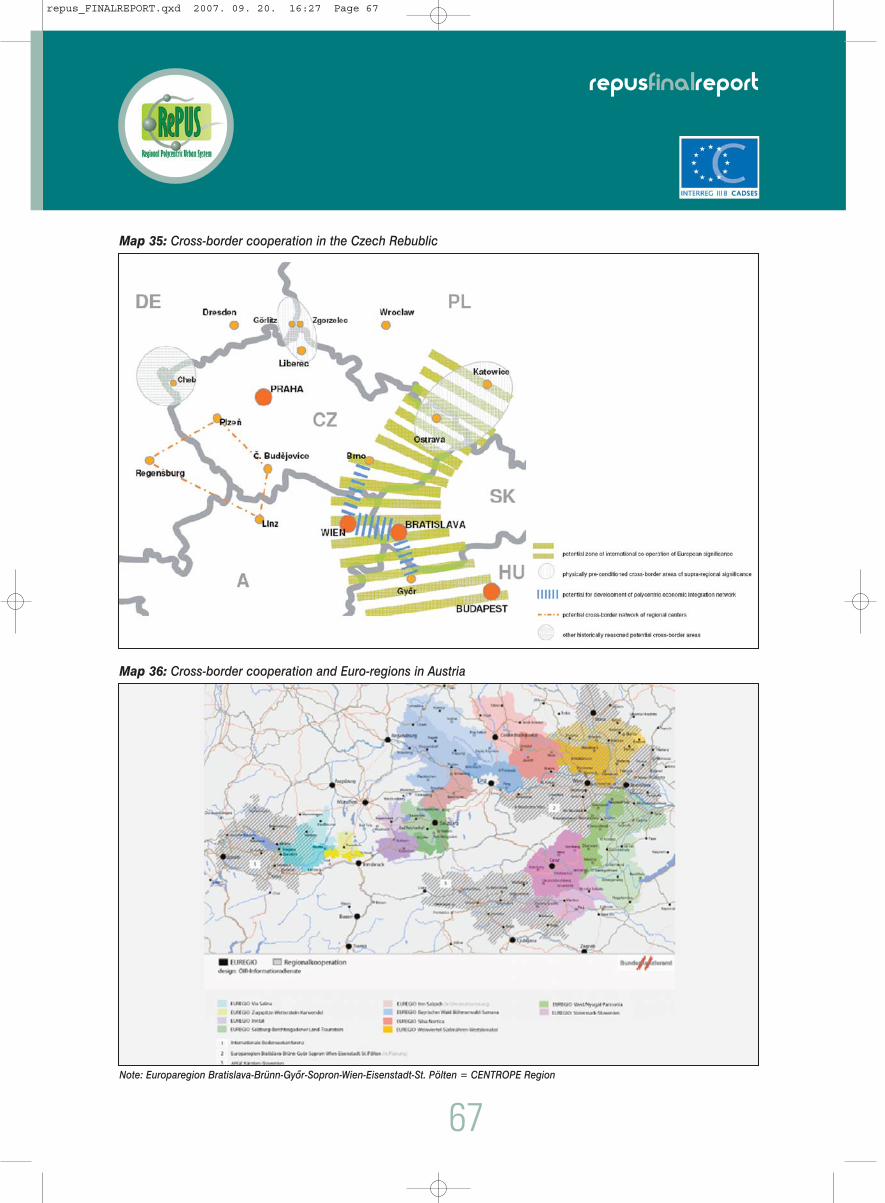
67
repusfinalreport
Map 35: Cross-border cooperation in the Czech Rebublic
Note: Europaregion Bratislava-Brünn-Gyõr-Sopron-Wien-Eisenstadt-St. Pölten = CENTROPE Region
Map 36: Cross-border cooperation and Euro-regions in Austria
repus_FINALREPORT.qxd 2007. 09. 20. 16:27 Page 67
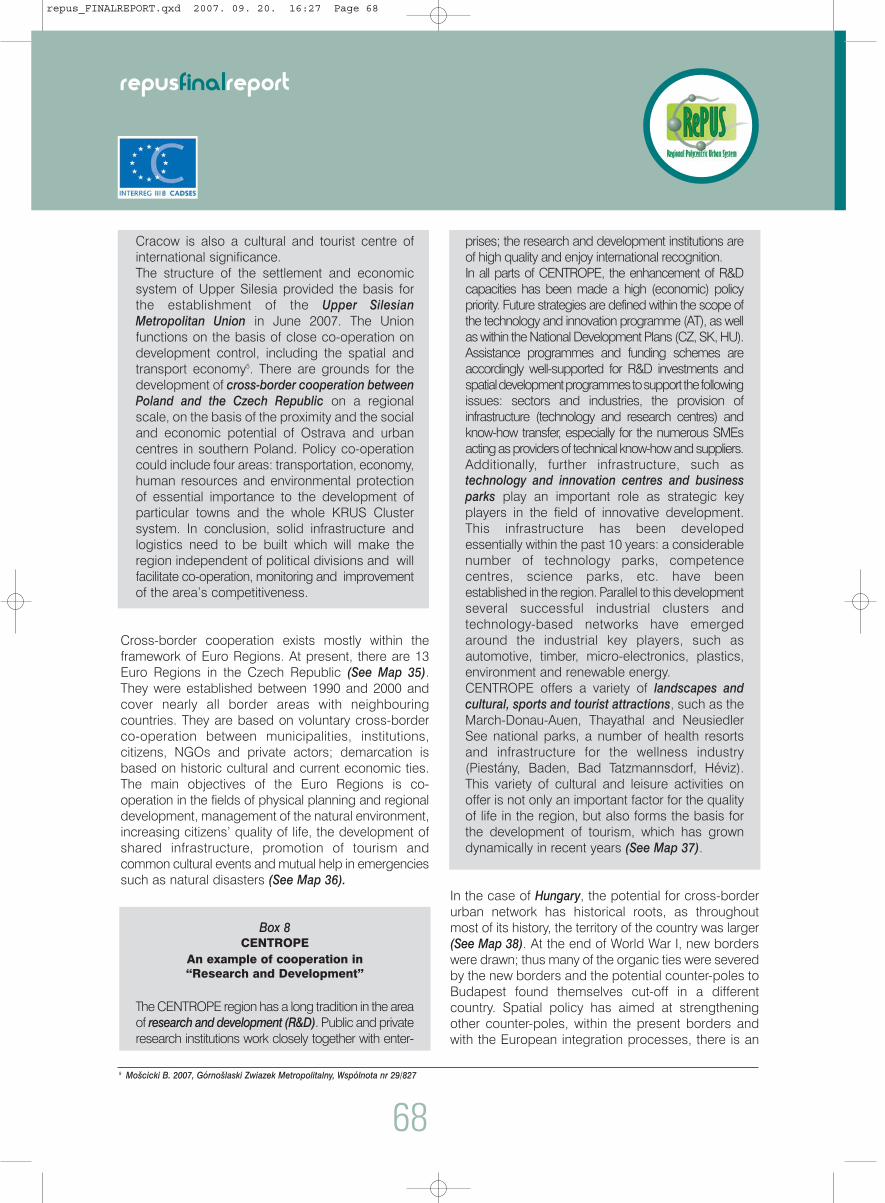
Cracow is also a cultural and tourist centre ofinternational significance. The structure of the settlement and economicsystem of Upper Silesia provided the basis forthe establishment of the Upper SilesianMetropolitan Union in June 2007. The Unionfunctions on the basis of close co-operation ondevelopment control, including the spatial andtransport economy5. There are grounds for thedevelopment of cross-border cooperation betweenPoland and the Czech Republic on a regionalscale, on the basis of the proximity and the socialand economic potential of Ostrava and urbancentres in southern Poland. Policy co-operationcould include four areas: transportation, economy,human resources and environmental protectionof essential importance to the development ofparticular towns and the whole KRUS Clustersystem. In conclusion, solid infrastructure andlogistics need to be built which will make theregion independent of political divisions and willfacilitate co-operation, monitoring and improvementof the area’s competitiveness.
Cross-border cooperation exists mostly within theframework of Euro Regions. At present, there are 13Euro Regions in the Czech Republic (See Map 35).They were established between 1990 and 2000 andcover nearly all border areas with neighbouringcountries. They are based on voluntary cross-borderco-operation between municipalities, institutions,citizens, NGOs and private actors; demarcation isbased on historic cultural and current economic ties.The main objectives of the Euro Regions is co-operation in the fields of physical planning and regionaldevelopment, management of the natural environment,increasing citizens’ quality of life, the development ofshared infrastructure, promotion of tourism andcommon cultural events and mutual help in emergenciessuch as natural disasters (See Map 36).
Box 8CENTROPE
An example of cooperation in“Research and Development”
The CENTROPE region has a long tradition in the areaof research and development (R&D). Public and privateresearch institutions work closely together with enter-
prises; the research and development institutions areof high quality and enjoy international recognition.In all parts of CENTROPE, the enhancement of R&Dcapacities has been made a high (economic) policypriority. Future strategies are defined within the scope ofthe technology and innovation programme (AT), as wellas within the National Development Plans (CZ, SK, HU).Assistance programmes and funding schemes areaccordingly well-supported for R&D investments andspatial development programmes to support the followingissues: sectors and industries, the provision ofinfrastructure (technology and research centres) andknow-how transfer, especially for the numerous SMEsacting as providers of technical know-how and suppliers.Additionally, further infrastructure, such astechnology and innovation centres and businessparks play an important role as strategic keyplayers in the field of innovative development.This infrastructure has been developedessentially within the past 10 years: a considerablenumber of technology parks, competencecentres, science parks, etc. have beenestablished in the region. Parallel to this developmentseveral successful industrial clusters andtechnology-based networks have emergedaround the industrial key players, such asautomotive, timber, micro-electronics, plastics,environment and renewable energy. CENTROPE offers a variety of landscapes andcultural, sports and tourist attractions, such as theMarch-Donau-Auen, Thayathal and NeusiedlerSee national parks, a number of health resortsand infrastructure for the wellness industry(Piestány, Baden, Bad Tatzmannsdorf, Héviz).This variety of cultural and leisure activities onoffer is not only an important factor for the qualityof life in the region, but also forms the basis forthe development of tourism, which has growndynamically in recent years (See Map 37).
In the case of Hungary, the potential for cross-borderurban network has historical roots, as throughoutmost of its history, the territory of the country was larger(See Map 38). At the end of World War I, new borderswere drawn; thus many of the organic ties were severedby the new borders and the potential counter-poles toBudapest found themselves cut-off in a differentcountry. Spatial policy has aimed at strengtheningother counter-poles, within the present borders andwith the European integration processes, there is an
68
repusfinalreport
5 Moscicki B. 2007, Górnoslaski Zwiazek Metropolitalny, Wspólnota nr 29/827
ˆ ˆ
repus_FINALREPORT.qxd 2007. 09. 20. 16:27 Page 68
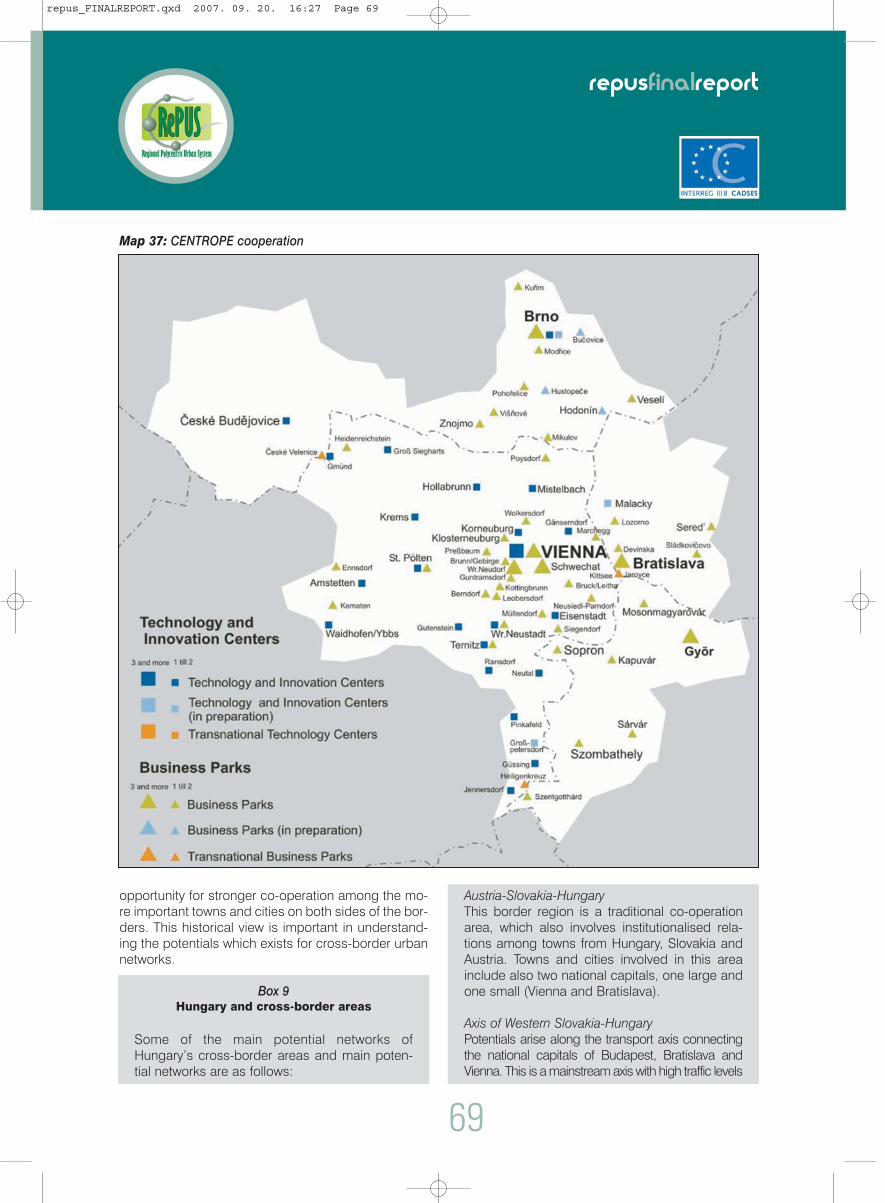
69
repusfinalreport
opportunity for stronger co-operation among the mo-re important towns and cities on both sides of the bor-ders. This historical view is important in understand-ing the potentials which exists for cross-border urbannetworks.
Box 9Hungary and cross-border areas
Some of the main potential networks ofHungary’s cross-border areas and main poten-tial networks are as follows:
Austria-Slovakia-HungaryThis border region is a traditional co-operationarea, which also involves institutionalised rela-tions among towns from Hungary, Slovakia andAustria. Towns and cities involved in this areainclude also two national capitals, one large andone small (Vienna and Bratislava).
Axis of Western Slovakia-HungaryPotentials arise along the transport axis connectingthe national capitals of Budapest, Bratislava andVienna. This is a mainstream axis with high traffic levels
Map 37: CENTROPE cooperation
repus_FINALREPORT.qxd 2007. 09. 20. 16:27 Page 69
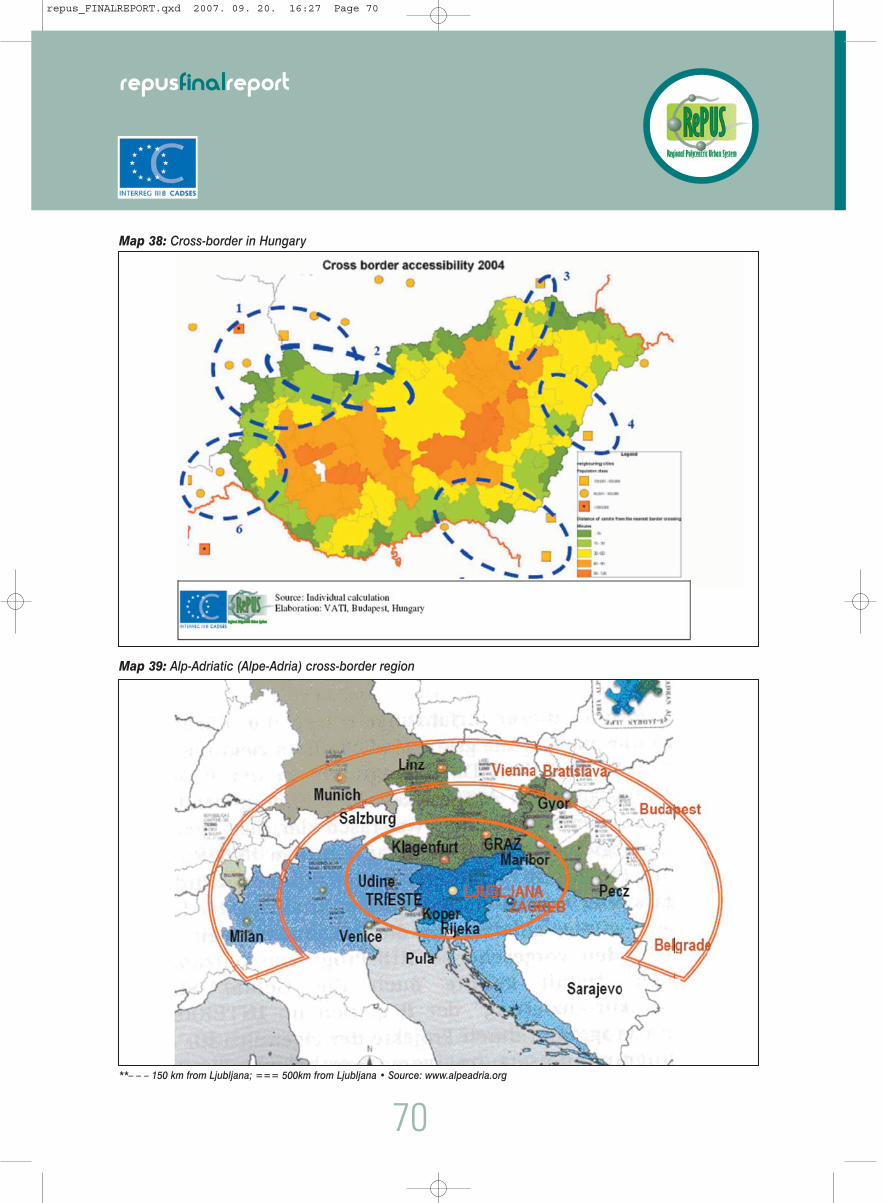
Map 38: Cross-border in Hungary
**– – – 150 km from Ljubljana; === 500km from Ljubljana • Source: www.alpeadria.org
70
repusfinalreport
Map 39: Alp-Adriatic (Alpe-Adria) cross-border region
repus_FINALREPORT.qxd 2007. 09. 20. 16:27 Page 70

71
repusfinalreport
and high population density, in a series of relativelysmall to medium-sized towns, which have high ratesof activity. The development of the towns along thisaxis is achieved by strong connections, commutingbetween the two sides of the border. One strength ofthe region is that it has an advantage in terms oflanguage skills, due to the fact that there are largeethnic communities in the region; this means thatone soft factor for co-operation is present here.
Couple: Miskolc (HU) – Košice (SK)Košice was once the north-eastern regional centre ofHungary with traditional, organic relations within theregion. After the First World War, Košice became partof Slovakia, while Miskolc remained in Hungarianterritory. North-eastern Hungary found itself lacking aregional centre, resulting in the forced developmentof Miskolc, which underwent a huge populationincrease. Now Miskolc and the region are facingrestructuring problems. Additionally, eastern Slovakiais of low socio-economic status and there is lack ofinfrastructure, therefore potentials in this region startco-operative development on a longer term. In thelong term, Košice may assume the role of a locallabour centre for peripheries along the border whichnow belong to Miskolc, forming a concave LLS.
Debrecen (HU) – Oradea (RO)Development has started, but this border area hasonly recently begun to allow free movement ofresources (from the beginning of 2007). However,the two cities – Debrecen and Oradea – are of asimilar character: they are strong regional centresand share similarities in terms of ethnicity, thusalso having a language advantage.
Nyíregyháza (HU) – Berehovo (UA)Co-operation has started: in 2007, the two townsbecame partner towns. Despite their proximity, thereis a huge challenge, due to the fact that Ukraine willnot become a EU member state in the short term,rather it will remain a neighbouring or partner countryonly. This means that people coming from Bregovorequire a visa and several bureaucratic difficulties hinderfree movement. For this reason, employment in theblack economy is high in this cross-border area.
Triple border Hungary-Romania-SerbiaThe border region shows potentials not only withinthe boundaries of the EU but also outside, as thereare three countries involved, including Serbia whichhas hopes of accession in the long run. The regionincludes several strong regional centres and some
supplementary smaller towns. There is a high levelof institutionalised cooperation in the form of aEuregion Four countries border the region (Hungary,Austria, Slovenia and Croatia).
As the border section between Hungary and Sloveniais small, this area in fact can be considered asstretching into the territories of four countries: Austria,Slovenia, Croatia and Hungary, of which three are EUmember states and one is a candidate country. Thereis a mixture of ethnic minorities of all four nations inthis region. The territory is predominantly rural and insome cases faces restructuring problems, but thearea’s characteristics show good perspectives fordevelopment, including the development of trans-European corridor V (Budapest-Zagreb-Ljubljana) theextension of the potential development triangle ofHungary south of Maribor. The region has well-pre-served natural assets which need to be built on,under the principles of sustainable development.Towns affected include: Nagykanizsa (HU), Zalaeger-szeg (HU), Murska Sobota (SI), Ptuj (SI), Maribor (SI),Graz (AT), Cakovec (CRO) and Zagreb (CRO).
Taking into consideration Slovenia’s small size, open bordersand geo-strategic location at the crossroads betweenCentral Europe, the Mediterranean, and South-East Europe,the existing cross-border links and networks between urbanareas in Slovenia and cross-border regions in Austria, Italy,Hungary and Croatia need to be strengthened further,through the institutionalisation of cross-border, inter-regionaland trans-national urban networks within new EU regions.
Box 10:Alpe-Adria Working Community
The Alps-Adriatic Working Community (Alpe-Adria) was established in 1978, as an importantstep towards a new future for Europe. This cross-border and inter-regional association’s main taskis joint informative expert treatment and co-ordinationof issues, in the interest of the current members.The current members are countries, counties,and regions from: Austria (Burgenland, Carinthia,Upper Austria and Styria), Italy (Friuli-Venezia-Giulia, Lombardia and Veneto), Hungary (Bara-nya, Somogy, Vas and Zala), Croatia andSlovenia. The Alps-Adriatic territory covers a totalarea of 190,423 km² and is home to about 26 millionpeople. The Alps-Adriatic Working Communityhas no legal status or central administration andthe costs of its activities are borne by each memberstate itself. The most important projects have
ˆ
repus_FINALREPORT.qxd 2007. 09. 20. 16:27 Page 71
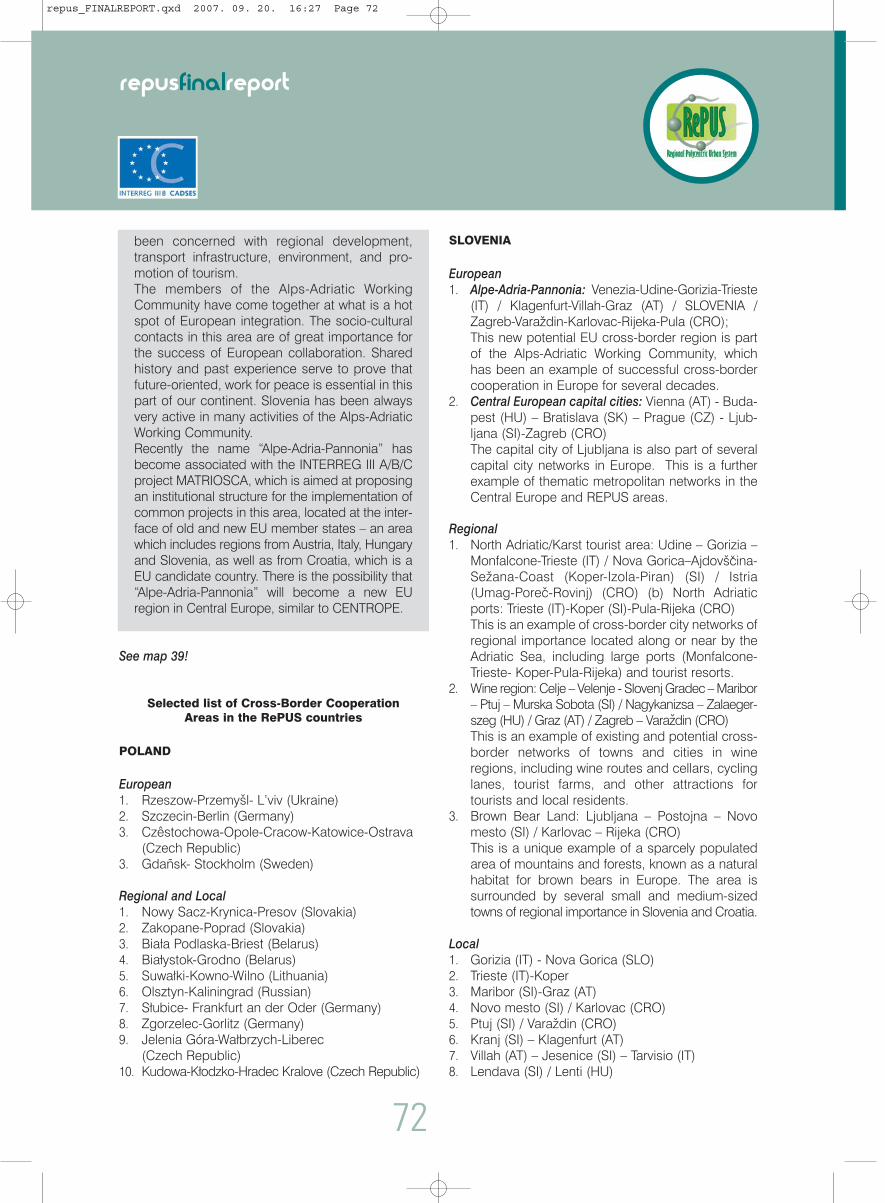
been concerned with regional development,transport infrastructure, environment, and pro-motion of tourism. The members of the Alps-Adriatic WorkingCommunity have come together at what is a hotspot of European integration. The socio-culturalcontacts in this area are of great importance forthe success of European collaboration. Sharedhistory and past experience serve to prove thatfuture-oriented, work for peace is essential in thispart of our continent. Slovenia has been alwaysvery active in many activities of the Alps-AdriaticWorking Community. Recently the name “Alpe-Adria-Pannonia” hasbecome associated with the INTERREG III A/B/Cproject MATRIOSCA, which is aimed at proposingan institutional structure for the implementation ofcommon projects in this area, located at the inter-face of old and new EU member states – an areawhich includes regions from Austria, Italy, Hungaryand Slovenia, as well as from Croatia, which is aEU candidate country. There is the possibility that“Alpe-Adria-Pannonia” will become a new EUregion in Central Europe, similar to CENTROPE.
See map 39!
Selected list of Cross-Border CooperationAreas in the RePUS countries
POLAND
European1. Rzeszow-Przemysl- L’viv (Ukraine)2. Szczecin-Berlin (Germany)3. Czêstochowa-Opole-Cracow-Katowice-Ostrava
(Czech Republic)3. Gdañsk- Stockholm (Sweden)
Regional and Local1. Nowy Sacz-Krynica-Presov (Slovakia)2. Zakopane-Poprad (Slovakia)3. Biala Podlaska-Briest (Belarus)4. Bialystok-Grodno (Belarus)5. Suwalki-Kowno-Wilno (Lithuania)6. Olsztyn-Kaliningrad (Russian)7. Slubice- Frankfurt an der Oder (Germany)8. Zgorzelec-Gorlitz (Germany)9. Jelenia Góra-Walbrzych-Liberec
(Czech Republic)10. Kudowa-Klodzko-Hradec Kralove (Czech Republic)
72
SLOVENIA
European1. Alpe-Adria-Pannonia: Venezia-Udine-Gorizia-Trieste
(IT) / Klagenfurt-Villah-Graz (AT) / SLOVENIA /Zagreb-Varazdin-Karlovac-Rijeka-Pula (CRO);This new potential EU cross-border region is partof the Alps-Adriatic Working Community, whichhas been an example of successful cross-bordercooperation in Europe for several decades.
2. Central European capital cities: Vienna (AT) - Buda-pest (HU) – Bratislava (SK) – Prague (CZ) - Ljub-ljana (SI)-Zagreb (CRO)The capital city of Ljubljana is also part of severalcapital city networks in Europe. This is a furtherexample of thematic metropolitan networks in theCentral Europe and REPUS areas.
Regional1. North Adriatic/Karst tourist area: Udine – Gorizia –
Monfalcone-Trieste (IT) / Nova Gorica–Ajdovšcina-Sezana-Coast (Koper-Izola-Piran) (SI) / Istria(Umag-Porec-Rovinj) (CRO) (b) North Adriaticports: Trieste (IT)-Koper (SI)-Pula-Rijeka (CRO)This is an example of cross-border city networks ofregional importance located along or near by theAdriatic Sea, including large ports (Monfalcone-Trieste- Koper-Pula-Rijeka) and tourist resorts.
2. Wine region: Celje – Velenje - Slovenj Gradec – Maribor– Ptuj – Murska Sobota (SI) / Nagykanizsa – Zalaeger-szeg (HU) / Graz (AT) / Zagreb – Varazdin (CRO)This is an example of existing and potential cross-border networks of towns and cities in wineregions, including wine routes and cellars, cyclinglanes, tourist farms, and other attractions fortourists and local residents.
3. Brown Bear Land: Ljubljana – Postojna – Novomesto (SI) / Karlovac – Rijeka (CRO)This is a unique example of a sparcely populatedarea of mountains and forests, known as a naturalhabitat for brown bears in Europe. The area issurrounded by several small and medium-sizedtowns of regional importance in Slovenia and Croatia.
Local1. Gorizia (IT) - Nova Gorica (SLO)2. Trieste (IT)-Koper3. Maribor (SI)-Graz (AT)4. Novo mesto (SI) / Karlovac (CRO)5. Ptuj (SI) / Varazdin (CRO)6. Kranj (SI) – Klagenfurt (AT)7. Villah (AT) – Jesenice (SI) – Tarvisio (IT)8. Lendava (SI) / Lenti (HU)
repusfinalreport
ˆ
ˆ
ˆ
ˆ
ˆ
ˆ
ˆ
repus_FINALREPORT.qxd 2007. 09. 20. 16:27 Page 72
9. Gornja Radgona (SI) – Bad Radgensburg (AT)10. Rogaška Slatina-Rogatec (SI) / Krapina (CRO)11. Cividale (IT) / Kobarid-Tolmin (SI)
This is a list of existing cross-border bilateral linksbetween urban areas of various sizes, located on theborders between Slovenia and Italy, Austria, Croatiaand Hungary. There are various kinds of cross-borderslinks and connection – economic, cultural, environmental,institutional, family-related, etc.; some of them aresupported with EU structural funds.
AUSTRIA
European1. CENTROPE comprises the federal provinces of
Vienna, Lower Austria and Burgenland (AT), SouthMoravia Region (CZ), Bratislava and TrnavaRegions (SK), as well as Gyõr-Moson-SopronCounty (HU)
2. Alpe-Adria-Pannonia: state governments of Styria,Carinthia, Burgenland (AT), autonomous region FriuliVenezia Giulia, Veneto Region (IT), Republic ofSlovenia, counties of Zala, Baranya, Gyõr – Moson –Sopron, Somogy, Vas, Tolna County (HU), Koprivnica– Krizevci County, Region of Istria and VarazdinCounty (additional partner) (HR), AutonomousProvince of Vojvodina (SCG as additional partner)
Regional 1. EUREGIO West/ Pannonia (HU/AT)2. EUREGIO Region Weinviertel-South Moravia-West
Slovakia (CZ/AT/SK)3. EUREGIO Styria-Slovenia (AT/SI)4. EUREGIO Bayerischer Wald – Böhmerwald –
Unterer Inn (D, CZ,AT)5. EUREGIO Silva Nortica (CZ/AT)6. ARGE Kärnten-Slowenien (AT/SI)7. CITYNET: Brunn am Gebirge, Schwechat,
Hainburg, Bad Deutsch Altenburg, Himberg,Bruck an der Leitha, Eisenstadt, Gloggnitz, Ternitz,Baden, Oberwart, Pinkafeld, Güssing, Jennersdorf(Austria) - Szentgotthárd, Körmend, Vasvár, Szom-bathely, Sárvár, Köszeg, Sopron, Mosonmagyaró-vár, Gyõr, Fertõd, Kapuvár, Tét (Hungary)
HUNGARY
European 1. Austria-Slovakia-Hungary-
Two capitals involved (Bratislava-Wien)
HU: Gyõr, Mosonmagyaróvár, Sopron, SzombathelySK: Bratislava, TrnavaAT: Wiener Neustadt, Eisenstadt
2. Four countries border regions (Hungary-Austria-Slovenia-Croatia)The building of the highway Budapest-Zagreb-Ljubljana (trans-European corridor V). Townsinclude: Nagykanizsa (HU), Zalaegerszeg (HU),Murska Sobota (SI), Ptuj (SI), Maribor (SI), Graz(AT), Zagreb (CRO)
Regional1. Axis of Western Slovakia-Hungary
Several smaller towns included:Komárom (HU) – Komárno (SK)Esztergom (HU) – Stúrovo (SK)
2. Couple: Miskolc (HU) – Košice (SK)Miskolc Košice
3. Debrecen (HU) – Oradea (RO)4. Triple border Hungary-Romania-Serbia
Towns included: Szeged, Hódmezõvásárhely, Ma-kó, Békéscsaba, Gyula, Arad (RO), Timisoara(RO), Subotica (SRB)
CZECH REPUBLIC
European1. Centropa: Brno – Wien (Austria) – Bratislava
(Slovak) – Gyõr – Budapest (HU)2. Ostrava – Katowice, Cracow (PL)3. Ceské Budejovice – Plzen – Linz (Austria) –
Regensburg (Germany)4. Euroregion Nisa: Liberec – Zittau – Görlitz
(Germany) – Zgorzelec – Jelenia Góra (PL)
Regional1. Ústí nad Labem / Decín – Dresden (Germany)2. Zwickau / Plauen (D) – Cheb (CZ) – Hof – Nürnberg (D) 3. Kudowa / Klodzko (PL) – Náchod – Hradec
Králové / Pardubice (CZ) 4. within the Centropa region: Wien, Waidhofen,
Amstetten, Krems, Hollabrunn, Mistelbach (A) – Veselína Morave, Hodonín, Znojmo, Brno, Gmünd(A)/CeskéVelenice(CZ), Ceské Budejovice (CZ)
5. within the Euroregion Nisa: Liberec, Jablonec nadNisou (CZ) – Zittau, Görlitz (D)/ Zgorzelec (PL)(N.B.: Görliz and Zgorzelec is the same town dividedbetween D and PL)
6. within the Upper Silesian Region: Opava, Ostrava,Ceský Tešín (CZ) – Racibórz, Cieszyn, Bielsko-Biala, Zywiec, Katowice (PL) – Cadca, Zilina (SK)
73
repusfinalreport
ˆ
ˆ
ˆˆ
ˆˆ ˆ
ˆˆ
ˆˆ
ˆ
ˆ ˆ
repus_FINALREPORT.qxd 2007. 09. 20. 16:27 Page 73

2.5 Typology of LLS(cluster analysis)
A further step forward for identifying the specificity ofsmall to medium-sized towns in the urban settlementsystem has been achieved with LLS typology, bymeans of cluster analysis.
I. A list of selected indicators – including population,economic (GVA, productivity, revenue at disposal),unemployment rate, employment by sectors, FDI,human resources quality (education) – have beenapplied to cluster analysis;
II. The basic criteria for grouping the clusters hasbeen population size, taking the average clusterpopulation6 for small / medium / large towns andcities (LLS) in order to find possible links betweensize and performance.
The results by country remain highly specific, as thetypology reflects the unique features of the individualsuburban grouping of cities (LLS), within the frameworkof the national settlement system. However, somecomparisons between countries can be made (seeFigure 5) for highlighting specific patterns, by size andperformance. Some preliminary considerations are:
a) Metropolitan areas:
• The main metropolitan areas which include thecapital cities perform extremely well, since they area focus point for the best human resources, beingmore attractive. They show higher economic per-formance, high services delivery and less socialdistress (lower unemployment). Some of the largemetropolitan areas, for example Naples in Italy arean exception to this, since they show some poorresults (productivity) and a high rate of unemploy-ment.
b) Large and medium-sized towns and cities:
• Many large and medium clusters of towns and citiesdemonstrate different strengths, depending either ontheir profile (economic) or/and their location (accessi-bility). In general, the best performing clusters arethose that have a larger than average population, incomparison with small clusters of towns and cities.
74
This may indicate that after the capital cities, secondtier towns and cities which are able to demonstrategood performances are most probably large or uppermedium-sized towns and cities. They are relevant orplay a strong role as regional/national centres anddemonstrate strong economic performance. Ofcourse, this does not signify that in absolute terms, thelarger the size, the better the performance. However,the multi-functional profile of larger towns and citiesmeans that they have a better chance of being moreattractive, as high-level, quality services are more eas-ily found in these towns and cities. In fact, there aremany medium-sized towns and cities that thanks toother, high quality features (cultural attractiveness,good environment, high standard of living, lack ofcongestion) are becoming very attractive. These arealso those towns and cities which are part of the betterperforming clusters, depending on the national contexts.
• Clusters of medium-sized towns and cities which per-form poorly are those that are affected by industrialdecline (see Czech Republic, Hungary and Poland) orwhich have weaker functions. Furthermore, they areoften near densely urbanised areas, where dominantlarge towns and cities are to be found, or indepressed regions or peripheral locations. Isolatedtowns and cities can hardly overcome the low level ofactivity or the lack of qualified resources in the contextof their regional economy.
c) Small Towns
• Most clusters of small and very small towns seem toperform most poorly in comparison with all other typesof clusters, unless they have specialised in eithertourism or heavy engineering or industry. In somecases, they have become a strong focus for FDI (seethe Hungary cluster), which can also explain impressiveperformance. The relation between size and performancefor small towns, implies that their attractiveness reliesexclusively on their capacity to specialise in one or a fewselected functions, as due to their small size, they do nothave the capacity to be multi-functional.
• Small towns in the vicinity of metropolitan areasare adversely affected by positive effects, for thediffusion of wealth, or negatively, if this creates anoutflow of people and increase in ageing popula-tion. It is obvious that the relationship betweensmall towns and medium to large towns and cities
repusfinalreport
6 The references to population size has not been taken as a rigid standard criteria but only as indicative way : down from 60.000 inhabitants considered Small; from 60.000 up to 200.000 as Medium, and up Large.
repus_FINALREPORT.qxd 2007. 09. 20. 16:27 Page 74

is essential for identifying the place of the formerthat, for their limited population size cannot have acritical mass for exerting a strong isolated function.The hierarchical relation in this case primes over
• Clusters of small towns related to agriculture areusually associated with poor economic performance(low productivity or GVA per capita). This is particularlyan issue in the rural areas of new members of theEuropean Union, but also in regions of SouthernItaly, which are weaker in relative terms. Small townsdemonstrate very poor performance, which indicatesthat they are undergoing serious decline.
It is relevant to underline the linkages between cities'performance and overall regional conditions. A largecity can become the motor of the regional economy ifhas strong qualified functions and attraction capacity:in this case positive spin-off can take place in thesurrounding regional economy. Instead, in a pooreconomic regional environment and/or peripheralregion, an isolated medium or Small Town can hardlybecome strong motor for development of the region:on the opposite, the town can become the worstimage of the low regional profile. These different out-comes suggest that a strategy for improving urbancompetitiveness and favouring urban re-generationcannot be pursued outside the regional context wherecities and towns are located.
Furthermore, below are the two indicators used for theabove table, in order to make comparisons of relativeeconomic performance. Each country has adopteddifferent economic indicators and for this reason, it isnot possible to make comparisons between countries.Instead, they are only viewed as being results for theclusters within each individual country (internalcountry performance level).
On average, each country has eight clusters (theCzech Republic has six). The number of clusterswhich demonstrate above average economicperformance is relatively limited: around 50% (forPoland and Hungary) and 30% – 40% (for the CzechRepublic, Slovenia and Italy) of all clusters.
These results indicate that generally, there are greatdisparities in the performances of the city clusters, Theanalysis is completed by other social and demo-graphic indicators which have served the identificationof the typology, including ageing population, migrationflows, unemployment, productivity and attractivenessfor FDI.
75
repusfinalreport
Table 3: Selected indicators of Cluster Analysis
POLANDPopulation Size
Average bycluster
EconomicIndicator
Budget revenues ofcommunes ( )
HUNGARYPopulation Size
Average bycluster
EconomicIndicator
Productivity ( )
CZECHREPUBLIC
Population SizeAverage by
cluster
EconomicIndicator
Income per capita atdisposal ( )
SLOVENIAPopulation Size
Average bycluster
EconomicIndicator
GVA per capita ( )
ITALYPopulation Size
Average bycluster
EconomicIndicator
GVA per capita ( )
Cluster 1
Cluster 2
Cluster 3
Cluster 4
Cluster 5
Cluster 6
Cluster 7
Cluster 8
Cluster 1
Cluster 2
Cluster 3
Cluster 4
Cluster 5
Cluster 6
Cluster 7
Cluster 8
Cluster 1
Cluster 2
Cluster 3
Cluster 4
Cluster 5
Cluster 6
Cluster 7
Cluster 8
Cluster 1
Cluster 2
Cluster 3
Cluster 4
Cluster 5
Cluster 6
Cluster 7
Cluster 8
Cluster 1
Cluster 2
Cluster 3
Cluster 4
Cluster 5
Cluster 6
10004636
217987
78726
115211
90600
87604
66910
54009
1795
1820
1475
1333
1813
1374
1312
1411
2865417
151413
41230
35711
31848
26443
22677
9552
5272
1234
826
1249
877
639
4678
869
540922
78846
78227
29273
17337
31602
21651
20083
10608
6967
7826
5247
3355
3859
4342
2857
3175132
2235602
779958
196000
104000
27390
21053
13815
31980
15944
24464
24017
17209
18164
9012
18851
41908
40347
59664
250194
29584
1484361
6189
6928
6792
7273
6456
9180
repus_FINALREPORT.qxd 2007. 09. 20. 16:27 Page 75
76
repusfinalreport
and less competitive in comparison withcompetitors further east. However, the existingcluster may have the potential to transformationitself into a more advanced and consequentlymore competitive cluster over the long term.
POLANDMetropolisCluster 1: Developed and potential metropolitan areasThis cluster includes the group of 16 LLS of the largestcities in Poland and the Regions’ capitals. These aredeveloped metropolitan areas (Warsaw, Cracow,Gdañsk, Poznañ, Wroclaw, Lodz and Katowice) andpotential metropolitan areas (Zielona Góra, the bipolarsystem of Bydgoszcz-Toruñ, Opole, Olsztyn, Bialystok,Lublin, Kielce, and Rzeszów). This group is characterizedby favourable population dynamics and the highestpopulation density, best developed university andeducational facilities, high budget revenues and thelowest unemployment levels.
Large to medium-sized towns and citiesCluster 2: Developing large and medium-sized townsand cities This cluster embraces a group of 27 LLS of large citiesand medium-sized towns that have the highest communebudget revenues and report the largest populationincrease. Some of them are strong, restructuredindustrial centres. High commune budget revenueshave placed in that group also other smaller centres,though marked by a better economic situation, whichare border towns, that is Slubice and Zgorzelec.
Cluster 3: Medium-sized, developing regional centres This cluster embraces a group of 38 medium-sizedregional centres, located in agricultural areas of lowpopulation density and unemployment and withcommune budget revenues at the national average.They are important centres that provide services toagricultural areas, including those related toeducation and culture (Zamosc, Biala Podlaska,Suwalki), as well as tourist centres (Augustów,Tuchola, Ostrolêka). This group can be found inEastern and Central Poland.
Cluster 4: Medium-sized regional centres, locatedalong main transport routesThis cluster embraces a group of LLS of 38 medium-sizedtowns, with good transport accessibility and important
The analysis is completed by other social anddemographic indicators which have served theidentification of the typology, including ageing population,migration flows, unemployment, productivity andattractiveness for FDI.
Box 11Economic clusters of the automotive industry– the case of the Czech and Slovak Republics:
small and medium-sized towns and cities,which are highly specialised and internationally
competitive
A cluster of automotive manufacturing hasdeveloped in the countries of Central andEastern Europe. This cluster originated withplants which had existed before the economictransition. These plants were bought andrefurbished by multi-national companies in the1990s (Škoda in Mladá Boleslav CZ was boughtby Volkswagen). Over the last decade, newplants opened on greenfield locations, utilizingthe available workforce released through thecollapse of other branches of local manufacturingindustries. These plants typically co-operate with“mother” establishments outside the country,such as Volkswagen in Germany, Toyota inJapan, KIA in Korea, etc. In these cases, theCentral and Eastern European plants act asmere assembly plants for models from the“mother” production sites. (See Map 40)
Selected older plants that produce parts neededfor car production (lighting, brakes, tyres,windscreens, etc.) underwent the same processof being bought and refurbished and joined thenetwork, making up a cluster of car-relatedmanufacturing adjacent to the basic manufacturers.
The emergence of clusters for the automotiveindustry is a Central and Eastern Europeanresponse to the challenge of globalisation and isreflected in the Territorial Agenda of the EU underPriority 3 – support for clusters for competitiveand innovative activities. This response isadequate to the transitional period of the 1990sand early 2000s, when the competitiveness ofthe national economics in the region lay in thecheap, well-qualified labour force, accessibility tothe emerging markets of Eastern Europe andemerged environmental concerns. As such, it willprobably prove transitory, if the EU integrationprocess makes the workforce more expensive
, ,
repus_FINALREPORT.qxd 2007. 09. 20. 16:27 Page 76

77
repusfinalreport
Figures 5: Economic Performance of Clusters
repus_FINALREPORT.qxd 2007. 09. 20. 16:27 Page 77
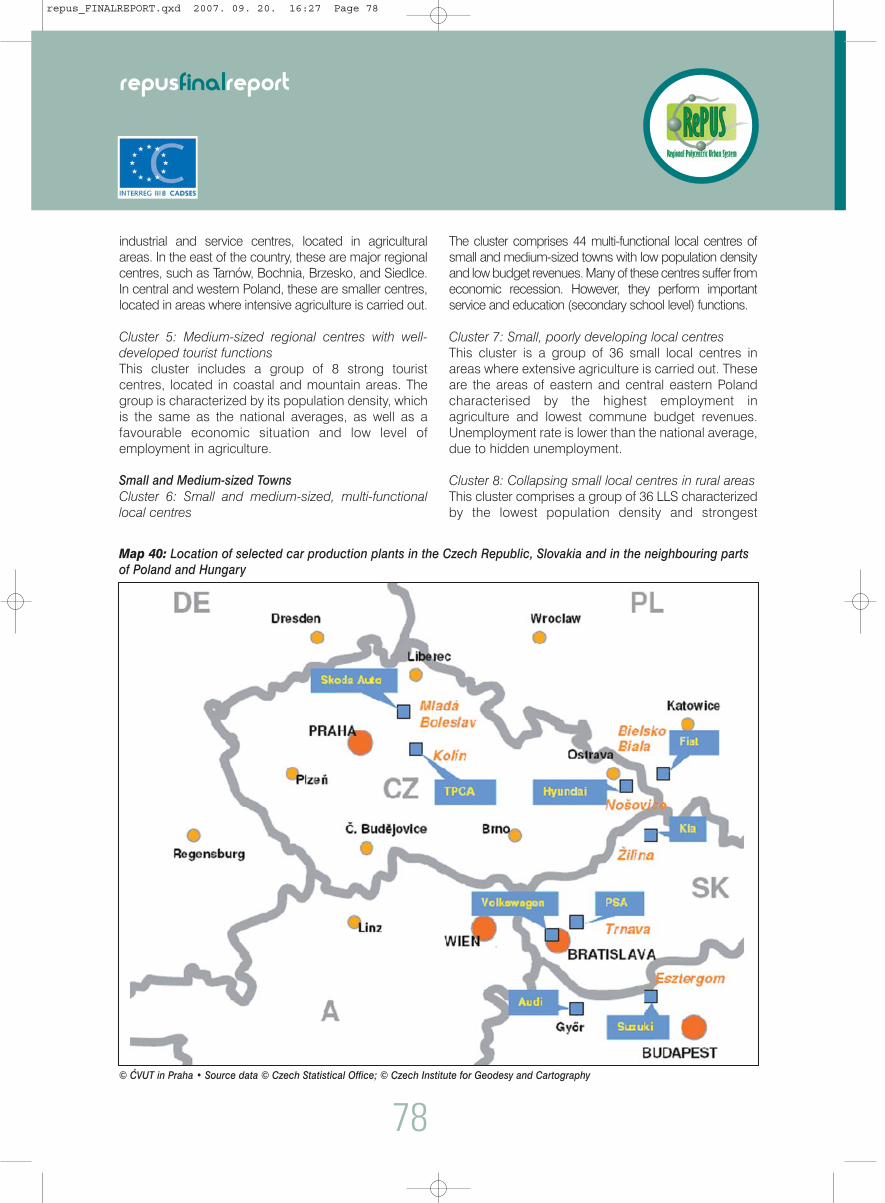
78
repusfinalreport
© CVUT in Praha • Source data © Czech Statistical Office; © Czech Institute for Geodesy and Cartography
ˆ
industrial and service centres, located in agriculturalareas. In the east of the country, these are major regionalcentres, such as Tarnów, Bochnia, Brzesko, and Siedlce.In central and western Poland, these are smaller centres,located in areas where intensive agriculture is carried out.
Cluster 5: Medium-sized regional centres with well-developed tourist functionsThis cluster includes a group of 8 strong touristcentres, located in coastal and mountain areas. Thegroup is characterized by its population density, whichis the same as the national averages, as well as afavourable economic situation and low level ofemployment in agriculture.
Small and Medium-sized TownsCluster 6: Small and medium-sized, multi-functionallocal centres
The cluster comprises 44 multi-functional local centres ofsmall and medium-sized towns with low population densityand low budget revenues. Many of these centres suffer fromeconomic recession. However, they perform importantservice and education (secondary school level) functions.
Cluster 7: Small, poorly developing local centres This cluster is a group of 36 small local centres inareas where extensive agriculture is carried out. Theseare the areas of eastern and central eastern Polandcharacterised by the highest employment inagriculture and lowest commune budget revenues.Unemployment rate is lower than the national average,due to hidden unemployment.
Cluster 8: Collapsing small local centres in rural areasThis cluster comprises a group of 36 LLS characterizedby the lowest population density and strongest
Map 40: Location of selected car production plants in the Czech Republic, Slovakia and in the neighbouring partsof Poland and Hungary
repus_FINALREPORT.qxd 2007. 09. 20. 16:27 Page 78
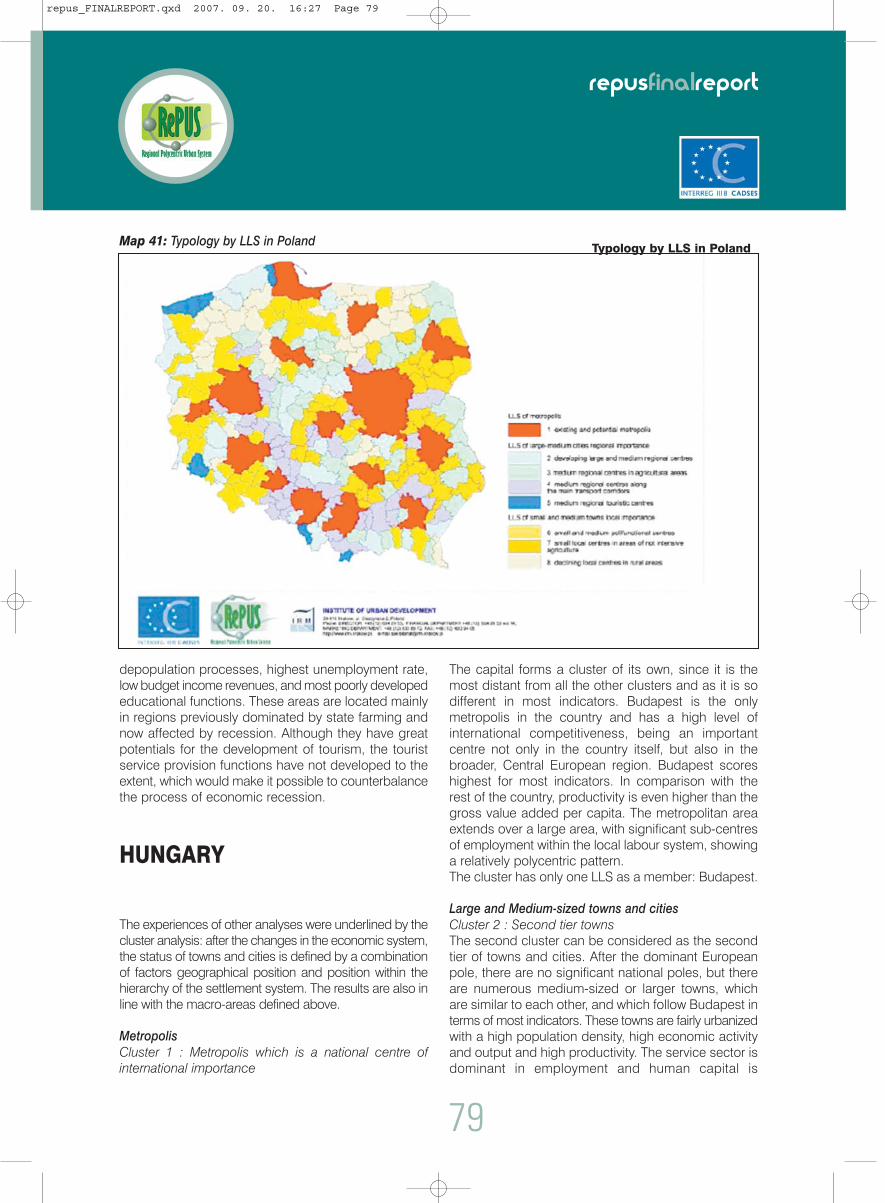
79
repusfinalreport
Map 41: Typology by LLS in Poland
depopulation processes, highest unemployment rate,low budget income revenues, and most poorly developededucational functions. These areas are located mainlyin regions previously dominated by state farming andnow affected by recession. Although they have greatpotentials for the development of tourism, the touristservice provision functions have not developed to theextent, which would make it possible to counterbalancethe process of economic recession.
HUNGARY
The experiences of other analyses were underlined by thecluster analysis: after the changes in the economic system,the status of towns and cities is defined by a combinationof factors geographical position and position within thehierarchy of the settlement system. The results are also inline with the macro-areas defined above.
MetropolisCluster 1 : Metropolis which is a national centre ofinternational importance
The capital forms a cluster of its own, since it is themost distant from all the other clusters and as it is sodifferent in most indicators. Budapest is the onlymetropolis in the country and has a high level ofinternational competitiveness, being an importantcentre not only in the country itself, but also in thebroader, Central European region. Budapest scoreshighest for most indicators. In comparison with therest of the country, productivity is even higher than thegross value added per capita. The metropolitan areaextends over a large area, with significant sub-centresof employment within the local labour system, showinga relatively polycentric pattern.The cluster has only one LLS as a member: Budapest.
Large and Medium-sized towns and citiesCluster 2 : Second tier towns The second cluster can be considered as the secondtier of towns and cities. After the dominant Europeanpole, there are no significant national poles, but thereare numerous medium-sized or larger towns, whichare similar to each other, and which follow Budapest interms of most indicators. These towns are fairly urbanizedwith a high population density, high economic activityand output and high productivity. The service sector isdominant in employment and human capital is
Typology by LLS in Poland
repus_FINALREPORT.qxd 2007. 09. 20. 16:27 Page 79

80
repusfinalreport
increased in place. There is a high educational levelachieved through significant knowledge centres, as arelatively large number of students are enrolled in theeducational institutions of these towns.Geographically the second tier means a balanced net-work of county capitals and complementary capitals, withan even distribution around the country; they form a ringaround the Budapest LLS with some additional towns.There are 26 LLSs included in the cluster includingSopron, Veszprém, Debrecen, Pécs, Eger, Gyõr,Miskolc and Szeged
Small and Medium-sized Towns and CitiesCluster 3: Tourist townsThe lack of national centres and the high number ofLLSs in the second tier after Budapest are followed bythe other clusters, all of which are significantly smaller.Of these, the groups of largest towns is small, as thereare only three towns included in this cluster, however,these have been identified as important types. Thethree LLSs identified in this group show endogenousdevelopment based on natural assets and tourism,operated mostly through national capital, which mayresult in somewhat more modest but sustainable development,if the resources are used in a wise way. These towns arewinners in terms of migration, though they face the
problem of high natural population decrease and anegative population balance. The towns are situatedalong the shore of Lake Balaton and serve as importantcentres in the life of the Balaton region.
Cluster 4: Industrial enginesTowns included in this cluster can be regarded as industrialengines of development. These are towns which havesurvived the recession of the nineties and due to severalfactors, including good accessibility, attracted foreigninvestment. This means that at the present time, a highrate of activity has been achieved, mostly by foreigncompanies. Almost half of the employed are present inindustry, thus reaching the highest level for the rate ofindustrial employment in the country. There is a risk ofvulnerability to the changes of global economic processes,as industrial production could be shifted in the directionof cheaper labour in the future.There are 25 LLSs included in the cluster.
Cluster 5: Rural centresThese rural towns with low population density arecharacteristic on the southern Great Plain. Thoughthere are some in the northern part of the Plain and inSouthern Transdanubia, these towns are typical in thearea around Szeged. These towns are characterized
Map 42: Typology by LLS in Hungary
repus_FINALREPORT.qxd 2007. 09. 20. 16:27 Page 80

by their rural character not only in terms of populationdensity, but also because agricultural employment isrelatively high in comparison to the rest of the clusters.The educational level in this cluster can be consideredas low and productivity is also low.There are 29 LLSs included in this cluster.
Cluster 6: Small, under developed townsThese towns are predominantly in the crisis areasidentified above as macro areas. These towns areunder-developed and they have low scores for mostsocioeconomic indicators: the lowest activity, outputand productivity is present in these areas. The highrate of emigration is accompanied by populationincrease, due to the fact that these regions are notonly in a low position, but are places where certain layersof society are segregated, with a high ratio of Romapopulation and the formation of rural ghettos, excludedfrom socioeconomic processes. This exclusion alsohas a strong spatial character, since accessibility islowest in these areas. It should be pointed out thatthere are limitations in the local labour systems, asthere are some areas which lack even an employmentcentre and are attached to a larger town with largerlabour market further away. Those regions are notincluded in this cluster, even though it is in thoseregions that problems are the most severe.
Cluster 7: Industrial „tigers“This cluster contains only a few members, but it is stillvery important as these are significantly different fromall other clusters. These towns are very small in size,but show a very high output, based on one or maybea few plants with high industrial production. Theseplants are either assembling factories for multi-nationalcompanies or are part of the energy sector, such asthe nuclear power plant at Paks. The gross valueadded in these towns is extremely high, even whenproductivity is taken into account. Mention should bemade of two phenomena: the values of gross valueadded, especially in the case of multi-national companiesmay be distorted by companies’ internal accountingsystems; such distortion may be greater in the case ofsuch small towns. Also, it should be noted, that thevulnerability to global economic processes in thesetowns is higher than in the case of cluster 4, since forthese towns, the size of the LLS is smaller and thestructure of the local economy is unbalanced: it isbased on one sector only and in some cases on onlyone company; although this is not valid for the energysector.There are 5 LLSs included in the cluster: Paks; Komá-rom; Tab; Répcelak; Visonta.
Cluster 8: Small towns specialised in tourismThe smallest cluster in terms of size and number ofmembers is an interesting phenomenon and has beenretained, partly because these towns do not fit into anyother clusters and partly because they are a goodexample of sustainable, endogenous development.The cluster is formed by two minor towns with strongtourism, based on thermal resources. Both have theirown resources to build on and have a prosperous out-look, as the demand for wellness tourism as well asthe promotion of national thermal assets is expectedto grow. The activity level for the population and theoutput is modest, although as can been seen from thecase studies, Harkány dominates the nearby regionalcentre Pécs, as there are actually more commutersfrom Pécs to Harkány than the other way around. Astourism is very strong in both towns, the share ofemployment in services is the highest among all theclusters. The number of tourist beds exceeds the numberof inhabitants and there is a good base for furthersustainable development.There are 2 LLSs included in the cluster: Hévíz,Harkány.
The results of cluster analysis are in line with theidentification of macro areas. In the triangle of developmentidentified, most of the LLSs are from clusters withgood productivity levels, while the areas identified asproblem areas and under-developed regions mostlyhave LLSs from the lowest status cluster. Budapest isemerging from the rest of the country here, with a ringof second tier towns and industrial engines in its vicinity.However the growth poles identified in spatial policyare not emerging from the rest of the second tier,which means that although a policy aim exists to haveconcentrated development of counter-poles to Buda-pest, the real socio-economic processes still demonstratethe strength of a more extended, polycentric system ofmedium-sized towns, which are county capitals orcomplementary capitals.
CZECH REPUBLIC
Cluster characteristicsThe analysis resulted in identification of the followingsix clusters and their respective characteristics.Clusters 1 to 3 and 5 constitute larger continuous territorieswhile the Clusters 4 and 6 spread almost evenly in thecountry’s territory, but they are rather nodal and
81
repusfinalreport
repus_FINALREPORT.qxd 2007. 09. 20. 16:27 Page 81
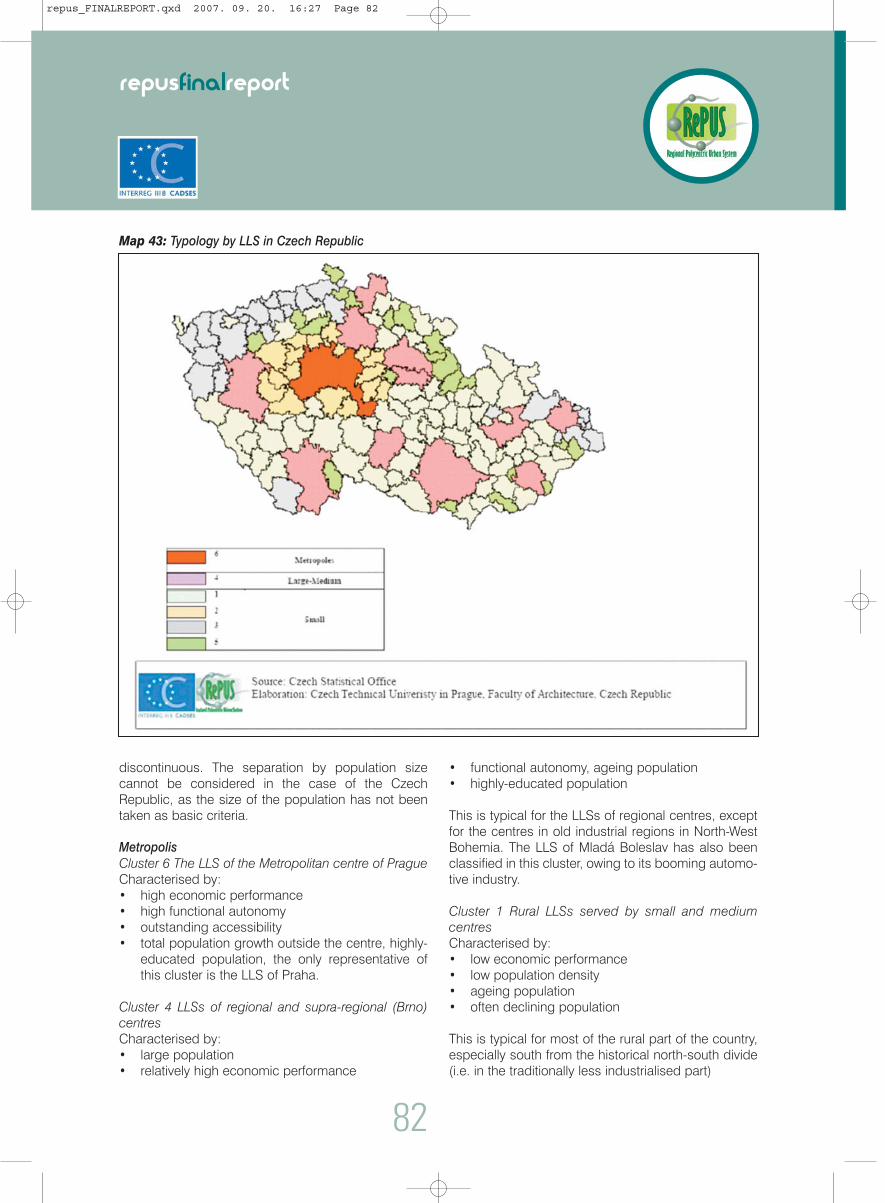
82
repusfinalreport
Map 43: Typology by LLS in Czech Republic
discontinuous. The separation by population sizecannot be considered in the case of the CzechRepublic, as the size of the population has not beentaken as basic criteria.
MetropolisCluster 6 The LLS of the Metropolitan centre of PragueCharacterised by:• high economic performance• high functional autonomy• outstanding accessibility• total population growth outside the centre, highly-
educated population, the only representative ofthis cluster is the LLS of Praha.
Cluster 4 LLSs of regional and supra-regional (Brno)centresCharacterised by:• large population• relatively high economic performance
• functional autonomy, ageing population• highly-educated population
This is typical for the LLSs of regional centres, exceptfor the centres in old industrial regions in North-WestBohemia. The LLS of Mladá Boleslav has also beenclassified in this cluster, owing to its booming automo-tive industry.
Cluster 1 Rural LLSs served by small and mediumcentresCharacterised by:• low economic performance• low population density• ageing population• often declining population
This is typical for most of the rural part of the country,especially south from the historical north-south divide(i.e. in the traditionally less industrialised part)
repus_FINALREPORT.qxd 2007. 09. 20. 16:27 Page 82

Cluster 2: LLSs with increasing dependence on themetropolisCharacterised by:• weak functional autonomy• demographically old population but high immigra-
tion rates with demographically younger immi-grants
The LLS of this cluster were identified only in themetropolitan hinterland of Praha; they cover almostentirely the Central Bohemian Region. The non-xistence of this type of LLSs in the hinterland of otherregional centres, namely Brno are evidence of theexclusive position of the capital region. However, in theBrno case the large size of the Brno LLS suggests thatthe agglomeration process already included most ofthe prospective Cluster 2 LLSs.
Cluster 3: Old industry-based LLSs structurally affectedby de-industrialisationCharacterised by:• high unemployment rate• high emigration• demographically young population
This cluster is typical for LLSs in the NUTS2 RegionNorth-West and NUTS2 Region Moravia-Silesia, bothurban and rural. It is only Ostrava LLS in NUTS2 whichbelongs to the other cluster of regional centres, unlikeother regional centres of Ústí nad Labem and KarlovyVary, in which cases the economic and socialcharacteristics prevail over the position of regional centres.
Cluster 5: Small LLSsIt is difficult to characterise this cluster in a similar way.In general, the common features are:• low population size• relatively low economic performance• demographically young population• weak centres with relatively small FUAs• very low functional autonomy
However, within this cluster, several quite diverse typologiesof LLSs and FUAs are included. A subgroup can be identifiedthat involves traditionally industrialised rural parts of thecountry, mostly textile and other types of light industry,which was traditionally rather dispersed in small townsand even villages, rather than concentrated in largertowns (North-East Bohemia). The rest of the cluster israther heterogeneous and the LLSs can be interpretedonly in regional context. They span from thriving Trebonwith its attractive spa and tourist industry to deprived LLSse.g. in Walachia (the eastern part of Moravia-Silesia).
SLOVENIA
MetropolisCluster 1 : MEGA LjubljanaMetropolitan area of the capital city Ljubljana, withhigh values for all indicators (demographic, econom-ic, services), but with a lower level of tourist capacitiesand lower share of university-educated population inthe overall population of the large LLS.
Large to Medium-sized towns and citiesCluster 2 : Dynamic regional poleCoastal conurbation or city cluster (polycentric morphologicaland functional) of international importance comprisingthree towns Koper-Izola-Piran and other urban settlementson the Adriatic coast, near the border with Italy andCroatia; the port of Koper is importance on a Europeanlevel. There is high density, higher population growth,ageing population, a high rate of immigrants, very highrate of employment in services and tourist capacities,high GVA and productivity, high number of studentsand very high share of university-educated population,good accessibility, but lower FDI.
Cluster 3 : Second tier regional polesLarger urban areas consisting of the most importantregional centres (Maribor, Celje, Kranj, Nova Gorica, Novomesto, Velenj, Zasavje (Trbovlje-Hrastnik)), show highervalues for certain indicators, e.g. population growth,density, GVA and productivity, employment in industry,number of students, accessibility, but lower share ofuniversity-educated population, tourist capacities and FDI.
Small townsCluster 4 : (sub) regional and local developing areasMedium and small-sized towns: Ptuj, Postojna, Krško,Slovenj Gradec (regional centres), Ajdovšcina, Škofja Loka,Šmarje pri Jelšah, Ribnica (small, suburban towns) andIdrija (strong local) are characterised by lower density andlocated near main regional poles (cluster 1-3). They alsohave population growth with low ageing (i.e. due to subur-banisation and lower property prices), average GVA with lowunemployment and higher employment in industry, averageFDI, average number of university-educated people with alower number of students and lower accessibility.
Cluster 5: small peripheral areas with higher FDI forindustryThese are small (industrial) towns (Crnomelj, Lenart,Mozirje, Ormoz) in low density peripheral and rural areas,
83
repusfinalreport
ˆ ˆˆ
ˆ
ˆ
repus_FINALREPORT.qxd 2007. 09. 20. 16:27 Page 83

84
repusfinalreport
Map 44: Typology by LLS in Slovenia
which have low GVA and a high share of FDI in GVA, aswell as higher employment in industry than in services,higher unemployment, low tourist capacities, averagelevel of education, no students and low accessibility.
Cluster 6 : (sub) regional and local areas under restruc-turingMedium and small-sized towns (Murska Sobota,Ravne na Koroškem (regional centres), Lendava,Zalec, Slovenske Konjice, Šentjur pri Celju) in industri-al and rural areas, population decline with low ageing,average GVA, low FDI, higher unemployment withemployment in industry, low level of higher educatedpopulation and students, lower accessibility.
Cluster 7 : tourist areasVery high tourist capacities in low density mountainareas in Western Slovenia at the border with Italy(Sezana, Tolmin) and Austria (Bled-Radovljica-Jesenice with Kranjska Gora), population decline withageing, lower level of university-educated population,
very low unemployment with higher employment inservices, low GVA, FDI and accessibility.
Cluster 8 : peripheral areas under restructuringMedium and small towns in low density (mountain andrural) peripheral border areas (mainly with Croatia –Brezice, Ilirska Bistrica, Kocevje, Ljutomer) and GornjaRadgona, Slovenska Bistrica, Sevnica, Radlje ob Draviin South East Slovenia NUTS 2 region, with loweraccessibility, population decline with ageing, low GVAand FDI, high unemployment, higher level of secondaryschool educated people and average tourist capacities.
ITALY
Italy typology completes the hierarchy analysis, as itgives deeper insights about the type and performance
ˆ
ˆ
ˆ
ˆ
repus_FINALREPORT.qxd 2007. 09. 20. 16:28 Page 84

Map 45: Typology by LLS in Italy
85
repusfinalreport
repus_FINALREPORT.qxd 2007. 09. 20. 16:28 Page 85

86
repusfinalreport
of urban settlements, organised on the basis of theirpopulation function.
The main spatial pattern of the Italian economyemerges again, as the disparities have a large effecton the various city clusters: the divide between themain macro-areas, north/centre/south are confirmedby the performances of the city clusters, with particularevidence for the large and medium-sized towns andcities. The North the highest performing large, ormedium cities, and even the small towns are moredynamic. The south retains few well performing largeand medium-sized towns and cities, whilst the smalltowns are among the worst performing. Apart from afew large agglomerations (cluster), the centre remainscharacterised by mixed performance.
MetropolisWhen considering the importance of the metropolitanareas in Italy, two main clusters are identified: the firstwith high performance and the second with lowperformance.
Cluster 1 – high performing metropolitan areas The two “capitals”: Rome and Milan, both highperforming, with strong national-international functions.
Cluster 2 – low performing metropolitan area Naples urban areas, since many socio-economicindicators show low performance, rather than itspotential for the population density, due to the largenumber of small towns in the vicinity.
Large and medium-sized towns and citiesGiven the weight of the numerous large to medium-sized towns and cities in Italy, they form the pillars ofthe urban settlements.
Cluster 3 – High performing large cities These play a strong role in the respective regions,but have a role which extends to a national or eveninternational level: Turin, Venice, Bologna, Genoa,Bari, Palermo and Catania. These cities have strongfunctions, good economic indicators and high quali-ty service delivery.
Cluster 4 – Dynamic regional towns and cities These are strong regional centres, densely located inthe north. They are above average for productivity andGVA per capita. Along with Cluster 1 and Cluster 3,they are the best performing towns and cities.
Cluster 5 – Moderately performing regional towns andcities from the second tier These are well-integrated into the northernregions, as they are made up of dense urbansettlement between large and medium-sizedcities. They are also present in the centre but lessso in the South. They show more mixed results, asthey include towns and cities which specialise inagricultural; this is particularly the case for thosein the south.
Small townsGenerally speaking, none of these attain the upperlevels performance, although it depends on theirprofiles and positioning: i.e. whether they are dynamicand specialised.
Cluster 6 – Small towns with clear functions These have good employment capacity and lowunemployment rates, low density because many are inthe foothills of mountains (Alps and Apennine mainlyin Central Italy). They include green areas, so theyprovide high standard of living.
Cluster 7 – Small towns with the poorest results These towns are focused on agriculture and have highunemployment. They are the worst performing amongall types of towns and cities. They are concentrated inthe south and on the islands.
Cluster 8 – Dynamic Small Towns These are highly specialised, particularly in servicesand tourism, with good results in term of productivityand employment. They are mainly located in thenorthern Alps in the Italian Tyrol, but also scattered infew isolated place in Sardinia and Tuscany.
AUSTRIA
Vienna
Vienna has a unique status in the outcome of theAustrian cluster analysis because the city of Vienna isone LLS7. The characteristics of Vienna are most simi-lar to type 2, but with higher population density by far(and by definition, with a mono-centricity of 100), butwith lower economic performance.
7 In Austria LLS have been analysed according to the existing local labour market districts ("Arbeitsmarktbezirke").
repus_FINALREPORT.qxd 2007. 09. 20. 16:28 Page 86

Map 46: Typology by LLS in Austria
Cluster 1 – Mono-centric urban regions Mono-centric urban regions mainly depict the largerprovincial capitals (e.g. Graz, Linz, Salzburg, Innsbruckand Klagenfurt etc.) and some semi-urban LLS withinthe range of Vienna’s broader agglomeration area.They are characterised by the following attributes: • The LLS show considerably higher densities than
the average LLS, mainly within the urban node, butincreasingly also in the agglomeration area.
• They depict mono-centric regions, the urbannodes are of provincial or regional importance andsome of those urban nodes have largeagglomerations (mainly provincial capitals).
• The LLS show very good accessibility in the urbannode, which is not much less in the periphery ofthe LLS. They are located centrally and are linkedto high level transport infrastructure in all transportmodes (except inland waterway in some cases).
• The economic performance of all the LLS is goodand they show a dominant concentration ofeconomic activities in the urban node.
Cluster 2 – Polycentric urban regionsThose two LLS (to some extent together with their
neighbours) are a kind of exception within the Austrianurban landscape of the Rhine Valley. The mostimportant difference in type 1 is the polycentric patternwithin this densely populated region. Additionally, type2 is characterised by the following attributes: • The two LLS show high (above average)
population density with a rather polycentricpattern. Both LLS have medium urban nodes, amedium share of population in the urban nodeand there are some other urban nodes of lessimportance located within the LLS.
• Both LLS show relatively good accessibility.Although not centrally located (from an Austrianperspective), they are linked to high level transportinfrastructure (road, railway and air-transport) notonly in Austria, but also in Germany andSwitzerland.
• The economic performance of these LLS lieswithin the Austrian average performance.
The following types 3 and 4 depict rural areas, whichare located in central areas and/or broader urbanagglomerations. All of them are located within or inproximity to the main transport axes (high level road
87
repusfinalreport
repus_FINALREPORT.qxd 2007. 09. 20. 16:28 Page 87

and rail) in Austria. Whereas type 3 regions are locat-ed more centrally, show higher population density andbetter economic development, it must be said thattype 4 regions are less populated and less economi-cally dynamic. The characteristics of those types inmore detail are as follows:
Cluster 3 – Dynamic rural areas within the range ofwider urban agglomerations• Those LLS show a medium to low share of population
in the urban node: a small town is often surrounded bya high number of even smaller municipalities/villages.
• Population density is at a medium level. • The accessibility of the LLS is relatively high. The
favourable situation of the LLS arises mainly fromtheir location in proximity to one of the main urbancentres (mono-centric urban regions), within oneof the major transport axes within Austria.
• They show medium economic performance
Cluster 4 –Rural areas within Austrian transport corridors• The LLS are mainly very small towns which have
the function of an urban node and therefore a lowshare of population in the “urban” node.
• Generally they are characterised by low populationdensity.
• Due to their location within the major transportaxes in Austria, accessibility is relatively high.
• The economic performance of these LLS is low,comparatively speaking.
The most difficult situation prevails in regions of type 5.Located in peripheral position within Austria (mainlyborder regions or alpine regions), their accessibility isweak. Overall they show less dynamism in terms of botheconomic and population development. Additionally,most of them additionally share an unfavourable outlookin terms of population development in the future.
Cluster 5 – Peripheral regions• Within all these LLS, there are only s few Small and
Medium-sized towns and population density is low. • Due to the small size of the urban nodes (low
share of population in the urban node), lowhierarchy between those nodes and the surroundingrural areas exist. Nevertheless, these small urbannodes often have an important service function inthe area.
• Accessibility is only medium to low, mainly due toa rather peripheral location. Links to high levelinfrastructure are missing.
• The LLS generally show weak economicperformance.
88
3. The policy strategydimension
3.1 The European contextbetween territorial cohesionand competitiveness
The polycentric territorial development in the visionproposed by the ESDP and reconfirmed in theEuropean Territorial Agenda remains one of the pillarsof European policy strategy. However, the increasingimpact of globalisation, which increases competitionfor cities and regions, mean that more emphasis isplaced on other factors such as knowledge, competi-tiveness, innovation and efficiency, as placed at theforefront of the Lisbon Agenda.
The European Union endeavours to strike a goodbalance between the two different targets of“Competitiveness and Cohesion”. In a situation wherethere are constraints on natural and financialresources, countries are at different stages of developmentand this fact results in high social and economicdisparities across Europe. The balance between thesetwo targets is not easy, as the pressure from the externalenvironment is very high. The territoriesand the towns andcities – as they are dynamic actors – therefore acquire a newrole in facing these new challenges.
The Territorial Agenda (Territorial Agenda of theEuropean Union, 2007) is an attempt to reconcilethese two targets of competitiveness and cohesionand address fundamental policy issues such as:
• To adapt the approach to the specificities of theterritories and regions fully exploiting the existingpotentialities: this creates the necessity to adopt atailor-made policy approach as the origins of theproblems are peculiar to each case: there is noblue-print for a solution to structural territorialproblems.
• To strengthen polycentric development andInnovation by reinforcing the city region and citiesnetwork: the development of the city/regionsco-operation, including small and medium-sizedtowns, based on the principle of proximity, in orderto combat peripheral position and social exclusion.
repusfinalreport
repus_FINALREPORT.qxd 2007. 09. 20. 16:28 Page 88

• To ensure sustainability of growth while facingincreasing shortage of natural resources and therelated problems of energy: this is indeed a newand crucial problem for addressing the costs ofeconomic growth, while at the same time strength-ening high standards of living.
• To strengthen the rural-urban partnership, byinvolving different institutional layers, from local toregional to ensure local governance.
• To favour the clustering of activities as integrationand specialisation create new competitivecapacities; this is also seen as vehicle forinternational co-operation and local partnership.
• To improve accessibility and transport infra-structures with the extension of the trans-European network.
These targets are inspired to a great extent by theprinciple of partnership and co-operation, amongvarious institutional tiers, from local up to national andregional, in order to ensure good institutional capacityand policy effectiveness. Governance is at the centreof new strategies, as synthesis between institutionaleffectiveness and partnership, among differentterritorial layers and also involving local stakeholders.This issue is particularly crucial for the new memberstates, as they come from a cultural background withlittle horizontal cooperation, since central planningcontributed to the fragmentation of the institutionaland economic actors in the territory.
3.2 Spatial vision of polycentricdevelopment in the RePUSarea
To what extent has a polycentric vision come into thepolicy strategy horizon of the new member states?Polycentric development and strategy for medium andsmall towns and cities seem to have been retained bythe policy-makers in the new member states.
Laid out briefly below, there are some syntheses ofthe country concepts and vision for spatial develop-ment. These indicate the importance of having a
strategy to deal with the main urban settlementproblems: an issue of which their respective authoritiesare well aware. How these visions are translated intoconcrete policies for implementation is the othermost sensitive issue: here gaps emerge as coherence,effectiveness, political willingness and resources arecrucial for pursuing such policies. Institutional capacityand capability at the different territorial layers, andtheir effective coordination, are all aspects thatinfluence the degree of real and effective implementationof the policies.
Moreover the long term character of such visions mayalso contradict the short term policies that by contrastdeal with more direct and specific issues: spatialplanning, understood as the main economic, urban andsocial dynamics that develop in the territory andphysical planning, dealing with infrastructuredevelopment and land use. The line between spatialplanning and physical planning are difficult to delineate,as often they either overlap or cross each other; thisalso depends on the background of the individualcountry.
HUNGARY
In a polycentric vision, Hungary has elaboratedand approved an ambitious strategy for spatialdevelopment and as a continuation of this policydevelopment; a specific concept is beingprepared for the development of the settlementsystem. This strategy seeks to strike a balancebetween improvement of the competitiveness ofthe metropolitan areas, by strengthening thecapital and the (potential) regional centres as“development poles” and the spatial cohesion ofthe country, which requires that the most under-developed regions catch up. The objective is tofully take advantage of the great potential of theBudapest metropolitan area, but also tostrengthen the most important second tierCities, in order to create alternative developmentpoles, so as to counter-balance the growingcentripetal areas of the capital city. At the sametime, smaller towns as urban centres of under-developed rural micro regions are dedicated toplay key role in the development of their micro-regions. (See Figure 6)
1. The target “Development of a highly competitive Bu-dapest metropolitan area” is split into two sub-targets: competitiveness and sustainability:
89
repusfinalreport
repus_FINALREPORT.qxd 2007. 09. 20. 16:28 Page 89

90
repusfinalreport
Figure 6: The Objective Structure of the National Spatial Development Concept
repus_FINALREPORT.qxd 2007. 09. 20. 16:28 Page 90
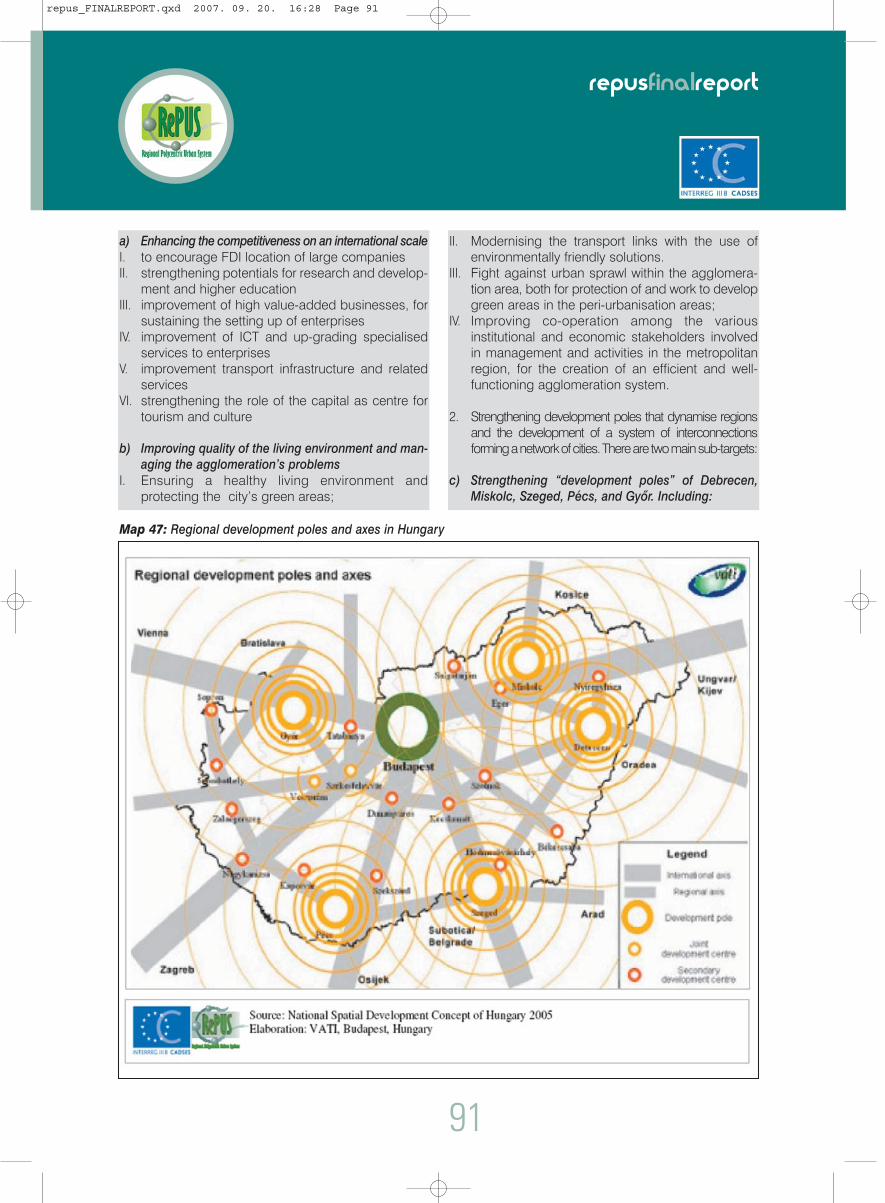
91
repusfinalreport
a) Enhancing the competitiveness on an international scaleI. to encourage FDI location of large companiesII. strengthening potentials for research and develop-
ment and higher educationIII. improvement of high value-added businesses, for
sustaining the setting up of enterprisesIV. improvement of ICT and up-grading specialised
services to enterprisesV. improvement transport infrastructure and related
servicesVI. strengthening the role of the capital as centre for
tourism and culture
b) Improving quality of the living environment and man-aging the agglomeration’s problems
I. Ensuring a healthy living environment andprotecting the city’s green areas;
II. Modernising the transport links with the use ofenvironmentally friendly solutions.
III. Fight against urban sprawl within the agglomera-tion area, both for protection of and work to developgreen areas in the peri-urbanisation areas;
IV. Improving co-operation among the variousinstitutional and economic stakeholders involvedin management and activities in the metropolitanregion, for the creation of an efficient and well-functioning agglomeration system.
2. Strengthening development poles that dynamise regionsand the development of a system of interconnectionsforming a network of cities. There are two main sub-targets:
c) Strengthening “development poles” of Debrecen,Miskolc, Szeged, Pécs, and Gyõr. Including:
Map 47: Regional development poles and axes in Hungary
repus_FINALREPORT.qxd 2007. 09. 20. 16:28 Page 91
I. Upgrading the educational system for the qualityand skill of human resources;
II. Increase the specialised R&D capacityIII. Raise the standard of financial and business
consultancy and public services;IV. Development of a network of institutions and
organizations that can deliver innovation;V. Encourage urban development activities which
attract private sector investment.
d) Developing the network of the cooperating cities,concentrating on the medium-sized cities
I. Improve accessibility within regions betweenurban centres by development of public transportand roads
II. Improve accessibility and mobility across thecountry by the development of motorway, expresstrains, regional airports and ICT infrastructures
On top of that regional development axes for Hungaryhave been identified by the National SpatialDevelopment Concept: (See Map 47)
From this strategic vision of spatial develop-ment, it emerges that there are also third tiertowns and cities at an intermediate levelbetween the capital and the main developmentpoles. These are located along a double ringpattern around the radial axes. This de factothree-tier strategy would, in principle, increasethe diffusion of wealth distribution and improveintegration since towns and cities of differentsizes would become closer due to improvedaccessibility, searching political willingness forcooperation and looking for improvement of thelabour market integration. Mobility can improveeffectiveness, whilst not always necessarilybeing beneficial for cohesion.
POLAND
From the polycentric development viewpoint, the keyproblem for Polish spatial development addressed bythe Conception of Spatial Development of Poland is:how can the requirements of competitiveness andeffectiveness be reconciled with the principles ofjustice and equality. There are clear problems ofconsistency between the assumed priority of“effeciency” versus “equity”, in a view of “balanceddevelopment” nationwide (see section for macro-areas – in Poland). Based on that principle, threepriorities have been identified:
92
A. potential polarization poles of diversified hierarchy, B. potential belts of accelerated development, C. potential zones of multi-functional, ecological devel-
opment.
The multi-polar urban settlement system in Polandrepresents a great opportunity for developing a strongpolycentric policy, which can be based on the mor-phological existence of a large number of centres ofvarious sizes, very close each other and spread out allover the country. There is great potential for integra-tion, if strong transport infrastructures investment isensured for internal mobility.
The Concept of Spatial Development for Polandassumes that in order to become a dynamic andgrowing economy integrated into Europe, the urbansettlement system should include:• the capital metropolis as the central player in
the country;• a network of uniformly diffused centres of
European significance, which include centres located at interchange points within the Europeansystem of transport, with developed universitycentres and multi-functional capacities,
• a network of centres of national, trans-regional andregional significance that cover the largest parts ofthe country
• other minor urban centres of local importance(See Figure 7)
A series of Priorities have been identified for improvinga spatial strategy for stimulating development byincreasing poly-centricity and cohesion of the settlementsystem of Poland, in European, national and regionaldimensions:
Priority 1: Increasing integration of the Polish settlementsystem: upgrading scientific and soft factors forimproving effectiveness, skills of human resourcesand ICT innovation; Priority 2: Increasing poly-centricity and nationalcohesion for the settlement system:Priorities 3: Increasing cohesion of developmentpolicies: better coordination of horizontal and verticalpolicies; improved integrated approach Priority 4: Strengthening the endogenous bases for localdevelopment: in particular for small towns in rural areasfor providing services; improving accessibility toperipheral areas; small business promotion; upgradingand expanding service provision for enterprises
repusfinalreport
repus_FINALREPORT.qxd 2007. 09. 20. 16:28 Page 92
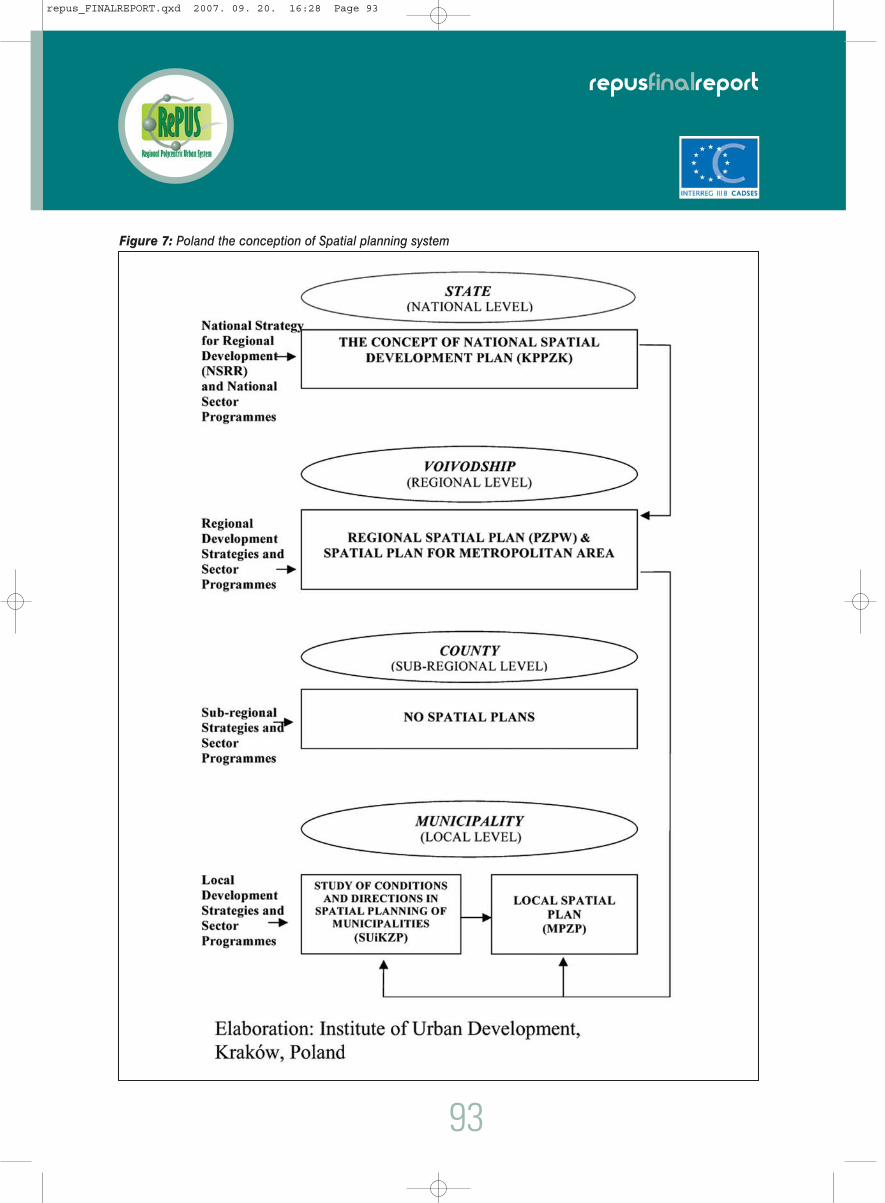
Figure 7: Poland the conception of Spatial planning system
93
repusfinalreport
repus_FINALREPORT.qxd 2007. 09. 20. 16:28 Page 93

94
repusfinalreport
Map 48: Polycentric development of Polish space
Priority 5: Inter and intra regional development integra-tion policy Priority 6: Increasing the effectiveness of the wayregional and local development is managed.(See Map 48)
In order to update the official Concept of SpatialDevelopment of Poland (1999), several objectivesneed to be included:
• Establishing functional zones in the country tosupport the complementarity of spatial structureand take advantage of regional diversification,
• To spur development of the Eastern Regionsthrough the inclusion of the regional urbancentres of Bialystok, Lublin, and Rzeszów intolarge integration areas of the most advancedregions for Poland, but also with a Europeanperspective. This is to overcome inherited“peripherality”, while preserving the regions’
specific character, such as traditional farmingso as to preserve the values of ecologicalareas.
• To stimulate the development of rural areas by:I. strengthening local job centres in order to develop
service functions, including provision of servicesto rural areas in the financial and informationfields, in order to utilize the benefits of Polishintegration into the European economy andfavour diversification into activities outside theagricultural sector;
II. ii- developing the educational and culturalpotential of smaller regional and local urbancentres, also adopting active incentives toattract people from larger cities coming to thecountryside.
• Creating and developing logistic centres of nationaland regional importance
• Stimulating the development of regional clusters ofinnovation
repus_FINALREPORT.qxd 2007. 09. 20. 16:28 Page 94
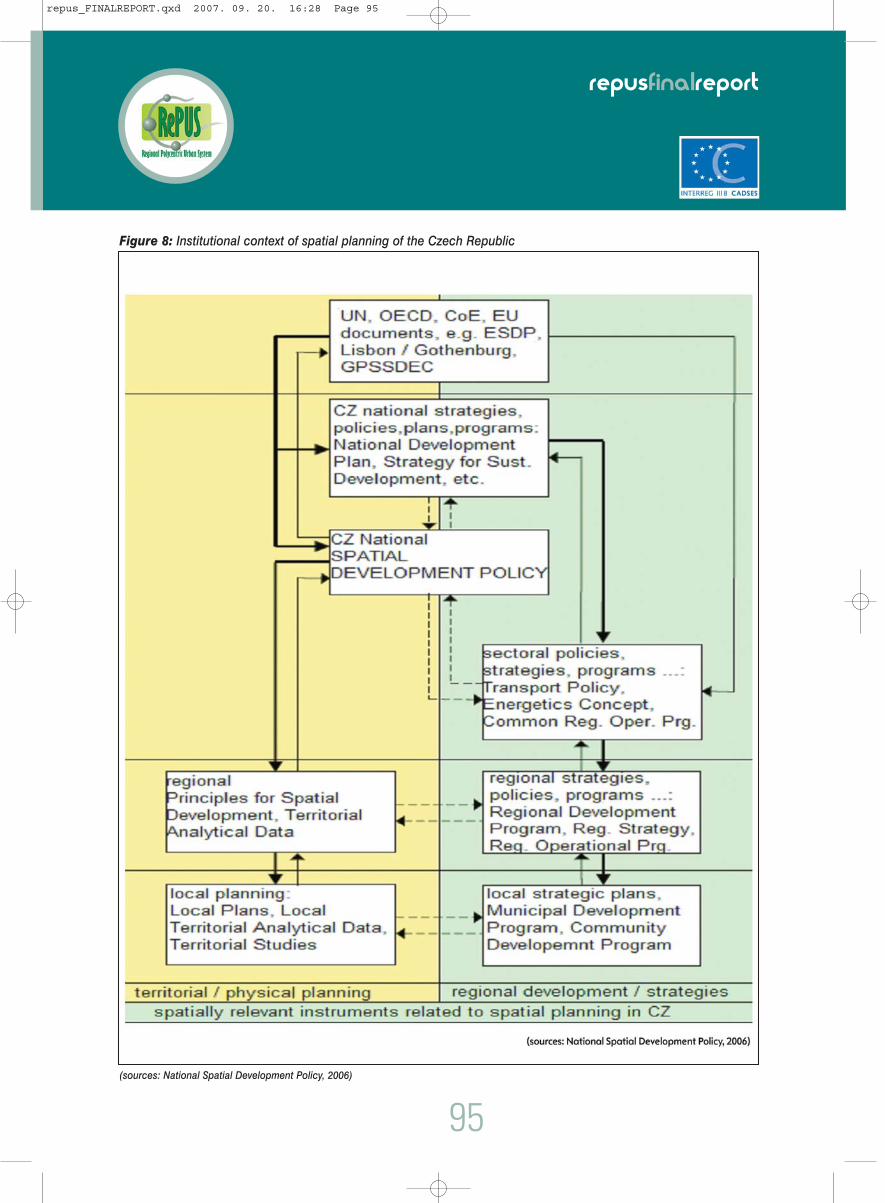
(sources: National Spatial Development Policy, 2006)
95
repusfinalreport
Figure 8: Institutional context of spatial planning of the Czech Republic
repus_FINALREPORT.qxd 2007. 09. 20. 16:28 Page 95

96
repusfinalreport
CZECH REPUBLIC
In the Czech Republic, the National Spatial DevelopmentPolicy (PUR) sets national priorities for sustainabledevelopment areas. The National Policy of SpatialDevelopment (PÚR) provides a good institutional back-ground for the development of relevant and effectivepolicies on national, regional and local spatial planninglevels (See Figure 8). By law, the PÚR has to co-ordinatestate sectoral policies from the spatial aspect and“vertically” co-ordinate territorial development on a regionaland local level. Since the PÚR is strategic document, itsmain role is to establish frameworks for specific policieson the regional level of planning, in accordance with thePrinciples of Territorial Development (ZÚR). This has nothappened yet, as it will only take place in 2008 when theZÚR will be introduced.
The first, 2006, version of the PÚR has focused mostlyon the development of transportation infrastructure. Itis advisable that the next review should react to thechanging physical as well as social environment andthus it may be more oriented towards the co-ordination of the development of settlement structure.
The review of the PÚR currently being preparedwill be critical for introducing an effective policyof spatial management at a national level, whichwould be relevant to EU Territorial Agenda inrespect of the poly-centricity of metropolitanregions, cities and urban areas. The present periodis also important for establishing a new practiceof spatial management of regions, as regionalZÚRs are now being drafted, for approval by theend of 2008.
The vision of polycentric development results clearlyfrom this map with radial axes from Prague.Particularly interesting is the regularity of the distanceof the secondary urban poles that cover virtually thewhole country. (See Map 49)
The polycentric development vision for the CzechRepublic, with a radial axes scheme can beobserved around the core of the metropolitanarea of Prague.
In the Czech Republic, there is no other city other thanPrague to assume the role of gateway between theinternational and the local economy. This is especially
Map 49: Development areas, development axes and specific areas in Czech Republic
repus_FINALREPORT.qxd 2007. 09. 20. 16:28 Page 96

Figure 9: Austria Spatial Planning integration Scheme
relevant to the second largest city, Brno, which hasaspired to play a more important role.
On the regional level, the Czech Republic has a net-work of regional centres which covers most of thecountry. These regional centres provide the full rangeof higher-ranking facilities (higher education, spe-cialised hospitals, and regional administration), aswell as institutions.
The significance of the regional centres wasmaintained and even strengthened by the establishment
of some new functions, namely regional administrationbut also, for example, new independent universities atthe beginning of the 1990s.
The role of regional centres was further enhanced bythe dissolution of the district level of administration in2001; hence, former district centres lost some of theirleverage. However, the ranking of the regional centresshows a span from the strongest “supra-regional”Brno, followed at a clear distance by the westernmostPlzen, the “twins” of Hradec Králové and Pardubiceand, with certain limitations, Ostrava, to the relatively
97
repusfinalreport
ˆ
repus_FINALREPORT.qxd 2007. 09. 20. 16:28 Page 97

small and weaker regional centres of Jihlava andKarlovy Vary. The new polarisation of the CzechRepublic in the international business and politicalcontext, as well as economic transformation hasreshuffled the position of regional centres: Plzen andCeské Budejovice seem to be winners in this respect,while the old industrial centre of Ostrava, which more-over is situated on the unfavourable north-easternfringe of the country, is among the losers.
In the long run, provided the gap between “old” and“new” EU member states narrows and transport infra-structure is improved, Moravian regional centres mayimprove their position and possibly also their poten-tials for mutual networking. Thus, Moravia and Silesiamay offer better prospects for polycentric models ofan integrated system of regional centres, balancing inthis way the strong position of Prague within thenational context.
AUSTRIA
Two main critical aspects characterise the Austrianvision and spatial planning system: the old andconsolidated tradition in spatial planning and thefederal character of the state, defining a stronglevel of decentralised power: the “Länder”.However, polycentricity is not part of the spatialplanners’ goal. The strengthening of the functionsof small and medium-sized towns ought to beachieved via the concept of “decentralisedconcentration”. (See Figure 9)
Austria subscribes to a concept of spatialdevelopment based on the notion of the “centralplace” which has its roots on Christaller’s theory:the centrality of a town or city’s functions remainthose that define the town or city’s hierarchy.Within this framework, even if some notion ofpolycentrism has surfaced over the last decade,there have been no explicit policies drawn uptoward this broader goal.
The structure of the Austrian urban system with Viennaas the main urban pole and several minor urban poleshas also been laid down in the „Austrian SpatialDevelopment Concept 2001“. The model of polycentricdevelopment, defined in the ESDP, is described as beingrelevant to Austria, but with one major difference: theimportant urban regions shall develop further, butVienna shall be able to hold its dominant position withinthe Austrian urban structure. It is clear that there is no
98
scope for seeking a more balanced urban system atthe highest level in Austria
SLOVENIA
Urban policy in Slovenia has been part of nationalspatial and regional development policies since 1960sonwards and part of urban (land use and urbandesign) planning at the local level (e.g. municipal andintra-city level). Regional policy and spatial planning inSlovenia have their origins in a polycentric urbandevelopment concept based on (adopted) “centralplace theory” (or hierarchy of central places) and“development poles” by Perroux from 1960s onwards,with their gravitation areas as “planning regions”. Thisoriginal “polycentric urban development” concept,formulated in the 1960s, was never fully implemented.This was firstly because of the introduction of the“communal system” in the Yugoslav Federation in1970s, when local communes in individual republicswere given more power and responsibility over localdevelopment and planning, and later in the 1990s withthe change of the political system, market economyand institutional reforms. Urban policy is also animportant part of the new strategic documents, lawsand by-laws, most notably the Spatial DevelopmentStrategy of Slovenia (2004), the Spatial Planning Act(2002, 2007) and the Construction Act (2002, 2007)and the Land Development Act (2005) etc. Therefore,the concept of polycentrism has been the basicdevelopment concept for Slovenia, through the allocationof jobs and services in “regional centres” (middle-sized towns), which are important for the social andeconomic development of their “gravitation areas”,and as an instrument for (regional) development oflocal centres (small towns) and “less developedareas”. As a result of this consistency in polycentricspatial (urban and regional) development policessince the end of 1960s, the ESPON 1.1.1 project(2004) finds that Slovenia is one of the most polycentricEuropean countries, despite the small size of the country.
In 2002 the National Assembly of the Republic ofSlovenia adopted the first new Spatial Planning Actand Construction Act with Spatial ManagementPolicy. Two years later, the Strategy of SpatialDevelopment of the Republic of Slovenia with SpatialOrder (2004) was adopted. Prior to the new SpatialPlanning Act, the government adopted two otherdocuments: the Assessment of Spatial Developmentin Slovenia and the Spatial Management Policy of theRepublic of Slovenia. These were the first new spatial
repusfinalreport
ˆ ˆˆ
repus_FINALREPORT.qxd 2007. 09. 20. 16:28 Page 98

Source: Spatial Development Strategy of Republic of Slovenia (2004)"Spatial Development Strategy of Republic of Slovenia (2004) is promoting further polycentric urban development concept through 51 »centresof (inter)national, regional and inter-municipal importance« (with 62 urban settlements) and »functional urban regions« of 15 »centres of(inter)national importance« (i.e. regional centres)."
99
repusfinalreport
Map 50: »Centres of (inter)national, regional and inter-municipal importance« (urban network) with city clusters,agglomerations and functional urban areas
repus_FINALREPORT.qxd 2007. 09. 20. 16:28 Page 99
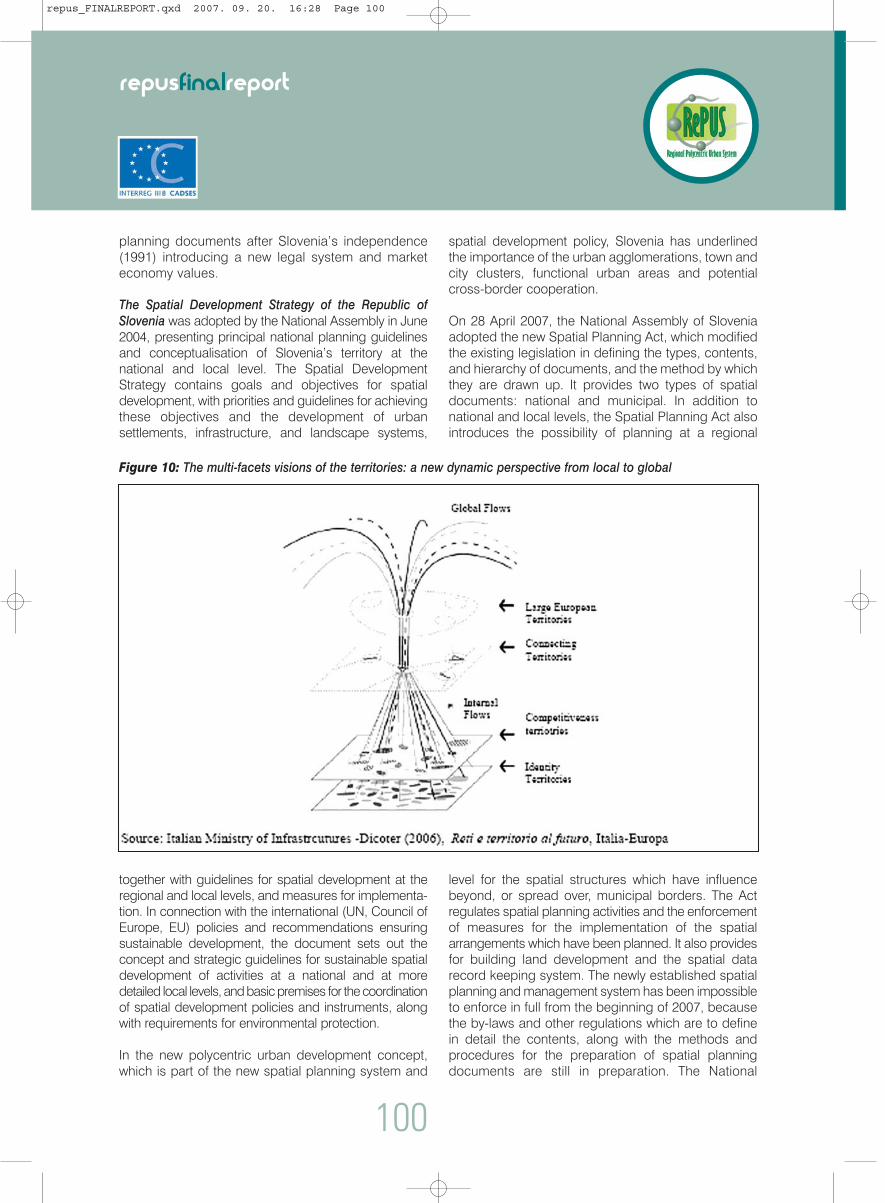
100
repusfinalreport
planning documents after Slovenia’s independence(1991) introducing a new legal system and marketeconomy values.
The Spatial Development Strategy of the Republic ofSlovenia was adopted by the National Assembly in June2004, presenting principal national planning guidelinesand conceptualisation of Slovenia’s territory at thenational and local level. The Spatial DevelopmentStrategy contains goals and objectives for spatialdevelopment, with priorities and guidelines for achievingthese objectives and the development of urbansettlements, infrastructure, and landscape systems,
spatial development policy, Slovenia has underlinedthe importance of the urban agglomerations, town andcity clusters, functional urban areas and potentialcross-border cooperation.
On 28 April 2007, the National Assembly of Sloveniaadopted the new Spatial Planning Act, which modifiedthe existing legislation in defining the types, contents,and hierarchy of documents, and the method by whichthey are drawn up. It provides two types of spatialdocuments: national and municipal. In addition tonational and local levels, the Spatial Planning Act alsointroduces the possibility of planning at a regional
Figure 10: The multi-facets visions of the territories: a new dynamic perspective from local to global
together with guidelines for spatial development at theregional and local levels, and measures for implementa-tion. In connection with the international (UN, Council ofEurope, EU) policies and recommendations ensuringsustainable development, the document sets out theconcept and strategic guidelines for sustainable spatialdevelopment of activities at a national and at moredetailed local levels, and basic premises for the coordinationof spatial development policies and instruments, alongwith requirements for environmental protection.
In the new polycentric urban development concept,which is part of the new spatial planning system and
level for the spatial structures which have influencebeyond, or spread over, municipal borders. The Actregulates spatial planning activities and the enforcementof measures for the implementation of the spatialarrangements which have been planned. It also providesfor building land development and the spatial datarecord keeping system. The newly established spatialplanning and management system has been impossibleto enforce in full from the beginning of 2007, becausethe by-laws and other regulations which are to definein detail the contents, along with the methods andprocedures for the preparation of spatial planningdocuments are still in preparation. The National
repus_FINALREPORT.qxd 2007. 09. 20. 16:28 Page 100

Strategic Spatial Plan of Slovenia is also being drawnup. This is to present the basic premises for the prepa-ration of all spatial planning documents at nationaland local levels and will replace the current SpatialDevelopment Strategy. Along with other nationalstrategic development documents, it will serve as astarting point for guiding sustainable spatialdevelopment at the national, regional and local levels.(See Map 50)
ITALY
Historically with weak or absent spatial planningtradition, Italy has enjoyed strong decentralisationand the regions have assumed the role of thespatial planners. Thus the dynamic of the territoryis mainly seen from the regional perspective. In thepast, attempts to draw up a spatial frameworkhave failed. Recently, a new vision has once againbeen developed which may indicate new avenuesfor development.
The analysis carried out by the Ministry ofInfrastructure presents an interesting interpretation ofspatial development, where territories do not only existas locations of activities in a static way, but there isalso a territories’ network, where different flows atmultiple levels are inter-connected around thelocalities. The main features of the development in thechanged dimension of the present globalisationemerge from this overlapping and reciprocal crossingof different dynamics as “multi-layers”.
Different types of territories constituent the multi-layers(multi-leaves) scenarios:• Identity Territories: where cohesion targets are at
the forefront;• Competitiveness Territories: where private firms,
local resources, business environment and net-works of main institutional and economic actorsinteract;
• Connecting territories: where human resources,goods, knowledge, information and servicesdevelop and emerge at the upper level;
• Large European territories: where macro-regionalareas compete in the broad economic and geo-political context;
This graphic (Figure 10) gives a very clear and logicalframework for the dynamics of the territories, wherecompetition and cooperation react with each other.This concerns hard and soft (intangible) factors are
equally. What emerges is a new conception of theterritory in a dynamic way where flows, rather thanstable assets are the main determinants.
This perspective gives a new interpretation of theimportance of the two different components in theurban perspective: I. The metropolitan areas acquire strategic importance
for improving their potential development even in aEuropean context. Within this vision, determinantquality factors related to urban development, notonly of tangible but also of intangible nature, areemphasized.
II. The role of small and medium-sized towns are alsomentioned as essential tools for ensuring thediffusion of high quality of life, as a prerequisite fora vision of diffusion of well-being in an advancedsociety.
This broader vision however hardly translates intostable and coherent spatial planning framework:with infrastructure development remaining de facto,it is mainly the operational plans that dominant thepolicy framework at national level. Thus, spatialplanning as a strategic document in practice is limitedto the Regional level (NUTS 2). Strong decentralisation,without coherent national coordination remains themost critical weakness of the institutional territorialsystem in Italy, in particular in light of strong regionaldisparities.
3.3 Critical policy issues
The RePUS project has developed some criticalappraisal of the main policy issues which characterizethe national institutions and function in the fields ofpublic policy, regional policy, spatial planningpractice and urban policy in each individual country.Many discussions with policy-makers at the variouslevels of public administration, those in the academicfield and experts have been carried out in eachcountry and some indications shall be presentedbriefly here. These discussions are based not on asurvey but rather provide only a qualitativeappreciation of the importance and relevance ofthe problems touched upon. These points are notintended to be an exhaustive list of the manyissues that have been analysed and discussed butrather only indicative.
101
repusfinalreport
repus_FINALREPORT.qxd 2007. 09. 20. 16:28 Page 101

• The institutional context: decentralisation, effective-ness, governance and multi-layered government:this is the crucial issue on the present policy agendafor the new member countries. Regionalisation anddecentralisation, as far as level of institutionalcapability, may present a future challenge to thesearch for more effective urban policy and spatialstrategy for development. The integration orientedcooperation between governments of regions andof towns and cities are an essential element for thedevelopment of a system for small and medium-sized towns and cities. Regional cooperationbetween towns and cities is of similar importance.
• Spatial planning and physical planning: transportinfrastructure development is often retained as themain focus of spatial planning, due to an underestimationof the complexity of the issues related to spatialdevelopment. Moreover, the lack of co-operationbetween physical and development planning canbe considered a serious problem in the majority ofthe Central European countries. The communicationbetween the two planning activities is quite weak. Inthe future, these two separated fields of planningshould be integrated in a joint process.
• Often there are contradictory approaches at the lowerand intermediary institutional layers, due to the factthat the municipalities or the upper local/lower region-al level dealing with land use regulation lack a widerspatial vision of economic and urban development.There are inefficiencies and difficulties in dealing withspontaneous phenomena such as suburbanisationand urban sprawl, as there is a lack of broader strategicplans which go beyond the territorial limits ofpolicy-makers at local level (municipalities).
• Regional policy, urban policy and spatial planning,however well-developed they may be institutionally,often tend to deal with the issues of spatial developmentseparately, through their singular fragmentedpolicies and instruments. However, theseoverlapping issues increasingly require that allthree areas of spatial management should be betterconnected and coordinated, both institutionallyand in operation and in awareness of theinterconnectedness and complexity of spatial processes.
• It is difficult to co-ordinate sectoral policies dealing withregional and urban development. The administrationsdealing with individual sectors often underestimatethe spatial effects of sectoral policies and themajor development projects which derive from
102
them. This may eventually undermine theeffectiveness of the policies themselves. Co-operation and co-ordination between sectoral andspatial planning activities should be enhanced inthe future.
• Approaches to urban development strategy shouldreflect the specific potentials and constraints of theregion or city or town in question. As such, therelevant policies should be tailor-made to reflectthe different levels and origin of the problems tobe addressed, because no blueprint exists inspatial management. Endogenous potentialsdeserve special attention, since they arefundamental elements ensuring economic andsocial sustainability.
• City networking and cross-border cooperation forstrengthening integration and development areimportant messages for the RePUS countries. Upuntil now, city networking has remained ratherlimited as competition prevails over cooperation.Also, cross-border cooperation is often limited justto the areas near border crossings and they arecharacterised more by gaps and disparities thanby partnership.
More specifically, vis-à-vis the small and medium-sized towns’ perspective, the following needs to beretained through the main RePUS messages:
The relevant policy priority in the Central and EasternEuropean new member states is to catch up to the EUlevel and integrate with the overall European processof urban and regional development. Within this, aprominent policy role is attributed to the large citiesand greater metropolitan regions. Nevertheless, therole of small and medium-sized cities should not beunderrated either.
• Small and medium-sized towns deserve greaterattention in regional and urban policy, both on thenational and trans-national scale:
• Small and medium-sized towns constitute themain body of the urban system and they can playa crucial role in the catching up process for under-developed rural regions,
• whereas large towns and cities and metropolitanregions are motors for spatial development, smalland medium-sized towns have a vital role inrunning and managing the settlement system
repusfinalreport
repus_FINALREPORT.qxd 2007. 09. 20. 16:28 Page 102

• Small and medium-sized towns have special linksto large towns and cities, whereby theysupplement the urban functions of large townsand cities, education, culture, production, distributionetc, depending on location characteristics
• The characteristics of geographical location andregional links are determinant for the developmentpotential and role of small and medium-sizedtowns. The differences in spatial relations thusinvolve the need for diversified policy approaches:
• Small and medium-sized towns in metropolitan/urban regions need to develop and strengthen theirspecial profiles, the specific roles which they performin the urban region (education, culture, trade orrecreational tourism or special/high-tech industry).The issue of managing suburban sprawl around majorcentres needs to be addressed urgently. This mayrequire revisiting the existing roles and responsibili-ties of regions and municipalities in spatial management.Future regional cross-sectoral management of developmentin the growth pole hinterlands might include:
I. regional control over large-scale development proj-ects;
II. regional frameworks for local housing developmentplanning;
III. harmonisation with planning / development oftransportation network, where rail-orienteddevelopment should be prioritised in metropolitanand regional-city regions.
• Small and medium size cities in rural areas shouldretain their conventional function as local servicecentres accommodated to the new challenges,thus focusing among others on training andmarketing and service suppliers, as well assupplementary employment functions. Theeconomic base for the urban area (LLS) should bereasonably diversified to achieve a robust and, assuch, more sustainable pattern of development.
• The more or less isolated small and medium-sizedindustrial towns should focus on maintaining andstrengthening local firms, mobilising localentrepreneurship and developing local servicesand a pro-active employment policy (with specialregard to training and re-training)
• For the local centres in resort regions, resortcentres, the main issue is environmental upgrading,development of soft infrastructure, improvement of
accessibility, use of tools of place marketing andbranding in order to stimulate tourist demand andlast but not least, the provision of supplementaryfunctions such as training, as well as bio-farmingand craft industry for local markets.
• The development strategies are to be based on themobilisation of strengths and potentials. Thereforecomplexity, foresight and a pro-active, comprehensiveapproach are indispensable for policy making:
• Change is a permanent phenomenon, whichresults from globalisation and gives rise to highinstability: this instability needs to be managed inorder to benefit from it. Attracting foot-loose, mobilefirms (such as assembly plants) is not a sustainablesolution, unless the firms are locally rooted andable to create clusters in their territorial proximity orin the surrounding municipalities.
• The enhancement of education and training is apermanent obligation for the maintenance of acompetitive workforce and to ensure livelihoodsfor the local population.
• Redistribution of resources for the support ofdeprived areas and municipalities will remain necessary.However, this will be limited to basic equity issues,as well as social care for those in need.
• The mobilisation of local /endogenous resourcesneeds a creative approach and it can be oriented toa variety of areas such as cultural heritage, naturalassets, work traditions and willingness of action.
• In order to introduce spatial considerations indevelopment policy, better coordination is neededamong existing institutions, namely regional policy/ sectoral policies / spatial planning.
• In the case of small and medium-sized towns,local initiatives and the implementation of bottom-up, local policies is particularly important
• The national and regional authorities need toensure a suitable and appropriate scope for localpolicy actions: financial capacities, political, legalpower and institutional capacities. Empowering isof special significance for the enhancement ofcreative action.
• Local authorities cannot operate effectively inisolation. Dialogue between authorities, the
103
repusfinalreport
repus_FINALREPORT.qxd 2007. 09. 20. 16:28 Page 103

exchange of views, experience and opinion isneeded at different levels of the hierarchy.
• Good and mutually profitable public- privatepartnerships can and should be developed locallyby means of dialogue and co-operation with localenterprises.
• Public participation is an obvious requirement inlocal policies. The involvement of both permanentand temporary residents (second home owners) isalways useful for the development of communityspirit and to obtain public support.
• The development of co-operative structures is anessential contemporary condition of appropriateurban functioning.
• For small and medium-sized towns, the fosteringof horizontal linkages of inter-municipalitycooperation is of particular significance. Links tocentral cities is essential, but equally so is thecluster formation of towns and cities of similar size,as well as intensive urban-rural relations.
• Cross-border cooperation is a relatively newelement of urban functioning. Conditions for suchco-operation are improving along the borders bothwith member states and neighbouring countries.Small and medium-sized towns have special roleand broad opportunities in this process.
• Cooperation can extend beyond the immediatevicinity. Twinning and other co-operative arrangementsat a trans-national level are also possible andfruitful between municipalities with commonground in terms of ethnicity, geography or culture.
4. Conclusions
The main results of the RePUS ‘s spatial analysisindicate some important findings, although for thecomplexity of multi-layer analysis, many aspectsrequire further in-depth study in order that phenomenawhich are difficult to be better understood.
1. A changing background: the process of economicand social integration of the new member statesinto the European economy is still ongoing and
104
has not been completely achieved, as the gap thatstill exist between the Old and the New membersis still relevant (see Fourth Cohesion Report, theprojections 2004 – 2024). Thus, the processes ofrestructuring and adjustment that characterise theeconomy and society from both perspectives,both in terms of hard factors – such as industrial,services and infrastructural investments – as wellas in terms of soft factors – such as innovation, up-grading of education and qualification, newknowledge-based diffusion activities – are stillunder way and they have a strong territorialdimension. The re-location of resources and thesearch for efficiency gains have a robust impacton regions and towns and cities, which areaffected also by the speed of changes. The impactof such changes in the territory is very high andthis moving framework dominated by newlycreated market mechanisms is modifying previous“centres et peripheries”: the regions prospering inthe past have lost significance and others areslowly emerging, as resources go toward newsectors and locations.
2. These processes of adjustments have broughtabout increasing polarisation around just a few poles,usually the capital metropolitan area. Regionaldisparities are increasing as concentration bringsincreasing returns. This trend characterises to varyingdegrees, all the new member states, particularly atthis initial phase of market adjustment. At the sametime, it is relevant to emphasise that importantchanges in the European economic landscape arealso taking place, as economic concentration in thetraditional Pentagon areas has been slowing downin relative terms, since the last decade (1995-2004)(Fourth Cohesion Report, 2007). This fact is due inpart to the growing economic weight of additionalmetropolitan areas in the old cohesion memberscountries, i.e. Spain and Ireland, but it is also due torapid growth of the new member’s capital cities, i.e.Warsaw, Budapest, Prague, Bratislava and Ljubljana.This confirms the fact that the strengthening of thecapital cities in the Central and Eastern Europeaneconomic context, is of utmost importance forbringing higher growth and bearing up underincreasing pressure from international competitiveness,particularly in terms of price competitiveness. This isan essential pre-condition from the macro-economicpoint of view for ensuring an adequate catching-upwith the advanced countries. However, excessiveconcentration brings the well-known phenomena of
repusfinalreport
repus_FINALREPORT.qxd 2007. 09. 20. 16:28 Page 104

Map 51: Spatial vision: Development axes in the RePUS countries
105
repusfinalreport
Spatial vision: Developmentaxes in the RePUS countries
repus_FINALREPORT.qxd 2007. 09. 20. 16:28 Page 105

diseconomies and negative externalities, as pricesincrease too rapidly and the impact on theenvironment is highly negative. In addition to this,there is the typical phenomenon of mushroomingsprawl. This is why there is the need on one hand,to manage these processes in order to minimize thenegative effects with appropriate urban policesmeasures, and on the other hand to favour thestrengthening of second tier cities.
3. Given the basic background with a less favourablestarting situation for all CEE areas (moderatedensity, different level of the economic performancein absolute terms, some rigidities due to the urbanheritage structures), the hypothesis of developingan alternative model of spatial integration basedmainly on small and medium-sized towns seemsunrealistic and is not well-grounded enough,based on the empirical evidence from the empiricalanalysis. This requires a broader vision of theentire settlement system as an integrated system,where different tiers of urban areas find an appropriateplace, but in a dynamic way and not in keeping withChristaller’s vision of rigid hierarchy.
4. On the base of the RePUS findings, second tierurban areas have important potential that seems toemerge even if at the beginning stage, that mightbe strengthened in the medium – long term. Startingfrom the most promising indications, particularlyfor the large and medium-sized towns and cities, astrategy needs to be adapted which is central tothe economic development of the countries andensures a certain diversified type of functions –mainly services. The expected increase ininstitutional decentralisation, up-grading of theinstitutional and policy capacity of the Regions(NUTS 2 levels) might also give additional politicalpowers to potential regional capitals. The polycentricstrategy put forward in all the RePUS new memberstates contributes to this goal and can becomeeffective, as long as there is a clear combination ofthe two different focus target: the capitalmetropolitan areas and its hinterland, and thelarge and medium-sized towns and cities.
5. This suggest that a “dual track strategy” policyneeds to be drawn up where, beside further increasingthe competitiveness of the capital city, there is asecond tier strategy adapted for the upper tiers ofthe towns and cities of secondary importance, whichneeds to enjoy a certain “critical mass”. A good bal-ance between cohesion – in the polycentric vision –
106
and competitiveness – the winning strategy for inter-national competitiveness – needs to be found.
6. Small towns are also extremely important, as theycan play an important role for social and economiccohesion as secondary functions in the territory.Their position in the urban settlement systemdepends on the specificities of the framework inwhich they lie:
I. Small towns can have determinant roles asdiffused types of urban centres that contribute to theprocess of economic integration from the bottom:their density and their location can be a factor thatfacilitates the processes of diffusion of servicesand improvement of standard of living in rural orsparsely populated areas. This is of particularimportance in the most peripheral areas, wherethere is absence of other major urban centres.
II. Small towns in the hinterland of the largemetropolitan areas have a peculiar function ofintegrating labour market and secondary servicesfunctions. They also have a function in limitingsprawl phenomena and sub-urbanisation oflarge metropolises.
III. Highly specialised profiles can become a strongfactor for competitiveness in the case of smalltowns, in terms of tourist function, recreationalareas, high technology or industrial-specificbranches possibly giving rise to industrial andservice clusters. Specialisation becomes acondition sine-qua non for integration into an areaand favours spin-off with adjacent towns or theattraction of expansion of specialised services.
7. Polycentric vision needs to be adapted as a consequenceand major area disparities to be addressed, asthey can be costly in the long term. Towns andcities acquire a strong role in particular in lessurbanised areas, as they need to upgrade theirfunctions and attract investments, jobs creationand services delivery.
8. The questions of accessibility and mobility should notbe addressed in an isolated manner but in a way whichcomprises an integrated vision, i.e. one not exclusivelyfocused on hard investments, but also on efficiencyand modal system strategy development. Moreover,the improvement of the overall conditions for thecreation of endogenous growth factors at regional andlocal levels are essential in order to fully exploit theexpected increase in accessibility and avoid increasingthe outflow of people, so reinforcing the decline ofperipheral areas or isolated towns and cities.
repusfinalreport
repus_FINALREPORT.qxd 2007. 09. 20. 16:28 Page 106

Map 52: Spatial vision: Cooperation and Development areas in the RePUS countries
107
repusfinalreport
Spatial vision: Cooperation and Developmentareas in the RePUS countries
repus_FINALREPORT.qxd 2007. 09. 20. 16:28 Page 107

108
practice learning; exchanges of experience inspatial planning and development policystrategy).
13. Enhancement of cross-border co-operation remainscentral, as common historical and cultural back-grounds act as a motor for developing closer ties.The importance of different size urban centres issignificant for identifying expected impact andrelative importance: as locally based, dailycommuting for service provision remains of localimportance, whilst more relevant co-operation withmedium to large towns and cities represents acritical mass for economic integration.
One of the last areas which is part of the scope of theRePUS project has been that of identifying a PotentialEconomic Integrating Zone (PEIZ) on the base of thepotentialities identified in the course of the spatial analysiscarried out by the project. A proposed vision for thePEIZ needs to be based on strong acquis and on thestrongest potential areas identified. (See Map 51)
The synthesis map is an attempt to highlight some ofthe indications that emerge from the RePUS finding: itis only intended to be a possible vision for futuredevelopment of the Central and Eastern Europe areasin the long term. It has identified what is referred to asthe PEIZ (Potential Economic Integrating Zone). Thus, itdoes not reflect the situation at present, but ratherproposes a dynamic positive perspective in the future.It is not a static and defined area, but rather it is a“system” where the actors are the town and city areas– all types including large, medium and small – aroundthe main metaphorical axes of development, which goboth vertically and horizontally in all directions.
• The main development axes (in blue) in fact, aremore symbolic and only partially reflect the maintrans-European network. This is why they are nota comprehensive representation of the realtransport network. The central axis which crossesvertically all the areas (from Gdañsk to Milan andbeyond) indicates, in contrast to the transportaxis, an idle median axis that is geometrically atthe middle of the areas where the four capitalcities (Warsaw, Prague, Budapest and Ljubljana)are located with Vienna and Bratislava at the centre.All the other large, medium and small towns andcities are sparsely located all over the areas. Theother axes indicate horizontal integration, goingwest and east: the arrows indicate the dynamicvisions as they move west toward Germany and Italy
repusfinalreport
9. An integrated approach should be adopted andcoherence and consistency between the sectoralpolicies and spatial and urban policies should beensured. The spatial context is more and more adeterminant for successful policies, as soft andhard factors interact reciprocally in the territorialcontext.
10. The relevance of regionalisation and decentralisation:the weak state of the NUTS 2 Regions, in the newmember states, with the exception of Poland,remain a critical issue, as regionalisation couldhelp the new member states to overcome excessivecentralisation around capital cities and to improveallocation of resources in the countryside, asNUTS 2 ensure a higher economic and spatialhorizon, comparing with the lower scale, as NUTS3, that remain too fragmented. The scale of theproblems requires a broader vision, which goesbeyond a lower regional/ local perspective. Therole of the State in public policy management hasdramatically weakened since transition began.The Regions could take on an important role forregulation and improving efficiency, provided thatenough institutional capacities exist.
11. To take advantage of the position of the Central andEastern European areas within the Europeancontext – since it lies eastern side of the Pentagon,the dominant core areas of Europe, and on theWest side, as intermediary for a larger integrationareas toward non-member states. The strengtheningof economic ties with the Pentagon areas remainscrucial in order to facilitate processes for creatingspin-off: to improve the capacity of the large areasto compete.
12. To strengthen the diffusion of City Networkingin both directions, horizontally (on the baseof the same sizes) or vertically (on the baseof specific targets but involving differentsizes cities/towns). the benefit of variouscooperation schemes can be sensitive. Citynetworks, both those based on proximity andthose based on spatially distant partnerships can become a strong instrument forcounter balancing excessive polarisation anddisparit ies. The involvement of differentinstitutional layers, including regional andlocal (town or city) is important, as strategiccooperation can bring an improvement of theintegration and diffusion of experience andpolicy implementation efficiency (best
repus_FINALREPORT.qxd 2007. 09. 20. 16:28 Page 108

and further into the core of Europe (the Pentagon),and to the east, the Baltic, the new accessioncountries, i.e. Romania and the non-EU countries,i.e. Russia and Ukraine.
• The idea of Central and Eastern Europe overcomingthe position of being a simple periphery of thePentagon is fundamentally based on possiblenew connectivity and networking among the newmember states’ capital cities, as accessibility towill improve in the near future. Also included inthe network are the other cities (urban areas)which structure the respective urban settlementsystem, in particular medium-sized cities. Thenumerous regional cities against the backgroundof cooperation areas represent the strong potentialfor networking to overcome the excessivepolarisation around the capitals, against thebackground of the sparsely or densely locatedsmall towns. (See Map 52)
The second synthesis map presents the largeareas of existing and potential cooperation (Map52), including cross-border, network potential,main areas of urban density (large/medium/smalltowns and cities) and proximity. There are criticalareas where there is both the highest populationpotential in term of size and density and the morediffused type or more peripheral areas. Thehypothesis is to identify large areas of potentialco-operation on the basis of similar urbansettlement structure and common spatial andeconomic development problems.
Main areas of co-operation for a policy-oriented strategy
1. Blue: Central areas (RePUS’ blue banana) NorthHungary up to Vienna –Bratislava, Czech Republicwith Brno: most densely populated and with thegreatest potential; many large urban areas(metropolises) plus medium-sized towns andcities (potential regional capitals), plus a largenumber of small towns.
2. Pink: Southern Poland development axis includingthe Ostrava agglomeration: the second greatestpotential with a strong centre in Kraków-Katowice-Opole-Ostrava (Upper-Silesian cluster).
3. Green: southern cooperation areas: Slovenia-Italyintegrated with Austria/Hungary: new potentialcross- border areas and improved accessibility,metropolitan areas, medium-sized towns and
cities and many small towns.4. Light Blue: North-South integration areas: from
Katowice-Cracow to Budapest for better centralarea integration. Large cities are close to smalltowns and there is strong potential for high urbandensity in the two large metropolitan areas.
5. Violet: Capital regions with future potentials: a. Central Poland: Warszawa – Lódz – Poznan:
strong second areas in Poland with potentialalso for integration with weaker border areasare the east and north.
b. Central Czech: Prague metropolitan areasintegrating with north-west small to medium-sized towns and the regional capital, Plzen,which is surrounded by German borders. Thereis potential in the future (there are disparitiesinside these areas).
6. Orange: large border areas with peripheralproblems: three different areas: Two in Poland: Northern Poland / Eastern Polandand one in the South of Hungary: there is potentialfor co-operation with countries further east andnew accession countries. There are several medium-sized towns and cities and many small cities inHungary, with important potential for localdevelopment. In Poland, these are more sparselylocated, with a few major isolated urban poles.Here too, the balance between metropolitan areas,large and medium-sized cities, and small towns iscrucial for a spatial vision and a less hierarchicalperspective. Integration of sub-urbanisationsystems can facilitate effectiveness and efficiency.
Six cooperation and development areas may also havestrategic importance, as they could be based oncommon features and economic ties. The Central andEastern European area thus demonstrates newopportunities for devising diversified strategies totackle the problems of territorial imbalances atdifferent levels and by different priorites.
109
repusfinalreport
´
repus_FINALREPORT.qxd 2007. 09. 20. 16:28 Page 109

• BATTEN D.F. (1995) “Network cities; creativeurban agglomerations for the 21st century”, UrbanStudies, 32(2), pp. 313-327
• BAYCAN LEVENT T., KUNDAK, S. andGULUMSER, A.A. (2004), ”The role of ”network ofcities” in construction of global urban culture”,Paper presented in the 44th European Congress ofthe European Regional Science Association, Porto
• Belsky E.S. and Karaska, G.J. (1990),”Approaches to locating urban functions in devel-oping rural areas”, International Regional ScienceReview, vol. 13, no. 3, pp. 225-240
• CAMAGNI R. (2007), “Interregional disparities, ter-ritorial policies and city networks in New MemberCountries of the EU”, Working Paper, Milan
• COMMISSION OF EUROPEAN COMMUNITY(CEC) (1994) Europe 2000 + : Co-operation forEuropean territorial development. Luxembourg:Office for Official Publications of the EuropeanCommunity
• COMMISSION OF EUROPEAN UNION (2007),Fourth Cohesion Report. Growing Regions,Growing Europe, Luxembourg: Office for OfficialPublications of the European Community
• DAVOUDI S. (2000) Making sense of the ESDP,Town and Country Planning, 68(12), pp. 367-369
• Davoudi S. (2002), “Polycentricity: what does itmean and how is it interpreted in the ESDP?”,Paper presented at the EURA Conference Urbanand Spatial European policies: Levels of TerritorialGovernment, Turin
• DAVOUDI S. (2003) Polycentricity in EuropeanSpatial Planning: From an analytical tool to a nor-mative agenda, European Planning Studies, De-cember, 8(11), pp. 979-999
• Erickcek G.A. and McKinney, Hannah (2004),“Small cities Blues: looking for growth factors insmall and medium sized-cities”, Upjohn InstituteWorking Paper
110
• ESDP (1997) European Spatial Development Perspective, first official draft (Noordwijk). Luxem-burg: CEC.
• ESDP (1999) European Spatial DevelopmentPerspective, Towards Balanced and sustainableDevelopment of the Territory of the EU. Luxem-burg. CEC
• ESPON 1.1.1 (2005), Urban Areas as nodes in apolycentric development
• ESPON 2.1.1 (2005), Territorial Impact of EU trans-port and TEN policies
• ESPON 3.2. (2006), Scenario
• ESPON 1.4.1. (2006), The Small and MediumCities (SMESTO)
• ESPON, (2006), ESPON ATLAS, Mapping thestructure of the European territory
• ESPON, (2006), Territory matters for competitive-ness and cohesion
• EU (2006), Cohesion policy in support of growthand jobs. Community Strategic Guidelines 2007-2013, Bruxelles
• EU (2007), Territorial Agenda of the EuropeanUnion: Towards a More Competitive andSustainable Europe of Diverse Regions
• Gaile G.L. (1992), “Improving Rural-Urban link-ages through small town market-based develop-ment”, Third World Planning Review, vol. 14, no. 2,pp. 131-148
• Hamilton F.E.I, DIMITROVSKA Andrews K., PICH-LER-MILANOVIC N. (2005) “Transformation ofcities in central and eastern Europe: towards glob-alization”, Tokyo-New York-Paris: UNU Press
• HEALEY P. (1998), “Building institutional capacitythrough collaborative approaches to urban plan-ning”, Environment and Planning, vol. 30, pp.1531-1546
repusfinalreport
SELECTED REFERENCES REPUSˆ
repus_FINALREPORT.qxd 2007. 09. 20. 16:28 Page 110

• Kearns A. (2004), “Social Capital, Regenerationand Urban Policy”, ESRC Working Paper
• KRATKE S. (2001) “Strengthening the polycentricurban system in Europe: conclusions from theESDP”, European Planning Studies, 9(1), pp. 105-116
• Krugman P. (1998), “Space: the final frontier”,Journal of Economic Perspectives, vol. 12, no. 2,pp. 161-174
• KUNZMANN K.R. and WEGENER, M. (1991) “Thepattern of urbanization in Western Europe”,Ekistics 350, September, pp. 282-291
• OECD (2002), Redefining territories: The functionalregions, Paris
• OECD (2006), Competitive Cities in the GlobalEconomy, Paris
• OECD (2007), Competitive Cities: a NewEntrepreneurial Paradigm, Paris
111
repusfinalreport
repus_FINALREPORT.qxd 2007. 09. 20. 16:28 Page 111

repus_FINALREPORT.qxd 2007. 09. 20. 16:28 Page 112


![arXiv:1710.00961v1 [physics.flu-dyn] 3 Oct 2017web.stanford.edu/group/prakash-lab/cgi-bin/labsite/wp-content/... · bacteria [Schuler and Frankel(1999),Zborowski et al.(2003)Zborowski,](https://img.pdfslide.us/doc/110x75/5c775ef009d3f229578bc3ef/arxiv171000961v1-3-oct-2017webstanfordedugroupprakash-labcgi-binlabsitewp-content.jpg)