Embed Size (px)
Citation preview
85
Student ratings are one of the most widely used measures of teaching in education today. All users should understand what the numbers mean and how they should and should not be used.
Interpreting the Numbers: Using a Narrative to Help Others Read Student Evaluations of Your Teaching Accurately
Jennifer Franklin
Your academic livelihood or reputation may someday depend on how oth-ers interpret the evaluations your students have given you and your course.Like them or not, ratings are now in use in over 90 percent of all collegesand universities in the United States (Seldin, 1984) and are in widespreaduse by faculty committees and academic administrators such as deans anddepartment chairs to make personnel decisions: merit review, promotion,and tenure for tenure-track faculty and hire-or-fire decisions for adjunct fac-ulty. Submitting a well-written, well-reasoned narrative discussing your stu-dents’ evaluations of your teaching (that is, ratings) is an opportunity toimprove the odds that your reviewers will consider your students’ opinionsin the full context of the complex factors that shaped them. The reflectionneeded to write an effective narrative can help you in two important ways.The first is that you defend yourself from misuse of your ratings (and indoing so increase the incentive for academic decision makers to do a betterjob of using ratings for everyone). A narrative can help your reviewers gaina fuller understanding of ratings as a valuable but imperfect measure ofteaching effectiveness and therefore help them avoid common misinterpre-tation and misuses of data that can adversely affect their evaluation of yourteaching. A narrative can also remind colleagues that they, not your stu-dents, are the evaluators of record. Student evaluations are data for reviewby colleagues, not canned, ready-made evaluations on which to base per-sonnel decisions.
NEW DIRECTIONS FOR TEACHING AND LEARNING, no. 87, Fall 2001 © John Wiley & Sons, Inc.
9
86 TECHNIQUES AND STRATEGIES FOR INTERPRETING STUDENT EVALUATIONS
The second way that writing a narrative can help is to offer you insightthat can help you improve your ratings by improving your teaching. Writ-ing a ratings narrative can also benefit your own education and develop-ment as a scholar of teaching as a discipline as well as a scholar who teachesa discipline. Just as keeping a journal can foster reflective practice as ateacher, taking the time to consider and record what your student ratingsmean to you can provide new insights into your teaching practices and yourrelationship with your students. The challenge is to convey the meaning andimportance of your students’ feedback at the same time you put your rat-ings data in perspective.
Although students have much valuable feedback to offer, including rat-ings when properly collected, do not assume that those who will examinethese ratings have the necessary skills and knowledge to use them withinguidelines recommended by ratings experts. There is too much evidence tothe contrary. My colleague Michael Theall and I have conducted severalstudies over the past fifteen years examining what ratings users know abouthow ratings data should be used. In one multi-institutional study, more thanhalf of the faculty using ratings of their colleagues could not answer basicquestions about the common statistics that appear on typical ratings reports,such as means and standard deviations. Others were willing to use data sub-stantially flawed by poor sampling within classes or across an instructor’steaching load simply because it was “better than no data” (Franklin andTheall, 1989; Theall and Franklin, in press). Our findings have given rise tothe concerns and suggestions in this article.
Evaluate the Evaluation Process
Whatever purpose you have for constructing a narrative, understandinghow student ratings in your campus’s appraisal process compare with widelyrecognized standards for good practice can provide perspective. If your rat-ings are being used for personnel decisions, a narrative can explain whyyour ratings are really great or, if they are not, mitigate the damage they maycause. Understanding how ratings are supposed to work according to stan-dards for good practice can serve you either way if you are able to articulateauthoritatively why your ratings should or should not count in an evalua-tion of your teaching effectiveness.
The first premise of a well-constructed faculty evaluation plan is thatteaching is a multidimensional enterprise—that is, that faculty have manyroles as teachers: developing course content, planning courses and instruc-tional activities, constructing course materials, presenting instructionalinformation, assessing student learning, giving students instructional andmotivational feedback, and, more recently, course Web developer, to namejust some. The second premise is that there are potentially multiple sourcesof data concerning each role. Student feedback is only one such source and
87INTERPRETING THE NUMBERS
is not equally applicable to every role. Potential sources of data concern-ing the various dimensions of teaching include students, alumni, facultywho are content experts, faculty who are pedagogical experts, administra-tors such as department chairs, specialists such as faculty developers,instructional developers, evaluators, and, of course, the instructor beingevaluated.
The more sources of data and the better matched they are to the dimen-sion of teaching being considered, the better the overall plan is. For exam-ple, students are unlikely to be the best judges of the quality, currency, oraccuracy of course content; expert colleagues in the field are. Thus, thewidely used ratings items asking students to judge the expertise of a teacherare unlikely to provide the most valid data. However, compared with a vis-iting colleague untrained in systematic observation techniques who spendsan hour and a half observing one class, students who spend an entire semes-ter in a course are uniquely qualified to comment on the pace of the instruc-tion, the classroom atmosphere, or whether difficult concepts are presentedclearly. Arreola’s excellent, practical guide to comprehensive faculty evalu-ations systems, Developing a Comprehensive Faculty Evaluation System(2000), can help assess the quality of a department’s process.
The following factors are vital to get valid and reliable data about teach-ing performance from ratings:
Ratings questionnaires must be properly constructed and administered.Ratings data must be summarized in formats that provide readers with
essential information about response rates, frequencies, average or typi-cal (mean or modal) response, information about the spread or dispersionof student responses, and, if possible, benchmarks based on a criterion ornormative data.
Those who will use the data must have the information they need for analy-sis and interpretation using the reports as provided.
The interpretations and conclusions that result must be evaluated andapplied in the context of a well-constructed, comprehensive, and effec-tively implemented system for evaluating teaching
There are a lot of qualifications and even hedges in these assertions, butin essence, if ratings are used properly, they can provide useful informationabout the quality of instruction students have received. In my experience,the greatest amount of care is put into the first step, and the rest is taken forgranted. The resulting problem is that no matter how good the question-naire was, if reviewers lack the needed skills and knowledge, the ratings areno more than a Rorschach test with numbers instead of inkblots. Readerswill look at the report and imagine they see what they already believe, a fineconclusion if they are already convinced you are a fabulous teacher, butwhat if they are not so inclined? Your narrative is an opportunity to put
88 TECHNIQUES AND STRATEGIES FOR INTERPRETING STUDENT EVALUATIONS
some objectivity back into the numbers by raising questions about the con-text of the data being considered.
The Most Common Ratings Problems
To get the most effect from your narrative, you should be prepared to iden-tify and address the most common and potentially harmful types of errorsin ratings: misuse of data, bad data, and misinterpretation of ratings.
Even your best effort might not outweigh strongly entrenched bad fac-ulty evaluation practices, but the efforts you make in this direction will atleast be preparation should you need to explore legal remedies if you areharmed by those practices. Even if your ratings are less than optimum, stan-dards for good practice in ratings use are similar to standards for dueprocess. In a fair personnel action, bad, misused, or misinterpreted data can-not be used against you.
Misuse of Ratings Data. Student ratings are all too frequently givenundue weight in judging teaching effectiveness. To understand the problemof overreliance on ratings data, first consider a probable source of the prob-lem. Finding the best available match between a dimension of teaching andthe best available data is often a challenge. Some otherwise good sources,such as multiple, trained observers coming to your classroom several times,may not be affordable or available. Overreliance may also result from a ten-dency to view numbers as more objective and possibly less subject to disputethan more qualitative approaches. Peer evaluation is often avoided lest itstrain collegiality. Whatever the cause, if ratings are overused at your insti-tution, keeping a teaching portfolio that also includes a narrative analysis ofyour ratings can offer you an opportunity to inject more data in the decision-making process when it is needed to demonstrate your performance acrossa broader range of teaching roles and activities.
Conversely, underreliance on ratings is a problem that occurs when rat-ings are ignored. It is not uncommon for administrators to collect ratingsfor the appearance of objectivity, but then effectively set them aside, basingdecisions on faculty reputation or students’ written comments, particularlywhen the reviewers are not comfortable using numbers or doubt the valid-ity of ratings. This is probably more likely to occur when administrators orcommittees receive quantitative summaries of ratings items along with stu-dents’ written comments. Reviewers appear to gravitate toward students’written comments because they appear richer and more readily inter-pretable. You may need to explain why the opinions of the majority of theclass as reflected in the ratings should outweigh the articulate but negativewritten comments of one or two students. My views on the use of writtencomments in personnel decision-making processes can be found in a posi-tion paper written to advise faculty at my campus:
Summarizing raw written comments necessarily requires interpretation, para-phrasing, and reduction. Different interpreters often understand single writ-
89INTERPRETING THE NUMBERS
ten comments and patterns of comments differently. Without a strategy forinterpreting written comments, subjectivity can easily distort interpretations,especially when the evaluators know the person being evaluated. Evaluatorsmay be unduly influenced by a single highly articulate opinion, positive ornegative. The use of multiple readers and systematic content analysis meth-ods can address the reliability problem; however their implementationrequires skill and resources [Franklin and Berman, 1997].
If your ratings are strong and will help your case but are being ignored,your ability to decode your ratings for your readers and persuasively con-nect them to fundamental validity arguments grounded in ratings researchmay put your ratings back on the table. The challenge is to make the dataspeak. (See the article “Making Sense of Student Written Comments” in thisvolume for a discussion of how to analyze written comments.)
Bad Ratings Data. Bad data are data that are potentially misleading oruninformative because the questionnaire used to obtain them was badlyconstructed, inappropriate to the situation, or administered incorrectly orbecause the data have been processed, analyzed, or reported incorrectly. Ifyou believe your ratings data are suspect due to such a problem and mightresult in or contribute to an adverse personnel action, a careful analysis ofthe problem in your narrative might put reviewers on notice not to overrelyon the data. First consider that bad data can come from any or all of thesesources: a badly constructed questionnaire, improper administration of thequestionnaire, or errors in data processing or analysis.
Questionnaire Construction. Locally constructed questionnaires varydramatically in quality. Unless the department or institution uses a profes-sionally developed, nationally known rating questionnaire with publishedvalidity and reliability data, or perhaps consulted with ratings experts todevelop the campus ratings system, do not assume your questionnaire is agood one or that all of the items in it are working as they were intended.Look for a technical report if the questionnaire was institutionally con-structed.1 If reading validation reports of survey instruments is not in yourarea of expertise, enlist a colleague in a discipline that includes surveyresearch to help you. If your questionnaire has not been assessed for valid-ity and reliability and you are concerned that it has problems that may becausing harm to faculty careers, contact a professional with expertise in rat-ings for advice. Familiarity with survey methodology alone is not sufficient;familiarity with student ratings as a measure of teaching performance isneeded.
Common problems include technical areas such as poorly constructeditem stems (questions). An example is the common double-barreled item,which asks two questions at the same time—for example, “Rate the assign-ments and the exams.” Other problems include overly complex or ambigu-ous stems or poorly scaled response options. Another common problemstems from questions that are irrelevant to good teaching or that studentsare not well suited to answer. Detecting the latter requires a careful reading
90 TECHNIQUES AND STRATEGIES FOR INTERPRETING STUDENT EVALUATIONS
of the literature, such as the sources recommended in this article. Do notassume that because you teach, you know what questions should be askedof students.
Questionnaire Administration. Improperly administered ratings ques-tionnaires can result in badly skewed data or even data that have been tam-pered with. In the case of paper questionnaires, end-of-term ratings shouldbe administered during a class well before exam week begins and by amember of that class while the instructor is out of the room. The instruc-tor should refrain from making prejudicial introductory remarks. Studentsshould be cautioned not to discuss their responses with each other at leastuntil after all forms have been turned in. The forms should be returned bythe students unsigned in a sealed envelope to an independent, secure loca-tion, and no results should be reported to the instructor until after gradeshave been filed.
The identity of the student monitor should be recorded. In addition tomaintaining student anonymity, students should be informed that theirresponses are confidential and that the instructor will see only groupedanonymous data. Otherwise, students have a strong incentive to inflate theirratings. If there is a comment section on the form and the whole form goesback to the teacher, students will be concerned that their handwriting maybe recognized, and therefore neither their ratings nor their comments areanonymous.
A new technique, administering questionnaires by computer synchro-nously in a computer lab or asynchronously using Web-based forms, mayhave a variety of problems related to administration, depending on how itis implemented. Although there is some preliminary evidence that a well-constructed form can successfully be delivered on-line, I believe there aremany potential problems, and it is premature to conclude that the paper andcomputer methods are equivalent. This raises questions for performanceappraisal, a process that requires consistency for fairness sake. Moreover,unvalidated Web delivered ratings questionnaires are still that: unvalidated.
Errors in Data Processing or Analysis. No matter how well a question-naire is constructed or administered, there is one last opportunity for get-ting bad data: incorrect data or summaries of data resulting from dataprocessing errors, errors of calculation, and programmatic errors causingthe wrong information to be printed on reports. The gold standard forchecking results is to have the original answer sheets and recalculate ques-tionable results by hand. At a minimum, you should look at your reportswith a critical eye. Do not take accuracy for granted. Remember that thecomputers that produce your report were programmed by humans.
Misinterpretation of Ratings Data. The sources and types of misin-terpretation are as varied as there are interpreters. It is beyond the scope ofthis article to identify more than a few things to watch out for, but in myexperience errors fall in three general categories: errors of statistical under-standing, unfounded generalizations about the characteristics of ratings, and
91INTERPRETING THE NUMBERS
a general lack of applicable information about effective teaching practicesand course design.
Evaluating Your Ratings Data
Making a realistic assessment of the generalizability of your ratings is anessential first step; errors of interpretation typically start with a failure toconsider whether the questions were appropriate in the first place or datacollected are consistent enough to support any conclusions at all. Take timeto study the questionnaire used to collect your ratings, how it was admin-istered, and how the results have been summarized before you begin todraw inferences about your teaching from the data.
The primary concerns are validity (whether the questionnaire measuresteaching effectiveness directly or indirectly) and reliability (how faithfullyit measures your teaching effectiveness across the many students whoresponded and the many classes that were rated). Generalizing from the rat-ings data you have to the larger questions such as how well you teach orhow good your course is requires answering questions such as these:
Was the questionnaire well constructed and suitable for use in your course?How representative of your students’ views are these data?How well do they agree with each other?Looking across your courses, do you have enough data from enough courses
to generalize about your overall teaching effectiveness or your teachingeffectiveness within various areas of your teaching load?
Were the data collected and analyzed correctly?
If you suspect any problems in this area, consider addressing them in yournarrative if you are concerned that your ratings may have a negative influ-ence on your performance appraisal.
Validity. The validity of the questionnaire is determined by the natureof the questions it asks, as well as how and to whom it is administered. Arethe questions singly and as a set capable of measuring what they purport tomeasure? For example, if a question asks about a characteristic of a teacher,it must have a foundation in research showing a clear connection betweenthat characteristic and teaching effectiveness, and students must be capableof observing that characteristic. If you want to ascertain the potential valid-ity of a ratings questionnaire, the surest way is to consult a source such asDoyle (1983) or an expert on ratings. That said, give or take an item or two,most questionnaires are probably acceptable, assuming that they are not theonly source of data.
Reliability. Many of the most egregious errors seem to occur in thewillingness of decision makers to rely on data that cannot be assumed to berepresentative of your average or typical teaching performance. A key con-cept behind using ratings from one or more courses is that the ratings
92 TECHNIQUES AND STRATEGIES FOR INTERPRETING STUDENT EVALUATIONS
obtained should be generally representative of your teaching in that partic-ular kind of course. You do not need ratings from every course if you haveenough samples of your ratings from which to generalize reliably. What isthe likelihood that an item would yield the same results when administeredon separate occasions under similar circumstances? How consistent are theresults in each class or from class to class? Nearly everyone who has taughtlong enough has experienced a course that went unusually well and has alsobeen disappointed by a course. Depending on how many courses you havetaught and how many courses’ worth of ratings are at hand, simply averag-ing the results may or may not be representative of your results. Every meanscore based on an average of many responses to a single question likely iscomposed of two parts: your hypothetical “true” score and the “error” inmeasurement.
There are many reasons that “error” can happen:
• The courses or the students within the courses may differ in waysthat are likely to be associated with systematic differences in ratings. Forexample, having an unusually large number of graduate students in anupper-level course one semester could make a difference in the resultsbecause graduate students tend to rate faculty higher than do undergradu-ates, all other things being equal.
• There may not be enough courses to calculate what is typical. Thisis complicated by the size of the classes. It takes many more instances ofsmall classes to constitute a representative sample than it does for largerclasses because as the number of observations (student ratings) increases,the more closely the mean of those ratings will approach a true score. Obvi-ously, the impact of one student’s accidentally marking the wrong bubble onthe average of all students’ ratings is far less in a class of fifty than in a classof five.
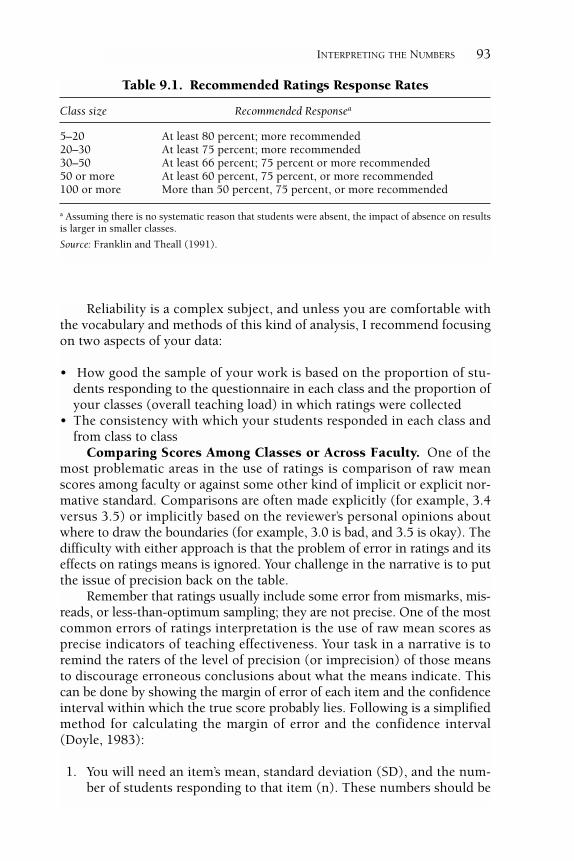
• There may not be enough students responding compared to totalclass enrollment within one or more of the courses, making the results fromthose courses not representative of all the students in the courses. Gener-ally, the higher the proportion of respondents to students enrolled, the morereliable the results will tend to be, and, at the same time, the smaller theclass enrollment, the higher that proportion will need to be to ensure thatthe sample is reasonably representative. Table 9.1 provides a set of roughguidelines for determining if a reasonably adequate sample has beenobtained.
• Averaged results from comparable courses taken over several semes-ters are likely to be considerably more reliable for comparisons than thosefrom single courses. The number of courses required to construct “average”results increases as the class size decreases. Generally, five or more coursesare recommended in most cases, although very small classes certainly needmore. For example, courses with as few as five students may need twentysections for comparison (Centra, 1993).
93INTERPRETING THE NUMBERS
Reliability is a complex subject, and unless you are comfortable withthe vocabulary and methods of this kind of analysis, I recommend focusingon two aspects of your data:
• How good the sample of your work is based on the proportion of stu-dents responding to the questionnaire in each class and the proportion ofyour classes (overall teaching load) in which ratings were collected
• The consistency with which your students responded in each class andfrom class to class
Comparing Scores Among Classes or Across Faculty. One of themost problematic areas in the use of ratings is comparison of raw meanscores among faculty or against some other kind of implicit or explicit nor-mative standard. Comparisons are often made explicitly (for example, 3.4versus 3.5) or implicitly based on the reviewer’s personal opinions aboutwhere to draw the boundaries (for example, 3.0 is bad, and 3.5 is okay). Thedifficulty with either approach is that the problem of error in ratings and itseffects on ratings means is ignored. Your challenge in the narrative is to putthe issue of precision back on the table.
Remember that ratings usually include some error from mismarks, mis-reads, or less-than-optimum sampling; they are not precise. One of the mostcommon errors of ratings interpretation is the use of raw mean scores asprecise indicators of teaching effectiveness. Your task in a narrative is toremind the raters of the level of precision (or imprecision) of those meansto discourage erroneous conclusions about what the means indicate. Thiscan be done by showing the margin of error of each item and the confidenceinterval within which the true score probably lies. Following is a simplifiedmethod for calculating the margin of error and the confidence interval(Doyle, 1983):
1. You will need an item’s mean, standard deviation (SD), and the num-ber of students responding to that item (n). These numbers should be
Table 9.1. Recommended Ratings Response Rates
Class size Recommended Responsea
5–20 At least 80 percent; more recommended20–30 At least 75 percent; more recommended30–50 At least 66 percent; 75 percent or more recommended50 or more At least 60 percent, 75 percent, or more recommended100 or more More than 50 percent, 75 percent, or more recommended
a Assuming there is no systematic reason that students were absent, the impact of absence on resultsis larger in smaller classes.
Source: Franklin and Theall (1991).
94 TECHNIQUES AND STRATEGIES FOR INTERPRETING STUDENT EVALUATIONS
supplied by the survey administrators. As an example, for Item 2, themean is 4.4, SD is 0.52, and n is 10.
2. Divide the SD by the square root of n. This is the standard error of themean (how much the mean is likely to vary)—for example, 0.52/3.62[the square root of 10] � .16 (rounded to two decimal places).
3. Multiply the standard error of the mean obtained in Step 2 by 1.96 (astatistically based constant) to get the actual amount the mean mightvary: .16 � 1.96 � .31.
4. To get the 95 percent confidence interval, subtract the amount calcu-lated in Step 3 from the mean to get the lowest probable limit of yourtrue score. Then add the amount calculated in Step 3 to the mean to getthe highest probable limit of your true score. This range from the low-est probable limit to the highest probable limit is the 95 percent confi-dence interval. Your true score on that item will fall within this intervalwith a 95 percent probability—for example, lowest level � 4.4 � .31 �4.09; highest level � 4.4 � .31 � 4.71. The true score lies somewherebetween 4.09 and 4.71.
This means that if the confidence interval spans a really large range ofscores, the precision of that item is suspect; your true score could be any-where in that interval. If the confidence interval is a narrow range of scores,the item is a better measure from a precision standpoint.
If the thought of calculating these values sends shivers down yourspine, find an agreeable colleague or graduate student knowledgeable aboutstatistics to help you compute and understand them before you write yournarrative. But do understand them!
Comparing Your Results to Those of Others. Even if you knowwhere your own score most likely falls, it is not safe to conclude that twoapparently different means (for example, your own and that of the overalldepartment) are necessarily statistically different. The apparent differencemay be the result of chance or systematic error. However, having establishedthe precision of your own results, you can then compare them with anynorm or benchmark for ratings. If you have the standard deviation andnumber of courses for the overall department mean, you can compute the95 percent confidence interval of that mean as well. Using the procedurejust outlined, but with the mean and standard deviation for the overalldepartment group instead of the your mean and standard deviation and sub-stituting the number of courses in the overall department group for thenumber of student responses you used before, compute a confidence inter-val for the overall department mean on the same item. This allows you tocompare your data with the overall department mean.
One useful approach is to make a table (Table 9.2) showing your resultscompared with the department results and even indicate each time that yourresults are significantly higher than, at the same level as, or significantlylower than the department mean for the same item. In this example, yournarrative might say, “During the period from spring 1998 through spring
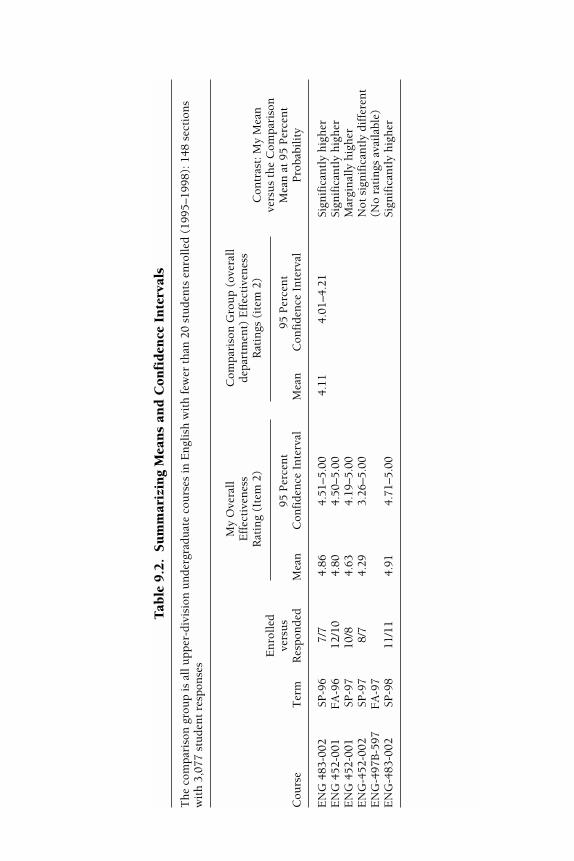
Tab
le 9
.2.
Su
mm
ariz
ing
Mea
ns
and
Con
fid
ence
In
terv
als
Th
e co
mpa
riso
n g
rou
p is
all
upp
er-d
ivis
ion
un
derg
radu
ate
cou
rses
in E
ngl
ish
wit
h f
ewer
th
an 2
0 st
ude
nts
en
roll
ed (
1995
–199
8): 1
48 s
ecti
ons
wit
h 3
,077
stu
den
t re
spon
ses
Con
tras
t: M
y M
ean
En
roll
edve
rsu
s th
e C
ompa
riso
nve
rsu
s95
Per
cen
t 95
Per
cen
t M
ean
at
95 P
erce
nt
Cou
rse
Ter
mR
espo
nde
dM
ean
Con
fide
nce
In
terv
alM
ean
Con
fide
nce
In
terv
alP
roba
bili
ty
EN
G 4
83-0
02SP
-96
7/7
4.86
4.51
–5.0
04.
114.
01–4
.21
Sign
ific
antl
y h
igh
erE
NG
452
-001
FA
-96
12/1
04.
804.
50–5
.00
Sign
ific
antl
y h
igh
erE
NG
452
-001
SP-9
710
/84.
634.
19–5
.00
Mar
gin
ally
hig
her
EN
G-4
52-0
02SP
-97
8/7
4.29
3.26
–5.0
0N
ot s
ign
ific
antl
y di
ffer
ent
EN
G-4
97B
-597
FA
-97
(No
rati
ngs
ava
ilab
le)
EN
G-4
83-0
02SP
-98
11/1
14.
914.
71–5
.00
Sign
ific
antl
y h
igh
er
My
Ove
rall
Eff
ecti
ven
ess
Rat
ing
(Ite
m 2
)
Com
pari
son
Gro
up
(ove
rall
de
part
men
t) E
ffec
tive
nes
sR
atin
gs (
item
2)
96 TECHNIQUES AND STRATEGIES FOR INTERPRETING STUDENT EVALUATIONS
2000, I taught six upper-division courses, for which student ratings werecollected in five of six sections. (The student monitor lost the package inthe sixth section; see the note from the student.) My ratings of instructionaleffectiveness were higher than the department average for similar coursesbased on size and level four out of five times.” The important point for thisnarrative is that you have a statistically sound basis for concluding that yourratings are truly higher, or not different from, or truly lower than whateverstandard for comparison is being used.
Mitigating Circumstances and What Makes a Difference. Whateverthe comparison approach your evaluators may take, in order to make valid,useful comparisons among items, instructors, or sections, any comparisonsshould also take into account the following dictum: the more similar theclasses or sections being compared (in terms of, say, content, level of the stu-dents, class size, or prerequisite versus elective), the more valid the compar-ison is. However, in practice, another area of serious concern should bewhether the ratings users know what characteristics of teachers, students,and courses have actually been shown to be correlated with ratings. (Goodsources for this kind of information include Doyle, 1983; Feldman, 1978;Braskamp and Ory, 1994; Centra, 1993.)
Here are some things that research suggests may influence ratings, alongwith some suggestions about them:
• Years of teaching experience. This factor has a predictable (and intu-itively logical) influence on ratings that should be taken into considerationwhen comparing scores. The poorest ratings are usually obtained by instruc-tors with less than one year of experience. Teachers with between three andtwelve years of experience tend to receive the best ratings, and those withone to two years or more than twelve years receive relatively intermediateratings. If you are in the early stages of your career, this may be a useful factto point out.
• Class size. Students tend to rank instructors who are teaching smallclasses (fewer than twenty students) most highly, followed by those witharound twenty to forty students. The lowest ratings seem to occur in largeclasses with forty to sixty or so students, but ratings are slightly higher againfor extremely large classes, especially those larger than one hundred stu-dents. (I suspect that students abandon expectations for personal contactwhen classes are very large, but still hold faculty to them in large classeswhere personal contact may be possible but difficult.) If your institutionuses norms or comparison data that do not control for class size, use yournarrative to point out this problem if your ratings are lower than the com-parison ratings.
• Electives. Students tend to give slightly higher ratings to their majorsor electives than to courses taken to fulfill a requirement. If your teachingload is on the required side and your results are consistently compared with
97INTERPRETING THE NUMBERS
results from predominantly elective courses, you should point out the needfor a better match for comparison purposes.
• Discipline. Courses in the humanities tend to be rated more highlythan those in the physical sciences and engineering, with social and behav-ioral sciences falling in between. Courses with a concern for practice arerated higher than courses with a strong theoretical orientation. A variety ofother disciplinary differences have also been observed. Most sources agreethat ratings should not be compared across disciplines. If comparisons arenecessary, it is preferable to compare the standings of faculty within theirown disciplinary comparison groups. Of all the factors that could work tothe advantage or disadvantage of faculty, this is one of the most important.If your ratings are compared to a schoolwide mean or to comparison groupsthat include courses outside your discipline in the broadest sense, be pre-pared to challenge this in your narrative.
• Innovation. New or revised courses frequently get lower-than-expectedratings the first time out. This may be very important if you have been activein developing or revising a course for which you do not have abundant rat-ings. New courses make take time to work the bugs out, and consequentlyyou may have lower ratings than usual. In your narrative, point out that thecourse is new; then take a positive tack and describe how the ratings are help-ing you fine-tune or revise the course.
Some factors rarely influence ratings:
• Schedule. Time of day and scheduling factors within a semesterappear to have little or no influence on ratings. However, there may be sys-tematic differences in who attends classes at particular times, which mayhave some impact on ratings. One important exception is that summer ses-sion courses frequently receive higher ratings than comparable fall or springcounterparts, so avoid comparing summer data with main academic yeardata.
• Student ability. Academic ability of students as measured by gradepoint average has shown little relationship to the ratings they give; studentswho do poorly are just as appreciative of good teaching as students who dowell, and students who do well are just as critical of poor teaching as areless able students and perhaps a little more so (Theall and Franklin, 1990).Do not fall victim to the self-serving canard that your good students gaveyou the highest ratings. Unless your data have been cross-tabulated andshow that this was the case in your class, it is only speculation. Moreover,from another point of view, how well you teach the students who need youthe most is also a measure of your teaching skill.
The following factors have a more complex (and often ambiguous) rela-tionship to ratings include:
98 TECHNIQUES AND STRATEGIES FOR INTERPRETING STUDENT EVALUATIONS
• Workload and difficulty. Workload and course difficulty deserve spe-cial consideration. I have heard too many faculty and administrators dismissthe low ratings of a colleague because he or she also had a reputation forbeing tough on students or, conversely, that a highly rated teacher’s ratingsmust have been due to a lack of substance or challenge in the course.Although getting high ratings for a challenging course is commendable andshould be pointed out in your narrative, in the absence of high ratings, per-ceived difficulty could actually result from poor teaching and a heavy work-load. Although “academic rigor” is a common excuse for low ratings, it isnot by itself a sign of good teaching. Only a careful look by qualified peersat a course’s content, assignments, exams, and grading policy can determineif the level of challenge was instructionally appropriate.
• Grades and ratings. There is a moderate positive correlation betweenratings and expected course grades, although this alone does not demonstratethat ratings are biased by grades. There is a logical relationship between stu-dent satisfaction at anticipating higher grades and the ratings they give. Goodteachers have successful students who rate their teachers highly. This does notmean than an individual instructor will attempt to “buy” better ratings byreducing the work or challenge needed to earn a grade. Many faculty are con-cerned about the possibility that the rise in the use of ratings has caused wide-spread grade inflation. This may or may not be true. If it has, it is becausefaculty gave higher grades, not because students gave higher ratings. Givingstudents unearned good grades and reducing the effort needed to earn gradeshave been demonstrated to have virtually no payoff for raising ratings in thelong run, provided ratings are anonymous. Also, having a clear and fair grad-ing policy is one aspect of good teaching. Being a tough grader does not byitself signify good teaching. This concern is outside the purview of ratings asa measure of teaching performance and is better served by attention from cur-riculum and instruction committees by regular review of grade distributions.
When writing a narrative, it is useful to know which factors have beenshown to have some relationship to ratings and which have not. It is alsouseful to know that the significant associations between such variables andratings when they do occur are mostly weak ones and usually would notmake a noticeable difference in your ratings. One of the most natural thingsto do when reading evaluations of one’s own performance, especially whenthey are less than stellar, is to challenge the results by looking for reasonsthat the evaluations were wrong or biased by factors not under our control.It is in this area that misconceptions and mythology about ratings abound.
Pulling It All Together: Ratings and the Scholarship of Teaching
Understanding the basics about ratings is very helpful in interpreting them.That may seem too obvious to say, but I have learned not to take this forgranted. When misused, they may actually short-circuit useful discourse, so

99INTERPRETING THE NUMBERS
it is alarming to see how many faculty and administrators lacking criticalskills and information about ratings use them routinely to evaluate teach-ing performance. Whatever the cause, ratings are not doing as good a job asthey should in informing decisions that affect the careers of faculty. Nor arefaculty using them as productively as they might in informing their ownteaching practices. The causes for poor practice are complex and many, butthe remedy offered by faculty educating themselves about good practices forusing ratings data works on many levels.
When data from well-constructed ratings questionnaires become justone valued source of information among many in faculty evaluation andpersonnel decision-making processes, they can fuel active inquiry, reflec-tion, and practice for faculty, and they will cease to do the harm that has dis-credited them so often among faculty. An article such as this can point youin the right direction, but a deeper reading can also serve you well, depend-ing on how much you have at stake when ratings are used in evaluatingyour performance as a teacher. At minimum, it can help you seek out andidentify sources of expert advice if it is needed. In the long run, the reflec-tion required to construct a narrative analysis of your ratings offers anopportunity to engage in what we so often espouse for our students: activelearning, that is, learning about teaching.
Note
1. A good example of such a report and an exemplary ratings system can be seen onthe Web site of the Office of Educational Assessment at the University of Washington:www.washington.edu/oea/ias1.htm.
References
Arreola, R. A. Developing a Comprehensive Faculty Evaluation System. Bolton, Mass.:Anker, 2000.
Braskamp, L. A., and Ory, J. C. Assessing Faculty Work. San Francisco: Jossey-Bass, 1994.Centra, J. A. Reflective Faculty Evaluation. San Francisco: Jossey-Bass, 1993.Doyle, K. O. Evaluating Teaching. San Francisco: New Lexington Press, 1983.Feldman, K. A. “Course Characteristics and College Students’ Ratings of Their Teachers
and Courses: What We Know and What We Don’t.” Research in Higher Education,1978, 9, 199–242.
Franklin, J., and Berman, E. “Using Student Written Comments in Summative Evalua-tion.” In University of Arizona Administrators’ Guide to Using TCE Results. Tucson: Uni-versity of Arizona, Office of Instructional Assessment and Evaluation, 1997.
Franklin, J., and Theall, M. “Rating the Readers: Knowledge, Attitudes, and Practices ofUsers of Student Ratings of Instruction.” Paper presented at the Seventy-FourthAnnual Meeting of the American Educational Research Association, San Francisco,Apr. 1989.
Lewis, K. G., and Lunde, J. P. Face to Face: A Sourcebook of Individual Consultation Tech-niques for Faculty/Instructional Developers. Stillwater, Okla.: New Forums Press, 2001.
Seldin, P. The Teaching Portfolio. Bolton, Mass.: Anker, 1984.Theall, M., and Franklin, J. (eds.), “Student Ratings of Instruction: Issues for Improving
Practice.” New Directions for Teaching and Learning, no. 43. San Francisco: Jossey-Bass, 1990.
100 TECHNIQUES AND STRATEGIES FOR INTERPRETING STUDENT EVALUATIONS
Theall, M., and Franklin, J. “If I Had a Hammer: Some Thoughts on Appropriately UsingTechnology to Facilitate Evaluation.” In P. Cranton and C. Knapper (eds.), FreshApproaches to Teaching Evaluation. New Directions for Teaching and Learning, no. 87.San Francisco: Jossey-Bass, in press.
JENNIFER FRANKLIN is director of the Center for Teaching and Learning at Cal-ifornia State University, Dominguez Hills.