Embed Size (px)
DESCRIPTION
Interpretation of iTrace TM Aberrometry For Accommodative Lenses. Data provided by Deepak Chitkara, M.B., ChB. D.O. Donald R. Sanders, M.D., PhD. - PowerPoint PPT Presentation
Citation preview
Interpretation
of
iTraceTM Aberrometry
For Accommodative Lenses
Data provided by
Deepak Chitkara, M.B., ChB. D.O.
Donald R. Sanders, M.D., PhD.
This presentation describes the refractive maps produced by the Tracey iTraceTM aberrometer and compares the effects observed in normal phakic patients and with aphakic patients with monofocal or The TetraflexTM Accomodative IOL.
Accommodation―Non-presbyopic patient
The iTrace™ refractive map shows the eye’s refractive error at each point within the pupil. The maps shown are 2 dimensional and color-coded. For ease of understanding, hyperopic corrections are coloured blue, emmetropia is shown in green, and myopic corrections are shown in yellow, then orange and then red as the correction increases.
This is the standard refractive map obtained from the iTrace™ aberrometerfor a 30 year old non-presbyopic (normal) patient.
The map in the upper left is taken when the patient is viewing a distance target and that on the upper right is when a near accommodative target (an eye chart) is viewed. The lower map presents the difference between the distance and the near maps. In the normal accommodating patient, refraction is close to emmetropia when viewing a distance target and is myopic when viewing a near target.
Distance Map
Difference Map
Near Map
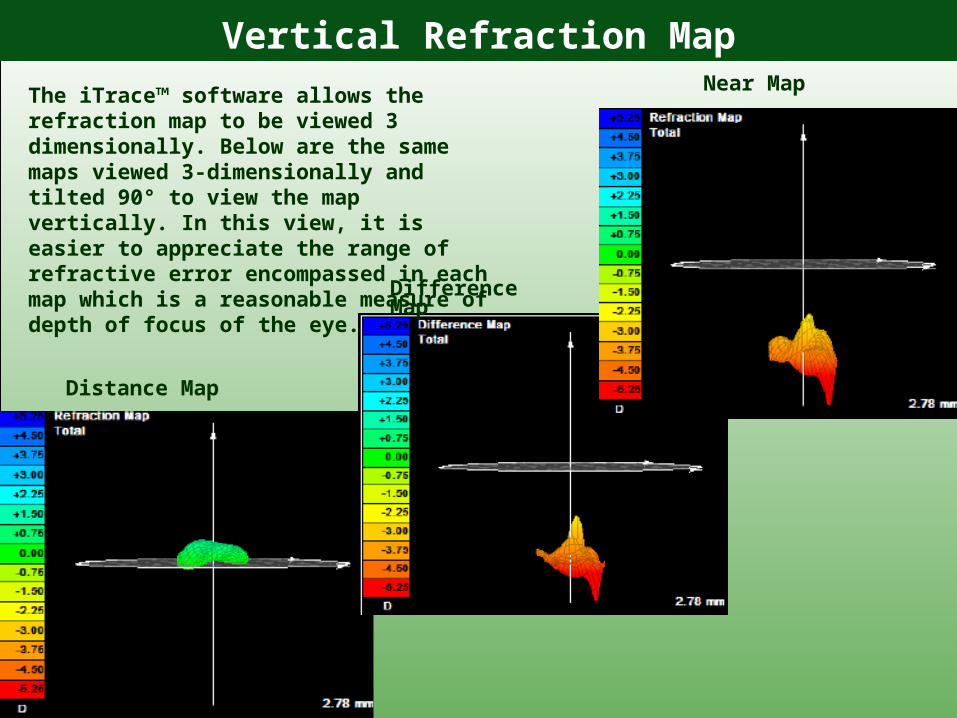
Vertical Refraction MapThe iTrace™ software allows the refraction map to be viewed 3 dimensionally. Below are the same maps viewed 3-dimensionally and tilted 90° to view the map vertically. In this view, it is easier to appreciate the range of refractive error encompassed in each map which is a reasonable measure of depth of focus of the eye.
Distance Map
Difference Map
Near Map
Interpretation of Maps-Normal Accommodation
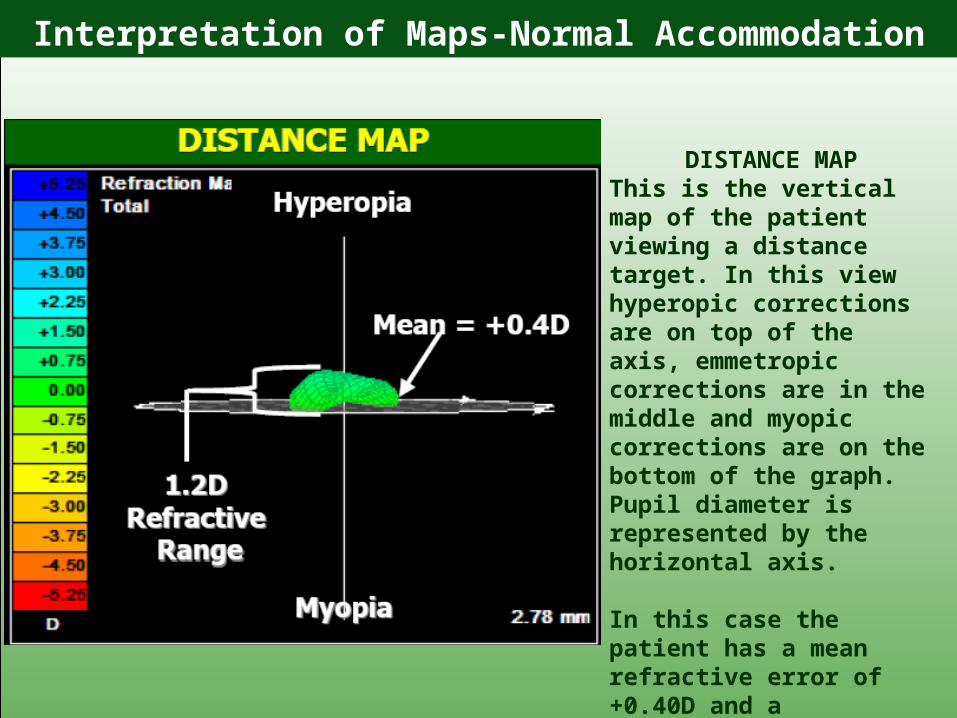
DISTANCE MAPThis is the vertical map of the patient viewing a distance target. In this view hyperopic corrections are on top of the axis, emmetropic corrections are in the middle and myopic corrections are on the bottom of the graph. Pupil diameter is represented by the horizontal axis.
In this case the patient has a mean refractive error of +0.40D and a refractive range of 1.2D when viewing a distant target.
Interpretation of Maps-Normal Accommodation
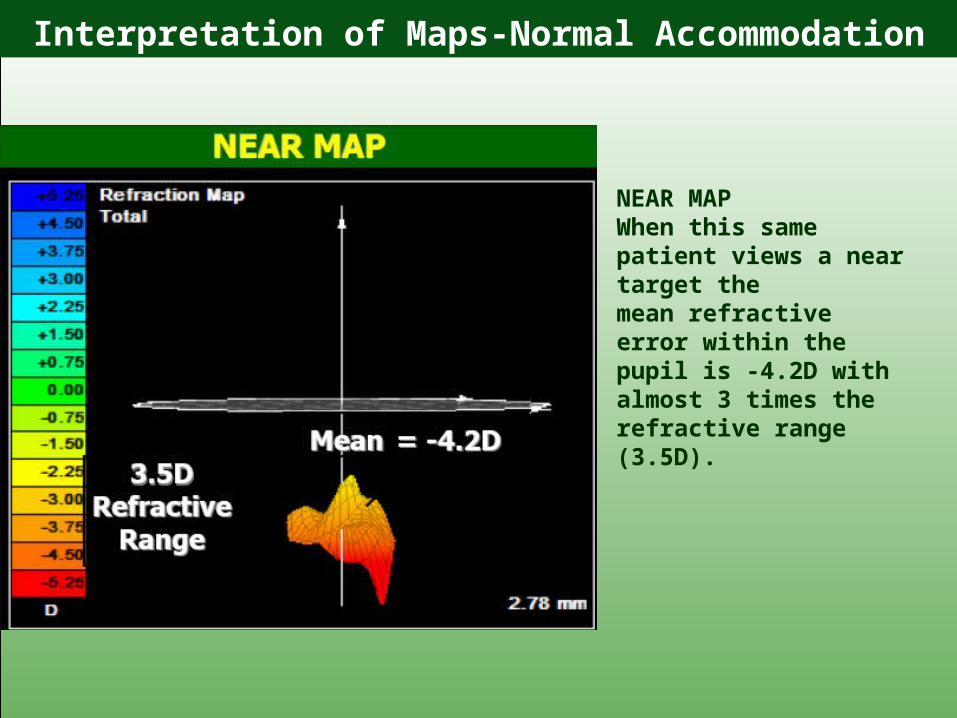
NEAR MAPWhen this same patient views a near target themean refractive error within the pupil is -4.2D with almost 3 times the refractive range (3.5D).
Interpretation of Maps-Normal Accommodation
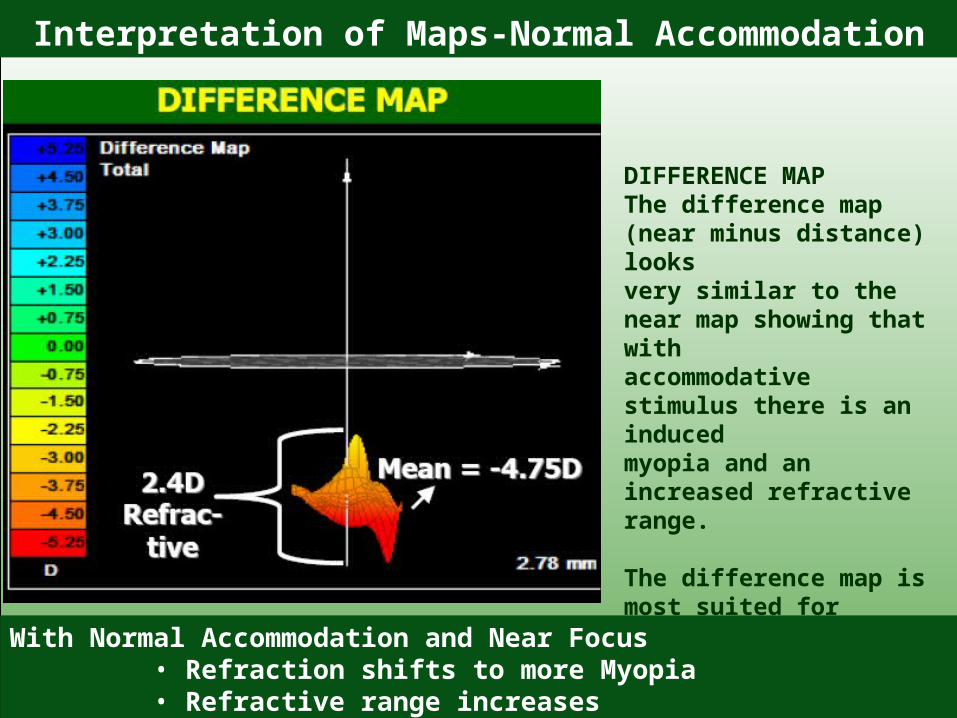
DIFFERENCE MAPThe difference map (near minus distance) looksvery similar to the near map showing that withaccommodative stimulus there is an inducedmyopia and an increased refractive range.
The difference map is most suited for assessingaccommodative amplitude.
With Normal Accommodation and Near Focus • Refraction shifts to more Myopia • Refractive range increases
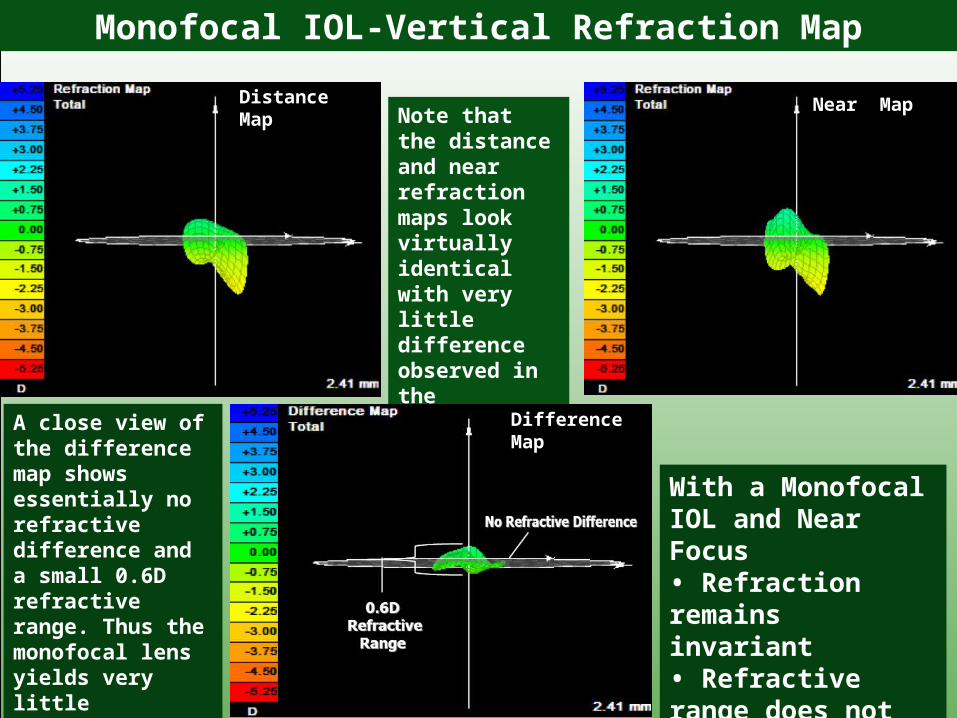
Monofocal IOL-Vertical Refraction Map
Note that the distance and near refraction maps look virtually identical with very little differenceobserved in the difference map.
A close view of the difference map shows essentially no refractive difference and a small 0.6Drefractive range. Thus the monofocal lens yields very little accommodative amplitude.
With a Monofocal IOL and Near Focus• Refraction remains invariant• Refractive range does not increase
Distance Map Near Map
Difference Map
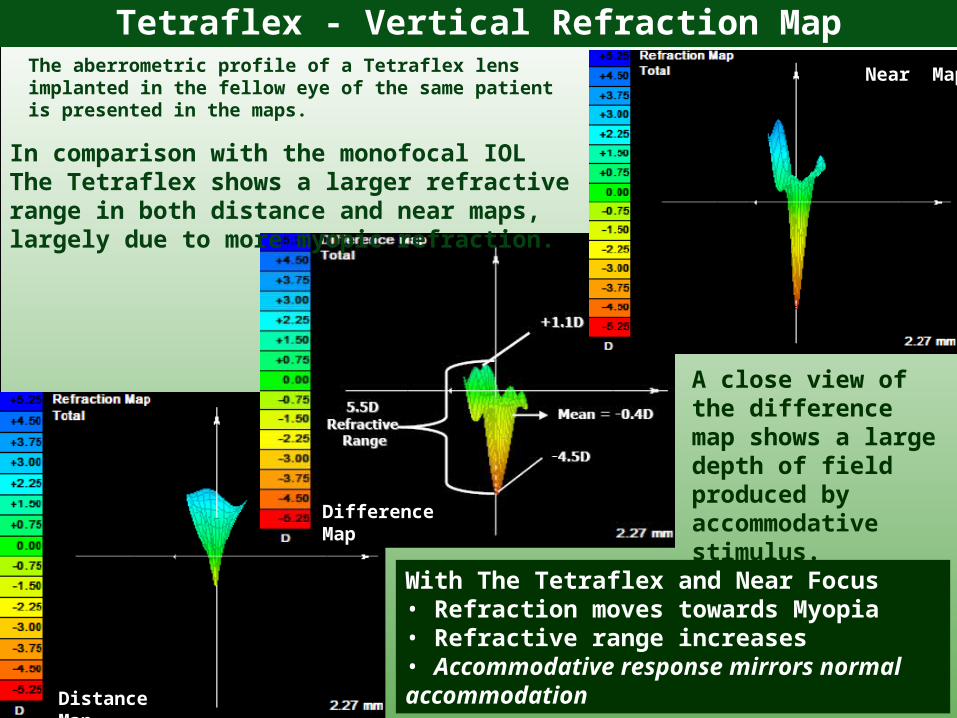
Tetraflex - Vertical Refraction MapThe aberrometric profile of a Tetraflex lens implanted in the fellow eye of the same patient is presented in the maps.
In comparison with the monofocal IOL The Tetraflex shows a larger refractive range in both distance and near maps, largely due to more myopic refraction.
A close view of the difference map shows a large depth of field produced by accommodativestimulus.
With The Tetraflex and Near Focus• Refraction moves towards Myopia• Refractive range increases• Accommodative response mirrors normal accommodationDistance Map
Near Map
Difference Map
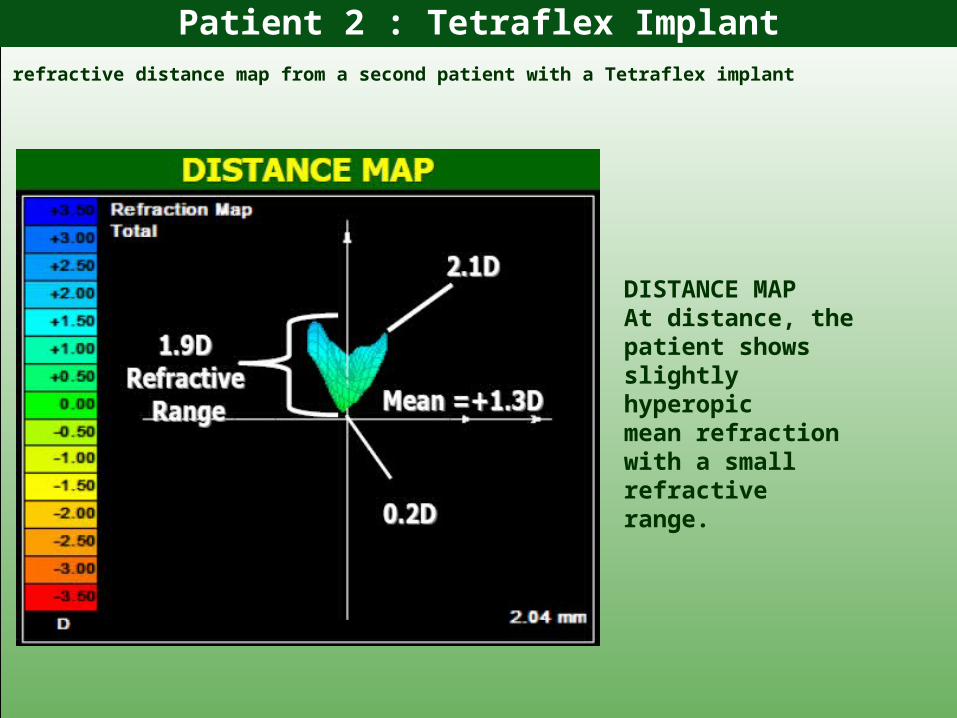
Patient 2 : Tetraflex ImplantiTrace refractive distance map from a second patient with a Tetraflex implant
DISTANCE MAPAt distance, the patient shows slightly hyperopicmean refraction with a small refractiverange.
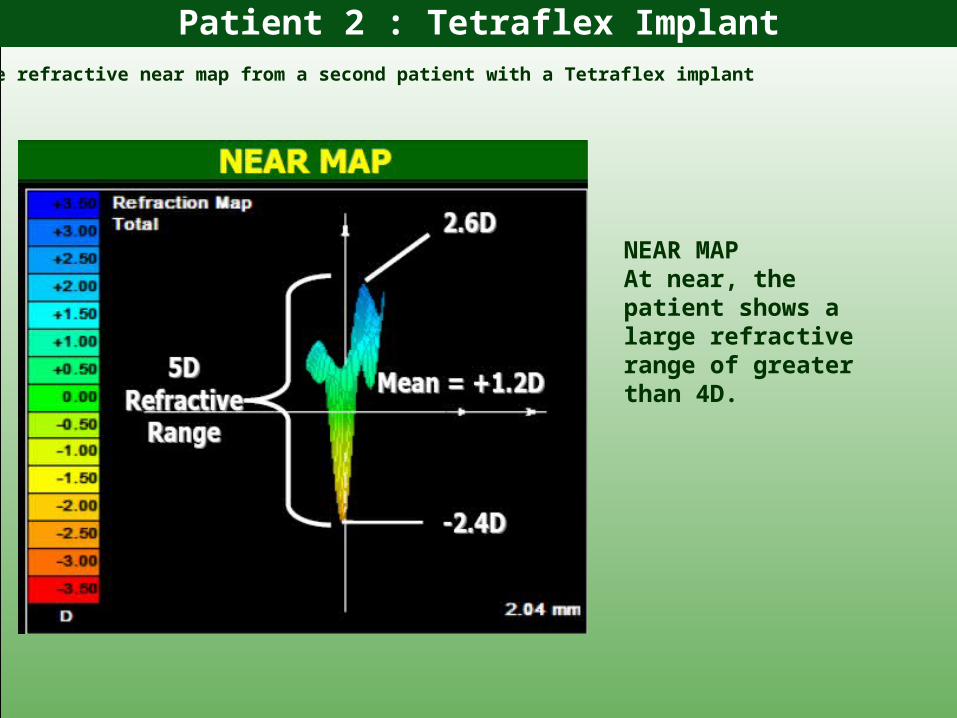
Patient 2 : Tetraflex ImplantiTrace refractive near map from a second patient with a Tetraflex implant
NEAR MAPAt near, the patient shows a large refractiverange of greater than 4D.
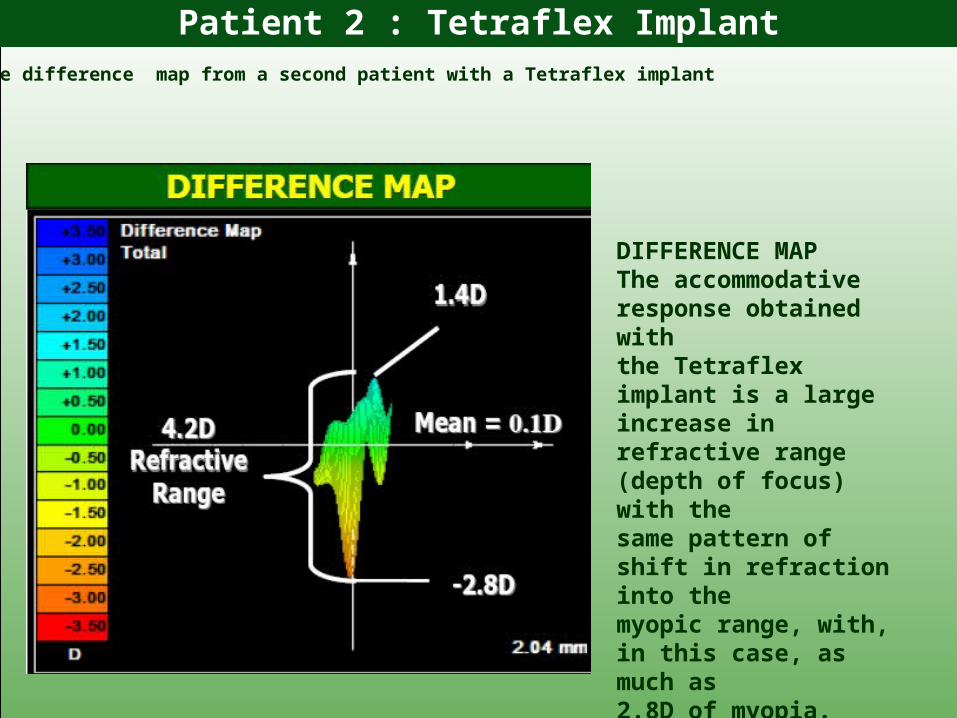
Patient 2 : Tetraflex ImplantiTrace difference map from a second patient with a Tetraflex implant
DIFFERENCE MAPThe accommodative response obtained withthe Tetraflex implant is a large increase inrefractive range (depth of focus) with thesame pattern of shift in refraction into themyopic range, with, in this case, as much as2.8D of myopia.
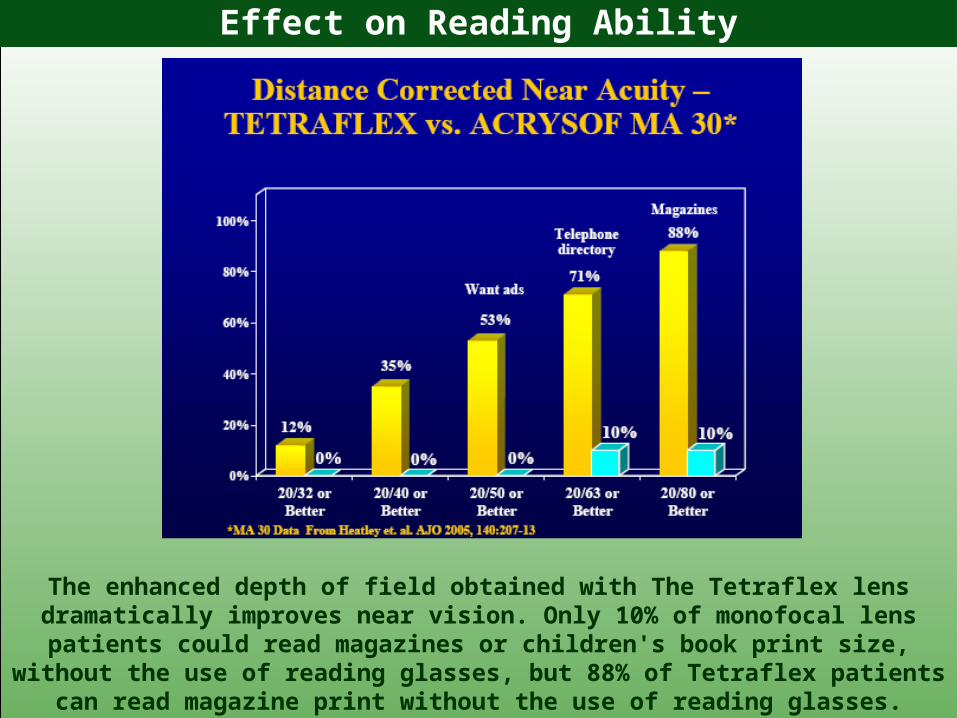
Effect on Reading Ability
The enhanced depth of field obtained with The Tetraflex lens dramatically improves near vision. Only 10% of monofocal lens patients could read magazines
or children's book print size, without the use of reading glasses, but 88% of Tetraflex patients can read magazine print without the use of reading glasses.
SUMMARY
• The Tetraflex is associated with a widened refractive range and more myopia with near fixation.
• Changes in aberrometric profiles produced by The Tetraflex result in improved near vision.
The Tetraflex™ is CE marked approved.The Tetraflex™ is currently in FDA study, and not yet approved for sale in the
US.