Embed Size (px)
Citation preview

•6th African Rift Geothermal Conference
Edwin Wafula
•31st October -6th November 2016
United Nations Conference Centre, Addis Ababa
INTERPRETATION OF GEOCHEMICAL DATA BASED ON DIFFERENT MODELS OF RESERVOIR CHARACTERISTICS:
A CASE FOR OLKARIA
2
Conclusion
Mineral saturation
Geothermometry
Geochemical modelling
Geology
Introduction
Contents

3
Introduction
One of geothermal
prospects in
Kenyan Rift
Olkaria divided by
7 sectors
Development by
KenGen/ Orpower
Olkaria produces
~677 MWe

4
Geology
From Otieno, 2016 (Modified from Clarke et al.,
1990)

5
Subsurface Geology
Upper volcanics: pyroclasts
Olkaria basalts: Minor basalts, minor tuffs
Plateau trachytes: trachytes, minor basalt, rhyolites
Mau tuffs: Tuffs, minor trachytes, rhyolites
Pre- Mau volcanics: Basalts, trachytes, tuffs
Proterozoic metamorphic basement system

6
Hydrothermal mineralogy
•Smectite -zeolite
•Smectite-chlorite- illite
0-550m bgl
•Epidote- chlorite-illite
550-1400m
bgl
•Actinolite-epidote-chlorite-illite
1400-3000m
bgl
• Epidote, garnet,chlorite,
• Actinolite • Albite,
chalcedony, quartz, adularia,
• Biotite, calcite, flourite, pyrite, illite

7
Geochemistry
• Study of origin of geothermal fluids and
reactions
• Fluid rock interaction & equilibrium concept
• Study chemical reactions based on activity
products and equilibrium constants
• Predict mineral reactions and saturation
states.

8
Aquifer composition
Cl serves as an
indicator of upflow
150-600 ppm in
Domes
200-600 ppm in NE-
field
More variations in E-
field
150-1400ppm. Deep
E-field wells have
SE wells have
Cl > 1000 ppm (800
series)

9
Geochemical modelling
• Single phase liquid aquifer
• No initial vapour • Calculated
enthalpy corresponding to aquifer temperature
Model 1
• Two phase
vapour and liquid
aquifer
• Initial steam
fraction
• Measured
enthalpy is in
excess due to
phase separation
Model 2

10
Aquifer composition
Well Enth1 pH1 Cl1 CO21v
X1 Enth2 pH2
Cl2 CO22v X2
15 1047 6.9 535 0 0 2140 7.8 509 2762 0.6
16 981 6.8 497 0 0 1534 7.8 491 4138 0.3
709 1216 6.4 523 0 0 1921 8.4 518 3479 0.5
714 1170 7.7 535 0 0 1303 7.7 497 12686 0.1

11
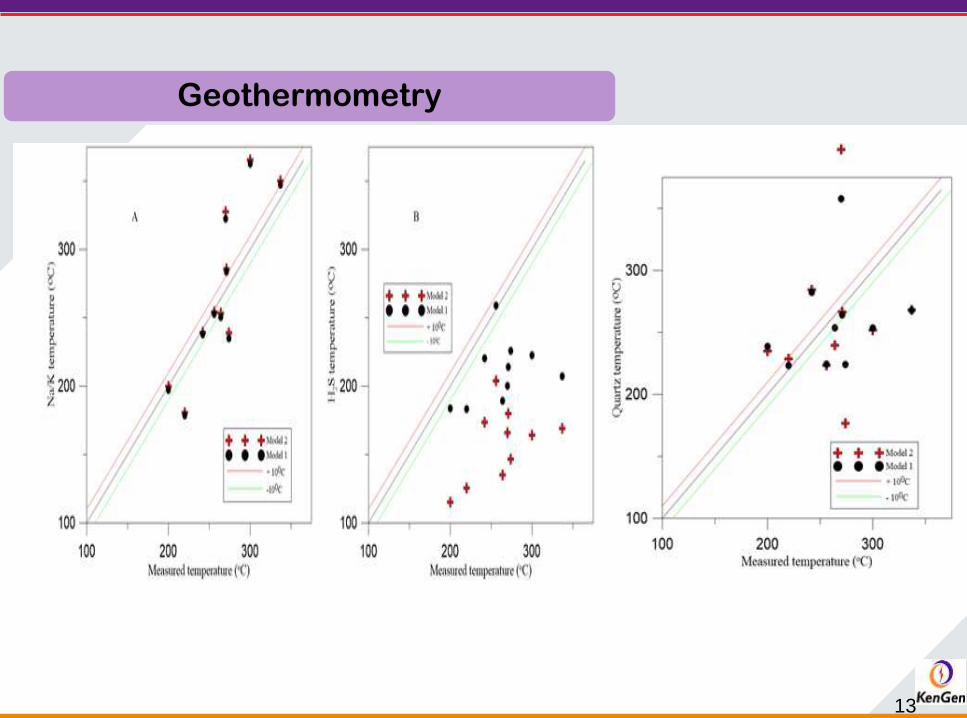
Geothermometry
• Silica, Na/K, H2S geothermometers applied
• The silica geothermometer 𝑞𝑢𝑎𝑟𝑡𝑧 + 2𝐻2𝑂 =𝐻4𝑆𝑖𝑂4
• The tNa/K 𝑙𝑜𝑤 − 𝑎𝑙𝑏𝑖𝑡𝑒 + 𝐾+ = 𝑚𝑖𝑐𝑟𝑜𝑐𝑙𝑖𝑛𝑒 +𝑁𝑎+
• The tH2S 14𝑝𝑦𝑟 + 1
2𝑝𝑦𝑟𝑟 + 𝐻2𝑂𝑙 =
1
4𝑚𝑎𝑔 + 𝐻2𝑆𝑎𝑞
12
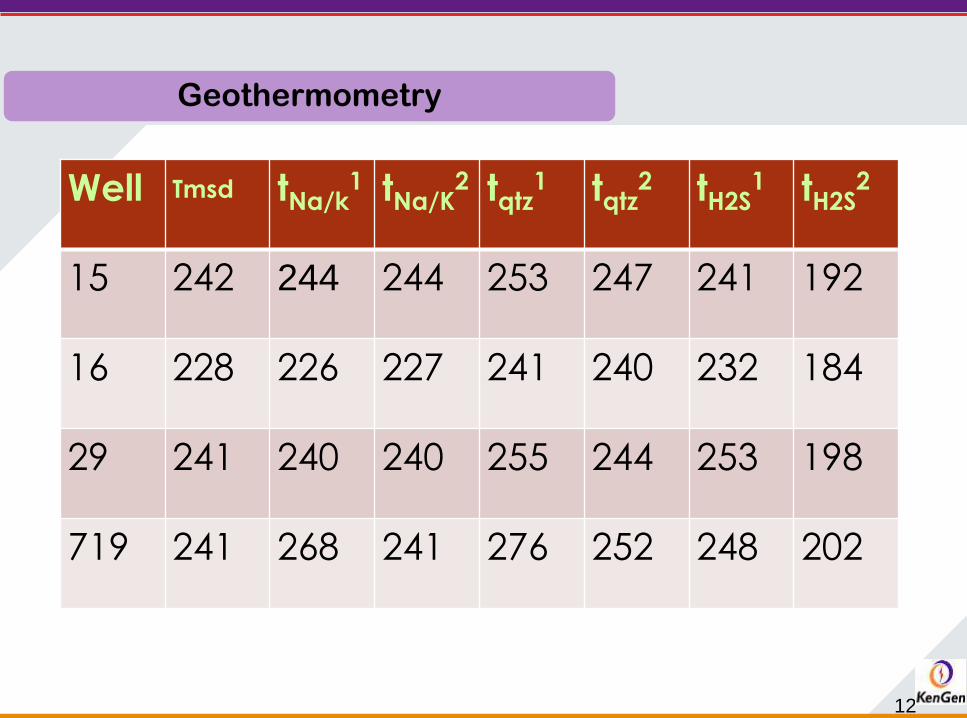
Geothermometry
Well Tmsd tNa/k1 tNa/K
2 tqtz1 tqtz
2 tH2S1 tH2S
2
15 242 244 244 253 247 241 192
16 228 226 227 241 240 232 184
29 241 240 240 255 244 253 198
719 241 268 241 276 252 248 202
13
Geothermometry

14
Fluid rock interaction
• Fluid rock interaction results in dissolution of rock
• Aquifer fluid composition is controlled by
interaction with mineral
• Minerals either undergo dissolution or
precipitation
• Model used in aquifer fluid evaluation influences
state of saturation
• Prediction of mineral formation could be done

15
Mineral Saturation

16
Mineral Saturation

17
Gas equilibria
H2 H2S

18
Gas equilibria
CO2

19
Conclusions
• Aquifers could be liquid only or two phase
vapour and liquid
• Model used determines the initial
composition of components
• Na/K ,Tqtz temperature match the measured
temperature, not H2S
• Reservoir initially single phase liquid ,phase
separation by depressurization boiling
• Mineral saturation state depends on initial
aquifer conditions

20
THE END