Embed Size (px)
Citation preview
In cooperation with the U.S. Navy
Interpretation of Borehole Geophysical Logs, Aquifer-Isolation Tests, and Water-Quality Data for Sites 1, 3, and 5 at Willow Grove Naval Air Station/Joint Reserve Base, Horsham Township, Montgomery County, Pennsylvania: 2005
U.S. Department of the InteriorU.S. Geological Survey
Scientific Investigations Report 2006–5243

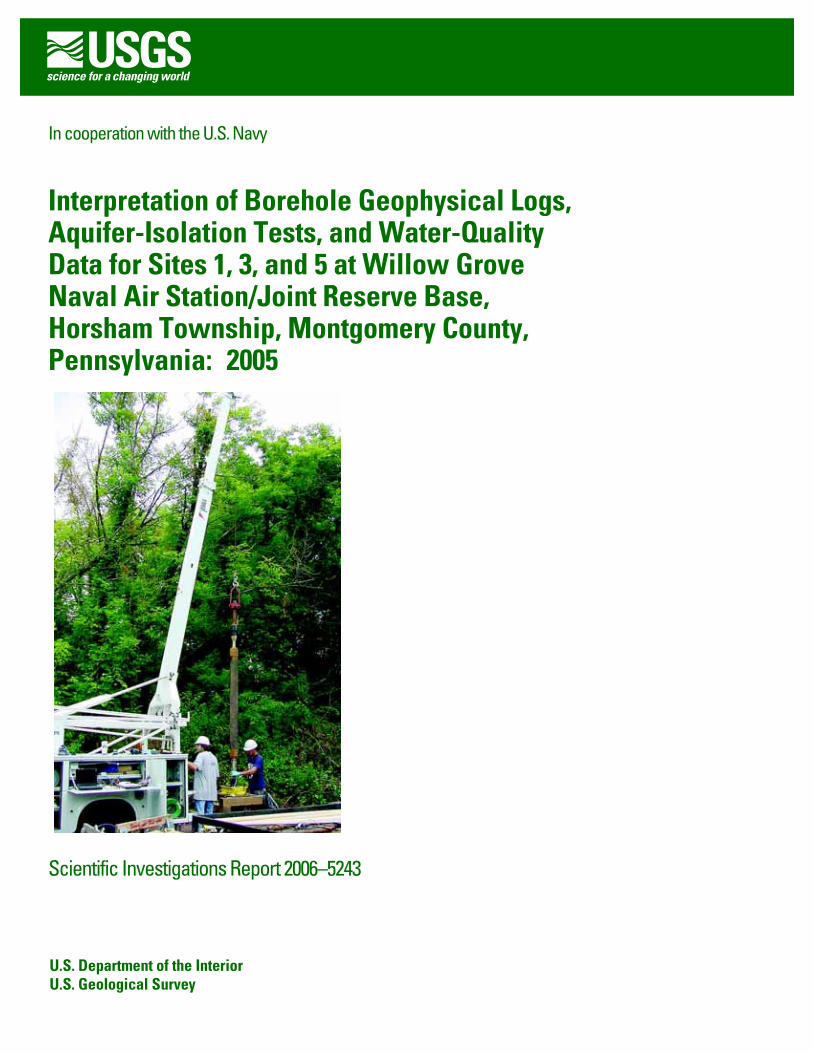
Cover. View of straddle-packer assembly being lowered in a well at the Willow Grove Naval Air Station/Joint Reserve Base.

Interpretation of Borehole Geophysical Logs, Aquifer-Isolation Tests, and Water-Quality Data for Sites 1, 3, and 5 at Willow Grove Naval Air Station/Joint Reserve Base, Horsham Township, Montgomery County, Pennsylvania: 2005
By Ronald A. Sloto
In cooperation with the U.S. Navy
Scientific Investigations Report 2006-5243
U.S. Department of the Interior U.S. Geological Survey
U.S. Department of the InteriorDIRK KEMPTHORNE, Secretary
U.S. Geological SurveyMark D. Myers, Director
U.S. Geological Survey, Reston, Virginia: 2007
For product and ordering information: World Wide Web: http://www.usgs.gov/pubprod Telephone: 1-888-ASK-USGS
For more information on the USGS—the Federal source for science about the Earth, its natural and living resources, natural hazards, and the environment: World Wide Web: http://www.usgs.gov Telephone: 1-888-ASK-USGS
Any use of trade, product, or firm names is for descriptive purposes only and does not imply endorsement by the U.S. Government.
Although this report is in the public domain, permission must be secured from the individual copyright owners to repro-duce any copyrighted material contained within this report.
Suggested citation:Sloto, R.A., 2007, Interpretation of borehole geophysical logs, aquifer-isolation tests, and water-quality data for Sites 1, 3, and 5 at Willow Grove Naval Air Station/Joint Reserve Base, Horsham Township, Montgomery County, Pennsylvania: U.S. Geological Survey Scientific Investigation Report 2006-5243, 74 p.

iii
Contents
Abstract . . . . . . . . . . . . . . . . . . . . . . . . . . . . . . . . . . . . . . . . . . . . . . . . . . . . . . . . . . . . . . . . . . . . . . . . . . . . . . . . . . . . . . . . . . . . . . . . . . . . 1 Introduction . . . . . . . . . . . . . . . . . . . . . . . . . . . . . . . . . . . . . . . . . . . . . . . . . . . . . . . . . . . . . . . . . . . . . . . . . . . . . . . . . . . . . . . . . . . . . . . . . 1
Purpose and Scope . . . . . . . . . . . . . . . . . . . . . . . . . . . . . . . . . . . . . . . . . . . . . . . . . . . . . . . . . . . . . . . . . . . . . . . . . . . . . . . . . . . 1Hydrogeologic Setting . . . . . . . . . . . . . . . . . . . . . . . . . . . . . . . . . . . . . . . . . . . . . . . . . . . . . . . . . . . . . . . . . . . . . . . . . . . . . . . . 3 Well-Identification System . . . . . . . . . . . . . . . . . . . . . . . . . . . . . . . . . . . . . . . . . . . . . . . . . . . . . . . . . . . . . . . . . . . . . . . . . . . . 3
Methods of Investigation . . . . . . . . . . . . . . . . . . . . . . . . . . . . . . . . . . . . . . . . . . . . . . . . . . . . . . . . . . . . . . . . . . . . . . . . . . . . . . . . . . . . 6 Borehole Geophysical Logs . . . . . . . . . . . . . . . . . . . . . . . . . . . . . . . . . . . . . . . . . . . . . . . . . . . . . . . . . . . . . . . . . . . . . . . . . . . 6 Heatpulse-Flowmeter Measurements. . . . . . . . . . . . . . . . . . . . . . . . . . . . . . . . . . . . . . . . . . . . . . . . . . . . . . . . . . . . . . . . . 6Borehole Television Surveys . . . . . . . . . . . . . . . . . . . . . . . . . . . . . . . . . . . . . . . . . . . . . . . . . . . . . . . . . . . . . . . . . . . . . . . . . . 6Aquifer-Isolation Tests . . . . . . . . . . . . . . . . . . . . . . . . . . . . . . . . . . . . . . . . . . . . . . . . . . . . . . . . . . . . . . . . . . . . . . . . . . . . . . . . 6 Water-Quality Samples . . . . . . . . . . . . . . . . . . . . . . . . . . . . . . . . . . . . . . . . . . . . . . . . . . . . . . . . . . . . . . . . . . . . . . . . . . . . . . . 7
Interpretation of Borehole Geophysical Logs, Aquifer-Isolation Tests, and Water-Quality Data at Site 1 . . . . . 10 Correlation of Borehole Geophysical Logs. . . . . . . . . . . . . . . . . . . . . . . . . . . . . . . . . . . . . . . . . . . . . . . . . . . . . . . . . . . . 10 Well 01MW09 (MG-2143) . . . . . . . . . . . . . . . . . . . . . . . . . . . . . . . . . . . . . . . . . . . . . . . . . . . . . . . . . . . . . . . . . . . . . . . . . . . . 10
Interpretation of Borehole Geophysical Logs . . . . . . . . . . . . . . . . . . . . . . . . . . . . . . . . . . . . . . . . . . . . . . . . . . . 10 Interpretation of Aquifer-Isolation Tests . . . . . . . . . . . . . . . . . . . . . . . . . . . . . . . . . . . . . . . . . . . . . . . . . . . . . . . . 13
Interval 1 (120.5-131.5 Feet Below Land Surface). . . . . . . . . . . . . . . . . . . . . . . . . . . . . . . . . . . . . . . . . . . 14 Interval 2 (57-68 Feet Below Land Surface) . . . . . . . . . . . . . . . . . . . . . . . . . . . . . . . . . . . . . . . . . . . . . . . . 14 Interval 3 (29-50 Feet Below Land Surface) . . . . . . . . . . . . . . . . . . . . . . . . . . . . . . . . . . . . . . . . . . . . . . . . 14
Vertical Distribution of Water-Quality Constituents . . . . . . . . . . . . . . . . . . . . . . . . . . . . . . . . . . . . . . . . . . . . . . 17 Well 01MW10 (MG-2141) . . . . . . . . . . . . . . . . . . . . . . . . . . . . . . . . . . . . . . . . . . . . . . . . . . . . . . . . . . . . . . . . . . . . . . . . . . . . 18
Interpretation of Borehole Geophysical Logs. . . . . . . . . . . . . . . . . . . . . . . . . . . . . . . . . . . . . . . . . . . . . . . . . . . . 18 Interpretation of Aquifer-Isolation Tests . . . . . . . . . . . . . . . . . . . . . . . . . . . . . . . . . . . . . . . . . . . . . . . . . . . . . . . . 20
Interval 1 (305-316 Feet Below Land Surface). . . . . . . . . . . . . . . . . . . . . . . . . . . . . . . . . . . . . . . . . . . . . . 20 Interval 2 (263-274 Feet Below Land Surface) . . . . . . . . . . . . . . . . . . . . . . . . . . . . . . . . . . . . . . . . . . . . . 22 Interval 3 (230-241 Feet Below Land Surface). . . . . . . . . . . . . . . . . . . . . . . . . . . . . . . . . . . . . . . . . . . . . . 22 Interval 4 (207-218 Feet Below Land Surface). . . . . . . . . . . . . . . . . . . . . . . . . . . . . . . . . . . . . . . . . . . . . . 22 Interval 5 (148.7-159.7 Feet Below Land Surface). . . . . . . . . . . . . . . . . . . . . . . . . . . . . . . . . . . . . . . . . . . 22 Interval 6 (106-117 Feet Below Land Surface). . . . . . . . . . . . . . . . . . . . . . . . . . . . . . . . . . . . . . . . . . . . . . 25 Interval 7 (69.6-92.8 Feet Below Land Surface). . . . . . . . . . . . . . . . . . . . . . . . . . . . . . . . . . . . . . . . . . . . . 25 Interval 8 (38-62.7 Feet Below Land Surface). . . . . . . . . . . . . . . . . . . . . . . . . . . . . . . . . . . . . . . . . . . . . . . 25
Vertical Distribution of Water-Quality Constituents . . . . . . . . . . . . . . . . . . . . . . . . . . . . . . . . . . . . . . . . . . . . . . 25 Interpretation of Borehole Geophysical Logs, Aquifer-Isolation Tests, and Water-Quality Data at Site 3. . . . . . 31
Well 03MW08 (MG-2142) . . . . . . . . . . . . . . . . . . . . . . . . . . . . . . . . . . . . . . . . . . . . . . . . . . . . . . . . . . . . . . . . . . . . . . . . . . . . 31 Interpretation of Borehole Geophysical Logs. . . . . . . . . . . . . . . . . . . . . . . . . . . . . . . . . . . . . . . . . . . . . . . . . . . . 31 Interpretation of Aquifer-Isolation Tests . . . . . . . . . . . . . . . . . . . . . . . . . . . . . . . . . . . . . . . . . . . . . . . . . . . . . . . . 33
Interval 1 (178.2-222 Feet Below Land Surface) . . . . . . . . . . . . . . . . . . . . . . . . . . . . . . . . . . . . . . . . . . . . 34Interval 2 (162-173 Feet Below Land Surface) . . . . . . . . . . . . . . . . . . . . . . . . . . . . . . . . . . . . . . . . . . . . . 34 Interval 3 (136.5-145.5 Feet Below Land Surface). . . . . . . . . . . . . . . . . . . . . . . . . . . . . . . . . . . . . . . . . . . 34Interval 4 (124.5-135.5 Feet Below Land Surface) . . . . . . . . . . . . . . . . . . . . . . . . . . . . . . . . . . . . . . . . . . 34 Interval 5 (75.5-86.5 Feet Below Land Surface) . . . . . . . . . . . . . . . . . . . . . . . . . . . . . . . . . . . . . . . . . . . . 39 Interval 6 (38-68.5 Feet Below Land Surface). . . . . . . . . . . . . . . . . . . . . . . . . . . . . . . . . . . . . . . . . . . . . . . 39

iv
Vertical Distribution of Water-Quality Constituents . . . . . . . . . . . . . . . . . . . . . . . . . . . . . . . . . . . . . . . . . . . . . . 39Interpretation of Borehole Geophysical Logs, Aquifer-Isolation Tests, and Water-Quality Data at Site 5. . . . . . 43
Well 05MW12S (MG-2136) . . . . . . . . . . . . . . . . . . . . . . . . . . . . . . . . . . . . . . . . . . . . . . . . . . . . . . . . . . . . . . . . . . . . . . . . . . . 43 Interpretation of Borehole Geophysical Logs . . . . . . . . . . . . . . . . . . . . . . . . . . . . . . . . . . . . . . . . . . . . . . . . . . . 43 Interpretation of Aquifer-Isolation Tests . . . . . . . . . . . . . . . . . . . . . . . . . . . . . . . . . . . . . . . . . . . . . . . . . . . . . . . . . 43
Interval 1 (51.5-70 Feet Below Land Surface) . . . . . . . . . . . . . . . . . . . . . . . . . . . . . . . . . . . . . . . . . . . . . . 45 Interval 2 (17-44.5 Feet Below Land Surface) . . . . . . . . . . . . . . . . . . . . . . . . . . . . . . . . . . . . . . . . . . . . . . 45
Vertical Distribution of Water-Quality Constituents . . . . . . . . . . . . . . . . . . . . . . . . . . . . . . . . . . . . . . . . . . . . . . 45 Well 05MW13I (MG-2137) . . . . . . . . . . . . . . . . . . . . . . . . . . . . . . . . . . . . . . . . . . . . . . . . . . . . . . . . . . . . . . . . . . . . . . . . . . . . 49
Interpretation of Borehole Geophysical Logs . . . . . . . . . . . . . . . . . . . . . . . . . . . . . . . . . . . . . . . . . . . . . . . . . . . 49 Interpretation of Aquifer-Isolation Tests . . . . . . . . . . . . . . . . . . . . . . . . . . . . . . . . . . . . . . . . . . . . . . . . . . . . . . . . . 51
Interval 1 (162-181 Feet Below Land Surface) . . . . . . . . . . . . . . . . . . . . . . . . . . . . . . . . . . . . . . . . . . . . . 51 Interval 2 (151.5-163.5 Feet Below Land Surface) . . . . . . . . . . . . . . . . . . . . . . . . . . . . . . . . . . . . . . . . . . 52 Interval 3 (128.5-140.5 Feet Below Land Surface) . . . . . . . . . . . . . . . . . . . . . . . . . . . . . . . . . . . . . . . . . . 52Interval 4 (100.5-112.5 Feet Below Land Surface) . . . . . . . . . . . . . . . . . . . . . . . . . . . . . . . . . . . . . . . . . . 52 Interval 5 (64.5-76.5 Feet Below Land Surface) . . . . . . . . . . . . . . . . . . . . . . . . . . . . . . . . . . . . . . . . . . . . 52
Vertical Distribution of Water-Quality Constituents . . . . . . . . . . . . . . . . . . . . . . . . . . . . . . . . . . . . . . . . . . . . . . 57 Well 05MW14I (MG-2138) . . . . . . . . . . . . . . . . . . . . . . . . . . . . . . . . . . . . . . . . . . . . . . . . . . . . . . . . . . . . . . . . . . . . . . . . . . . . 58
Interpretation of Borehole Geophysical Logs . . . . . . . . . . . . . . . . . . . . . . . . . . . . . . . . . . . . . . . . . . . . . . . . . . . 58 Interpretation of Aquifer-Isolation Tests . . . . . . . . . . . . . . . . . . . . . . . . . . . . . . . . . . . . . . . . . . . . . . . . . . . . . . . . . 60
Interval 1 (123.5-148 Feet Below Land Surface) . . . . . . . . . . . . . . . . . . . . . . . . . . . . . . . . . . . . . . . . . . . . 60 Interval 2 (78.5-86.5 Feet Below Land Surface) . . . . . . . . . . . . . . . . . . . . . . . . . . . . . . . . . . . . . . . . . . . . 62 Interval 3 (45-63.5 Feet Below Land Surface) . . . . . . . . . . . . . . . . . . . . . . . . . . . . . . . . . . . . . . . . . . . . . . 62
Vertical Distribution of Water-Quality Constituents . . . . . . . . . . . . . . . . . . . . . . . . . . . . . . . . . . . . . . . . . . . . . . 65 Well 05MW15I (MG-2139) . . . . . . . . . . . . . . . . . . . . . . . . . . . . . . . . . . . . . . . . . . . . . . . . . . . . . . . . . . . . . . . . . . . . . . . . . . . . 66
Interpretation of Borehole Geophysical Logs . . . . . . . . . . . . . . . . . . . . . . . . . . . . . . . . . . . . . . . . . . . . . . . . . . . 66 Interpretation of Aquifer-Isolation Tests . . . . . . . . . . . . . . . . . . . . . . . . . . . . . . . . . . . . . . . . . . . . . . . . . . . . . . . . . 68
Interval 1 (134.5-150 Feet Below Land Surface) . . . . . . . . . . . . . . . . . . . . . . . . . . . . . . . . . . . . . . . . . . . . 68 Interval 2 (124.5-132.5 Feet Below Land Surface) . . . . . . . . . . . . . . . . . . . . . . . . . . . . . . . . . . . . . . . . . . 68 Interval 3 (61.5-77.3 Feet Below Land Surface) . . . . . . . . . . . . . . . . . . . . . . . . . . . . . . . . . . . . . . . . . . . . 70 Interval 4 (31-46.5 Feet Below Land Surface) . . . . . . . . . . . . . . . . . . . . . . . . . . . . . . . . . . . . . . . . . . . . . . 70
Vertical Distribution of Water-Quality Constituents . . . . . . . . . . . . . . . . . . . . . . . . . . . . . . . . . . . . . . . . . . . . . . 70 Summary and Conclusions . . . . . . . . . . . . . . . . . . . . . . . . . . . . . . . . . . . . . . . . . . . . . . . . . . . . . . . . . . . . . . . . . . . . . . . . . . . . . . . . . 72 Acknowledgments . . . . . . . . . . . . . . . . . . . . . . . . . . . . . . . . . . . . . . . . . . . . . . . . . . . . . . . . . . . . . . . . . . . . . . . . . . . . . . . . . . . . . . . . . 73 References Cited. . . . . . . . . . . . . . . . . . . . . . . . . . . . . . . . . . . . . . . . . . . . . . . . . . . . . . . . . . . . . . . . . . . . . . . . . . . . . . . . . . . . . . . . . . . 73

v
Figures
1.-4. Maps showing: 1. Location of the Willow Grove Naval Air Station/Joint Reserve Base and sites of
possible ground-water contamination, Horsham Township, Montgomery County, Pennsylvania . . . . . . . . . . . . . . . . . . . . . . . . . . . . . . . . . . . . . . . . . . . . . . . . . . . . . . . . . . . . . . . . . . . . . . . . . . . .2
2. Locations of base supply wells (SW) and selected monitor wells (MW) at Site 1, Willow Grove Naval Air Station/Joint Reserve Base, Horsham Township, Montgomery County, Pennsylvania . . . . . . . . . . . . . . . . . . . . . . . . . . . . . . . . . . . . . . . . . . . . . . . . . . . . . .4
3. Locations of selected monitor wells at Sites 3 and 5, Willow Grove Naval Air Station/Joint Reserve Base, Horsham Township, Montgomery County, Pennsylvania . . . .5
4. Generalized sketch of straddle-packer assembly and sampling pump in a borehole. . . . . . . . . .8 5. Hydrographs from wells 01MW09 (MG-2143) and 01MW10 (MG-2141), Willow Grove
Naval Air Station/Joint Reserve Base, Horsham Township, Montgomery County, Pennsylvania, November 8-14, 2005. . . . . . . . . . . . . . . . . . . . . . . . . . . . . . . . . . . . . . . . . . . . . . . . . . . . . . . . 10
6. Graphs showing correlation of natural-gamma logs, single-point-resistance logs, and tetrachloroethylene concentrations from wells SW-1 (MG-209), SW-2 (MG-210), 01MW09 (MG-2140), and 01MW10 (MG-2141), Willow Grove Naval Air Station/Joint Reserve Base, Horsham Township, Montgomery County, Pennsylvania. . . . . . . . . . . . . . . . . . . . . . . . . . . . . . . . . . . . . . . . . . . . . . . . . . . . . . . . . . . . . . . . . . . . . . 11
7. Borehole geophysical logs for well 01MW09 (MG-2143), Willow Grove Naval Air Station/Joint Reserve Base, Horsham Township, Montgomery County, Pennsylvania, November 8, 2005. . . . . . . . . . . . . . . . . . . . . . . . . . . . . . . . . . . . . . . . . . . . . . . . . . . . . . . . . . . . . . . . . . . . . . . . . . 12
8. Image from borehole television survey showing horizontal fracture at 125 feet below land surface in well 01MW09 (MG-2143), Willow Grove Naval Air Station/Joint Reserve Base, Horsham Township, Montgomery County, Pennsylvania, November 8, 2005. . . . . . . . . . . . . . . . . . . . . . . . . . . . . . . . . . . . . . . . . . . . . . . . . . . . . . . . . . . 13
9. Hydrographs from aquifer-isolation test of interval 1 (120.5-131.5 feet below land surface) in well 01MW09 (MG-2143), Willow Grove Naval Air Station/Joint Reserve Base, Horsham Township, Montgomery County, Pennsylvania . . . . . . . . . . . . . . . . . . . 15
10. Hydrographs from aquifer-isolation test of interval 2 (57-68 feet below land surface) in well 01MW09 (MG-2143), Willow Grove Naval Air Station/Joint Reserve Base, Horsham Township, Montgomery County, Pennsylvania . . . . . . . . . . . . . . . . . . . . . . . . . . . . 16
11. Borehole geophysical logs for well 01MW10 (MG-2141), Willow Grove Naval Air Station/Joint Reserve Base, Horsham Township, Montgomery County, Pennsylvania, November 4, 2005. . . . . . . . . . . . . . . . . . . . . . . . . . . . . . . . . . . . . . . . . . . . . . . . . . . . . . . . . . . 19
12. Images from borehole television survey showing (A) high-angle fracture at 153 feet below land surface and (B) horizontal fracture at 310 feet below land surface in well 01MW10 (MG-2141), Willow Grove Naval Air Station/Joint Reserve Base, Horsham Township, Montgomery County, Pennsylvania, November 9, 2005. . . . . . . . . . . . . . . . 20
13. Hydrographs from aquifer-isolation test of interval 1 (305-316 feet below land surface) in well 01MW10 (MG-2141), Willow Grove Naval Air Station/Joint Reserve Base, Horsham Township, Montgomery County, Pennsylvania . . . . . . . . . . . . . . . . . . . 21
14. Hydrographs from aquifer-isolation test of interval 2 (263-274 feet below land surface) in well 01MW10 (MG-2141), Willow Grove Naval Air Station/Joint Reserve Base, Horsham Township, Montgomery County, Pennsylvania . . . . . . . . . . . . . . . . . . . . . . . . . . . . 23
15. Hydrographs from aquifer-isolation test of interval 4 (207-218 feet below land surface) in well 01MW10 (MG-2141), Willow Grove Naval Air Station/Joint Reserve Base, Horsham Township, Montgomery County, Pennsylvania . . . . . . . . . . . . . . . . . . . . . . . . . . . . 24
vi
16. Hydrographs from aquifer-isolation test of interval 5 (148.7-159.7 feet below land surface) in well 01MW10 (MG-2141), Willow Grove Naval Air Station/Joint Reserve Base, Horsham Township, Montgomery County, Pennsylvania . . . . . . . . . . . . . . . . . . . 26
17. Hydrographs from aquifer-isolation test of interval 6 (106-117 feet below land surface) in well 01MW10 (MG-2141), Willow Grove Naval Air Station/Joint Reserve Base, Horsham Township, Montgomery County, Pennsylvania . . . . . . . . . . . . . . . . . . . 27
18. Hydrographs from aquifer-isolation test of interval 7 (69.6-92.9 feet below land surface) in well 01MW10 (MG-2141), Willow Grove Naval Air Station/Joint Reserve Base, Horsham Township, Montgomery County, Pennsylvania . . . . . . . . . . . . . . . . . . . . . . . . . . . . 28
19. Hydrographs from aquifer-isolation test of interval 8 (38-62.7 feet below land surface) in well 01MW10 (MG-2141), Willow Grove Naval Air Station/Joint Reserve Base, Horsham Township, Montgomery County, Pennsylvania . . . . . . . . . . . . . . . . . . . . . . . . . . . . 29
20. Borehole geophysical logs for well 03MW08 (MG-2142), Willow Grove Naval Air Station/Joint Reserve Base, Horsham Township, Montgomery County, Pennsylvania, November 3, 2005. . . . . . . . . . . . . . . . . . . . . . . . . . . . . . . . . . . . . . . . . . . . . . . . . . . . . . . . . . . 32
21. Images from borehole television survey showing (A) horizontal fracture at 169 feet below land surface and (B) vertical fracture at 64 feet below land surface in well 03MW08I (MG-2142), Willow Grove Naval Air Station/Joint Reserve Base, Horsham Township, Montgomery County, Pennsylvania, November 8, 2005. . . . . . . . . . . . . . . . 33
22. Hydrographs from aquifer-isolation test of interval 1 (178.2-222 feet below land surface) in well 03MW08 (MG-2142), Willow Grove Naval Air Station/Joint Reserve Base, Horsham Township, Montgomery County, Pennsylvania . . . . . . . . . . . . . . . . . . . . . . . . . . . . 35
23. Hydrographs from aquifer-isolation test of interval 2 (162-173 feet below land surface) in well 03MW08 (MG-2142), Willow Grove Naval Air Station/Joint Reserve Base, Horsham Township, Montgomery County, Pennsylvania . . . . . . . . . . . . . . . . . . . . . . . . . . . . 36
24. Hydrographs from aquifer-isolation test of interval 3 (136.5-145.5 feet below land surface) in well 03MW08 (MG-2142), Willow Grove Naval Air Station/Joint Reserve Base, Horsham Township, Montgomery County, Pennsylvania . . . . . . . . . . . . . . . . . . . 37
25. Hydrographs from aquifer-isolation test of interval 4 (124.5-135.5 feet below land surface) in well 03MW08 (MG-2142), Willow Grove Naval Air Station/Joint Reserve Base, Horsham Township, Montgomery County, Pennsylvania . . . . . . . . . . . . . . . . . . . 38
26. Hydrographs from aquifer-isolation test of interval 5 (75.5-86.5 feet below land surface) in well 03MW08 (MG-2142), Willow Grove Naval Air Station/Joint Reserve Base, Horsham Township, Montgomery County, Pennsylvania . . . . . . . . . . . . . . . . . . . . . . . . . . . . 40
27. Hydrographs from aquifer-isolation test of interval 6 (38-68.5 feet below land surface) in well 03MW08 (MG-2142), Willow Grove Naval Air Station/Joint Reserve Base, Horsham Township, Montgomery County, Pennsylvania . . . . . . . . . . . . . . . . . . . . . . . . . . . . 41
28. Borehole geophysical logs for well 05MW12S (MG-2136), Willow Grove Naval Air Station/Joint Reserve Base, Horsham Township, Montgomery County, Pennsylvania, June 27, 2005 . . . . . . . . . . . . . . . . . . . . . . . . . . . . . . . . . . . . . . . . . . . . . . . . . . . . . . . . . . . . . . . 44
29. Image from borehole television survey showing vertical fracture at 63 feet below land surface in well 05MW12S (MG-2136), Willow Grove Naval Air Station/Joint Reserve Base, Horsham Township, Montgomery County, Pennsylvania . . . . . . . . . . . . . . . . . . . 45
30. Hydrographs from aquifer-isolation test of interval 1 (51.5-70 feet below land surface) in well 05MW12S (MG-2136), Willow Grove Naval Air Station/Joint Reserve Base, Horsham Township, Montgomery County, Pennsylvania . . . . . . . . . . . . . . . . . . . 46
31. Hydrographs from aquifer-isolation test of interval 2 (17-44.5 feet below land surface) in well 05MW12S (MG-2136), Willow Grove Naval Air Station/Joint Reserve Base, Horsham Township, Montgomery County, Pennsylvania . . . . . . . . . . . . . . . . . . . 47

vii
32. Borehole geophysical logs for well 05MW13I (MG-2137), Willow Grove Naval Air Station/Joint Reserve Base, Horsham Township, Montgomery County, Pennsylvania, June 29, 2005 . . . . . . . . . . . . . . . . . . . . . . . . . . . . . . . . . . . . . . . . . . . . . . . . . . . . . . . . . . . . . . . . . . . . . . . . . . . . . . .50
33. Image from borehole television survey showing vertical fracture at 137 feet below land surface in well 05MW13I (MG-2137), Willow Grove Naval Air Station/Joint Reserve Base, Horsham Township, Montgomery County, Pennsylvania, June 28, 2005 . . . . . . . . . . . . . . . . . . . . . . . . . . . . . . . . . . . . . . . . . . . . . . . . . . . . . . . . . . . . . . . .51
34. Hydrographs from aquifer-isolation test of interval 2 (151.5-163.5 feet below land surface) in well 05MW13I (MG-2137), Willow Grove Naval Air Station/Joint Reserve Base, Horsham Township, Montgomery County, Pennsylvania . . . . . . . . . . . . . . . . . . . .53
35. Hydrographs from aquifer-isolation test of interval 3 (128.5-140.5 feet below land surface) in well 05MW13I (MG-2137), Willow Grove Naval Air Station/Joint Reserve Base, Horsham Township, Montgomery County, Pennsylvania . . . . . . . . . . . . . . . . . . . .54
36. Hydrographs from aquifer-isolation test of interval 4 (100.5-112.5 feet below land surface) in well 05MW13I (MG-2137), Willow Grove Naval Air Station/Joint Reserve Base, Horsham Township, Montgomery County, Pennsylvania . . . . . . . . . . . . . . . . . . . .55
37. Hydrographs from aquifer-isolation test of interval 5 (64.5-76.5 feet below land surface) in well 05MW13I (MG-2137), Willow Grove Naval Air Station/Joint Reserve Base, Horsham Township, Montgomery County, Pennsylvania . . . . . . . . . . . . . . . . . . . .56
38. Borehole geophysical logs for well 05MW14I (MG-2138), Willow Grove Naval Air Station/Joint Reserve Base, Horsham Township, Montgomery County, Pennsylvania, June 27, 2005 . . . . . . . . . . . . . . . . . . . . . . . . . . . . . . . . . . . . . . . . . . . . . . . . . . . . . . . . . . . . . . . .59
39. Image from borehole television survey showing (A) vertical fracture at 60 feet below land surface and (B) horizontal fracture at 148 feet below land surface in well 05MW14I (MG-2138), Willow Grove Naval Air Station/Joint Reserve Base, Horsham Township, Montgomery County, Pennsylvania, June 28, 2005 . . . . . . . . . . . . . . . . . . . . .60
40. Hydrographs from aquifer-isolation test of interval 1 (123.5-148 feet below land surface) in well 05MW14I (MG-2138), Willow Grove Naval Air Station/Joint Reserve Base, Horsham Township, Montgomery County, Pennsylvania . . . . . . . . . . . . . . . . . . . .61
41. Hydrographs from aquifer-isolation test of interval 2 (78.5-86.5 feet below land surface) in well 05MW14I (MG-2138), Willow Grove Naval Air Station/Joint Reserve Base, Horsham Township, Montgomery County, Pennsylvania . . . . . . . . . . . . . . . . . . . .63
42. Hydrographs from aquifer-isolation test of interval 3 (45-63.5 feet below land surface) in well 05MW14I (MG-2138), Willow Grove Naval Air Station/Joint Reserve Base, Horsham Township, Montgomery County, Pennsylvania . . . . . . . . . . . . . . . . . . . .64
43. Borehole geophysical logs for well 05MW15I (MG-2139), Willow Grove Naval Air Station/Joint Reserve Base, Horsham Township, Montgomery County, Pennsylvania, June 28, 2005 . . . . . . . . . . . . . . . . . . . . . . . . . . . . . . . . . . . . . . . . . . . . . . . . . . . . . . . . . . . . . . . .67
44. Image from borehole television survey showing vertical fracture at 142 feet below land surface in well 05MW15I (MG-2139), Willow Grove Naval Air Station/Joint Reserve Base, Horsham Township, Montgomery County, Pennsylvania, June 27, 2005 . . . . . . . . . . . . . . . . . . . . . . . . . . . . . . . . . . . . . . . . . . . . . . . . . . . . . . . . . . . . . . . .68
45. Hydrographs from aquifer-isolation test of interval 1 (134.5-150 feet below land surface) in well 05MW15I (MG-2139), Willow Grove Naval Air Station/Joint Reserve Base, Horsham Township, Montgomery County, Pennsylvania . . . . . . . . . . . . . . . . . . . .69
46. Hydrographs from aquifer-isolation test of interval 3 (61.5-77.3 feet below land surface) in well 05MW15I (MG-2139), Willow Grove Naval Air Station/Joint Reserve Base, Horsham Township, Montgomery County, Pennsylvania . . . . . . . . . . . . . . . . . . . .71

viii
Tables
1. Record of selected wells, Willow Grove Naval Air Station/Joint Reserve Base, Horsham Township, Montgomery County, Pennsylvania. . . . . . . . . . . . . . . . . . . . . . . . . . . . . . . . . . . . . . . . . . . .3
2. Volatile organic compounds analyzed in ground-water samples, Willow Grove Naval Air Station/Joint Reserve Base, Horsham Township, Montgomery County, Pennsylvania . . . . . . . . . . .9
3. Heatpulse-flowmeter measurements made in well 01MW09 (MG-2143), Willow Grove Naval Air Station/Joint Reserve Base, Horsham Township, Montgomery County, Pennsylvania, November 8, 2005. . . . . . . . . . . . . . . . . . . . . . . . . . . . . . . . . . . . . . . . . . . . . . . . . . . . . . . . . . . . . . . . . . 13
4. Intervals isolated during aquifer-isolation tests conducted in well 01MW09 (MG-2143), November 14-15, 2005, Willow Grove Naval Air Station/Joint Reserve Base, Horsham Township, Montgomery County, Pennsylvania. . . . . . . . . . . . . . . . . . . . . . . . . . . . . . . . . . . . . . . . . . . . . . . . . . . . 13
5. Concentrations of volatile organic compounds detected in water samples collected during aquifer- isolation tests in well 01MW09 (MG-2143), November 14-15, 2005, Willow Grove Naval Air Station/Joint Reserve Base, Horsham Township, Montgomery County, Pennsylvania. . . . . . . . . . . . . . . . . . . . . . . . . . . . . . . . . . . . . . . . . . . . . . . . . . . . . . . . . . . . . . . . . . . . . . . . . . . . . . . . . . . . . 17
6. Selected water-quality constituents measured in the field in water samples collected during aquifer-isolation tests in well 01MW09 (MG-2143), November 14-15, 2005, Willow Grove Naval Air Station/Joint Reserve Base, Horsham Township, Montgomery County, Pennsylvania. . . . . . . . . . . . . . . . . . . . . . . . . . . . . . . . . . . . . . . . . . . . . . . . . . . . . . . . . . . . . . . . . . . . . . . . . . . . . . . . . . . . . 17
7. Heatpulse-flowmeter measurements made in well 01MW10 (MG-2141), Willow Grove Naval Air Station/Joint Reserve Base, Horsham Township, Montgomery County, Pennsylvania, November 4, 2005. . . . . . . . . . . . . . . . . . . . . . . . . . . . . . . . . . . . . . . . . . . . . . . . . . . . . . . . . . . . . . . . . . 18
8. Intervals isolated during aquifer-isolation tests conducted in well 01MW10 (MG-2141), November 15-21, 2005, Willow Grove Naval Air Station/Joint Reserve Base, Horsham Township, Montgomery County, Pennsylvania. . . . . . . . . . . . . . . . . . . . . . . . . . . . . . . . . . . . . . . . . . . . . . . . . . . . 22
9. Concentrations of volatile organic compounds detected in water samples collected during aquifer-isolation tests in well 01MW10 (MG-2141), November 15-21, 2005, Willow Grove Naval Air Station/Joint Reserve Base, Horsham Township, Montgomery County, Pennsylvania. . . . . . . . . . . . . . . . . . . . . . . . . . . . . . . . . . . . . . . . . . . . . . . . . . . . . . . . . . . . . . . . . . . . . . . . . . . . . . . . . . . . . 30
10. Selected water-quality constituents measured in the field in water samples collected during aquifer-isolation tests in well 01MW10 (MG-2141), November 15-21, 2005, Willow Grove Naval Air Station/Joint Reserve Base, Horsham Township, Montgomery County, Pennsylvania. . . . . . . . . . . . . . . . . . . . . . . . . . . . . . . . . . . . . . . . . . . . . . . . . . . . . . . . . . . . . . . . . . . . . . . . . . . . . . . . . . . . . 30
11. Heatpulse-flowmeter measurements made in well 03MW08 (MG-2142), Willow Grove Naval Air Station/Joint Reserve Base, Horsham Township, Montgomery County, Pennsylvania, November 3, 2005. . . . . . . . . . . . . . . . . . . . . . . . . . . . . . . . . . . . . . . . . . . . . . . . . . . . . . . . . . . . . . . . . . 31
12. Intervals isolated during aquifer-isolation tests conducted in well 03MW08 (MG-2142), November 22-28, 2005, Willow Grove Naval Air Station/Joint Reserve Base, Horsham Township, Montgomery County, Pennsylvania. . . . . . . . . . . . . . . . . . . . . . . . . . . . . . . . . . . . . . . . . . . . . . . . . . . . 33
13. Concentrations of volatile organic compounds detected in water samples collected during aquifer-isolation tests in well 03MW08 (MG-2142), November 22-28, 2005, Willow Grove Naval Air Station/Joint Reserve Base, Horsham Township, Montgomery County, Pennsylvania. . . . . . . . . . . . . . . . . . . . . . . . . . . . . . . . . . . . . . . . . . . . . . . . . . . . . . . . . . . . . . . . . . . . . . . . . . . . . . . . . . . . . 42
14. Selected water-quality constituents measured in the field in water samples collected during aquifer-isolation tests in well 03MW08 (MG-2142), November 22-28, 2005, Willow Grove Naval Air Station/Joint Reserve Base, Horsham Township, Montgomery County, Pennsylvania. . . . . . . . . . . . . . . . . . . . . . . . . . . . . . . . . . . . . . . . . . . . . . . . . . . . . . . . . . . . . . . . . . . . . . . . . . . . . . . . . . . . . 42
15. Heatpulse-flowmeter measurements made in well 05MW12S (MG-2136) under nonpumping conditions, Willow Grove Naval Air Station/Joint Reserve Base, Horsham Township, Montgomery County, Pennsylvania, June 27, 2005 . . . . . . . . . . . . . . . . . . . . . . . . . . . . . . . . . . . . . 43

ix
16. Intervals isolated during aquifer-isolation tests conducted in well 05MW12S (MG-2136), July 11, 2005, Willow Grove Naval Air Station/Joint Reserve Base, Horsham Township, Montgomery County, Pennsylvania. . . . . . . . . . . . . . . . . . . . . . . . . . . . . . . . . . . . . . . . . . . . . . . . . . . . . . . . . . . . . . . 43
17. Concentrations of volatile organic compounds detected in water samples collected during aquifer- isolation tests in well 05MW12S (MG-2136), July 11, 2005, Willow Grove Naval Air Station/Joint Reserve Base, Horsham Township, Montgomery County, Pennsylvania. . . . . . . . . . . . . . . . . . . . . . . . . . . . . . . . . . . . . . . . . . . . . . . . . . . . . . . . . . . . . . . . . . . . . . . . . . . . . . . . . . . . . 48
18. Selected water-quality constituents measured in the field in water samples collected during aquifer-isolation tests in well 05MW12S (MG-2136), July 11, 2005, Willow Grove Naval Air Station/Joint Reserve Base, Horsham Township, Montgomery County, Pennsylvania. . . . . . . . . . . . . . . . . . . . . . . . . . . . . . . . . . . . . . . . . . . . . . . . . . . . . . . . . . . . . . . . . . . . . . . . . . . . . . . . . . . . . 48
19. Heatpulse-flowmeter measurements made in well 05MW13I (MG-2137), Willow Grove Naval Air Station/Joint Reserve Base, Horsham Township, Montgomery County, Pennsylvania, June 29, 2005 . . . . . . . . . . . . . . . . . . . . . . . . . . . . . . . . . . . . . . . . . . . . . . . . . . . . . . . . . . . . . . . . . . . . . . 49
20. Intervals isolated during aquifer-isolation tests conducted in well 05MW13I (MG-2137), July 19-20, 2005, Willow Grove Naval Air Station/Joint Reserve Base, Horsham Township, Montgomery County, Pennsylvania. . . . . . . . . . . . . . . . . . . . . . . . . . . . . . . . . . . . . . . . . . . . . . . . . . . . . . . . . . . . . . . 51
21. Concentrations of volatile organic compounds detected in water samples collected during aquifer-isolation tests in well 05MW13I (MG-2137), July 19-20, 2005, Willow Grove Naval Air Station/Joint Reserve Base, Horsham Township, Montgomery County, Pennsylvania. . . . . . . . . . . . . . . . . . . . . . . . . . . . . . . . . . . . . . . . . . . . . . . . . . . . . . . . . . . . . . . . . . . . . . . . . . . . . . . . . . . . . 57
22. Selected water-quality constituents measured in the field in water samples collected during aquifer-isolation tests in well 05MW13I (MG-2137), July 19-20, 2005, Willow Grove Naval Air Station/Joint Reserve Base, Horsham Township, Montgomery County, Pennsylvania. . . . . . . . . . . . . . . . . . . . . . . . . . . . . . . . . . . . . . . . . . . . . . . . . . . . . . . . . . . . . . . . . . . . . . . . . . . . . . . . . . . . . 57
23. Heatpulse-flowmeter measurements made in well 05MW14I (MG-2138), Willow Grove Naval Air Station/Joint Reserve Base, Horsham Township, Montgomery County, Pennsylvania, June 27, 2005 . . . . . . . . . . . . . . . . . . . . . . . . . . . . . . . . . . . . . . . . . . . . . . . . . . . . . . . . . . . . . . . . . . . . . . 58
24. Intervals isolated during aquifer-isolation tests conducted in well 05MW14I (MG-2138), July 12-13, 2005, Willow Grove Naval Air Station/Joint Reserve Base, Horsham Township, Montgomery County, Pennsylvania. . . . . . . . . . . . . . . . . . . . . . . . . . . . . . . . . . . . . . . . . . . . . . . . . . . . . . . . . . . . . . . 60
25. Concentrations of volatile organic compounds detected in water samples collected during aquifer-isolation tests in well 05MW14I (MG-2138), July 12-13, 2005, Willow Grove Naval Air Station/Joint Reserve Base, Horsham Township, Montgomery County, Pennsylvania. . . . . . . . . . . . . . . . . . . . . . . . . . . . . . . . . . . . . . . . . . . . . . . . . . . . . . . . . . . . . . . . . . . . . . . . . . . . . . . . . . . . . 65
26. Selected water-quality constituents measured in the field in water samples collected during aquifer-isolation tests in well 05MW14I (MG-2138), July 12-13, 2005, Willow Grove Naval Air Station/Joint Reserve Base, Horsham Township, Montgomery County, Pennsylvania. . . . . . . . . . . . . . . . . . . . . . . . . . . . . . . . . . . . . . . . . . . . . . . . . . . . . . . . . . . . . . . . . . . . . . . . . . . . . . . . . . . . . 65
27. Heatpulse-flowmeter measurements made in well 05MW15I (MG-2139), Willow Grove Naval Air Station/Joint Reserve Base, Horsham Township, Montgomery County, Pennsylvania, June 28, 2005 . . . . . . . . . . . . . . . . . . . . . . . . . . . . . . . . . . . . . . . . . . . . . . . . . . . . . . . . . . . . . . . . . . . . . . 66
28. Intervals isolated during aquifer-isolation tests conducted in well 05MW15I (MG-2139), July 14-15, 2005, Willow Grove Naval Air Station/Joint Reserve Base, Horsham Township, Montgomery County, Pennsylvania. . . . . . . . . . . . . . . . . . . . . . . . . . . . . . . . . . . . . . . . . . . . . . . . . . . . . . . . . . . . . . . 68
29. Concentrations of volatile organic compounds detected in water samples collected during aquifer-isolation tests in well 05MW15I (MG-2139), July 14-18, 2005, Willow Grove Naval Air Station/Joint Reserve Base, Horsham Township, Montgomery County, Pennsylvania. . . . . . . . . . . . . . . . . . . . . . . . . . . . . . . . . . . . . . . . . . . . . . . . . . . . . . . . . . . . . . . . . . . . . . . . . . . . . . . . . . . . . 70
x
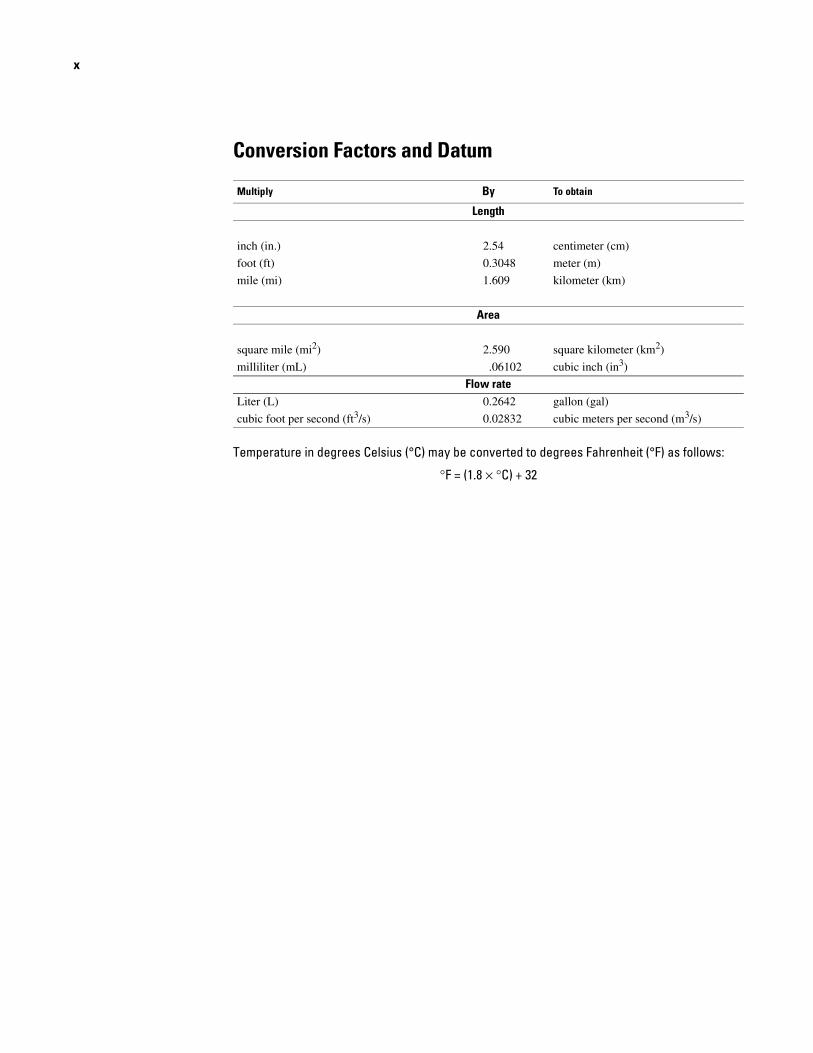
Conversion Factors and Datum
Temperature in degrees Celsius (°C) may be converted to degrees Fahrenheit (°F) as follows:
°F = (1.8 × °C) + 32
Multiply By To obtain
Length
inch (in.) 2.54 centimeter (cm)
foot (ft) 0.3048 meter (m)
mile (mi) 1.609 kilometer (km)
Area
square mile (mi2) 2.590 square kilometer (km2)
milliliter (mL) .06102 cubic inch (in3)
Flow rateLiter (L) 0.2642 gallon (gal)
cubic foot per second (ft3/s) 0.02832 cubic meters per second (m3/s)

Interpretation of Borehole Geophysical Logs, Aquifer-Isolation Tests, and Water-Quality Data for Sites 1, 3, and 5 at the Willow Grove Naval Air Station/Joint Reserve Base, Horsham Township, Montgomery County, Pennsylvania: 2005
by Ronald A. Sloto
Abstract
Borehole geophysical logging, heatpulse-flowmeter mea-surements, borehole television surveys, and aquifer-isolation tests were conducted in 2005 at the Willow Grove Naval Air Station/Joint Reserve Base (NAS/JRB) in Horsham Township, Montgomery County, Pa. This study was done by the U.S. Geo-logical Survey (USGS) in cooperation with the U.S. Navy in support of hydrogeological investigations to address ground-water contamination. Data collected for this study are valuable for understanding ground-water flow in the Stockton Formation at the local and regional scale. The Willow Grove NAS/JRB is underlain by the Stockton Formation, which consists of sedi-mentary rocks of Triassic age. The rocks of the Stockton For-mation form a complex, heterogeneous aquifer with partially connected zones of high permeability. Borehole geophysical logs, heatpulse-flowmeter measurements, and borehole televi-sion surveys made in seven boreholes ranging from 70 to 350 ft deep were used to identify potential water-producing fractures and fracture zones and to select intervals for aquifer-isolation tests. An upward vertical hydraulic gradient was measured in one borehole, a downward vertical hydraulic gradient was mea-sured in four boreholes, both an upward and a downward verti-cal hydraulic gradient were measured in one borehole, and no flow was measurable in one borehole. The aquifer-isolation tests isolated 30 discrete fractures in the seven boreholes for collection of depth-discrete hydraulic and water-quality data. Of the 30 fractures identified as potentially water producing, 26 fractures (87 percent) produced more than 1 gallon per minute of water. The specific capacity of the isolated intervals producing more than 1 gallon per minute ranged from 0.02 to 5.2 gallons per minute per foot. There was no relation between specific capacity and depth of the fracture. Samples for analysis for volatile organic compounds were collected from each iso-lated zone. Tetrachloroethylene (PCE) was the most prevalent compound at Site 1; concentrations were as great as 62 µg/L (micrograms per liter). 1,1-dichloroethane was the most preva-lent compound at Site 3; concentrations were as great as 9.3 µg/L. Toluene was the most prevalent compound at Site 5; concentrations were as great as 77 µg/L. For five out of the six wells (83 percent) sampled for field determinations of water-
quality constituents, the interval with the lowest dissolved oxy-gen concentration had the highest total VOC concentration.
Introduction
The Willow Grove Naval Air Station/Joint Reserve Base (NAS/JRB) is in Horsham Township, Montgomery County, Pa. (fig. 1). In addition to its primary use as a reserve Naval air sta-tion, this 1,000-acre facility also supports Marine, Army, and Air Force activities. Areas with possible contamination at the Willow Grove NAS/JRB (fig. 1), also referred to as “the base” in this report, were identified by the U.S. Navy as part of a pre-liminary assessment program (Halliburton NUS Environmental Corporation, 1993). A hydrogeological investigation is being conducted by the U.S. Navy to address ground-water contami-nation at these sites.
In support of this investigation, the U.S. Geological Sur-vey (USGS) conducted borehole geophysical logging and aqui-fer-isolation (packer) tests in seven boreholes to characterize the geophysical and hydraulic properties and to characterize the water quality of water-producing fractures. This work is a con-tinuation of previous work by the USGS (Conger, 1997, 1999; Sloto, 2002; Sloto and others, 2001, 2002). Some data used for this study and presented in this report were provided by TetraTech NUS, Inc., and ECOR Solutions, Inc., and are repro-duced herein with permission.
Purpose and Scope
For this study, borehole geophysical logs, heatpulse-flow-meter measurements, and borehole television surveys made in seven boreholes ranging from 70 to 350 ft deep were used to identify potential water-producing fractures and fracture zones and to select intervals for aquifer-isolation tests. The aquifer-isolation tests isolated 30 discrete fractures in the seven bore-holes for collection of depth-discrete hydraulic and water-qual-ity data. Samples for analysis for volatile organic compounds were collected from each isolated zone.This report presents an interpretation of borehole geophysical logs, heatpulse-flowme-ter measurements, borehole television surveys, and aquifer-iso-

2 Interpretation of Borehole Geophysical Logs for Sites 1, 3, and 5 at Willow Grove Naval Air Station/Joint Reserve Base
75°10' 75°09' 75°08'
40°11'
40°12'
40°13'
SITE 3
SITE 5
SITE 1
BASE BOUNDARY
0 0.5 10.25 MILE0.75
0 0.5 10.25 KILOMETER0.75
Base from U.S. Geological Survey Ambler 1:24,000, 1966
Location of map
PENNSYLVANIA
Figure 1. Location of the Willow Grove Naval Air Station/Joint Reserve Base and sites of possible ground-water contamination, Horsham Township, Montgomery County, Pennsylvania.
Introduction 3
lation tests conducted in the seven boreholes. The report also presents water-quality data collected during the aquifer-isola-tion tests.
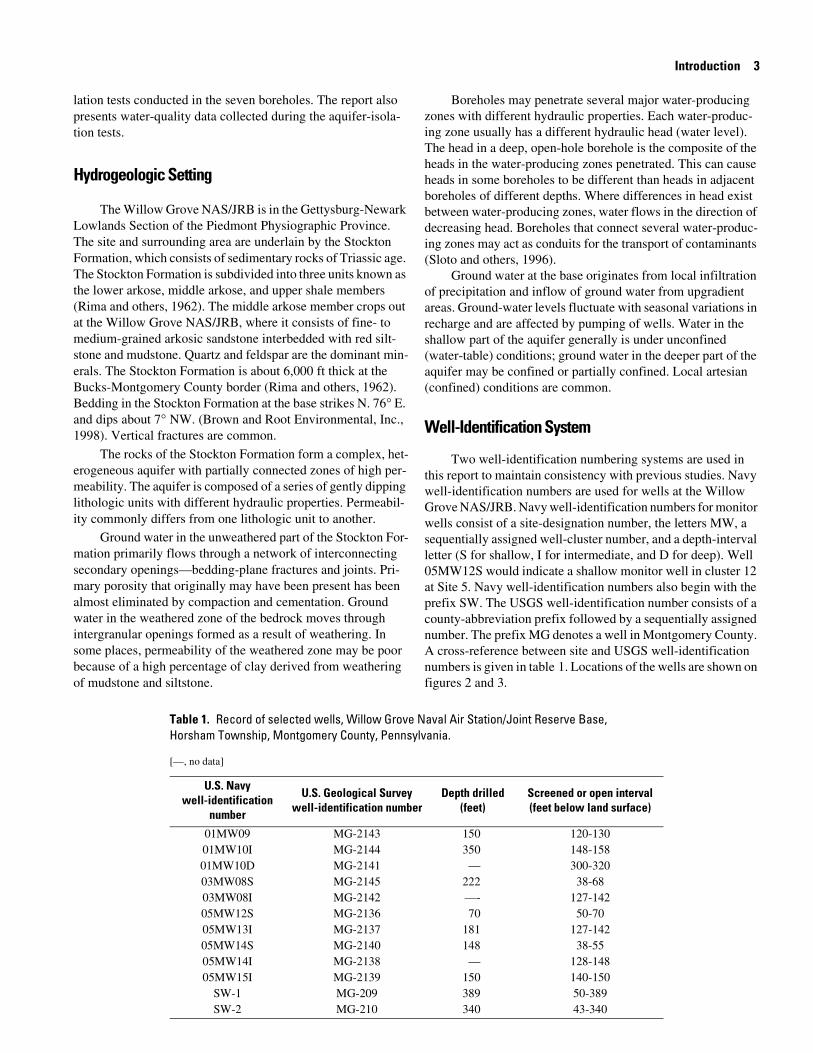
Hydrogeologic Setting
The Willow Grove NAS/JRB is in the Gettysburg-Newark Lowlands Section of the Piedmont Physiographic Province. The site and surrounding area are underlain by the Stockton Formation, which consists of sedimentary rocks of Triassic age. The Stockton Formation is subdivided into three units known as the lower arkose, middle arkose, and upper shale members (Rima and others, 1962). The middle arkose member crops out at the Willow Grove NAS/JRB, where it consists of fine- to medium-grained arkosic sandstone interbedded with red silt-stone and mudstone. Quartz and feldspar are the dominant min-erals. The Stockton Formation is about 6,000 ft thick at the Bucks-Montgomery County border (Rima and others, 1962). Bedding in the Stockton Formation at the base strikes N. 76° E. and dips about 7° NW. (Brown and Root Environmental, Inc., 1998). Vertical fractures are common.
The rocks of the Stockton Formation form a complex, het-erogeneous aquifer with partially connected zones of high per-meability. The aquifer is composed of a series of gently dipping lithologic units with different hydraulic properties. Permeabil-ity commonly differs from one lithologic unit to another.
Ground water in the unweathered part of the Stockton For-mation primarily flows through a network of interconnecting secondary openings—bedding-plane fractures and joints. Pri-mary porosity that originally may have been present has been almost eliminated by compaction and cementation. Ground water in the weathered zone of the bedrock moves through intergranular openings formed as a result of weathering. In some places, permeability of the weathered zone may be poor because of a high percentage of clay derived from weathering of mudstone and siltstone.
Boreholes may penetrate several major water-producing zones with different hydraulic properties. Each water-produc-ing zone usually has a different hydraulic head (water level). The head in a deep, open-hole borehole is the composite of the heads in the water-producing zones penetrated. This can cause heads in some boreholes to be different than heads in adjacent boreholes of different depths. Where differences in head exist between water-producing zones, water flows in the direction of decreasing head. Boreholes that connect several water-produc-ing zones may act as conduits for the transport of contaminants (Sloto and others, 1996).
Ground water at the base originates from local infiltration of precipitation and inflow of ground water from upgradient areas. Ground-water levels fluctuate with seasonal variations in recharge and are affected by pumping of wells. Water in the shallow part of the aquifer generally is under unconfined (water-table) conditions; ground water in the deeper part of the aquifer may be confined or partially confined. Local artesian (confined) conditions are common.
Well-Identification System
Two well-identification numbering systems are used in this report to maintain consistency with previous studies. Navy well-identification numbers are used for wells at the Willow Grove NAS/JRB. Navy well-identification numbers for monitor wells consist of a site-designation number, the letters MW, a sequentially assigned well-cluster number, and a depth-interval letter (S for shallow, I for intermediate, and D for deep). Well 05MW12S would indicate a shallow monitor well in cluster 12 at Site 5. Navy well-identification numbers also begin with the prefix SW. The USGS well-identification number consists of a county-abbreviation prefix followed by a sequentially assigned number. The prefix MG denotes a well in Montgomery County. A cross-reference between site and USGS well-identification numbers is given in table 1. Locations of the wells are shown on figures 2 and 3.
Table 1. Record of selected wells, Willow Grove Naval Air Station/Joint Reserve Base, Horsham Township, Montgomery County, Pennsylvania.
[—, no data]
U.S. Navywell-identification
number
U.S. Geological Surveywell-identification number
Depth drilled(feet)
Screened or open interval (feet below land surface)
01MW09 MG-2143 150 120-13001MW10I MG-2144 350 148-15801MW10D MG-2141 — 300-32003MW08S MG-2145 222 38-6803MW08I MG-2142 —- 127-14205MW12S MG-2136 70 50-7005MW13I MG-2137 181 127-14205MW14S MG-2140 148 38-5505MW14I MG-2138 — 128-14805MW15I MG-2139 150 140-150
SW-1 MG-209 389 50-389SW-2 MG-210 340 43-340

4 Interpretation of Borehole Geophysical Logs for Sites 1, 3, and 5 at Willow Grove Naval Air Station/Joint Reserve Base
Figure 2. Locations of base supply wells (SW) and selected monitor wells (MW) at Site 1, Willow Grove Naval Air Station/ Joint Reserve Base, Horsham Township, Montgomery County, Pennsylvania.
01MW09 WELL AND IDENTIFICATION NUMBER
75°08'30” 75°08'20”
40°12'20”
40°12'30”
SW-2
SW-1
01MW10
01MW09
0 250 500 FEET
0 50 100 METERS
Base from TetraTech NUS, Inc. (2006)
A
A'
EXPLANATION
A A' LINE OF GEOLOGIC SECTION

Introduction 5
40°11'24”
40°11'30”
40°11'36”
75°09' 75°08'50”
0 250 500 FEET
0 50 100 METERS
05MW15I
05MW14I
05MW13I05MW12S
05MW12I
05MW10S
05MW10I05MW09I
05MW07S
05MW07I05MW05S
05MW05I
05MW03S
05MW03I 05MW02S
05MW01S05MW01I
05MW01SI
03MW08
Base from TetraTech NUS, Inc. (2006)
03MW08
OBSERVATION WELL AND IDENTIFICATION NUMBER
WELL USED FOR AQUIFER-ISOLATION TEST AND IDENTIFICATION NUMBER
05MW3I
EXPLANATION
Figure 3. Locations of selected monitor wells at Sites 3 and 5, Willow Grove Naval Air Station/Joint Reserve Base, Horsham Township, Montgomery County, Pennsylvania.
6 Interpretation of Borehole Geophysical Logs for Sites 1, 3, and 5 at Willow Grove Naval Air Station/Joint Reserve Base
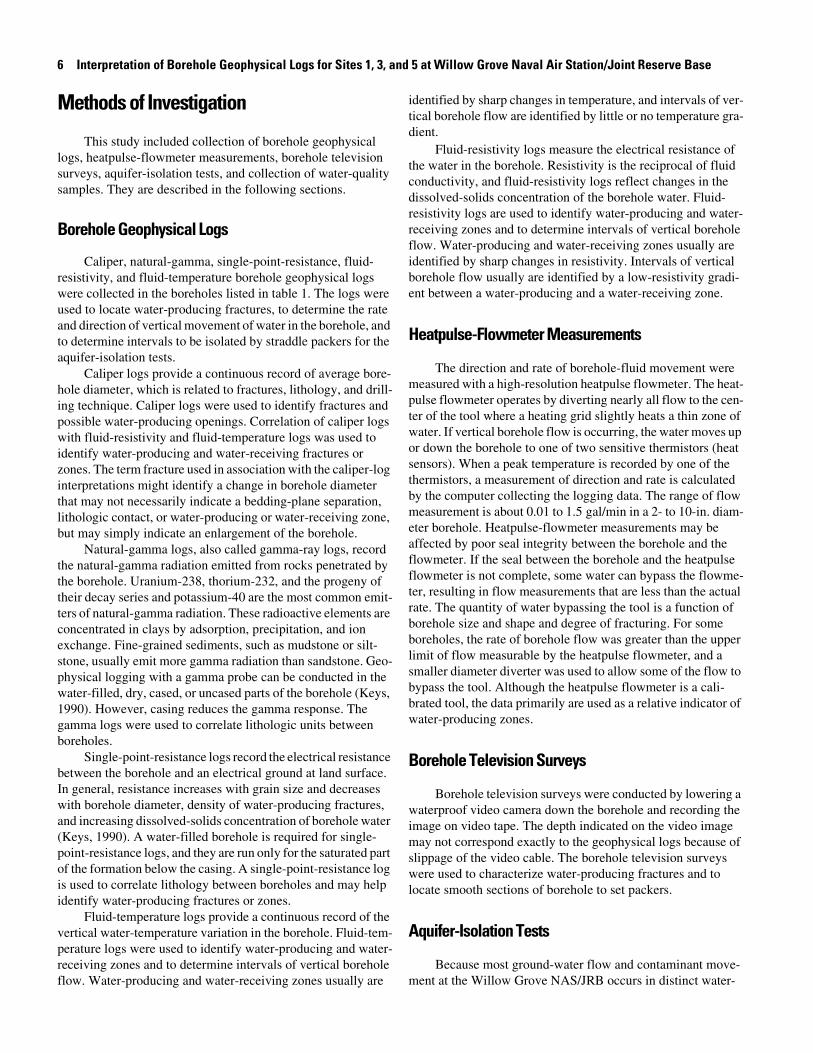
Methods of Investigation
This study included collection of borehole geophysical logs, heatpulse-flowmeter measurements, borehole television surveys, aquifer-isolation tests, and collection of water-quality samples. They are described in the following sections.
Borehole Geophysical Logs
Caliper, natural-gamma, single-point-resistance, fluid-resistivity, and fluid-temperature borehole geophysical logs were collected in the boreholes listed in table 1. The logs were used to locate water-producing fractures, to determine the rate and direction of vertical movement of water in the borehole, and to determine intervals to be isolated by straddle packers for the aquifer-isolation tests.
Caliper logs provide a continuous record of average bore-hole diameter, which is related to fractures, lithology, and drill-ing technique. Caliper logs were used to identify fractures and possible water-producing openings. Correlation of caliper logs with fluid-resistivity and fluid-temperature logs was used to identify water-producing and water-receiving fractures or zones. The term fracture used in association with the caliper-log interpretations might identify a change in borehole diameter that may not necessarily indicate a bedding-plane separation, lithologic contact, or water-producing or water-receiving zone, but may simply indicate an enlargement of the borehole.
Natural-gamma logs, also called gamma-ray logs, record the natural-gamma radiation emitted from rocks penetrated by the borehole. Uranium-238, thorium-232, and the progeny of their decay series and potassium-40 are the most common emit-ters of natural-gamma radiation. These radioactive elements are concentrated in clays by adsorption, precipitation, and ion exchange. Fine-grained sediments, such as mudstone or silt-stone, usually emit more gamma radiation than sandstone. Geo-physical logging with a gamma probe can be conducted in the water-filled, dry, cased, or uncased parts of the borehole (Keys, 1990). However, casing reduces the gamma response. The gamma logs were used to correlate lithologic units between boreholes.
Single-point-resistance logs record the electrical resistance between the borehole and an electrical ground at land surface. In general, resistance increases with grain size and decreases with borehole diameter, density of water-producing fractures, and increasing dissolved-solids concentration of borehole water (Keys, 1990). A water-filled borehole is required for single-point-resistance logs, and they are run only for the saturated part of the formation below the casing. A single-point-resistance log is used to correlate lithology between boreholes and may help identify water-producing fractures or zones.
Fluid-temperature logs provide a continuous record of the vertical water-temperature variation in the borehole. Fluid-tem-perature logs were used to identify water-producing and water-receiving zones and to determine intervals of vertical borehole flow. Water-producing and water-receiving zones usually are
identified by sharp changes in temperature, and intervals of ver-tical borehole flow are identified by little or no temperature gra-dient.
Fluid-resistivity logs measure the electrical resistance of the water in the borehole. Resistivity is the reciprocal of fluid conductivity, and fluid-resistivity logs reflect changes in the dissolved-solids concentration of the borehole water. Fluid-resistivity logs are used to identify water-producing and water-receiving zones and to determine intervals of vertical borehole flow. Water-producing and water-receiving zones usually are identified by sharp changes in resistivity. Intervals of vertical borehole flow usually are identified by a low-resistivity gradi-ent between a water-producing and a water-receiving zone.
Heatpulse-Flowmeter Measurements
The direction and rate of borehole-fluid movement were measured with a high-resolution heatpulse flowmeter. The heat-pulse flowmeter operates by diverting nearly all flow to the cen-ter of the tool where a heating grid slightly heats a thin zone of water. If vertical borehole flow is occurring, the water moves up or down the borehole to one of two sensitive thermistors (heat sensors). When a peak temperature is recorded by one of the thermistors, a measurement of direction and rate is calculated by the computer collecting the logging data. The range of flow measurement is about 0.01 to 1.5 gal/min in a 2- to 10-in. diam-eter borehole. Heatpulse-flowmeter measurements may be affected by poor seal integrity between the borehole and the flowmeter. If the seal between the borehole and the heatpulse flowmeter is not complete, some water can bypass the flowme-ter, resulting in flow measurements that are less than the actual rate. The quantity of water bypassing the tool is a function of borehole size and shape and degree of fracturing. For some boreholes, the rate of borehole flow was greater than the upper limit of flow measurable by the heatpulse flowmeter, and a smaller diameter diverter was used to allow some of the flow to bypass the tool. Although the heatpulse flowmeter is a cali-brated tool, the data primarily are used as a relative indicator of water-producing zones.
Borehole Television Surveys
Borehole television surveys were conducted by lowering a waterproof video camera down the borehole and recording the image on video tape. The depth indicated on the video image may not correspond exactly to the geophysical logs because of slippage of the video cable. The borehole television surveys were used to characterize water-producing fractures and to locate smooth sections of borehole to set packers.
Aquifer-Isolation Tests
Because most ground-water flow and contaminant move-ment at the Willow Grove NAS/JRB occurs in distinct water-

Methods of Investigation 7
producing fractures rather than through primary openings in the bedrock, it is important to define the hydraulic and chemical characteristics of important, discrete water-producing fractures. This characterization only can be performed by isolating each water-producing fracture with straddle packers so that its prop-erties can be separated from the other water-producing fractures in the borehole. These tests are called aquifer-isolation tests and commonly are referred to as packer tests.
The straddle-packer assembly consisted of two inflatable rubber bladders (packers) about 4 ft long set on 2-in.-diameter lift pipe with a pump set between the packers. The distance from the center of the upper packer to the center of the lower packer varied. Packer settings given in this report are from the bottom of the top packer to the top of the bottom packer. Isolated inter-vals are numbered in order from the bottom to the top of the borehole.
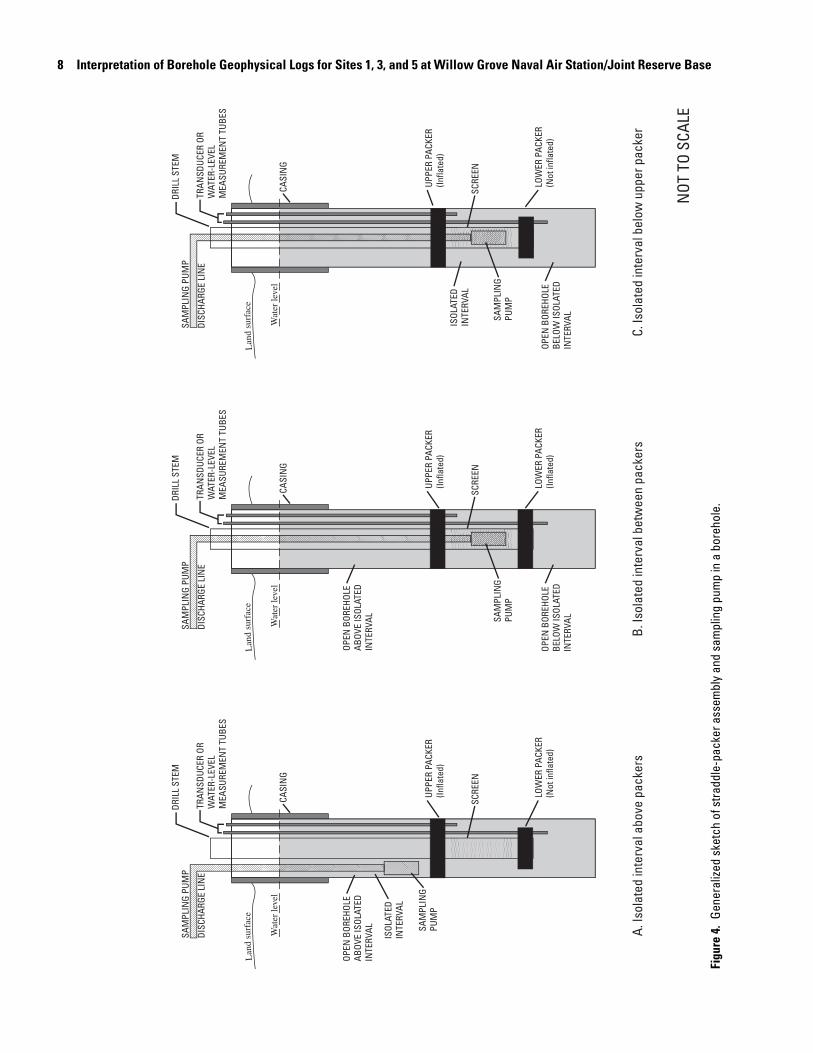
Several aquifer-isolation tests were conducted in each borehole. Intervals selected for aquifer-isolation tests were based on the borehole geophysical logs and borehole television surveys. The packer assembly was lowered to the selected depth in the borehole, and the packers were inflated against the bore-hole wall, isolating the selected interval. Exact depths to set packers were based on the location of smooth sections of bore-hole wall determined from the caliper logs and borehole televi-sion surveys. For the test of most intervals, both packers were inflated (fig. 4B). For the test of the lowermost isolated interval in most boreholes, only the upper packer was inflated (fig. 4A). For the test of the uppermost isolated interval in most boreholes, only the lower packer was inflated (fig. 4C). Inflation of both packers created three intervals—an upper interval above the upper packer, the isolated interval between the packers, and a lower interval below the lower packer. Pressure in the packers was monitored continuously so that the packers always remained at maximum inflation. After the packers were inflated, water levels in each interval usually were allowed to stabilize before pumping began. Because of interference caused by the pumping of the supply wells, water levels may not have stabilized completely before the start of the test. Water levels were recorded above, below, and in the isolated interval.
During aquifer-isolation tests, measurements of water lev-els were made in each interval by calibrated pressure transduc-ers and were recorded by a digital data logger. Water levels ini-tially were determined by electric measuring tapes; these water levels were used to calibrate the transducers. The transducers were set in measurement tubes open to the monitored intervals. The accuracy of the transducer in the isolated interval was ± 0.06 ft. The accuracy of the transducers used in the intervals above and below the isolated interval was ± 0.03 ft. Land sur-face is used as a reference for all water-level measurements in this report. Calibrated, in-line flowmeters were used to measure discharge. The water was treated by a granulated active carbon filtration system before discharge.
The specific capacity of each isolated interval was calcu-lated by dividing the pumping rate by the drawdown. Water samples were collected prior to the end of each test by opening a sampling port in the discharge line before the flowmeter and
the activated carbon treatment system. This caused the pumping rate to increase and the water level to decline. The specific capacity was determined using the drawdown just prior to sam-pling. Specific capacity is affected by the pumping rate and the length of pumping. In general, a higher pumping rate and(or) a longer pumping duration will result in a lower specific capacity.
Water-Quality Samples
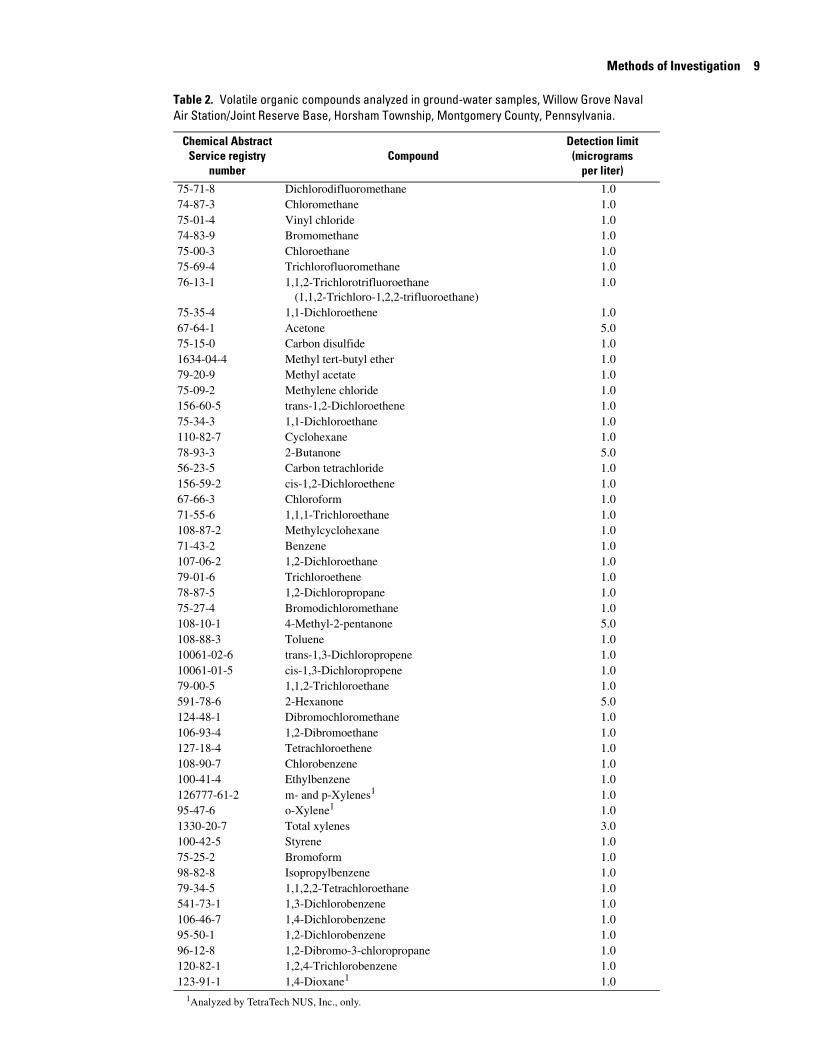
Field determination of water-quality constituents (dis-solved oxygen, pH, specific conductance, and temperature) were made by the USGS. Water samples were collected for lab-oratory analysis for volatile organic compounds (VOCs) (table 2) by TetraTech NUS, Inc., or ECOR Solutions, Inc. Samples were collected near the end of each aquifer-isolation test from a sampling port placed in the discharge line before the flowmeter and active carbon filtration system. Samples for VOC analysis were collected in 40-milliliter septum bottles, placed on ice, and shipped overnight to a contract laboratory.
8 Interpretation of Borehole Geophysical Logs for Sites 1, 3, and 5 at Willow Grove Naval Air Station/Joint Reserve Base
Lan
d su
rfac
e
UPPE
R PA
CKER
(Infla
ted)
LOW
ER P
ACKE
R(N
ot in
flate
d)
DRIL
L ST
EMSA
MPL
ING
PUM
P
DISC
HARG
E LI
NE
CASI
NG
TRAN
SDUC
ER O
RW
ATER
-LEV
ELM
EASU
REM
ENT
TUBE
S
Wat
er le
vel
SAM
PLIN
GPU
MP
SCRE
EN
OPEN
BOR
EHOL
EAB
OVE
ISOL
ATED
INTE
RVAL A.
Isol
ated
inte
rval
abo
ve p
acke
rsB.
Isol
ated
inte
rval
bet
wee
n pa
cker
sC.
Isol
ated
inte
rval
bel
ow u
pper
pac
ker
Lan
d su
rfac
e
UPPE
R PA
CKER
(Infla
ted)
LOW
ER P
ACKE
R(In
flate
d)
DRIL
L ST
EMSA
MPL
ING
PUM
P
DISC
HARG
E LI
NE
CASI
NG
TRAN
SDUC
ER O
RW
ATER
-LEV
ELM
EASU
REM
ENT
TUBE
S
Wat
er le
vel
SAM
PLIN
GPU
MP
SCRE
EN
OPEN
BOR
EHOL
EAB
OVE
ISOL
ATED
INTE
RVAL
ISOL
ATED
INTE
RVAL
OPEN
BOR
EHOL
EBE
LOW
ISOL
ATED
INTE
RVAL
Lan
d su
rfac
e
UPPE
R PA
CKER
(Infla
ted)
LOW
ER P
ACKE
R(N
ot in
flate
d)
DRIL
L ST
EM
CASI
NG
TRAN
SDUC
ER O
RW
ATER
-LEV
ELM
EASU
REM
ENT
TUBE
S
Wat
er le
vel
SAM
PLIN
GPU
MP
SCRE
EN
NOT
TO
SCAL
E
SAM
PLIN
G PU
MP
DISC
HARG
E LI
NE
ISOL
ATED
INTE
RVAL
OPEN
BOR
EHOL
EBE
LOW
ISOL
ATED
INTE
RVAL
Figu
re 4
. Ge
nera
lized
ske
tch
of s
tradd
le-p
acke
r ass
embl
y an
d sa
mpl
ing
pum
p in
a b
oreh
ole.
Methods of Investigation 9
Table 2. Volatile organic compounds analyzed in ground-water samples, Willow Grove Naval Air Station/Joint Reserve Base, Horsham Township, Montgomery County, Pennsylvania.
Chemical Abstract Detection limitService registry Compound (micrograms
number per liter)75-71-874-87-375-01-474-83-975-00-375-69-476-13-1
75-35-467-64-175-15-01634-04-479-20-975-09-2156-60-575-34-3110-82-778-93-356-23-5156-59-267-66-371-55-6108-87-271-43-2107-06-279-01-678-87-575-27-4108-10-1108-88-310061-02-610061-01-579-00-5591-78-6124-48-1106-93-4127-18-4108-90-7100-41-4126777-61-295-47-61330-20-7100-42-575-25-298-82-879-34-5541-73-1106-46-795-50-196-12-8120-82-1123-91-1
DichlorodifluoromethaneChloromethaneVinyl chlorideBromomethaneChloroethaneTrichlorofluoromethane1,1,2-Trichlorotrifluoroethane
(1,1,2-Trichloro-1,2,2-trifluoroethane)1,1-DichloroetheneAcetoneCarbon disulfideMethyl tert-butyl etherMethyl acetateMethylene chloridetrans-1,2-Dichloroethene1,1-DichloroethaneCyclohexane2-ButanoneCarbon tetrachloridecis-1,2-DichloroetheneChloroform1,1,1-TrichloroethaneMethylcyclohexaneBenzene1,2-DichloroethaneTrichloroethene1,2-DichloropropaneBromodichloromethane4-Methyl-2-pentanoneToluenetrans-1,3-Dichloropropenecis-1,3-Dichloropropene1,1,2-Trichloroethane2-HexanoneDibromochloromethane1,2-DibromoethaneTetrachloroetheneChlorobenzeneEthylbenzene
1m- and p-Xylenes1o-Xylene
Total xylenesStyreneBromoformIsopropylbenzene1,1,2,2-Tetrachloroethane1,3-Dichlorobenzene1,4-Dichlorobenzene1,2-Dichlorobenzene1,2-Dibromo-3-chloropropane1,2,4-Trichlorobenzene
11,4-Dioxane
1.01.01.01.01.01.01.0
1.05.01.01.01.01.01.01.01.05.01.01.01.01.01.01.01.01.01.01.05.01.01.01.01.05.01.01.01.01.01.01.01.03.01.01.01.01.01.01.01.01.01.01.0
1Analyzed by TetraTech NUS, Inc., only.

10 Interpretation of Borehole Geophysical Logs for Sites 1, 3, and 5 at Willow Grove Naval Air Station/Joint Reserve Base
Interpretation of Borehole Geophysical Logs, Aquifer-Isolation Tests, and Water-Quality Data at Site 1
Water levels in the vicinity of Site 1 (figs. 1 and 2) are strongly influenced by the pumping cycle of wells SW-1 and SW-2 (fig. 2), which pump in tandem. Water levels in wells 01MW09 and 01MW10 are never static. The water levels are always rising or falling in response to the pumping cycles in wells SW-1 and SW-2 (fig. 5). During the aquifer-isolation tests, the water-level cycle in well 01MW09 had a range of approximately 0.6 ft, and the water-level cycle in well 01MW10 had a range of approximately 4.7 ft. The peaks in water level in well 01MW09 occurred about 25 minutes later than the peaks in well 01MW10. Constantly rising and falling water levels can make interpretation of borehole geophysical logs and aquifer-isolation-test data difficult.
Correlation of Borehole Geophysical Logs
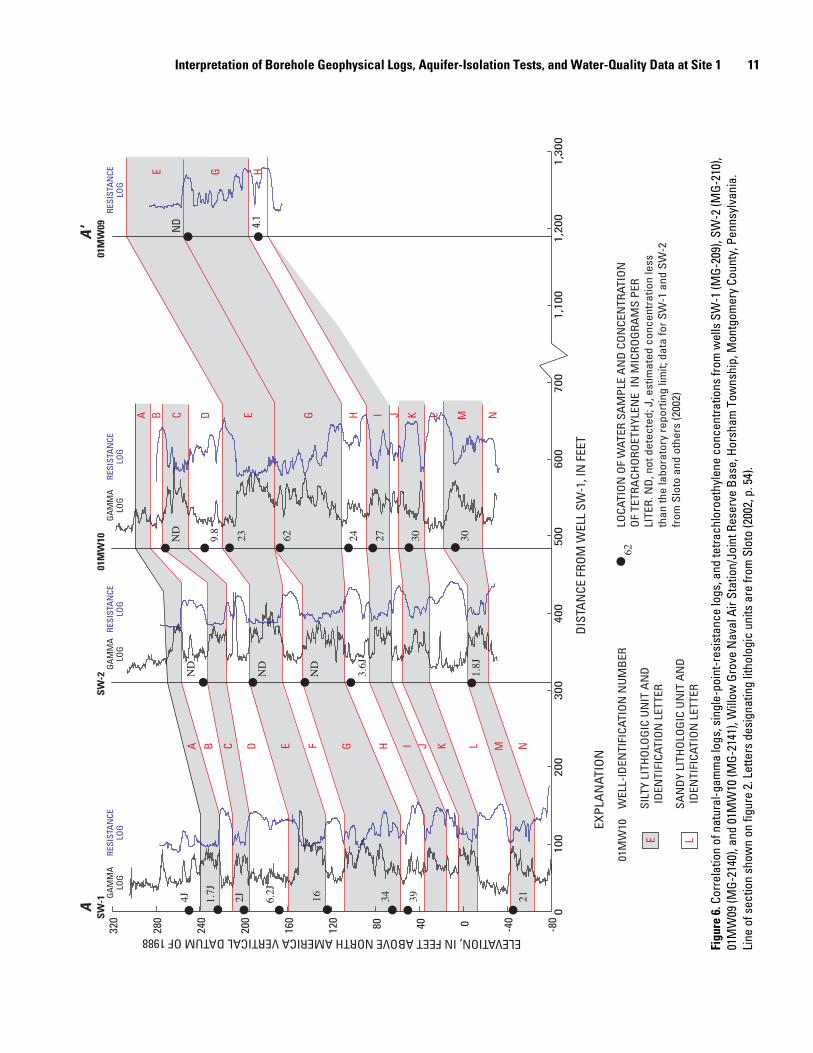
Lithologic units penetrated by wells SW-1 and SW-2 were correlated by Sloto and others (2002, p. 54). This correlation was extended to wells 01MW09 and 01MW10 (fig. 6). Frac-
tures in lithologic units in wells SW-1 and SW-2 with the great-est concentrations of tetrachloroethylene (PCE) are also pene-trated by wells 01MW09 and 01MW10. The highest concentration of PCE measured in well SW-1 was from litho-logic unit H (39 µg/L) and lithologic unit G (34 µg/L). These units are penetrated by wells 01MW09 and 01MW10 (fig. 6).
Well 01MW09 (MG-2143)
Well 01MW09 was drilled about 1,240 ft southeast of well SW-1 and 1,140 ft southeast of well SW-2 (fig. 2). Projecting the location of well 01MW09 in the direction of dip places it about 1,165 ft updip of well SW-1.
Interpretation of Borehole Geophysical Logs
A suite of borehole geophysical logs (fig. 7) was collected in well 01MW09 (fig. 2) by the USGS on November 8, 2005. A gamma log is not available. The caliper log shows the well is 150 ft deep, cased to 29 ft bls (below land surface), and major fractures are at 43, 59-66, 75, and 125 ft bls. The fluid-temper-ature log shows sharp breaks in slope at about 60 and 129 ft bls. The fluid-resistivity log shows sharp breaks in slope at about 60 and 118 ft bls. The fluid-temperature and fluid-resistivity logs
WATER LEVEL IN WELL 01MW10
WATER LEVEL IN WELL 01MW09
22
23
24
25
26
27
28
29
30
NOVEMBER 20058 9 10 11 12 13 14
DEP
TH T
O W
ATER
, IN
FEE
T B
ELO
W L
AN
D S
URF
ACE
Figure 5. Hydrographs from wells 01MW09 (MG-2143) and 01MW10 (MG-2141), Willow Grove Naval Air Station/Joint Reserve Base, Horsham Township, Montgomery County, Pennsylvania, November 8-14, 2005.
Interpretation of Borehole Geophysical Logs, Aquifer-Isolation Tests, and Water-Quality Data at Site 1 11
A B E F G H I J K LC D M N
MGE H LDCBA I J K N
E
01M
W10
WEL
L-ID
ENTI
FICA
TIO
N N
UM
BER
DIS
TAN
CE F
ROM
WEL
L SW
-1, I
N F
EET
SW-1
SW-2
01M
W10
01M
W09
4080 -80
-400
120
160
200
240
280
320
100
020
030
040
050
060
070
01,
100
1,30
0
ELEVATION, IN FEET ABOVE NORTH AMERICA VERTICAL DATUM OF 1988
1,20
0
E G H
ND
3.6J
1.8J
ND
ND
4J 34166.2J
2J1.7J
2139
ND
62239.8
4.1
ND
30302724
AA
'
EXPL
AN
ATIO
N
SILT
Y LI
THO
LOG
IC U
NIT
AN
D
ID
ENTI
FICA
TIO
N L
ETTE
R
62LO
CATI
ON
OF
WAT
ER S
AM
PLE
AN
D C
ON
CEN
TRAT
ION
OF
TETR
ACH
ORO
ETH
YLEN
E IN
MIC
ROG
RAM
S PE
RLI
TER.
ND
, not
det
ecte
d; J
, est
imat
ed c
once
ntra
tion
less
than
the
labo
rato
ry re
port
ing
limit;
dat
a fo
r SW
-1 a
nd S
W-2
from
Slo
to a
nd o
ther
s (2
002)
LSA
ND
Y LI
THO
LOG
IC U
NIT
AN
D
ID
ENTI
FICA
TIO
N L
ETTE
R
GA
MM
ALO
GRE
SIST
AN
CELO
GG
AM
MA
LOG
GA
MM
ALO
GRE
SIST
AN
CELO
GRE
SIST
AN
CELO
GRE
SIST
AN
CELO
G
Figu
re 6
. Cor
rela
tion
of n
atur
al-g
amm
a lo
gs, s
ingl
e-po
int-r
esis
tanc
e lo
gs, a
nd te
trach
loro
ethy
lene
con
cent
ratio
ns fr
om w
ells
SW
-1 (M
G-20
9), S
W-2
(MG-
210)
, 01
MW
09 (M
G-2
140)
, and
01M
W10
(MG-
2141
), W
illow
Gro
ve N
aval
Air
Stat
ion/
Join
t Res
erve
Bas
e, H
orsh
am T
owns
hip,
Mon
tgom
ery
Coun
ty, P
enns
ylva
nia.
Li
ne o
f sec
tion
show
n on
figu
re 2
. Let
ters
des
igna
ting
litho
logi
c un
its a
re fr
om S
loto
(200
2, p
. 54)
.

12 Interpretation of Borehole Geophysical Logs for Sites 1, 3, and 5 at Willow Grove Naval Air Station/Joint Reserve Base
SIN
GLE
-PO
INT
RE
SIS
TAN
CE
,IN
OH
MS
FLU
IDT
EM
PE
RA
TU
RE
, IN
DE
GR
EE
S C
ELS
IUS
FLU
ID R
ES
IST
IVIT
Y,IN
OH
M-M
ET
ER
S
100
200
300
400
500
1313
.514
810
1214
DEPTH, IN FEET BELOW LAND SURFACEC
ALI
PE
R L
OG
HO
LE D
IAM
ET
ER
,IN
INC
HE
S
0
20 40 60 80 100
120
140
160
88.
59
9.5
CA
SIN
G
Figu
re 7
. Bor
ehol
e ge
ophy
sica
l log
s fo
r wel
l 01M
W09
(MG-
2143
), W
illow
Gro
ve N
aval
Air
Stat
ion/
Join
t Res
erve
Bas
e, H
orsh
am T
owns
hip,
M
ontg
omer
y Co
unty
, Pen
nsyl
vani
a, N
ovem
ber 8
, 200
5.

Interpretation of Borehole Geophysical Logs, Aquifer-Isolation Tests, and Water-Quality Data at Site 1 13
indicate borehole flow and possible water-producing zones at about 60 and 125 ft bls.
Heatpulse-flowmeter measurements were made under nonpumping conditions (table 3). However, the water level in well 01MW09 was not static at the time the measurements were made. The geophysical logs and heatpulse-flowmeter measure-ments indicate water entered the borehole at a rate of about 1.1 gal/min through a large vertical fracture at 59-66 ft bls and flowed upward and downward. Water flowing upward exited the borehole through fractures above 44 ft bls. Water flowing downward exited through a horizontal fracture at 125 ft bls (fig. 8). Well 01MW09 was screened later from 120 to 130 ft bls to monitor the principle water-producing fracture at 125 ft bls.
Interpretation of Aquifer-Isolation Tests
On the basis of the borehole geophysical logs, heatpulse-flowmeter measurements, and the borehole television survey,
three intervals were selected for aquifer-isolation tests in well 01MW09 (table 4). A straddle-packer assembly was used to isolate discrete fractures to determine depth-discrete specific-capacity values and to obtain depth-discrete water samples. For the test of intervals 1 and 2, the distance between the bottom of the upper packer and the top of the lower packer was 11 ft, and both packers were inflated. For the test of interval 3, only the upper packer was inflated.
Table 3. Heatpulse-flowmeter measurements made in well 01MW09 (MG-2143), Willow Grove Naval Air Station/Joint Reserve Base, Horsham Township, Montgomery County, Pennsylvania, November 8, 2005.
Depth(feet below
land surface)
Flow(gallons
per minute)
Flowdirection
38.2
54.0
70.1
0.07
.05
1.1
Up
Up
Down
80.1 1.2 Down
92.1 1.2 Down
120.2 1.2 Down
FRACTURE
Figure 8. Image from borehole television survey showing horizontal fracture at 125 feet below land surface in well 01MW09 (MG-2143), Willow Grove Naval Air Station/Joint Reserve Base, Horsham Township, Montgomery County, Pennsylvania, November 8, 2005.
Table 4. Intervals isolated during aquifer-isolation tests conducted in well 01MW09 (MG-2143), November 14-15, 2005, Willow Grove Naval Air Station/Joint Reserve Base, Horsham Township, Montgomery County, Pennsylvania.
[ft, feet; ft bls, feet below land surface; gal/min, gallons per minute; (gal/min)/ft, gallon per minute per foot of drawdown; —, no data]
IntervalDepth of isolated
fracture(ft bls)
Bottom of upper packer
(ft bls)
Top of lower packer
(ft bls)
Average pumping rate
(gal/min)
Drawdown (ft)
Specific capacity[(gal/min)/ft]
3 43 150 Not inflated — — —
2 59-62 57 68 2.1 4.80 0.44
1 125 120.5 131.5 1.3 60.07 .02
1Top of upper packer.

14 Interpretation of Borehole Geophysical Logs for Sites 1, 3, and 5 at Willow Grove Naval Air Station/Joint Reserve Base
Interval 1 (120.5-131.5 Feet Below Land Surface)
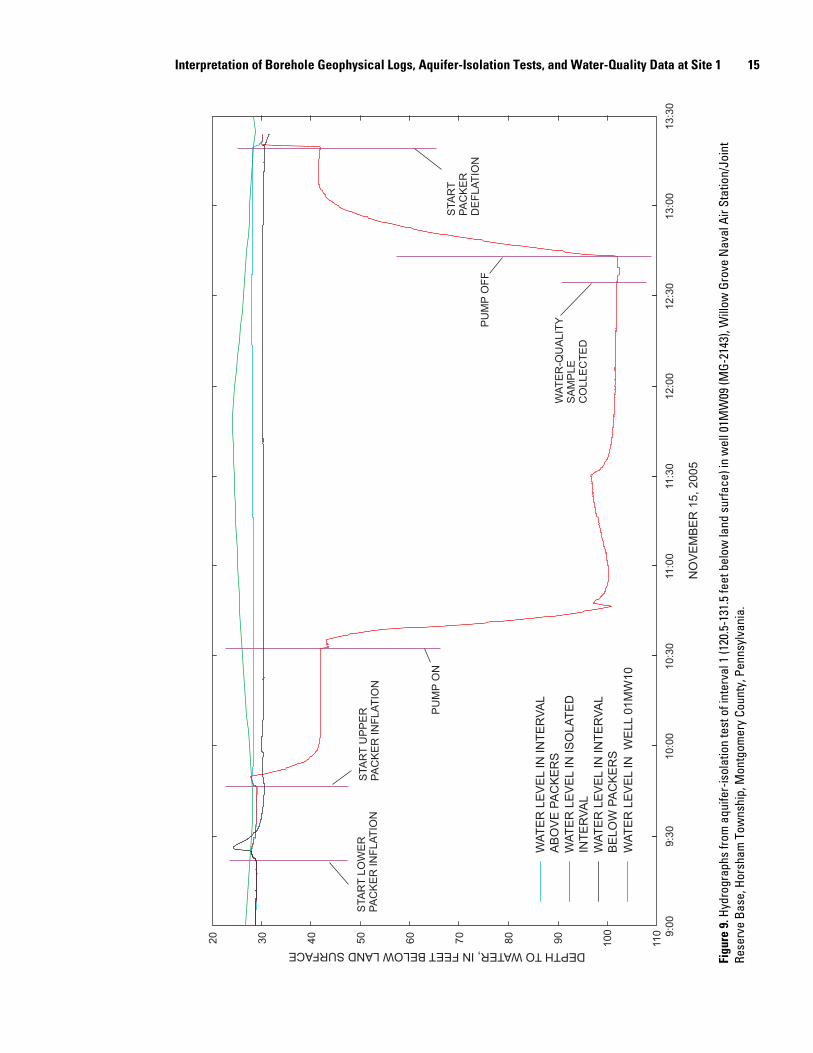
For the aquifer-isolation test of interval 1, the bottom of the upper packer and the top of the lower packer were set at 120.5 and 131.5 ft bls, respectively, to isolate the fracture zone at 125 ft bls. Before packer inflation, the depth to water in the open borehole was 28.73 ft bls. Pumping began 71 minutes after the start of packer inflation. Just prior to the start of pump-ing, the depth to water in the isolated interval decreased 13.05 ft, the depth to water in the interval below the packers decreased 1.54 ft, and the depth to water in the interval above the packers increased 0.38 ft. This is consistent with the heat-pulse-flowmeter measurements, which showed downward flow to the fracture at 125 ft bls. The average pumping rate of inter-val 1 was 1.3 gal/min. Drawdown was 60.07 ft in the isolated interval (fig. 9). The specific capacity of interval 1 was 0.02 (gal/min)/ft.
Interval 2 (57-68 Feet Below Land Surface)
For the aquifer-isolation test of interval 2, the bottom of the upper packer and the top of the lower packer were set at 57 and 68 ft bls, respectively, to isolate the fracture zone at 59-62 ft bls. The average pumping rate of interval 2 was 2.1 gal/min. Drawdown was 4.80 ft in the isolated interval. The specific capacity of interval 2 was 0.44 (gal/min)/ft. The hydro-graphs for the isolated interval and interval below the packers (fig. 10) indicate no hydraulic connection between the two intervals. The water level in the interval above the packers con-tinued to recover from pumping interval 2 and did not show a hydraulic connection between that interval and wells SW-1 and SW-2.
Interval 3 (29-50 Feet Below Land Surface)
The testing of intervals 2 and 3 was conducted with the packers set at the same depth. Interval 3 was tested before inter-val 2. For the aquifer-isolation test of interval 3, only the upper packer was inflated, isolating the interval between the top of the upper packer at 50 ft bls and the bottom of casing at 29 ft bls. The pump was placed above the upper packer. Interval 3 was quickly pumped dry. The water level in interval 3 recovered very slowly, and no water sample was collected.
Interpretation of Borehole Geophysical Logs, Aquifer-Isolation Tests, and Water-Quality Data at Site 1 15
NO
VE
MB
ER
15,
200
5
20 30 40 50 60 70 80 90 100
110 9:
009:
3010
:00
10:3
011
:00
11:3
012
:00
12:3
013
:00
13:3
0
WA
TE
R L
EV
EL
IN IN
TE
RV
AL
AB
OV
E P
AC
KE
RS
WA
TE
R L
EV
EL
IN IS
OLA
TE
D
INT
ER
VA
LW
AT
ER
LE
VE
L IN
INT
ER
VA
L B
ELO
W P
AC
KE
RS
WA
TE
R L
EV
EL
IN W
ELL
01M
W10
WA
TE
R-Q
UA
LIT
YS
AM
PLE
CO
LLE
CT
ED
PU
MP
OF
F
STA
RT
UP
PE
RP
AC
KE
R IN
FLA
TIO
NS
TAR
T L
OW
ER
P
AC
KE
R IN
FLA
TIO
N
STA
RT
PA
CK
ER
DE
FLA
TIO
N
PU
MP
ON
DEPTH TO WATER, IN FEET BELOW LAND SURFACE
Figu
re 9
. Hyd
rogr
aphs
from
aqu
ifer-
isol
atio
n te
st o
f int
erva
l 1 (1
20.5
-131
.5 fe
et b
elow
land
sur
face
) in
wel
l 01M
W09
(MG-
2143
), W
illow
Gro
ve N
aval
Air
Stat
ion/
Join
t Re
serv
e Ba
se, H
orsh
am T
owns
hip,
Mon
tgom
ery
Coun
ty, P
enns
ylva
nia.

16 Interpretation of Borehole Geophysical Logs for Sites 1, 3, and 5 at Willow Grove Naval Air Station/Joint Reserve Base
NO
VE
MB
ER
14,
200
5
20 25 30 35 40 45 14:4
515
:00
15:1
515
:30
15:4
516
:00
16:1
516
:30
16:4
517
:00
17:1
517
:30
17:4
518
:00
PU
MP
ON
PU
MP
OF
F
STA
RT
LO
WE
R
PA
CK
ER
INF
LAT
ION
STA
RT
UP
PE
RP
AC
KE
R D
EF
LAT
ION
STA
RT
LO
WE
RP
AC
KE
RD
EF
LAT
ION
DEPTH TO WATER, IN FEET BELOW LAND SURFACE
WA
TE
R-Q
UA
LIT
YS
AM
PLE
CO
LLE
CT
ED
WA
TE
R L
EV
EL
IN IN
TE
RV
AL
AB
OV
E P
AC
KE
RS
WA
TE
R L
EV
EL
IN IS
OLA
TE
D
INT
ER
VA
LW
AT
ER
LE
VE
L IN
INT
ER
VA
L B
ELO
W P
AC
KE
RS
WA
TE
R L
EV
EL
IN W
ELL
01M
W10
Figu
re 1
0. H
ydro
grap
hs fr
om a
quife
r-is
olat
ion
test
of i
nter
val 2
(57-
68 fe
et b
elow
land
sur
face
) in
wel
l 01M
W09
(MG-
2143
), W
illow
Gro
ve N
aval
Air
Stat
ion/
Join
t Res
erve
Ba
se, H
orsh
am T
owns
hip,
Mon
tgom
ery
Coun
ty, P
enns
ylva
nia.

Interpretation of Borehole Geophysical Logs, Aquifer-Isolation Tests, and Water-Quality Data at Site 1 17
Vertical Distribution of Water-Quality Constituents
During the aquifer-isolation tests of intervals 1 and 2, water samples were collected by the USGS for field determina-tions and by ECOR Solutions, Inc., for analysis for VOCs. Ana-lytical results were used to determine change in concentration with depth. VOCs detected in water samples are listed in table 5. Acetone and chloroform probably are laboratory con-
taminants. Concentrations of PCE (4.1 µg/L), trichlororethyl-ene (TCE) (1.5 µg/L), and toluene (1.1 µg/L) above the labora-tory reporting limit were detected only in the water sample from interval 1 (table 5). Interval 1 is in lithologic unit H (fig. 6), which had the greatest PCE concentration in well SW-1. Con-centrations of dissolved oxygen and pH were higher in interval 1 than interval 2 (table 6).
Table 5. Concentrations of volatile organic compounds detected in water samples collected during aquifer- isolation tests in well 01MW09 (MG-2143), November 14-15, 2005, Willow Grove Naval Air Station/Joint Reserve Base, Horsham Township, Montgomery County, Pennsylvania.
[Laboratory results were provided by ECOR Solutions, Inc.; ft bls, feet below land surface; µg/L, micrograms per liter; ND, not detected, reporting limit is 5 µg/L for acetone and 1 µg/L for other constituents listed; J, estimated result less than reporting limit]
cis-1,2- Tetrachloro- Trichloro-Depth of sample Acetone Chloroform dichloro- Toluene
Interval ethylene ethylene(ft bls) (µg/L) (µg/L) ethene (µg/L)
(µg/L) (µg/L)(µg/L)
2 57-68 6.2 2.4 ND ND ND 0.76 J
1 120.5-131.5 ND 3.4 0.71 J 4.1 1.1 1.5
Table 6. Selected water-quality constituents measured in the field in water samples collected during aquifer-isolation tests in well 01MW09 (MG-2143), November 14-15, 2005, Willow Grove Naval Air Station/Joint Reserve Base, Horsham Township, Montgomery County, Pennsylvania.
[ft bls, feet below land surface; mg/L, milligrams per liter; µS/cm at 25°C, microsiemens per centimeter at 25 degrees Celsius; C, Celsius; —, no data]
IntervalDepth of sample
(ft bls)
Dissolved oxygen(mg/L)
pH (standard
units)
Specificconductance
(µS/cm at 25°C)
Temperature (degrees C)
2 57-68 1.5 6.5 514 13.9
1 120.5-131.5 3.3 7.9 — 16.9

18 Interpretation of Borehole Geophysical Logs for Sites 1, 3, and 5 at Willow Grove Naval Air Station/Joint Reserve Base
Well 01MW10 (MG-2141)
Well 01MW10 was drilled about 695 ft southeast of well SW-1 and 990 ft northeast of well SW-2 (fig. 2). Projecting the location of well 01MW10 in the direction of dip places it about 485 ft updip of well SW-1.
Interpretation of Borehole Geophysical Logs
A suite of borehole geophysical logs (fig. 11) was col-lected in well 01MW10 by the USGS on November 4, 2005. The caliper log shows the well is 350 ft deep, cased to 39 ft bls, and major fractures are at 55-56, 71-86, 110, 215, 236, 266-272, and 310 ft bls. The fluid-temperature log shows sharp breaks in slope at about 80, 159, 181, and 312 ft bls. The fluid-resistivity log shows sharp breaks in slope at about 75, 181, and 240 ft bls. The fluid-temperature and fluid-resistivity logs together indi-cate borehole flow and possible water-producing zones at about 70-76, 159, 180, 234, and 310 ft bls. The borehole television
survey identified water flowing into the borehole from a small vertical fracture at 153 ft bls.
Heatpulse-flowmeter measurements were made under nonpumping conditions (table 7). Because the rate of flow exceeded the upper measurable limit of the tool, smaller diam-eter diverters were used to allow some of the water to bypass the tool. Flow-rate measurements made with the 6- and 4-in. divert-ers are not accurate and are intended to show direction of flow only. The water level was rising during the first three measure-ments and was declining during the rest of the measurements. All measured flow was downward, except for the measurement made at 316.2 ft bls, which was upward. Water entered the borehole through fractures at 43, 55-56, 71-86, 110, 153, and 215 ft bls. Water exited the borehole through a horizontal frac-ture at 310 ft bls. Two screens were later set in well 01MW10, one at 148-158 ft bls to isolate the fracture at 153 ft bls (fig. 12A) and one at 300-320 ft bls to isolate the fracture at 310 ft bls (fig. 12B).
Table 7. Heatpulse-flowmeter measurements made in well 01MW10 (MG-2141), Willow Grove Naval Air Station/Joint Reserve Base, Horsham Township, Montgomery County, Pennsylvania, November 4, 2005. Measurements are presented in the order in which they were made.
Depth Flow Water levelFlow(feet below land (gallons per (feet below land
directionsurface) minute) surface)
8-inch diverter
46.0 0.35 Down 25.78
63.1 1.2 Down 25.60
6-inch diverter
100.2 1.0 Down 25.00
4-inch diverter
100.1 .34 Down 26.14
170.2 .38 Down 26.37
218.2 .25 Down 26.65
246.0 .26 Down 27.04
302.1 .06 Down 27.38
316.2 .06 Up 27.90
287.9 .09 Down 28.18
275.9 .11 Down 28.58
128.0 .66 Down 28.75
100.0 .62 Down 28.67

Interpretation of Borehole Geophysical Logs, Aquifer-Isolation Tests, and Water-Quality Data at Site 1 19
CA
LIP
ER
LO
GH
OLE
DIA
ME
TE
R,
IN IN
CH
ES
NA
TU
RA
L G
AM
MA
,IN
CO
UN
TS
PE
R S
EC
ON
D
SIN
GLE
-PO
INT
RE
SIS
TAN
CE
,IN
OH
MS
FLU
ID T
EM
PE
RA
TU
RE
,IN
DE
GR
EE
S C
ELS
IUS
FLU
ID R
ES
IST
IVIT
Y,IN
OH
M-M
ET
ER
S
DEPTH, IN FEET BELOW LAND SURFACE
0 20 40 60 80 100
120
140
160
180
200
220
240
260
280
300
320
340
360
89
1011
120
100
200
300
100
350
600
1213
148
1012
14
CA
SIN
G
Figu
re 1
1. B
oreh
ole
geop
hysi
cal l
ogs
for w
ell 0
1MW
10 (M
G-21
41),
Will
ow G
rove
Nav
al A
ir St
atio
n/Jo
int R
eser
ve B
ase,
Hor
sham
Tow
nshi
p, M
ontg
omer
y Co
unty
, Pe
nnsy
lvan
ia, N
ovem
ber 4
, 200
5.

20 Interpretation of Borehole Geophysical Logs for Sites 1, 3, and 5 at Willow Grove Naval Air Station/Joint Reserve Base
Interpretation of Aquifer-Isolation Tests
On the basis of the borehole geophysical logs, heatpulse-flowmeter measurements, and the borehole television survey, eight intervals were selected for aquifer-isolation tests in well 01MW10 (table 8). A straddle-packer assembly was used to isolate discrete fractures to determine depth-discrete specific-capacity values and to obtain depth-discrete water samples. For the test of intervals 1 to 6, the distance between the bottom of the upper packer and the top of the lower packer was 11 ft, and both packers were inflated. For the test of interval 7, the dis-tance between the bottom of the upper packer and the top of the lower packer was 23.2 ft, and both packers were inflated. For the test of interval 8, only the upper packer was inflated.
Interval 1 (305-316 Feet Below Land Surface)
For the aquifer-isolation test of interval 1, the bottom of the upper packer and the top of the lower packer were set at 305 and 316 ft bls, respectively, to isolate the fracture zone at 310 ft bls. Before packer inflation, the depth to water in the open borehole was 24.80 ft bls. After packer inflation, the depth to water in the isolated interval decreased 5.07 ft, the water level in the interval above the packers decreased 1.57 ft, and the water level in the interval below the packers decreased 1.79 ft. The water level in the isolated interval decreased 0.60 ft after the lower packer was inflated and decreased an additional 4.48 ft after the upper packer was inflated. This is consistent with the borehole geophysical logs, which indicated downward flow to the fracture at 310 ft bls. The water levels were still declining at the start of pumping of interval 1. Some of the decline was the response to the pumping of wells SW-1 and SW-2. The average pumping rate of interval 1 was 3.2 gal/min. Drawdown was 14.30 ft in the isolated interval, 4.23 ft in the interval below the packers, and 3.64 ft in the inter-val above the packers. The specific capacity of interval 1 was 0.22 (gal/min)/ft. The hydrographs for the interval above the packers, the isolated interval, and the interval below the packers (fig. 13) indicate a strong hydraulic connection between these intervals in well 01MW10 and between these intervals and wells SW-1 and SW-2.
A
B
FRACTURE
Figure 12. Images from borehole television survey showing (A) high-angle fracture at 153 feet below land surface and (B) horizontal fracture at 310 feet below land surface in well 01MW10 (MG-2141), Willow Grove Naval Air Station/Joint Reserve Base, Horsham Township, Montgomery County, Pennsylvania, November 9, 2005.

Interpretation of Borehole Geophysical Logs, Aquifer-Isolation Tests, and Water-Quality Data at Site 1 21
NO
VE
MB
ER
21,
200
5
28.6
29.0
29.4
29.8 11
:15
11:3
011
:45
12:0
012
:15
12:3
012
:45
13:0
013
:15
13:3
013
:45
14:0
014
:15
14:3
0
20 25 30 35 40 45 50
PU
MP
ON
PU
MP
OF
F
STA
RT
UP
PE
RP
AC
KE
R IN
FLA
TIO
N
STA
RT
LO
WE
R
PA
CK
ER
INF
LAT
ION
STA
RT
UP
PE
RP
AC
KE
R D
EF
LAT
ION
STA
RT
LO
WE
RP
AC
KE
RD
EF
LAT
ION
WA
TE
R L
EV
EL
IN IN
TE
RV
AL
AB
OV
E P
AC
KE
RS
WA
TE
R L
EV
EL
IN IS
OLA
TE
D IN
TE
RV
AL
WA
TE
R L
EV
EL
IN IN
TE
RV
AL
BE
LOW
PA
CK
ER
S
WA
TE
R L
EV
EL
IN W
ELL
01M
W09
DEPTH TO WATER, IN FEET BELOW LAND SURFACE
WA
TE
R-Q
UA
LIT
YS
AM
PLE
CO
LLE
CT
ED
Figu
re 1
3. H
ydro
grap
hs fr
om a
quife
r-is
olat
ion
test
of i
nter
val 1
(305
-316
feet
bel
ow la
nd s
urfa
ce) i
n w
ell 0
1MW
10 (M
G-21
41),
Will
ow G
rove
Nav
al A
ir St
atio
n/Jo
int R
eser
ve B
ase,
Hor
sham
Tow
nshi
p, M
ontg
omer
y Co
unty
, Pen
nsyl
vani
a.

22 Interpretation of Borehole Geophysical Logs for Sites 1, 3, and 5 at Willow Grove Naval Air Station/Joint Reserve Base
Interval 2 (263-274 Feet Below Land Surface)
For the aquifer-isolation test of interval 2, the bottom of the upper packer and the top of the lower packer were set at 263 and 274 ft bls, respectively, to isolate the fracture zone at 266-272 ft bls. Before packer inflation, the water level in the borehole was declining (fig. 14). After inflation of the lower packer, the water level in the interval below the packers decreased 4.77 ft. After inflation of the upper packer, the water level in the isolated interval decreased 5.89 ft. This is consistent with the heatpulse-flowmeter measurements, which showed downward flow. Pumping of interval 2 began at an initial rate of 2.9 gal/min. After 2 minutes, the pumping rate was increased to 4 gal/min. The average pumping rate of interval 2 was 3.9 gal/min. The maximum drawdown in the isolated interval before the water level started to rise in response to the pumping of wells SW-1 and SW-2 was 10.35 ft. The estimated specific capacity of interval 2 using this maximum drawdown and the average pumping rate was 0.38 (gal/min)/ft. The hydrographs for the interval above the packers, the isolated interval, and the interval below the packers (fig. 14) indicate a strong hydraulic connection between these intervals in well 01MW10 and wells SW-1 and SW-2 and a weak hydraulic connection between the interval below the packers and the isolated interval.
Interval 3 (230-241 Feet Below Land Surface)
For the aquifer-isolation test of interval 3, the bottom of the upper packer and the top of the lower packer were set at 230 and 241 ft bls, respectively, to isolate the fracture at 233 ft bls. The isolated interval was rapidly dewatered. It was allowed to recover and then pumped again to obtain a water sample.
Interval 4 (207-218 Feet Below Land Surface)
For the aquifer-isolation test of interval 4, the bottom of the upper packer and the top of the lower packer were set at 207
and 218 ft bls, respectively, to isolate the fracture at 215 ft bls. Before packer inflation, the water level in the borehole was declining in response to pumping of wells SW-1 and SW-2. About the time the upper packer was inflated, the water level in the borehole began to rise in response to cessation of pumping of wells SW-1 and SW-2. After packer inflation, the depth to water in the isolated interval decreased 4.53 ft, the depth to water in the interval below the packers decreased 6.14 ft, and the depth to water in the interval above the packers increased 0.72 ft. This is consistent with the heatpulse-flowmeter mea-surements, which showed downward flow. Pumping of interval 4 began at an initial rate of 2.4 gal/min. After 1 minute, the pumping rate was increased to 3.4 gal/min. The average pumping rate of interval 4 was 3.2 gal/min. Water levels in all three intervals rose during the test in response to cessation of pumping of wells SW-1 and SW-2 (fig. 15). The estimated spe-cific capacity of interval 4 using the maximum drawdown of 12.89 ft and the average pumping rate was 0.25 (gal/min)/ft. The hydrographs for the interval above the packers, the isolated interval, and the interval below the packers (fig. 15) indicate a strong hydraulic connection between these intervals in well 01MW10 and wells SW-1 and SW-2.
Interval 5 (148.7-159.7 Feet Below Land Surface)
For the aquifer-isolation test of interval 5, the bottom of the upper packer and the top of the lower packer were set at 148.7 and 159.7 ft bls, respectively, to isolate the fracture at 153 ft bls. After packer inflation, the depth to water in the iso-lated interval increased 7.6 ft, the depth to water in the interval below the packers decreased 4.26 ft, and the depth to water in the interval above the packers increased 2.58 ft. The water level was still rising in the isolated interval at the start of pumping of interval 5. This is consistent with the borehole television survey that showed water flowing into the borehole from this fracture. The average pumping rate of interval 5 was 1.2 gal/min. Water
Table 8. Intervals isolated during aquifer-isolation tests conducted in well 01MW10 (MG-2141), November 15-21, 2005, Willow Grove Naval Air Station/Joint Reserve Base, Horsham Township, Montgomery County, Pennsylvania.
[ft, feet; ft bls, feet below land surface; gal/min, gallons per minute; (gal/min)/ft, gallons per minute per foot of drawdown; —, no data]
IntervalDepth of isolated
fracture(ft bls)
Bottom of upper packer
(ft bls)
Top of lower packer
(ft bls)
Average pumping rate
(gal/min)
Drawdown (ft)
Specific capacity
[(gal/min)/ft]
8 43-56 162.7 Not inflated 2.7 10.78 0.25
7 72-86 69.6 92.8 3.5 1.16 3.0
6 108-114 106 117 2.5 10.47 .24
5 153 148.7 159.7 1.2 23.54 .05
4 215 207 218 3.2 12.89 .25
3 233 230 241 — — —
2 266-272 263 274 3.9 10.35 .38
1 310 305 316 3.2 14.30 .22
1Top of upper packer.

Interpretation of Borehole Geophysical Logs, Aquifer-Isolation Tests, and Water-Quality Data at Site 1 23
WA
TE
R L
EV
EL
IN IN
TE
RV
AL
AB
OV
E P
AC
KE
RS
WA
TE
R L
EV
EL
IN IS
OLA
TE
D
INT
ER
VA
LW
AT
ER
LE
VE
L IN
INT
ER
VA
L B
ELO
W P
AC
KE
RS
WA
TE
R L
EV
EL
IN W
ELL
01
MW
09
29.0
29.1
29.2
29.3
29.4
29.5 24 26 28 30 32 34 36 38 40 42 44 46
7:30
7:45
8:00
8:15
8:30
8:45
9:00
9:15
9:30
9:45
10:0
010
:15
10:3
0
DEPTH TO WATER, IN FEET BELOW LAND SURFACE
NO
VE
MB
ER
21,
200
5
STA
RT
LO
WE
RP
AC
KE
R D
EF
LAT
ION
PU
MP
ON
PU
MP
OF
F
STA
RT
UP
PE
RP
AC
KE
R IN
FLA
TIO
N
STA
RT
LO
WE
R
PA
CK
ER
IN
FLA
TIO
NS
TAR
T U
PP
ER
PA
CK
ER
DE
FLA
TIO
NW
AT
ER
-QU
ALI
TY
SA
MP
LEC
OLL
EC
TE
D
Figu
re 1
4. H
ydro
grap
hs fr
om a
quife
r-is
olat
ion
test
of i
nter
val 2
(263
-274
feet
bel
ow la
nd s
urfa
ce) i
n w
ell 0
1MW
10 (M
G-21
41),
Will
ow G
rove
Nav
al A
ir St
atio
n/Jo
int R
eser
ve
Base
, Hor
sham
Tow
nshi
p, M
ontg
omer
y Co
unty
, Pen
nsyl
vani
a.

24 Interpretation of Borehole Geophysical Logs for Sites 1, 3, and 5 at Willow Grove Naval Air Station/Joint Reserve Base
WA
TE
R L
EV
EL
IN IN
TE
RV
AL
AB
OV
E P
AC
KE
RS
WA
TE
R L
EV
EL
IN IS
OLA
TE
D
INT
ER
VA
LW
AT
ER
LE
VE
L IN
INT
ER
VA
L B
ELO
W P
AC
KE
RS
WA
TE
R L
EV
EL
IN W
ELL
01
MW
09
25 30 35 40 45 50
NO
VE
MB
ER
18,
200
5
8:45
9:00
9:15
9:30
9:45
10:0
010
:15
10:3
010
:45
11:0
011
:15
29.0
29.2
29.4
29.6
SE
DIM
EN
TF
ILT
ER
CLO
GG
ED
STA
RT
LO
WE
RP
AC
KE
R D
EF
LAT
ION
PU
MP
ON
PU
MP
OF
F
STA
RT
UP
PE
RP
AC
KE
R
INF
LAT
ION
STA
RT
LO
WE
R
PA
CK
ER
INF
LAT
ION
STA
RT
UP
PE
RP
AC
KE
R D
EF
LAT
ION
DEPTH TO WATER, IN FEET BELOW LAND SURFACE
WA
TE
R-Q
UA
LIT
YS
AM
PLE
CO
LLE
CT
ED
Figu
re 1
5. H
ydro
grap
hs fr
om a
quife
r-is
olat
ion
test
of i
nter
val 4
(207
-218
feet
bel
ow la
nd s
urfa
ce) i
n w
ell 0
1MW
10 (M
G-2
141)
, Will
ow G
rove
Nav
al A
ir St
atio
n/Jo
int R
eser
ve
Base
, Hor
sham
Tow
nshi
p, M
ontg
omer
y Co
unty
, Pen
nsyl
vani
a.

Interpretation of Borehole Geophysical Logs, Aquifer-Isolation Tests, and Water-Quality Data at Site 1 25
levels rose during the test in response to cessation of pumping of wells SW-1 and SW-2 until 15:54 when water levels started to decline in response to pumping of wells SW-1 and SW-2 (fig. 16). Drawdown was 23.54 ft in the isolated interval. The estimated specific capacity was 0.05 (gal/min)/ft. The hydro-graphs for the interval above the packers, the isolated interval, and the interval below the packers (fig. 16) indicate a strong hydraulic connection between these intervals in well 01MW10 and wells SW-1 and SW-2.
Interval 6 (106-117 Feet Below Land Surface)
For the aquifer-isolation test of interval 6, the bottom of the upper packer and the top of the lower packer were set at 106 and 117 ft bls, respectively, to isolate the fracture zone at 108-114 ft bls. Water levels rose during the test in response to ces-sation of pumping of wells SW-1 and SW-2 until about 12:01 when the water levels started to decline in response to pumping of wells SW-1 and SW-2 (fig. 17). When the lower packer was inflated, the water level in the interval below the lower packer decreased 2.55 ft, and the water level above the lower packer increased. This is consistent with the heatpulse-flowmeter mea-surements, which showed downward flow. Pumping of interval 6 began at an initial rate of 1.5 gal/min. After 1 minute, the pumping rate was increased to 2.5 gal/min. The average pumping rate of interval 6 was 2.5 gal/min. Drawdown was 10.47 ft in the isolated interval. The estimated specific capacity was 0.24 (gal/min)/ft. The hydrographs for the interval above the packers, the isolated interval, and the interval below the packers (fig. 17) indicate a strong hydraulic connection between these intervals in well 01MW10 and wells SW-1 and SW-2 and a very slight hydraulic connection between the iso-lated interval and the interval above the packers.
Interval 7 (69.6-92.8 Feet Below Land Surface)
For the aquifer-isolation test of interval 7, the bottom of the upper packer and the top of the lower packer were set at 69.6 and 92.8 ft bls, respectively, to isolate the fracture zone at 72-86 ft bls. Water levels rose prior to the test and during the test in response to cessation of pumping of wells SW-1 and SW-2 until about 16:06 when the water levels started to decline in response to pumping of wells SW-1 and SW-2. When the lower packer was inflated, the water level in the interval below the lower packer decreased 1.84 ft, and the water level above the lower packer increased (fig. 18). When the upper packer was inflated, the water level above the upper packer rapidly rose until pumping of interval 7 began. Pumping of interval 7 began at an initial rate of 2.7 gal/min. After 2 minutes, the pumping rate was increased to 3.8 gal/min. The average pumping rate of interval 7 was 3.5 gal/min. The estimated specific capacity of interval 7 using the maximum drawdown of 1.16 ft and the average pumping rate was 3.0 (gal/min)/ft. Water levels in all intervals rose in response to cessation of pumping of wells SW-1 and SW-2 throughout most of the test, indicating a strong hydraulic connection to wells SW-1 and SW-2. The water level in the interval above the packers showed a response when the
pump in the isolated zone was turned off, indicating a slight hydraulic connection between the isolated interval and the interval above the packers. The water level in the interval below the lower packer began to decline in response to the start of pumping of wells SW-1 and SW-2 and did not respond to the cessation of pumping in the isolated zone, indicating no hydrau-lic connection between the interval below the packers and the isolated interval.
Interval 8 (38-62.7 Feet Below Land Surface)
For the aquifer-isolation test of interval 8, only the upper packer was inflated. The top of the upper packer was set at 62.7 ft bls to isolate the interval between the bottom of the cas-ing (38 ft bls) and 62.7 ft bls, which includes the fracture zone at 43-56 ft bls. Prior to packer inflation, the water level in the borehole was rising in response to cessation of pumping of wells SW-1 and SW-2 (fig. 19). When the packer was inflated, the water level in the isolated interval (the interval above the packer) increased 3.24 ft. The water level in the interval below the packer continued to rise throughout the test until about 11:49 when the water level began to decline in response to the pumping of wells SW-1 and SW-2. Pumping of interval 8 began at an initial rate of 2.1 gal/min. After 4 minutes, the pumping rate was increased to 2.8 gal/min. The average pumping rate of interval 8 was 2.7 gal/min. Drawdown was 10.78 ft in the iso-lated interval (fig. 19). The specific capacity of interval 8 was 0.25 (gal/min)/ft. The water level in the interval below the packer showed no response to pumping the isolated interval and showed a very strong hydraulic connection with wells SW-1 and SW-2.
Vertical Distribution of Water-Quality Constituents
During each aquifer-isolation test, water samples were col-lected by the USGS for field determinations of water-quality constituents and by ECOR Solutions, Inc., for analysis for VOCs. VOCs detected in water samples collected during aqui-fer-isolation tests are listed in table 9. Acetone and chloroform probably are laboratory contaminants. The concentration of tol-uene was less than 1 µg/L for all samples. The highest concen-trations of PCE (62 µg/L), TCE (4.5 µg/L), and cis-1,2-dichlo-roethene (3.4 µg/L) were in water samples collected from interval 5. Interval 5 is in lithologic unit G (fig. 6). The PCE concentration of a sample from lithologic unit G in well SW-1 was 34 µg/L (fig. 6). Concentrations of VOCs from intervals 1 and 2 were similar. The second greatest concentrations of PCE were from intervals 1 and 2 (both 30 µg/L). Intervals 1 and 2 are in lithologic units K and L, respectively (fig. 6). The PCE con-centration of a sample from lithologic unit M in well SW-1 was 21 µg/L (fig. 6). No VOCs were detected in the shallowest interval (interval 8). The water sample from interval 5 had the lowest temperature (13.0 °C) and concentration of dissolved oxygen (1.9 mg/L) and the highest concentration of VOCs, pH (7.2), and specific conductance (855 µS/cm) of the intervals sampled (table 10).

26 Interpretation of Borehole Geophysical Logs for Sites 1, 3, and 5 at Willow Grove Naval Air Station/Joint Reserve Base
WA
TE
R L
EV
EL
IN IN
TE
RV
AL
AB
OV
E P
AC
KE
RS
WA
TE
R L
EV
EL
IN IS
OLA
TE
D IN
TE
RV
AL
WA
TE
R L
EV
EL
IN IN
TE
RV
AL
BE
LOW
PA
CK
ER
S
WA
TE
R L
EV
EL
IN W
ELL
01M
W09
14:0
014
:15
14:3
014
:45
15:0
015
:15
15:3
015
:45
16:0
016
:15
16:3
016
:45
17:0
017
:15
17:3
0
NO
VE
MB
ER
17,
200
5
PU
MP
ON
PU
MP
OF
F
STA
RT
UP
PE
RP
AC
KE
R IN
FLA
TIO
N
STA
RT
LO
WE
R
PA
CK
ER
INF
LAT
ION
STA
RT
UP
PE
RP
AC
KE
R D
EF
LAT
ION
STA
RT
LO
WE
RP
AC
KE
RD
EF
LAT
ION
WA
TE
R-Q
UA
LIT
YS
AM
PLE
CO
LLE
CT
ED
20 25 30 35 40 45 50 55
DEPTH TO WATER, IN FEET BELOW LAND SURFACE29.0
29.2
29.4
29.6
29.8
30.0
Figu
re 1
6. H
ydro
grap
hs fr
om a
quife
r-is
olat
ion
test
of i
nter
val 5
(148
.7-1
59.7
feet
bel
ow la
nd s
urfa
ce) i
n w
ell 0
1MW
10 (M
G-21
41),
Will
ow G
rove
Nav
al A
ir St
atio
n/Jo
int
Rese
rve
Base
, Hor
sham
Tow
nshi
p, M
ontg
omer
y Co
unty
, Pen
nsyl
vani
a.

Interpretation of Borehole Geophysical Logs, Aquifer-Isolation Tests, and Water-Quality Data at Site 1 27
24 26 28 30 32 34 36 38 40 10:3
010
:45
11:0
011
:15
11:3
011
:45
12:0
012
:15
12:3
012
:45
13:0
013
:15
13:3
0
28.8
29.0
29.2
29.4
MIS
SIN
G D
ATA
WH
ER
E L
INE
SA
RE
DA
SH
ED
PU
MP
ON
PU
MP
OF
F
STA
RT
UP
PE
RP
AC
KE
R
INF
LAT
ION
STA
RT
LO
WE
R
PA
CK
ER
INF
LAT
ION
STA
RT
UP
PE
RP
AC
KE
R D
EF
LAT
ION
STA
RT
LO
WE
RP
AC
KE
RD
EF
LAT
ION
DEPTH TO WATER, IN FEET BELOW LAND SURFACE
NO
VE
MB
ER
17,
200
5
WA
TE
R L
EV
EL
IN IN
TE
RV
AL
AB
OV
E P
AC
KE
RS
WA
TE
R L
EV
EL
IN IS
OLA
TE
D IN
TE
RV
AL
WA
TE
R L
EV
EL
IN IN
TE
RV
AL
BE
LOW
PA
CK
ER
S
WA
TE
R L
EV
EL
IN W
ELL
01M
W09
WA
TE
R-Q
UA
LIT
YS
AM
PLE
CO
LLE
CT
ED
Figu
re 1
7. H
ydro
grap
hs fr
om a
quife
r-is
olat
ion
test
of i
nter
val 6
(106
-117
feet
bel
ow la
nd s
urfa
ce) i
n w
ell 0
1MW
10 (M
G-21
41),
Will
ow G
rove
Nav
al A
ir St
atio
n/Jo
int R
eser
ve B
ase,
Hor
sham
Tow
nshi
p, M
ontg
omer
y Co
unty
, Pen
nsyl
vani
a.

28 Interpretation of Borehole Geophysical Logs for Sites 1, 3, and 5 at Willow Grove Naval Air Station/Joint Reserve Base
NO
VE
MB
ER
16,
200
5
23 24 25 26 27 28 29 30 14:1
514
:30
14:4
515
:00
15:1
515
:30
15:4
516
:00
16:1
516
:30
16:4
517
:00
PU
MP
ON
PU
MP
OFF
STA
RT
UP
PE
R P
AC
KE
R IN
FLAT
ION
STA
RT
LOW
ER
PA
CK
ER
INFL
ATIO
NS
TAR
T U
PP
ER
PAC
KE
R D
EFL
ATIO
N
STA
RT
LOW
ER
PAC
KE
R D
EFL
ATIO
N
DEPTH TO WATER, IN FEET BELOW LAND SURFACE
WAT
ER
LE
VE
L IN
INTE
RVA
L A
BO
VE
PA
CK
ER
SW
ATE
R L
EV
EL
IN IS
OLA
TED
INTE
RVA
L
WAT
ER
LE
VE
L IN
INTE
RVA
L B
ELO
W P
AC
KE
RS
WAT
ER
LE
VE
L IN
WE
LL 0
1MW
09
WAT
ER
-QU
ALI
TYS
AM
PLE
CO
LLE
CTE
D
Figu
re 1
8. H
ydro
grap
hs fr
om a
quife
r-is
olat
ion
test
of i
nter
val 7
(69.
6-92
.9 fe
et b
elow
land
sur
face
) in
wel
l 01M
W10
(MG-
2141
), W
illow
Gro
ve N
aval
Air
Stat
ion/
Join
t Res
erve
Bas
e, H
orsh
am T
owns
hip,
Mon
tgom
ery
Coun
ty, P
enns
ylva
nia.

Interpretation of Borehole Geophysical Logs, Aquifer-Isolation Tests, and Water-Quality Data at Site 1 29
28.6
28.8
29.0
29.2
29.4
29.6
29.8 24 25 26 27 28 29 30 31 32 33 34 35 36 37 38 10
:00
10:1
510
:30
10:4
511
:00
11:1
511
:30
11:4
512
:00
12:1
512
:30
12:4
513
:00
13:1
513
:30
13:4
514
:00
NO
VE
MB
ER
16,
200
5
PU
MP
ON
PU
MP
OF
F
STA
RT
UP
PE
RP
AC
KE
R IN
FLA
TIO
NS
TAR
T L
OW
ER
PA
CK
ER
DE
FLA
TIO
N
WA
TE
R L
EV
EL
IN IN
TE
RV
AL
BE
LOW
PA
CK
ER
S
WA
TE
R L
EV
EL
IN IS
OLA
TE
D IN
TE
RV
AL
WA
TE
R L
EV
EL
IN W
ELL
01M
W09
WA
TE
R-Q
UA
LIT
YS
AM
PLE
CO
LLE
CT
ED
DEPTH TO WATER, IN FEET BELOW LAND SURFACE
Figu
re 1
9. H
ydro
grap
hs fr
om a
quife
r-is
olat
ion
test
of i
nter
val 8
(38-
62.7
feet
bel
ow la
nd s
urfa
ce) i
n w
ell 0
1MW
10 (M
G-21
41),
Will
ow G
rove
Nav
al A
ir St
atio
n/Jo
int R
eser
ve
Base
, Hor
sham
Tow
nshi
p, M
ontg
omer
y Co
unty
, Pen
nsyl
vani
a.

30 Interpretation of Borehole Geophysical Logs for Sites 1, 3, and 5 at Willow Grove Naval Air Station/Joint Reserve Base
Table 9. Concentrations of volatile organic compounds detected in water samples collected during aquifer-isolation tests in well 01MW10 (MG-2141), November 15-21, 2005, Willow Grove Naval Air Station/Joint Reserve Base, Horsham Township, Montgomery County, Pennsylvania.
[Laboratory results were provided by ECOR Solutions, Inc.; ft bls, feet below land surface; µg/L, micrograms per liter; ND, not detected, reporting limit is 5 µg/L for acetone and 1 µg/L for other constituents listed; B, constituent detected in blank; J, estimated result less than reporting limit]
cis-1,2-Tetrachloro- Trichloro-
Depth of sample Acetone Chloroform dichloro- Toluene Interval ethylene ethylene
(ft bls) (µg/L) (µg/L) ethene (µg/L) (µg/L) (µg/L)(µg/L)
8 38-62.7 ND ND ND ND 0.98 BJ ND
7 69.6-92.8 3.3 J ND ND 9.8 .66 BJ 0.94 J
6 106-117 9.0 ND 0.77 J 23 .67 BJ 2.3
5 148.7-159.7 ND 7.1 3.4 62 ND 4.5
4 207-218 2.9 J .96 J 1.7 24 .43 J 2.8
3 230-241 2.8 J 1.1 2.0 27 .46 J 3.6
2 263-274 2.7 J 1.1 2.1 30 ND 3.3
1 305-316 3.1 J 1.0 2.0 30 ND 3.0
Table 10. Selected water-quality constituents measured in the field in water samples collected during aquifer-isolation tests in well 01MW10 (MG-2141), November 15-21, 2005, Willow Grove Naval Air Station/Joint Reserve Base, Horsham Township, Montgomery County, Pennsylvania.
[ft bls, feet below land surface; mg/L, milligrams per liter; µS/cm at 25°C, microsiemens per centimeter at 25 degrees Celsius; C, Celsius]
Dissolved pH SpecificDepth of sample Temperature Interval oxygen (standard conductance
(ft bls) (degrees C)(mg/L) units) (µS/cm at 25°C)
8 38-62.7 6.2 6.1 673 14.7
7 69.6-92.8 6.8 6.5 629 14.4
6 106-117 5.7 7.1 598 13.6
5 148.7-159.7 1.9 7.2 855 13.0
4 207-218 5.1 6.8 690 13.6
3 230-241 4.8 7.1 761 14.1
2 263-274 5.2 7.1 767 13.7
1 305-316 5.1 7.1 776 13.8

Interpretation of Borehole Geophysical Logs, Aquifer-Isolation Tests, and Water-Quality Data at Site 3 31
Interpretation of Borehole Geophysical Logs, Aquifer-Isolation Tests, and Water-Quality Data at Site 3
Well 03MW08 (MG-2142)
Well 03MW08 is downgradient of Site 5 and upgradient of Site 3 (fig. 3). It is considered to be part of Site 3.
Interpretation of Borehole Geophysical Logs
A suite of borehole geophysical logs (fig. 20) was col-lected in well 03MW08 by the USGS on November 3, 2005. The caliper log shows the well is 222 ft deep, cased to 38 ft bls, and major fractures are at 49, 79, 121, 124, 138, 159, 169, and 191-193 ft bls. The fluid-temperature log shows a sharp break at about 170 ft bls. The fluid-resistivity log shows sharp breaks at about 80, 128, 143, and 190 ft bls.
Heatpulse-flowmeter measurements were made under nonpumping and pumping conditions (table 11). The geophysi-cal logs and heatpulse-flowmeter measurements indicate water entered the borehole at a rate of 0.3 gal/min through the fracture zone above 70 ft bls and flowed downward. Additional water (0.3 gal/min) entered the borehole through a horizontal fracture at 80 ft bls and flowed downward. Water flowing downward exited the borehole through horizontal fractures at 121-124, 138, and below 164 ft bls (fig. 21). Well 03MW08 was screened later from 38-68 ft bls to monitor the water-producing fracture zone above 68 ft bls (fig. 21B) and from 163 to 173 ft bls to monitor the fracture at 169 ft bls (fig. 21A).
Table 11. Heatpulse-flowmeter measurements made in well 03MW08 (MG-2142), Willow Grove Naval Air Station/Joint Reserve Base, Horsham Township, Montgomery County, Pennsylvania, No-vember 3, 2005. Measurements are presented in the order in which they were made.
[—, no flow]
Depth(feet below land
surface)
Flow(gallon
per minute)
Flowdirection
55.2
65.1
71.2
100.1
116.6
130.1
150.2
157.2
164.4
207.1
42.1
42.3
55.2
42.3
Nonpumping conditions
0.19
.23
.29
.59
.60
.53
.35
.34
.36
0
.34
.26
.26
.26
Down
Down
Down
Down
Down
Down
Down
Down
Down
—
Down
Down
Down
Down
54.9
65.1
71.0
Pumping conditions
.33
.31
.34
Up
Up
Up

32 Interpretation of Borehole Geophysical Logs for Sites 1, 3, and 5 at Willow Grove Naval Air Station/Joint Reserve Base
0
20 40 60 80 100
120
140
160
180
200
220
240
89
100
100
200
300
300
600
900
1,20
013
1415
1416
1820
DEPTH, IN FEET BELOW LAND SURFACE
CA
SIN
G
CA
LIP
ER
LO
G H
OLE
DIA
ME
TE
R, I
N IN
CH
ES
NA
TU
RA
L G
AM
MA
, IN
CO
UN
TS
PE
R S
EC
ON
D
SIN
GLE
-PO
INT
RE
SIS
TAN
CE
,IN
OH
MS
FLU
ID T
EM
PE
RA
TU
RE
,IN
DE
GR
EE
S C
ELS
IUS
FLU
ID R
ES
IST
IVIT
Y,IN
OH
M-M
ET
ER
S
Figu
re 2
0. B
oreh
ole
geop
hysi
cal l
ogs
for w
ell 0
3MW
08 (M
G-21
42),
Will
ow G
rove
Nav
al A
ir St
atio
n/Jo
int R
eser
ve B
ase,
Hor
sham
Tow
nshi
p, M
ontg
omer
y Co
unty
, Pe
nnsy
lvan
ia, N
ovem
ber 3
, 200
5.

Interpretation of Borehole Geophysical Logs, Aquifer-Isolation Tests, and Water-Quality Data at Site 3 33
Interpretation of Aquifer-Isolation Tests
On the basis of the borehole geophysical logs, heatpulse-flowmeter measurements, and the borehole television survey, six intervals were selected for aquifer-isolation tests in well 03MW08 (table 12). A straddle-packer assembly was used to isolate discrete fractures to determine depth-discrete specific-
capacity values and to obtain depth-discrete water samples. For the tests of intervals 2-5, the distance between the bottom of the upper packer and the top of the lower packer was 11 ft, and both packers were inflated. For the tests of intervals 1 and 6, only the upper packer was inflated. During the tests, the water level was measured in well 05MW13I, which is screened from 127 to 142 ft bls.
FRACTURE
A
FRACTURE
B
Figure 21. Images from borehole television survey showing (A) horizontal fracture at 169 feet below land surface and (B) vertical fracture at 64 feet below land surface in well 03MW08I (MG-2142), Willow Grove Naval Air Station/Joint Reserve Base, Horsham Township, Montgomery County, Pennsylvania, November 8, 2005.
Table 12. Intervals isolated during aquifer-isolation tests conducted in well 03MW08 (MG-2142), November 22-28, Willow Grove Naval Air Station/Joint Reserve Base, Horsham Township, Montgomery County, Pennsylvania.
2005,
[ft, feet; ft bls, feet below land surface; gal/min, gallons per minute; (gal/min)/ft, gallons per minute per foot of drawdown]
IntervalDepth of isolated
fracture(ft bls)
Bottom of upper packer(ft bls)
Top of lower packer
(ft bls)
Average pumping rate
(gal/min)
Drawdown (ft)
Specific capacity
[(gal/min)/ft]
6 Above 68.5 168.5 Not inflated 1.0 23.12 0.04
5 80 75.5 86.5 1.6 17.12 .09
4 124-125 124.5 135.5 2.4 6.36 .38
3 138 136.5 145.5 2.9 3.62 .80
2 169 162 173 4.0 2.60 1.5
1 Below 178.2 2178.2 Not inflated 5.3 28.95 .18
1Top of upper packer. 2Bottom of upper packer.

34 Interpretation of Borehole Geophysical Logs, Sites 1, 3, and 5, Willow Grove Naval Air Station/Joint Reserve Base
Interval 1 (178.2-222 Feet Below Land Surface)
For the aquifer-isolation test of interval 1, the bottom of the upper packer was set at 178.2 ft bls to isolate the lower sec-tion of the borehole. The packer was inflated on November 28 and left inflated overnight. On November 29, the depth to water above and below the packer was 26.60 ft bls, indicating no dif-ference in hydraulic head between the two intervals. This is consistent with the heatpulse-flowmeter measurements, which showed no flow in this section of the borehole. The average pumping rate was 5.3 gal/min. Drawdown was 28.95 ft in the isolated interval and 0.64 ft in the interval above the packer. The specific capacity of interval 1 was 0.18 (gal/min)/ft. The hydrographs for the interval above the packer and the isolated interval (fig. 22) indicate a weak hydraulic connection between the intervals. The water level in well 05MW13I declined 0.31 ft in response to pumping interval 1, indicating a hydraulic con-nection between interval 1 and well 05MW13I.
Interval 2 (162-173 Feet Below Land Surface)
For the aquifer-isolation test of interval 2, the bottom of the upper packer and the top of the lower packer were set at 162 and 173 ft bls, respectively, to isolate the fracture zone at 169 ft bls. Before packer inflation, the depth to water in the open borehole was 26.64 ft bls. After packer inflation, the depth to water in the isolated interval was 26.64 ft bls (no change), the depth to water in the interval below the packers increased 0.07 ft, and the depth to water in the interval above the packers increased 0.05 ft. This is consistent with the heatpulse-flowme-ter measurements, which showed downward flow to the fracture at 169 ft bls. Pumping began at an initial rate of 3.0 gal/min. After 2 minutes, the pumping rate was increased to 4.1 gal/min. The average pumping rate was 4.0 gal/min. Drawdown was 2.60 ft in the isolated interval, 0.57 ft in the interval below the packers, and 0.50 ft in the interval above the packers. The spe-cific capacity of interval 2 was 1.5 (gal/min)/ft. The hydro-graphs for the interval above the packers, the isolated interval, and the interval below the packers (fig. 23) indicate a hydraulic connection between the isolated interval and the intervals above and below the packers. The water level in well 05MW13I declined 0.18 ft in response to pumping interval 2, indicating a hydraulic connection between interval 2 and well 05MW13I.
Interval 3 (136.5-145.5 Feet Below Land Surface)
For the aquifer-isolation test of interval 3, the bottom of the upper packer and the top of the lower packer were set at 136.5 and 145.5 ft bls, respectively, to isolate the fracture zone at 138 ft bls. Before packer inflation, the depth to water in the open borehole was 26.64 ft bls. After packer inflation, the depth to water in the isolated interval decreased 0.03 ft; the depth to water in the interval below the packers increased 0.01 ft; and the depth to water in the interval above the packers increased 0.13 ft. This is generally consistent with the heatpulse-flowme-ter measurements, which showed downward flow to the fracture at 138 ft bls. Pumping began at an initial rate of 2.5 gal/min.
After 3 minutes, the pumping rate was increased to 3.0 gal/min. The average pumping rate was 2.9 gal/min. Drawdown was 3.62 ft in the isolated interval, 0.36 ft in the interval below the packers, and 0.64 ft in the interval above the packers. The spe-cific capacity of interval 3 was 0.80 (gal/min)/ft. The hydro-graphs for the interval above the packers, the isolated interval, and the interval below the packers (fig. 24) indicate a hydraulic connection between the isolated interval and the intervals above and below the packers. The water level in well 05MW13I declined 0.15 ft in response to pumping interval 3, indicating a hydraulic connection between interval 3 and well 05MW13I.
Interval 4 (124.5-135.5 Feet Below Land Surface)
For the aquifer-isolation test of interval 4, the bottom of the upper packer and the top of the lower packer were set at 124.5 and 135.5 ft bls, respectively, to isolate the fracture zone at 124-125 ft bls. After packer inflation, the depth to water in the isolated interval did not change, the depth to water in the interval below the packers increased 0.03 ft, and the depth to water in the interval above the packers increased 0.75 ft. This is consistent with the heatpulse-flowmeter measurements, which showed downward flow. The average pumping rate was 2.4 gal/min. Drawdown was 6.36 ft in the isolated interval, 0.27 ft in the interval below the packers, and 0.31 ft in the inter-val above the packers. The specific capacity of interval 4 was 0.38 (gal/min)/ft. The hydrographs for the interval above the packers, the isolated interval, and the interval below the packers (fig. 25) indicate a weak hydraulic connection among the inter-vals. The water level in well 05MW13I declined 0.14 ft in response to pumping interval 4, indicating a hydraulic connec-tion between interval 4 and well 05MW13I.

Interpretation of Borehole Geophysical Logs, Aquifer-Isolation Tests, and Water-Quality Data at Site 3 35
25 25 30 35 40 45 50 55 60 65 7:45
8:00
8:15
8:30
8:45
9:00
9:15
9:30
9:45
10:0
0
24.5
24.6
24.7
24.8
24.9
NO
VE
MB
ER
28,
200
5
DEPTH TO WATER, IN FEET BELOW LAND SURFACE
PU
MP
ON
PU
MP
OF
FS
TAR
T U
PP
ER
PA
CK
ER
D
EF
LAT
ION
WA
TE
R L
EV
EL
IN IN
TE
RV
AL
AB
OV
E P
AC
KE
RS
WA
TE
R L
EV
EL
IN IS
OLA
TE
D
INT
ER
VA
L
WA
TE
R L
EV
EL
IN W
ELL
05M
W13
I
WA
TE
R-Q
UA
LIT
YS
AM
PLE
CO
LLE
CT
ED
Figu
re 2
2. H
ydro
grap
hs fr
om a
quife
r-is
olat
ion
test
of i
nter
val 1
(178
.2-2
22 fe
et b
elow
land
sur
face
) in
wel
l 03M
W08
(MG-
2142
), W
illow
Gro
ve N
aval
Air
Stat
ion/
Join
t Re
serv
e Ba
se, H
orsh
am T
owns
hip,
Mon
tgom
ery
Coun
ty, P
enns
ylva
nia.

36 Interpretation of Borehole Geophysical Logs for Sites 1, 3, and 5 at Willow Grove Naval Air Station/Joint Reserve Base
24.5
24.6
24.7
24.8
24.9 25 25 26 27 28 29 30 12:1
512
:30
12:4
513
:00
13:1
513
:30
13:4
514
:00
14:1
514
:30
NO
VE
MB
ER
28,
200
5
PU
MP
ON
PU
MP
OF
F
STA
RT
UP
PE
RP
AC
KE
R IN
FLA
TIO
NS
TAR
T L
OW
ER
P
AC
KE
R IN
FLA
TIO
NS
TAR
T U
PP
ER
PA
CK
ER
DE
FLA
TIO
N
STA
RT
LO
WE
RP
AC
KE
RD
EF
LAT
ION
DEPTH TO WATER, IN FEET BELOW LAND SURFACE
WA
TE
R L
EV
EL
IN IN
TE
RV
AL
AB
OV
E P
AC
KE
RS
WA
TE
R L
EV
EL
IN IS
OLA
TE
D
INT
ER
VA
LW
AT
ER
LE
VE
L IN
INT
ER
VA
L B
ELO
W P
AC
KE
RS
WA
TE
R L
EV
EL
IN W
ELL
05M
W13
I
INC
RE
AS
EP
UM
PIN
G R
AT
E
WA
TE
R-Q
UA
LIT
YS
AM
PLE
CO
LLE
CT
ED
Figu
re 2
3. H
ydro
grap
hs fr
om a
quife
r-is
olat
ion
test
of i
nter
val 2
(162
-173
feet
bel
ow la
nd s
urfa
ce) i
n w
ell 0
3MW
08 (M
G-21
42),
Will
ow G
rove
Nav
al A
ir St
atio
n/Jo
int R
eser
ve
Base
, Hor
sham
Tow
nshi
p, M
ontg
omer
y Co
unty
, Pen
nsyl
vani
a.

Interpretation of Borehole Geophysical Logs, Aquifer-Isolation Tests, and Water-Quality Data at Site 3 37
NO
VE
MB
ER
28,
200
5
WA
TE
R L
EV
EL
IN IN
TE
RV
AL
AB
OV
E P
AC
KE
RS
WA
TE
R L
EV
EL
IN IS
OLA
TE
DIN
TE
RV
AL
WA
TE
R L
EV
EL
IN IN
TE
RV
AL
BE
LOW
PA
CK
ER
SW
AT
ER
LE
VE
L IN
WE
LL 0
5MW
13I
PU
MP
ON
PU
MP
OF
F
STA
RT
UP
PE
RP
AC
KE
R IN
FLA
TIO
NS
TAR
T L
OW
ER
P
AC
KE
R IN
FLA
TIO
N
STA
RT
UP
PE
RP
AC
KE
R D
EF
LAT
ION
STA
RT
LO
WE
RP
AC
KE
RD
EF
LAT
ION
DEPTH TO WATER, IN FEET BELOW LAND SURFACE
INC
RE
AS
EP
UM
PIN
G R
AT
E
25 25 26 27 28 29 30 318:
308:
459:
009:
159:
309:
4510
:00
10:1
510
:30
10:4
511
:00
11:1
511
:30
24.5
24.6
24.7
24.8
24.9
WA
TE
R-Q
UA
LIT
YS
AM
PLE
CO
LLE
CT
ED
Figu
re 2
4. H
ydro
grap
hs fr
om a
quife
r-is
olat
ion
test
of i
nter
val 3
(136
.5-1
45.5
feet
bel
ow la
nd s
urfa
ce) i
n w
ell 0
3MW
08 (M
G-2
142)
, Will
ow G
rove
Nav
al A
ir St
atio
n/Jo
int
Rese
rve
Base
, Hor
sham
Tow
nshi
p, M
ontg
omer
y Co
unty
, Pen
nsyl
vani
a.
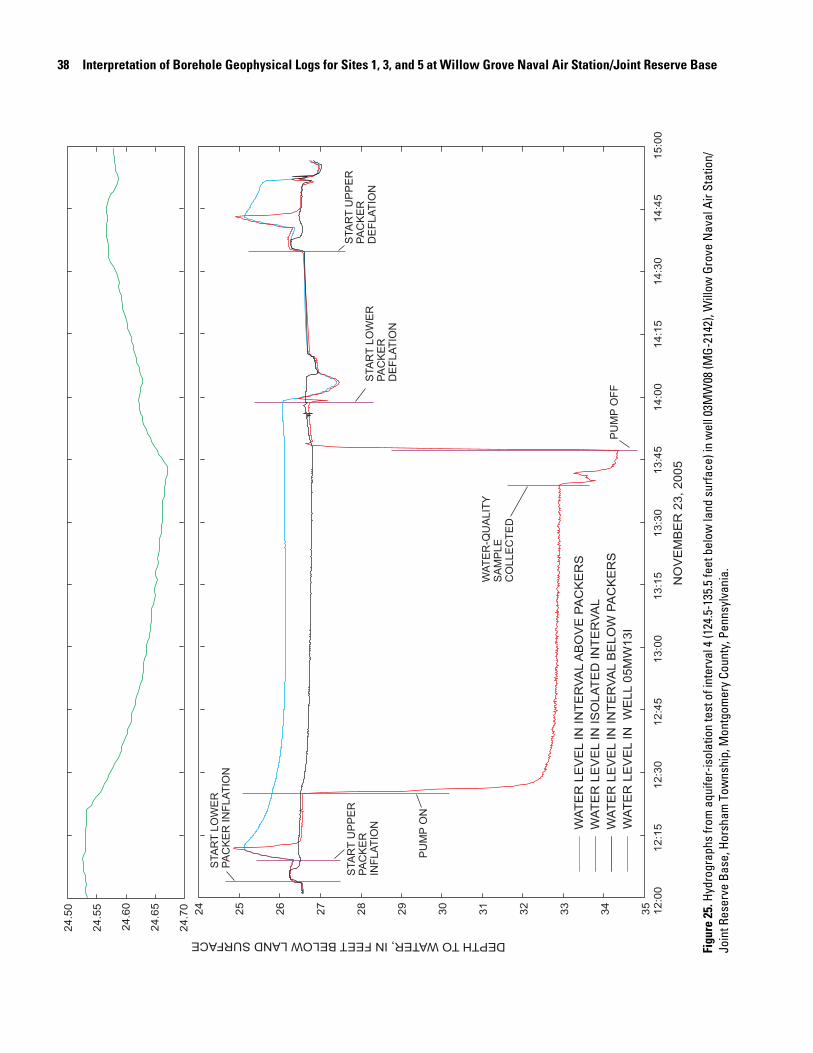
38 Interpretation of Borehole Geophysical Logs for Sites 1, 3, and 5 at Willow Grove Naval Air Station/Joint Reserve Base
24
25
26
27
28
29
30
31
32
33
34
35 12
:00
12
:15
12
:30
12
:45
13
:00
13
:15
13
:30
13
:45
14
:00
14
:15
14
:30
14
:45
15
:00
NO
VE
MB
ER
23, 2005
PU
MP
ON
PU
MP
OF
F
STA
RT
UP
PE
RP
AC
KE
RIN
FLA
TIO
N
STA
RT
LO
WE
R
PA
CK
ER
INF
LAT
ION
STA
RT
UP
PE
RP
AC
KE
RD
EF
LAT
ION
STA
RT
LO
WE
RP
AC
KE
RD
EF
LAT
ION
DEPTH TO WATER, IN FEET BELOW LAND SURFACE
WA
TE
R L
EV
EL
IN IN
TE
RV
AL
AB
OV
E P
AC
KE
RS
WA
TE
R L
EV
EL
IN IS
OLA
TE
D IN
TE
RV
AL
WA
TE
R L
EV
EL
IN IN
TE
RV
AL
BE
LO
W P
AC
KE
RS
WA
TE
R L
EV
EL
IN W
ELL
05M
W13I
24
.55
24
.70
24
.65
24
.50
24
.60
WA
TE
R-Q
UA
LIT
YS
AM
PLE
CO
LLE
CT
ED
Figu
re 2
5. H
ydro
grap
hs fr
om a
quife
r-is
olat
ion
test
of i
nter
val 4
(124
.5-1
35.5
feet
bel
ow la
nd s
urfa
ce) i
n w
ell 0
3MW
08 (M
G-2
142)
, Will
ow G
rove
Nav
al A
ir St
atio
n/Jo
int R
eser
ve B
ase,
Hor
sham
Tow
nshi
p, M
ontg
omer
y Co
unty
, Pen
nsyl
vani
a.

Interpretation of Borehole Geophysical Logs, Aquifer-Isolation Tests, and Water-Quality Data at Site 3 39
Interval 5 (75.5-86.5 Feet Below Land Surface)
For the aquifer-isolation test of interval 5, the bottom of the upper packer and the top of the lower packer were set at 75.5 and 86.5 ft bls, respectively, to isolate the fracture at 80 ft bls. Before packer inflation, the depth to water in the open borehole was 26.60 ft bls. After packer inflation, the depth to water in the isolated interval increased 0.23 ft, the depth to water in the interval below the packers decreased 0.02 ft, and the depth to water in the interval above the packers increased 2.04 ft. This is generally consistent with the heatpulse-flowmeter measure-ments, which showed downward flow. The average pumping rate was 1.6 gal/min. Drawdown was 17.12 ft in the isolated interval, 0 ft in the interval below the packers, and 0.80 ft in the interval above the packers. The specific capacity of interval 5 was 0.09 (gal/min)/ft. The water level in the interval above the packers had not stabilized and was still declining at the start of pumping (fig. 26). It appears that the hydrograph of the interval above the packers was slightly affected by pumping, but most of the drawdown probably was the continued decline from inflation of the upper packer. The hydrographs (fig. 26) indicate little hydraulic connection between the isolated interval and the interval above the packers and no hydraulic connection between the isolated interval and the interval below the packers. The water level in well 05MW13I did not change in response to pumping interval 5, indicating no hydraulic connection between interval 5 and well 05MW13I.
Interval 6 (38-68.5 Feet Below Land Surface)
For the aquifer-isolation test of interval 6, only the upper packer was inflated. The top of the upper packer was set at 68.5 ft bls to isolate the upper section of the borehole. Before packer inflation, the depth to water in the open borehole was 26.54 ft bls. After packer inflation, the water level in the inter-val above the packer (isolated interval) increased 0.06 ft and was still rising at start of pumping. This is consistent with the heatpulse-flowmeter measurements, which showed downward flow from the isolated interval. Pumping began at an initial rate of 2.4 gal/min. The pumping rate dropped during the test. After 52 minutes, the pumping rate was decreased to 0.8 gal/min. The average pumping rate was 1.0 gal/min. Drawdown was 23.12 ft in the isolated interval and 0.04 ft in the interval below the packer. The specific capacity of interval 6 was 0.04 (gal/min)/ft. The hydrographs for the isolated interval and the interval below the packer (fig. 27) indicate no hydraulic connection between these two intervals. The water level in well 05MW13I did not change in response to pumping interval 6, indicating no hydraulic connection between interval 6 and well 05MW13I.
Vertical Distribution of Water-Quality Constituents
During each aquifer-isolation test, water samples were col-lected by the USGS for field determinations of water-quality constituents and by ECOR Solutions, Inc., for analysis for
VOCs. Analytical results were used to determine change in con-centration with depth. VOCs detected in water samples col-lected during aquifer-isolation tests are listed in table 13. Ace-tone probably is a laboratory contaminant. Concentrations of VOCs were less than 10 µg/L (table 13). The concentration of most VOCs generally increased with depth to interval 2. Con-centrations of most VOCs were highest in interval 2. Concen-trations of total VOCs in the deepest interval (interval 1) (21 µg/L) were less than concentrations in interval 2 (31 µg/L). Concentrations of dissolved oxygen generally decreased with depth, and specific conductance and temperature increased with depth (table 14). The interval (interval 2) with the highest total VOC concentration also had the lowest dissolved oxygen con-centration (3.2 mg/L).

40 Interpretation of Borehole Geophysical Logs for Sites 1, 3, and 5 at Willow Grove Naval Air Station/Joint Reserve Base
22 24 26 28 30 32 34 36 38 40 42 44 468:
158:
308:
459:
009:
159:
309:
4510
:00
10:1
510
:30
10:4
511
:00
11:1
5
NO
VE
MB
ER
23,
200
5
PU
MP
ON
PU
MP
OF
F
STA
RT
UP
PE
RP
AC
KE
R IN
FLA
TIO
N
STA
RT
LO
WE
R
PA
CK
ER
INF
LAT
ION
STA
RT
UP
PE
RP
AC
KE
R D
EF
LAT
ION
STA
RT
LO
WE
RP
AC
KE
RD
EF
LAT
ION
DEPTH TO WATER, IN FEET BELOW LAND SURFACE
WA
TE
R L
EV
EL
IN IN
TE
RV
AL
AB
OV
E P
AC
KE
RS
WA
TE
R L
EV
EL
IN IS
OLA
TE
DIN
TE
RV
AL
WA
TE
R L
EV
EL
IN IN
TE
RV
AL
BE
LOW
PA
CK
ER
S
WA
TE
R-Q
UA
LIT
YS
AM
PLE
CO
LLE
CT
ED
Figu
re 2
6. H
ydro
grap
hs fr
om a
quife
r-is
olat
ion
test
of i
nter
val 5
(75.
5-86
.5 fe
et b
elow
land
sur
face
) in
wel
l 03M
W08
(MG-
2142
), W
illow
Gro
ve N
aval
Air
Stat
ion/
Join
t Re
serv
e Ba
se, H
orsh
am T
owns
hip,
Mon
tgom
ery
Coun
ty, P
enns
ylva
nia.
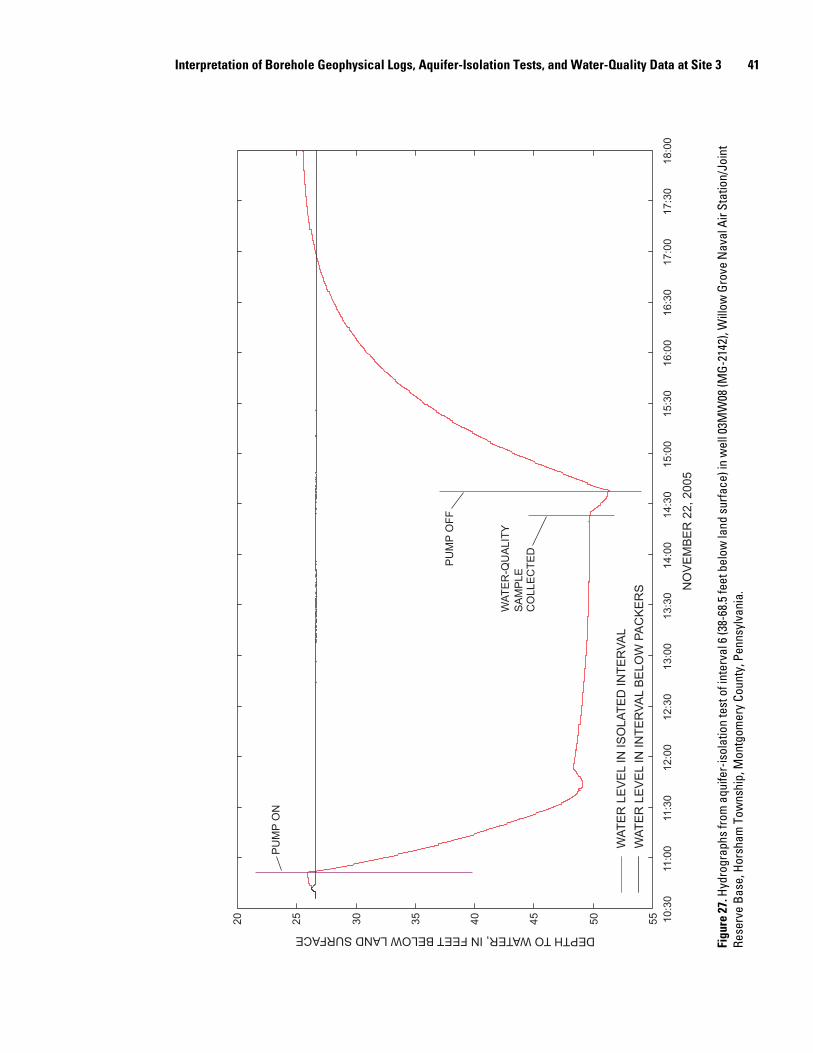
Interpretation of Borehole Geophysical Logs, Aquifer-Isolation Tests, and Water-Quality Data at Site 3 41
WA
TE
R L
EV
EL
IN IS
OLA
TE
D IN
TE
RV
AL
WA
TE
R L
EV
EL
IN IN
TE
RV
AL
BE
LOW
PA
CK
ER
S
20 25 30 35 40 45 50 55 10:3
011
:00
11:3
012
:00
12:3
013
:00
13:3
014
:00
14:3
015
:00
15:3
016
:00
16:3
017
:00
17:3
018
:00
NO
VE
MB
ER
22,
200
5
PU
MP
ON
PU
MP
OF
F
DEPTH TO WATER, IN FEET BELOW LAND SURFACE
WA
TE
R-Q
UA
LIT
YS
AM
PLE
CO
LLE
CT
ED
Figu
re 2
7. H
ydro
grap
hs fr
om a
quife
r-is
olat
ion
test
of i
nter
val 6
(38-
68.5
feet
bel
ow la
nd s
urfa
ce) i
n w
ell 0
3MW
08 (M
G-2
142)
, Will
ow G
rove
Nav
al A
ir St
atio
n/Jo
int
Rese
rve
Base
, Hor
sham
Tow
nshi
p, M
ontg
omer
y Co
unty
, Pen
nsyl
vani
a.

42 Interpretation of Borehole Geophysical Logs, Sites 1, 3, and 5, Willow Grove Naval Air Station/Joint Reserve Base
Table 13. Concentrations of volatile organic compounds detected in water samples collected during aquifer-isolation tests in well 03MW08 (MG-2142), November 22-28, 2005, Willow Grove Naval Air Station/Joint Reserve Base, Horsham Township, Montgomery County, Pennsylvania.
[Laboratory results were provided by TetraTech NUS, Inc.; ft bls, feet below land surface; µg/L, micrograms per liter; ND, not detected, reporting limit is 5 µg/L for acetone and 1 µg/L for other constituents listed; J, estimated result less than reporting limit]
IntervalDepth of sample
(ft bls)
1,1-dichloro-
ethene(µg/L)
1,1-dichloro-
ethane(µg/L)
Acetone(µg/L)
cis-1,2-dichloro-
ethene(µg/L)
Tetrachloro-ethylene
(µg/L)
Toluene(µg/L)
1,1,1-Trichloro-
ethane(µg/L)
Trichloro-ethylene
(µg/L)
6 38-68.5 ND ND 2.6 J ND ND 2.9 ND ND
5 75.5-86.5 ND ND ND ND ND 1.1 ND ND
4 124.5-135.5 1.2 2.2 ND 0.49 J 1.8 .66 J 1.1 0.89 J
3 136.5-145.5 2.2 4.0 3.2 J .81 J 1.6 .96 J 2.1 1.6
2 162-173 5.7 9.3 2.8 J 1.6 1.7 .67 J 5.3 3.5
1 178.2-222 5.0 7.3 ND 1.1 .88 J ND 4.5 2.4
Table 14. Selected water-quality constituents measured in the field in water samples collected during aquifer-isolation tests in well 03MW08 (MG-2142), November 22-28, 2005, Willow Grove Naval Air Station/Joint Reserve Base, Horsham Township, Montgomery County, Pennsylvania.
[ft bls, feet below land surface; mg/L, milligrams per liter; µS/cm at 25°C, microsiemens per centimeter at 25 degrees Celsius; C, Celsius; —, no data]
Depth of Dissolved pH SpecificTemperature
Interval sample oxygen (standard conductance (degrees C)(ft bls) (mg/L) units) (µS/cm at 25°C)
6 38-68.5 8.6 6.1 151 13.7
5 75.5-86.5 — — — —
4 124.5-135.5 5.9 7.0 256 13.5
3 136.5-145.5 — — — —
2 162-173 3.2 7.0 304 14.1
1 178.2-222 3.6 6.8 355 14.2
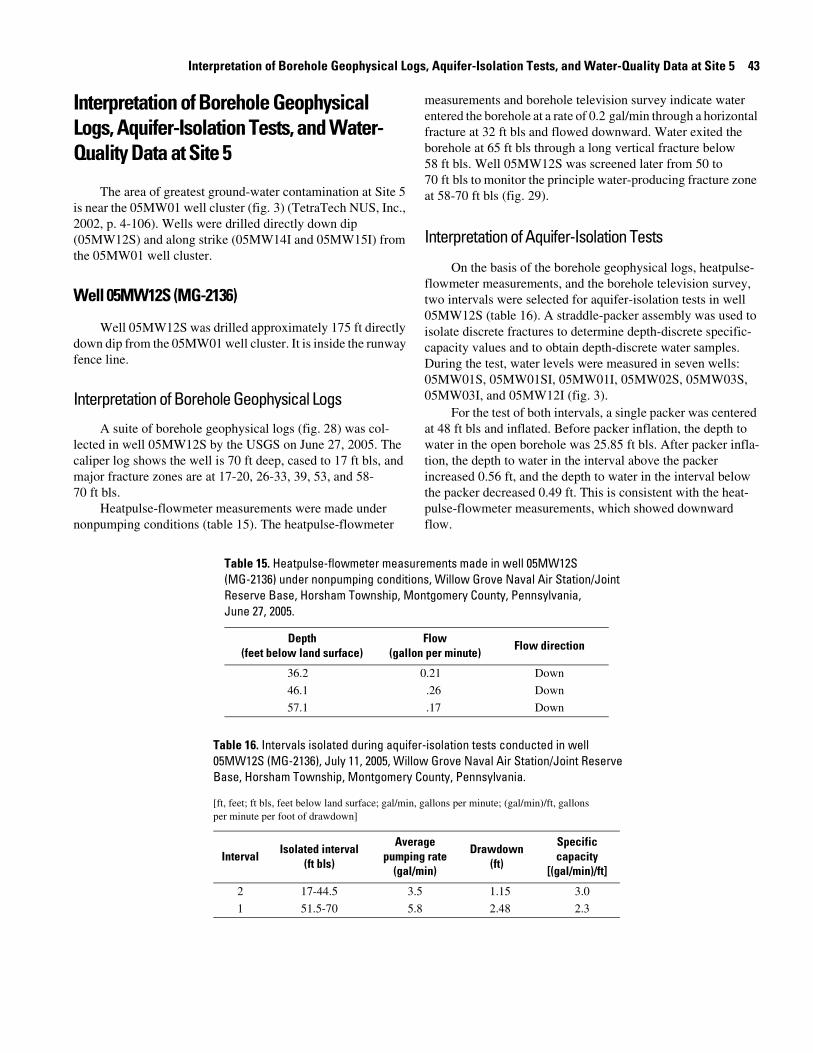
Interpretation of Borehole Geophysical Logs, Aquifer-Isolation Tests, and Water-Quality Data at Site 5 43
Interpretation of Borehole Geophysical Logs, Aquifer-Isolation Tests, and Water-Quality Data at Site 5
The area of greatest ground-water contamination at Site 5 is near the 05MW01 well cluster (fig. 3) (TetraTech NUS, Inc., 2002, p. 4-106). Wells were drilled directly down dip (05MW12S) and along strike (05MW14I and 05MW15I) from the 05MW01 well cluster.
Well 05MW12S (MG-2136)
Well 05MW12S was drilled approximately 175 ft directly down dip from the 05MW01 well cluster. It is inside the runway fence line.
Interpretation of Borehole Geophysical Logs
A suite of borehole geophysical logs (fig. 28) was col-lected in well 05MW12S by the USGS on June 27, 2005. The caliper log shows the well is 70 ft deep, cased to 17 ft bls, and major fracture zones are at 17-20, 26-33, 39, 53, and 58-70 ft bls.
Heatpulse-flowmeter measurements were made under nonpumping conditions (table 15). The heatpulse-flowmeter
measurements and borehole television survey indicate water entered the borehole at a rate of 0.2 gal/min through a horizontal fracture at 32 ft bls and flowed downward. Water exited the borehole at 65 ft bls through a long vertical fracture below 58 ft bls. Well 05MW12S was screened later from 50 to 70 ft bls to monitor the principle water-producing fracture zone at 58-70 ft bls (fig. 29).
Interpretation of Aquifer-Isolation Tests
On the basis of the borehole geophysical logs, heatpulse-flowmeter measurements, and the borehole television survey, two intervals were selected for aquifer-isolation tests in well 05MW12S (table 16). A straddle-packer assembly was used to isolate discrete fractures to determine depth-discrete specific-capacity values and to obtain depth-discrete water samples. During the test, water levels were measured in seven wells: 05MW01S, 05MW01SI, 05MW01I, 05MW02S, 05MW03S, 05MW03I, and 05MW12I (fig. 3).
For the test of both intervals, a single packer was centered at 48 ft bls and inflated. Before packer inflation, the depth to water in the open borehole was 25.85 ft bls. After packer infla-tion, the depth to water in the interval above the packer increased 0.56 ft, and the depth to water in the interval below the packer decreased 0.49 ft. This is consistent with the heat-pulse-flowmeter measurements, which showed downward flow.
Table 15. Heatpulse-flowmeter measurements made in well 05MW12S (MG-2136) under nonpumping conditions, Willow Grove Naval Air Station/Joint Reserve Base, Horsham Township, Montgomery County, Pennsylvania, June 27, 2005.
Depth FlowFlow direction
(feet below land surface) (gallon per minute)
36.2 0.21 Down
46.1 .26 Down
57.1 .17 Down
Table 16. Intervals isolated during aquifer-isolation tests conducted in well 05MW12S (MG-2136), July 11, 2005, Willow Grove Naval Air Station/Joint Reserve Base, Horsham Township, Montgomery County, Pennsylvania.
[ft, feet; ft bls, feet below land surface; gal/min, gallons per minute; (gal/min)/ft, gallons per minute per foot of drawdown]
Average Specific Isolated interval Drawdown
Interval pumping rate capacity(ft bls) (ft)(gal/min) [(gal/min)/ft]
2 17-44.5 3.5 1.15 3.0
1 51.5-70 5.8 2.48 2.3

44 Interpretation of Borehole Geophysical Logs for Sites 1, 3, and 5 at Willow Grove Naval Air Station/Joint Reserve Base
DEPTH, IN FEET BELOW LAND SURFACE
0
10 20 30 40 50 60 70 80
89
1011
010
020
00
400
800
1,20
013
1415
2024
28
CA
SIN
G
CA
LIP
ER
LO
G H
OLE
DIA
ME
TE
R, I
N IN
CH
ES
NA
TU
RA
L G
AM
MA
,IN
CO
UN
TS
PE
RS
EC
ON
D
SIN
GLE
-PO
INT
RE
SIS
TAN
CE
,IN
OH
MS
FLU
ID T
EM
PE
RA
TU
RE
,IN
DE
GR
EE
S C
ELS
IUS
FLU
ID R
ES
IST
IVIT
Y,IN
OH
M-M
ET
ER
S
Figu
re 2
8. B
oreh
ole
geop
hysi
cal l
ogs
for w
ell 0
5MW
12S
(MG-
2136
), W
illow
Gro
ve N
aval
Air
Stat
ion/
Join
t Res
erve
Bas
e, H
orsh
am T
owns
hip,
Mon
tgom
ery
Coun
ty,
Penn
sylv
ania
, Jun
e 27
, 200
5.
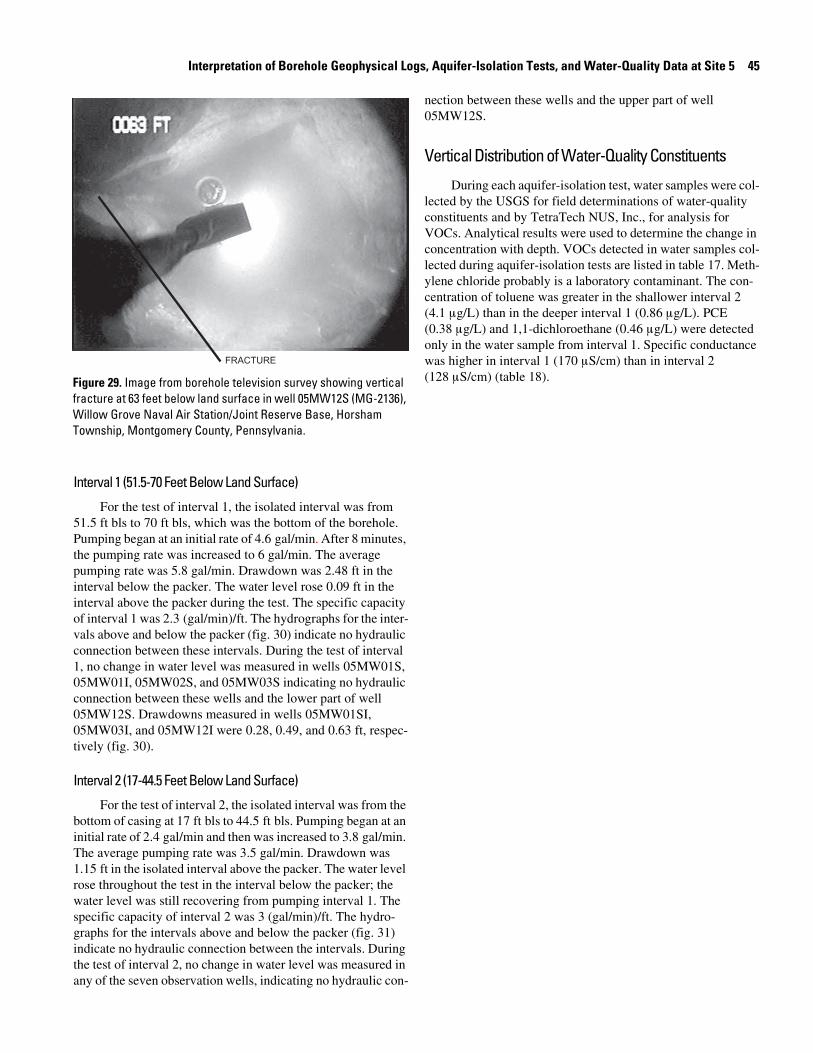
Interpretation of Borehole Geophysical Logs, Aquifer-Isolation Tests, and Water-Quality Data at Site 5 45
Interval 1 (51.5-70 Feet Below Land Surface)
For the test of interval 1, the isolated interval was from 51.5 ft bls to 70 ft bls, which was the bottom of the borehole. Pumping began at an initial rate of 4.6 gal/min. After 8 minutes, the pumping rate was increased to 6 gal/min. The average pumping rate was 5.8 gal/min. Drawdown was 2.48 ft in the interval below the packer. The water level rose 0.09 ft in the interval above the packer during the test. The specific capacity of interval 1 was 2.3 (gal/min)/ft. The hydrographs for the inter-vals above and below the packer (fig. 30) indicate no hydraulic connection between these intervals. During the test of interval 1, no change in water level was measured in wells 05MW01S, 05MW01I, 05MW02S, and 05MW03S indicating no hydraulic connection between these wells and the lower part of well 05MW12S. Drawdowns measured in wells 05MW01SI, 05MW03I, and 05MW12I were 0.28, 0.49, and 0.63 ft, respec-tively (fig. 30).
Interval 2 (17-44.5 Feet Below Land Surface)
For the test of interval 2, the isolated interval was from the bottom of casing at 17 ft bls to 44.5 ft bls. Pumping began at an initial rate of 2.4 gal/min and then was increased to 3.8 gal/min. The average pumping rate was 3.5 gal/min. Drawdown was 1.15 ft in the isolated interval above the packer. The water level rose throughout the test in the interval below the packer; the water level was still recovering from pumping interval 1. The specific capacity of interval 2 was 3 (gal/min)/ft. The hydro-graphs for the intervals above and below the packer (fig. 31) indicate no hydraulic connection between the intervals. During the test of interval 2, no change in water level was measured in any of the seven observation wells, indicating no hydraulic con-
nection between these wells and the upper part of well 05MW12S.
Vertical Distribution of Water-Quality Constituents
During each aquifer-isolation test, water samples were col-lected by the USGS for field determinations of water-quality constituents and by TetraTech NUS, Inc., for analysis for VOCs. Analytical results were used to determine the change in concentration with depth. VOCs detected in water samples col-lected during aquifer-isolation tests are listed in table 17. Meth-ylene chloride probably is a laboratory contaminant. The con-centration of toluene was greater in the shallower interval 2 (4.1 µg/L) than in the deeper interval 1 (0.86 µg/L). PCE (0.38 µg/L) and 1,1-dichloroethane (0.46 µg/L) were detected only in the water sample from interval 1. Specific conductance was higher in interval 1 (170 µS/cm) than in interval 2 (128 µS/cm) (table 18).
FRACTURE
Figure 29. Image from borehole television survey showing vertical fracture at 63 feet below land surface in well 05MW12S (MG-2136), Willow Grove Naval Air Station/Joint Reserve Base, Horsham Township, Montgomery County, Pennsylvania.

46 Interpretation of Borehole Geophysical Logs for Sites 1, 3, and 5 at Willow Grove Naval Air Station/Joint Reserve Base
24 25 26 27 28 29 30 11:4
512
:00
12:1
512
:30
12:4
513
:00
13:1
513
:30
13:4
514
:00
INC
RE
AS
E P
UM
PIN
G R
AT
E
JULY
11,
200
5
PU
MP
ON
PU
MP
OF
F
STA
RT
PA
CK
ER
INF
LAT
ION
DEPTH TO WATER, IN FEET BELOW LAND SURFACE
WA
TE
R L
EV
EL
IN IN
TE
RV
AL
AB
OV
E P
AC
KE
RS
WA
TE
R L
EV
EL
IN IS
OLA
TE
D IN
TE
RV
AL
WA
TE
R L
EV
EL
IN W
ELL
05M
W12
IW
AT
ER
LE
VE
L IN
WE
LL 0
5MW
01S
I
WA
TE
R L
EV
EL
IN W
ELL
05M
W13
I
Figu
re 3
0. H
ydro
grap
hs fr
om a
quife
r-is
olat
ion
test
of i
nter
val 1
(51.
5-70
feet
bel
ow la
nd s
urfa
ce) i
n w
ell 0
5MW
12S
(MG
-213
6), W
illow
Gro
ve N
aval
Air
Stat
ion/
Join
t Res
erve
Bas
e, H
orsh
am T
owns
hip,
Mon
tgom
ery
Coun
ty, P
enns
ylva
nia.

Interpretation of Borehole Geophysical Logs, Aquifer-Isolation Tests, and Water-Quality Data at Site 5 47
WA
TE
R L
EV
EL
IN IS
OLA
TE
D IN
TE
RV
AL
WA
TE
R L
EV
EL
IN IN
TE
RV
AL
BE
LOW
PA
CK
ER
S
STA
RT
PA
CK
ER
DE
FLA
TIO
N
25.4
25.6
25.8
26.0
26.2
26.4
26.6
26.8
27.0 14
:00
14:1
514
:30
14:4
515
:00
15:1
515
:30
15:4
516
:00
16:1
5
PU
MP
ON
PU
MP
OF
F
DEPTH TO WATER, IN FEET BELOW LAND SURFACE
WA
TE
R-Q
UA
LIT
YS
AM
PLE
CO
LLE
CT
ED
JULY
11,
200
5
Figu
re 3
1. H
ydro
grap
hs fr
om a
quife
r-is
olat
ion
test
of i
nter
val 2
(17-
44.5
feet
bel
ow la
nd s
urfa
ce) i
n w
ell 0
5MW
12S
(MG-
2136
), W
illow
Gro
ve N
aval
Air
Stat
ion/
Join
t Re
serv
e Ba
se, H
orsh
am T
owns
hip,
Mon
tgom
ery
Coun
ty, P
enns
ylva
nia.
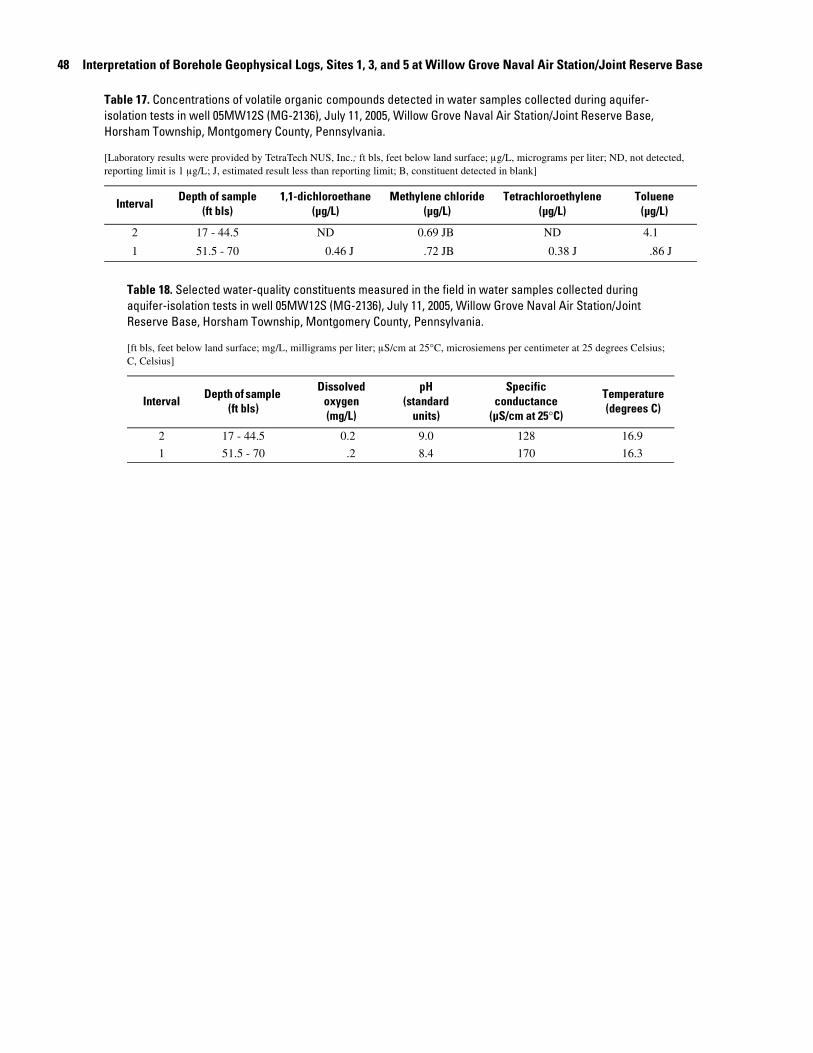
48 Interpretation of Borehole Geophysical Logs, Sites 1, 3, and 5 at Willow Grove Naval Air Station/Joint Reserve Base
Table 17. Concentrations of volatile organic compounds detected in water samples collected during aquifer- isolation tests in well 05MW12S (MG-2136), July 11, 2005, Willow Grove Naval Air Station/Joint Reserve Base, Horsham Township, Montgomery County, Pennsylvania.
[Laboratory results were provided by TetraTech NUS, Inc.; ft bls, feet below land surface; µg/L, micrograms per liter; ND, not detected, reporting limit is 1 µg/L; J, estimated result less than reporting limit; B, constituent detected in blank]
IntervalDepth of sample
(ft bls)1,1-dichloroethane
(µg/L)Methylene chloride
(µg/L)Tetrachloroethylene
(µg/L) Toluene
(µg/L)
2 17 - 44.5 ND 0.69 JB ND 4.1
1 51.5 - 70 0.46 J .72 JB 0.38 J .86 J
Table 18. Selected water-quality constituents measured in the field in water samples collected during aquifer-isolation tests in well 05MW12S (MG-2136), July 11, 2005, Willow Grove Naval Air Station/Joint Reserve Base, Horsham Township, Montgomery County, Pennsylvania.
[ft bls, feet below land surface; mg/L, milligrams per liter; µS/cm at 25°C, microsiemens per centimeter at 25 degrees Celsius; C, Celsius]
IntervalDepth of sample
(ft bls)
Dissolved oxygen(mg/L)
pH (standard
units)
Specificconductance
(µS/cm at 25°C)
Temperature (degrees C)
2 17 - 44.5 0.2 9.0 128 16.9
1 51.5 - 70 .2 8.4 170 16.3
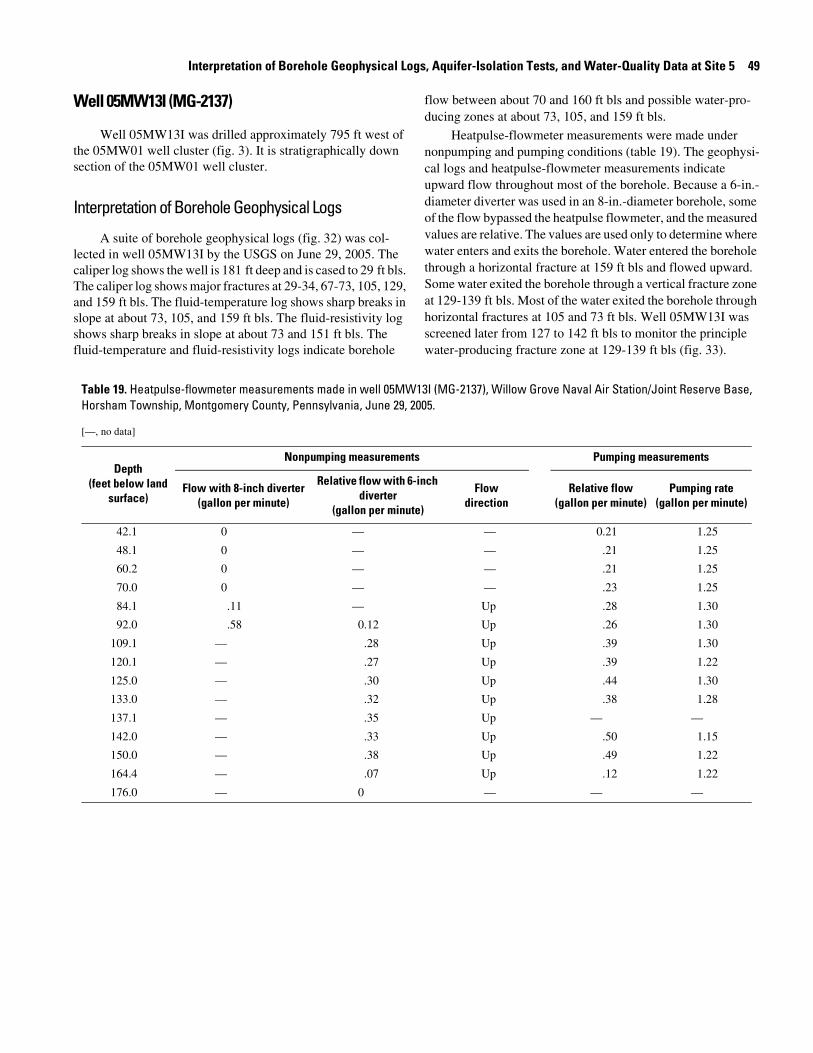
Interpretation of Borehole Geophysical Logs, Aquifer-Isolation Tests, and Water-Quality Data at Site 5 49
Well 05MW13I (MG-2137)
Well 05MW13I was drilled approximately 795 ft west of the 05MW01 well cluster (fig. 3). It is stratigraphically down section of the 05MW01 well cluster.
Interpretation of Borehole Geophysical Logs
A suite of borehole geophysical logs (fig. 32) was col-lected in well 05MW13I by the USGS on June 29, 2005. The caliper log shows the well is 181 ft deep and is cased to 29 ft bls. The caliper log shows major fractures at 29-34, 67-73, 105, 129, and 159 ft bls. The fluid-temperature log shows sharp breaks in slope at about 73, 105, and 159 ft bls. The fluid-resistivity log shows sharp breaks in slope at about 73 and 151 ft bls. The fluid-temperature and fluid-resistivity logs indicate borehole
flow between about 70 and 160 ft bls and possible water-pro-ducing zones at about 73, 105, and 159 ft bls.
Heatpulse-flowmeter measurements were made under nonpumping and pumping conditions (table 19). The geophysi-cal logs and heatpulse-flowmeter measurements indicate upward flow throughout most of the borehole. Because a 6-in.-diameter diverter was used in an 8-in.-diameter borehole, some of the flow bypassed the heatpulse flowmeter, and the measured values are relative. The values are used only to determine where water enters and exits the borehole. Water entered the borehole through a horizontal fracture at 159 ft bls and flowed upward. Some water exited the borehole through a vertical fracture zone at 129-139 ft bls. Most of the water exited the borehole through horizontal fractures at 105 and 73 ft bls. Well 05MW13I was screened later from 127 to 142 ft bls to monitor the principle water-producing fracture zone at 129-139 ft bls (fig. 33).
Table 19. Heatpulse-flowmeter measurements made in well 05MW13I (MG-2137), Willow Grove Naval Air Station/Joint Reserve Base, Horsham Township, Montgomery County, Pennsylvania, June 29, 2005.
[—, no data]
Nonpumping measurements Pumping measurementsDepth
(feet below land Relative flow with 6-inch Flow with 8-inch diverter Flow Relative flow Pumping rate
surface) diverter(gallon per minute) direction (gallon per minute) (gallon per minute)
(gallon per minute)
42.1 0 — — 0.21 1.25
48.1 0 — — .21 1.25
60.2 0 — — .21 1.25
70.0 0 — — .23 1.25
84.1 .11 — Up .28 1.30
92.0 .58 0.12 Up .26 1.30
109.1 — .28 Up .39 1.30
120.1 — .27 Up .39 1.22
125.0 — .30 Up .44 1.30
133.0 — .32 Up .38 1.28
137.1 — .35 Up — —
142.0 — .33 Up .50 1.15
150.0 — .38 Up .49 1.22
164.4 — .07 Up .12 1.22
176.0 — 0 — — —

50 Interpretation of Borehole Geophysical Logs for Sites 1, 3, and 5 at Willow Grove Naval Air Station/Joint Reserve Base
DEPTH, IN FEET BELOW LAND SURFACE
0
20 40 60 80 100
120
140
160
180
200
89
1011
010
020
020
040
060
080
012
1314
1214
1618
CA
SIN
G
CA
LIP
ER
LO
G H
OLE
DIA
ME
TE
R, I
N IN
CH
ES
NA
TU
RA
L G
AM
MA
,IN
CO
UN
TS
PE
RS
EC
ON
D
SIN
GLE
-PO
INT
RE
SIS
TAN
CE
,IN
OH
MS
FLU
ID T
EM
PE
RA
TU
RE
,IN
DE
GR
EE
S C
ELS
IUS
FLU
ID R
ES
IST
IVIT
Y,IN
OH
M-M
ET
ER
S
Figu
re 3
2. B
oreh
ole
geop
hysi
cal l
ogs
for w
ell 0
5MW
13I (
MG
-213
7), W
illow
Gro
ve N
aval
Air
Stat
ion/
Join
t Res
erve
Bas
e, H
orsh
am T
owns
hip,
Mon
tgom
ery
Coun
ty,
Penn
sylv
ania
, Jun
e 29
, 200
5.

Interpretation of Borehole Geophysical Logs, Aquifer-Isolation Tests, and Water-Quality Data at Site 5 51
Interpretation of Aquifer-Isolation Tests
On the basis of the borehole geophysical logs, heatpulse-flowmeter measurements, and the borehole television survey, five intervals were selected for aquifer-isolation tests in well 05MW13I (table 20). A straddle-packer assembly was used to isolate discrete fractures to determine depth-discrete specific-capacity values and to obtain depth-discrete water samples. The distance between the bottom of the upper packer and the top of the lower packer was 12 ft. For the test of intervals 1, only the upper packer was inflated. For the test of intervals 2, 3, 4, and 5, both packers were inflated. During the test of well 05MW13I, water levels were measured in wells 05MW14I and 05MW15I (fig. 3).
Interval 1 (162-181 Feet Below Land Surface)
For the aquifer-isolation test of interval 1, the bottom of the upper packer was set at 162 ft bls and inflated to isolate the lower part of the borehole. The yield of this interval was approximately 0.7 gal/min. Interval 1 was rapidly pumped dry and allowed to recover overnight. It was pumped dry again the next morning, allowed to recover, and pumped again to obtain a water sample. No response to pumping interval 1 was mea-sured in wells 05MW14I and 05MW15I.
FRACTURE
Figure 33. Image from borehole television survey showing vertical fracture at 137 feet below land surface in well 05MW13I (MG-2137), Willow Grove Naval Air Station/Joint Reserve Base, Horsham Township, Montgomery County, Pennsylvania, June 28, 2005.
Table 20. Intervals isolated during aquifer-isolation tests conducted in well 05MW13I (MG-2137), July 19-20, 2005, Willow Grove Naval Air Station/Joint Reserve Base, Horsham Township, Montgomery County, Pennsylvania.
[ft, feet; ft bls, feet below land surface; gal/min, gallons per minute; (gal/min)/ft, gallons per minute per foot of drawdown; —, no data]
IntervalDepth of isolated
fracture(ft bls)
Bottom of upper packer
(ft bls)
Top of lower packer
(ft bls)
Average pumping rate
(gal/min)
Drawdown(ft)
Specific capacity
[(gal/min)/ft]
5 73 64.5 76.5 3.9 3.01 1.3
4 105 100.5 112.5 4.5 .90 5.0
3 129-139 128.5 140.5 4.2 3.43 1.2
2 159 151.5 163.5 4.7 .90 5.2
1 Below 162 162 Not inflated 0.7 — —
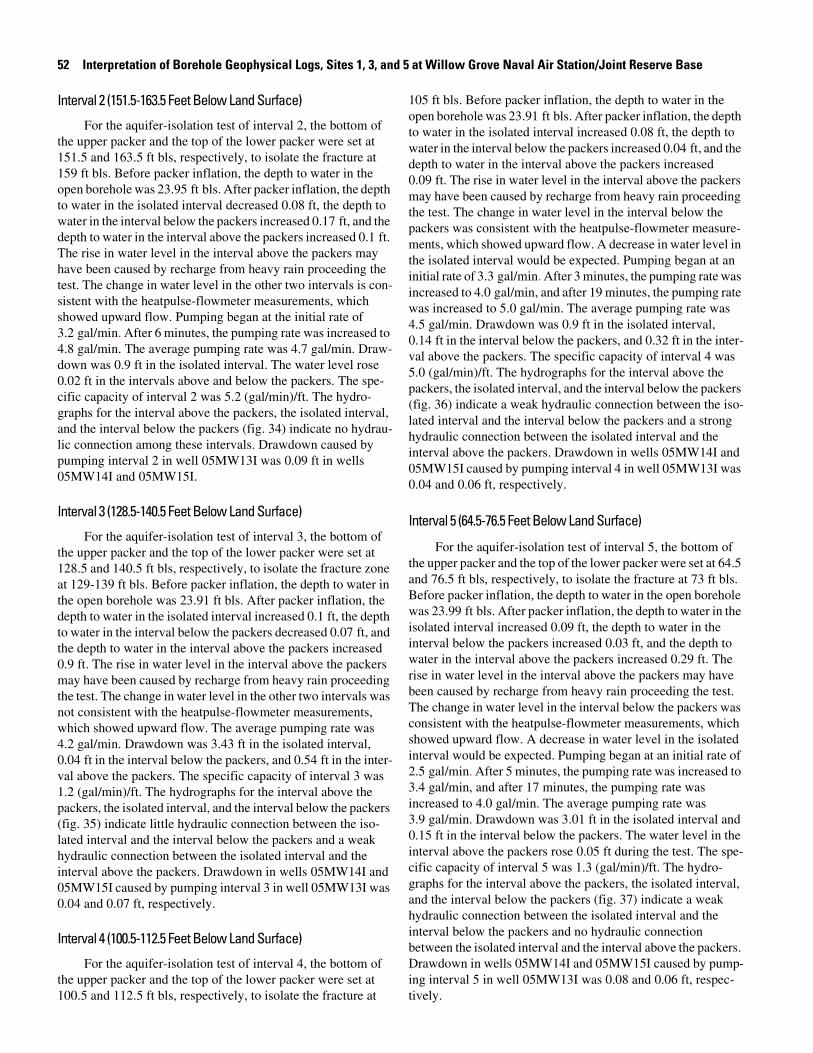
52 Interpretation of Borehole Geophysical Logs, Sites 1, 3, and 5 at Willow Grove Naval Air Station/Joint Reserve Base
Interval 2 (151.5-163.5 Feet Below Land Surface)
For the aquifer-isolation test of interval 2, the bottom of the upper packer and the top of the lower packer were set at 151.5 and 163.5 ft bls, respectively, to isolate the fracture at 159 ft bls. Before packer inflation, the depth to water in the open borehole was 23.95 ft bls. After packer inflation, the depth to water in the isolated interval decreased 0.08 ft, the depth to water in the interval below the packers increased 0.17 ft, and the depth to water in the interval above the packers increased 0.1 ft. The rise in water level in the interval above the packers may have been caused by recharge from heavy rain proceeding the test. The change in water level in the other two intervals is con-sistent with the heatpulse-flowmeter measurements, which showed upward flow. Pumping began at the initial rate of 3.2 gal/min. After 6 minutes, the pumping rate was increased to 4.8 gal/min. The average pumping rate was 4.7 gal/min. Draw-down was 0.9 ft in the isolated interval. The water level rose 0.02 ft in the intervals above and below the packers. The spe-cific capacity of interval 2 was 5.2 (gal/min)/ft. The hydro-graphs for the interval above the packers, the isolated interval, and the interval below the packers (fig. 34) indicate no hydrau-lic connection among these intervals. Drawdown caused by pumping interval 2 in well 05MW13I was 0.09 ft in wells 05MW14I and 05MW15I.
Interval 3 (128.5-140.5 Feet Below Land Surface)
For the aquifer-isolation test of interval 3, the bottom of the upper packer and the top of the lower packer were set at 128.5 and 140.5 ft bls, respectively, to isolate the fracture zone at 129-139 ft bls. Before packer inflation, the depth to water in the open borehole was 23.91 ft bls. After packer inflation, the depth to water in the isolated interval increased 0.1 ft, the depth to water in the interval below the packers decreased 0.07 ft, and the depth to water in the interval above the packers increased 0.9 ft. The rise in water level in the interval above the packers may have been caused by recharge from heavy rain proceeding the test. The change in water level in the other two intervals was not consistent with the heatpulse-flowmeter measurements, which showed upward flow. The average pumping rate was 4.2 gal/min. Drawdown was 3.43 ft in the isolated interval, 0.04 ft in the interval below the packers, and 0.54 ft in the inter-val above the packers. The specific capacity of interval 3 was 1.2 (gal/min)/ft. The hydrographs for the interval above the packers, the isolated interval, and the interval below the packers (fig. 35) indicate little hydraulic connection between the iso-lated interval and the interval below the packers and a weak hydraulic connection between the isolated interval and the interval above the packers. Drawdown in wells 05MW14I and 05MW15I caused by pumping interval 3 in well 05MW13I was 0.04 and 0.07 ft, respectively.
Interval 4 (100.5-112.5 Feet Below Land Surface)
For the aquifer-isolation test of interval 4, the bottom of the upper packer and the top of the lower packer were set at 100.5 and 112.5 ft bls, respectively, to isolate the fracture at
105 ft bls. Before packer inflation, the depth to water in the open borehole was 23.91 ft bls. After packer inflation, the depth to water in the isolated interval increased 0.08 ft, the depth to water in the interval below the packers increased 0.04 ft, and the depth to water in the interval above the packers increased 0.09 ft. The rise in water level in the interval above the packers may have been caused by recharge from heavy rain proceeding the test. The change in water level in the interval below the packers was consistent with the heatpulse-flowmeter measure-ments, which showed upward flow. A decrease in water level in the isolated interval would be expected. Pumping began at an initial rate of 3.3 gal/min. After 3 minutes, the pumping rate was increased to 4.0 gal/min, and after 19 minutes, the pumping rate was increased to 5.0 gal/min. The average pumping rate was 4.5 gal/min. Drawdown was 0.9 ft in the isolated interval, 0.14 ft in the interval below the packers, and 0.32 ft in the inter-val above the packers. The specific capacity of interval 4 was 5.0 (gal/min)/ft. The hydrographs for the interval above the packers, the isolated interval, and the interval below the packers (fig. 36) indicate a weak hydraulic connection between the iso-lated interval and the interval below the packers and a strong hydraulic connection between the isolated interval and the interval above the packers. Drawdown in wells 05MW14I and 05MW15I caused by pumping interval 4 in well 05MW13I was 0.04 and 0.06 ft, respectively.
Interval 5 (64.5-76.5 Feet Below Land Surface)
For the aquifer-isolation test of interval 5, the bottom of the upper packer and the top of the lower packer were set at 64.5 and 76.5 ft bls, respectively, to isolate the fracture at 73 ft bls. Before packer inflation, the depth to water in the open borehole was 23.99 ft bls. After packer inflation, the depth to water in the isolated interval increased 0.09 ft, the depth to water in the interval below the packers increased 0.03 ft, and the depth to water in the interval above the packers increased 0.29 ft. The rise in water level in the interval above the packers may have been caused by recharge from heavy rain proceeding the test. The change in water level in the interval below the packers was consistent with the heatpulse-flowmeter measurements, which showed upward flow. A decrease in water level in the isolated interval would be expected. Pumping began at an initial rate of 2.5 gal/min. After 5 minutes, the pumping rate was increased to 3.4 gal/min, and after 17 minutes, the pumping rate was increased to 4.0 gal/min. The average pumping rate was 3.9 gal/min. Drawdown was 3.01 ft in the isolated interval and 0.15 ft in the interval below the packers. The water level in the interval above the packers rose 0.05 ft during the test. The spe-cific capacity of interval 5 was 1.3 (gal/min)/ft. The hydro-graphs for the interval above the packers, the isolated interval, and the interval below the packers (fig. 37) indicate a weak hydraulic connection between the isolated interval and the interval below the packers and no hydraulic connection between the isolated interval and the interval above the packers. Drawdown in wells 05MW14I and 05MW15I caused by pump-ing interval 5 in well 05MW13I was 0.08 and 0.06 ft, respec-tively.
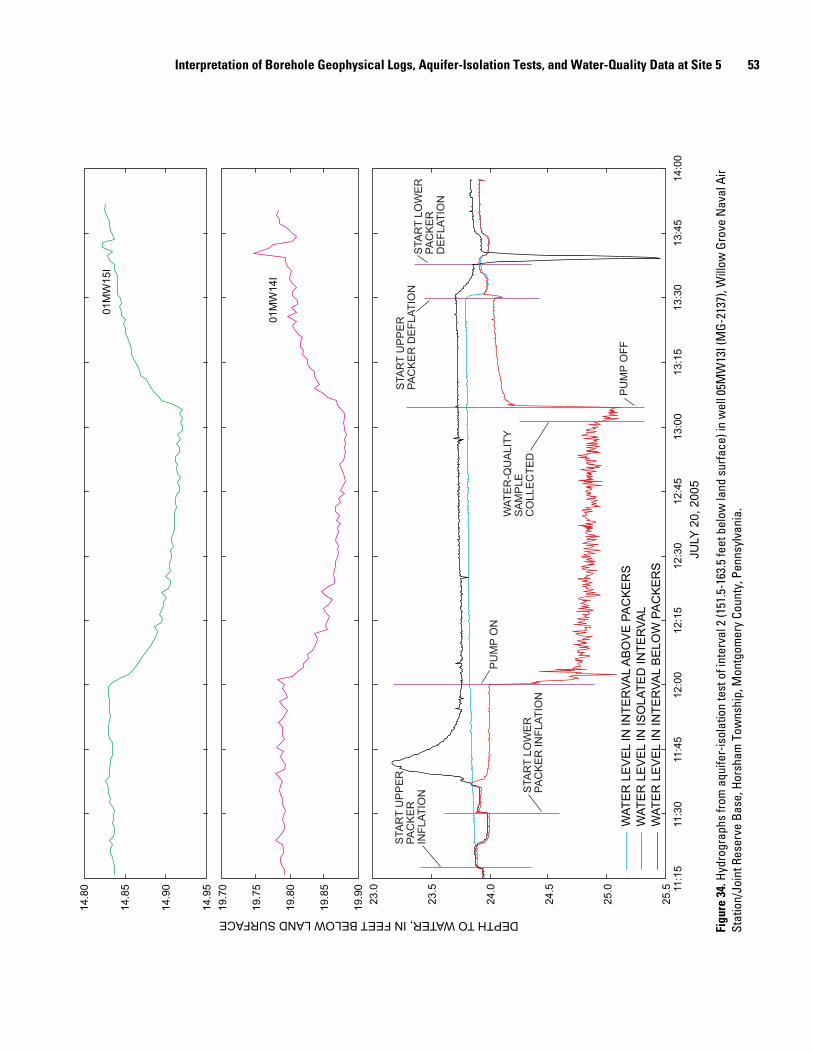
Interpretation of Borehole Geophysical Logs, Aquifer-Isolation Tests, and Water-Quality Data at Site 5 53
JULY
20,
200
5
11:1
511
:30
11:4
512
:00
12:1
512
:30
12:4
513
:00
13:1
513
:30
13:4
514
:00
01M
W15
I
01M
W14
I
23.0
23.5
24.0
24.5
25.0
25.5
14.8
0
14.8
5
14.9
0
14.9
5
19.7
0
19.7
5
19.8
0
19.8
5
19.9
0
PU
MP
ON
PU
MP
OF
F
STA
RT
UP
PE
RP
AC
KE
RIN
FLA
TIO
N STA
RT
LO
WE
R
PA
CK
ER
INF
LAT
ION
STA
RT
UP
PE
RP
AC
KE
R D
EF
LAT
ION
STA
RT
LO
WE
RP
AC
KE
RD
EF
LAT
ION
DEPTH TO WATER, IN FEET BELOW LAND SURFACE
WA
TE
R L
EV
EL
IN IN
TE
RV
AL
AB
OV
E P
AC
KE
RS
W
AT
ER
LE
VE
L IN
ISO
LAT
ED
INT
ER
VA
LW
AT
ER
LE
VE
L IN
INT
ER
VA
L B
ELO
W P
AC
KE
RS
WA
TE
R-Q
UA
LIT
YS
AM
PLE
CO
LLE
CT
ED
Figu
re 3
4. H
ydro
grap
hs fr
om a
quife
r-is
olat
ion
test
of i
nter
val 2
(151
.5-1
63.5
feet
bel
ow la
nd s
urfa
ce) i
n w
ell 0
5MW
13I (
MG-
2137
), W
illow
Gro
ve N
aval
Air
Stat
ion/
Join
t Res
erve
Bas
e, H
orsh
am T
owns
hip,
Mon
tgom
ery
Coun
ty, P
enns
ylva
nia.

54 Interpretation of Borehole Geophysical Logs for Sites 1, 3, and 5 at Willow Grove Naval Air Station/Joint Reserve Base
01M
W15
I
14.8
0
14.8
5
14.9
0
05M
W14
I
19.7
5
19.8
0
19.8
5 23 24 25 26 27 287:
307:
458:
008:
158:
308:
459:
009:
159:
309:
4510
:00
10:1
510
:30
JULY
19,
200
5
DEPTH TO WATER, IN FEET BELOW LAND SURFACE
WA
TE
R L
EV
EL
IN IN
TE
RV
AL
AB
OV
E P
AC
KE
RS
WA
TE
R L
EV
EL
IN IS
OLA
TE
D IN
TE
RV
AL
WA
TE
R L
EV
EL
IN IN
TE
RV
AL
BE
LOW
PA
CK
ER
S
PU
MP
ON
PU
MP
OF
F
STA
RT
UP
PE
RP
AC
KE
R IN
FLA
TIO
N
STA
RT
LO
WE
R
PA
CK
ER
INF
LAT
ION
STA
RT
UP
PE
RP
AC
KE
RD
EF
LAT
ION
STA
RT
LO
WE
RP
AC
KE
RD
EF
LAT
ION
WA
TE
R-Q
UA
LIT
YS
AM
PLE
CO
LLE
CT
ED
Figu
re 3
5. H
ydro
grap
hs fr
om a
quife
r-is
olat
ion
test
of i
nter
val 3
(128
.5-1
40.5
feet
bel
ow la
nd s
urfa
ce) i
n w
ell 0
5MW
13I (
MG-
2137
), W
illow
Gro
ve
Nav
al A
ir St
atio
n/Jo
int R
eser
ve B
ase,
Hor
sham
Tow
nshi
p, M
ontg
omer
y Co
unty
, Pen
nsyl
vani
a.

Interpretation of Borehole Geophysical Logs, Aquifer-Isolation Tests, and Water-Quality Data at Site 5 55
DEPTH TO WATER, IN FEET BELOW LAND SURFACE
23.6
23.8
24.0
24.2
24.4
24.6
24.8
25.0 12
:30
12:4
513
:00
13:1
513
:30
13:4
514
:00
14:1
514
:30
14:4
515
:00
15:1
5
JULY
19,
200
5
05W
M14
I
14.8
0
14.8
5
14.9
0
PU
MP
ON
PU
MP
OF
F
STA
RT
UP
PE
RP
AC
KE
R IN
FLA
TIO
N
STA
RT
LO
WE
R
PA
CK
ER
IN
FLA
TIO
N
STA
RT
UP
PE
RP
AC
KE
R D
EF
LAT
ION
STA
RT
LO
WE
RP
AC
KE
RD
EF
LAT
ION
INC
RE
AS
E P
UM
PIN
G R
AT
E
WA
TE
R L
EV
EL
IN IN
TE
RV
AL
AB
OV
E P
AC
KE
RS
WA
TE
R L
EV
EL
IN IS
OLA
TE
D IN
TE
RV
AL
WA
TE
R L
EV
EL
IN IN
TE
RV
AL
BE
LOW
PA
CK
ER
S
19.7
5
19.8
0
19.8
5
19.9
0
05W
M15
I
WA
TE
R-Q
UA
LIT
YS
AM
PLE
CO
LLE
CT
ED
Figu
re 3
6. H
ydro
grap
hs fr
om a
quife
r-is
olat
ion
test
of i
nter
val 4
(100
.5-1
12.5
feet
bel
ow la
nd s
urfa
ce) i
n w
ell 0
5MW
13I (
MG-
2137
), W
illow
Gro
ve N
aval
Air
Stat
ion/
Join
t Res
erve
Bas
e, H
orsh
am T
owns
hip,
Mon
tgom
ery
Coun
ty, P
enns
ylva
nia.

56 Interpretation of Borehole Geophysical Logs for Sites 1, 3, and 5 at Willow Grove Naval Air Station/Joint Reserve Base
23 24 25 26 27 289:
159:
309:
4510
:00
10:1
510
:30
10:4
511
:00
11:1
511
:30
JULY
19,
200
5
DEPTH TO WATER, IN FEET BELOW LAND SURFACE
PU
MP
ON
PU
MP
OF
F
STA
RT
UP
PE
RP
AC
KE
R IN
FLA
TIO
N
STA
RT
LO
WE
R
PA
CK
ER
INF
LAT
ION
STA
RT
PA
CK
ER
DE
FLA
TIO
N
WA
TE
R L
EV
EL
IN IN
TE
RV
AL
AB
OV
E P
AC
KE
RS
WA
TE
R L
EV
EL
IN IS
OLA
TE
D
INT
ER
VA
LW
AT
ER
LE
VE
L IN
INT
ER
VA
L B
ELO
W P
AC
KE
RS
INC
RE
AS
E
PU
MP
ING
RA
TE
WA
TE
R-Q
UA
LIT
YS
AM
PLE
CO
LLE
CT
ED
Figu
re 3
7. H
ydro
grap
hs fr
om a
quife
r-is
olat
ion
test
of i
nter
val 5
(64.
5-76
.5 fe
et b
elow
land
sur
face
) in
wel
l 05M
W13
I (M
G-21
37),
Will
ow G
rove
Nav
al A
ir St
atio
n/Jo
int
Rese
rve
Base
, Hor
sham
Tow
nshi
p, M
ontg
omer
y Co
unty
, Pen
nsyl
vani
a.

Interpretation of Borehole Geophysical Logs, Aquifer-Isolation Tests, and Water-Quality Data at Site 5 57
T(
[a
Vertical Distribution of Water-Quality Constituents
During each aquifer-isolation test, water samples were col-lected by the USGS for field determinations of water-quality constituents and by TetraTech NUS, Inc., for analysis for VOCs. VOCs detected in water samples collected during aqui-fer-isolation tests are listed in table 21. Acetone, chloroform, and methylene chloride are laboratory or field blank contami-nants. The highest concentrations of 1,1-dichloroethylene (16 µg/L), 1,1-dichloroethane (13 µg/L), cis-1,2-dichloro-ethene (2.4 µg/L), and 1,1,1-trichloroethane (16 µg/L) were
measured in the water sample from interval 3. Concentrations of these constituents were similar in intervals 1 and 2 and in inter-vals 3 and 4. The highest concentration of PCE (4.5 µg/L) and the lowest concentrations of the other constituents were mea-sured in interval 5, the shallowest interval. Concentrations of VOCs generally increased with depth to a maximum in interval 3 and then decreased with depth below interval 3. Specific con-ductance followed the same pattern (table 26). The interval with the highest chlorinated VOC concentration (interval 3) (58 µg/L) had the lowest dissolved oxygen concentration (1.8 mg/L).
able 21. Concentrations of volatile organic compounds detected in water samples collected during aquifer-isolation tests in well 05MW13I MG-2137), July 19-20, 2005, Willow Grove Naval Air Station/Joint Reserve Base, Horsham Township, Montgomery County, Pennsylvania.
Laboratory results were provided by TetraTech NUS, Inc.; ft bls, feet below land surface; µg/L, micrograms per liter; ND, not detected, reporting limit is 5 µg/L for cetone and 1 µg/L for other constituents listed; J, estimated result less than reporting limit; B, constituent detected in blank]
IntervalDepth of sample(ft bls)
1,1-dichloro-
ethene(µg/L)
1,1-dichloro-
ethane(µg/L)
cis-1,2-dichloro-
ethene(µg/L)
1,1,1-trichloro-
ethane(µg/L)
Acetone(µg/L)
Chloro-form
(µg/L)
Methylene chloride
(µg/L)
Toluene(µg/L)
Trichloro-ethylene
(µg/L)
Tetrachloro-ethylene
(µg/L)
5 64.5-76.5 1.6 3.3 0.81J 1.4 12 ND ND 2.1 1.2 4.5
4 100.5-112.5 11 12 2.3 12 ND 1.3 ND .96 J 6.4 1.2
3 128.5-140.4 16 13 2.4 16 12 B 1.3 B 0.59 J 1.2 8.1 1.0
2 151.5-163.5 9.2 9.8 2.0 10 12 B 1.3 B .48 J 9.7 5.4 2.7
1 162-181 9.2 6.4 1.2 5.3 ND ND ND 38 3.8 3.0
Table 22. Selected water-quality constituents measured in the field in water samples collected during aquifer-isolation tests in well 05MW13I (MG-2137), July 19-20, 2005, Willow Grove Naval Air Station/Joint Reserve Base, Horsham Township, Montgomery County, Pennsylvania.
[ft bls, feet below land surface; mg/L, milligrams per liter; µS/cm at 25°C, microsiemens per centimeter at 25 degrees Celsius; C, Celsius; —, not determined}
IntervalDepth of sample(ft bls)
Dissolved oxygen(mg/L)
pH (standard
units)
Specificconductance
(µS/cm at 25°C)
Temperature (degrees C)
5 64.5-76.5 2.4 6.6 226 15.4
4 100.5-112.5 2.9 6.9 308 14.5
3 128.5-140.4 1.8 7.0 338 14.0
2 151.5-163.5 2.7 7.2 331 13.7
1 162-181 — — — —

58 Interpretation of Borehole Geophysical Logs, Sites 1, 3, and 5 at Willow Grove Naval Air Station/Joint Reserve Base
Well 05MW14I (MG-2138)
Well 05MW14I was drilled approximately 495 ft west of the 05MW01 well cluster (fig. 3). It is directly along strike from the 05MW01 well cluster.
Interpretation of Borehole Geophysical Logs
A suite of borehole geophysical logs (fig. 38) was col-lected in well 05MW14I by the USGS on June 27-28, 2005. The caliper log shows the well is 148 ft deep, is cased to 22 ft bls, and major fractures are at 52, 56, 60, 63, and 90 ft bls. The fluid-temperature log shows breaks in slope at about 60 and 83 ft bls. The fluid-resistivity log shows breaks in slope at about 83 and 100 ft bls. The fluid-temperature and fluid-resistivity logs indi-
cate borehole flow and possible water-producing zones at about 60, 82, and 100 ft bls.
Heatpulse-flowmeter measurements were made under nonpumping conditions and while pumping the well at about 0.8 gal/min (table 23). The geophysical logs and heatpulse-flowmeter measurements indicate downward flow in the bore-hole. Water entered the borehole at a rate of 0.1 gal/min through a horizontal fracture at 45 ft bls and flowed downward. Some of the water exited the borehole through a small vertical fracture at 81 ft bls. Additional water entered the borehole through a verti-cal fracture at 100 ft bls and flowed downward. Water exited the borehole through a horizontal fracture at the bottom of the borehole. Well 05MW14I was screened later from 36 to 66 ft bls to monitor the water-producing fractures at 45-64 ft bls (fig. 39A) and from 128-148 ft bls to monitor the water-receiv-ing fracture at the bottom of the borehole (fig. 39B).
Table 23. Heatpulse-flowmeter measurements made in well 05MW14I (MG-2138), Willow Grove Naval Air Station/Joint Reserve Base, Horsham Township, Montgomery County, Pennsylvania, June 27, 2005.
[—, no data]
Depth Nonpumping measurements Pumping measurements
(feet below land surface)
Flow Flow(gallon per minute) direction
1Relative flow Pumping rate(gallon per minute) (gallon per minute)
33 0 — — —
40 — — — —
49 — — 0.63 0.81
50 .10 Down — —
58 .07 Down .63 .81
79 .10 Down .70 .81
87 .07 Down 2.14 .82
97 — — .61 .82
110 .15 Down .65 .82
122 .26 Down .64 .82
130 .25 Down .69 .81
144 .23 Down .52 .79
1Upward flow.2Poor diverter seal.

Interpretation of Borehole Geophysical Logs, Aquifer-Isolation Tests, and Water-Quality Data at Site 5 59
DEPTH, IN FEET BELOW LAND SURFACE
0 20 40 60 80 100
120
140
160
89
100
100
200
300
040
080
01,
200
10.5
11.0
11.5
1618
2022
24
CA
SIN
G
CA
LIP
ER
LO
G H
OLE
DIA
ME
TE
R, I
N IN
CH
ES
NA
TU
RA
L G
AM
MA
,IN
CO
UN
TS
PE
RS
EC
ON
D
SIN
GLE
-PO
INT
RE
SIS
TAN
CE
,IN
OH
MS
FLU
ID T
EM
PE
RA
TU
RE
,IN
DE
GR
EE
S C
ELS
IUS
FLU
ID R
ES
IST
IVIT
Y,IN
OH
M-M
ET
ER
S
Figu
re 3
8. B
oreh
ole
geop
hysi
cal l
ogs
for w
ell 0
5MW
14I (
MG-
2138
), W
illow
Gro
ve N
aval
Air
Stat
ion/
Join
t Res
erve
Bas
e, H
orsh
am T
owns
hip,
Mon
tgom
ery
Coun
ty,
Penn
sylv
ania
, Jun
e 27
, 200
5.
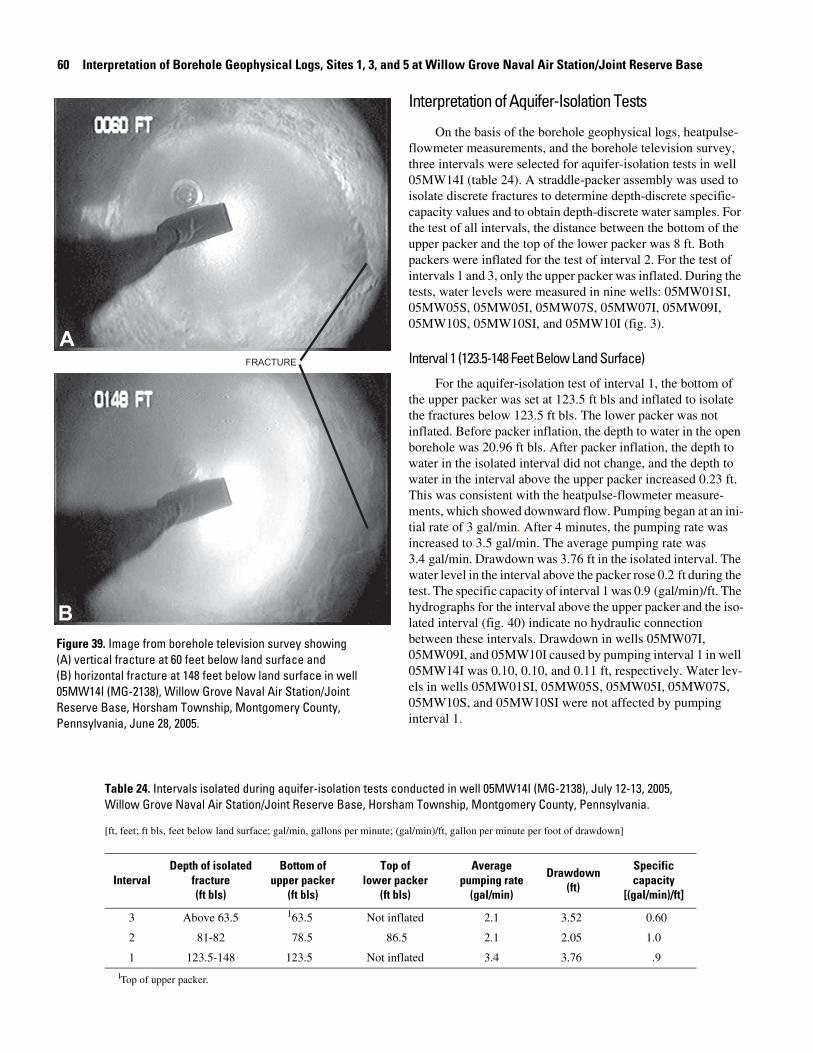
60 Interpretation of Borehole Geophysical Logs, Sites 1, 3, and 5 at Willow Grove Naval Air Station/Joint Reserve Base
Interpretation of Aquifer-Isolation Tests
On the basis of the borehole geophysical logs, heatpulse-flowmeter measurements, and the borehole television survey, three intervals were selected for aquifer-isolation tests in well 05MW14I (table 24). A straddle-packer assembly was used to isolate discrete fractures to determine depth-discrete specific-capacity values and to obtain depth-discrete water samples. For the test of all intervals, the distance between the bottom of the upper packer and the top of the lower packer was 8 ft. Both packers were inflated for the test of interval 2. For the test of intervals 1 and 3, only the upper packer was inflated. During the tests, water levels were measured in nine wells: 05MW01SI, 05MW05S, 05MW05I, 05MW07S, 05MW07I, 05MW09I, 05MW10S, 05MW10SI, and 05MW10I (fig. 3).
Interval 1 (123.5-148 Feet Below Land Surface)
For the aquifer-isolation test of interval 1, the bottom of the upper packer was set at 123.5 ft bls and inflated to isolate the fractures below 123.5 ft bls. The lower packer was not inflated. Before packer inflation, the depth to water in the open borehole was 20.96 ft bls. After packer inflation, the depth to water in the isolated interval did not change, and the depth to water in the interval above the upper packer increased 0.23 ft. This was consistent with the heatpulse-flowmeter measure-ments, which showed downward flow. Pumping began at an ini-tial rate of 3 gal/min. After 4 minutes, the pumping rate was increased to 3.5 gal/min. The average pumping rate was 3.4 gal/min. Drawdown was 3.76 ft in the isolated interval. The water level in the interval above the packer rose 0.2 ft during the test. The specific capacity of interval 1 was 0.9 (gal/min)/ft. The hydrographs for the interval above the upper packer and the iso-lated interval (fig. 40) indicate no hydraulic connection between these intervals. Drawdown in wells 05MW07I, 05MW09I, and 05MW10I caused by pumping interval 1 in well 05MW14I was 0.10, 0.10, and 0.11 ft, respectively. Water lev-els in wells 05MW01SI, 05MW05S, 05MW05I, 05MW07S, 05MW10S, and 05MW10SI were not affected by pumping interval 1.
FRACTURE
A
BFigure 39. Image from borehole television survey showing (A) vertical fracture at 60 feet below land surface and (B) horizontal fracture at 148 feet below land surface in well 05MW14I (MG-2138), Willow Grove Naval Air Station/Joint Reserve Base, Horsham Township, Montgomery County, Pennsylvania, June 28, 2005.
Table 24. Intervals isolated during aquifer-isolation tests conducted in well 05MW14I (MG-2138), July 12-13, 2005, Willow Grove Naval Air Station/Joint Reserve Base, Horsham Township, Montgomery County, Pennsylvania.
[ft, feet; ft bls, feet below land surface; gal/min, gallons per minute; (gal/min)/ft, gallon per minute per foot of drawdown]
IntervalDepth of isolated
fracture(ft bls)
Bottom of upper packer
(ft bls)
Top of lower packer
(ft bls)
Average pumping rate
(gal/min)
Drawdown (ft)
Specific capacity
[(gal/min)/ft]
3 Above 63.5 163.5 Not inflated 2.1 3.52 0.60
2 81-82 78.5 86.5 2.1 2.05 1.0
1 123.5-148 123.5 Not inflated 3.4 3.76 .9
1Top of upper packer.

Interpretation of Borehole Geophysical Logs, Aquifer-Isolation Tests, and Water-Quality Data at Site 5 61
19 20 21 22 23 24 25 26 27 10:0
010
:15
10:3
010
:45
11:0
011
:15
11:3
011
:45
12:0
012
:15
12:3
012
:45
JULY
13,
200
5
DEPTH TO WATER, IN FEET BELOW LAND SURFACE
PU
MP
ON
PU
MP
OF
F
STA
RT
UP
PE
RP
AC
KE
R IN
FLA
TIO
NS
TAR
T U
PP
ER
PA
CK
ER
DE
FLA
TIO
N
SE
DIM
EN
T F
ILT
ER
CLO
GG
ED
WA
TE
R L
EV
EL
IN IN
TE
RV
AL
AB
OV
E P
AC
KE
RS
WA
TE
R L
EV
EL
IN IS
OLA
TE
D IN
TE
RV
AL
WA
TE
R L
EV
EL
IN W
ELL
05M
W07
I
WA
TE
R L
EV
EL
IN W
ELL
05M
W09
I
WA
TE
R L
EV
EL
IN W
ELL
05M
W10
I
WA
TE
R-Q
UA
LIT
YS
AM
PLE
CO
LLE
CT
ED
Figu
re 4
0. H
ydro
grap
hs fr
om a
quife
r-is
olat
ion
test
of i
nter
val 1
(123
.5-1
48 fe
et b
elow
land
sur
face
) in
wel
l 05M
W14
I (M
G-2
138)
, Will
ow G
rove
Nav
al A
ir St
atio
n/Jo
int
Rese
rve
Base
, Hor
sham
Tow
nshi
p, M
ontg
omer
y Co
unty
, Pen
nsyl
vani
a.

62 Interpretation of Borehole Geophysical Logs, Sites 1, 3, and 5 at Willow Grove Naval Air Station/Joint Reserve Base
Interval 2 (78.5-86.5 Feet Below Land Surface)
For the aquifer-isolation test of interval 2, the bottom of the upper packer and the top of the lower packer were set at 78.5 and 86.5 ft bls, respectively, to isolate the fracture zone at 81-82 ft bls. Before packer inflation, the depth to water in the open borehole was 20.90 ft bls. After packer inflation, the depth to water in the isolated interval increased 0.17 ft, the depth to water in the interval below the packers decreased 0.02 ft, and the depth to water in the interval above the packers increased 0.34 ft. This was consistent with the heatpulse-flowmeter mea-surements, which showed downward flow. The average pump-ing rate was 2.1 gal/min. Drawdown was 2.05 ft in the isolated interval, 0.09 ft in the interval below the packers, and 0.07 ft in the interval above the packers. The specific capacity of interval 2 was 1.0 (gal/min)/ft. The hydrographs for the interval above the packers, the isolated interval, and the interval below the packers (fig. 41) indicate little hydraulic connection between the isolated interval and the intervals above and below the pack-ers. Drawdown in well 05MW05S caused by pumping interval 2 in well 05MW14I was 0.06 ft. Water levels in wells 05MW01SI, 05MW05I, 05MW07S, 05MW07I, 05MW09I, 05MW10S, 05MW10SI, and 05MW10I were not affected by pumping interval 2.
Interval 3 (45-63.5 Feet Below Land Surface)
For the aquifer-isolation test of interval 3, only the upper packer was inflated. Initially, the top of the upper packer was set at 35.5 ft bls to isolate the fracture at 22-26 ft bls, but this inter-val was rapidly pumped dry and did not recover, indicating the fractures above 35.5 ft bls were not water bearing. The packer was then lowered so that the top of the upper packer was set at 63.5 ft bls, isolating the fractures above 63.5 ft bls. Because no water was produced above 35.5 ft bls, interval 3 isolates water-producing fractures between 45 and 63.5 ft bls. Before packer inflation, the depth to water in the open borehole was 20.93 ft bls. After packer inflation, the depth to water in the iso-lated interval above the packer increased 0.02 ft, and the depth to water in the interval below the packer increased 0.08 ft. This was not consistent with the heatpulse-flowmeter measurements, which showed downward flow. The average pumping rate was 2.1 gal/min. Drawdown was 3.52 ft in the isolated interval and 0.43 ft in the interval below the packer. The specific capacity of interval 3 was 0.6 (gal/min)/ft. The hydrographs for the isolated interval above the packer and the interval below the packer (fig. 42) indicate a hydraulic connection between these inter-vals. Drawdown in well 05MW05S caused by pumping interval 3 was 0.05 ft. Water levels in wells 05MW01SI, 05MW05I, 05MW07S, 05MW07I, 05MW09I, 05MW10S, 05MW10SI, and 05MW10I were not affected by pumping interval 3.

Interpretation of Borehole Geophysical Logs, Aquifer-Isolation Tests, and Water-Quality Data at Site 5 63
19 20 21 22 23 24 25 26 27 28 29 14:1
514
:30
14:4
515
:00
15:1
515
:30
15:4
516
:00
16:1
516
:30
16:4
517
:00
JULY
12,
200
5
DEPTH TO WATER, IN FEET BELOW LAND SURFACE
WA
TE
R L
EV
EL
IN IN
TE
RV
AL
AB
OV
E P
AC
KE
RS
WA
TE
R L
EV
EL
IN IS
OLA
TE
D IN
TE
RV
AL
WA
TE
R L
EV
EL
IN IN
TE
RV
AL
BE
LOW
PA
CK
ER
S
PU
MP
ON
PU
MP
OF
F
STA
RT
UP
PE
RP
AC
KE
R IN
FLA
TIO
N
STA
RT
LO
WE
R
PA
CK
ER
INF
LAT
ION
STA
RT
UP
PE
RP
AC
KE
R D
EF
LAT
ION
STA
RT
LO
WE
RP
AC
KE
RD
EF
LAT
ION
WA
TE
R-Q
UA
LIT
YS
AM
PLE
CO
LLE
CT
ED
Figu
re 4
1. H
ydro
grap
hs fr
om a
quife
r-is
olat
ion
test
of i
nter
val 2
(78.
5-86
.5 fe
et b
elow
land
sur
face
) in
wel
l 05M
W14
I (M
G-21
38),
Will
ow G
rove
Nav
al A
ir St
atio
n/Jo
int
Rese
rve
Base
, Hor
sham
Tow
nshi
p, M
ontg
omer
y Co
unty
, Pen
nsyl
vani
a.

64 Interpretation of Borehole Geophysical Logs for Sites 1, 3, and 5 at Willow Grove Naval Air Station/Joint Reserve Base
20 21 22 23 24 25 2614
:00
14:1
514
:30
14:4
515
:00
15:1
515
:30
15:4
516
:00
16:1
516
:30
16:4
517
:00
17:1
517
:30
JULY
13,
200
5
DEPTH TO WATER, IN FEET BELOW LAND SURFACE
WA
TE
R L
EV
EL
IN IS
OLA
TE
D IN
TE
RV
AL
WA
TE
R L
EV
EL
IN IN
TE
RV
AL
BE
LOW
PA
CK
ER
SE
DIM
EN
T F
ILT
ER
CLO
GG
ED
PU
MP
ON
PU
MP
OF
F
STA
RT
UP
PE
RP
AC
KE
R IN
FLA
TIO
N
STA
RT
UP
PE
RP
AC
KE
R D
EF
LAT
ION
WA
TE
R-Q
UA
LIT
YS
AM
PLE
CO
LLE
CT
ED
Figu
re 4
2. H
ydro
grap
hs fr
om a
quife
r-is
olat
ion
test
of i
nter
val 3
(45-
63.5
feet
bel
ow la
nd s
urfa
ce) i
n w
ell 0
5MW
14I (
MG
-213
8), W
illow
Gro
ve N
aval
Air
Stat
ion/
Join
t Re
serv
e Ba
se, H
orsh
am T
owns
hip,
Mon
tgom
ery
Coun
ty, P
enns
ylva
nia.

Interpretation of Borehole Geophysical Logs, Aquifer-Isolation Tests, and Water-Quality Data at Site 5 65
Vertical Distribution of Water-Quality Constituents
During each aquifer-isolation test, water samples were col-lected by the USGS for field determinations of water-quality constituents and by TetraTech NUS, Inc., for analysis for VOCs. VOCs detected in water samples collected during aqui-fer-isolation tests are listed in table 25. Methylene chloride
probably is a laboratory contaminant. Concentrations of VOCs except toluene and cis-1,3-dichloropropene were greatest in interval 2 (table 25). Concentrations of VOCs except toluene were greater in interval 1 than in interval 3 (table 25). Concen-trations of dissolved oxygen and specific conductance were greater in interval 2 than in interval 3 (table 26).
Table 25. Concentrations of volatile organic compounds detected in water samples collected during aquifer-isolation tests in well 05MW14I (MG-2138), July 12-13, 2005, Willow Grove Naval Air Station/Joint Reserve Base, Horsham Township, Montgomery County, Pennsylvania.
[Laboratory results were provided by TetraTech NUS, Inc.; ft bls, feet below land surface; µg/L, micrograms per liter; ND, not detected, reporting limit is 1 µg/L; J, estimated result less than reporting limit; B, constituent detected in blank]
IntervalDepth of sample(ft bls)
1,1-dichloro-
ethene(µg/L)
1,1-dichloro-
ethane(µg/L)
cis-1,2-dichloro-
ethene(µg/L)
cis-1,3-dichloro-propene
(µg/L)
1,1,1-trichloro-
ethane(µg/L)
1,1,2-trichloro-
ethane(µg/L)
Methylene chloride
(µg/L)
Trichloro-ethylene
(µg/L)
Tetrachloro-ethylene
(µg/L)
Toluene(µg/L)
3 45-63.5 12 6.7 1.1 0.42 J 13 ND 0.52 J 4.8 0.35 J 27
2 78.5-86.5 28 16 2.7 ND 33 0.42 J .61 JB 11 .72 J 2.6
1 123.5-148 17 9.2 1.6 ND 18 .30 J ND 7.7 .58 J 2.2
Table 26. Selected water-quality constituents measured in the field in water samples collected during aquifer-isolation tests in well 05MW14I (MG-2138), July 12-13, 2005, Willow Grove Naval Air Station/Joint Reserve Base, Horsham Township, Montgomery County, Pennsylvania.
[ft bls, feet below land surface; mg/L, milligrams per liter; µS/cm at 25°C, microsiemens per centimeter at 25 degrees Celsius; C, Celsius; —, no data]
IntervalDepth of sample(ft bls)
Dissolved oxygen(mg/L)
pH (standard
units)
Specificconductance
(µS/cm at 25°C)
Temperature (degrees C)
3 45-63.5 0.8 6.4 273 13.3
2 78.5-86.5 1.0 6.3 332 13.2
1 123.5-148 — — — —

66 Interpretation of Borehole Geophysical Logs, Sites 1, 3, and 5 at Willow Grove Naval Air Station/Joint Reserve Base
Well 05MW15I (MG-2139)
Well 05MW15I was drilled approximately 955 ft west of the 05MW01 well cluster (fig. 3). It is directly along strike from the 05MW01 well cluster.
Interpretation of Borehole Geophysical Logs
A suite of borehole geophysical logs (fig. 43) was col-lected in well 05MW15I by the USGS on June 28, 2005. The caliper log shows the well is 150 ft deep, cased to 31 ft bls, and major fractures are at 37, 43, 64-78, and 142-143 ft bls. The fluid-temperature log shows a change in slope between about
68-81 and 111-115 ft bls. The fluid-resistivity log shows sharp breaks in slope at about 59 and 143 ft bls. The fluid-temperature and fluid-resistivity logs indicate possible water-producing zones at these depths.
Heatpulse-flowmeter measurements were made under nonpumping conditions and while pumping the well at 0.65-0.7 gal/min (table 27). Heatpulse-flowmeter measurements made under nonpumping conditions indicated no borehole flow. The geophysical logs and heatpulse-flowmeter measure-ments indicate water-producing zones at 37, 64-76, and 142-143 ft bls. Well 05MW15I was screened later from 140 to 150 ft bls to monitor the principle water-producing fracture at 142-143 ft bls (fig. 44).
Table 27. Heatpulse-flowmeter measurements made in well 05MW15I (MG-2139), Willow Grove Naval Air Station/Joint Reserve Base, Horsham Township, Montgomery County, Pennsylvania, June 28, 2005.
[—, no data]
Depth Nonpumping measurements Pumping measurements
(feet below land surface)
Flow Flow(gallon per minute) direction
1Relative flow Pumping rate(gallon per minute) (gallon per minute)
34 0 — 0.72 0.72
40 0 — .53 .71
52 0 — .91 .71
61 0 — .53 .71
82 0 — .14 .70
96 0 — .11 .70
110 0 — .11 .67
124 0 — .16 .65
132 — — .09 .65
137.4 0 — — —
1Upward flow.
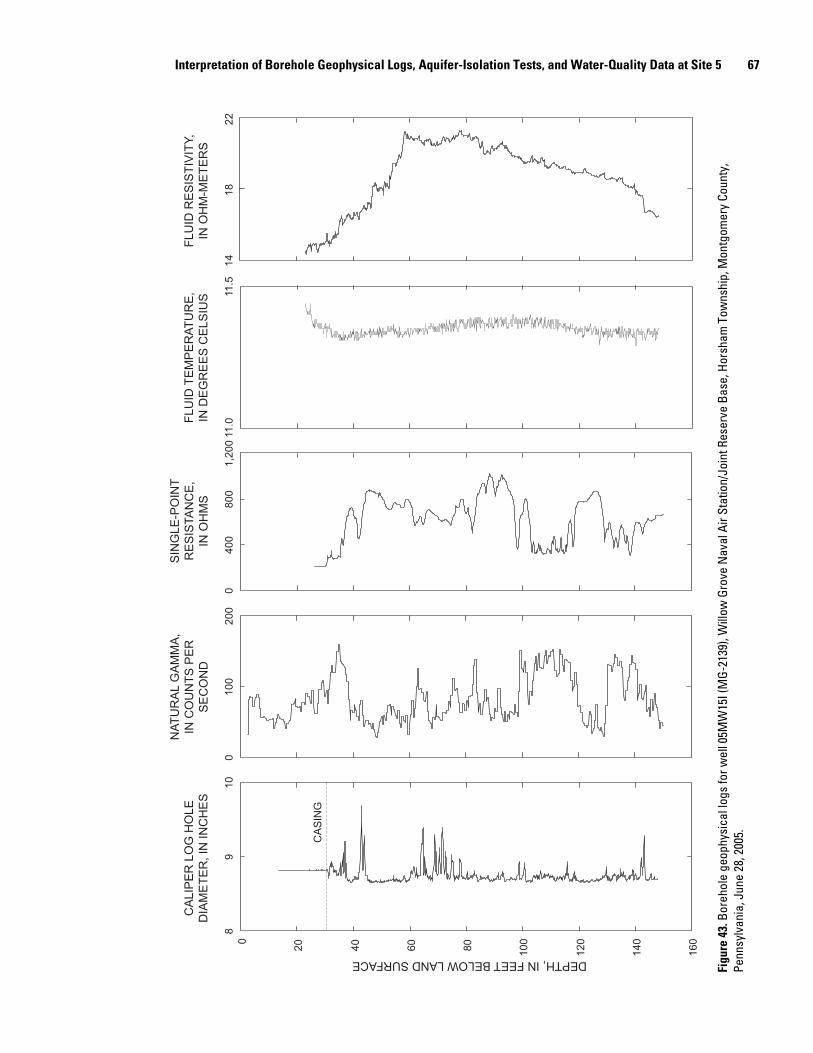
Interpretation of Borehole Geophysical Logs, Aquifer-Isolation Tests, and Water-Quality Data at Site 5 67
CA
LIP
ER
LO
G H
OLE
DIA
ME
TE
R, I
N IN
CH
ES
NA
TU
RA
L G
AM
MA
,IN
CO
UN
TS
PE
RS
EC
ON
D
SIN
GLE
-PO
INT
RE
SIS
TAN
CE
,IN
OH
MS
FLU
ID T
EM
PE
RA
TU
RE
,IN
DE
GR
EE
S C
ELS
IUS
FLU
ID R
ES
IST
IVIT
Y,IN
OH
M-M
ET
ER
S
DEPTH, IN FEET BELOW LAND SURFACE
0
20 40 60 80 100
120
140
160
89
100
100
200
040
080
01,
200
11.0
11.5
1418
22
CA
SIN
G
Figu
re 4
3. B
oreh
ole
geop
hysi
cal l
ogs
for w
ell 0
5MW
15I (
MG
-213
9), W
illow
Gro
ve N
aval
Air
Stat
ion/
Join
t Res
erve
Bas
e, H
orsh
am T
owns
hip,
Mon
tgom
ery
Coun
ty,
Penn
sylv
ania
, Jun
e 28
, 200
5.

68 Interpretation of Borehole Geophysical Logs, Sites 1, 3, and 5 at Willow Grove Naval Air Station/Joint Reserve Base
Interpretation of Aquifer-Isolation Tests
On the basis of the borehole geophysical logs and the bore-hole television survey, four intervals were selected for aquifer-isolation tests in well 05MW15I (table 28). A straddle-packer assembly was used to isolate discrete fractures to determine depth-discrete specific-capacity values and to obtain depth-dis-crete water samples. For the test of interval 2, the distance between the bottom of the upper packer and the top of the lower packer was 8 ft. For the test of interval 3, the distance between the bottom of the upper packer and the top of the lower packer
was 15.8 ft. For the tests of intervals 1 and 4, only the upper packer was inflated. During the tests, water levels were mea-sured in wells 05MW13I and 05MW14I.
Interval 1 (134.5-150 Feet Below Land Surface)
For the aquifer-isolation test of interval 1, the bottom of the upper packer was set at 134.5 ft bls to isolate the fracture zone at 142-143 ft bls. Before packer inflation, the depth to water in the open borehole was 16.08 ft bls. After packer infla-tion, the depth to water in the isolated interval below the packer decreased 0.07 ft, and the depth to water in the interval above the upper packer increased 0.16 ft. Pumping began at an initial rate of 1.8 gal/min, and 4 minutes later, the pumping rate was increased to 2.7 gal/min. The average pumping rate was 2.6 gal/min. Drawdown was 3.10 ft in the isolated interval and 0.01 ft in the interval above the upper packer. The specific capacity of interval 1 was 0.84 (gal/min)/ft. The hydrographs for the interval above the upper packer and the isolated interval (fig. 45) indicate no hydraulic connection between these inter-vals. Drawdown in wells 05MW13I and 05MW14I caused by pumping interval 1 in well 05MW15I was 0.08 and 0.10 ft, respectively.
Interval 2 (124.5-132.5 Feet Below Land Surface)
For the aquifer-isolation test of interval 2, the bottom of the upper packer and the top of the lower packer were set at 124.5 and 132.5 ft bls, respectively, to isolate the fracture zone at 130 ft bls. The yield of this interval was approximately 0.4 gal/min. It was pumped dry and allowed to recover over-night. It was pumped dry again the next morning, allowed to recover, and pumped again to collect a water sample. Water lev-els in wells 05MW13I and 05MW14I were not affected by pumping interval 2.
FRACTURE
Figure 44. Image from borehole television survey showing vertical fracture at 142 feet below land surface in well 05MW15I (MG-2139), Willow Grove Naval Air Station/Joint Reserve Base, Horsham Township, Montgomery County, Pennsylvania, June 27, 2005.
Table 28. Intervals isolated during aquifer-isolation tests conducted in well 05MW15I (MG-2139), July 14-15, 2005, Willow Grove Naval Air Station/Joint Reserve Base, Horsham Township, Montgomery County, Pennsylvania.
[ft, feet; ft bls, feet below land surface; gal/min, gallons per minute; (gal/min)/ft, gallons per minute per foot of drawdown; —, no data]
IntervalDepth of isolated
fracture (ft bls)
Bottom of upper packer
(ft bls)
Top of lower packer
(ft bls)
Average pumping rate
(gal/min)
Drawdown (ft)
Specific capacity
[(gal/min)/ft]
4 Above 46.5 146.5 Not inflated 0.3 — —
3 62-76 61.5 77.3 3.6 2.58 1.4
2 130 124.5 132.5 0.4 — —
1 142-143 134.5 Not inflated 2.6 3.10 0.84
1Top of packer.

Interpretation of Borehole Geophysical Logs, Aquifer-Isolation Tests, and Water-Quality Data at Site 5 69
10:3
010
:45
11:0
011
:15
11:3
011
:45
12:0
012
:15
12:3
012
:45
13:0
013
:15
13:3
0
05M
W14
I
14 15 16 17 18 19 20 21
21.0
21.1
21.2
25.2
25.3
25.4
05M
W13
I
JULY
15,
200
5
DEPTH TO WATER, IN FEET BELOW LAND SURFACE
PU
MP
ON
PU
MP
OF
F
STA
RT
UP
PE
RP
AC
KE
R IN
FLA
TIO
N
STA
RT
UP
PE
RP
AC
KE
R D
EF
LAT
ION
INC
RE
AS
E P
UM
PIN
G R
AT
E
WA
TE
R L
EV
EL
IN IN
TE
RV
AL
AB
OV
E P
AC
KE
RS
WA
TE
R L
EV
EL
IN IS
OLA
TE
D IN
TE
RV
AL
WA
TE
R-Q
UA
LIT
YS
AM
PLE
CO
LLE
CT
ED
Figu
re 4
5. H
ydro
grap
hs fr
om a
quife
r-is
olat
ion
test
of i
nter
val 1
(134
.5-1
50 fe
et b
elow
land
sur
face
) in
wel
l 05M
W15
I (M
G-21
39),
Will
ow G
rove
Nav
al
Air S
tatio
n/Jo
int R
eser
ve B
ase,
Hor
sham
Tow
nshi
p, M
ontg
omer
y Co
unty
, Pen
nsyl
vani
a.

70 Interpretation of Borehole Geophysical Logs, Sites 1, 3, and 5 at Willow Grove Naval Air Station/Joint Reserve Base
Interval 3 (61.5-77.3 Feet Below Land Surface)
For the aquifer-isolation test of interval 3, the bottom of the upper packer and the top of the lower packer were set at 61.5 and 77.3 ft bls, respectively, to isolate the fracture zone at 62-76 ft bls. Before packer inflation, the depth to water in the open borehole was 14.98 ft bls. After packer inflation, the depth to water in the isolated interval increased 0.17 ft, the depth to water in the interval below the packers decreased 0.10 ft, and the depth to water in the interval above the packers increased 0.35 ft. The rise in water level in the interval above the packers was caused by recharge from heavy rain during the 2 days prior to the test. The average pumping rate was 3.6 gal/min. Draw-down was 2.58 ft in the isolated interval, 0.11 ft in the interval below the packers, and 0.50 ft in the interval above the packers. The specific capacity of interval 3 was 1.4 (gal/min)/ft. The hydrographs for the interval above the packers, the isolated interval, and the interval below the packers (fig. 46) indicate a weak hydraulic connection between the isolated interval and the intervals above and below the packers. Water levels in wells 05MW13I and 05MW14I were not affected by pumping inter-val 3.
Interval 4 (31-46.5 Feet Below Land Surface)
For the aquifer-isolation test of interval 4, the top of the upper packer was set at 46.5 ft bls, and the bottom packer was not inflated. This isolated the fracture zones at 36-38 and 42-44 ft bls. The yield of this interval was approximately 0.3 gal/min. It was pumped dry, allowed to recover, and pumped again to obtain a water sample. Water levels in wells 05MW13I and 05MW14I were not affected by pumping inter-val 4.
Vertical Distribution of Water-Quality Constituents
During each aquifer-isolation test, water samples were col-lected by TetraTech NUS, Inc., for analysis for VOCs. VOCs detected in water samples collected during aquifer-isolation tests are listed in table 29. Chloroform and methylene chloride are laboratory or field blank contaminants. Concentrations of VOCs except toluene were less than 2 µg/L (table 29). Con-centrations of toluene ranged from 0.63 µg/L in interval 3 to 77 µg/L in interval 2. The highest concentrations of most of the other VOCs were in the water sample from interval 1. Field determinations of water-quality constituents by the USGS were made only for interval 1. The dissolved oxygen concentration was 1.9 mg/L, pH was 6.3, specific conductance was 297 µS/cm, and the temperature was 13.1° C.
Table 29. Concentrations of volatile organic compounds detected in water samples collected during aquifer-isolation tests in well 05MW15I (MG-2139), July 14-18, 2005, Willow Grove Naval Air Station/Joint Reserve Base, Horsham Township, Montgomery County, Pennsylvania.
[Laboratory results were provided by TetraTech NUS, Inc.; ft bls, feet below land surface; µg/L, micrograms per liter; ND, not detected, reporting limit is 1 µg/L; D, determined from diluted sample; J, estimated result less than reporting limit; B, constituent detected in blank]
IntervalDepth of sample(ft bls)
1,1-dichloro-
ethene(µg/L)
1,1-dichloro-
ethane(µg/L)
1,1,1-trichloro-
ethane(µg/L)
Chloroform(µg/L)
Methylene chloride
(µg/L)
Methylcyclo-hexane(µg/L)
Toluene(µg/L)
Trichloro-ethylene
(µg/L)
m- and p-xlyenes(µg/L)
4 31-46.5 ND ND ND ND ND ND 45 D ND ND
3 61.5-77.3 ND ND 0.53 J 1.3 ND ND .63 J ND ND
2 124.5-132.5 0.77 J 0.34 J .48 J ND 0.56 JB 0.50 J 77 D 0.30 J 0.34 J
1 134.5-150 1.8 .75 J 1.0 ND ND ND 2.8 .62 J ND

Interpretation of Borehole Geophysical Logs, Aquifer-Isolation Tests, and Water-Quality Data at Site 5 71
14 15 16 17 18 198:
158:
308:
459:
009:
159:
309:
4510
:00
10:1
510
:30
10:4
511
:00
11:1
511
:30
11:4
512
:00
JULY
18,
200
5
DEPTH TO WATER, IN FEET BELOW LAND SURFACE
WA
TE
R L
EV
EL
IN IN
TE
RV
AL
AB
OV
E P
AC
KE
RS
WA
TE
R L
EV
EL
IN IS
OLA
TE
D IN
TE
RV
AL
WA
TE
R L
EV
EL
IN IN
TE
RV
AL
BE
LOW
PA
CK
ER
S
PU
MP
ON
PU
MP
OF
F
STA
RT
UP
PE
RP
AC
KE
R IN
FLA
TIO
N
STA
RT
LO
WE
R
PA
CK
ER
INF
LAT
ION
STA
RT
UP
PE
RP
AC
KE
R D
EF
LAT
ION
STA
RT
LO
WE
RP
AC
KE
RD
EF
LAT
ION
INC
RE
AS
E P
UM
PIN
G R
AT
EW
AT
ER
-QU
ALI
TY
SA
MP
LEC
OLL
EC
TE
D
Figu
re 4
6. H
ydro
grap
hs fr
om a
quife
r-is
olat
ion
test
of i
nter
val 3
(61.
5-77
.3 fe
et b
elow
land
sur
face
) in
wel
l 05M
W15
I (M
G-21
39),
Will
ow G
rove
Nav
al A
ir St
atio
n/Jo
int
Rese
rve
Base
, Hor
sham
Tow
nshi
p, M
ontg
omer
y Co
unty
, Pen
nsyl
vani
a.

72 Interpretation of Borehole Geophysical Logs for Sites 1, 3, and 5 at Willow Grove Naval Air Station/Joint Reserve Base
Summary and Conclusions
This study was done by U.S. Geological Survey (USGS) in cooperation with the U.S. Navy at the Willow Grove Naval Air Station/Joint Reserve Base (NAS/JRB) in Horsham Township, Montgomery County, Pa., in support of hydrogeological inves-tigations conducted by the Navy to address ground-water con-tamination. The study presents an interpretation of borehole geophysical logs, heatpulse-flowmeter measurements, aquifer-isolation tests, and water-quality data for seven wells. The Wil-low Grove NAS/JRB is underlain by the Stockton Formation, which consists of sedimentary rocks of Triassic age. At the base, bedding in the Stockton Formation strikes N. 76° E. and dips about 7° NW. The rocks of the Stockton Formation form a complex, heterogeneous aquifer with partially connected zones of high permeability. Ground water in the unweathered part of the Stockton Formation primarily flows through a network of interconnecting secondary openings—bedding-plane fractures and joints. Wells generally penetrate several major water-pro-ducing zones with different hydraulic properties. Each water-producing zone usually has a different hydraulic head (water level) than adjacent zones. The head in an open-hole well is the composite of the heads in the water-producing zones pene-trated. This can cause heads in some wells to be different than heads in adjacent wells of different depths. Where differences in head exist between water-producing zones, water in the well bore flows in the direction of decreasing head.
Borehole geophysical logging, heatpulse-flowmeter mea-surements, borehole television surveys, and aquifer-isolation tests were made in seven boreholes ranging from 70 to 350 ft deep. The aquifer-isolation tests isolated 30 discrete fractures or fracture zones in the seven boreholes for collection of depth-discrete hydraulic data and water-quality samples. An upward vertical hydraulic gradient was measured in one well (well 05MW13I), a downward vertical hydraulic gradient was mea-sured in four wells (wells 01MW10, 03MW08, 05MW12S, and 05MW14I), both an upward and a downward vertical hydraulic gradient were measured in one well (well 01MW09), and no flow was measurable in one well (well 05MW15I). Of the 30 fractures identified as potentially water producing, 26 fractures (87 percent) produced more than 1 gallon per minute (gal/min) of water. The specific capacity of the isolated intervals produc-ing more than 1 gal/min ranged from 0.02 to 5.2 gallons per minute per foot ([gal/min]/ft). There was no relation between specific capacity and depth of the fracture.
At Site 1, wells 01MW09 and 01MW10 were tested. The water level in these wells is greatly affected by the pumping of the base supply wells. Well 01MW09 was drilled to 150 feet (ft) and cased to 29 ft below land surface (bls). Water entered the borehole through a large vertical fracture at 59-66 ft bls and flowed both upward and downward. Water flowing upward exited the borehole through fractures above 44 ft bls, and water flowing downward exited through a horizontal fracture at 125 ft bls. Three intervals were selected for aquifer-isolation tests. Interval 3 (29-50 ft bls) produced little water. Interval 2
(57-67 ft bls) had a higher specific capacity [0.44 (gal/min)/ft] than interval 1 (120.5-131.5 ft bls), which had a specific capac-ity of 0.02 (gal/min)/ft. Concentrations of PCE (tetrachloro- ethylene) (4.1 µg/L) and TCE (trichlororethylene) (1.5 µg/L) above the laboratory reporting limit were detected only in the water sample from interval 1. Interval 1 is in lithologic unit H, which had the greatest PCE concentration in well SW-1.
Well 01MW10 was drilled to 350 ft and cased to 39 ft bls. All measured flow was downward, except for the measurement made at 316.2 ft bls, which was upward. Water entered the borehole through fractures at 43, 55-56, 71-86, 110, 153, and 215 ft bls. Water exited the borehole through a horizontal fracture at 310 ft bls. Eight intervals were selected for aquifer-isolation tests. Specific capacity ranged from 0.05 to 3.0 (gal/min)/ft. The highest concentrations of PCE (62 µg/L), TCE (4.5 µg/L), and cis-1,2-dichloroethene (3.4 µg/L) were in water samples collected from interval 5 (148.7-159.7 ft bls). Interval 5 straddles lithologic units F and G. Concentrations of VOCs from intervals 1 (305-316 ft bls) and 2 (263-274 ft bls) were similar. The second greatest concentrations of PCE were from intervals 1 and 2 (both 30 µg/L). Intervals 1 and 2 are in lithologic units M and L, respectively. No VOCs were detected in the shallowest interval (38-62.7 ft bls). The water sample from interval 5 had the lowest temperature (13.0 °C) and con-centration of dissolved oxygen (1.9 mg/L) and the highest con-centration of VOCs, pH (7.2), and specific conductance (855 µS/cm) of the intervals sampled.
At Site 3, well 03MW08 was tested. Well 03MW08 was drilled to 222 ft and cased to 38 ft bls. Water entered the bore-hole through the fracture zone above 70 ft bls and flowed down-ward. Additional water entered the borehole through a horizon-tal fracture at 80 ft bls and flowed downward. Water flowing downward exited the borehole through horizontal fractures at 121-124, 138, and 169 ft bls. Six intervals were selected for aquifer-isolation tests. Specific capacity ranged from 0.04 to 1.5 (gal/min)/ft. Concentrations of VOCs were less than 10 µg/L. The most prevalent compound at Site 3 was 1,1-dichloroethane; concentrations were as great as 9.3 µg/L. The concentration of most VOCs generally increased with depth to interval 2 (162-173 ft bls). Concentrations of VOCs were highest in interval 2. Concentrations of VOCs in the deep-est interval (interval 1) (21 µg/L) were less than concentrations in interval 2 (31 µg/L). Concentrations of dissolved oxygen generally decreased with depth, and specific conductance and temperature increased with depth. The interval (interval 2) with the highest total VOC concentration also had the lowest dis-solved oxygen concentration (3.2 mg/L).
At Site 5, wells 05MW12S, 05MW13I, 05MW14I, and 05MW15I were tested. Well 05MW12S was drilled to 70 ft and cased to 17 ft bls. Water entered the borehole through a hori-zontal fracture at 32 ft bls and flowed downward. Water exited the borehole at 65 ft bls through a long vertical fracture. Two intervals were selected for aquifer-isolation tests. Specific capacity was 2.3 (gal/min)/ft for interval 1 (51.5-70 ft bls) and 3 (gal/min)/ft for interval 2 (17-44.5 ft bls). The concentration of toluene was greater in the shallower interval 2 (4.1 µg/L) than

Acknowledgments 73
in the deeper interval 1 (0.86 µg/L). PCE (0.38 µg/L) and 1,1-dichloroethane (0.46 µg/L) were detected only in the water sample from interval 1.
Well 05MW13I was drilled to 181 ft and cased to 29 ft bls. Water entered the borehole through a horizontal fracture at 159 ft bls and flowed upward. Some water exited the borehole through a vertical fracture zone at 129-139 ft bls. Most of the water exited the borehole through horizontal fractures at 105 and 73 ft bls. Five intervals were selected for aquifer-isolation tests. Specific capacity ranged from 1.3 to 5 (gal/min)/ft. The highest concentrations of VOCs (58 µg/L) were measured in interval 3 (128.5-140.4 ft bls). Concentrations of VOCs were similar in intervals 2 (151.5-163.5 ft bls) and 3 and in intervals 4 (100.5-112.5 ft bls) and 5 (64.5-76.5 ft bls). The lowest con-centrations of VOCs were measured in interval 5 (15 µg/L), the shallowest interval. Concentrations of VOCs generally increased with depth to a maximum in interval 3 and then decreased with depth below interval 3. Specific conductance followed the same pattern. The interval (interval 3) with the highest total VOC concentration also had the lowest dissolved oxygen concentration (1.8 mg/L).
Well 05MW14I was drilled to 148 ft and cased to 22 ft bls. Water entered the borehole through a horizontal fracture at 45 ft bls and flowed downward. Some of the water exited the borehole through a small vertical fracture at 81 ft bls. Addi-tional water entered the borehole through a vertical fracture at 100 ft bls and flowed downward. Water exited the borehole through a horizontal fracture at the bottom of the borehole (147-148 ft bls). Three intervals were selected for aquifer-isolation tests. Specific capacity ranged from 0.6 to 1 (gal/min)/ft. Con-centrations of VOCs (94 µg/L) were greatest in interval 2 (78.5-86.5 ft bls). Concentrations of chlorinated VOCs were greater in interval 1 (123.5-148 ft bls) (54 µg/L) than in interval 3 (45-63.5 ft bls) (38 µg/L).
Well 05MW15I was drilled to 150 ft and cased to 31 ft bls. No borehole flow was measurable in well 05MW15I. Four intervals were selected for aquifer-isolation tests. Two intervals produced little water. The specific capacity of the other two intervals was 0.84 and 1.4 (gal/min)/ft. Concentrations of VOCs except toluene were less than 2 µg/L. Concentrations of toluene ranged from 0.63 µg/L in interval 3 to 77 µg/L in interval 2. The highest concentrations of most of the other VOCs were in the water sample from interval 1 (134.5-150 ft bls).
PCE was the most prevalent compound at Site 1; concen-trations were as great as 62 µg/L. 1,1-dichloroethane was the most prevalent compound at Site 3; concentrations were as great as 9.3 µg/L. Toluene was the most prevalent compound at Site 5; concentrations were as great as 77 µg/L. For five out of the six wells sampled for field determinations (83 percent), the interval with the lowest dissolved oxygen concentration had the highest total VOC concentration.
Acknowledgments
VOC data used for this study and presented in this report were provided by TetraTech NUS, Inc., and ECOR Solutions, Inc. Borehole geophysical logging was done by Randall Conger of the USGS. Borehole television surveys were made by Philip Bird of the USGS. Aquifer-isolation tests were conducted by Peter Cinotto, Robert Rosman, Leif Olson, Randall Conger, and Philip Bird of the USGS. Critical reviews of this report were completed by Glen Carleton and Randall Conger of the USGS and Kevin Kilmartin of TetraTech NUS, Inc.
References Cited
Brown and Root Environmental, Inc., 1998, Phase II remedial investigation report for NASJRB Willow Grove, Pennsylvania: King of Prussia, Pa. [variously paginated].
Conger, R.W., 1997, Evaluation of geophysical logs, phase I, at Willow Grove Naval Air Station, Montgomery County, Pennsylvania: U.S. Geological Survey Open-File Report 97-631, 48 p.
Conger, R.W., 1999, Evaluation of geophysical logs, phase II, at Willow Grove Naval Air Station Joint Reserve Base, Montgomery County, Pennsylvania: U.S. Geological Survey Open-File Report 99-73, 14 p.
Halliburton NUS Environmental Corporation, 1993, Remedial investigation report for sites 1, 2, 3, and 5, Naval Air Station, Willow Grove, Pennsylvania: Wayne, Pa. [variously pagi-nated].
Keys, W.S., 1990, Borehole geophysics applied to ground-water investigations: U.S. Geological Survey Techniques of Water-Resources Investigations, book 2, chap. E2, 150 p.
Rima, D.R., Meisler, Harold, and Longwill, Stanley, 1962, Geology and hydrology of the Stockton Formation in south-eastern Pennsylvania: Pennsylvania Geological Survey, 4th ser., Water Resource Report 14, 111 p.
Sloto, R.A., 2002, Hydrogeological investigation at Site 5, Willow Grove Naval Air Station/Joint Reserve Base and vicinity, Horsham Township, Montgomery County, Pennsylvania: U.S. Geological Survey Water-Resources Investigations Report 01-4263, 37 p.
Sloto, R.A., Goode, D.J., and Frasch, S.M., 2002, Interpretation of borehole geophysical logs, aquifer-isolation tests, and water quality, supply wells 1 and 2, Willow Grove Naval Air Station/Joint Reserve Base, Horsham Township, Montgom-ery County, Pennsylvania: U.S. Geological Survey Water-Resources Investigations Report 01-4264, 64 p.
Sloto, R.A., Goode, D.J., and Way, J.C., 2001, Altitude and configuration of the regional potentiometric surface, Willow Grove Naval Air Station/Joint Reserve Base and vicinity, Horsham Township, Montgomery County, Pennsylvania, October 7-8, 1999: U.S. Geological Survey Open-File Report 01-149, 1 pl., scale 1:24,000.

74 Interpretation of Borehole Geophysical Logs for Sites 1, 3, and 5 at Willow Grove Naval Air Station/Joint Reserve Base
Sloto, R.A., Macchiaroli, Paola, and Towle, M.T., 1996, Geo-hydrology of the Stockton Formation and cross-contamina-tion through open boreholes, Hatboro Borough and Warmin-ster Township, Pennsylvania: U.S. Geological Survey Water-Resources Investigations Report 96-4047, 49 p
TetraTech NUS, Inc., 2002, Remedial Investigation Report for Site 5 - fire training area NASJRB Willow Grove, Pennsylvania: King of Prussia, Pa. [variously paginated].
TetraTech NUS, Inc., 2006, Environmental geographic infor-mation system (EGIS) NAS JRB Willow Grove Horsham, Pennsylvania: CD ROM.


![Deep Borehole Field Test Laboratory and Borehole Testing ... · The characterization borehole (CB) is the smaller-diameter borehole (i.e., 21.6 cm [8.5”] diameter at total depth),](https://img.pdfslide.us/doc/110x75/5ebe68817151f10bcd35645a/deep-borehole-field-test-laboratory-and-borehole-testing-the-characterization.jpg)