Embed Size (px)
Citation preview
INTERPLAY OF SOURCES OF SIZE EFFECTS IN CONCRETE SPECIMENS
M. Vořechovský and D. Matesová
Institute of Structural Mechanics, Faculty of Civil Engineering, Brno University of Technology 602 00 Brno, Czech Republic
ABSTRACT
We study well published results on direct tensile tests of dog-bone specimens with rotating boundary conditions performed by van Vliet and van Mier. There are several papers presenting the experimental results and naming various sources of experimentally observed size effect on nominal strength. We model the experiments by methods stochastic nonlinear fracture mechanics attempting at capturing the size effects. We first model the specimens by microplane material law to show that a large portion of the dependence of nominal strength can be explained deterministically. However, it is clear that more sources of size effect take part and we consider two of them. Namely, we model the local material strength by an autocorrelated random field attempting at capturing statistical part of the complex size effect, scatter inclusive. A noticeable fact already shown by Vořechovský [1,2] and [3] is that such an approach has the large size asymptotic behavior coinciding with the classical Weibull power law while the small size asymptote deviates strongly from the Weibull size effect. The strength drop of the smallest specimen reported in experiments is explained by weak surface layer of constant thickness (caused e.g. by drying, surface damage, aggregate size limitation at the boundary or other irregularities). All three named sources are believed to be the most contributing sources of the observed strength size effect and the model combining all of them is capable of reproducing the measured data. The computational approach represents a marriage of advanced computational nonlinear fracture mechanics with simulation techniques for random fields representing spatially varying material properties [4]. Using the numerical example we document how different sources of size effect on strength can interact and result in relatively complex processes in quasibrittle failure. The presented study documents the well known fact that an experimental determination of material parameters (needed for rational and safe design of structures) is very difficult for quasibrittle material such as concrete.
Introduction The paper studies well published results of direct tensile tests on dog-bone specimens with rotating boundary conditions with varying size (range 1:32) performed by van Vliet and van Mier [5,6,7,8,9,10]. In particular we are interested in the series of dry concrete specimens A to F (dimension D varying from 50 to 1600 mm, see Fig. 1); a series accompanied by verification tensile splitting tests. The paper attempts at explaining of the complex size effect on mean and variance of nominal strength by combination of random field simulation of local material properties, “weak boundary“ effects and a nonlinear fracture mechanics software based on a cohesive crack model. There has been spent much effort on different explanations of experimentally obtained size effect on strength from several different points of view. Firstly, the effect of a non-uniform distribution of strains in the smallest cross-section was studied with simple linear constitutive law [6,7] and a separation of structural and material size effects was discussed. The results were also compared to the Weibull theory [11] based on the weakest-link model which was found to fit the mean nominal strength of sizes B to F [5,6,7,8,9]. Unfortunately, the slope of mean size effect curve corresponds to Weibull modulus of 6 which does not coincide with the measured scatter of strengths at each size. However, this is required in Weibull type of size effect. Secondly, the effect of Gaussian stress fluctuation with non-uniform loading was studied by Dyskin et al. [10] and the developed model employing a limiting distribution of independent Gaussian variables with linear trend agrees with the data very well. Van Mier and van Vliet also compared the data to “Delft lattice model” using a simple local elastic-brittle material with regular and random lattices with good results. The statistical part of experimentally obtained size effect has been recently modeled in [12] by Weibull distribution of strength. In this paper, the authors firstly try to explain the mean size effect curve by deterministic effects (not assuming the local material strength random). It partly explains the decreasing slope of the mean size effect curve (MSEC) in double-logarithmic plot (nominal strength versus characteristic size). However, the strong decrease of the mean strength of the smallest specimen A is believed to be sufficiently captured by modeled weak surface layer of thickness of about 2 mm. A parametric study of the influence of a “weak layer” thickness and the percentage reduction of the layer strength compared to the bulk strength will be presented with regard to resulting MSEC. Next, the authors approximate the local material strength by an autocorrelated random field attempting at capturing the whole size effect, scatter inclusive and combine all sources together.

r
D
D
D/4
D/4
D/5
100 mm
stiff steel platen F,u
monitoredverticaldisplacements
and u uupp low
0.6 D
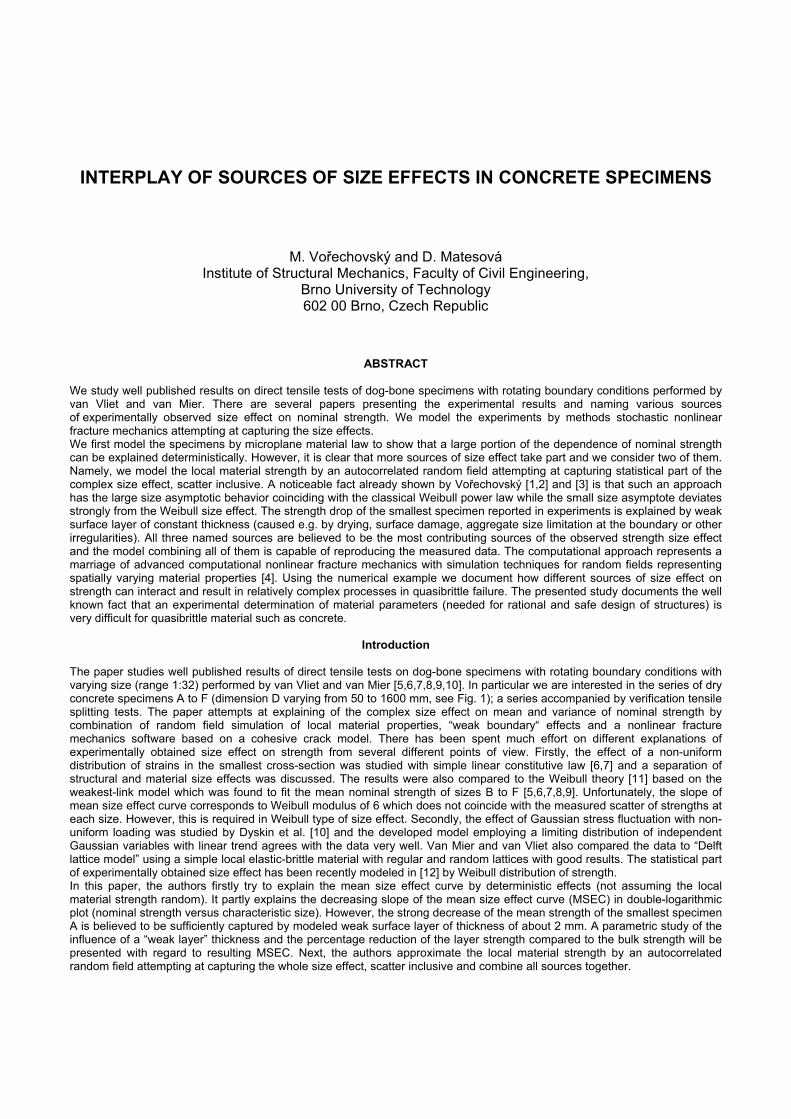
Figure 1. Dog-bone specimens tested by van Vliet and van Mier: series A to F, 2D model in software ATENA
Experiment
The experiments are well documented in [5,6,7,8,9,10]. We will briefly mention only those necessary data needed to explain the modeling part, all other details can be found in the cited publications. Dog-bone shaped specimens were loaded in uniaxial tension with scaled geometrically eccentricity from the vertical axis of symmetry e=D/50 [mm]. The loading platens were allowed to rotate freely in all directions around the loading point at the top and bottom concrete face. The loading platens were glued to concrete. Six different sizes were tested, all beams were geometrically similar. The beam thickness was kept constant (100 mm) implying transition from plane strain like conditions at the smallest size to plane stress conditions for the large sizes. The concrete mixture was reported to have an average cube compressive strength of 50 MPa and maximum aggregate size dmax = 8 mm.
Tab. 1. Experimental data. Specimens’ dimensions, nominal strengths and sample size.
Type A B C D E F
D [mm] 50 100 200 400 800 1600
r = 0.725 D [mm] 36.25 72.5 145 290 580 1160
Average σN [MPa] (std. dev. of σN) 2.54 (0.41) 2.97 (0.19) 2.75 (0.21) 2.30 (0.09) 2.07 (0.12) 1.86 (0.16)
No. of specimens tested 10 4 7 5 4 4
For comparison purposes, it is necessary to define nominal strength. Since the eccentricity of loading points has been geometrically scaled in both experiments and numerical model, we can neglect its effect and define the nominal stress σ simply as a function of characteristic dimension D (maximum specimen width), instantaneous tensile force F applied at concrete faces on the eccentricity e and cross sectional area in the middle of the specimen A (=0.6 Db)
σ = =1
0.06F FA D
(1)
Having defined the nominal stress, we define the nominal strength σN as the nominal stress attained at maximum loading force (σN =Fmax/A).
Deterministic model
A strong contribution to non-uniformity of the nominal strength is the “energetic-deterministic” size effect caused by approximately constant fracture process zone (FPZ) size with stress redistribution in beams of all sizes; see e.g. Bažant and Planas [13]. This effect can be modeled e.g. by finite element method if the fracture energy and the whole shape of pre- and postpeak behavior is correctly introduced. We created the deterministic model in software package ATENA [14], using the Bažant’s microplane material model (version 4) and crack band model [15] as a regularization. We neglected the transition from plain strain to plane stress conditions with growing beam size and model the whole series of sizes with plane stress model. Based on the information about the average cube compressive strength of 50 MPa ATENA generated a set of consistent microplane parameters: K1=1.5644E-04, K2=500, K3=15, K4=150, crack band cb = 30 mm, number of microplanes 21. We changed the crack band to 8 mm, a value which better matches the experimental data, see Fig. 1 left. The crack band size is related to fracture energy of material and controls the size at which the transition from ductile to elastic-brittle failure happens. A noticeable fact is that in the size effect plot the curve can be shifted right or left as a rigid body just by changing cb.

More specifically, the deterministic nominal strength ( )σ det ,N bD c computed for a certain size D using a value cb is also the nominal strength of size k D computed with crack band width k cb:
( ) ( )σ σ∀ > = ⋅ ⋅det detfor 0 : , ,N b N bk D c k D k c (2)
1.4
1.6
1.8
2.02.22.42.62.83.03.2
3.4
10 100 1000 10000 1000000.6
0.7
0.8
0.9
1.01.11.21.31.4
1.6
nom
inal
stre
ngth
M
Pa
σ
[]
N
no
rmal
ized
nom
inal
stre
ngth
[-]
specimen size [mm] D (characteristic dimension)
weakened layer
thickness
A B C D E F8 m
m
2 m
m
0.5
mm
small size strength asymptote
large size asymptote
deterministic computation(microplane model)
experiments(mean std. dev.)±
F,u
wea
k la
yer
thic
knes
s:
Figure 2. Left: size effect plot for experimental data, deterministic and weak layer computations. Right: computational model
with weak layer.
Weak boundary
A parametric study on this effect has been performed to illustrate what is the effect of (i) the weakened layer thickness and (ii) reduction of the material strength in that layer. In Fig. 2 we plot six size effect curves computed with deterministic model equipped with a layer of weakened material on both curved edges of the specimen (see the illustration on the right). In particular, we selected three thicknesses tw (0.5, 2 and 8 mm) and for each thickness we considered two different reduction factors of material strength parameter rt (0.5 and 0.9). In the figure, for each layer thickness the two curves are plotted and the space between them is filled with gray color (the upper always corresponds to reduction of 0.9 and the lower one to reduction of 0.5). It can be seen that the nominal strength reduction decays as the layer thickness becomes negligible compared to specimen dimension D. Moreover, the ratio between the reduced strength and deterministic nominal strength can be roughly used as a strength reduction coefficient for any ratio tw /D. This reveals simple scaling rule written for an arbitrary positive multiplier k as the reduction factor rσ of specimen strength due to weak strip compared to deterministic strength with no strip:
( )( )
( )( )σ σ
σ σσ σ
⋅ ⋅ = ≅ ∈ ⋅ det det
, ,; ;1N w N ww
tN N
D t k D k ttr r rD D k D
, (3)
where ( )σ detN D = deterministic strength for size D
( )σ ,N wD t = deterministic strength for size D with weak layer thickness wt rt = reduction factor for material strength within the weak layer ∈ 0;1tr Best results are obtained with tw = 2 mm and reduction coefficient rt = 0.5. The thickness roughly corresponds to the frequent largest aggregate size at boundary (particle size certainly decreases as we approach the specimen boundary). As can be seen from the figure, we are able to partly fit the drastic strength reduction of specimens where the thickness tw is not negligible compared to specimen neck thickness of 0.6 D. The deterministic size effect (transition from plastic to elastic strength) is automatically included in the computation because we use the same material model and parameters. However, the most important effect of strength reduction for large specimens can not be modeled by the two effects studied so far. Neither we are able to model the strength scatter because there has been no randomness considered in the model yet.
Stochastic model
We believe that the strong size effect on strength in the experimental data is predominantly caused by spatial variability/randomness of local material strength. Therefore, we considered the strength related parameter in microplane model denoted K1 in ATENA random and performed Monte Carlo type simulations for each size of a specimen. In particular, we sampled 64 realizations of random field of parameter K1 for each size and computed the responses (complete load-displacement diagrams, stress fields, crack patters, etc.). We numerically tested that parameter K1 has approximately linear relation to structural strength in a wide range around the mean value used in deterministic model. The reason for sampling the local material strength by random field instead of independent random variables is that we believe that in reality the strength of any two close locations must be strongly related (correlated) and such a relation can be suitably modeled by an autocorrelated

random field. We assumed the distribution of local strength in each material point identical and Weibull distributed. The local probability of failure pf (cumulative distribution function Fσ) depending on stress level σ reads:
( )σσσσ
= = − − 0
1 expm
fp F , (4)
where σ0 = scale parameter of Weibull distribution [MPa], Value 1.6621E-4 used for K1 m = shape parameter of Weibull distribution (dimensionless, depends solely on
cov = coefficient of variation). Value of 7.91 used for random K1. To obtain results consistent with previous deterministic analysis we kept the value of parameter K1 as the mean value. The second parameter of Weibull distribution has been set with regard to the cov of nominal strength of the smallest sample (in experiments cov of the size A was 0.16). This choice is supported by the fact that size A has the largest sample size (10 replications, see Tab. 1). Therefore the estimation of variance has higher statistical significance than for other sizes. Moreover, we believe that the effect of weakened boundary only reduces the mean nominal strength but does not influence the scatter of strengths. For simplicity we used the value of cov=0.15 (15% variability of local material strength). This is relatively high value implying relatively low Weibull modulus mentioned above. Discretized random field is a set of autocorrelated random variables. The most important parameter (apart from autocorrelation function) is the autocorrelation length controlling the distance over which the random material strengths are correlated. We used the squared exponential autocorrelation function:
= −
2
expr
dRl
, (5)
where d = distance of two points lr = correlation length, Value of 80 mm used for random field for K1 It can be shown that for specimens much smaller than one autocorrelation length the realization of random field of the local strength K1 is a constant function over the whole region and all local strengths of the whole specimen can be represented by just one random variable (instead of number of spatially correlated variables). Since the specimen’s nominal strength is just a simple transformation of input strength parameter K1 (no spatial variability allowing cracks to localize in other location than in deterministic analysis), we knew that the mean nominal strength of the smallest specimen will be the same as that obtained by deterministic analysis. That is why we used the K1 from deterministic analysis as the mean value of random field of K1. The samples of random fields evaluated in locations of integration points were simulated by methods described in [4,2,16]. The simulated random fields are stationary, isotropic and homogeneous. Briefly, the orthogonal transformation of covariance matrix has been used in combination with Latin Hypercube Sampling of the random part of field expansion. Such a combination proved itself to be very effective in providing samples of random fields leading to high accuracy in estimated response statistics compared to classical Monte Carlo sampling. Numerical studies documenting this efficiency are published in [4,2,16]. This is extremely important property in cases when evaluation of each one response is very time consuming. In our case the evaluation is represented by one computation of response by nonlinear finite element method with microplane material model. Clearly this is very expensive and we must keep the number of simulations as low as possible. The number of 64 simulations was tested to be high enough and enabling stable and accurate statistical estimates of field’s statistics (averages, sample standard deviations, autocorrelation structure) as well as reproducible estimates of statistics of structural response (nominal strength etc.). The automatic simulation of all structural responses was done by software SARA integrating (i) ATENA software (evaluation of response) on one side and (ii) FREET software [2,17,18] (simulation of samples of random parameters, statistical assessment) on the other side. In Fig. 3 we plot computed sets of load-displacement diagrams and sketch the definition of displacement (separation of two measuring points). Selected load displacement curves are highlighted and the corresponding realizations of random strength fields are plotted in Fig. 4. The letter denotes specimen size and the integer denotes number of simulation. Besides the most frequent simple load-displacement functions we purposely highlighted several curves with unusual shape (snap-back type or “a loop”). In routine practice of testing concrete structures such special shapes can be experimentally measured just occasionally. As discussed later, in our case some unusual of unexpected curves are obtained partly thanks to the definition of displacement ∆u and mainly thanks to the spatial randomness with high variability. The comparison of peak strength of deterministic load-displacement diagram with mean value of nominal strength can be made in Fig. 3. The difference between them grows with specimen size. While for size C the mean strength nearly coincides with the peak of deterministic diagram, for specimen size E the deterministic curve is above all 64 random realizations of the diagram, see Fig. 3.

In Fig. 4 we plot chosen realizations of random strength field for all sizes A – F. It can be seen that as the ratio of autocorrelation length and specimen size D decreases, the rate of spatial fluctuation of random field realizations grows. Therefore there is increasing number of locations with low material strength (locations prone to failure). Or, in other words, with increasing specimen size there is an increased probability that there will be a weak spot in highly stressed regions. This effect is long referred to as the statistical size effect. The classical statistical size effect is modeled by the simple weakest link model and usually approximated by Weibull power law [11]. However, as explained in [1,2,3], the classical Weibull model is not able to account for spatial correlation between local material strengths. Rather, Weibull model is based on IID (identically distributed independent distributions) random variables linked in series. The effect of such a consideration is that the strength of infinitely small specimen is infinite. In Weibull model every structure is equivalent to a chain under uniaxial tension, a chain of independent members having identical statistical distribution of stress. If the local strength is modeled by an autocorrelated random field (and we consider the autocorrelation length to be a material property), the small size asymptote of strength is equivalent to the distribution of local material strength. On the other hand, the large size asymptotics is exactly identical to that of the Weibull model [1,2,3] (for a proper choice of reference length and the corresponding scale parameter of Weibull distribution in Weibull model). The autocorrelation length plays an important role of statistical scaling length in material controlling the transition from one strength random variable model (full correlation in small structures) to many independent local strengths (large structures, Weibull model).
Nom
inal
stre
ss
σ
[MPa
]
0.5
0
1
1.5
2
2.5
3
3.5
Nom
inal
stre
ss
σ
[MPa
]
0.5
0
1
1.5
2
2.5
3
0.5
0
1
1.5
2
2.5
3
0.5
0
1
1.5
2
2.5
3
0 10 20 30 40
5 10 15 20
0 40 80 12020 60 100 140
0 20 40 6010 30 50 700
∆ µu u = - [ m]uupp low
2
15
E(800 mm)
C(200 mm)
F(1600 mm)
D(400 mm)
18
10
27
42
52
3
13
22
51
34
55
3
22
4427
4755
F
ulow
uupp
26
Determ.
Determ.
Determ.
Determ.
mean ± std. dev.
deterministic computation
Figure 3. Load-displacement diagrams (64 realizations) of structural sizes C, D, E and F. Selected diagrams are highlighted.
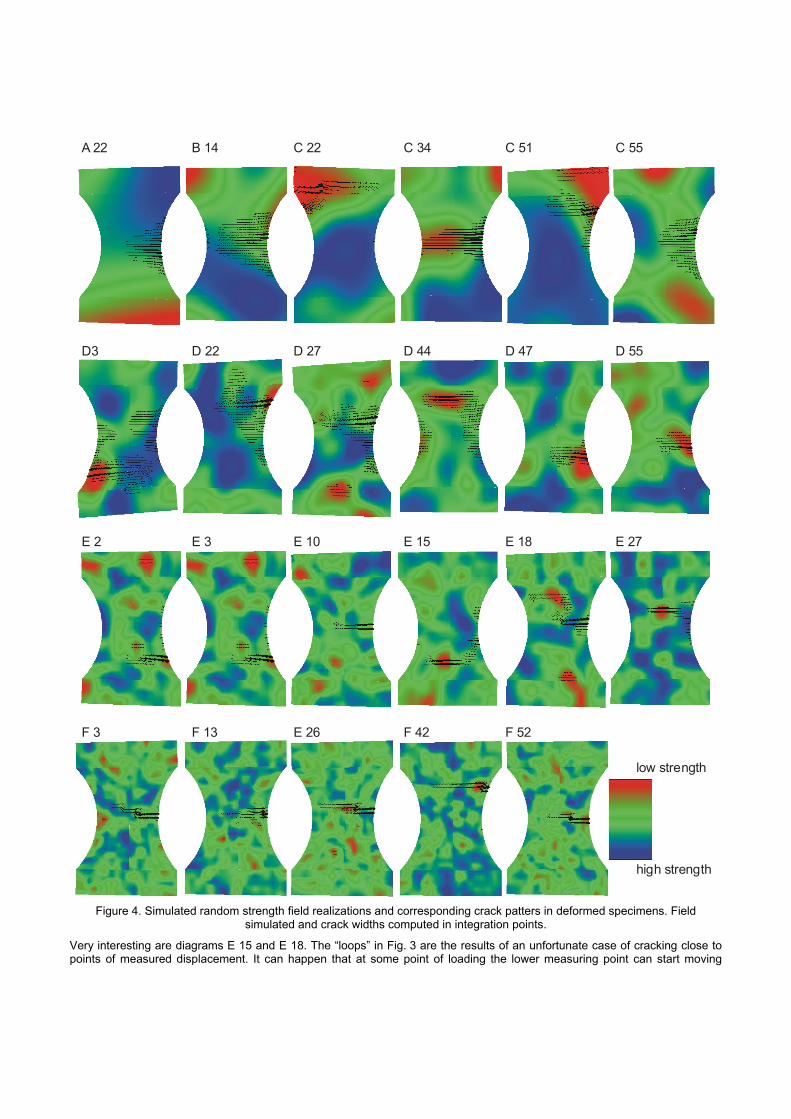
Crack patterns of two randomly chosen specimens A 22 and B 14 (see Fig. 4) show the most frequent location of strain localization. The small eccentricity of load and relatively narrow neck of dog bone specimen nearly guarantee that cracking will initiate on the right side of the neck. Samples of random fields in both cases (A, B) are nearly constant functions and therefore there is no space left for the weakest link principle. Pattern C 22 in the same figure documents that the local strength can be in some location so small that the relatively low stresses in that location can initiate fracturing. In specimen 22 the rotation of platens was opposite to the usual direction. Since the damage localized out of the distance on which we measured the displacement ∆u the corresponding L-D diagram in Fig. 3 has the snap-back like shape. The same is true also for C 51 whereas C 34 and C 55 are again just typical representatives of L-D diagrams and crack patterns. Similar features can be found in series D. Positions of cracking in D 3 and D 22 caused the snap back while D 27, D 44, D 47 and D 55 illustrate the random sampling of crack initiation leading to usual shape of L-D diagram displayed on our virtual testing machine.
A 22 B 14 C 22 C 34 C 51 C 55
D3 D 22 D 27 D 44 D 47 D 55
E 2 E 3 E 10 E 15 E 18 E 27
F 3 F 13 E 26 F 42 F 52
low strength
high strength
Figure 4. Simulated random strength field realizations and corresponding crack patters in deformed specimens. Field
simulated and crack widths computed in integration points.
Very interesting are diagrams E 15 and E 18. The “loops” in Fig. 3 are the results of an unfortunate case of cracking close to points of measured displacement. It can happen that at some point of loading the lower measuring point can start moving

faster than the upper point and this result in bizarre shape of L-D diagram E 15. A specimen can later start cracking in the neck as occurred in the case of E 18. In series F the autocorrelation length becomes so small compared to specimen dimension that again cracks initiates on the right side of the neck nearly in all cases, see Figs. 3 and 4. In series A we never reported snap-back like curve due to cracking outside the measuring distance and in B and F this happened once only, see Fig. 3. We can conclude that the most interesting processes happen in specimens with dimension comparable to one or two correlation lengths (region of transition from one random strength variable to a set in independent strength variables).
We note that in contrast to the experiments, we did not control loading by the displacement increments ∆u. Instead, we loaded the beams by displacement at the ends and therefore we were able to monitor snap-back type of curves without any difficulty.
0
0.2
0.4
0.6
0.8
1
1.5 2 2.5 3 3.5 4
CD
F
Nominal strength [MPa]σ N
F E D C B A2.02 2.25 2.66 3.01 3.18 3.2111.0 8.5 7.91 7.91 7.91 7.91
σm F
F
Figure 5. Left: Estimated distribution of nominal strength of specimens with Weibull random field of K1. Best fits by Weibull
distribution (Eq. 4). Right: Computed field of principal tension over the specimen in an elastic stress state
We were able to simulate random specimen responses of specimens smaller than A with random fields of K1, moreover we could simply use a random variable sampling to represent randomness in that small specimens. On the other hand, it becomes very problematic to simulate samples of random fields of specimens much larger than F. Even though the first author is deeply involved in techniques to overcome the computational difficulties with stochastic finite element computation of large structures [19] we will present another technique here. Fortunately, only strength is random in our analysis and we can use the classical Weibull integral for large structures. As explained in [1,2,3] if the structure is sufficiently large, the spatial correlation of local strengths becomes unimportant and the Weibull integral yields solution equivalent to full stochastic finite element simulation. We will briefly sketch the computational procedure of evaluating the Weibull integral for structural failure probability, details can be found e.g. in [13]. The Weibull integral has the form:
( ) ( ) ( )σ σ − − = ∫ 0ln 1 ; , dfV
P c m Vx x (6)
where Pf = probability (the cumulative probability density) of failure load of structure [ ]•c = stress concentration function There are several possible definitions of the stress concentration function, see [13]. In the studied specimens the major contributor to the stress tensor is the normal stress σyy. The field of stress σyy nearly coincides with the principal tension σI. Since only tensile stresses are assumed to cause a failure, we defined the stress concentration function simply as:
( ) ( )σσ σ
σ = 0
0 0
1; ,m
Ic mV
xx (7)
where V0 = reference volume associated with m and σ0 In Fig. 5 right we plot computed field of principal tension over the specimen in an elastic stress state. Numerical integration of this stress field for different specimen sizes and failure probabilities can be suitably rewritten in dimensionless coordinates so that the computation becomes extremely easy. Resulting mean size effect is plotted in Fig. 6 (asymptotic mean size effect curve). Let us also mention that another way of simulating the random strength of large structures can be done utilizing the stability postulate of extreme values [20]. Such a computational procedure is an elegant trick using the recursive property of distribution function and is described in [21,22] together with applications. Results of such an approach (and also Weibull integral as presented here) are valid only for extremely large sizes where effects of structural nonlinearity (caused stress redistribution) disappear. For small sizes there are two problems: (i) spatial correlation of local strengths and (ii) effect of stress redistribution. The result must be a straight line in double logarithmic plot of size versus strength (size effect plot is a power law). An approach based on simple scaling of Weibull random variables associated with structural regions of different sizes

has been used in [12]. Authors simply used the scaling rules only for sizes larger that size C and this helped them to obtain close fit of experimental data. Unfortunately, the numerical model used did not allow platens to rotate freely and did not model the eccentricity of loading force which both, in our view can negatively affect the results of response statistics. By prescribing both platens to move without rotation one forces the specimen to fracture differently than if platens can rotate freely. This becomes extremely important if the local strength gets randomized spatially.
Analysis of the Results
By introducing three different scaling lengths we are able to independently incorporate three different effects in the model resulting in three size effects on nominal strength. The crack band width cb (deterministic scaling length) controls at which size the transition from ductile to elastic-brittle behavior happens and therefore it controls the transition between two horizontal asymptotes in the size effect plot (see Fig. 2). The second introduced length (weak boundary thickness tw) together with the material strength reduction controls at which size there will be a significant reduction of nominal strength. The reduction gets amplified with decreasing specimen size and causes opposite slope of size effect than the deterministic and statistical ones (see Fig. 2). The last introduced length is the autocorrelation length lr controlling the transition from randomness caused by overall material strength scatter (one random variable for material strength) to a set of independent identically distributed random variables of local material strengths via autocorrelated random field. In other words it controls the convergence to Weibull statistical size effect based in the weakest link principle. Such interplay of three independent material/structural lengths is very complex. It would be nearly impossible to determine all these parameters from the available experimental data even if the model featuring the three effects was perfectly correct.
In Fig. 5 left we plot the estimated distribution function of nominal strength for all tested sizes as we obtained them from the full stochastic finite element analysis with parameter K1 modeled by random field. The table above the graphs presents the parameters of Weibull distribution that best fit the empirical histograms. For some reason it happened that the Weibull modulus increases for sizes E and F even if the slope of corresponding size effect curve in Fig. 6 suggests again the value 7.91 (the value we that expect and that follows from simple Weibull size effect of elastic-brittle structure). The deviations may be caused by numerical errors; especially insufficient discretization of random field with respect to the autocorrelation length. The variability is not captured sufficiently by the density of integration points because we did not increase the mesh density for models of large specimens. Rather, we kept the same number of finite elements for all sizes in order to save computational time.
1.3
1.4
1.6
1.8
2.0
2.2
2.4
2.6
2.83.03.23.43.6
10 100 1000 10000
0.7
0.8
0.9
1.0
1.1
1.2
1.3
1.4
1.6
0.1 1 10 100
nom
inal
stre
ngth
σ
[MP
a]N
norm
aliz
ed n
omin
al s
treng
th
specimen size [mm]D
Weibull integral elastic stress field)(
Microplane model withrandom strength field(mean std. dev.)±
A B C D E F
small size strengthasymptote
deterministic large size asymptote
deterministic computation (microplane model)experiments
mean strength of elastic brittle material random local strength field
-
G H I J 1
7.91 1 6
IID variables, Weibull integral, stability postulate of extreme values (strength scaling)
autocorrelated random fieldfor local material strengths
one random variable for material strength
3
Figure 6. Comparison of results in size effect plot.
The resulting nominal strengths for all sizes obtained by nonlinear stochastic FEM are plotted and compared to experiments in Fig. 6. We see that starting from size C the size dependence on mean nominal strength is predominantly statistical and we were not able to model it by deterministic model alone, see e.g. [23]. We also included mean nominal strengths for sizes F, H and J obtained by Weibull integral (Eqs. 6 and 7). Weibull solution is a straight line and represent he asymptotic size effect of

structures caused solely by spatial strength randomness. Above the plots we sketch the size regions for different computational techniques used for modeling of random strength. The very thick curve in Fig. 6 (denoted as 3) is the curve resulting from combination of all three effects described here. The curve has been obtained by applying the dimensionless reduction factor rσ due to weak strip on results obtained by nonlinear stochastic FEM (layer thickness tw = 2 mm, reduction rt = 0.5). This was a simple solution to estimate the final results of model featuring all effects. Unfortunately this simple approach is not correct because it applies reduction of weak layer to final mean of all results of simulation with random fields. Generally this can not be done because the sources of size effect interact. To get consistent result, on should model the local strengths by random field and apply the reduction in the layer to each realization of a field). This would help the specimens to initiate crack in surface layer more often. However, the full set of time consuming simulations would be necessary. One can immediately see that the strength of size A is not reproduced correctly (even though the scatter is). We believe that partly this can be improved by considering the plane strain conditions and most importantly the fact that the thickens (0.1 m) is larger than the width of the beam and in 3D model the crack would often initiate from front or back surfaces of the specimen (see illustration in Fig. 1 left). This effect certainly results in decreased strength of specimen A. In our study the correlation length lr has been set to a value nearly equal to the thickness of a specimen. At this length the variation of local strength is just becoming significant and may distort results of very small specimens. The authors of experiments also reported that due to casting of the beams the front layers have different material properties than to back layers. We model these effects in 3D models, but the results are beyond the scope of this paper and 3D effects are neglected in this study [24].
Conclusions
The performed numerical simulations of random responses of tensile tests with dog-bone specimens with rotating boundary conditions performed by van Vliet and van Mier are in good agreement with the published data. Based on comparison of trends of nominal strength dependency on structural size we conclude that the numerical model featuring several scaling lengths is capable of capturing the most important mechanism of failure. In particular, we have shown that a portion of the experimentally obtained size effect can be captured at deterministic level with the help of deterministic length represented by crack band width in our model. Secondly, next strength dependence on size in large beams is modeled by autocorrelated random strength field. The important statistical length scale is introduced in a form of the autocorrelation length of the field. The asymptotic size effect form caused by random strength is the classical Weibull power law. By random sampling of the local strength field we were able to model also the random scatter of resulting nominal strengths. The last effect presented here is the weak boundary layer of constant width. This weakened layer results in reduction of strength of small specimens which contrasts with trends of the two previous size effects. The presented study documents the well known fact that an experimental determination of material parameters (needed for rational and safe design of structures) is very difficult for quasibrittle material such as concrete. Acknowledgments
This outcome has been achieved with the financial support of the Ministry of Education, Youth and Sports, project No. 1M680470001, within activities of the CIDEAS research centre. Authors thank Mr. Sadílek for help with extensive numerical simulations of dog-bone specimens.
References
1. Vořechovský, M., “Stochastic fracture mechanics and size effect”. Ph.D. thesis, Brno University of Technology, Brno, Czech Republic. ISBN 80-214-2695-0, (2004).
2. Vořechovský, M., “Statistical alternatives of combined size effect on nominal strength for structures failing at crack Initiation”, Invited lecture given at the Czech Academy of Sciences, Institute of physics of materials of the ASCR. In: Stibor, M. (Ed.), Problémy lomové mechaniky IV (Problems of Fracture Mechanics IV). Brno University of Technology, pp. 99–106. ISBN 80-214-2585-7 (in Czech), (2004).
3. Vořechovský, M. and Chudoba, R., “Stochastic modeling of multi-filament yarns II: Random properties over the length and size effect”. International journal of Solids and Structures, Vol. 43 (3-4), 435-45, (2006).
4. Vořechovský, M., “Simulation of cross correlated random fields by series expansion methods”. Structural safety, submitted to, (2005).
5. van Vliet, M.R.A. and van Mier, J.G.M., ”Experimental investigation of size effect in concrete under uniaxial tension” In Proceedings of FRAMCOS-3, edited by H. Mihashi and K. Rokugo, Aedificatio Publishers, Japan, 1923-1936, (1998).
6. van Vliet, M.R.A. and van Mier, J.G.M., ”Effect of strain gradients on the size effect of concrete in uniaxial tension” International Journal of Fracture, vol. 95, 195-219, (1999).
7. van Vliet, M.R.A. and van Mier, J.G.M., ”Experomental investigation of size effect in concrete and sandstone under uniaxial tension” Engineering Fracture Mechanics, vol. 65, 165-188, (2000).
8. van Vliet, M.R.A. and van Mier, J.G.M., ”Size effect of concrete and sandstone” Heron, vol. 45, 91-108, (2000). 9. van Mier, J.G.M. and van Vliet, M.R.A., ”Influence of microstructure of concrete on size/scale effects in tensile fracture”
Engineering Fracture Mechanics, vol. 70, 2281-2306, (2003).

10. Dyskin, A.V., van Vliet, M.R.A. and van Mier, J.G.M., ”Size effect in tensile strength caused by stress fluctuations” International Journal of Fracture, 108, 43-61, (2001).
11. Weibull, W., “The phenomenon of rupture in solids”. Royal Swedish Institute of Engineering Research (Ingenioersvetenskaps Akad. Handl.), Stockholm 153, 1–55. (1939)
12. Lehký. D. and Novák, D., “Nonlinear Fracture Mechanics Modeling of Size Effect in Concrete under Uniaxial Tension”. In Peter Schießl et al. (eds.), 4th International Ph.D. Symposium in Civil Engineering, volume 2, 410–417, Munich, Germany, Millpress, Rotterdam. (2002)
13. Bažant, Z.P. and Planas, J. “Fracture and Size Effect in Concrete and other Quasibrittle Materials”, CRC Press, Boca Raton, Florida, (1998).
14. Červenka, V. and Pukl, R., “ATENA Program Documentation”, Červenka Consulting, Prague, http://www.cervenka.cz, (2005).
15. Bažant, Z. P., Oh, B.-H., “Crack band theory for fracture of concrete”. Materials and Structures (RILEM, Paris) 16, 155–177, (1983).
16. Vořechovský, M. and Novák, D,. “Simulation of random fields for stochastic finite element analyses”. In: Augusti, G., Schuëller, G. I., Ciampoli, M. (Eds.), ICoSSaR '05 the 9th International Conference on Structural Safety and Reliability. Millpress Rotterdam, Netherlands, Rome, Italy, 2545–2552. (2005)
17. Novák, D., Vořechovský, M., Rusina, M. and Lehký, D., “FREET – program documentation”, User´s and Theory Guides, Brno/Červenka Consulting, Prague, http://www.freet.cz, (2005)
18. Novák, D., Vořechovský, M. and Rusina, R., “Small-sample Probabilistic Assessment – Software FREET”, Proc. of 9th Int. Conf. on Applications of Statistics and Probability in Civil Engineering – ICASP 9, San Francisco, USA, Rotterdam Millpress: pp. 91-96, (2003).
19. Vořechovský, M. and Chudoba, R., “Adaptive probabilistic modeling of localization, failure and size effect of quasi-brittle materials”, ECCM-2006 - III European Conference on Computational Mechanics, Lisbon Portugal, in print, (2006).
20. Fisher, R. A., Tippett, L. H. C., “Limiting forms of the frequency distribution of the largest and smallest member of a sample”. Proc., Cambridge Philosophical Society 24, 180–190. (1928).
21. Bažant, Z. P., Vořechovský, M.,. Novák, D., Asymptotic Prediction of Energetic-Statistical Size Effect from Deterministic Finite Element Solutions. Journal of Engineering Mechanics, ASCE, in review. (2004).
22. Novák, D., Bažant, Z. P., Vořechovský, M., “Computational modeling of statistical size effect in quasibrittle structures.” In: Der Kiureghian, A., Madanat, S., Pestana, J. M. (Eds.), ICASP 9, International Conference on Applications of Statistics and Probability in Civil Engineering. Millpress, Rotterdam, San Francisco, USA, 621–628, (2003).
23. Novák, D., Vořechovský, M., Pukl, R. and Červenka, V. “Statistical nonlinear analysis - size effect of concrete beams”. In R. de Borst, J. Mazars, G. Pijaudier-Cabot, and J. G. M. van Mier, editors, 4th Int. Conference FraMCoS - Fracture Mechanics of Concrete and Concrete Structures, pages 823-830, Cachan, France, Swets & Zeitlinger, Lisse, (2001).
24. Vořechovský, M. and Matesová, D., “Interplay of spurces of size effect in conrete specimens”, International Journal of Solids and Structures, under preparation, (2005).