Embed Size (px)
Citation preview
i
NASA/TM—1998–208533
Interplanetary Mission Design Handbook:Earth-to-Mars Mission Opportunities andMars-to-Earth Return Opportunities 2009–2024
July 1998
National Aeronautics andSpace Administration
Marshall Space Flight Center
L.E. GeorgeU.S. Air Force Academy, Colorado Springs, Colorado
L.D. KosMarshall Space Flight Center, Marshall Space Flight Center, Alabama
ii
Acknowledgments
Jerry R. Horsewood, Adasoft, Inc., andAndrey B. Sergeyevsky, NASA Jet Propulsion Laboratory
Available from:
NASA Center for AeroSpace Information National Technical Information Service800 Elkridge Landing Road 5285 Port Royal RoadLinthicum Heights, MD 21090–2934 Springfield, VA 22161(301) 621–0390 (703) 487–4650
iii
TABLE OF CONTENTS
INTRODUCTION ............................................................................................................................ 1
HUMAN MARS DESIGN REFERENCE MISSION OVERVIEW................................................ 2
GENERAL TRAJECTORY CHARACTERISTICS ........................................................................ 6
MISSION OPPORTUNITIES .......................................................................................................... 9
ADDITIONAL STUDIES AND APPENDIX INFORMATION ..................................................... 15
Total Time of Flight Trade Studies—2014 Opportunity ...................................................... 15Velocity Losses for Various Thrust-to-Weight Ratios .......................................................... 16All-Chemical Architectures .................................................................................................. 17Time In Radiation Belts ........................................................................................................ 17Verification of MAnE Results .............................................................................................. 19
DESCRIPTION OF TRAJECTORY CHARACTERISTICS........................................................... 20
Earth Departure Variables ..................................................................................................... 20Mars Arrival Variables .......................................................................................................... 20Mars Departure Variables ..................................................................................................... 21Earth Arrival Variables ......................................................................................................... 21
CONCLUSIONS .............................................................................................................................. 22
APPENDIX A—2009–2024 OPPORTUNITY PLOTS ................................................................... 23
APPENDIX B—FREE-RETURN TRAJECTORIES ...................................................................... 123
APPENDIX C—ASSUMPTIONS ................................................................................................... 125
APPENDIX D—OVERVIEW OF MAnE........................................................................................ 128
APPENDIX E—FLIGHT TIME STUDIES..................................................................................... 131
APPENDIX F—GRAVITY LOSS STUDIES.................................................................................. 134
APPENDIX G—VERIFICATION OF MAnE RESULTS ............................................................... 135
REFERENCES ................................................................................................................................. 153
iv
LIST OF FIGURES
1. 2014 primary piloted opportunity ......................................................................................... 2
2. DRM 2014 opportunity ........................................................................................................ 3
3. DRM architecture ................................................................................................................. 4
4. C3 departure energies for 2014 opportunities ....................................................................... 7
5. Cargo mission departure energies, 2009–2024..................................................................... 9
6. Cargo mission durations, 2009–2024 ................................................................................... 9
7. Cargo mission departure energies, 1990–2007..................................................................... 10
8. Piloted optimal departure energies, 2009–2024 ................................................................... 11
9. Design reference mission 2014 piloted opportunities .......................................................... 13
10. 2014 time-of-flight trade studies .......................................................................................... 15
11. Velocity losses at various T/W ratios.................................................................................... 16
v
LIST OF TABLES
1. DRM baseline cargo and piloted trajectories ....................................................................... 3
2. Data for cargo missions, 2009–2024 .................................................................................... 10
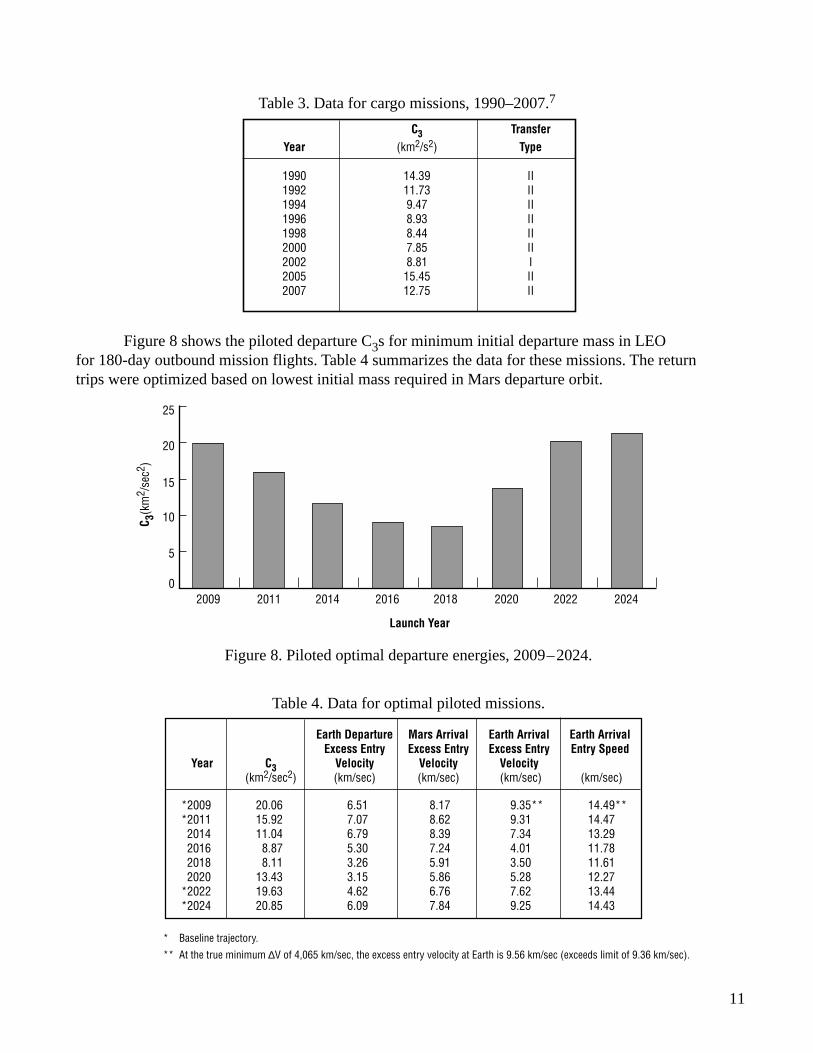
3. Data for cargo missions, 1990–2007 .................................................................................... 11
4. Data for optimal piloted missions......................................................................................... 11
5. Baseline piloted mission durations, 2014–2020 ................................................................... 12
6. Summary of all cargo and piloted opportunities, 2009–2024 .............................................. 14
7. All-chemical TMI transfers/DRM ........................................................................................ 17
8. ∆Vs and velocity losses for two periapse burns at departure/DRM ..................................... 17
9. 2009 opportunities summary ................................................................................................ 24
10. 2011 opportunities summary ................................................................................................ 39
11. 2014 opportunities summary ................................................................................................ 54
12. 2016 opportunities summary ................................................................................................ 70
13. 2018 opportunities summary ................................................................................................ 85
14. 2020 opportunities summary ................................................................................................ 95
15. 2022 opportunities summary ................................................................................................ 105
16. 2024 opportunities summary ................................................................................................ 114
17. Free return trajectories .......................................................................................................... 124
18. 2011 TOF trades ................................................................................................................... 132
19. 2014 TOF trades ................................................................................................................... 133
20. Verification trajectories......................................................................................................... 136
vi
DEFINITION OF SYMBOLS AND ABBREVIATIONS
a semimajor axis (km)
cnj Conjunction Class Mission
C3 energy (km2/sec2)
∆V Delta Velocity (km/sec)
DRM Design reference mission (two 2011 cargo/one 2014
piloted flight)
e orbit eccentricity
ε orbit energy (km2/s2)
ECRV Earth crew return vehicle
HIHTOP Heliocentric Interplanetary High-Thrust Trajectory
Optimization Program (the MAnE optimization module)
LEO low-Earth orbit (assumed 400-km altitude)
MAnE Mission Analysis Environment (for Heliocentric High-Thrust
Missions (Adasoft, Inc. tool))
mt metric ton, or 1,000 kg
RCS Reaction Control System
SWISTO Swingby-Stopover Trajectory Optimization Program
TEI trans-Earth injection
TMI trans-Mars injection
TOF time of flight
T/W thrust-to-weight
V ∞ V infinity, or departure hyperbolic excess velocity (km/sec)
lox/CH4 liquid oxygen/methane
Rp radius of perigee
Ra radius of apogee
υ true anomaly
1
TECHNICAL MEMORANDUM
INTERPLANETARY MISSION DESIGN HANDBOOK:EARTH-TO-MARS MISSION OPPORTUNITIES AND
MARS-TO-EARTH RETURN OPPORTUNITIES 2009–2024
INTRODUCTION
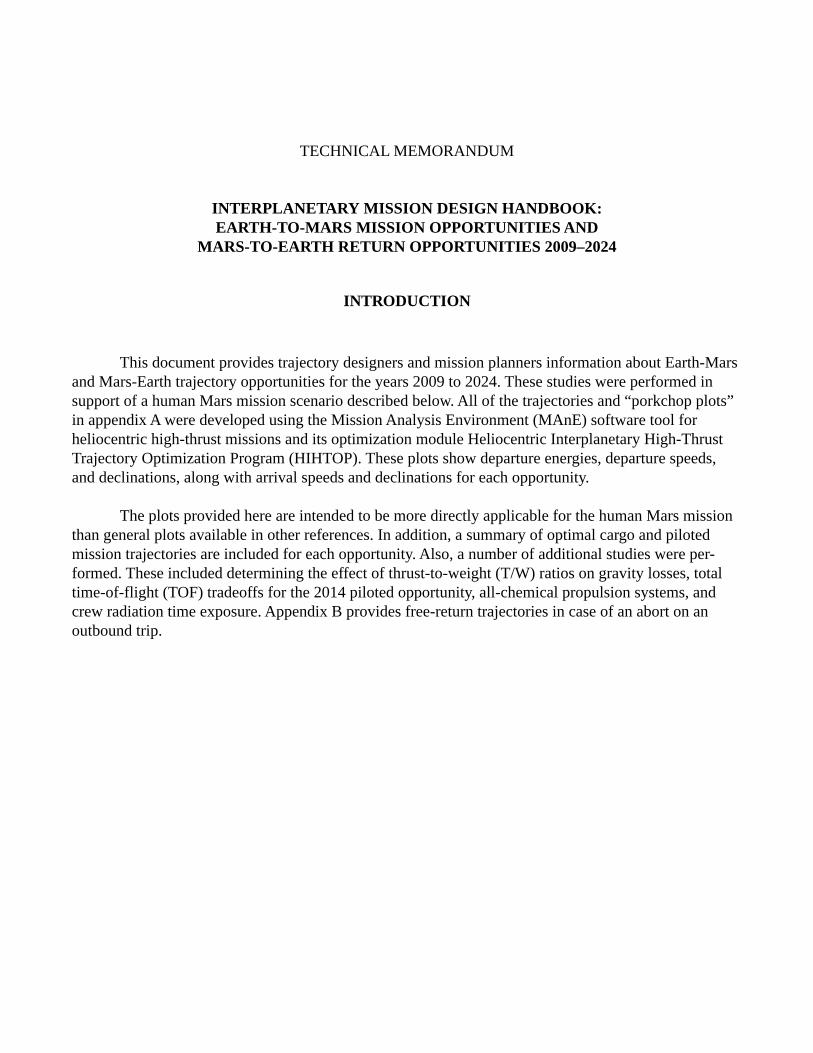
This document provides trajectory designers and mission planners information about Earth-Marsand Mars-Earth trajectory opportunities for the years 2009 to 2024. These studies were performed insupport of a human Mars mission scenario described below. All of the trajectories and “porkchop plots”in appendix A were developed using the Mission Analysis Environment (MAnE) software tool forheliocentric high-thrust missions and its optimization module Heliocentric Interplanetary High-ThrustTrajectory Optimization Program (HIHTOP). These plots show departure energies, departure speeds,and declinations, along with arrival speeds and declinations for each opportunity.
The plots provided here are intended to be more directly applicable for the human Mars missionthan general plots available in other references. In addition, a summary of optimal cargo and pilotedmission trajectories are included for each opportunity. Also, a number of additional studies were per-formed. These included determining the effect of thrust-to-weight (T/W) ratios on gravity losses, totaltime-of-flight (TOF) tradeoffs for the 2014 piloted opportunity, all-chemical propulsion systems, andcrew radiation time exposure. Appendix B provides free-return trajectories in case of an abort on anoutbound trip.
2
HUMAN MARS DESIGN REFERENCE MISSION OVERVIEW
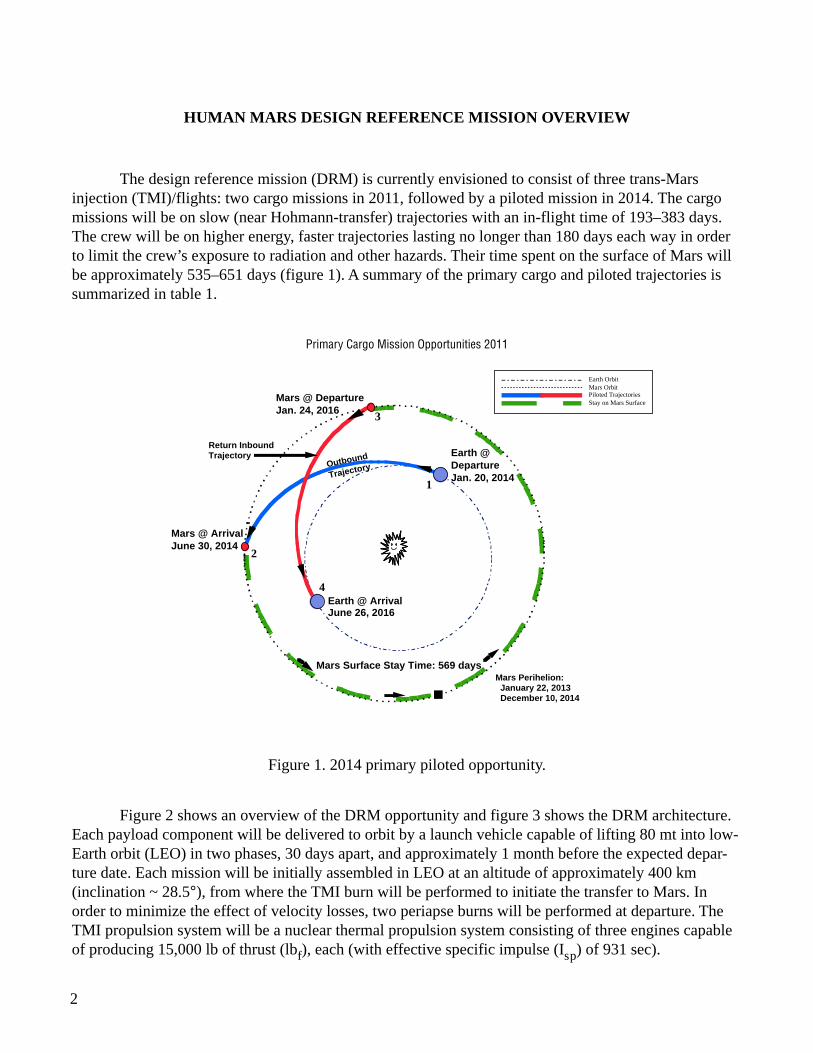
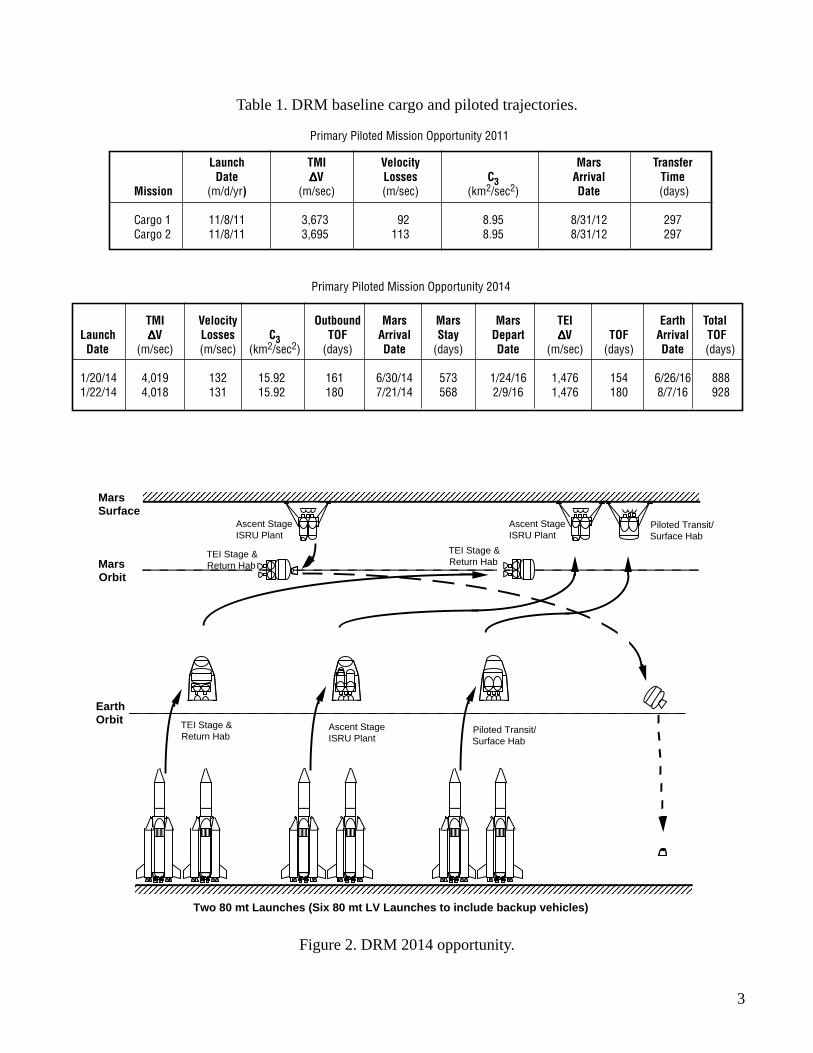
The design reference mission (DRM) is currently envisioned to consist of three trans-Marsinjection (TMI)/flights: two cargo missions in 2011, followed by a piloted mission in 2014. The cargomissions will be on slow (near Hohmann-transfer) trajectories with an in-flight time of 193–383 days.The crew will be on higher energy, faster trajectories lasting no longer than 180 days each way in orderto limit the crew’s exposure to radiation and other hazards. Their time spent on the surface of Mars willbe approximately 535–651 days (figure 1). A summary of the primary cargo and piloted trajectories issummarized in table 1.
Primary Cargo Mission Opportunities 2011
Mars @ ArrivalJune 30, 2014
Earth @DepartureJan. 20, 2014
1
2
3
4
Outbound
Trajectory
Return InboundTrajectory
Earth @ ArrivalJune 26, 2016
Mars @ DepartureJan. 24, 2016
Mars Perihelion: January 22, 2013 December 10, 2014
Mars Surface Stay Time: 569 days
■
Earth OrbitMars OrbitPiloted TrajectoriesStay on Mars Surface
Figure 1. 2014 primary piloted opportunity.
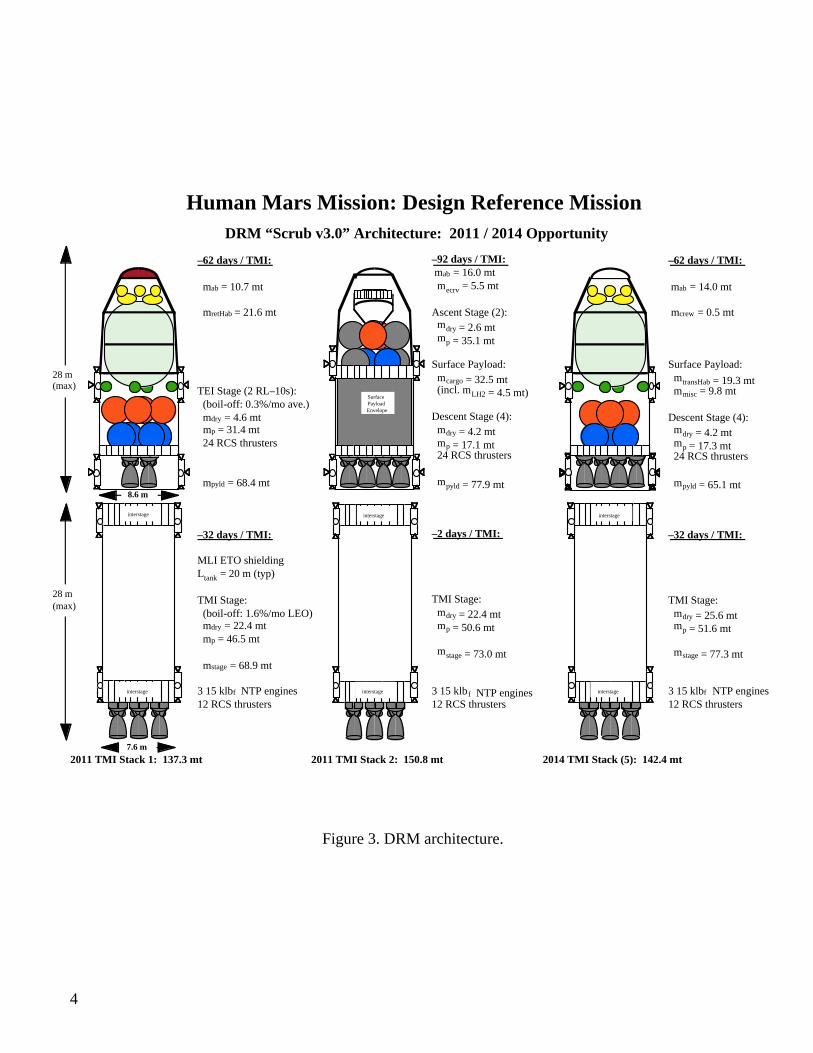
Figure 2 shows an overview of the DRM opportunity and figure 3 shows the DRM architecture.Each payload component will be delivered to orbit by a launch vehicle capable of lifting 80 mt into low-Earth orbit (LEO) in two phases, 30 days apart, and approximately 1 month before the expected depar-ture date. Each mission will be initially assembled in LEO at an altitude of approximately 400 km(inclination ~ 28.5°), from where the TMI burn will be performed to initiate the transfer to Mars. Inorder to minimize the effect of velocity losses, two periapse burns will be performed at departure. TheTMI propulsion system will be a nuclear thermal propulsion system consisting of three engines capableof producing 15,000 lb of thrust (lbf), each (with effective specific impulse (Isp) of 931 sec).
3
Figure 2. DRM 2014 opportunity.
Launch TMI Velocity Mars TransferDate ∆∆∆∆∆V Losses C3 Arrival Time
Mission (m/d/yr) (m/sec) (m/sec) (km2/sec2) Date (days)
Cargo 1 11/8/11 3,673 92 8.95 8/31/12 297Cargo 2 11/8/11 3,695 113 8.95 8/31/12 297
TMI Velocity Outbound Mars Mars Mars TEI Earth TotalLaunch ∆∆∆∆∆V Losses C3 TOF Arrival Stay Depart ∆∆∆∆∆V TOF Arrival TOF Date (m/sec) (m/sec) (km2/sec2) (days) Date (days) Date (m/sec) (days) Date (days)
1/20/14 4,019 132 15.92 161 6/30/14 573 1/24/16 1,476 154 6/26/16 8881/22/14 4,018 131 15.92 180 7/21/14 568 2/9/16 1,476 180 8/7/16 928
Table 1. DRM baseline cargo and piloted trajectories.
Primary Piloted Mission Opportunity 2011
Primary Piloted Mission Opportunity 2014
Two 80 mt Launches (Six 80 mt LV Launches to include backup vehicles)AAAAAAAAAAAAAAAAAAAAAAAAAAAAAAAAAAAA
AAAAAAAAAAAAAAAAAAAAAAAAAAAAAAAAAAAAAAAAAAAAAAAAAAAAAAAAAAAAAAAAAAAAAAAAMars
Surface
MarsOrbit
EarthOrbit
Ascent StageISRU Plant
Piloted Transit/Surface Hab
Ascent StageISRU Plant
Ascent StageISRU Plant
Piloted Transit/Surface Hab
TEI Stage &Return Hab
TEI Stage &Return Hab
TEI Stage &Return Hab
AAAA
AAAA
AAAA
AAAA
AAAA
AAAA
4
Figure 3. DRM architecture.
interstage
interstage
7.6 m
8.6 m
Human Mars Mission: Design Reference Mission
DRM “Scrub v3.0” Architecture: 2011 / 2014 Opportunity
–62 days / TMI:
mab = 10.7 mt
mretHab = 21.6 mt
TEI Stage (2 RL–10s): (boil-off: 0.3%/mo ave.) mdry = 4.6 mt mp = 31.4 mt 24 RCS thrusters
mpyld = 68.4 mt
–32 days / TMI:
MLI ETO shieldingLtank = 20 m (typ)
TMI Stage: (boil-off: 1.6%/mo LEO) mdry = 22.4 mt mp = 46.5 mt
mstage = 68.9 mt
3 15 klbf NTP engines12 RCS thrusters
–92 days / TMI: mab = 16.0 mt mecrv = 5.5 mt
Ascent Stage (2): mdry = 2.6 mt mp = 35.1 mt
Surface Payload: mcargo = 32.5 mt (incl. mLH2 = 4.5 mt)
Descent Stage (4): mdry = 4.2 mt mp = 17.1 mt 24 RCS thrusters
mpyld = 77.9 mt
–2 days / TMI:
TMI Stage: mdry = 22.4 mt mp = 50.6 mt
mstage = 73.0 mt
3 15 klbf NTP engines12 RCS thrusters
28 m(max)
28 m(max)
2011 TMI Stack 1: 137.3 mt 2011 TMI Stack 2: 150.8 mt 2014 TMI Stack (5): 142.4 mt
–62 days / TMI:
mab = 14.0 mt
mcrew = 0.5 mt
Surface Payload: mtransHab = 19.3 mt mmisc = 9.8 mt
Descent Stage (4): mdry = 4.2 mt mp = 17.3 mt 24 RCS thrusters
mpyld = 65.1 mt
–32 days / TMI:
TMI Stage: mdry = 25.6 mt mp = 51.6 mt
mstage = 77.3 mt
3 15 klbf NTP engines12 RCS thrusters
interstage
interstage
interstage
interstage
SurfacePayload
Envelope
5
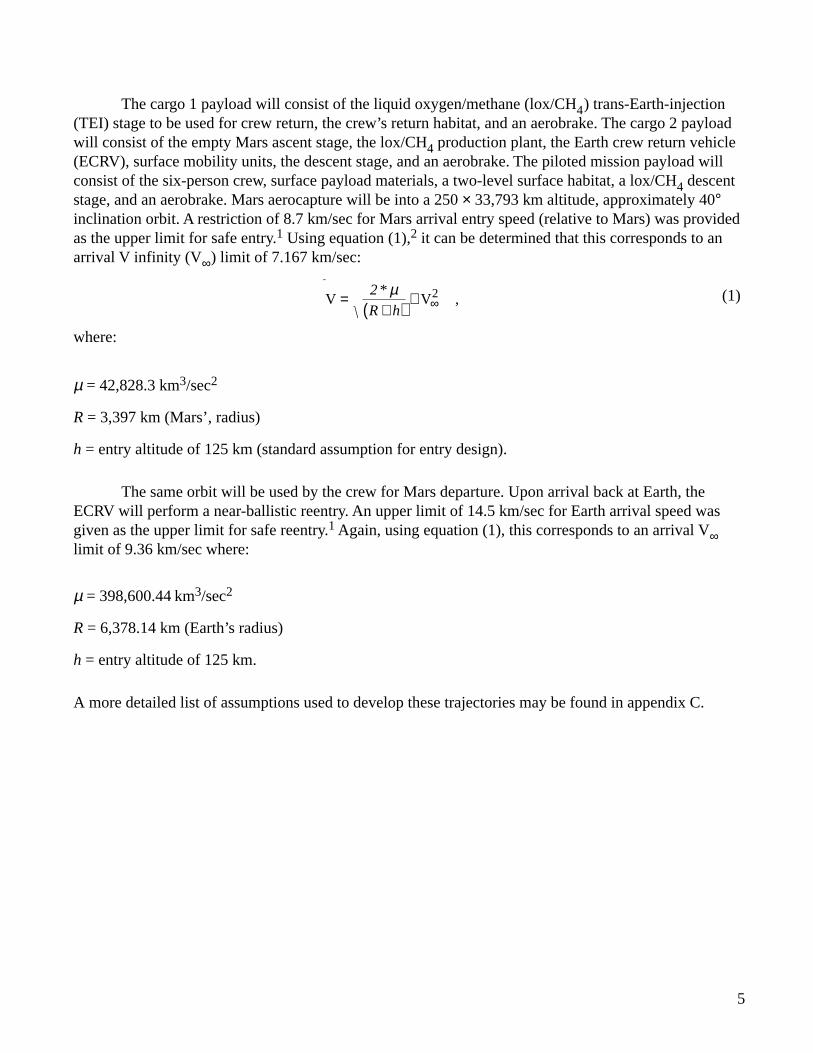
The cargo 1 payload will consist of the liquid oxygen/methane (lox/CH4) trans-Earth-injection(TEI) stage to be used for crew return, the crew’s return habitat, and an aerobrake. The cargo 2 payloadwill consist of the empty Mars ascent stage, the lox/CH4 production plant, the Earth crew return vehicle(ECRV), surface mobility units, the descent stage, and an aerobrake. The piloted mission payload willconsist of the six-person crew, surface payload materials, a two-level surface habitat, a lox/CH4 descentstage, and an aerobrake. Mars aerocapture will be into a 250 × 33,793 km altitude, approximately 40°inclination orbit. A restriction of 8.7 km/sec for Mars arrival entry speed (relative to Mars) was providedas the upper limit for safe entry.1 Using equation (1),2 it can be determined that this corresponds to anarrival V infinity (V∞) limit of 7.167 km/sec:
(1)
where:
µ = 42,828.3 km3/sec2
R = 3,397 km (Mars’, radius)
h = entry altitude of 125 km (standard assumption for entry design).
The same orbit will be used by the crew for Mars departure. Upon arrival back at Earth, theECRV will perform a near-ballistic reentry. An upper limit of 14.5 km/sec for Earth arrival speed wasgiven as the upper limit for safe reentry.1 Again, using equation (1), this corresponds to an arrival V∞limit of 9.36 km/sec where:
µ = 398,600.44 km3/sec2
R = 6,378.14 km (Earth’s radius)
h = entry altitude of 125 km.
A more detailed list of assumptions used to develop these trajectories may be found in appendix C.
V V2=+( )
+ ∞2*
R h
µ,
6
GENERAL TRAJECTORY CHARACTERISTICS
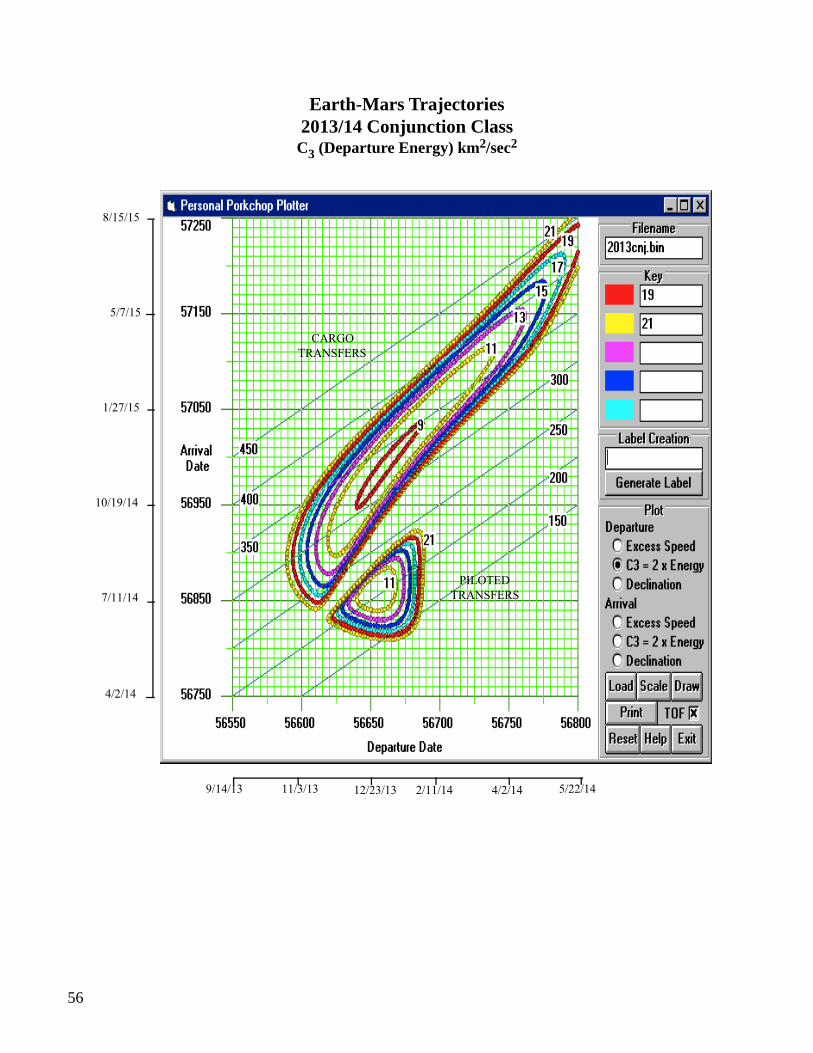
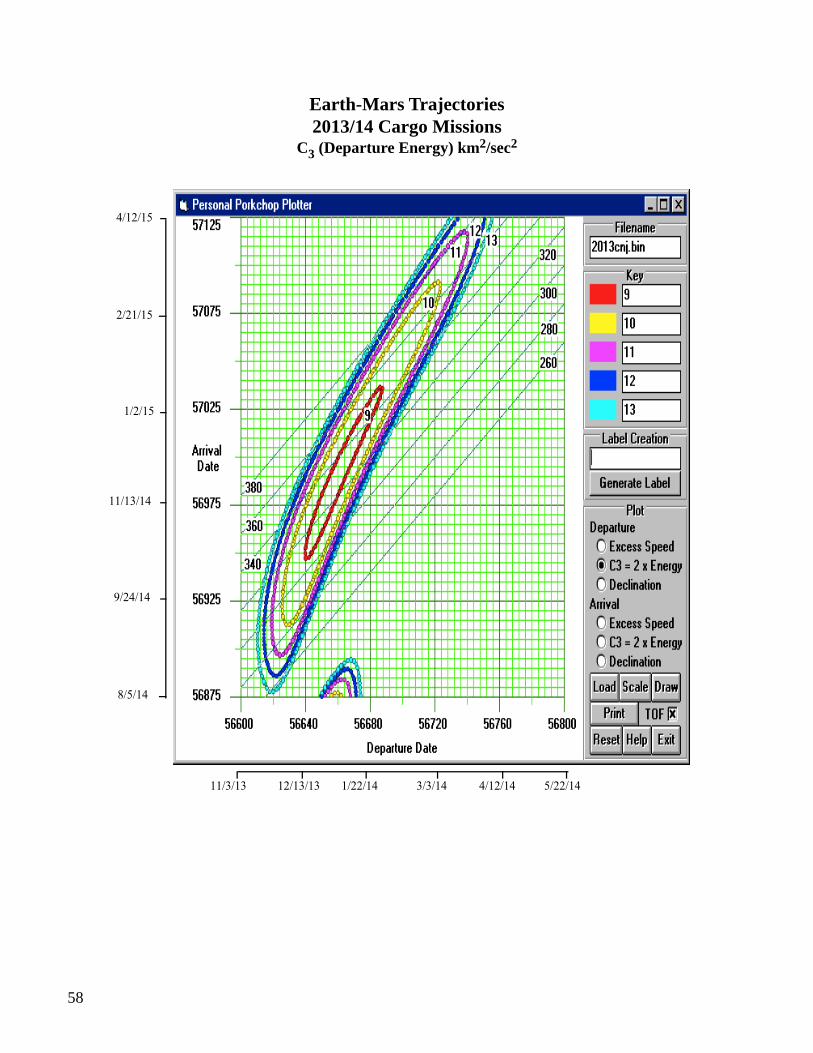
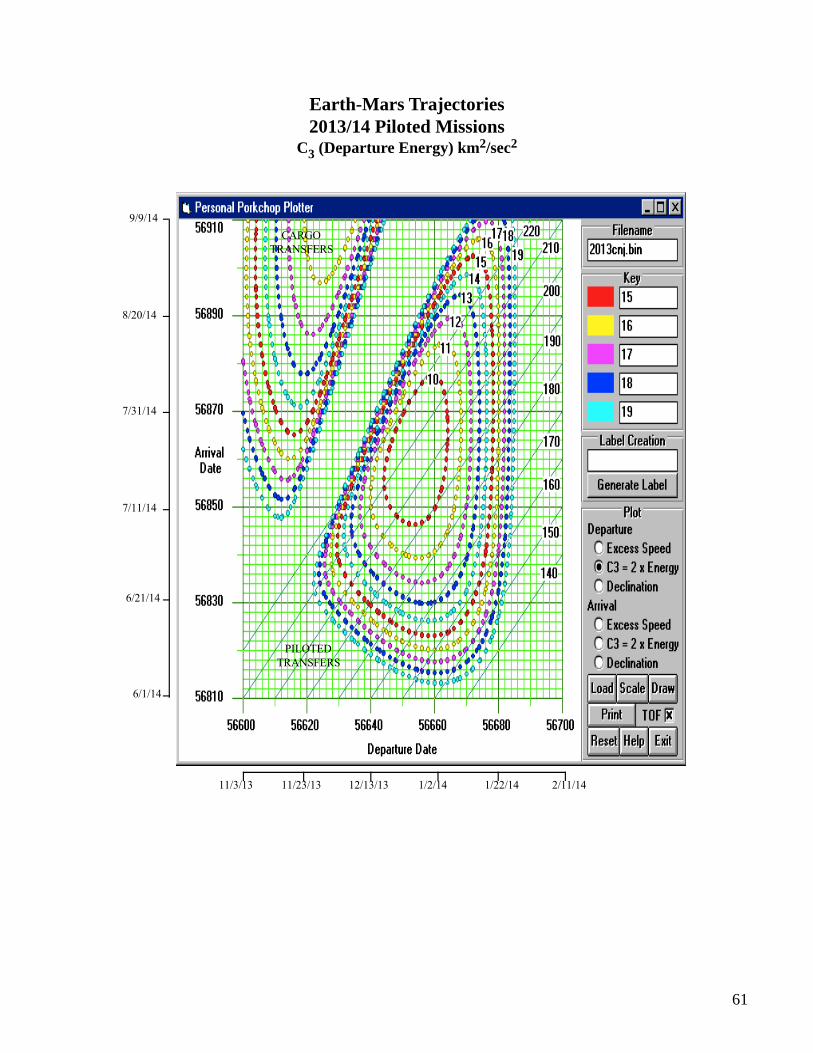
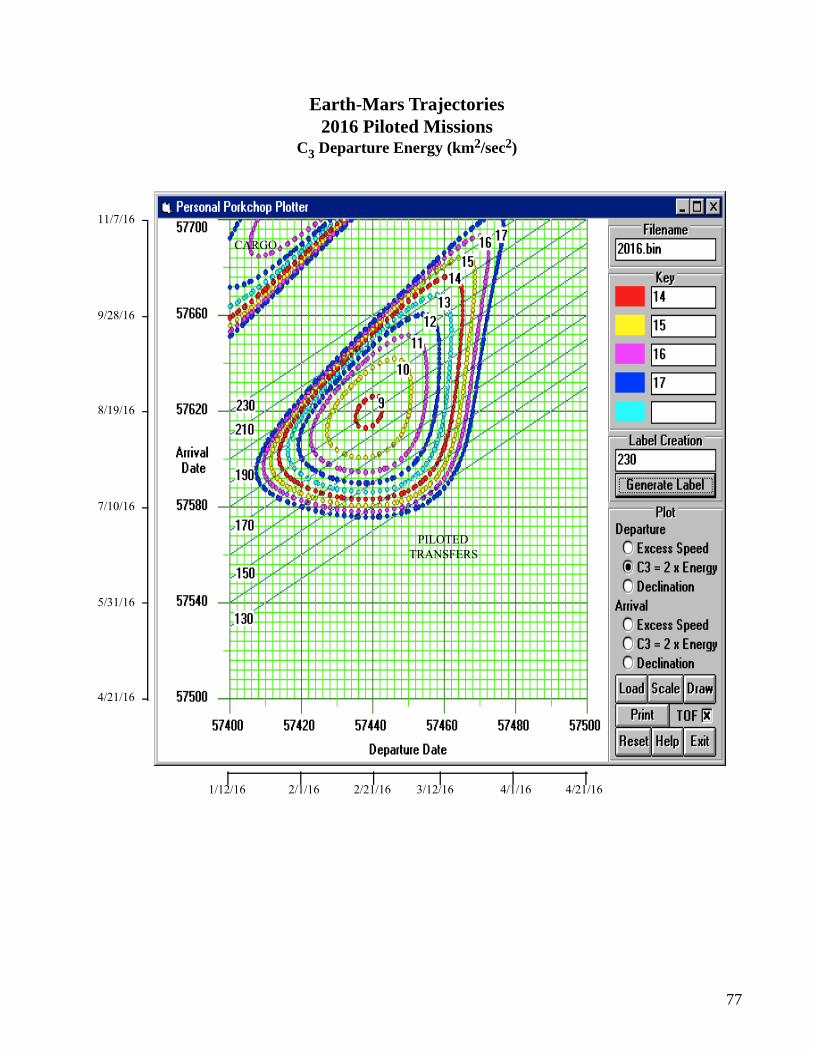
Before determining the optimal trajectories for each cargo and piloted flight, general trajectoryinformation needs to be developed and understood for each mission opportunity. This process beganwith the development of “porkchop” plots for each mission opportunity. The MAnE software tool wasused to compute a large number of trajectories. The (departure energies) C3s from these trajectories werethen plotted along with other mission data for ranges of Earth departure/Mars arrival and Mars depar-ture/Earth arrival dates. This information was then used to choose the departure and arrival dates fromwhich the MAnE module HIHTOP could optimize to a particular solution. For more information onMAnE, see appendix D.
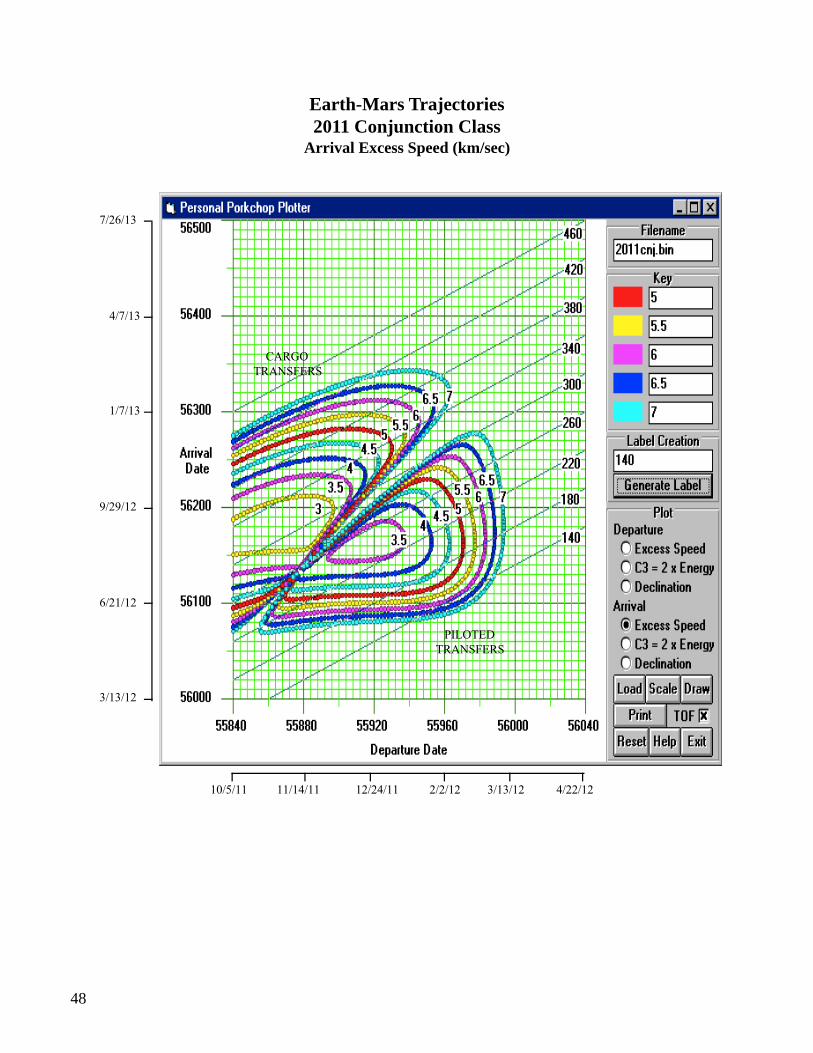
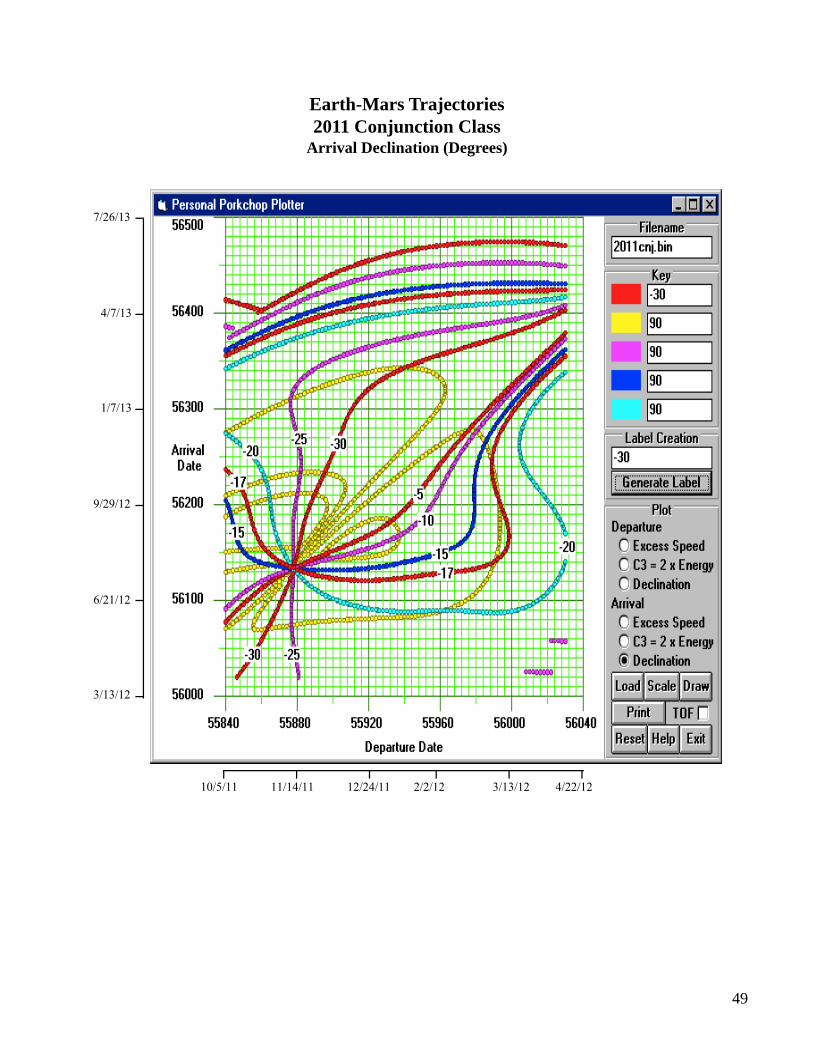
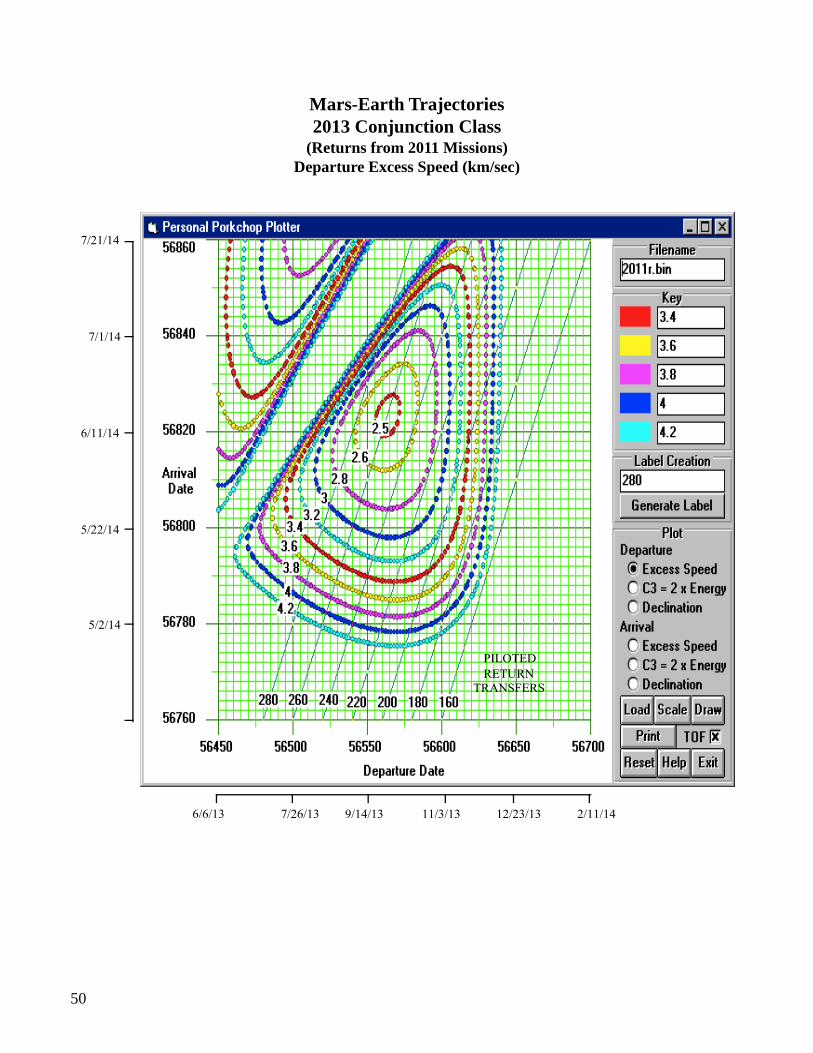
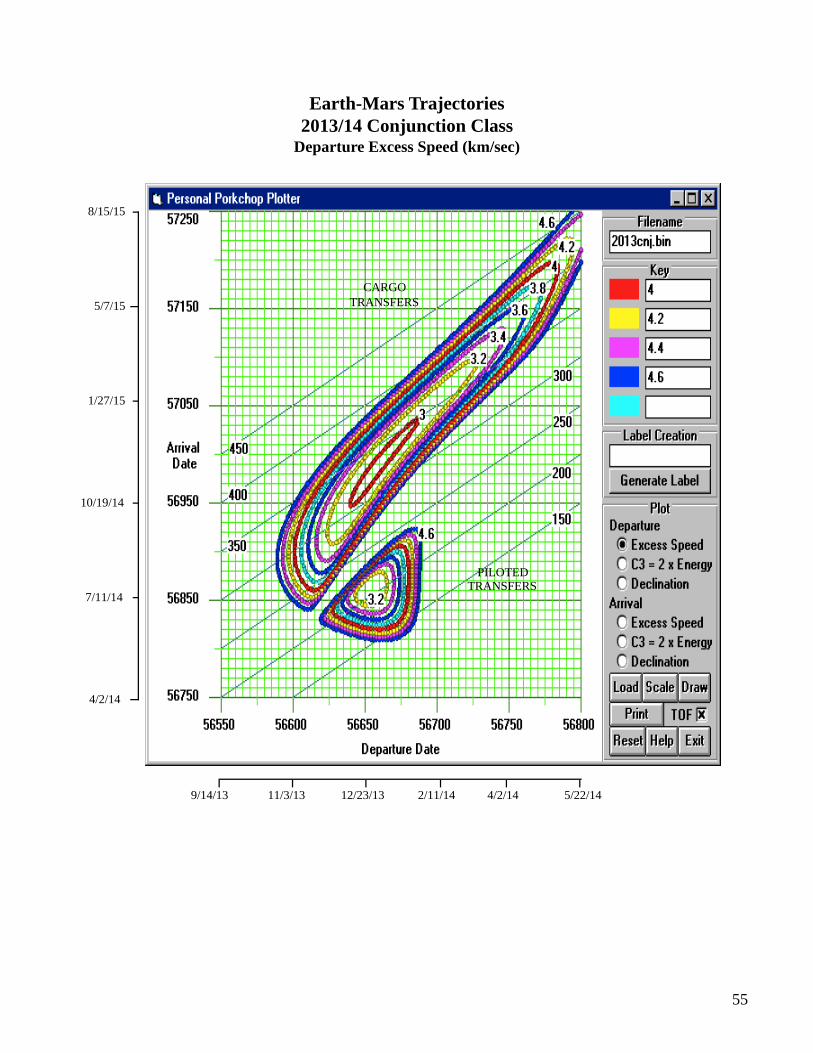
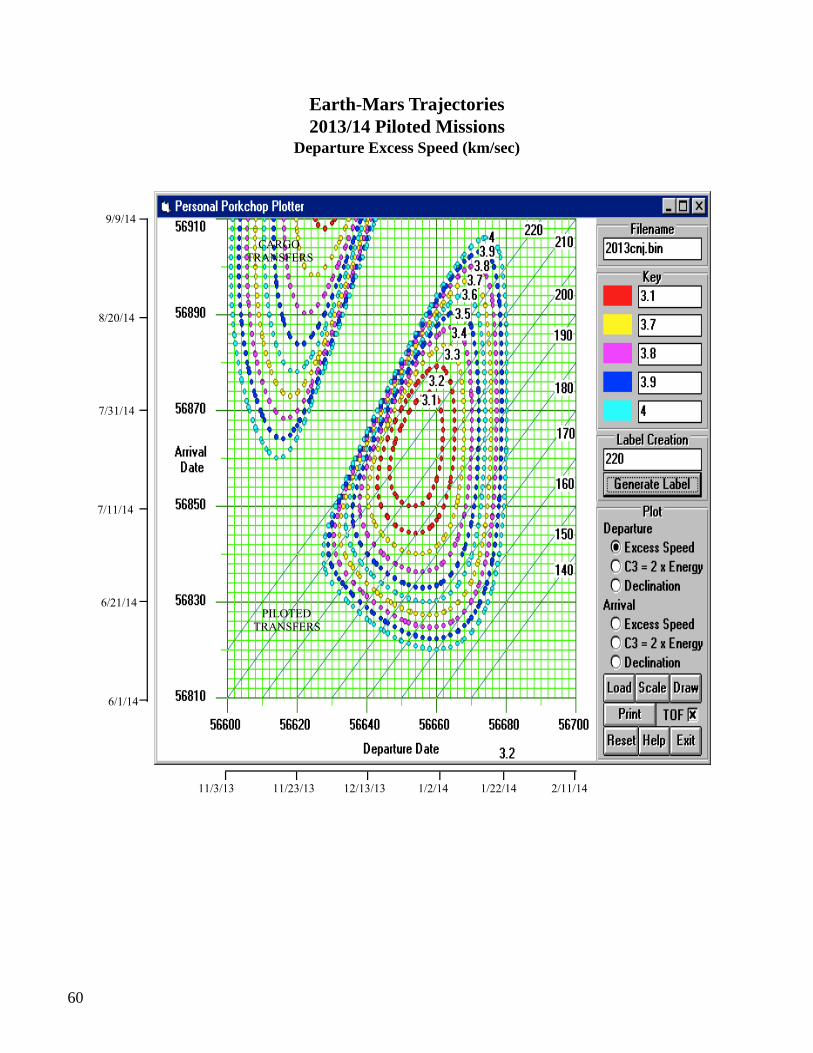
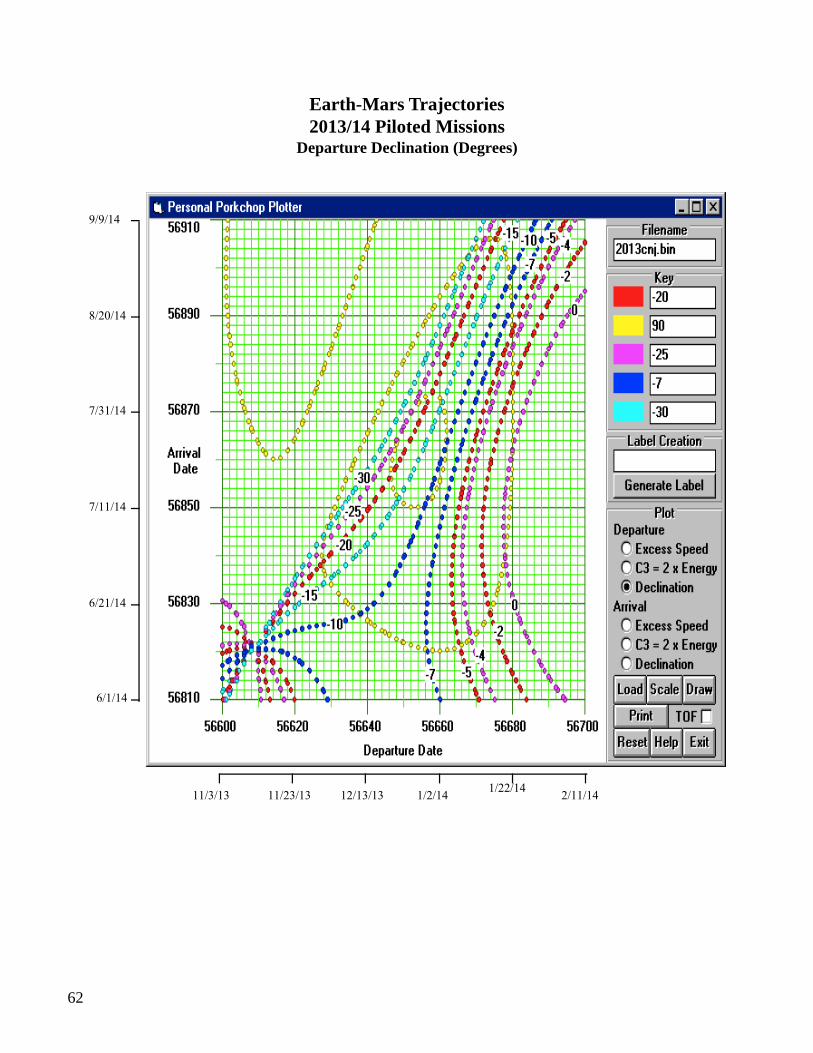
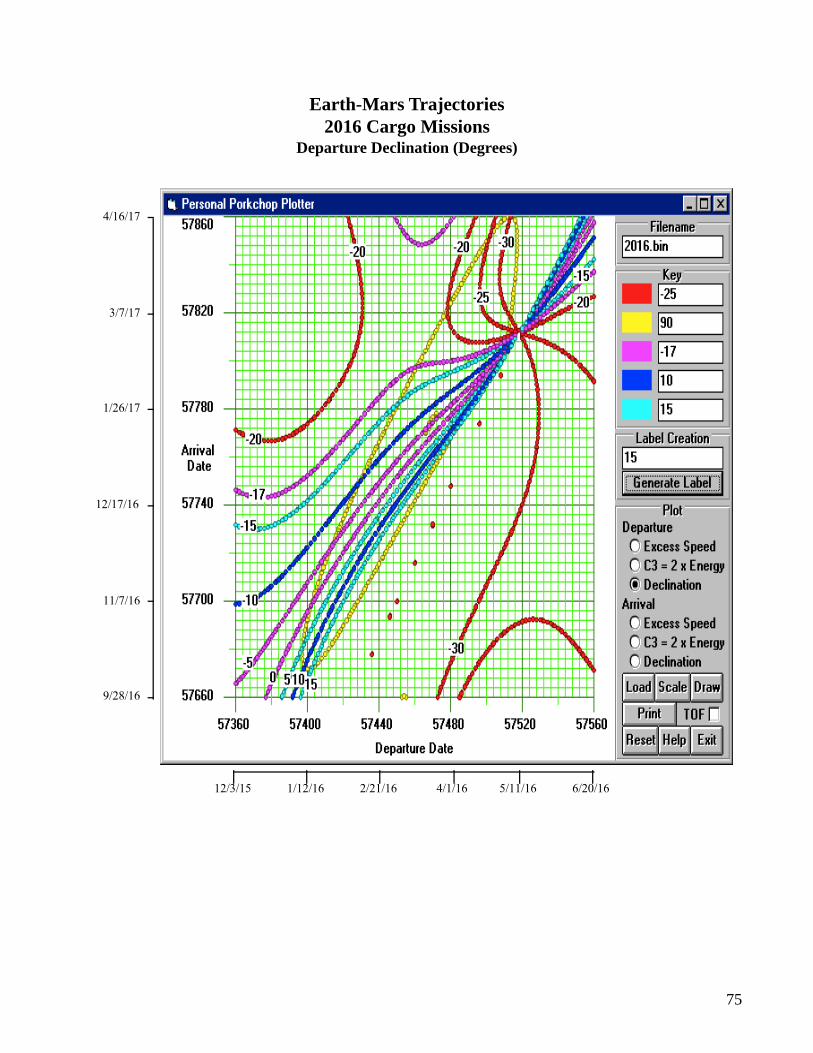
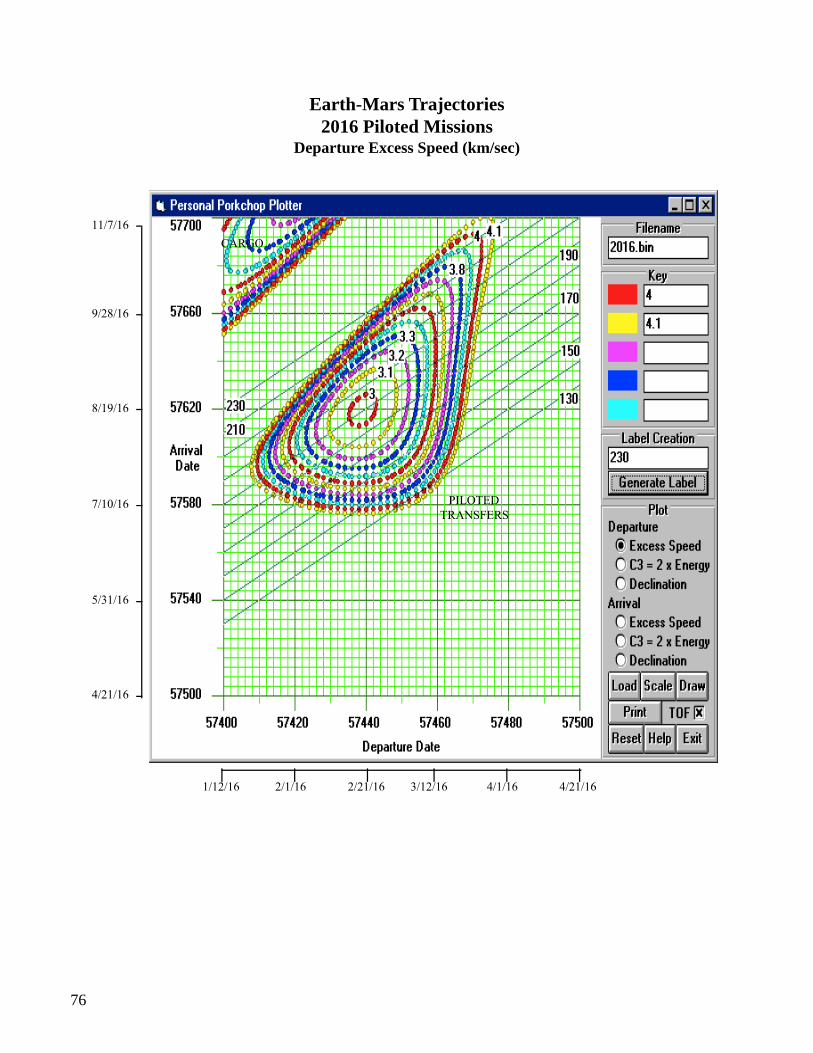
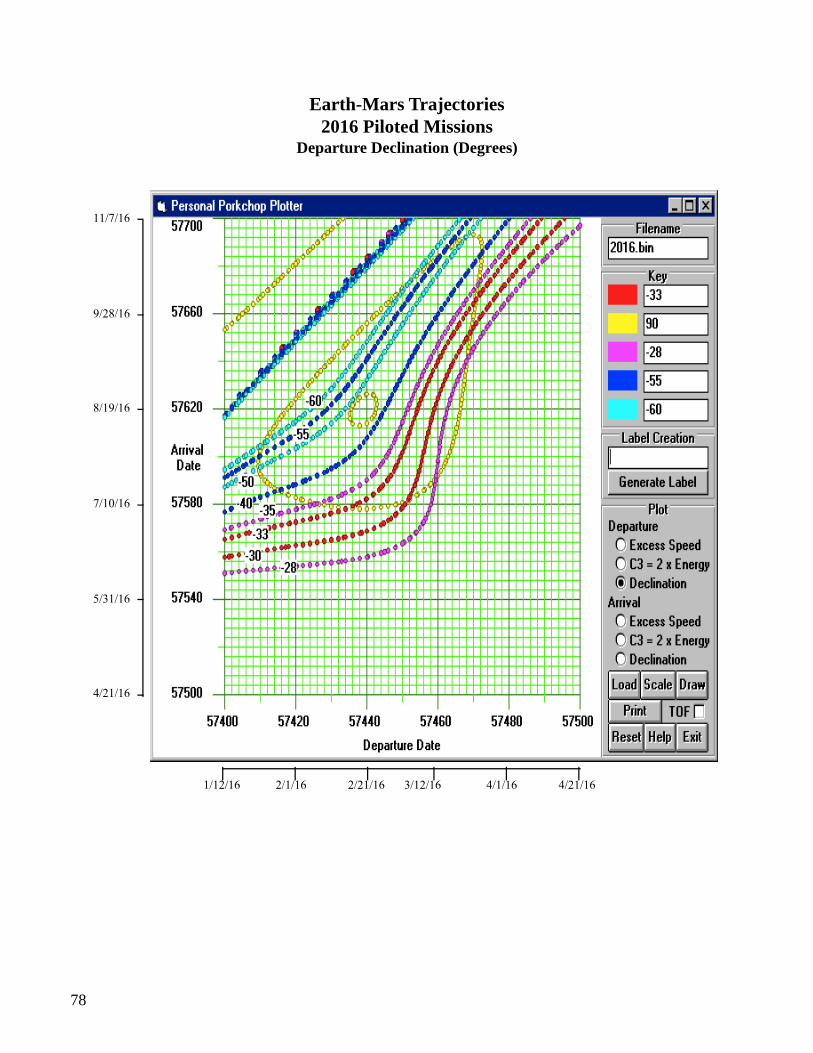
The mission spaces in appendix A represent this trajectory performance information. Plotsshowing departure excess velocity, departure energy, departure declination, arrival energy, and arrivaldeclination were developed for each opportunity. Each plot includes departure and arrival dates givenin both Julian and Gregorian dates. Most of the plots also include diagonal time-of-flight (TOF) lines.The plots are also clearly marked with the most applicable mission opportunity type—cargo or piloted—given the baseline mission and assumptions described above.
Two classes of missions are normally used to described Earth-Mars transfers. In order to mini-mize the energy required for the transfer, it is desirable for the Earth at launch and the target planet atarrival to be nearly in direct opposition (Hohmann transfer). These are conjunction class missions, andfor Earth/Mars, the launch opportunities, or synodic periods, for these transfers occur every 780 days(2.14 years). Opposition transfers are those where Mars and Earth are closest (i.e., on the same side ofthe Sun). They can often be very short in duration, but at a tradeoff of much more energy.3 For thesestudies, only conjunction class missions were investigated.
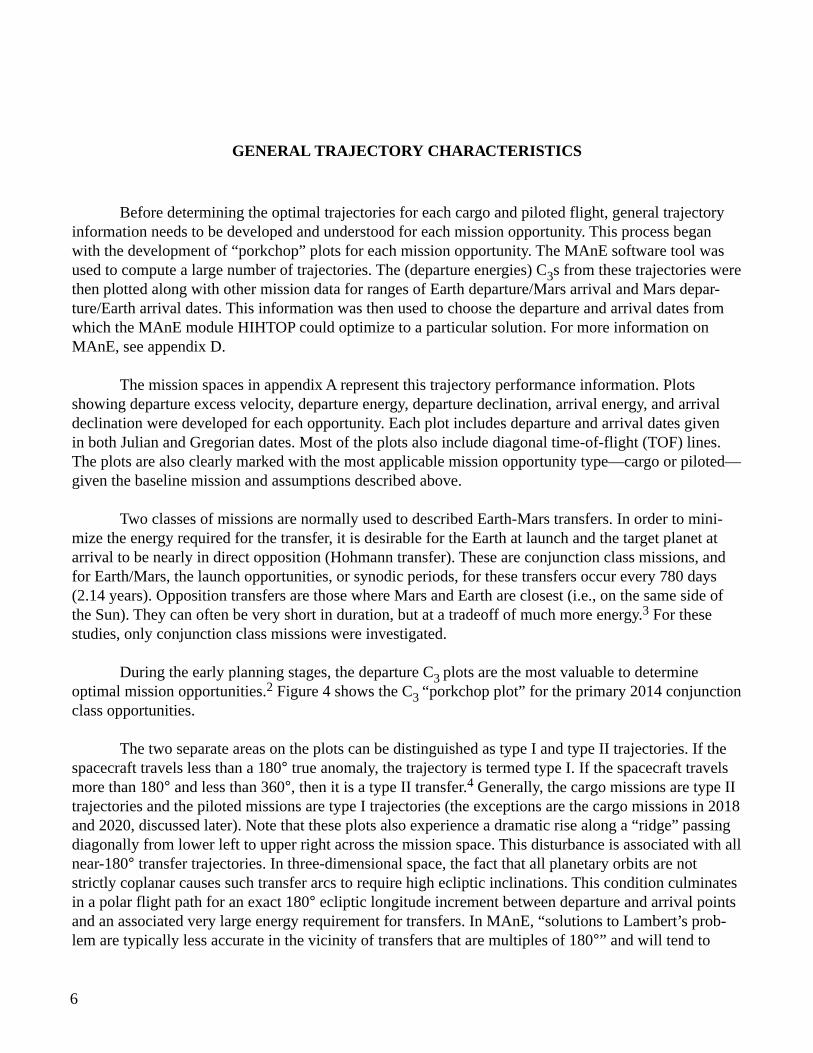
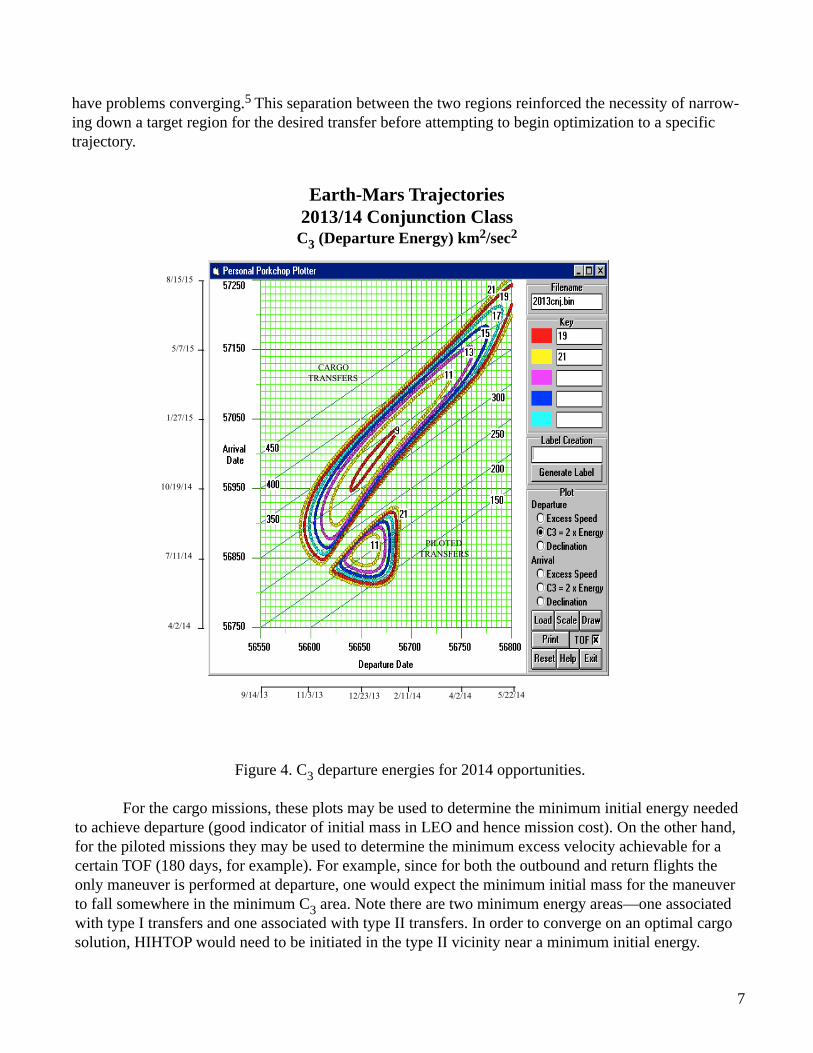
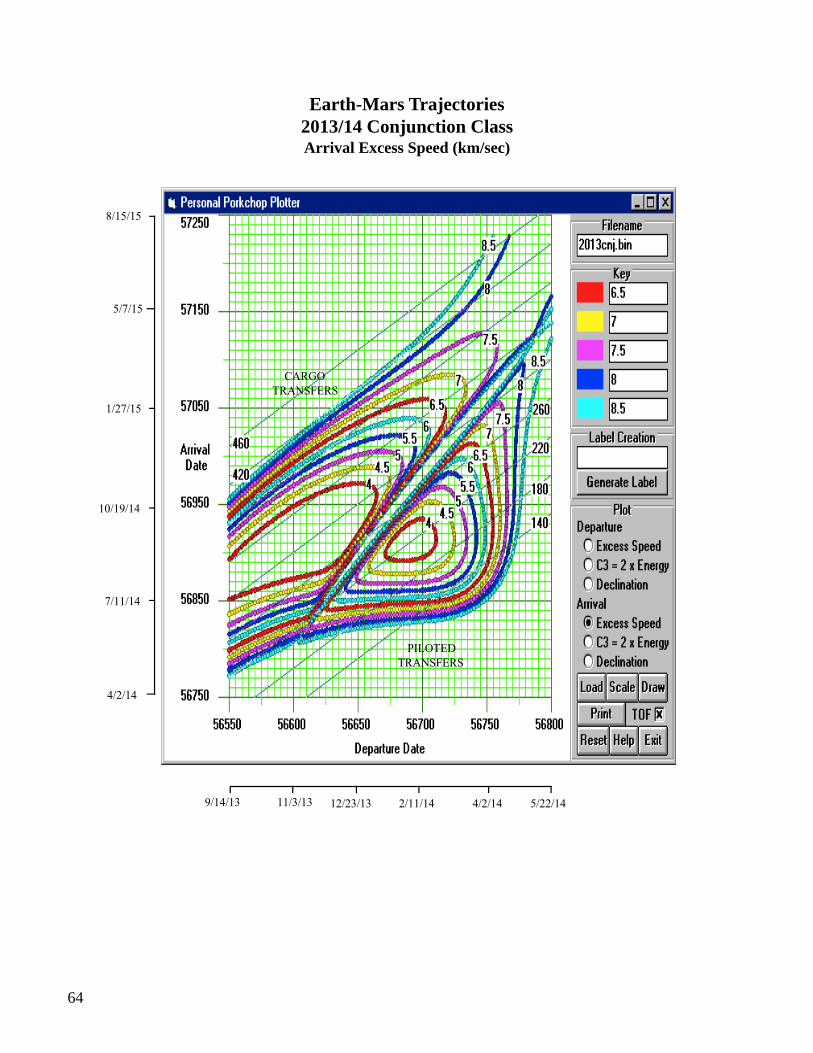
During the early planning stages, the departure C3 plots are the most valuable to determineoptimal mission opportunities.2 Figure 4 shows the C3 “porkchop plot” for the primary 2014 conjunctionclass opportunities.
The two separate areas on the plots can be distinguished as type I and type II trajectories. If thespacecraft travels less than a 180° true anomaly, the trajectory is termed type I. If the spacecraft travelsmore than 180° and less than 360°, then it is a type II transfer.4 Generally, the cargo missions are type IItrajectories and the piloted missions are type I trajectories (the exceptions are the cargo missions in 2018and 2020, discussed later). Note that these plots also experience a dramatic rise along a “ridge” passingdiagonally from lower left to upper right across the mission space. This disturbance is associated with allnear-180° transfer trajectories. In three-dimensional space, the fact that all planetary orbits are notstrictly coplanar causes such transfer arcs to require high ecliptic inclinations. This condition culminatesin a polar flight path for an exact 180° ecliptic longitude increment between departure and arrival pointsand an associated very large energy requirement for transfers. In MAnE, “solutions to Lambert’s prob-lem are typically less accurate in the vicinity of transfers that are multiples of 180°” and will tend to
7
have problems converging.5 This separation between the two regions reinforced the necessity of narrow-ing down a target region for the desired transfer before attempting to begin optimization to a specifictrajectory.
Figure 4. C3 departure energies for 2014 opportunities.
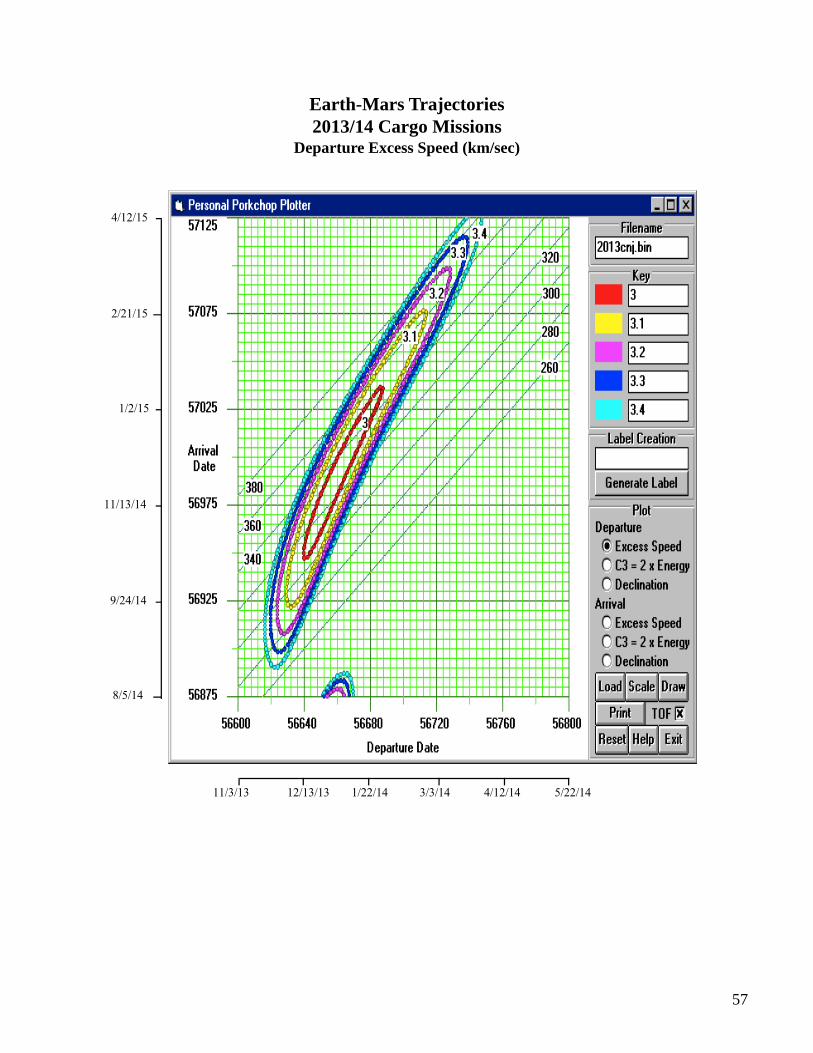
For the cargo missions, these plots may be used to determine the minimum initial energy neededto achieve departure (good indicator of initial mass in LEO and hence mission cost). On the other hand,for the piloted missions they may be used to determine the minimum excess velocity achievable for acertain TOF (180 days, for example). For example, since for both the outbound and return flights theonly maneuver is performed at departure, one would expect the minimum initial mass for the maneuverto fall somewhere in the minimum C3 area. Note there are two minimum energy areas—one associatedwith type I transfers and one associated with type II transfers. In order to converge on an optimal cargosolution, HIHTOP would need to be initiated in the type II vicinity near a minimum initial energy.
8/15/15
5/7/15
1/27/15
10/19/14
7/11/14
4/2/14
9/14/13 5/22/1411/3/13 12/23/13 2/11/14 4/2/14
CARGOTRANSFERS
PILOTEDTRANSFERS
Earth-Mars Trajectories2013/14 Conjunction ClassC3 (Departure Energy) km2/sec2
8
The preferred choice of the two solutions depends on the circumstances. For example, for the2014 cargo missions in figure 4, the optimal condition would be in the center of the 3 km/sec departurevelocity. In this case, a departure date (modified Julian date) of 56660 with a transfer time of 325 dayswas used as a starting point to find the lowest initial mass in LEO. On the other hand, for the pilotedmission, a 180-day transfer would require a higher departure speed (around 3.4 km/sec). In this case astarting point of 56660 with an end condition specified of 180 days in flight was used as the startingpoint for optimization.
Occasionally, arrival speeds at Mars and Earth were too large to allow for safe aerobraking orreentry. In these circumstances, the Mars arrival excess velocity or Earth arrival excess velocity plotswere examined for launch and arrival dates that met constraints. The departure and arrival dates could bemodified appropriately while specifying the upper limit of the allowable entry velocity as a MAnE endcondition.
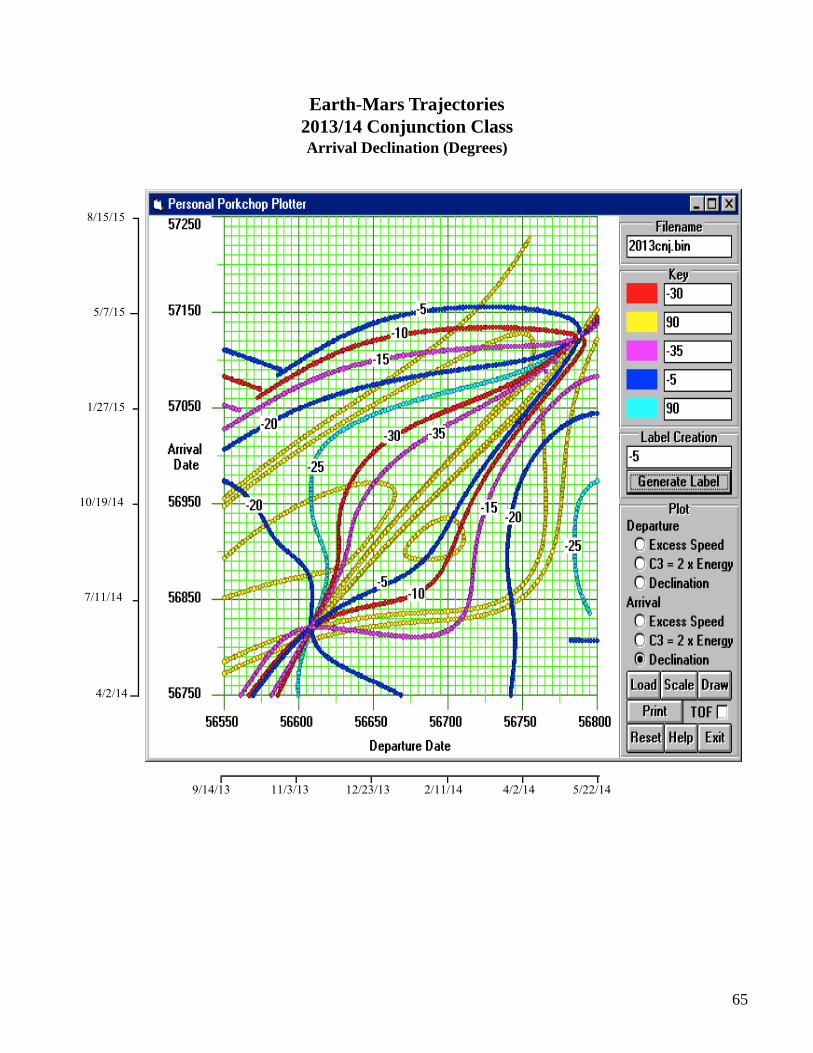
It is envisioned that the declination plots will not be used until much later in the design process,but they are included here for completeness. If there is a limit or desired declination determined duringlater planning phases, the contour plots can provide information on available launch and arrival dates tomeet those constraints.
9
MISSION OPPORTUNITIES
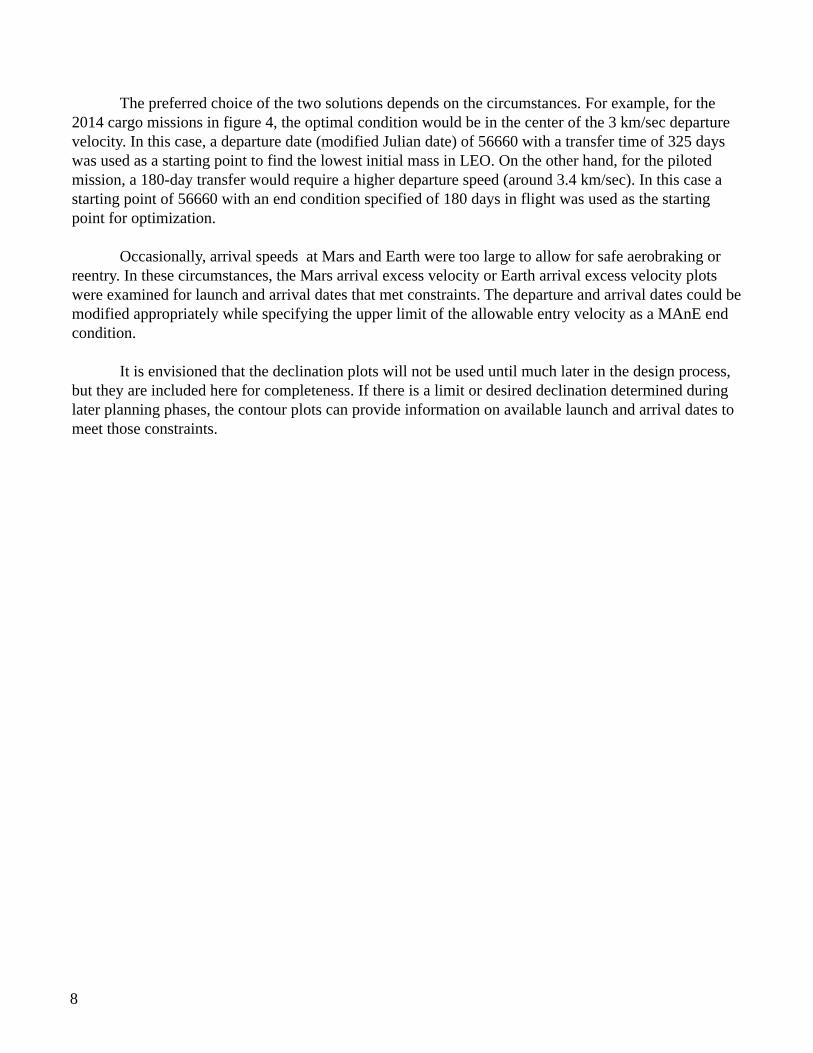
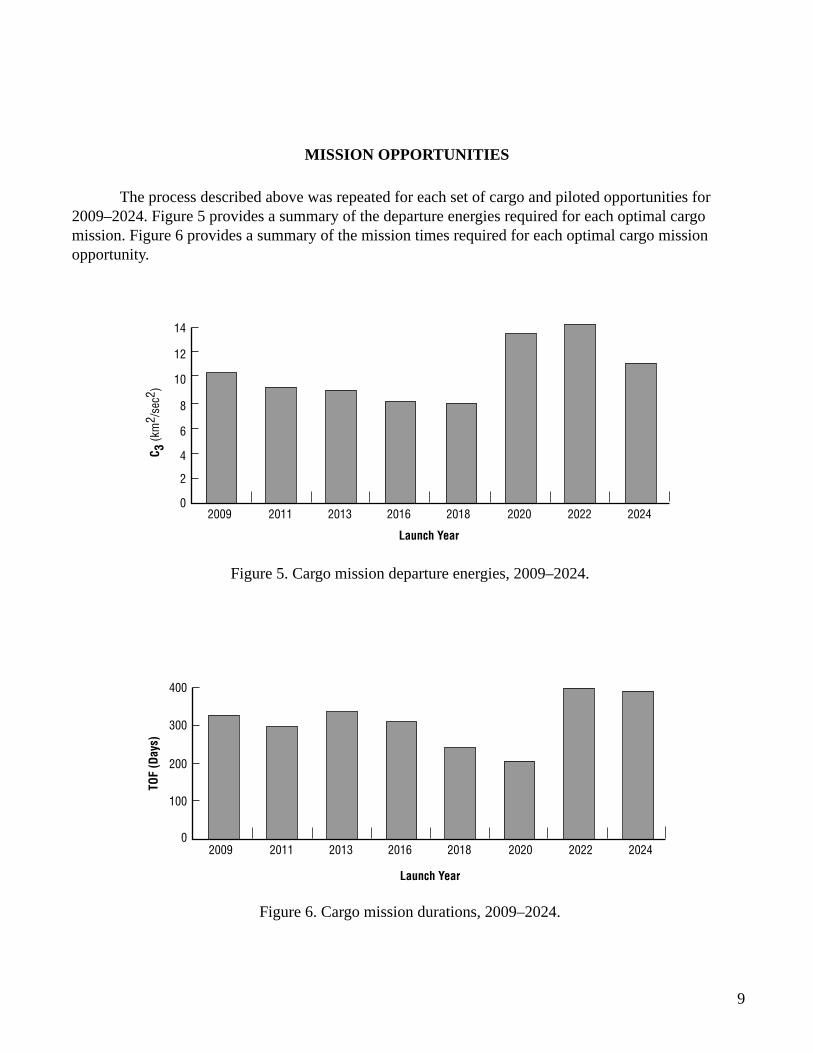
The process described above was repeated for each set of cargo and piloted opportunities for2009–2024. Figure 5 provides a summary of the departure energies required for each optimal cargomission. Figure 6 provides a summary of the mission times required for each optimal cargo missionopportunity.
Figure 5. Cargo mission departure energies, 2009–2024.
Figure 6. Cargo mission durations, 2009–2024.
10
12
14
2009 2011 2013 2016
Launch Year
C 3 (k
m2 /
sec2
)
2018 2020 2022 2024
8
6
4
2
0
2009 2011 2013 2016
Launch Year
TOF
(Day
s)
2018 2020 2022 20240
100
200
300
400
10
Table 2 summarizes the data for the 2009–2024 cargo missions. The rapid increase in departureenergy required for the 2020 cargo opportunity was unexpected. However, notice from the C3 porkchopplot in appendix A the minimum energy transfer in this case is a type I transfer—hence the higher energyand shorter mission duration. The 2018 opportunity is also type I. However, the higher energy transfermay be due to the fact that the type II arrival would coincide very closely with the Mars aphelion date ofAugust 3, 2020. It would thus be more efficient, relatively speaking, to reach Mars before that date,hence the type I transfer.
Figure 7. Cargo mission departure energies, 1990–2007.
10
12
14
16
1990 1992 1994 1996
Launch Year
C 3(km
2 /se
c2 )
1998 2000 2002 2005 2007
8
6
4
20
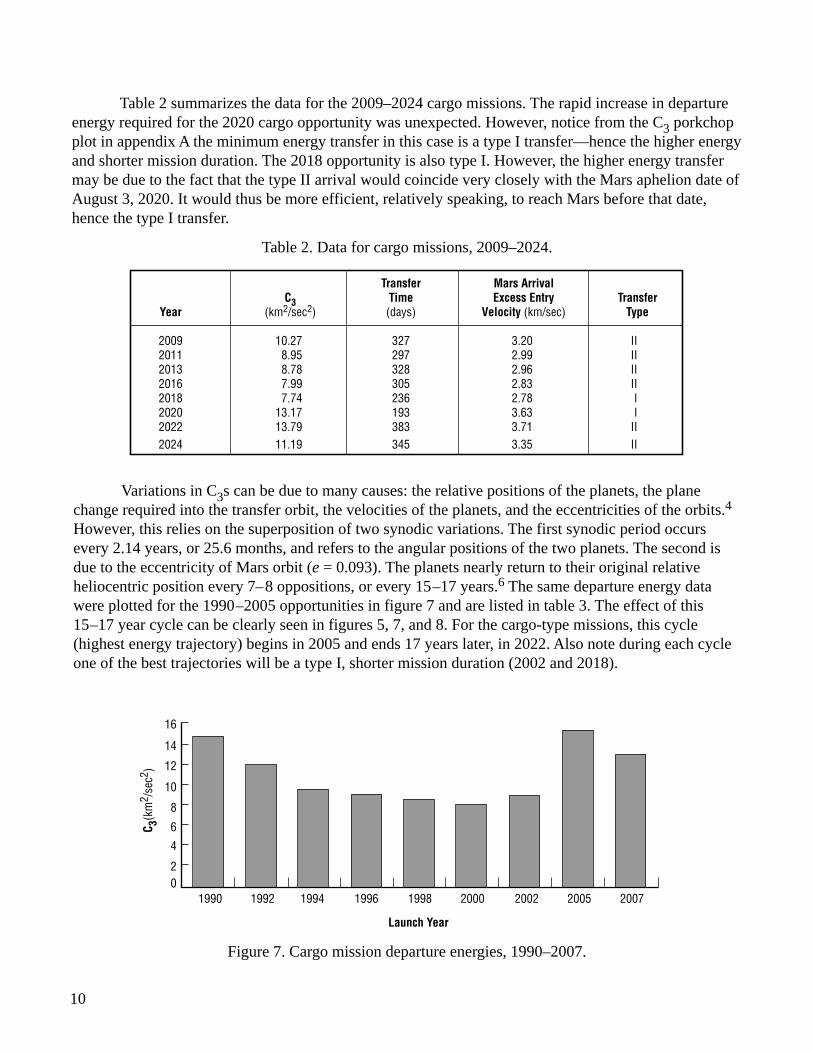
Variations in C3s can be due to many causes: the relative positions of the planets, the planechange required into the transfer orbit, the velocities of the planets, and the eccentricities of the orbits.4
However, this relies on the superposition of two synodic variations. The first synodic period occursevery 2.14 years, or 25.6 months, and refers to the angular positions of the two planets. The second isdue to the eccentricity of Mars orbit (e = 0.093). The planets nearly return to their original relativeheliocentric position every 7–8 oppositions, or every 15–17 years.6 The same departure energy datawere plotted for the 1990–2005 opportunities in figure 7 and are listed in table 3. The effect of this15–17 year cycle can be clearly seen in figures 5, 7, and 8. For the cargo-type missions, this cycle(highest energy trajectory) begins in 2005 and ends 17 years later, in 2022. Also note during each cycleone of the best trajectories will be a type I, shorter mission duration (2002 and 2018).
Table 2. Data for cargo missions, 2009–2024.
Transfer Mars ArrivalC3 Time Excess Entry Transfer
Year (km2/sec2) (days) Velocity (km/sec) Type
2009 10.27 327 3.20 II2011 8.95 297 2.99 II2013 8.78 328 2.96 II2016 7.99 305 2.83 II2018 7.74 236 2.78 I2020 13.17 193 3.63 I2022 13.79 383 3.71 II2024 11.19 345 3.35 II
11
Table 4. Data for optimal piloted missions.
Earth Departure Mars Arrival Earth Arrival Earth ArrivalExcess Entry Excess Entry Excess Entry Entry Speed
Year C3 Velocity Velocity Velocity(km2/sec2) (km/sec) (km/sec) (km/sec) (km/sec)
*2009 20.06 6.51 8.17 9.35** 14.49***2011 15.92 7.07 8.62 9.31 14.47 2014 11.04 6.79 8.39 7.34 13.292016 8.87 5.30 7.24 4.01 11.78
2018 8.11 3.26 5.91 3.50 11.61 2020 13.43 3.15 5.86 5.28 12.27*2022 19.63 4.62 6.76 7.62 13.44*2024 20.85 6.09 7.84 9.25 14.43
* Baseline trajectory.
** At the true minimum ∆V of 4,065 km/sec, the excess entry velocity at Earth is 9.56 km/sec (exceeds limit of 9.36 km/sec).
Table 3. Data for cargo missions, 1990–2007.7
Figure 8. Piloted optimal departure energies, 2009–2024.
25
2009 2011 2014 2016
Launch Year
C 3(km
2 /se
c2 )
2018 2020 2022 2024
20
15
10
5
0
C3 TransferYear (km2/s2) Type
1990 14.39 II1992 11.73 II1994 9.47 II1996 8.93 II1998 8.44 II2000 7.85 II2002 8.81 I2005 15.45 II2007 12.75 II
Figure 8 shows the piloted departure C3s for minimum initial departure mass in LEOfor 180-day outbound mission flights. Table 4 summarizes the data for these missions. The returntrips were optimized based on lowest initial mass required in Mars departure orbit.
12
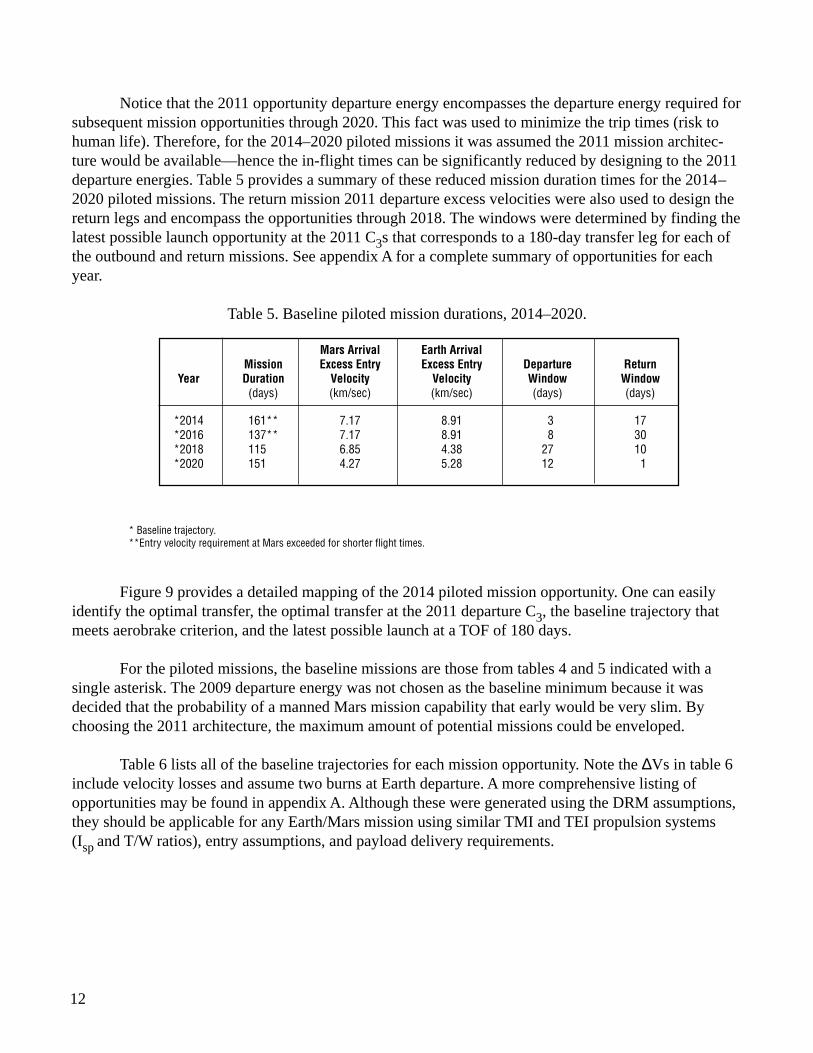
Notice that the 2011 opportunity departure energy encompasses the departure energy required forsubsequent mission opportunities through 2020. This fact was used to minimize the trip times (risk tohuman life). Therefore, for the 2014–2020 piloted missions it was assumed the 2011 mission architec-ture would be available—hence the in-flight times can be significantly reduced by designing to the 2011departure energies. Table 5 provides a summary of these reduced mission duration times for the 2014–2020 piloted missions. The return mission 2011 departure excess velocities were also used to design thereturn legs and encompass the opportunities through 2018. The windows were determined by finding thelatest possible launch opportunity at the 2011 C3s that corresponds to a 180-day transfer leg for each ofthe outbound and return missions. See appendix A for a complete summary of opportunities for eachyear.
Table 5. Baseline piloted mission durations, 2014–2020.
Mars Arrival Earth ArrivalMission Excess Entry Excess Entry Departure Return
Year Duration Velocity Velocity Window Window(days) (km/sec) (km/sec) (days) (days)
*2014 161** 7.17 8.91 3 17*2016 137** 7.17 8.91 8 30*2018 115 6.85 4.38 27 10*2020 151 4.27 5.28 12 1
* Baseline trajectory.**Entry velocity requirement at Mars exceeded for shorter flight times.
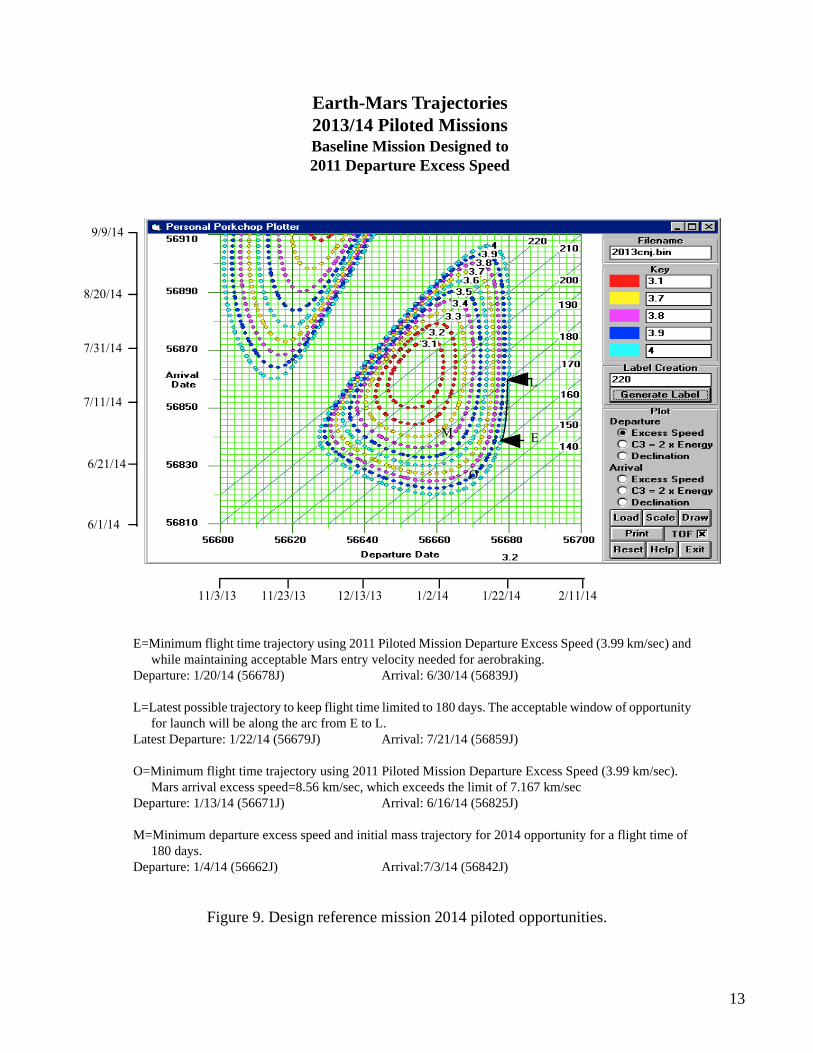
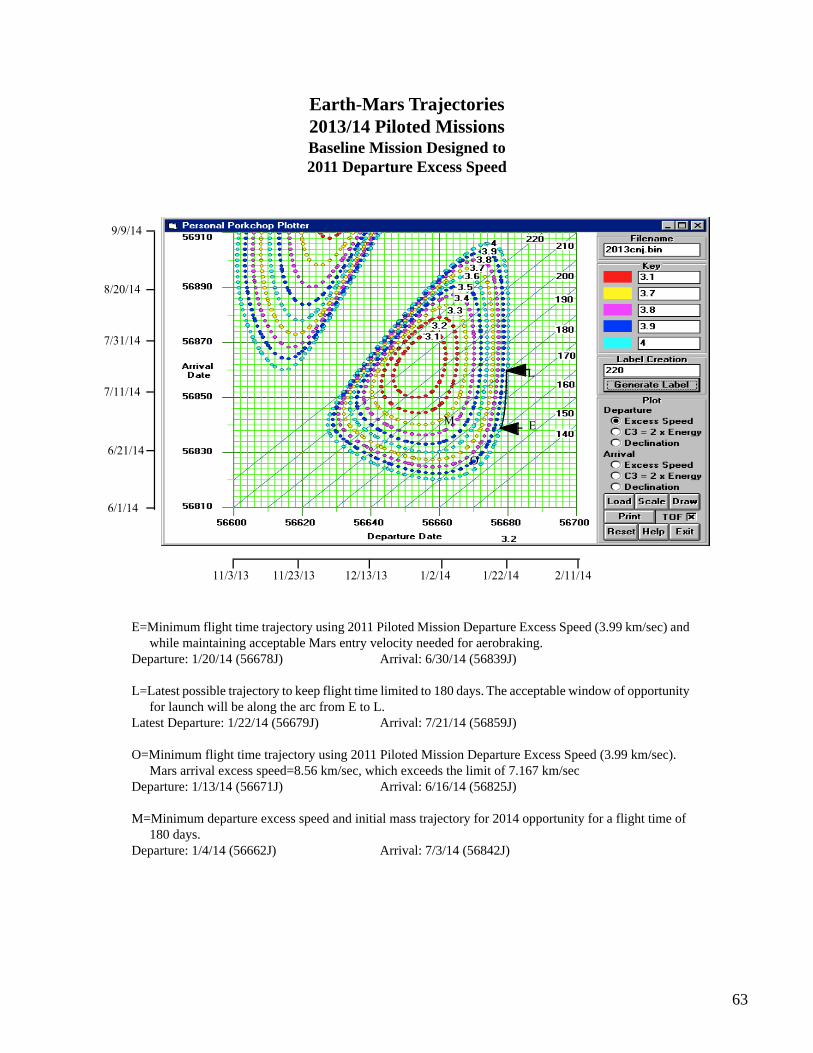
Figure 9 provides a detailed mapping of the 2014 piloted mission opportunity. One can easilyidentify the optimal transfer, the optimal transfer at the 2011 departure C3, the baseline trajectory thatmeets aerobrake criterion, and the latest possible launch at a TOF of 180 days.
For the piloted missions, the baseline missions are those from tables 4 and 5 indicated with asingle asterisk. The 2009 departure energy was not chosen as the baseline minimum because it wasdecided that the probability of a manned Mars mission capability that early would be very slim. Bychoosing the 2011 architecture, the maximum amount of potential missions could be enveloped.
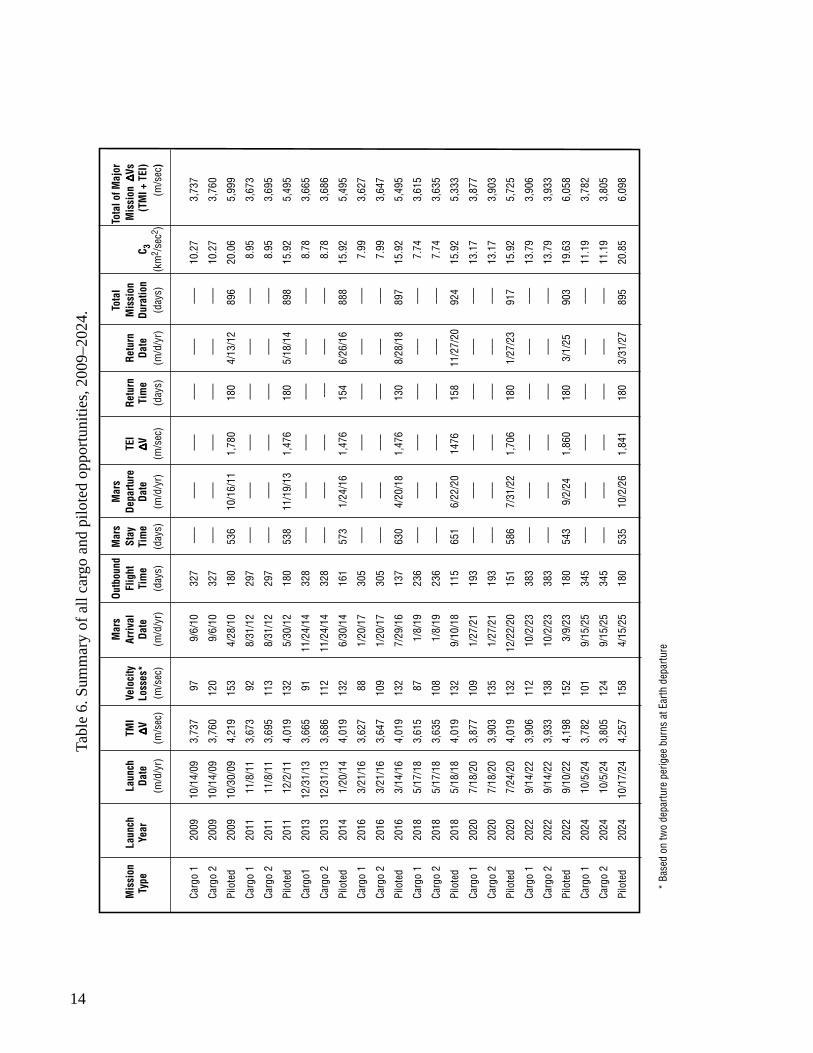
Table 6 lists all of the baseline trajectories for each mission opportunity. Note the ∆Vs in table 6include velocity losses and assume two burns at Earth departure. A more comprehensive listing ofopportunities may be found in appendix A. Although these were generated using the DRM assumptions,they should be applicable for any Earth/Mars mission using similar TMI and TEI propulsion systems(Isp and T/W ratios), entry assumptions, and payload delivery requirements.
13
Figure 9. Design reference mission 2014 piloted opportunities.
9/9/14
8/20/14
7/31/14
7/11/14
6/21/14
6/1/14
11/3/13 2/11/1411/23/13 12/13/13 1/2/14 1/22/14
E
O
L
M
Earth-Mars Trajectories2013/14 Piloted MissionsBaseline Mission Designed to2011 Departure Excess Speed
E=Minimum flight time trajectory using 2011 Piloted Mission Departure Excess Speed (3.99 km/sec) andwhile maintaining acceptable Mars entry velocity needed for aerobraking.
Departure: 1/20/14 (56678J) Arrival: 6/30/14 (56839J)
L=Latest possible trajectory to keep flight time limited to 180 days. The acceptable window of opportunityfor launch will be along the arc from E to L.
Latest Departure: 1/22/14 (56679J) Arrival: 7/21/14 (56859J)
O=Minimum flight time trajectory using 2011 Piloted Mission Departure Excess Speed (3.99 km/sec).Mars arrival excess speed=8.56 km/sec, which exceeds the limit of 7.167 km/sec
Departure: 1/13/14 (56671J) Arrival: 6/16/14 (56825J)
M=Minimum departure excess speed and initial mass trajectory for 2014 opportunity for a flight time of180 days.
Departure: 1/4/14 (56662J) Arrival:7/3/14 (56842J)
14
Tabl
e 6.
Sum
mar
y of
all
carg
o an
d pi
lote
d op
port
uniti
es, 2
009–
2024
.
Mar
sOu
tbou
ndM
ars
Mar
sTo
tal
Tot
al o
f Maj
orM
issi
onLa
unch
Laun
chTM
IVe
loci
tyAr
rival
Flig
htSt
ayDe
partu
reTE
IRe
turn
Retu
rnM
issi
on M
issi
on ∆∆∆∆ ∆
Vs T
ype
Year
Date
∆∆∆∆ ∆VLo
sses
*Da
teTi
me
Tim
eDa
te∆∆∆∆ ∆V
Tim
eDa
teDu
ratio
nC 3
(TM
I + T
EI)
(m/d
/yr)
(m/s
ec)
(m/s
ec)
(m/d
/yr)
(day
s)(d
ays)
(m/d
/yr)
(m/s
ec)
(day
s)(m
/d/y
r)(d
ays)
(km
2 /se
c2 )(m
/sec
)
Carg
o 1
2009
10/1
4/09
3,73
797
9/6/
1032
7 –
–– –
–– –
–– –
–– –
–– –
––10
.27
3,73
7
Carg
o 2
2009
10/1
4/09
3,76
012
09/
6/10
327
–––
–––
–––
–––
–––
–––
10.2
73,
760
Pilo
ted
2009
10/3
0/09
4,21
915
34/
28/1
018
053
610
/16/
111,
780
180
4/13
/12
896
20.0
65,
999
Carg
o 1
2011
11/8
/11
3,67
392
8/31
/12
297
–––
–––
–––
–––
–––
–––
8.95
3,67
3
Carg
o 2
2011
11/8
/11
3,69
511
38/
31/1
229
7 –
–– –
–– –
–– –
–– –
–– –
––8.
953,
695
Pilo
ted
2011
12/2
/11
4,01
913
25/
30/1
218
053
811
/19/
131,
476
180
5/18
/14
898
15.9
25,
495
Carg
o120
1312
/31/
133,
665
9111
/24/
1432
8 –
–– –
–– –
–– –
–– –
–– –
––8.
783,
665
Carg
o 2
2013
12/3
1/13
3,68
611
211
/24/
1432
8 –
–– –
–– –
–– -
–– –
–– –
––8.
783,
686
Pilo
ted
2014
1/20
/14
4,01
913
26/
30/1
416
157
31/
24/1
61,
476
154
6/26
/16
888
15.9
25,
495
Carg
o 1
2016
3/21
/16
3,62
788
1/20
/17
305
–––
–––
–––
–––
–––
–––
7.99
3,62
7
Carg
o 2
2016
3/21
/16
3,64
710
91/
20/1
730
5 –
–– –
–– –
–– –
–– –
–– –
––7.
993,
647
Pilo
ted
2016
3/14
/16
4,01
913
27/
29/1
613
763
04/
20/1
81,
476
130
8/28
/18
897
15.9
25,
495
Carg
o 1
2018
5/17
/18
3,61
587
1/8/
1923
6 –
–– –
–– –
–– –
–– –
–– –
––7.
743,
615
Carg
o 2
2018
5/17
/18
3,63
510
81/
8/19
236
–––
–––
–––
–––
–––
–––
7.74
3,63
5
Pilo
ted
2018
5/18
/18
4,01
913
29/
10/1
811
565
16/
22/2
014
7615
811
/27/
2092
415
.92
5,33
3
Carg
o 1
2020
7/18
/20
3,87
710
91/
27/2
119
3 –
–– –
–– –
–– –
–– –
–– –
––13
.17
3,87
7
Carg
o 2
2020
7/18
/20
3,90
313
51/
27/2
119
3 –
–– –
–– –
–– –
–– –
–– –
––13
.17
3,90
3
Pilo
ted
2020
7/24
/20
4,01
913
212
/22/
2015
158
67/
31/2
21,
706
180
1/27
/23
917
15.9
25,
725
Carg
o 1
2022
9/14
/22
3,90
611
210
/2/2
338
3 –
–– –
–– –
–– –
–– –
–– –
––13
.79
3,90
6
Carg
o 2
2022
9/14
/22
3,93
313
810
/2/2
338
3 –
–– –
–– –
–– –
–– –
–– –
––13
.79
3,93
3
Pilo
ted
2022
9/10
/22
4,19
815
23/
9/23
180
543
9/2/
241,
860
180
3/1/
2590
319
.63
6,05
8
Carg
o 1
2024
10/5
/24
3,78
210
19/
15/2
534
5 –
–– –
–– –
–– –
–– –
–– –
––11
.19
3,78
2
Carg
o 2
2024
10/5
/24
3,80
512
49/
15/2
534
5 –
–– –
–– –
–– –
–– –
–– –
––11
.19
3,80
5
Pilo
ted
2024
10/1
7/24
4,25
715
84/
15/2
518
053
510
/2/2
61,
841
180
3/31
/27
895
20.8
56,
098
* Ba
sed
on tw
o de
partu
re p
erig
ee b
urns
at E
arth
dep
artu
re
15
ADDITIONAL STUDIES AND APPENDIX INFORMATION
Total Time of Flight Trade Studies—2014 Opportunity
In addition to developing the “porkchop” plots and determining the optimal trajectories for eachmission opportunity, a few additional side studies were performed. These included TOF trade studies forthe 2014 piloted mission, T/W effects on velocity losses, all-chemical propulsion systems, and determin-ing how much time would be spent in Earth’s radiation belts.
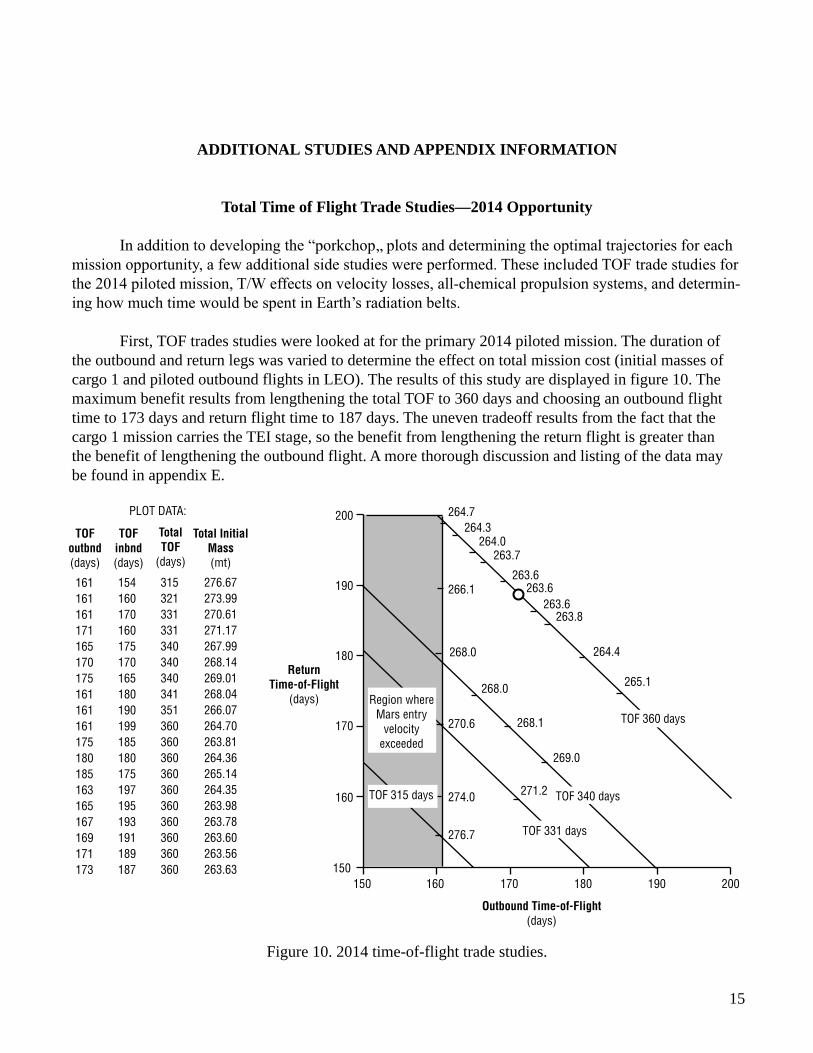
First, TOF trades studies were looked at for the primary 2014 piloted mission. The duration ofthe outbound and return legs was varied to determine the effect on total mission cost (initial masses ofcargo 1 and piloted outbound flights in LEO). The results of this study are displayed in figure 10. Themaximum benefit results from lengthening the total TOF to 360 days and choosing an outbound flighttime to 173 days and return flight time to 187 days. The uneven tradeoff results from the fact that thecargo 1 mission carries the TEI stage, so the benefit from lengthening the return flight is greater thanthe benefit of lengthening the outbound flight. A more thorough discussion and listing of the data maybe found in appendix E.
Figure 10. 2014 time-of-flight trade studies.
264.7
Return Time-of-Flight
(days)
200
190
180
170
160
150150 160 170 180 190 200
266.1
268.0
268.0
268.1
269.0
270.6
271.2274.0
276.7
264.3264.0
263.7
263.6263.6
263.6263.8
264.4
265.1
TOF 360 days
TOF 340 days
TOF 331 days
TOF 315 days
Region where Mars entry
velocity exceeded
Outbound Time-of-Flight (days)
161 161 161 171 165 170 175 161 161 161 175 180 185 163 165 167 169 171 173
154 160 170 160 175 170 165 180 190 199 185 180 175 197 195 193 191 189 187
315 321 331 331 340 340 340 341 351 360 360 360 360 360 360 360 360 360 360
276.67 273.99 270.61 271.17 267.99 268.14 269.01 268.04 266.07 264.70 263.81 264.36 265.14 264.35 263.98 263.78 263.60 263.56 263.63
TOF
outbnd (days)
TOF
inbnd (days)
Total TOF
(days)
PLOT DATA:
Total Initial Mass (mt)
16
Velocity Losses for Various Thrust-to-Weight Ratios
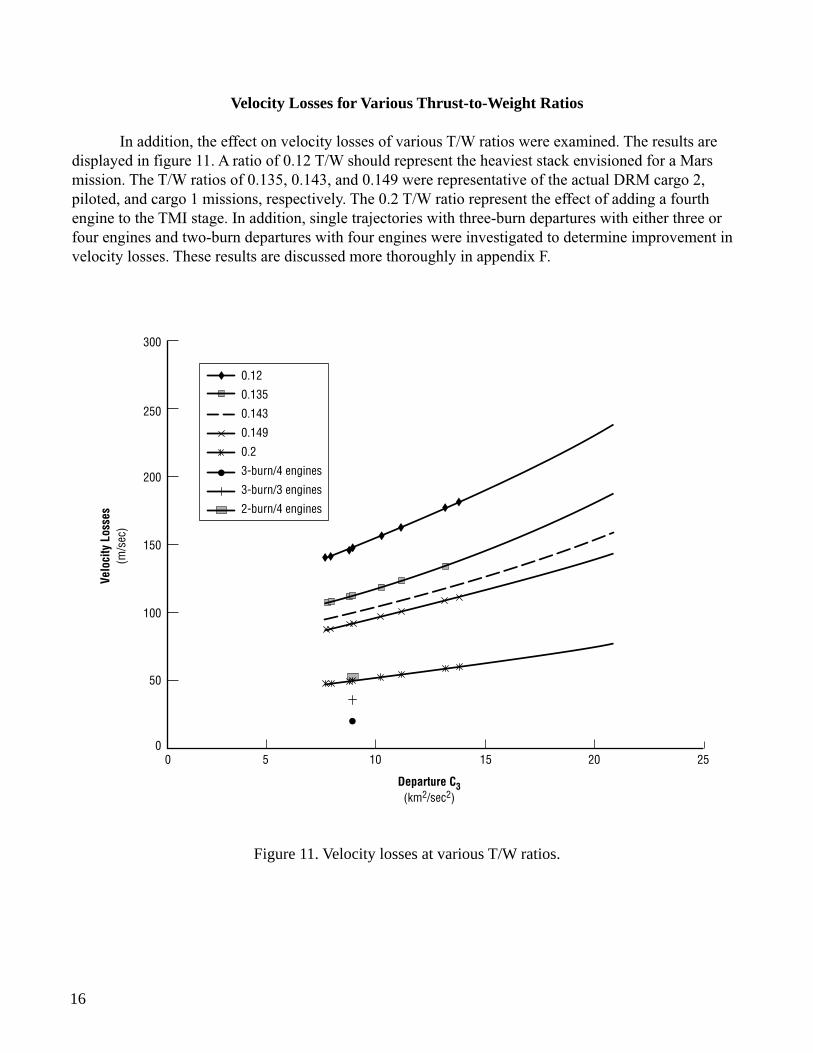
In addition, the effect on velocity losses of various T/W ratios were examined. The results aredisplayed in figure 11. A ratio of 0.12 T/W should represent the heaviest stack envisioned for a Marsmission. The T/W ratios of 0.135, 0.143, and 0.149 were representative of the actual DRM cargo 2,piloted, and cargo 1 missions, respectively. The 0.2 T/W ratio represent the effect of adding a fourthengine to the TMI stage. In addition, single trajectories with three-burn departures with either three orfour engines and two-burn departures with four engines were investigated to determine improvement invelocity losses. These results are discussed more thoroughly in appendix F.
Figure 11. Velocity losses at various T/W ratios.
0.12
0.135
0.143
0.149
0.2
3-burn/4 engines
3-burn/3 engines
2-burn/4 engines
250
300
200
150
100
Velo
city
Los
ses
(m/s
ec)
50
00 5 10 15 20 25
Departure C3 (km2/sec2)
17
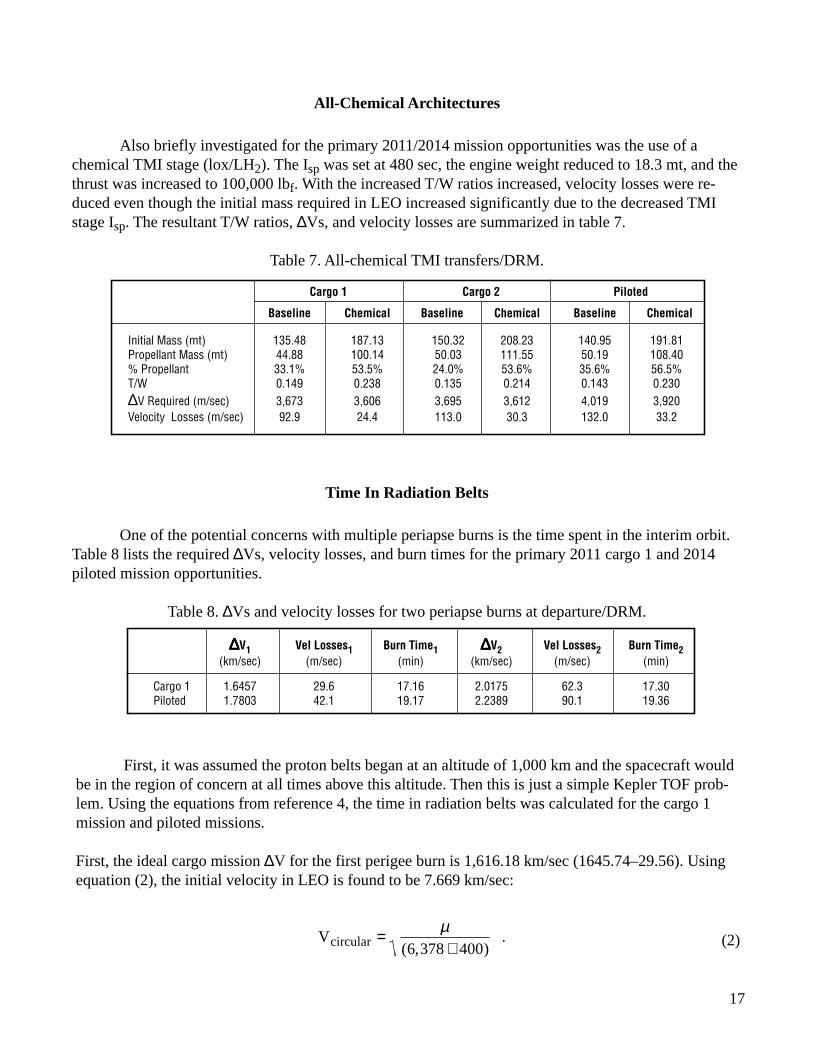
∆∆∆∆∆V1 Vel Losses1 Burn Time1 ∆∆∆∆∆V2 Vel Losses2 Burn Time2(km/sec) (m/sec) (min) (km/sec) (m/sec) (min)
Cargo 1 1.6457 29.6 17.16 2.0175 62.3 17.30Piloted 1.7803 42.1 19.17 2.2389 90.1 19.36
Cargo 1 Cargo 2 Piloted
Baseline Chemical Baseline Chemical Baseline Chemical
Initial Mass (mt) 135.48 187.13 150.32 208.23 140.95 191.81Propellant Mass (mt) 44.88 100.14 50.03 111.55 50.19 108.40% Propellant 33.1% 53.5% 24.0% 53.6% 35.6% 56.5%T/W 0.149 0.238 0.135 0.214 0.143 0.230∆V Required (m/sec) 3,673 3,606 3,695 3,612 4,019 3,920Velocity Losses (m/sec) 92.9 24.4 113.0 30.3 132.0 33.2
All-Chemical Architectures
Also briefly investigated for the primary 2011/2014 mission opportunities was the use of achemical TMI stage (lox/LH2). The Isp was set at 480 sec, the engine weight reduced to 18.3 mt, and thethrust was increased to 100,000 lbf. With the increased T/W ratios increased, velocity losses were re-duced even though the initial mass required in LEO increased significantly due to the decreased TMIstage Isp. The resultant T/W ratios, ∆Vs, and velocity losses are summarized in table 7.
Table 7. All-chemical TMI transfers/DRM.
Time In Radiation Belts
One of the potential concerns with multiple periapse burns is the time spent in the interim orbit.Table 8 lists the required ∆Vs, velocity losses, and burn times for the primary 2011 cargo 1 and 2014piloted mission opportunities.
Table 8. ∆Vs and velocity losses for two periapse burns at departure/DRM.
First, it was assumed the proton belts began at an altitude of 1,000 km and the spacecraft wouldbe in the region of concern at all times above this altitude. Then this is just a simple Kepler TOF prob-lem. Using the equations from reference 4, the time in radiation belts was calculated for the cargo 1mission and piloted missions.
First, the ideal cargo mission ∆V for the first perigee burn is 1,616.18 km/sec (1645.74–29.56). Usingequation (2), the initial velocity in LEO is found to be 7.669 km/sec:
Vcircular = µ(6,378 + 400)
. (2)
18
The velocity after performing the ∆V will be 9.2848 km/sec. Once you know this, you can find theenergy ε = –15.704 km2/sec2 of the interim orbit using equation (3):
Vcircular =+
+
=26 378 400
9 2848µ ε
( , ). km/sec . (3)
The semimajor axis, a, of the orbit can be calculated from equation (4) and found to be 12,691 km:
ε µ= – . .15 704 km /sec =(2 )
2 2
a (4)
From the radius of perigee (Rp = 6,778 km) and equation (5), the eccentricity, e, of the orbit is deter-mined to be 0.4659:
Rp = a e( – ) .1 (5)
Thus, the radius of apogee Ra from equation (6) is 18,604 km, or an altitude of 12,226 km:
Ra = a(1 + e) . (6)
The period will be 14,420 sec or 3.95 hr from equation (7):
Period =
2
3π µa . (7)
For the piloted mission, this same procedure was followed, yielding the following orbital elements:
a = 13,684 kme = 0.50468Period = 4.43 hrRa = 20,590 km (altitude 14,212 km).
Thus, both the cargo 1 and 2 and piloted missions will spend a significant amount of time in theradiation belts during the interim coast orbit. Next, the length of time the missions will spend in theproton belts was determined. At a radius vector or 7,378 km (altitude 1,000 km), the true anomaly, ν, forthe cargo mission upon entering this region can be calculated as 41.92° from equation (8):
R =a 1 – e2( )
1 + e cos ν. (8)
19
From this point, we will solve the Kepler TOF problem given an initial ν of 41.92° and a final ν of 180°.This TOF × 2 will be an approximation of the amount of time the spacecraft will spend in the radiationbelt region.
Initial and final eccentric anomalies can be found to be 0.4544 rad (Ei) and π (Ef) from equation (9):
cos E = e + cos v
1 + e cos v. (9)
Initial and final mean anomalies can be found to be 0.25 rad (Mi) and π (Mf) from equation (10):
M = E – e sin(E) . (10)
Finally, the TOF, can be found from equation (11):
Mf –Mi = n TOF , (11)
where
n = mean motion = µa3
= 0.0004415 rad/sec. (12)
For the cargo 1 mission, this total TOF (TOF found from equation (11) × 2) was found to beequal to 3.64 hr (13,100 sec), or 92 percent of the orbit period. This is probably not much of a concernfor the cargo mission. However, for the piloted mission, the TOF was 4.1 hr (14,850 sec), or 93 percentof the orbit period. Although it is expected that the majority of the radiation exposure will be during theremainder of the mission8 (estimates around 98 percent), it will need to be considered and the crewadequately protected in a two-burn departure scenario is used.
Verification of MAnE Results
One of the first tasks undertaken in this study was to verify MAnE and the HIHTOP optimizationprogram-provided correct results. These verifications consisted of two areas. First, previous trajectorieswere collected that had been generated at NASA Marshall Space Flight Center using the Swingby-Stopover Trajectory Optimization Program (SWISTO), a program that is no longer available on currentplatforms. SWISTO results were verified with MAnE runs to ensure departure energies, trajectories,and TOF’s were comparable. In addition, plots from references 7 and 9 were generated to compare theMAnE derived results. All of these verifications were successful and are described in more detail inappendix G.
20
DESCRIPTION OF TRAJECTORY CHARACTERISTICS
For each year, departure C3 and V∞ and plots are provided for all opportunities. These are fol-lowed by enlarged views of the specific cargo and piloted mission opportunities. Note for the eclipticprojections the vernal equinox reference would be pointed to the right of the page.
Earth Departure Variables
Departure V∞ (km/sec): Earth departure hyperbolic excess velocity. This is the difference be-tween the velocity of the Earth with respect to the Sun and the velocity required on the transfer ellipse.
Departure C3 (km2/sec2): Earth departure energy, or the square of the departure hyperbolicexcess velocity (V∞ ). C3 is usually the major performance parameter required for launch vehicle sizing.
Departure declination (degrees): Earth declination of the departure V∞ vector, may impose alaunch constraint.
Mars Arrival Variables
Arrival V∞ (km/sec): Mars centered arrival hyperbolic excess velocity, or difference between thearrival velocity on the transfer ellipse and the orbital velocity of the planet. It can be used to calculatethe spacecraft velocity at any altitude, h, of flyby by using the equation:9
V V2=+( )
+ ∞2
3 397*
,,
µh (13)
where:
µ= 42,828.3 km3/sec2
Mars radius = 3,397 kmh = altitude.
Arrival declination (degrees): Mars declination of the arrival V∞ vector.
21
Mars Departure Variables
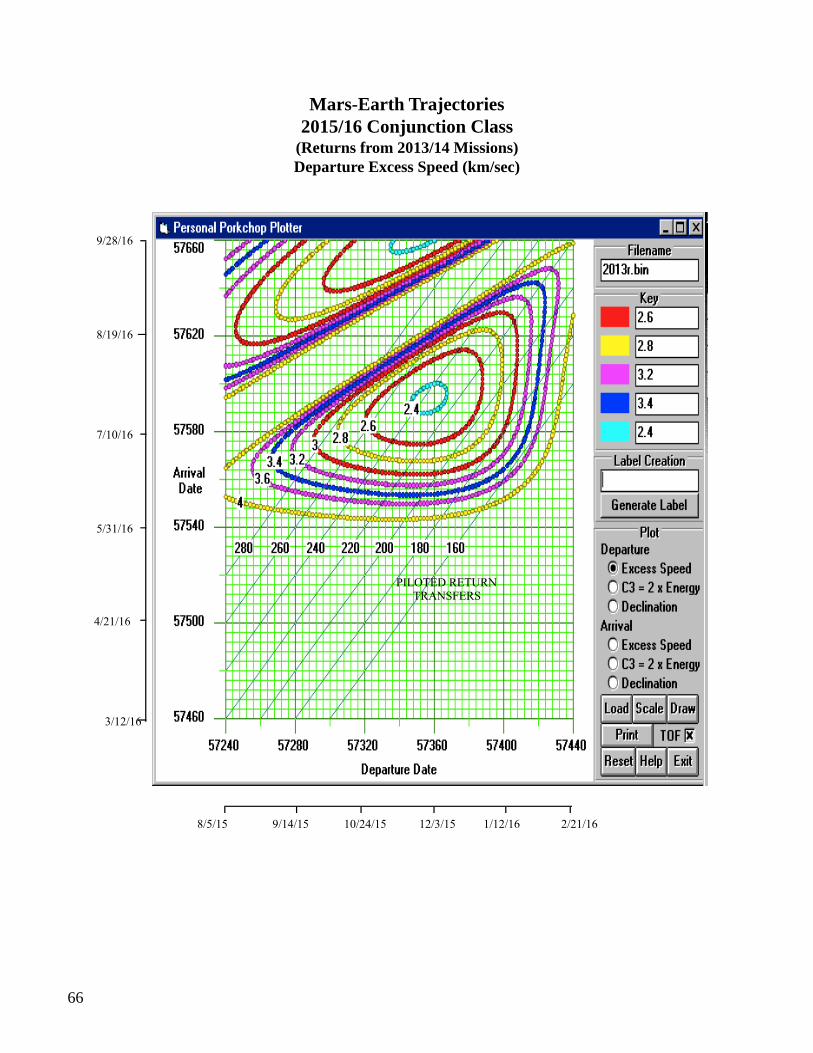
Departure V∞ (km/sec): Mars departure hyperbolic excess velocity.
Departure declination (degrees): Mars declination of the departure V∞ vector, may impose alaunch constraint.
Earth Arrival Variables
Arrival V∞ (km/sec): Earth-centered arrival hyperbolic excess velocity. It can be used to calcu-late the spacecraft velocity at any altitude h of flyby by using the equation:9
V V2=+( )
+ ∞2
6 378 14*
, .,
µh (14)
where:
µ = 398,600.44 km3/sec2
Earth’s radius = 6,378.14 km.
Arrival declination (degrees): Earth declination of the arrival V∞ vector.
22
CONCLUSIONS
In these studies, the high-thrust options for performing round-trip Mars missions were explored.Plots showing departure energies, departure speeds, and declinations, along with arrival speeds anddeclinations, are provided for each opportunity between 2009–2024. Trajectories that minimize initialmass required from LEO for both the cargo and piloted missions are summarized (piloted missions at180-day TOF’s). The 15- to 17-year cycle for optimal conditions for missions to Mars is clearly identifi-able in both missions, resulting in optimal missions for both types in 2018. In addition, by designing tohigher 2011 energies, it was determined that the piloted mission duration could be reduced by as muchas 65 days in 2018. Finally, a number of additional studies were performed, and summarized, includingthe effect of T/W ratios on gravity losses, total TOF variations, all-chemical propulsion systems, andtime spent in Earth’s radiation belts.
23
APPENDIX A—2009–2024 OPPORTUNITY PLOTS
The following trajectories and “porkchop plots” were developed using the Mission AnalysisEnvironment (MAnE) software tool for heliocentric high-thrust missions and its optimization moduleHeliocentric Interplanetary High-Thrust Trajectory Optimization program (HIHTOP). These plots showdeparture energies, departure speeds, and declinations, along with arrival speeds and declinations foreach opportunity.
24
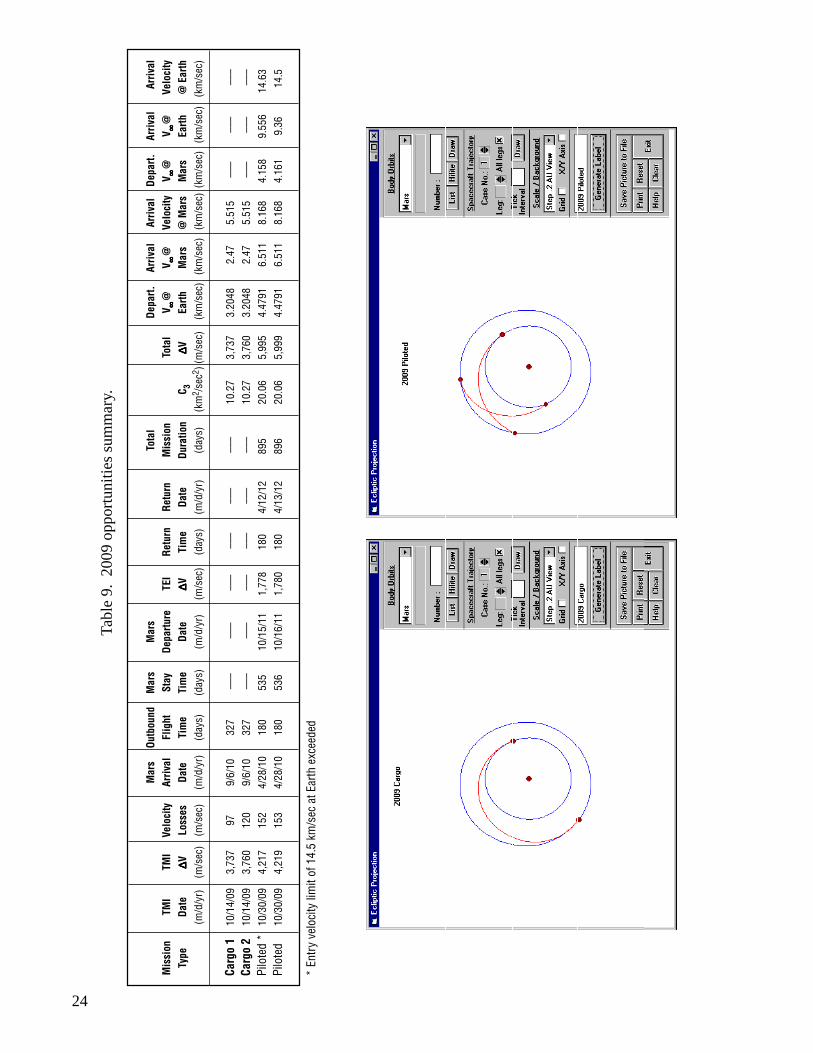
Tabl
e 9.
200
9 op
port
uniti
es s
umm
ary.
Mar
sOu
tbou
ndM
ars
Mar
sTo
tal
Depa
rt.Ar
rival
Arriv
alDe
part.
Arriv
alAr
rival
Mis
sion
TMI
TMI
Velo
city
Arriv
alFl
ight
Stay
Depa
rture
TEI
Retu
rnRe
turn
Mis
sion
Tota
lV ∞ ∞ ∞ ∞ ∞
@V ∞ ∞ ∞ ∞ ∞
@Ve
loci
tyV ∞ ∞ ∞ ∞ ∞
@V ∞ ∞ ∞ ∞ ∞
@
Velo
city
Type
Date
∆∆∆∆ ∆VLo
sses
Date
Tim
eTi
me
Date
∆∆∆∆ ∆VTi
me
Date
Dura
tion
C 3∆∆∆∆ ∆V
Earth
Mar
s@
Mar
sM
ars
Earth
@ E
arth
(m/d
/yr)
(m/s
ec)
(m/s
ec)
(m/d
/yr)
(day
s)(d
ays)
(m/d
/yr)
(m/s
ec)
(day
s)(m
/d/y
r)(d
ays)
(km
2 /se
c2 )(m
/sec
) (k
m/s
ec)
(km
/sec
) (k
m/s
ec)
(km
/sec
) (k
m/s
ec)
(km
/sec
)
Carg
o 1
10/1
4/09
3,73
797
9/6/
1032
7 –
–– –
–– –
–– –
–– –
–– –
––10
.27
3,73
73.
2048
2.47
5.51
5 –
–– –
––––
–Ca
rgo
210
/14/
093,
760
120
9/6/
1032
7 –
–– –
–– –
–– –
–– –
–– –
––10
.27
3,76
03.
2048
2.47
5.51
5 –
–– –
––
–––
Pilo
ted
*10
/30/
094,
217
152
4/28
/10
180
535
10/1
5/11
1,77
818
04/
12/1
289
520
.06
5,99
54.
4791
6.51
18.
168
4.15
8 9
.556
14.
63Pi
lote
d10
/30/
094,
219
153
4/28
/10
180
536
10/1
6/11
1,78
018
04/
13/1
289
620
.06
5,99
94.
4791
6.51
18.
168
4.16
19.
3614
.5
* En
try
velo
city
lim
it of
14.
5 km
/sec
at E
arth
exc
eede
d
25
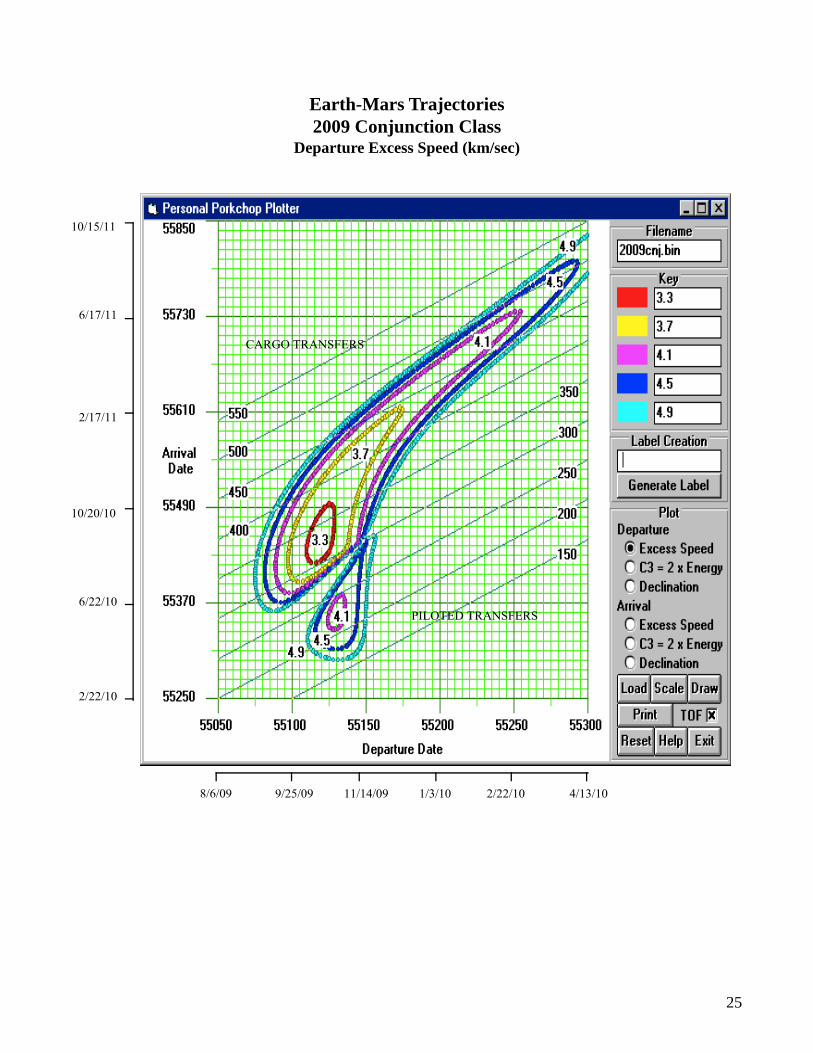
10/15/11
6/17/11
2/17/11
10/20/10
6/22/10
2/22/10
8/6/09 4/13/109/25/09 11/14/09 1/3/10 2/22/10
CARGO TRANSFERS
PILOTED TRANSFERS
Earth-Mars Trajectories2009 Conjunction Class
Departure Excess Speed (km/sec)
26
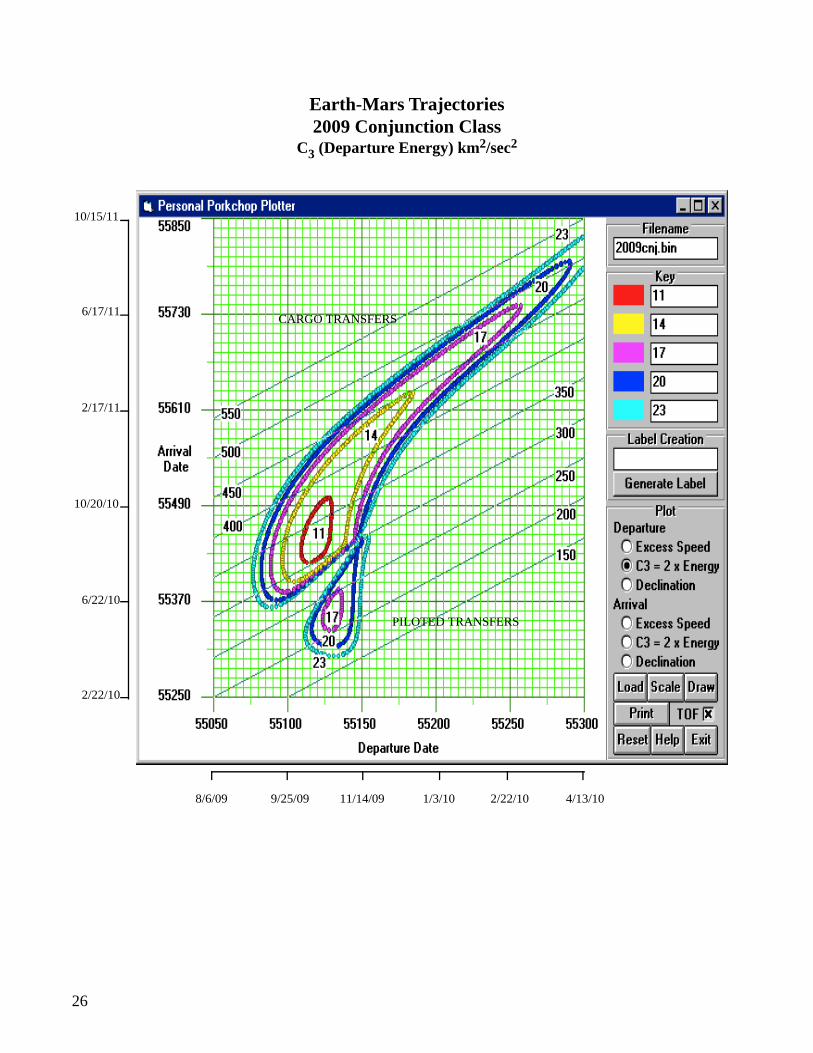
10/15/11
6/17/11
2/17/11
10/20/10
6/22/10
2/22/10
8/6/09 4/13/109/25/09 11/14/09 1/3/10 2/22/10
CARGO TRANSFERS
PILOTED TRANSFERS
CARGO TRANSFERS
PILOTED TRANSFERS
Earth-Mars Trajectories2009 Conjunction Class
C3 (Departure Energy) km2/sec2
27
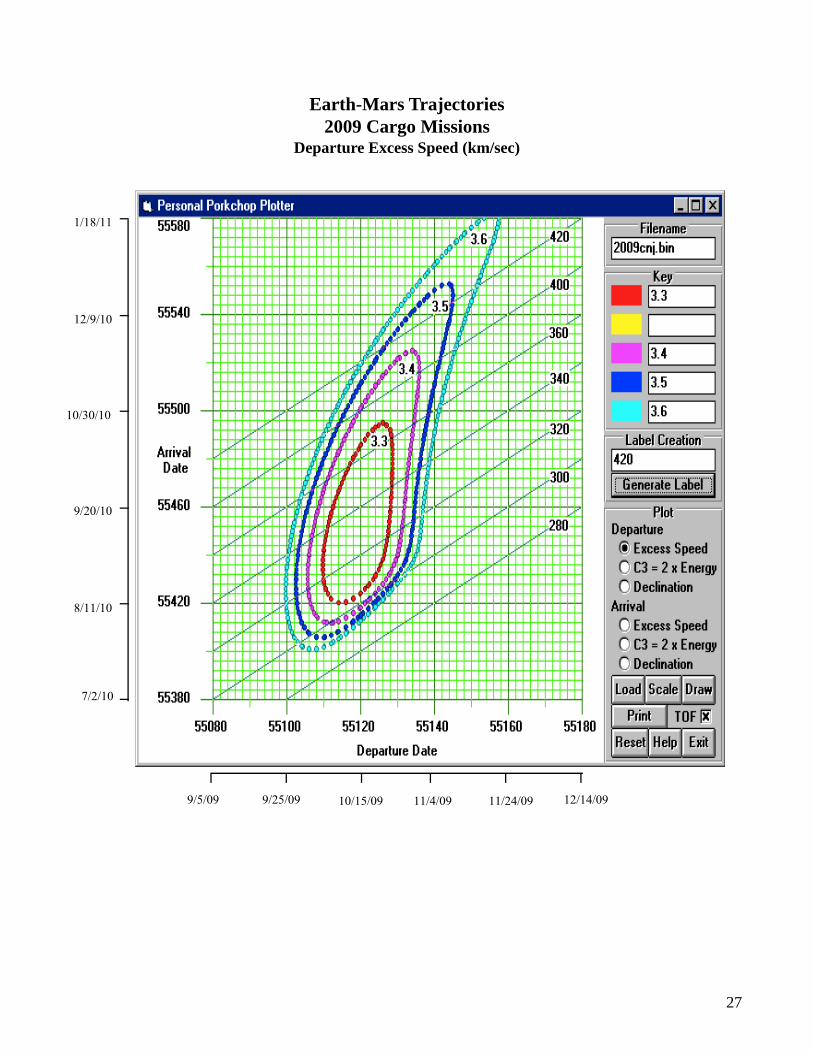
1/18/11
12/9/10
10/30/10
9/20/10
8/11/10
7/2/10
9/5/09 12/14/099/25/09 10/15/09 11/4/09 11/24/09
Earth-Mars Trajectories2009 Cargo Missions
Departure Excess Speed (km/sec)
28
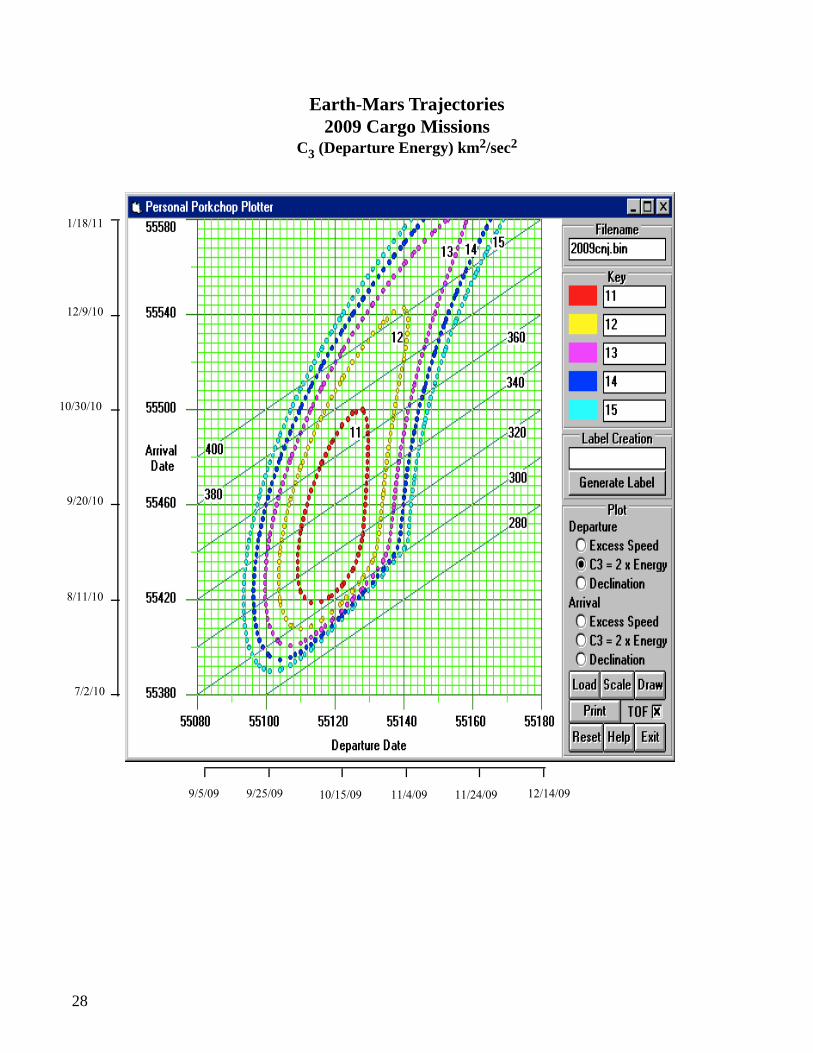
1/18/11
12/9/10
10/30/10
9/20/10
8/11/10
7/2/10
9/5/09 12/14/099/25/09 10/15/09 11/4/09 11/24/09
Earth-Mars Trajectories2009 Cargo Missions
C3 (Departure Energy) km2/sec2
29
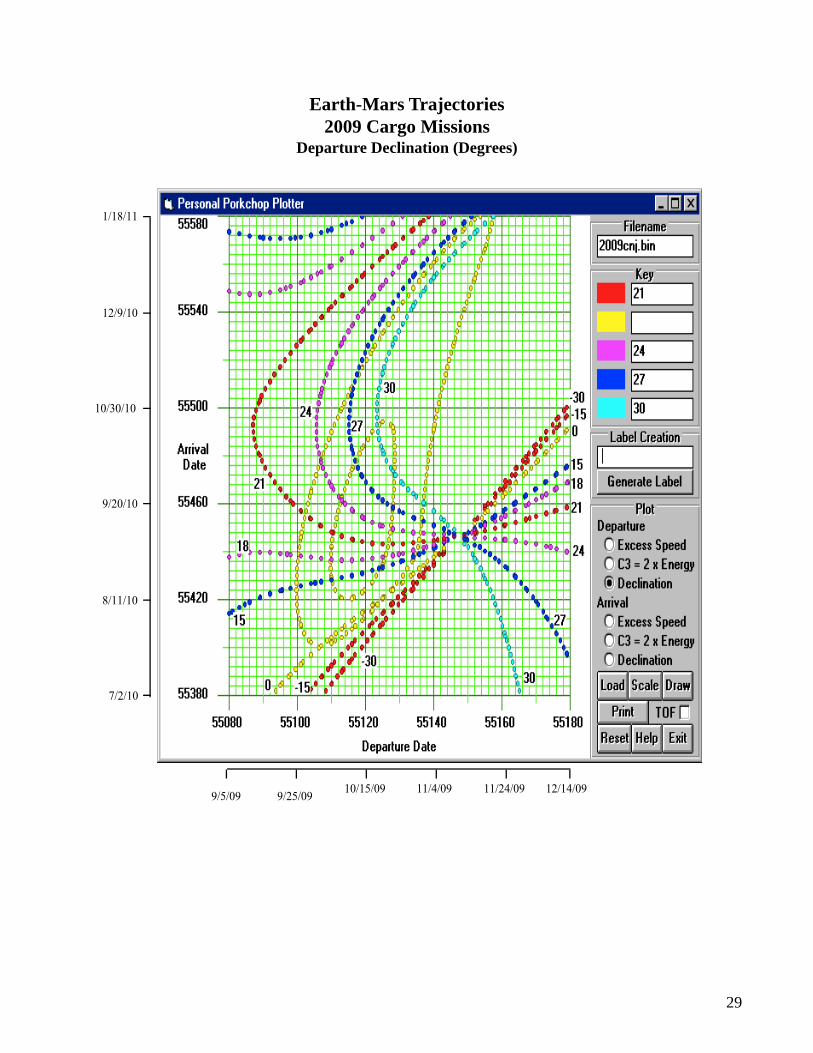
1/18/11
12/9/10
10/30/10
9/20/10
8/11/10
7/2/10
9/5/0912/14/09
9/25/0910/15/09 11/4/09 11/24/09
Earth-Mars Trajectories2009 Cargo Missions
Departure Declination (Degrees)
30
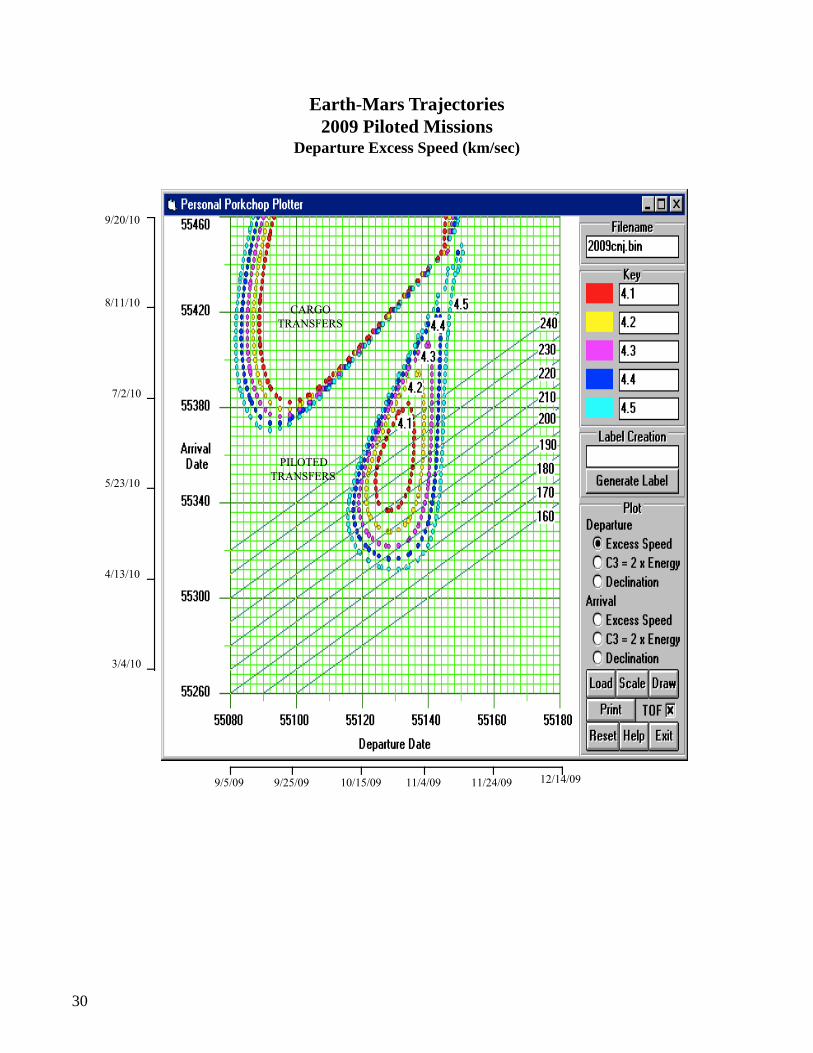
9/20/10
8/11/10
7/2/10
5/23/10
4/13/10
3/4/10
9/5/09 12/14/099/25/09 10/15/09 11/4/09 11/24/09
CARGOTRANSFERS
PILOTEDTRANSFERS
Earth-Mars Trajectories2009 Piloted Missions
Departure Excess Speed (km/sec)
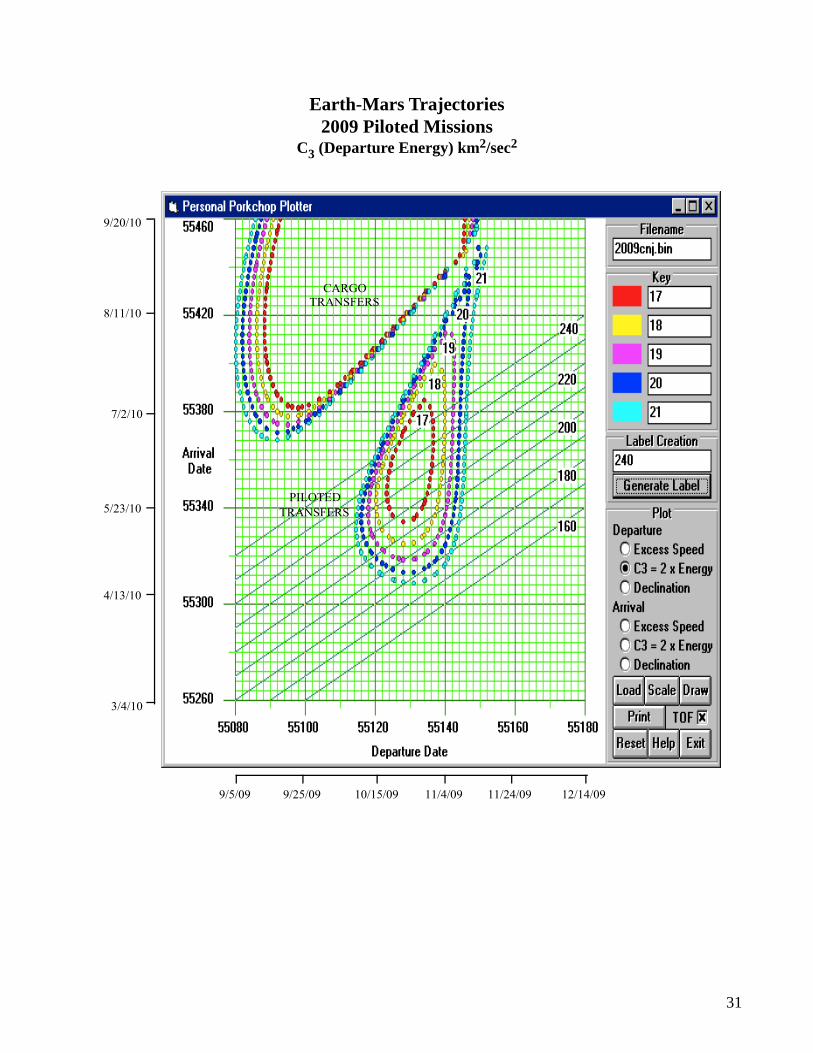
31
9/20/10
8/11/10
7/2/10
5/23/10
4/13/10
3/4/10
9/5/09 12/14/099/25/09 10/15/09 11/4/09 11/24/09
CARGOTRANSFERS
PILOTEDTRANSFERS
Earth-Mars Trajectories2009 Piloted Missions
C3 (Departure Energy) km2/sec2
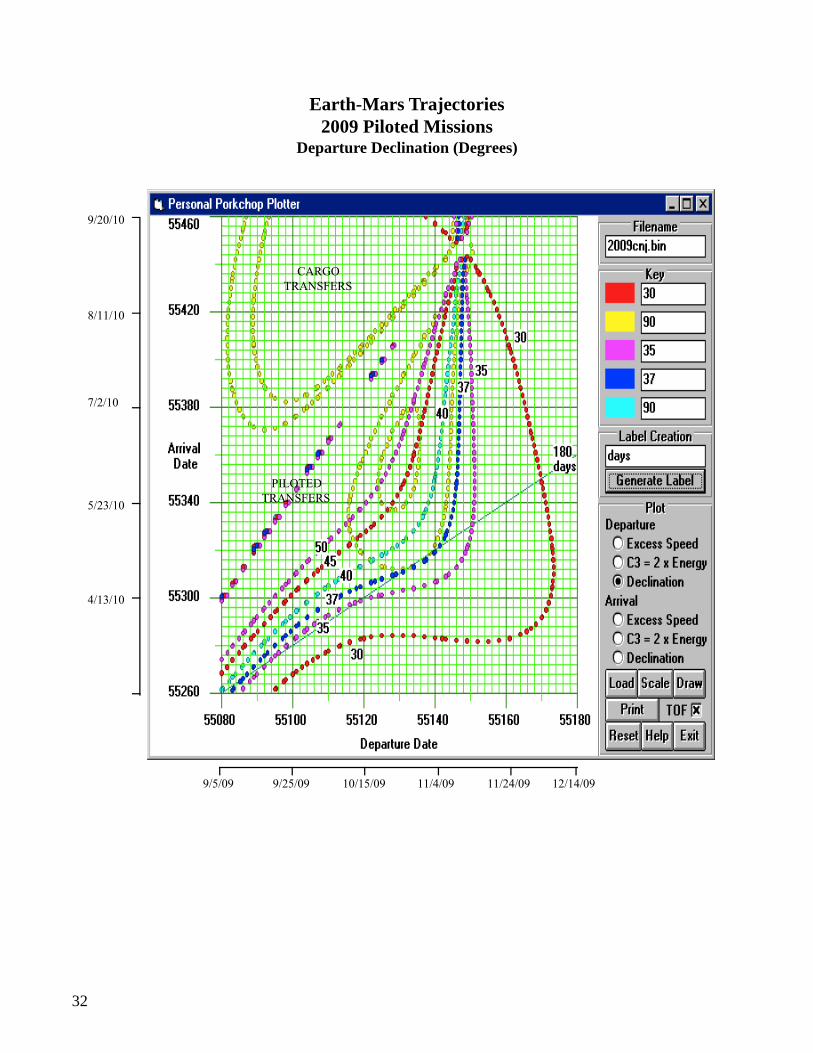
32
9/20/10
8/11/10
7/2/10
5/23/10
4/13/10
9/5/09 12/14/099/25/09 10/15/09 11/4/09 11/24/09
CARGOTRANSFERS
PILOTEDTRANSFERS
CARGOTRANSFERS
PILOTEDTRANSFERS
Earth-Mars Trajectories2009 Piloted Missions
Departure Declination (Degrees)
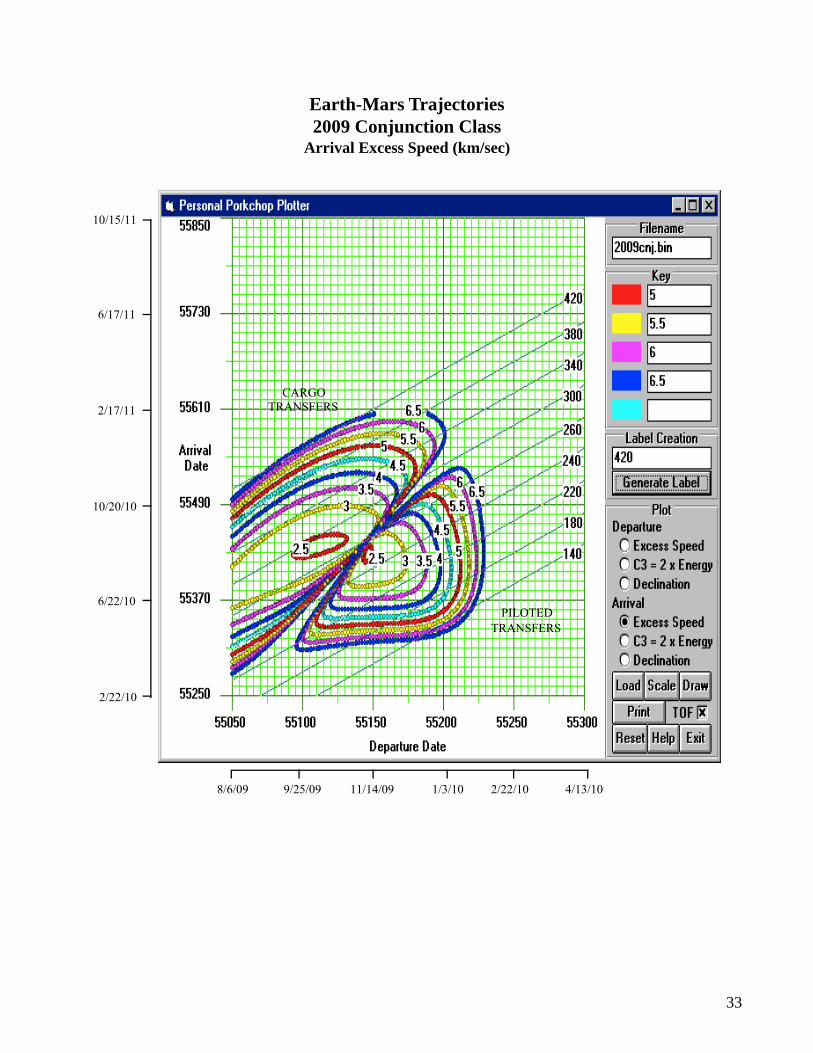
33
10/15/11
6/17/11
2/17/11
10/20/10
6/22/10
2/22/10
8/6/09 4/13/109/25/09 11/14/09 1/3/10 2/22/10
CARGOTRANSFERS
PILOTEDTRANSFERS
CARGOTRANSFERS
PILOTEDTRANSFERS
Earth-Mars Trajectories2009 Conjunction Class
Arrival Excess Speed (km/sec)
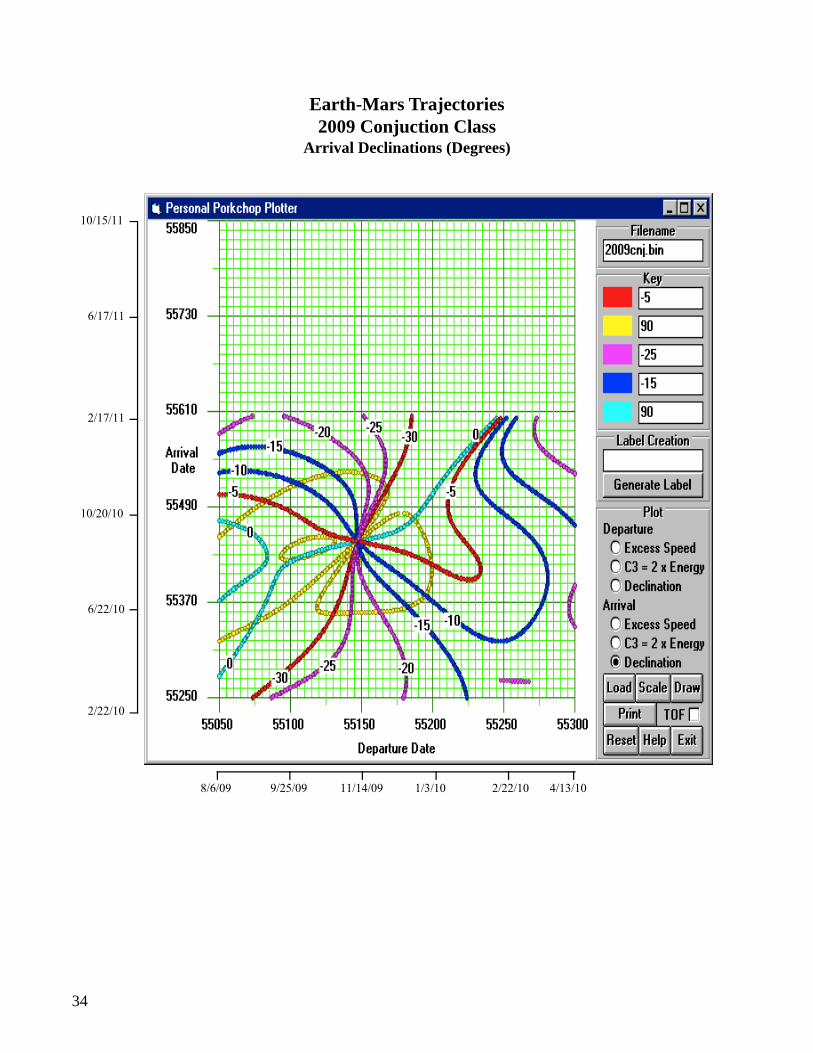
34
10/15/11
6/17/11
2/17/11
10/20/10
6/22/10
2/22/10
8/6/09 4/13/109/25/09 11/14/09 1/3/10 2/22/10
Earth-Mars Trajectories2009 Conjuction Class
Arrival Declinations (Degrees)
35
6/21/12
6/1/12
5/12/12
4/22/12
4/2/12
3/13/12
1/23/127/7/11 8/26/11 10/15/11 12/4/11
CARGOTRANSFERS
PILOTEDTRANSFERS
5/18/11
PILOTED RETURN
TRANSFERS
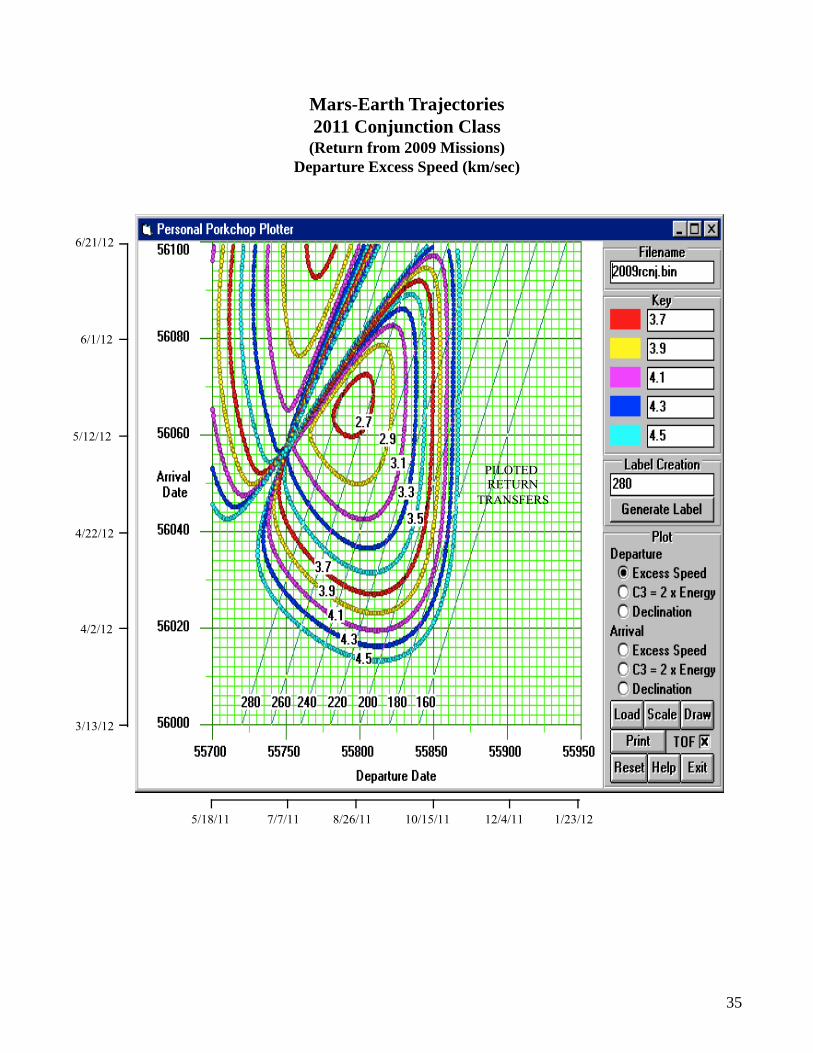
Mars-Earth Trajectories2011 Conjunction Class(Return from 2009 Missions)
Departure Excess Speed (km/sec)
36
6/21/12
6/1/12
5/12/12
4/22/12
4/2/12
3/13/12
1/23/127/7/11 8/26/11 10/15/11 12/4/115/18/11
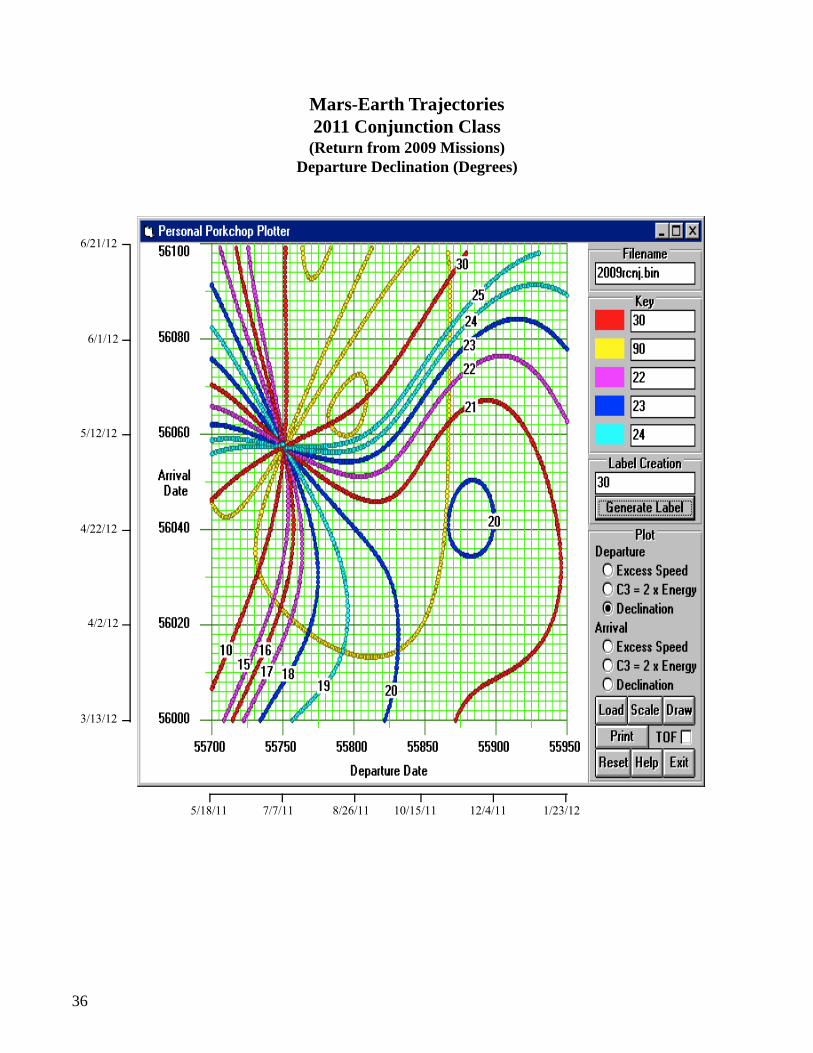
Mars-Earth Trajectories2011 Conjunction Class(Return from 2009 Missions)
Departure Declination (Degrees)
37
6/21/12
6/1/12
5/12/12
4/22/12
4/2/12
3/13/12
1/23/127/7/11 8/26/11 10/15/11 12/4/115/18/11
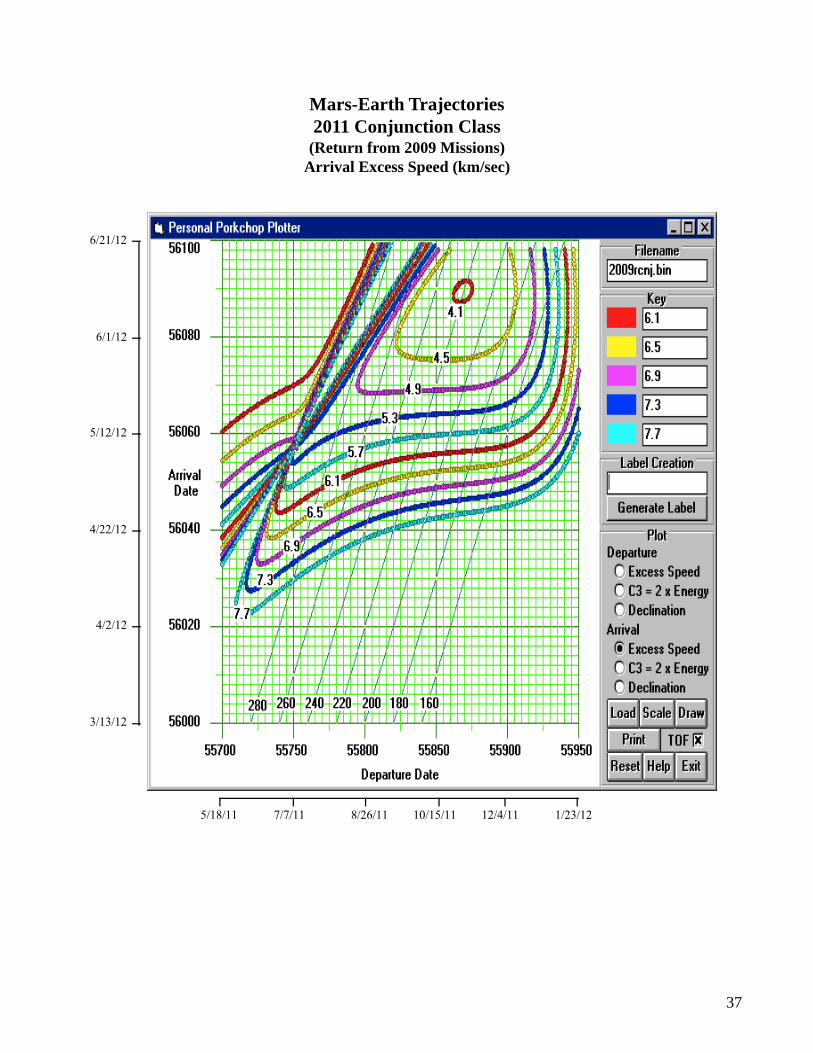
Mars-Earth Trajectories2011 Conjunction Class(Return from 2009 Missions)
Arrival Excess Speed (km/sec)
38
6/21/12
6/1/12
5/12/12
4/22/12
4/2/12
3/13/12
1/23/127/7/11 8/26/11 10/15/11 12/4/115/18/11
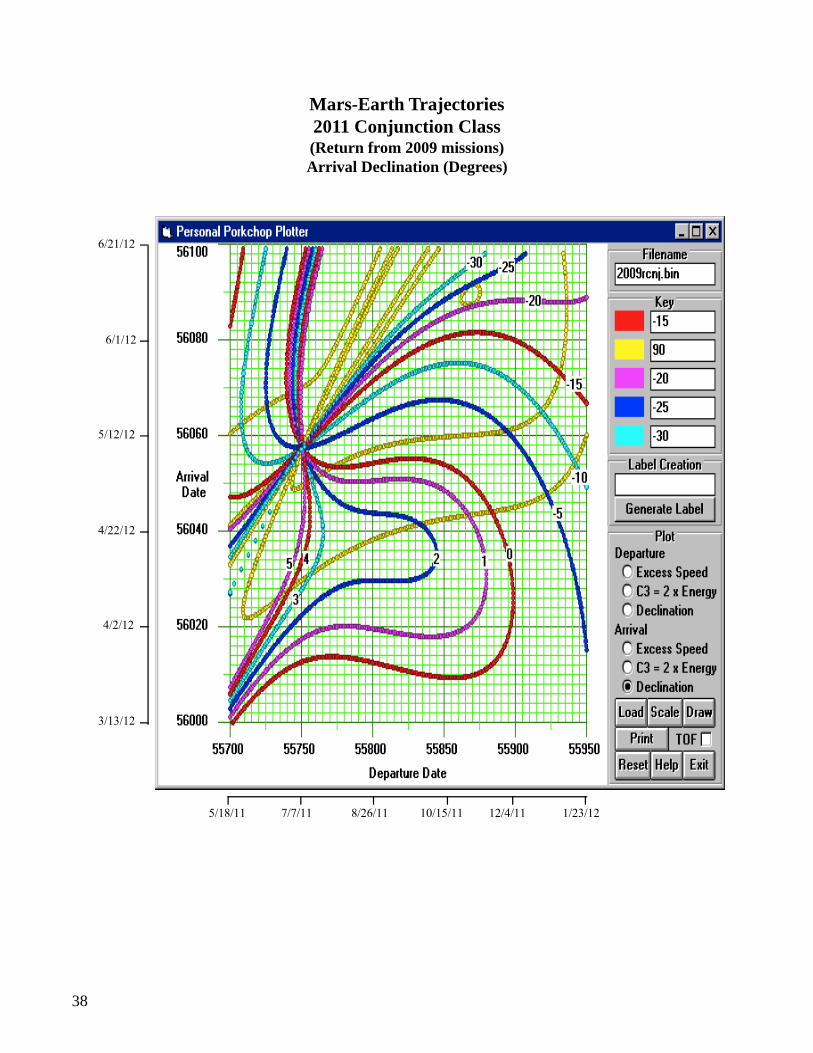
Mars-Earth Trajectories2011 Conjunction Class(Return from 2009 missions)Arrival Declination (Degrees)
39
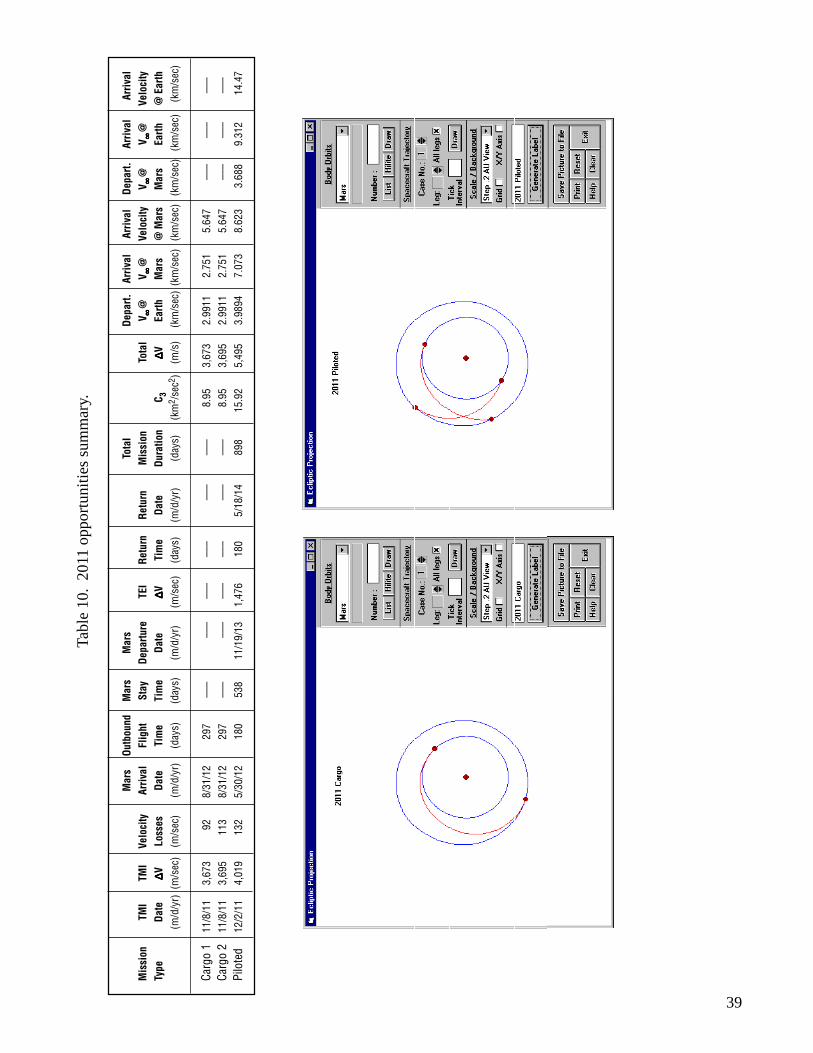
Tabl
e 10
. 20
11 o
ppor
tuni
ties
sum
mar
y.
Mar
sOu
tbou
ndM
ars
Mar
sTo
tal
Depa
rt.Ar
rival
Arriv
alDe
part.
Arriv
alAr
rival
Mis
sion
TMI
TMI
Velo
city
Arriv
alFl
ight
Stay
Depa
rture
TEI
Retu
rnRe
turn
Mis
sion
Tota
lV ∞ ∞ ∞ ∞ ∞
@V ∞ ∞ ∞ ∞ ∞
@Ve
loci
tyV ∞ ∞ ∞ ∞ ∞
@V ∞ ∞ ∞ ∞ ∞
@Ve
loci
tyTy
peDa
te∆∆∆∆ ∆V
Loss
esDa
teTi
me
Tim
eDa
te∆∆∆∆ ∆V
Tim
eDa
teDu
ratio
nC 3
∆∆∆∆ ∆VEa
rthM
ars
@ M
ars
Mar
sEa
rth@
Ear
th(m
/d/y
r)(m
/sec
)(m
/sec
)(m
/d/y
r)(d
ays)
(day
s)(m
/d/y
r)(m
/sec
)(d
ays)
(m/d
/yr)
(day
s)(k
m2 /
sec2 )
(m/s
) (k
m/s
ec)
(km
/sec
) (k
m/s
ec)
(km
/sec
) (k
m/s
ec)
(km
/sec
)
Carg
o 1
11/8
/11
3,67
392
8/31
/12
297
–––
–––
–––
–––
–––
–––
8.95
3,67
32.
9911
2.75
15.
647
–––
–––
–––
Carg
o 2
11/8
/11
3,69
511
38/
31/1
229
7 –
–– –
–– –
–– –
–– –
–– –
––8.
953,
695
2.99
112.
751
5.64
7 –
–– –
–– –
––Pi
lote
d12
/2/1
14,
019
132
5/30
/12
180
538
11/1
9/13
1,47
618
05/
18/1
489
815
.92
5,49
53.
9894
7.07
38.
623
3.68
89.
312
14.4
7
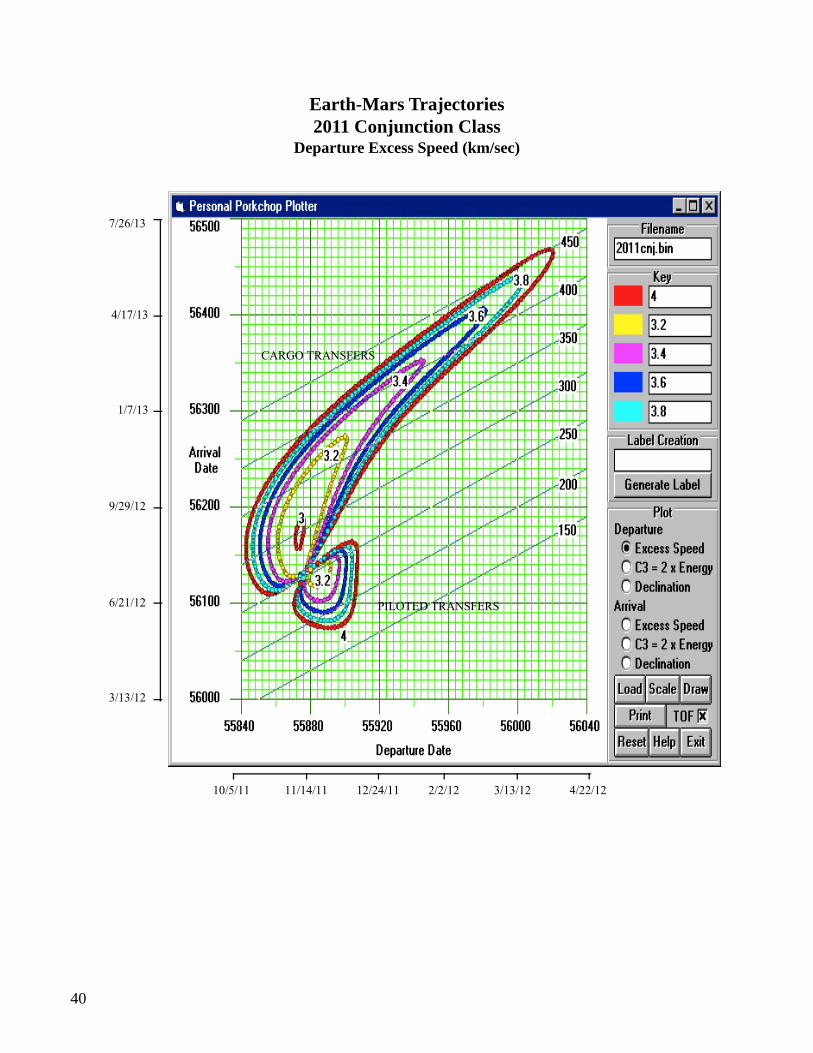
40
7/26/13
4/17/13
1/7/13
9/29/12
6/21/12
3/13/12
10/5/11 4/22/1211/14/11 12/24/11 2/2/12 3/13/12
CARGO TRANSFERS
PILOTED TRANSFERS
Earth-Mars Trajectories2011 Conjunction Class
Departure Excess Speed (km/sec)
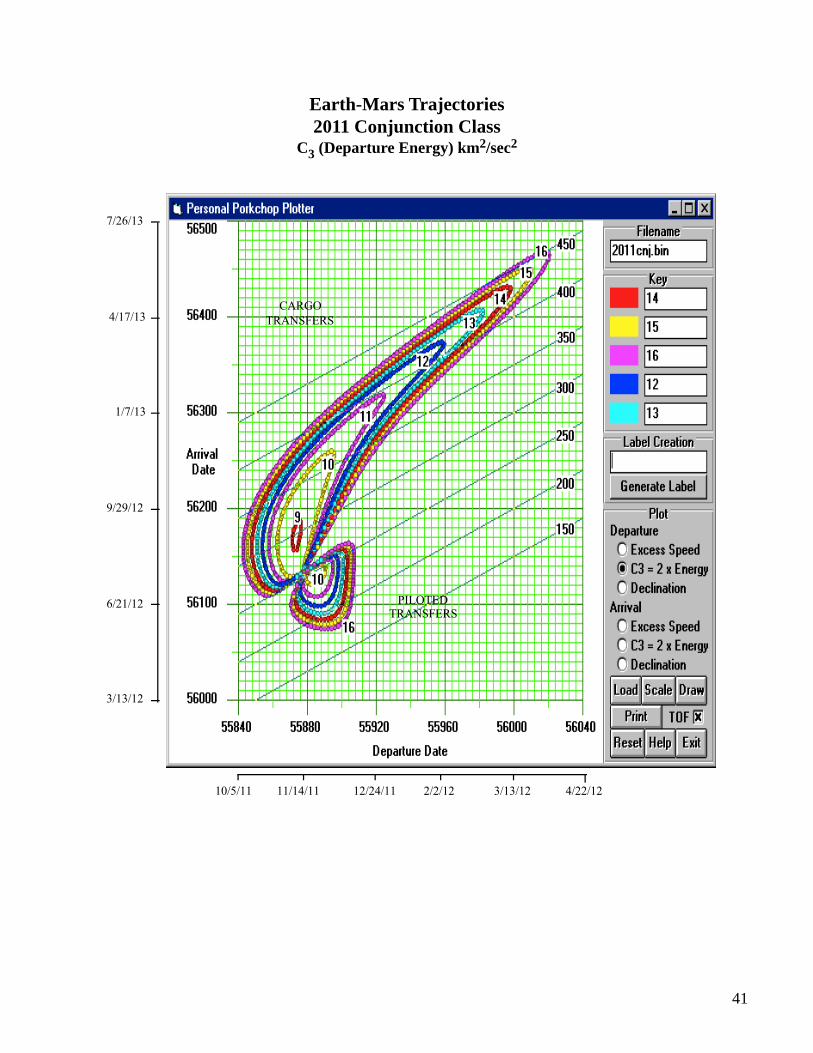
41
7/26/13
4/17/13
1/7/13
9/29/12
6/21/12
3/13/12
10/5/11 4/22/1211/14/11 12/24/11 2/2/12 3/13/12
CARGOTRANSFERS
PILOTEDTRANSFERS
Earth-Mars Trajectories2011 Conjunction Class
C3 (Departure Energy) km2/sec2
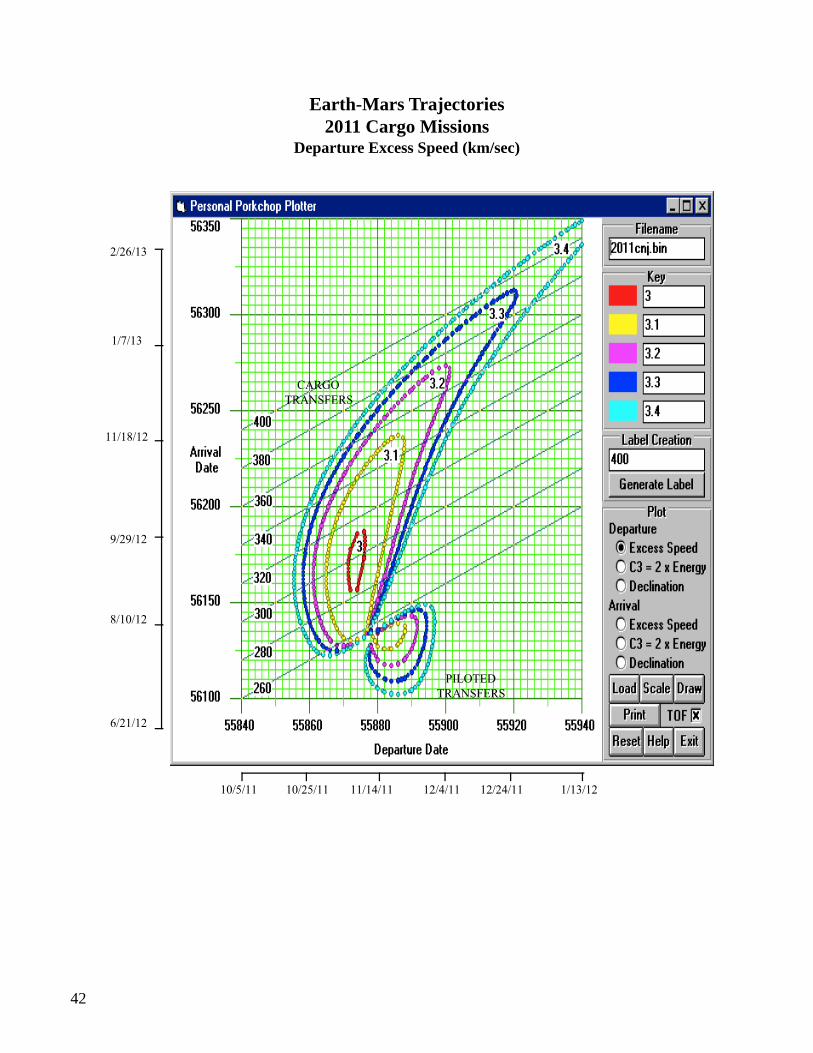
42
2/26/13
1/7/13
11/18/12
9/29/12
8/10/12
6/21/12
10/5/11 1/13/1210/25/11 11/14/11 12/4/11 12/24/11
CARGOTRANSFERS
PILOTEDTRANSFERS
Earth-Mars Trajectories2011 Cargo Missions
Departure Excess Speed (km/sec)
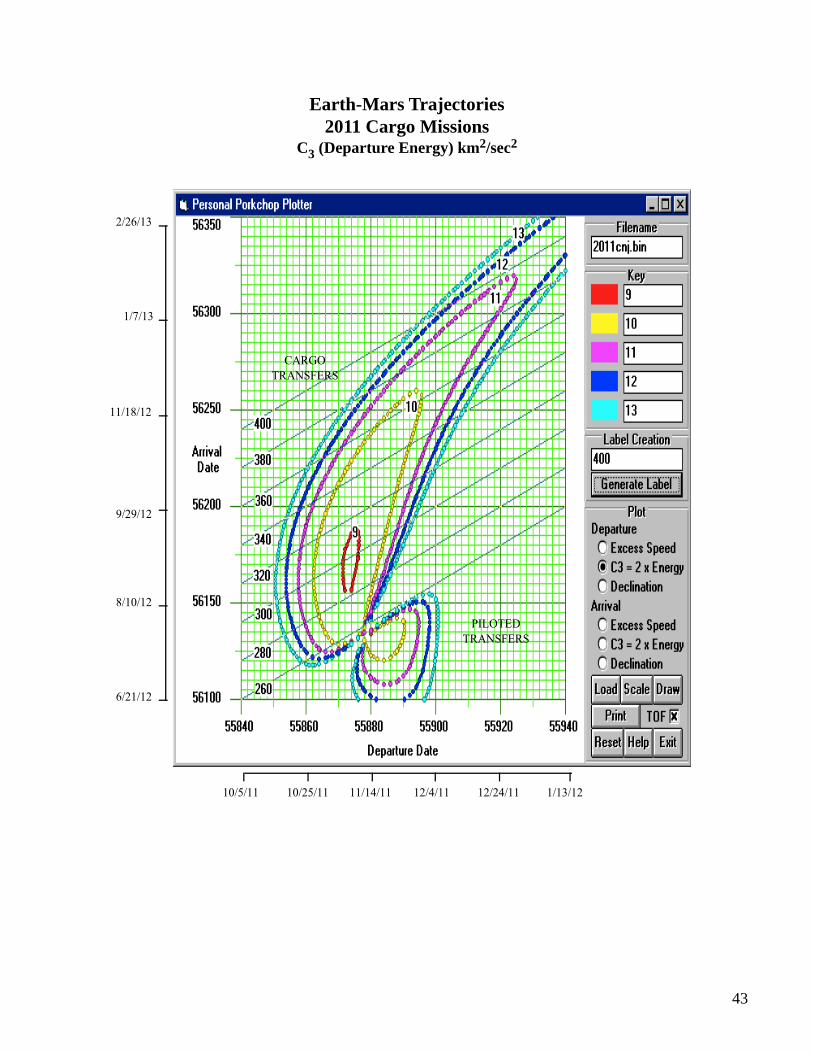
43
2/26/13
1/7/13
11/18/12
9/29/12
8/10/12
6/21/12
10/5/11 1/13/1210/25/11 11/14/11 12/4/11 12/24/11
CARGOTRANSFERS
PILOTEDTRANSFERS
Earth-Mars Trajectories2011 Cargo Missions
C3 (Departure Energy) km2/sec2
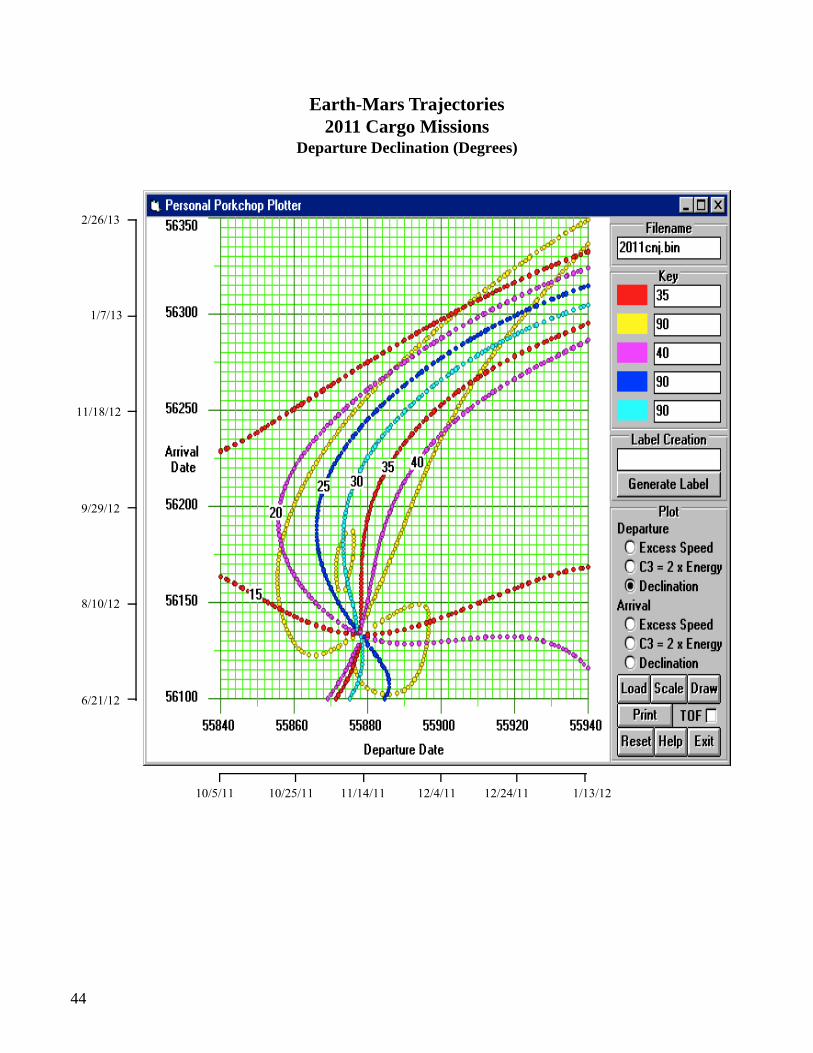
44
2/26/13
1/7/13
11/18/12
9/29/12
8/10/12
6/21/12
10/5/11 1/13/1210/25/11 11/14/11 12/4/11 12/24/11
Earth-Mars Trajectories2011 Cargo Missions
Departure Declination (Degrees)
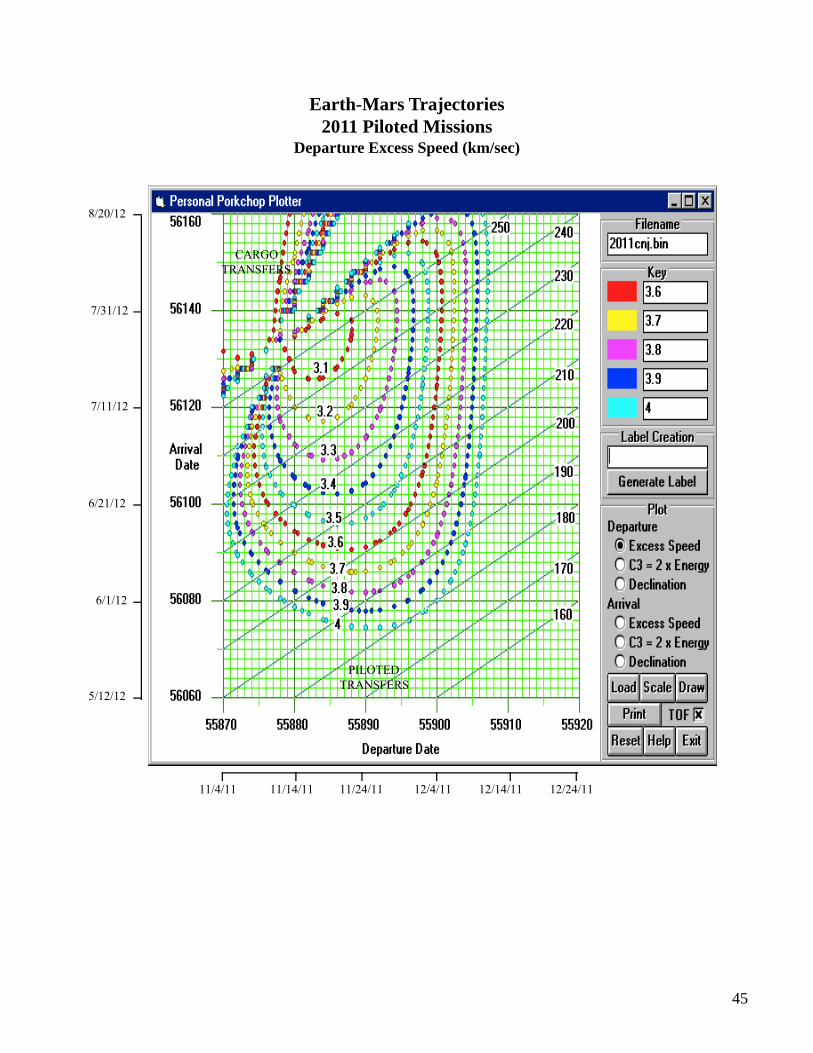
45
8/20/12
7/31/12
7/11/12
6/21/12
6/1/12
5/12/12
11/4/11 12/24/1111/14/11 11/24/11 12/4/11 12/14/11
CARGOTRANSFERS
PILOTEDTRANSFERS
Earth-Mars Trajectories2011 Piloted Missions
Departure Excess Speed (km/sec)
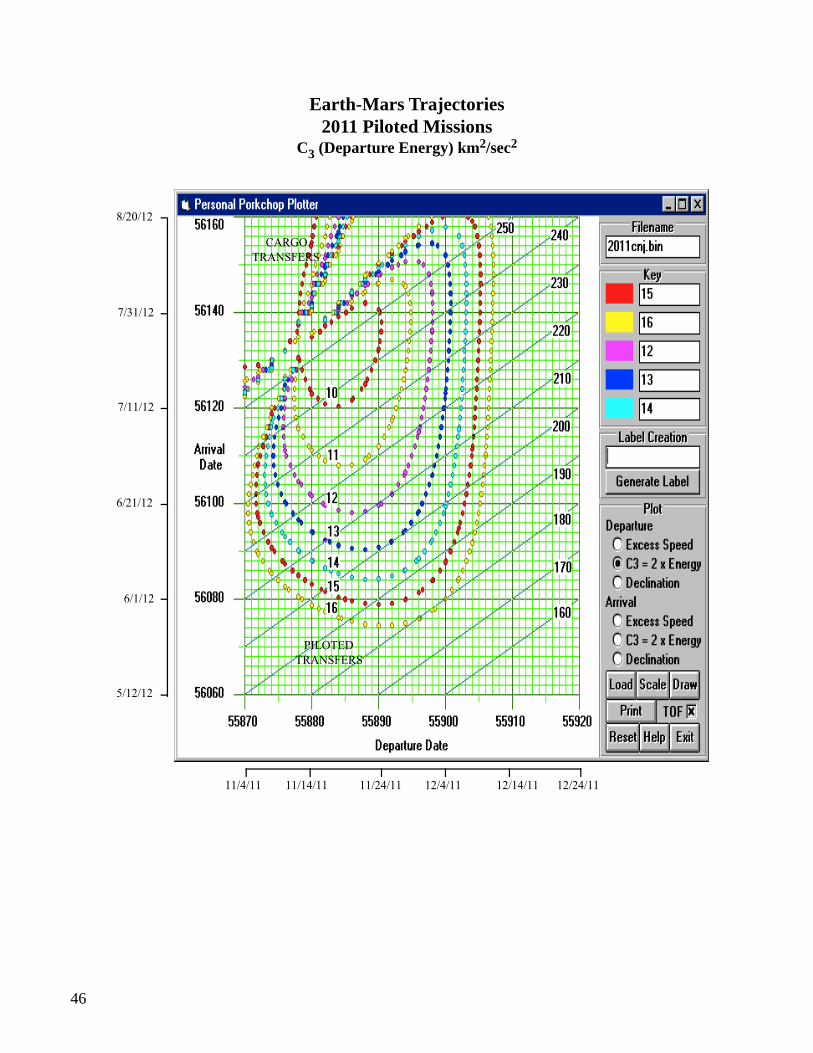
46
8/20/12
7/31/12
7/11/12
6/21/12
6/1/12
5/12/12
11/4/11 12/24/1111/14/11 11/24/11 12/4/11 12/14/11
CARGOTRANSFERS
PILOTEDTRANSFERS
Earth-Mars Trajectories2011 Piloted Missions
C3 (Departure Energy) km2/sec2
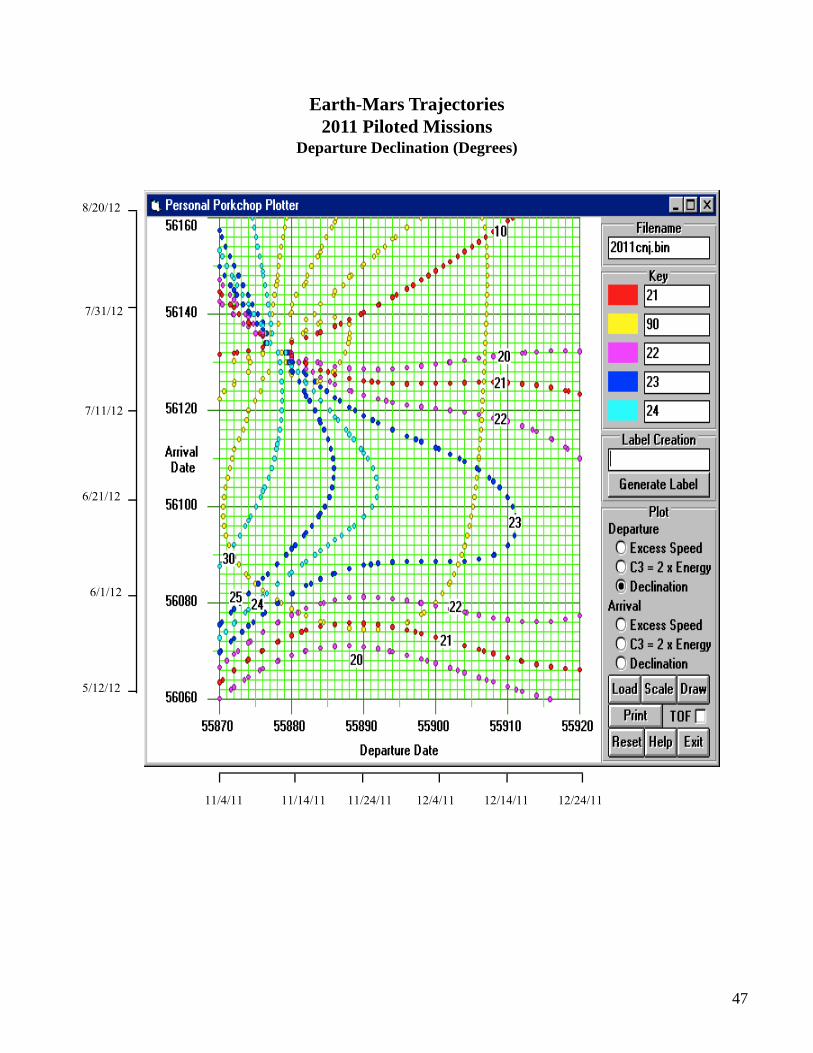
47
8/20/12
7/31/12
7/11/12
6/21/12
6/1/12
5/12/12
11/4/11 12/24/1111/14/11 11/24/11 12/4/11 12/14/11
Earth-Mars Trajectories2011 Piloted Missions
Departure Declination (Degrees)
48
7/26/13
4/7/13
1/7/13
9/29/12
6/21/12
3/13/12
10/5/11 4/22/1211/14/11 12/24/11 2/2/12 3/13/12
CARGOTRANSFERS
PILOTEDTRANSFERS
Earth-Mars Trajectories2011 Conjunction Class
Arrival Excess Speed (km/sec)
49
7/26/13
4/7/13
1/7/13
9/29/12
6/21/12
3/13/12
10/5/11 4/22/1211/14/11 12/24/11 2/2/12 3/13/12
Earth-Mars Trajectories2011 Conjunction Class
Arrival Declination (Degrees)
50
7/21/14
7/1/14
6/11/14
5/22/14
5/2/14
6/6/13 2/11/147/26/13 9/14/13 11/3/13 12/23/13
PILOTEDRETURN
TRANSFERS PILOTEDRETURN
TRANSFERS
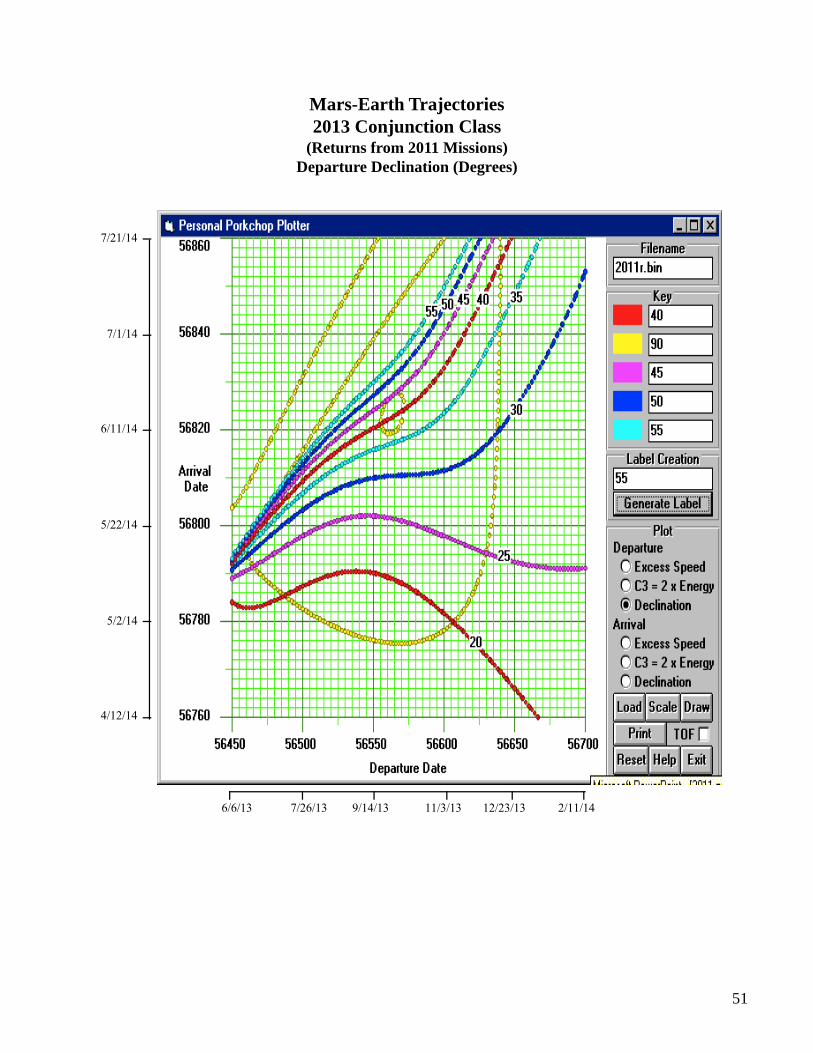
Mars-Earth Trajectories2013 Conjunction Class
(Returns from 2011 Missions)Departure Excess Speed (km/sec)
51
7/21/14
7/1/14
6/11/14
5/22/14
5/2/14
4/12/14
6/6/13 2/11/147/26/13 9/14/13 11/3/13 12/23/13
Mars-Earth Trajectories2013 Conjunction Class
(Returns from 2011 Missions)Departure Declination (Degrees)
52
7/21/14
7/1/14
6/11/14
5/22/14
5/2/14
4/12/14
6/6/13 2/11/147/26/13 9/14/13 11/3/13 12/23/13
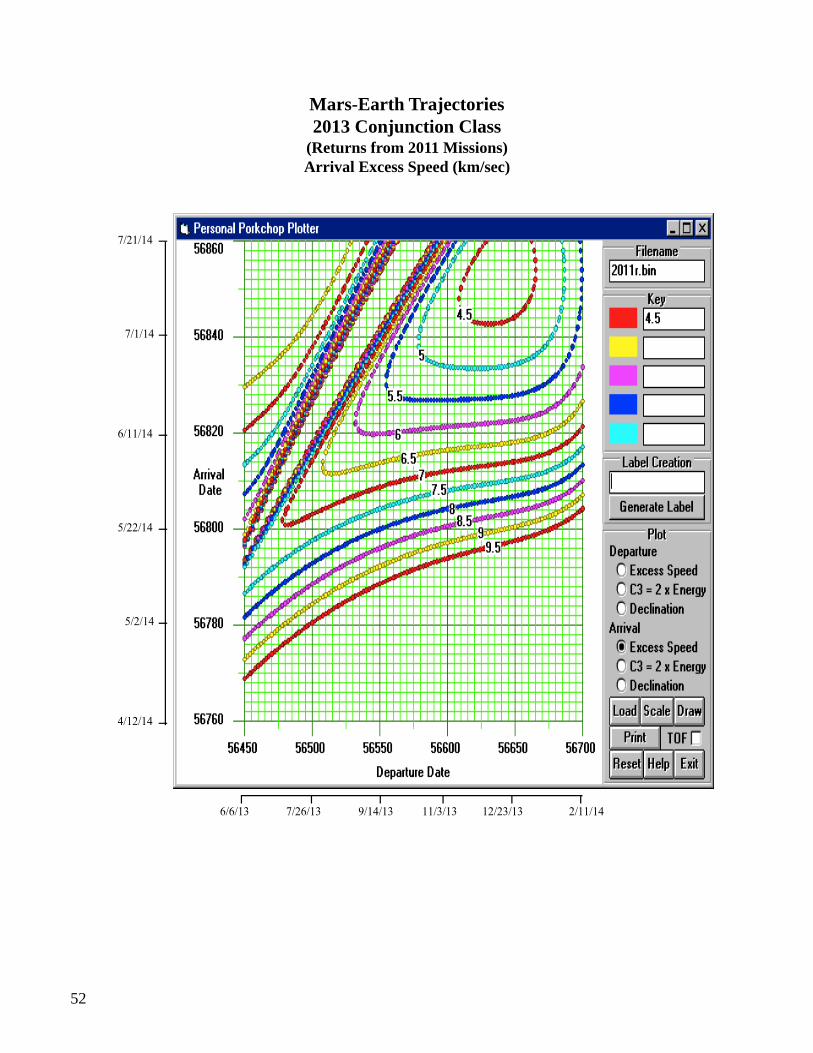
Mars-Earth Trajectories2013 Conjunction Class
(Returns from 2011 Missions)Arrival Excess Speed (km/sec)
53
7/21/14
7/1/14
6/11/14
5/22/14
5/2/14
4/12/14
6/6/13 2/11/147/26/13 9/14/13 11/3/13 12/23/13
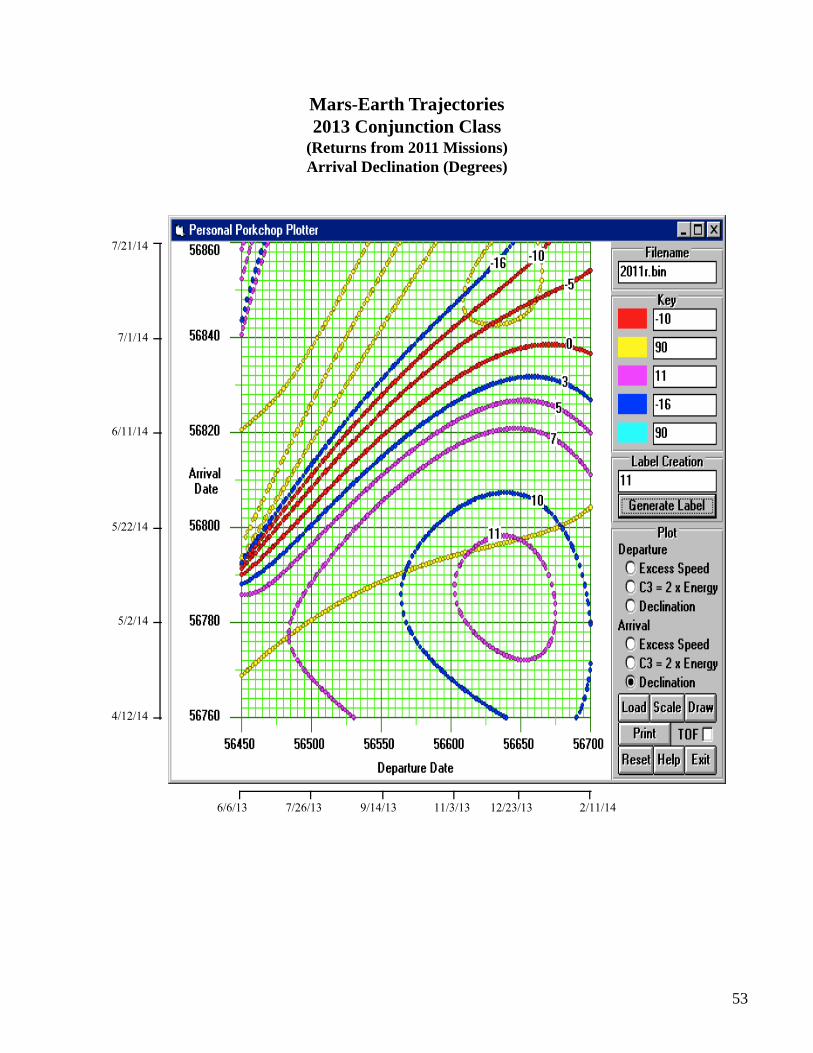
Mars-Earth Trajectories2013 Conjunction Class
(Returns from 2011 Missions)Arrival Declination (Degrees)
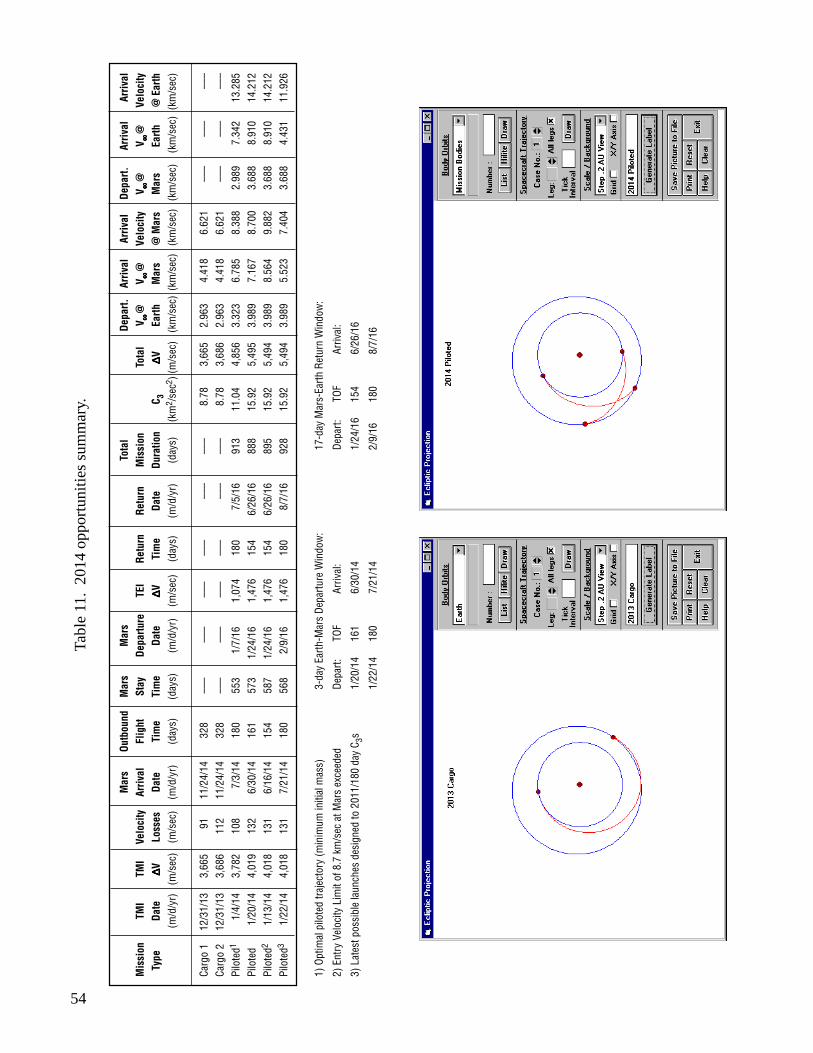
54
Tabl
e 11
. 20
14 o
ppor
tuni
ties
sum
mar
y.
Mar
sOu
tbou
ndM
ars
Mar
sTo
tal
Depa
rt.Ar
rival
Arriv
alDe
part.
Arriv
alAr
rival
Mis
sion
TMI
TMI
Velo
city
Arriv
alFl
ight
Stay
Depa
rture
TEI
Retu
rnRe
turn
Mis
sion
Tota
lV ∞ ∞ ∞ ∞ ∞
@V ∞ ∞ ∞ ∞ ∞
@Ve
loci
tyV ∞ ∞ ∞ ∞ ∞
@V ∞ ∞ ∞ ∞ ∞
@Ve
loci
ty T
ype
Date
∆∆∆∆ ∆VLo
sses
Date
Tim
eTi
me
Date
∆∆∆∆ ∆VTi
me
Date
Dura
tion
C 3∆∆∆∆ ∆V
Earth
Mar
s@
Mar
sM
ars
Earth
@ E
arth
(m/d
/yr)
(m/s
ec)
(m/s
ec)
(m/d
/yr)
(day
s)(d
ays)
(m/d
/yr)
(m/s
ec)
(day
s)(m
/d/y
r)(d
ays)
(km
2 /se
c2 )(m
/sec
) (k
m/s
ec)
(km
/sec
) (k
m/s
ec)
(km
/sec
) (k
m/s
ec)
(km
/sec
)
Carg
o 1
12/3
1/13
3,66
591
11/2
4/14
328
–––
–––
–––
–––
–––
–––
8.78
3,66
52.
963
4.41
86.
621
–––
–––
–––
Carg
o 2
12/3
1/13
3,68
611
211
/24/
1432
8 –
–– –
–– –
–– –
–– –
–– –
––8.
783,
686
2.96
34.
418
6.62
1 –
–– –
–– –
––Pi
lote
d11/
4/14
3,78
210
87/
3/14
180
553
1/7/
161,
074
180
7/5/
1691
311
.04
4,85
63.
323
6.78
58.
388
2.98
97.
342
13.2
85Pi
lote
d1/
20/1
44,
019
132
6/30
/14
161
573
1/24
/16
1,47
615
46/
26/1
688
815
.92
5,49
53.
989
7.16
78.
700
3.68
88.
910
14.2
12Pi
lote
d21/
13/1
44,
018
131
6/16
/14
154
587
1/24
/16
1,47
615
46/
26/1
689
515
.92
5,49
43.
989
8.56
49.
882
3.68
88.
910
14.2
12Pi
lote
d31/
22/1
44,
018
131
7/21
/14
180
568
2/9/
161,
476
180
8/7/
1692
815
.92
5,49
43.
989
5.52
37.
404
3.68
84.
431
11.9
26
1) O
ptim
al p
ilote
d tra
ject
ory
(min
imum
initi
al m
ass)
3-da
y Ea
rth-M
ars
Depa
rture
Win
dow
:17
-day
Mar
s-Ea
rth R
etur
n W
indo
w:
2) E
ntry
Vel
ocity
Lim
it of
8.7
km
/sec
at M
ars
exce
eded
Depa
rt:TO
FAr
rival
:De
part:
TOF
Arriv
al:
3) L
ates
t pos
sibl
e la
unch
es d
esig
ned
to 2
011/
180
day
C 3s1/
20/1
416
16/
30/1
41/
24/1
615
46/
26/1
6
1/22
/14
180
7/21
/14
2/9/
1618
08/
7/16
55
Earth-Mars Trajectories2013/14 Conjunction Class
Departure Excess Speed (km/sec)
8/15/15
5/7/15
1/27/15
10/19/14
7/11/14
4/2/14
9/14/13 5/22/1411/3/13 12/23/13 2/11/14 4/2/14
CARGOTRANSFERS
PILOTEDTRANSFERS
56
8/15/15
5/7/15
1/27/15
10/19/14
7/11/14
4/2/14
9/14/13 5/22/1411/3/13 12/23/13 2/11/14 4/2/14
CARGOTRANSFERS
PILOTEDTRANSFERS
Earth-Mars Trajectories2013/14 Conjunction ClassC3 (Departure Energy) km2/sec2
57
4/12/15
2/21/15
1/2/15
11/13/14
9/24/14
8/5/14
11/3/13 5/22/1412/13/13 1/22/14 3/3/14 4/12/14
Earth-Mars Trajectories2013/14 Cargo Missions
Departure Excess Speed (km/sec)
58
4/12/15
2/21/15
1/2/15
11/13/14
9/24/14
8/5/14
11/3/13 5/22/1412/13/13 1/22/14 3/3/14 4/12/14
Earth-Mars Trajectories2013/14 Cargo Missions
C3 (Departure Energy) km2/sec2
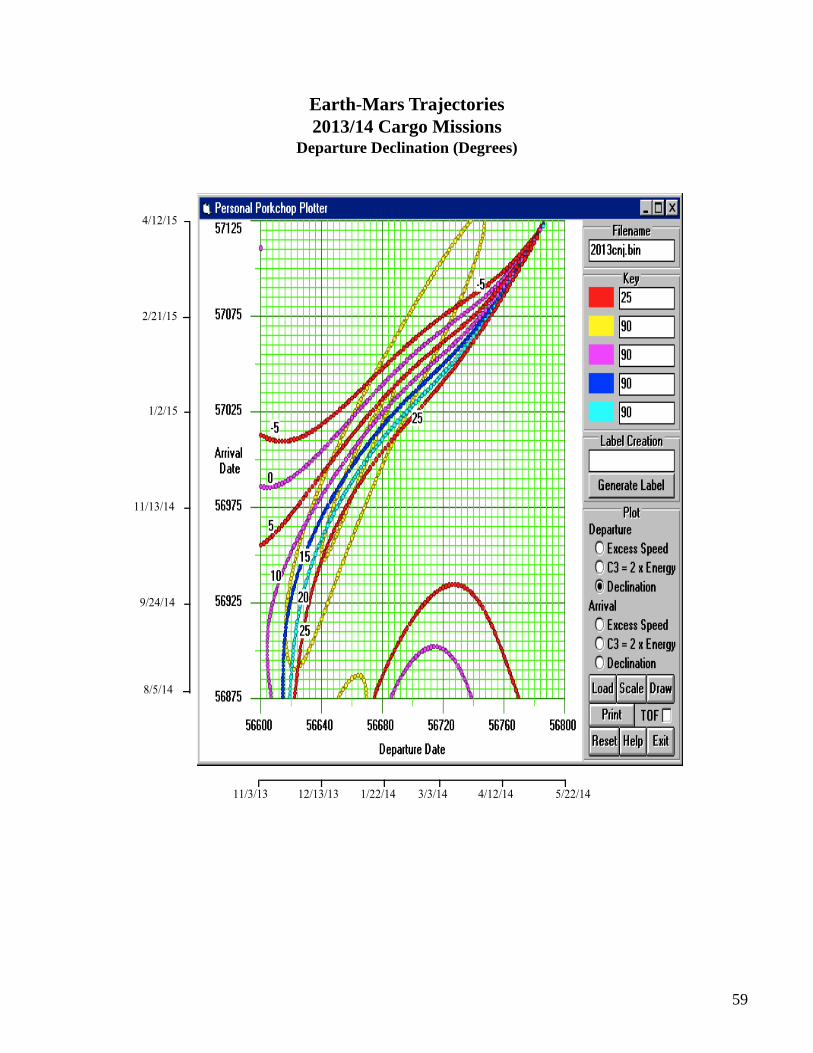
59
4/12/15
2/21/15
1/2/15
11/13/14
9/24/14
8/5/14
11/3/13 5/22/1412/13/13 1/22/14 3/3/14 4/12/14
Earth-Mars Trajectories2013/14 Cargo Missions
Departure Declination (Degrees)
60
9/9/14
8/20/14
7/31/14
7/11/14
6/21/14
6/1/14
11/3/13 2/11/1411/23/13 12/13/13 1/2/14 1/22/14
CARGOTRANSFERS
PILOTEDTRANSFERS
Earth-Mars Trajectories2013/14 Piloted Missions
Departure Excess Speed (km/sec)
61
9/9/14
8/20/14
7/31/14
7/11/14
6/21/14
6/1/14
11/3/13 2/11/1411/23/13 12/13/13 1/2/14 1/22/14
CARGOTRANSFERS
PILOTEDTRANSFERS
Earth-Mars Trajectories2013/14 Piloted Missions
C3 (Departure Energy) km2/sec2
62
9/9/14
8/20/14
7/31/14
7/11/14
6/21/14
6/1/14
11/3/13 2/11/1411/23/13 12/13/13 1/2/141/22/14
Earth-Mars Trajectories2013/14 Piloted Missions
Departure Declination (Degrees)
63
9/9/14
8/20/14
7/31/14
7/11/14
6/21/14
6/1/14
11/3/13 2/11/1411/23/13 12/13/13 1/2/14 1/22/14
E
O
L
M
Earth-Mars Trajectories2013/14 Piloted MissionsBaseline Mission Designed to2011 Departure Excess Speed
E=Minimum flight time trajectory using 2011 Piloted Mission Departure Excess Speed (3.99 km/sec) andwhile maintaining acceptable Mars entry velocity needed for aerobraking.
Departure: 1/20/14 (56678J) Arrival: 6/30/14 (56839J)
L=Latest possible trajectory to keep flight time limited to 180 days. The acceptable window of opportunityfor launch will be along the arc from E to L.
Latest Departure: 1/22/14 (56679J) Arrival: 7/21/14 (56859J)
O=Minimum flight time trajectory using 2011 Piloted Mission Departure Excess Speed (3.99 km/sec).Mars arrival excess speed=8.56 km/sec, which exceeds the limit of 7.167 km/sec
Departure: 1/13/14 (56671J) Arrival: 6/16/14 (56825J)
M=Minimum departure excess speed and initial mass trajectory for 2014 opportunity for a flight time of180 days.
Departure: 1/4/14 (56662J) Arrival: 7/3/14 (56842J)
64
8/15/15
5/7/15
1/27/15
10/19/14
7/11/14
4/2/14
9/14/13 5/22/1411/3/13 12/23/13 2/11/14 4/2/14
CARGOTRANSFERS
PILOTEDTRANSFERS
Earth-Mars Trajectories2013/14 Conjunction ClassArrival Excess Speed (km/sec)
65
8/15/15
5/7/15
1/27/15
10/19/14
7/11/14
4/2/14
9/14/13 5/22/1411/3/13 12/23/13 2/11/14 4/2/14
Earth-Mars Trajectories2013/14 Conjunction ClassArrival Declination (Degrees)
66
9/28/16
8/19/16
7/10/16
5/31/16
4/21/16
3/12/16
8/5/15 2/21/169/14/15 10/24/15 12/3/15 1/12/16
PILOTED RETURNTRANSFERS
Mars-Earth Trajectories2015/16 Conjunction Class
(Returns from 2013/14 Missions)Departure Excess Speed (km/sec)
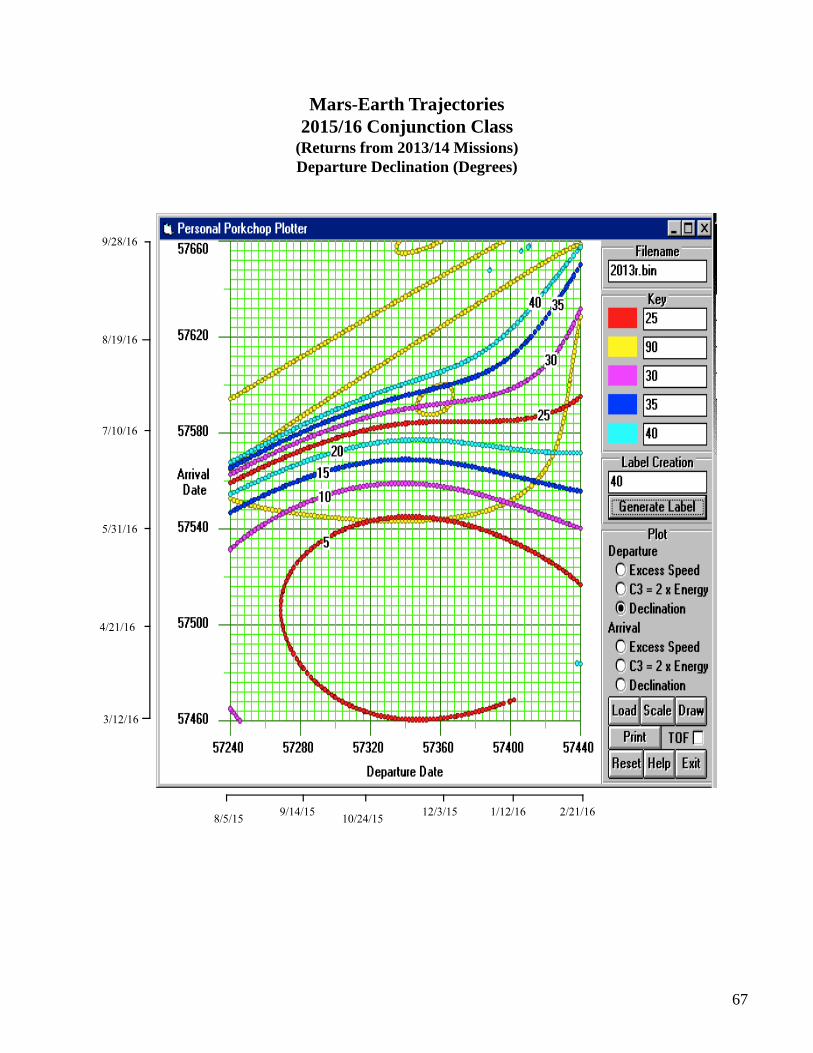
67
9/28/16
8/19/16
7/10/16
5/31/16
4/21/16
3/12/16
8/5/152/21/169/14/15
10/24/1512/3/15 1/12/16
Mars-Earth Trajectories2015/16 Conjunction Class
(Returns from 2013/14 Missions)Departure Declination (Degrees)
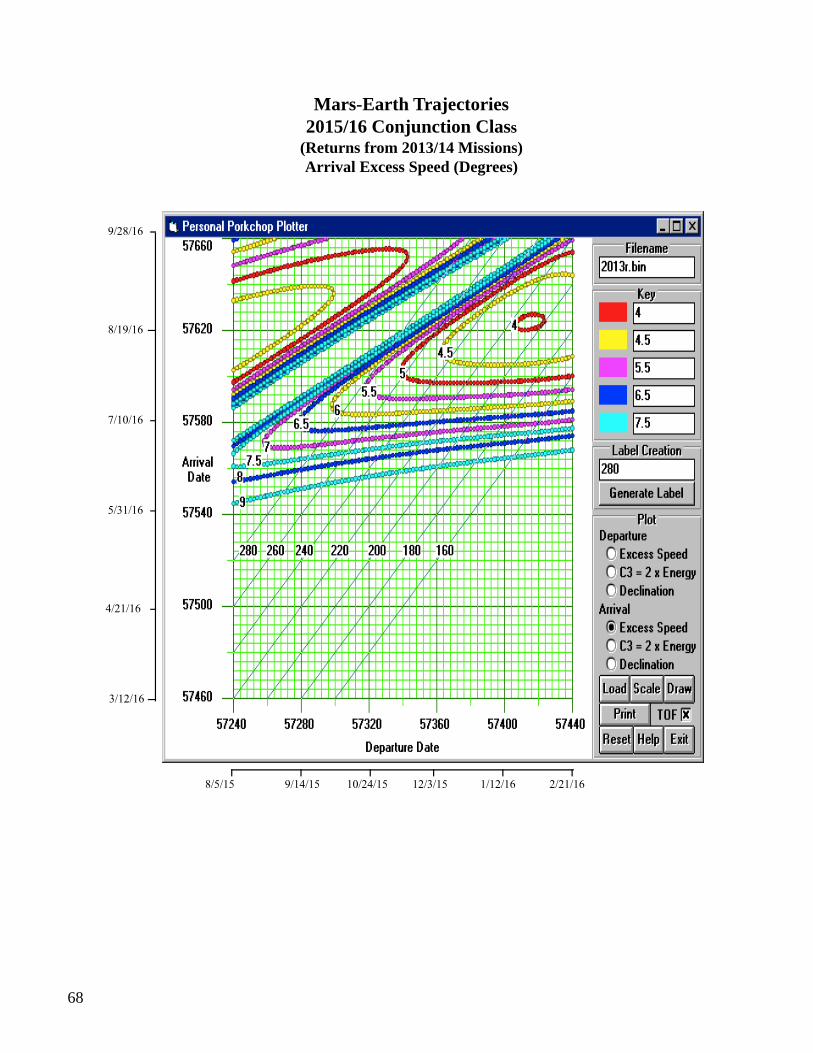
68
9/28/16
8/19/16
7/10/16
5/31/16
4/21/16
3/12/16
8/5/15 2/21/169/14/15 10/24/15 12/3/15 1/12/16
Mars-Earth Trajectories2015/16 Conjunction Class
(Returns from 2013/14 Missions)Arrival Excess Speed (Degrees)
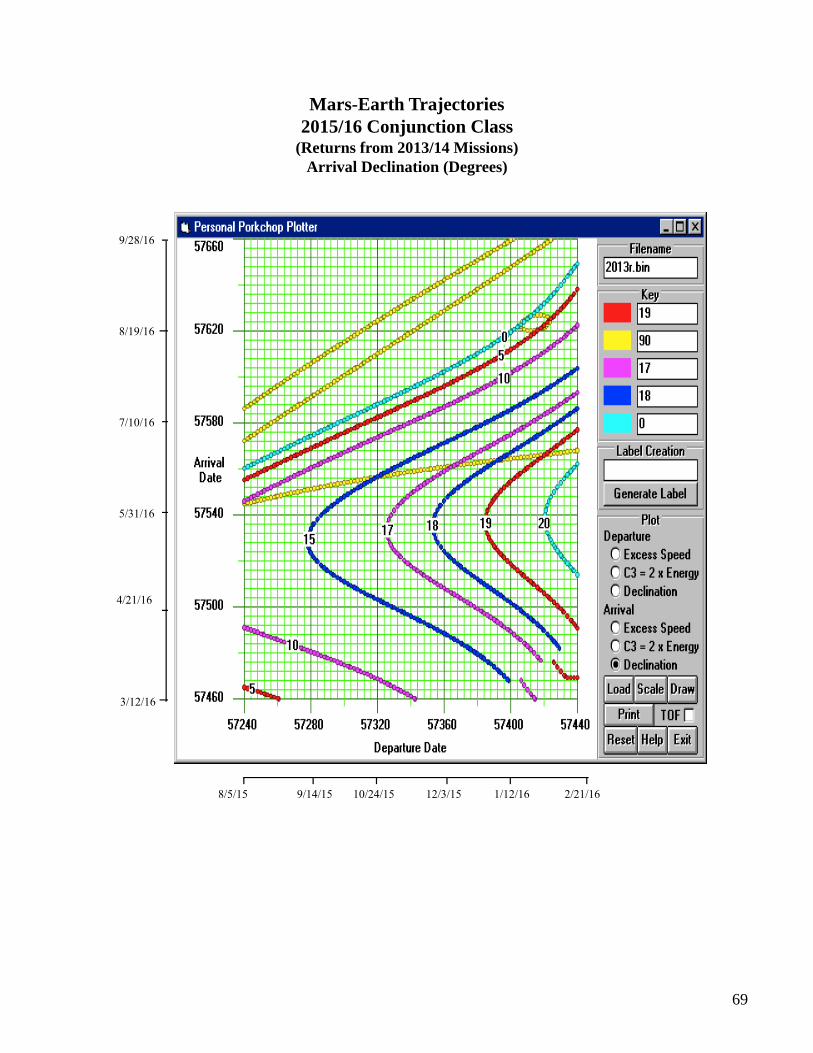
69
9/28/16
8/19/16
7/10/16
5/31/16
4/21/16
3/12/16
8/5/15 2/21/169/14/15 10/24/15 12/3/15 1/12/16
Mars-Earth Trajectories2015/16 Conjunction Class
(Returns from 2013/14 Missions)Arrival Declination (Degrees)
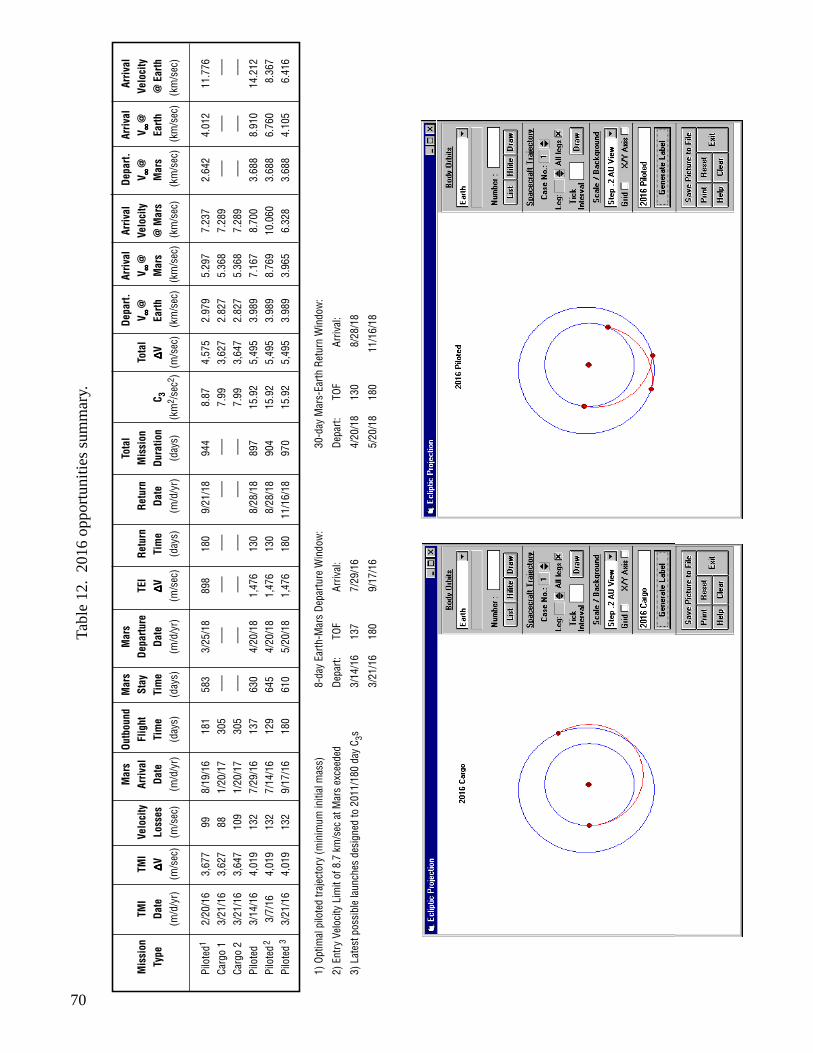
70
Tabl
e 12
. 20
16 o
ppor
tuni
ties
sum
mar
y.
Mar
sOu
tbou
ndM
ars
Mar
sTo
tal
Depa
rt.Ar
rival
Arriv
alDe
part.
Arriv
alAr
rival
Mis
sion
TMI
TMI
Velo
city
Arriv
alFl
ight
Stay
Depa
rture
TEI
Retu
rnRe
turn
Mis
sion
Tota
lV ∞ ∞ ∞ ∞ ∞
@V ∞ ∞ ∞ ∞ ∞
@Ve
loci
tyV ∞ ∞ ∞ ∞ ∞
@V ∞ ∞ ∞ ∞ ∞
@Ve
loci
tyTy
peDa
te∆∆∆∆ ∆V
Loss
esDa
teTi
me
Tim
eDa
te∆∆∆∆ ∆V
Tim
eDa
teDu
ratio
nC 3
∆∆∆∆ ∆VEa
rthM
ars
@ M
ars
Mar
sEa
rth@
Ear
th(m
/d/y
r)(m
/sec
)(m
/sec
)(m
/d/y
r)(d
ays)
(day
s)(m
/d/y
r)(m
/sec
)(d
ays)
(m/d
/yr)
(day
s)(k
m2 /
sec2 )
(m/s
ec)
(km
/sec
) (k
m/s
ec)
(km
/sec
) (k
m/s
ec)
(km
/sec
) (k
m/s
ec)
Pilo
ted1
2/20
/16
3,67
799
8/19
/16
181
583
3/25
/18
898
180
9/21
/18
944
8.87
4,57
52.
979
5.29
77.
237
2.64
24.
012
11.7
76Ca
rgo
13/
21/1
63,
627
881/
20/1
730
5 –
–– –
–– –
–– –
–– –
–– –
––7.
993,
627
2.82
75.
368
7.28
9 –
–– –
–– –
––Ca
rgo
23/
21/1
63,
647
109
1/20
/17
305
–––
–––
–––
–––
–––
–––
7.99
3,64
72.
827
5.36
87.
289
–––
–––
–––
Pilo
ted
3/14
/16
4,01
913
27/
29/1
613
763
04/
20/1
81,
476
130
8/28
/18
897
15.9
25,
495
3.98
97.
167
8.70
03.
688
8.91
014
.212
Pilo
ted2
3/7/
164,
019
132
7/14
/16
129
645
4/20
/18
1,47
613
08/
28/1
890
415
.92
5,49
53.
989
8.76
910
.060
3.68
86.
760
8.36
7Pi
lote
d 33/
21/1
64,
019
132
9/17
/16
180
610
5/20
/18
1,47
618
011
/16/
1897
015
.92
5,49
53.
989
3.96
56.
328
3.68
84.
105
6.41
6
1) O
ptim
al p
ilote
d tra
ject
ory
(min
imum
initi
al m
ass)
8-da
y Ea
rth-M
ars
Depa
rture
Win
dow
:30
-day
Mar
s-Ea
rth R
etur
n W
indo
w:
2) E
ntry
Vel
ocity
Lim
it of
8.7
km
/sec
at M
ars
exce
eded
Depa
rt:TO
FAr
rival
:De
part:
TOF
Arr
ival
:
3) L
ates
t pos
sibl
e la
unch
es d
esig
ned
to 2
011/
180
day
C 3s3/
14/1
613
77/
29/1
64/
20/1
813
0 8
/28/
18
3/21
/16
180
9/17
/16
5/20
/18
180
11/1
6/18
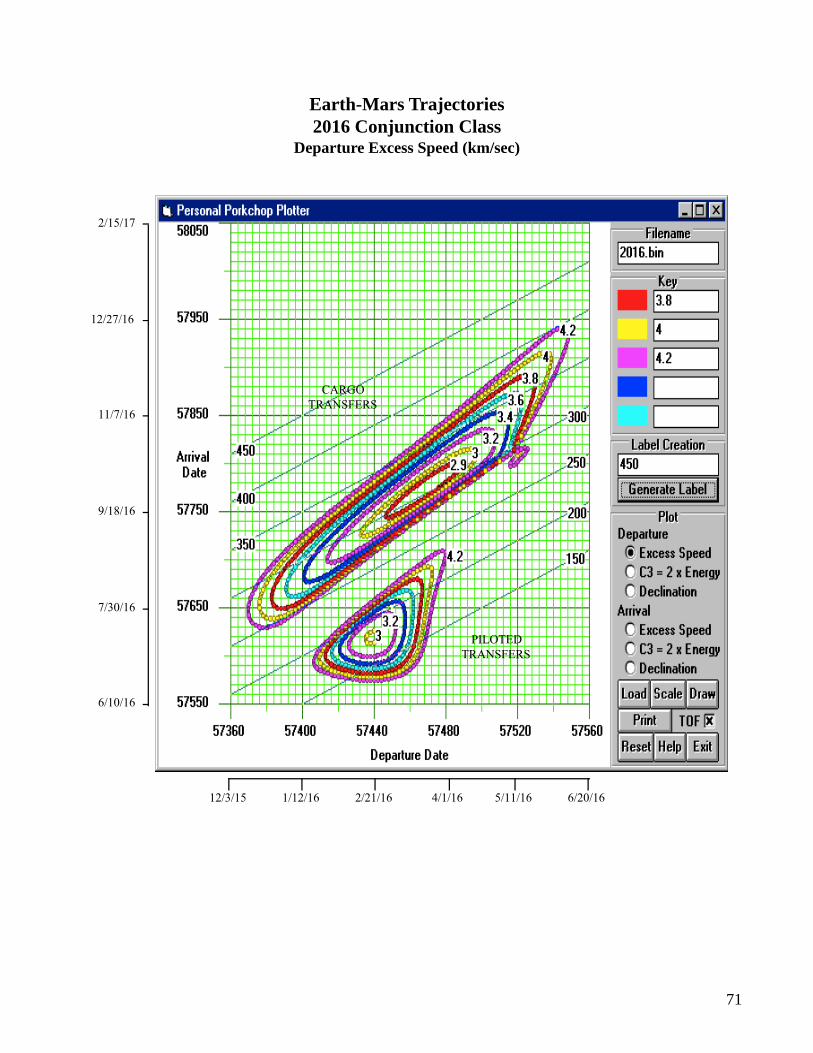
71
2/15/17
12/27/16
11/7/16
9/18/16
7/30/16
6/10/16
12/3/15 6/20/161/12/16 2/21/16 4/1/16 5/11/16
CARGOTRANSFERS
PILOTEDTRANSFERS
Earth-Mars Trajectories2016 Conjunction Class
Departure Excess Speed (km/sec)
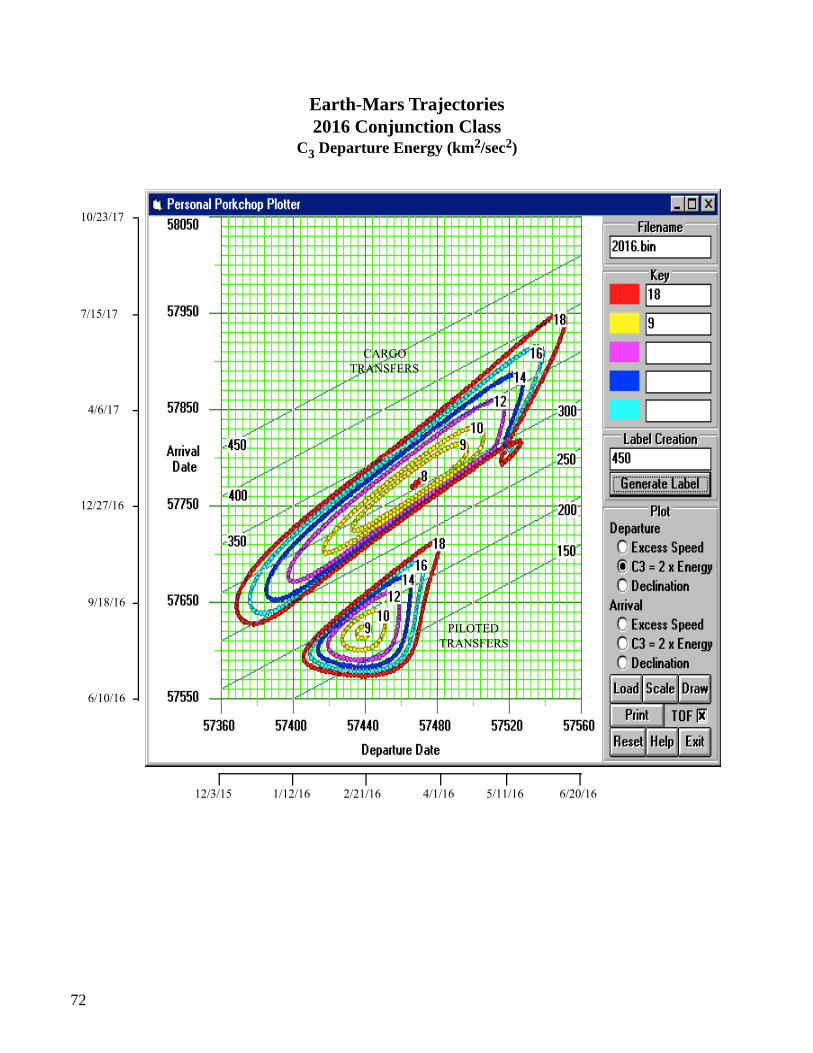
72
10/23/17
7/15/17
4/6/17
12/27/16
9/18/16
6/10/16
12/3/15 6/20/161/12/16 2/21/16 4/1/16 5/11/16
CARGOTRANSFERS
PILOTEDTRANSFERS
Earth-Mars Trajectories2016 Conjunction Class
C3 Departure Energy (km2/sec2)
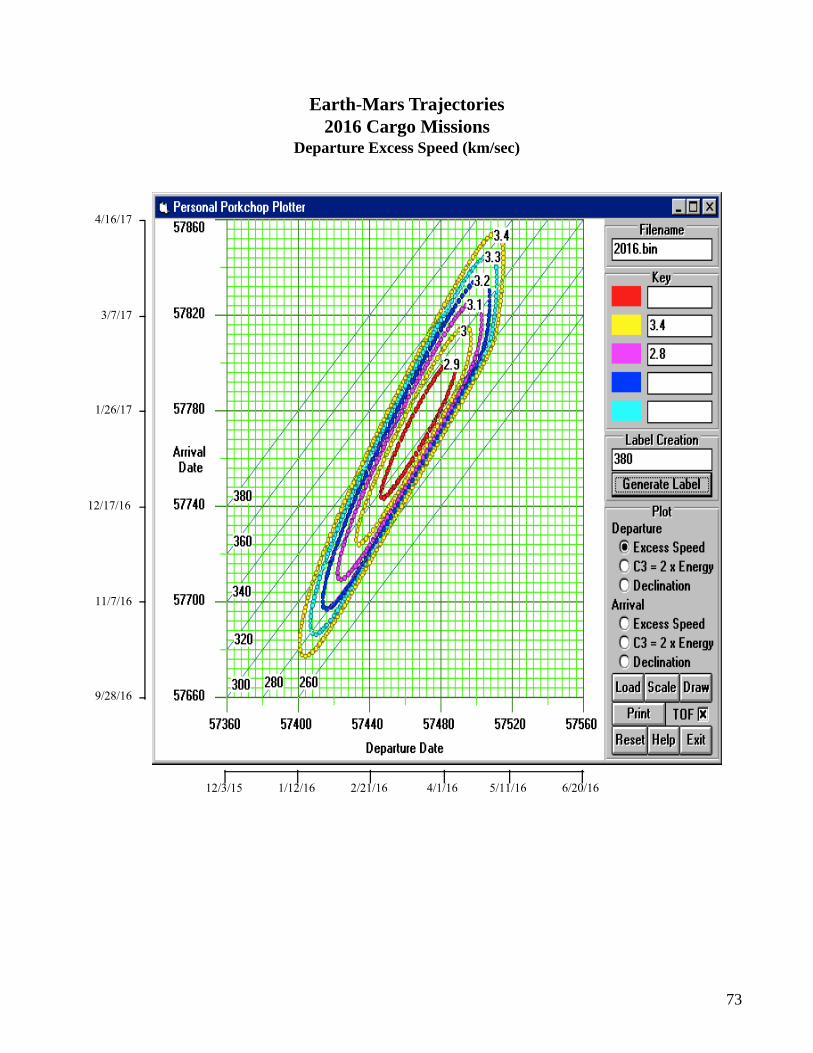
73
4/16/17
3/7/17
1/26/17
12/17/16
11/7/16
9/28/16
12/3/15 6/20/161/12/16 2/21/16 4/1/16 5/11/16
Earth-Mars Trajectories2016 Cargo Missions
Departure Excess Speed (km/sec)
74
4/16/17
3/7/17
1/26/17
12/17/16
11/7/16
9/28/16
12/3/15 6/20/161/12/16 2/21/16 4/1/16 5/11/16
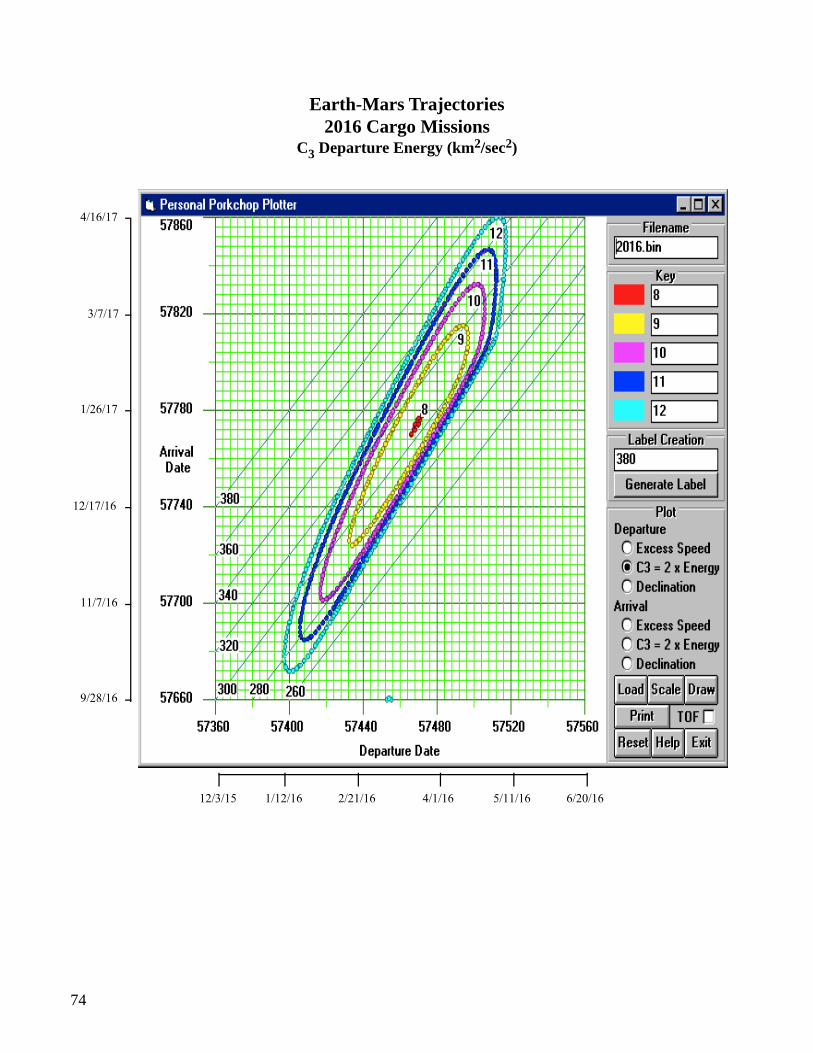
Earth-Mars Trajectories2016 Cargo Missions
C3 Departure Energy (km2/sec2)
75
4/16/17
3/7/17
1/26/17
12/17/16
11/7/16
9/28/16
12/3/15 6/20/161/12/16 2/21/16 4/1/16 5/11/16
Earth-Mars Trajectories2016 Cargo Missions
Departure Declination (Degrees)
76
11/7/16
9/28/16
8/19/16
7/10/16
5/31/16
4/21/16
1/12/16 4/21/162/1/16 2/21/16 3/12/16 4/1/16
CARGO
PILOTEDTRANSFERS
Earth-Mars Trajectories2016 Piloted Missions
Departure Excess Speed (km/sec)
77
11/7/16
9/28/16
8/19/16
7/10/16
5/31/16
4/21/16
1/12/16 4/21/162/1/16 2/21/16 3/12/16 4/1/16
CARGO
PILOTEDTRANSFERS
Earth-Mars Trajectories2016 Piloted Missions
C3 Departure Energy (km2/sec2)
78
11/7/16
9/28/16
8/19/16
7/10/16
5/31/16
4/21/16
1/12/16 4/21/162/1/16 2/21/16 3/12/16 4/1/16
Earth-Mars Trajectories2016 Piloted Missions
Departure Declination (Degrees)
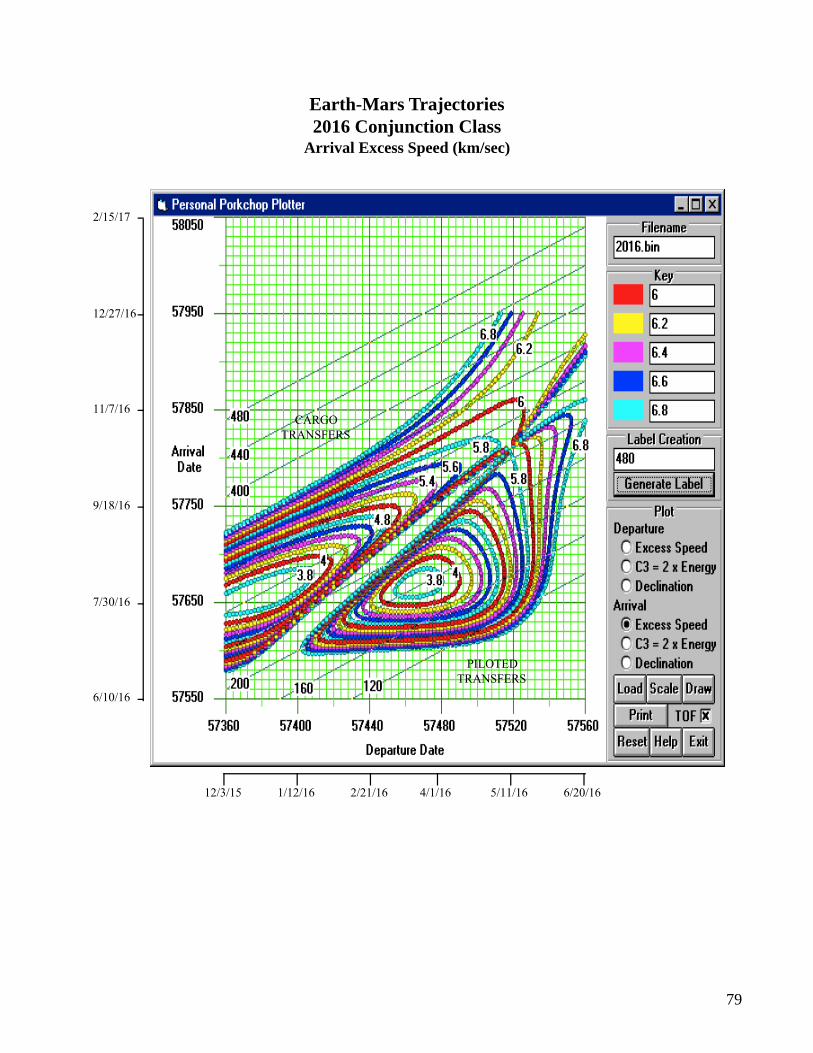
79
2/15/17
12/27/16
11/7/16
9/18/16
7/30/16
6/10/16
12/3/15 6/20/161/12/16 2/21/16 4/1/16 5/11/16
CARGOTRANSFERS
PILOTEDTRANSFERS
Earth-Mars Trajectories2016 Conjunction Class
Arrival Excess Speed (km/sec)
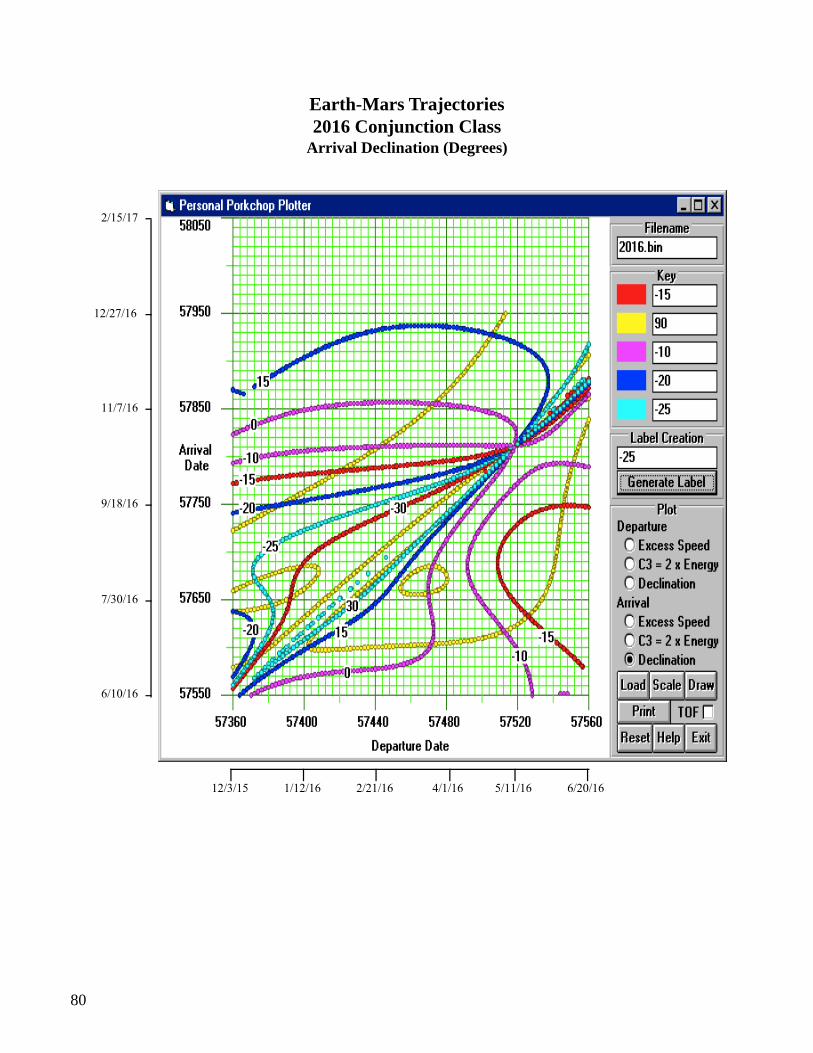
80
2/15/17
12/27/16
11/7/16
9/18/16
7/30/16
6/10/16
12/3/15 6/20/161/12/16 2/21/16 4/1/16 5/11/16
Earth-Mars Trajectories2016 Conjunction Class
Arrival Declination (Degrees)
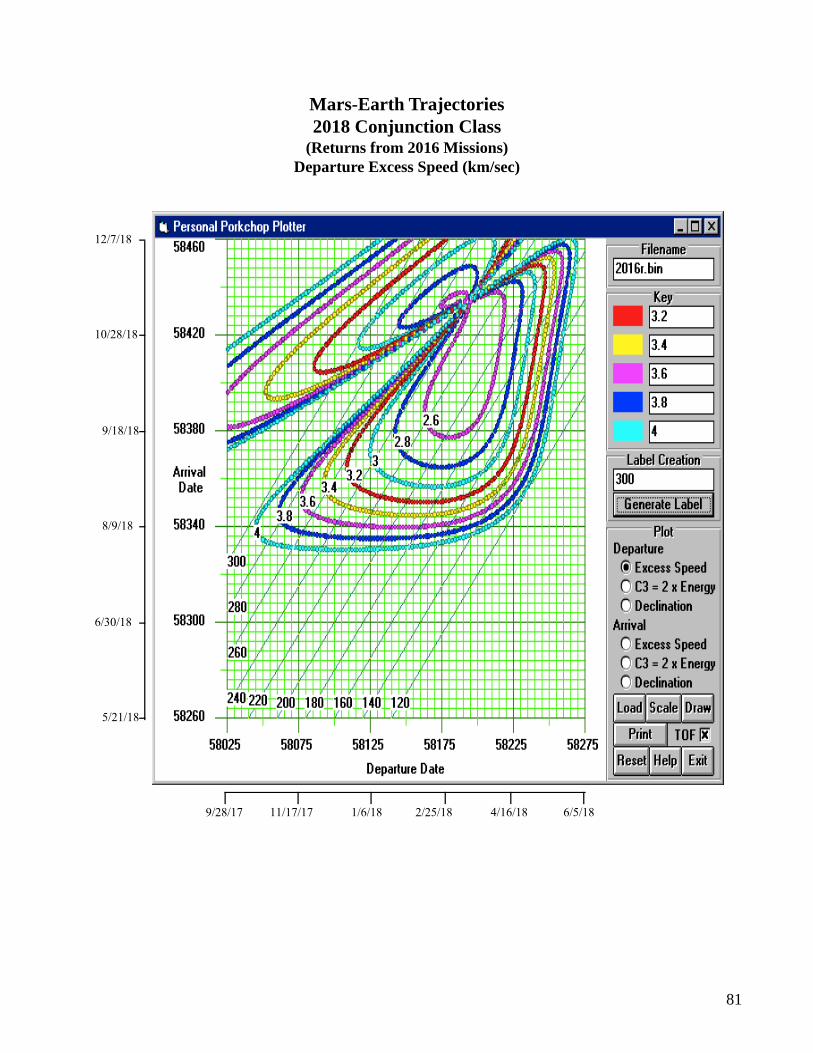
81
12/7/18
10/28/18
9/18/18
8/9/18
6/30/18
5/21/18
9/28/17 6/5/1811/17/17 1/6/18 2/25/18 4/16/18
Mars-Earth Trajectories2018 Conjunction Class
(Returns from 2016 Missions)Departure Excess Speed (km/sec)
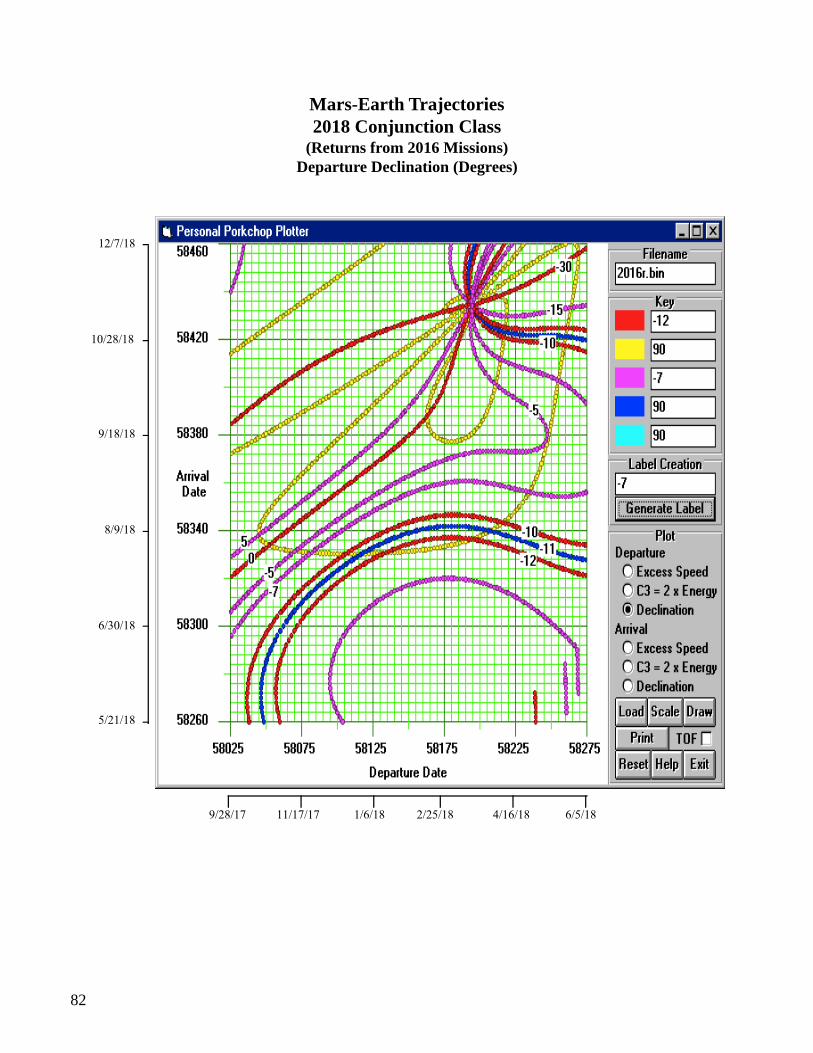
82
12/7/18
10/28/18
9/18/18
8/9/18
6/30/18
5/21/18
9/28/17 6/5/1811/17/17 1/6/18 2/25/18 4/16/18
Mars-Earth Trajectories2018 Conjunction Class
(Returns from 2016 Missions)Departure Declination (Degrees)
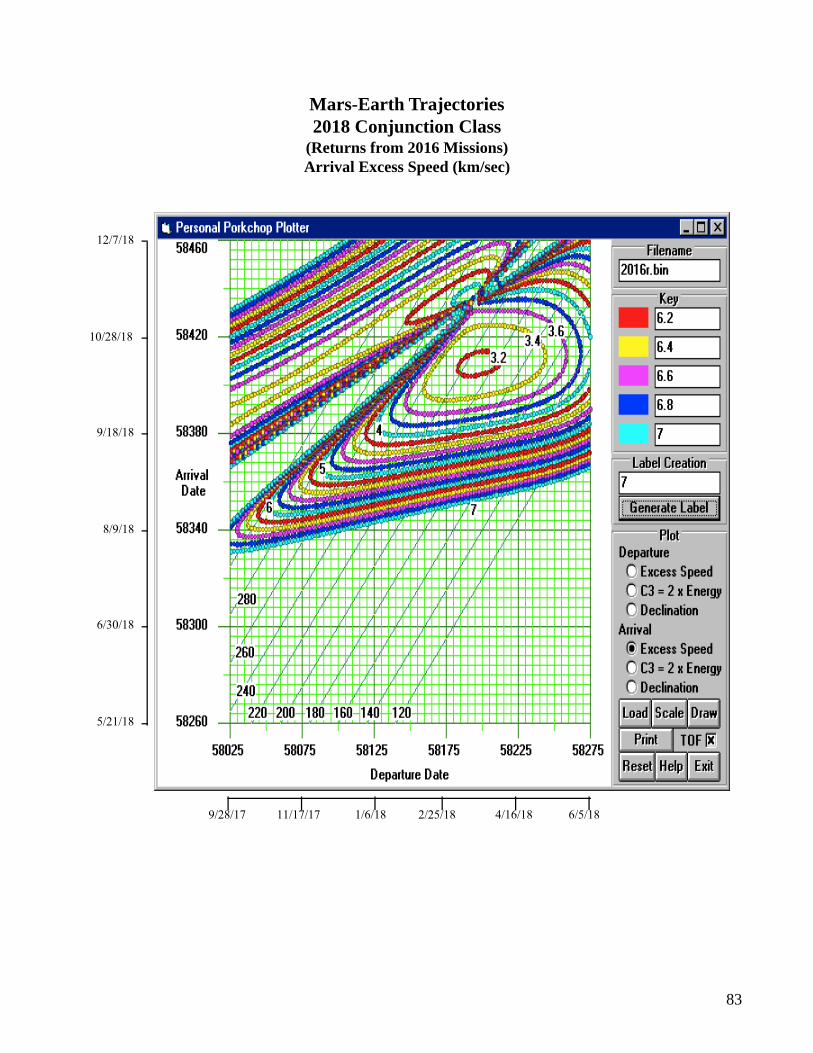
83
12/7/18
10/28/18
9/18/18
8/9/18
6/30/18
5/21/18
9/28/17 6/5/1811/17/17 1/6/18 2/25/18 4/16/18
Mars-Earth Trajectories2018 Conjunction Class
(Returns from 2016 Missions)Arrival Excess Speed (km/sec)
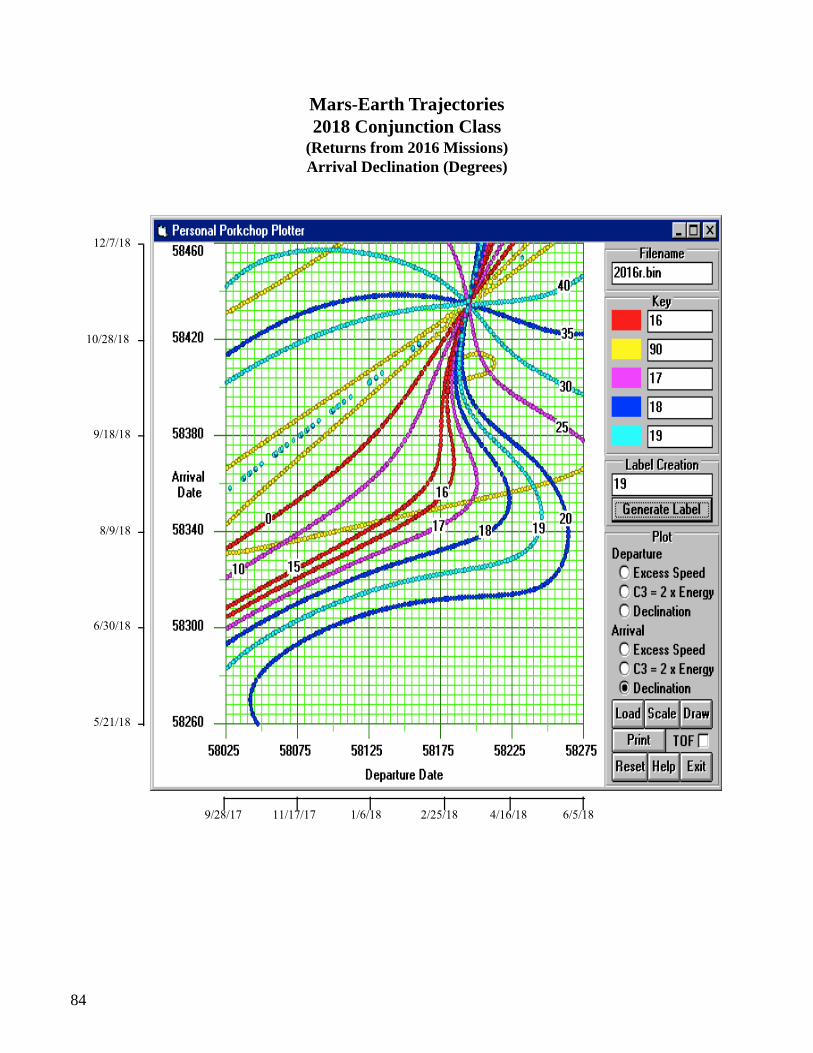
84
12/7/18
10/28/18
9/18/18
8/9/18
6/30/18
5/21/18
9/28/17 6/5/1811/17/17 1/6/18 2/25/18 4/16/18
Mars-Earth Trajectories2018 Conjunction Class
(Returns from 2016 Missions)Arrival Declination (Degrees)
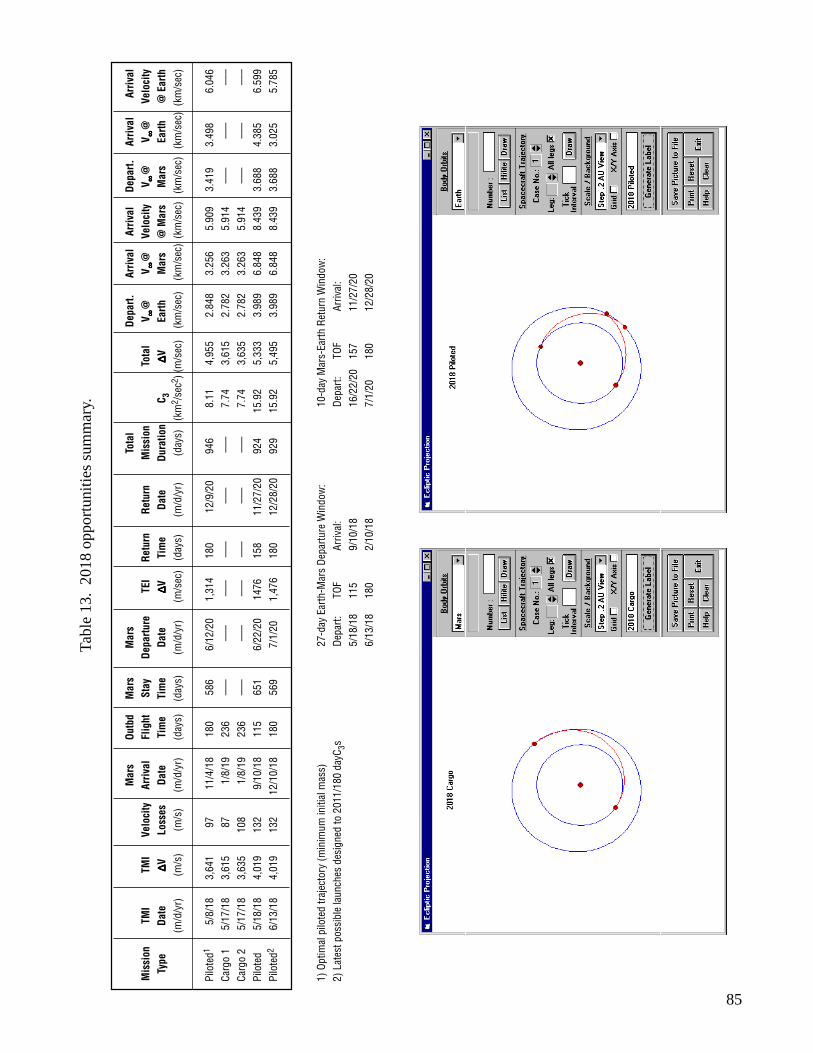
85
Tabl
e 13
. 20
18 o
ppor
tuni
ties
sum
mar
y.
Mar
sOu
tbd
Mar
sM
ars
Tota
lDe
part.
Arriv
alAr
rival
Depa
rt.Ar
rival
Arriv
alM
issi
onTM
ITM
IVe
loci
tyAr
rival
Flig
htSt
ayDe
partu
reTE
IRe
turn
Retu
rnM
issi
onTo
tal
V ∞ ∞ ∞ ∞ ∞ @
V ∞ ∞ ∞ ∞ ∞ @
Velo
city
V ∞ ∞ ∞ ∞ ∞ @
V ∞ ∞ ∞ ∞ ∞ @
Velo
city
Type
Date
∆∆∆∆ ∆VLo
sses
Date
Tim
eTi
me
Date
∆∆∆∆ ∆VTi
me
Date
Dura
tion
C 3∆∆∆∆ ∆V
Earth
Mar
s@
Mar
sM
ars
Earth
@ E
arth
(m/d
/yr)
(m/s
)(m
/s)
(m/d
/yr)
(day
s)(d
ays)
(m/d
/yr)
(m/s
ec)
(day
s)(m
/d/y
r)(d
ays)
(km
2 /se
c2 )(m
/sec
) (k
m/s
ec)
(km
/sec
) (k
m/s
ec)
(km
/sec
) (k
m/s
ec)
(km
/sec
)
Pilo
ted1
5/8/
183,
641
9711
/4/1
818
058
66/
12/2
01,
314
180
12/9
/20
946
8.11
4,95
52.
848
3.25
65.
909
3.41
93.
498
6.04
6Ca
rgo
15/
17/1
83,
615
871/
8/19
236
–––
–––
–––
–––
–––
–––
7.74
3,61
52.
782
3.26
35.
914
–––
–––
–––
Carg
o 2
5/17
/18
3,63
510
81/
8/19
236
–––
–––
–––
–––
–––
–––
7.74
3,63
52.
782
3.26
35.
914
–––
–––
–––
Pilo
ted
5/18
/18
4,01
913
29/
10/1
811
565
16/
22/2
014
7615
811
/27/
2092
415
.92
5,33
33.
989
6.84
88.
439
3.68
84.
385
6.59
9Pi
lote
d26/
13/1
84,
019
132
12/1
0/18
180
569
7/1/
201,
476
180
12/2
8/20
929
15.9
25,
495
3.98
96.
848
8.43
93.
688
3.02
55.
785
1) O
ptim
al p
ilote
d tra
ject
ory
(min
imum
initi
al m
ass)
27-d
ay E
arth
-Mar
s De
partu
re W
indo
w:
10-d
ay M
ars-
Earth
Ret
urn
Win
dow
:2)
Lat
est p
ossi
ble
laun
ches
des
igne
d to
201
1/18
0 da
yC3s
Depa
rt:TO
FAr
rival
:De
part:
TOF
Arriv
al:
5/18
/18
115
9/10
/18
16/2
2/20
157
11/2
7/20
6/13
/18
180
2/10
/18
7/1/
2018
012
/28/
20
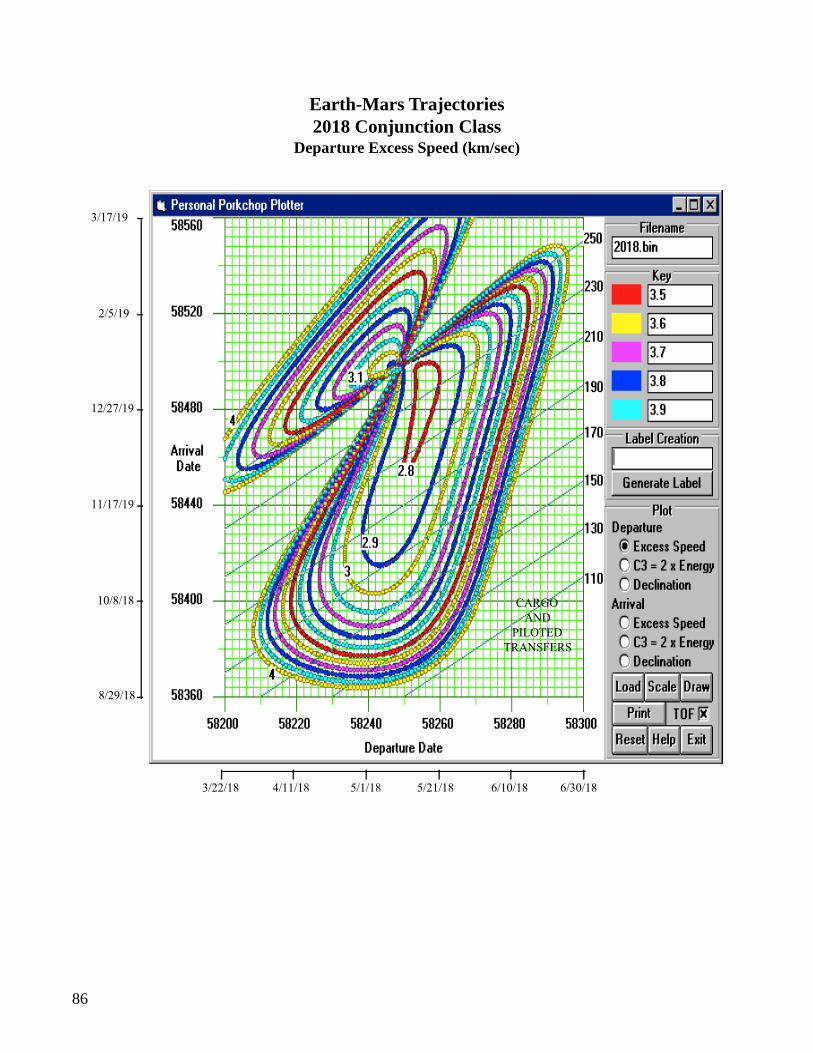
86
3/17/19
2/5/19
12/27/19
11/17/19
10/8/18
8/29/18
3/22/18 6/30/184/11/18 5/1/18 5/21/18 6/10/18
CARGOAND
PILOTEDTRANSFERS
Earth-Mars Trajectories2018 Conjunction Class
Departure Excess Speed (km/sec)
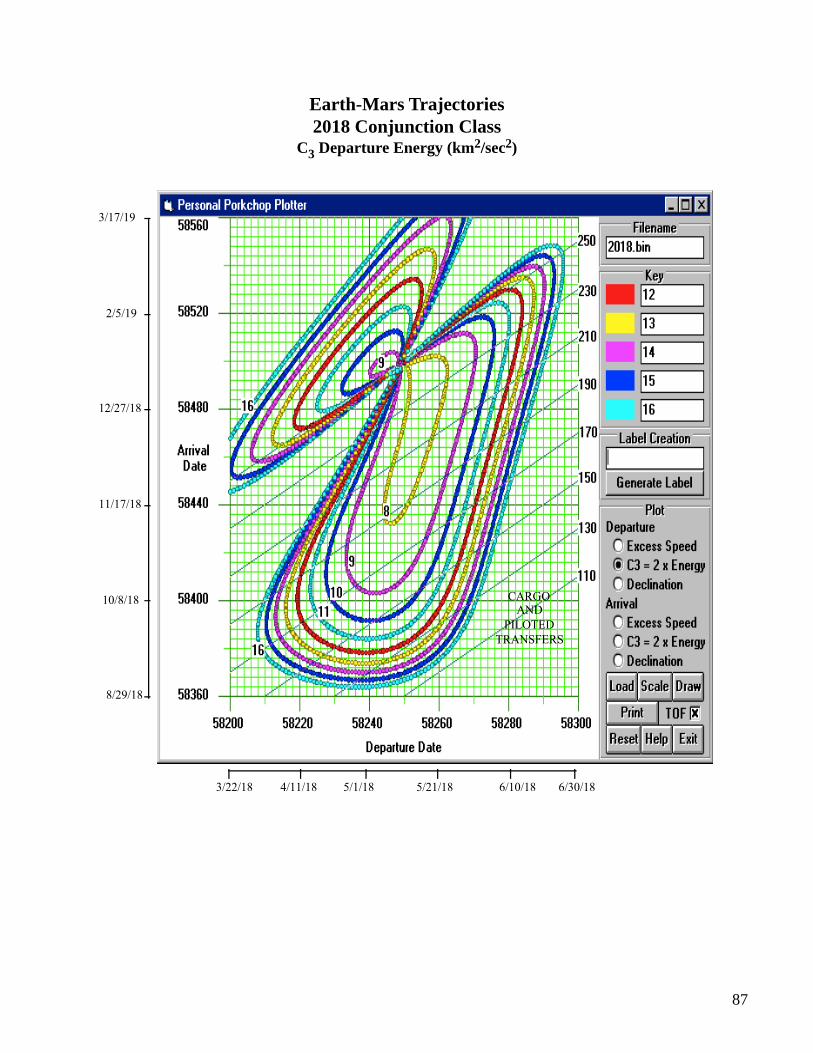
87
3/17/19
2/5/19
12/27/18
11/17/18
10/8/18
8/29/18
3/22/18 6/30/184/11/18 5/1/18 5/21/18 6/10/18
CARGOAND
PILOTEDTRANSFERS
Earth-Mars Trajectories2018 Conjunction Class
C3 Departure Energy (km2/sec2)
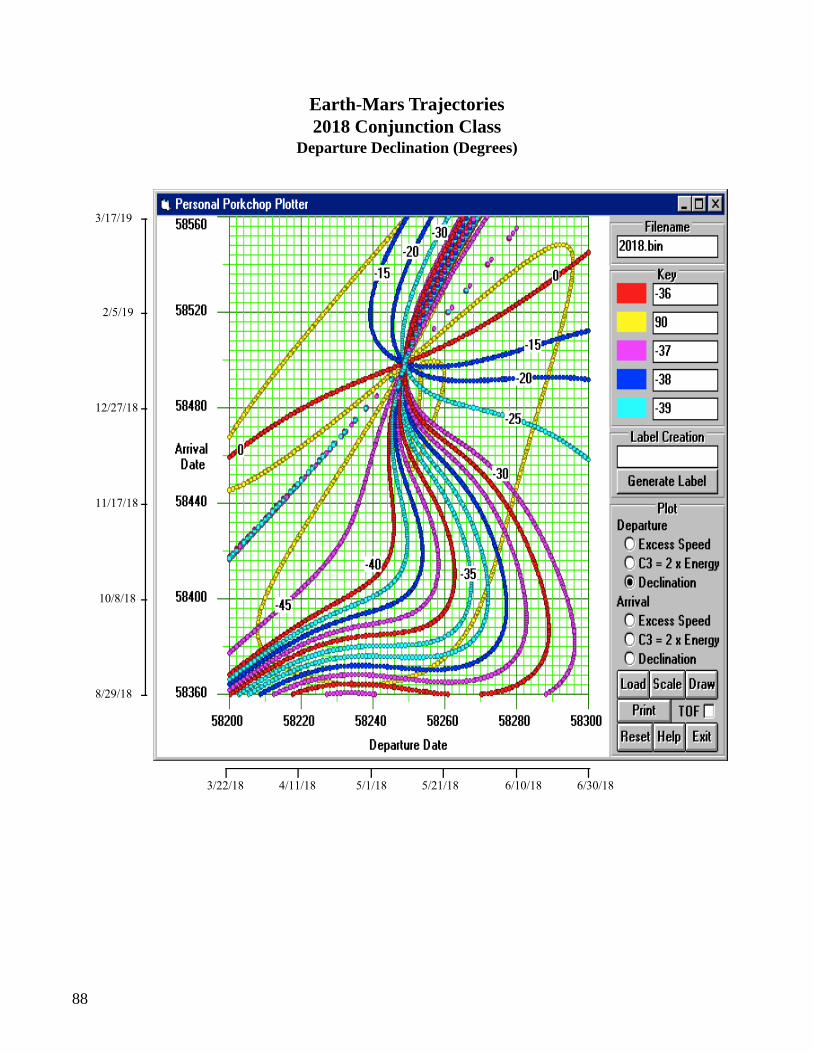
88
3/17/19
2/5/19
12/27/18
11/17/18
10/8/18
8/29/18
3/22/18 6/30/184/11/18 5/1/18 5/21/18 6/10/18
Earth-Mars Trajectories2018 Conjunction Class
Departure Declination (Degrees)
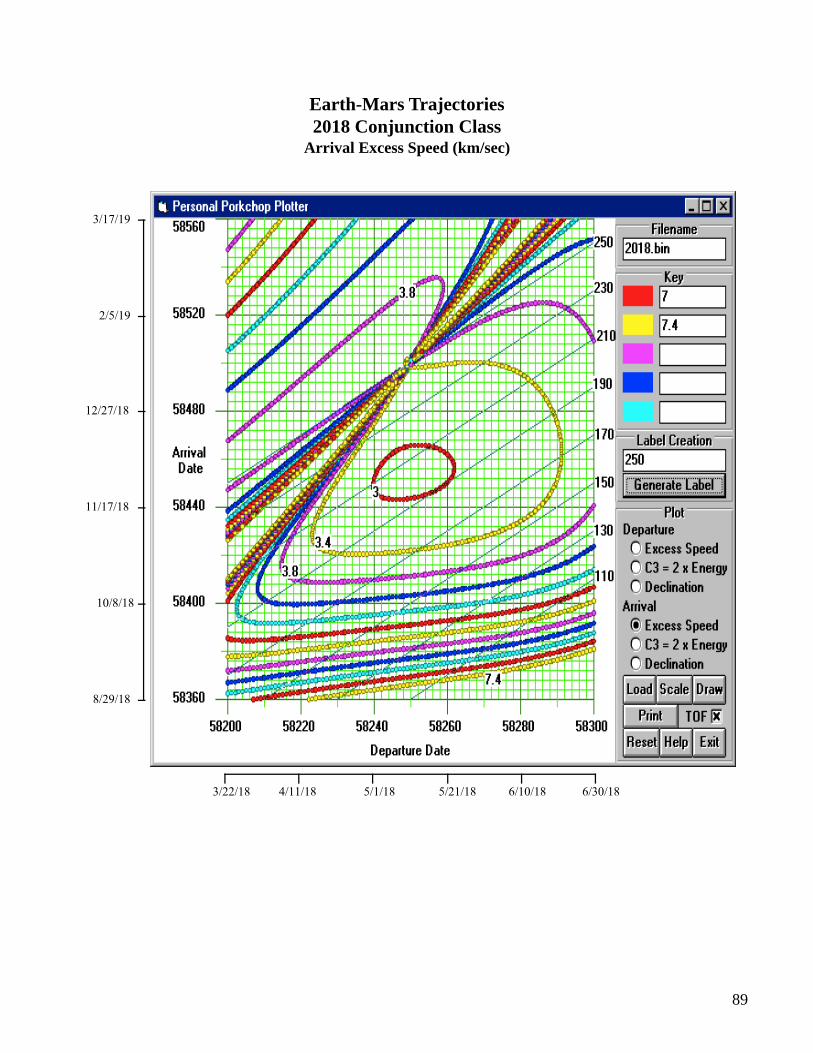
89
3/17/19
2/5/19
12/27/18
11/17/18
10/8/18
8/29/18
3/22/18 6/30/184/11/18 5/1/18 5/21/18 6/10/18
Earth-Mars Trajectories2018 Conjunction Class
Arrival Excess Speed (km/sec)
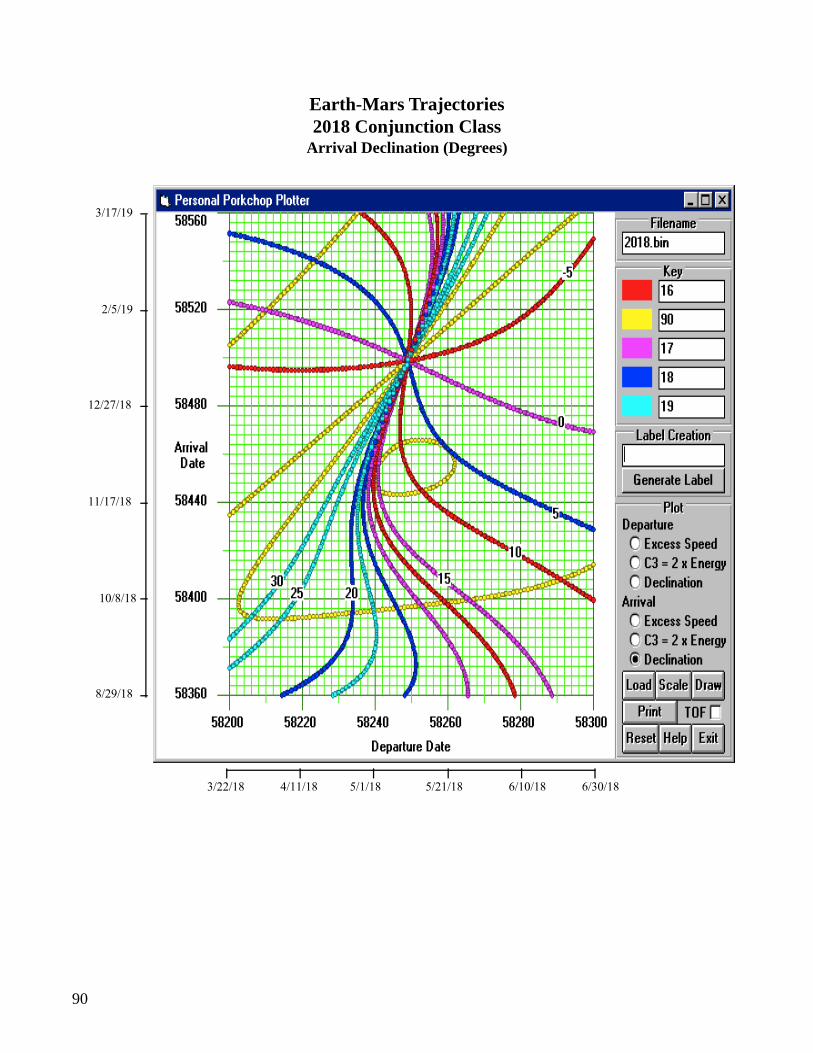
90
3/17/19
2/5/19
12/27/18
11/17/18
10/8/18
8/29/18
3/22/18 6/30/184/11/18 5/1/18 5/21/18 6/10/18
Earth-Mars Trajectories2018 Conjunction Class
Arrival Declination (Degrees)
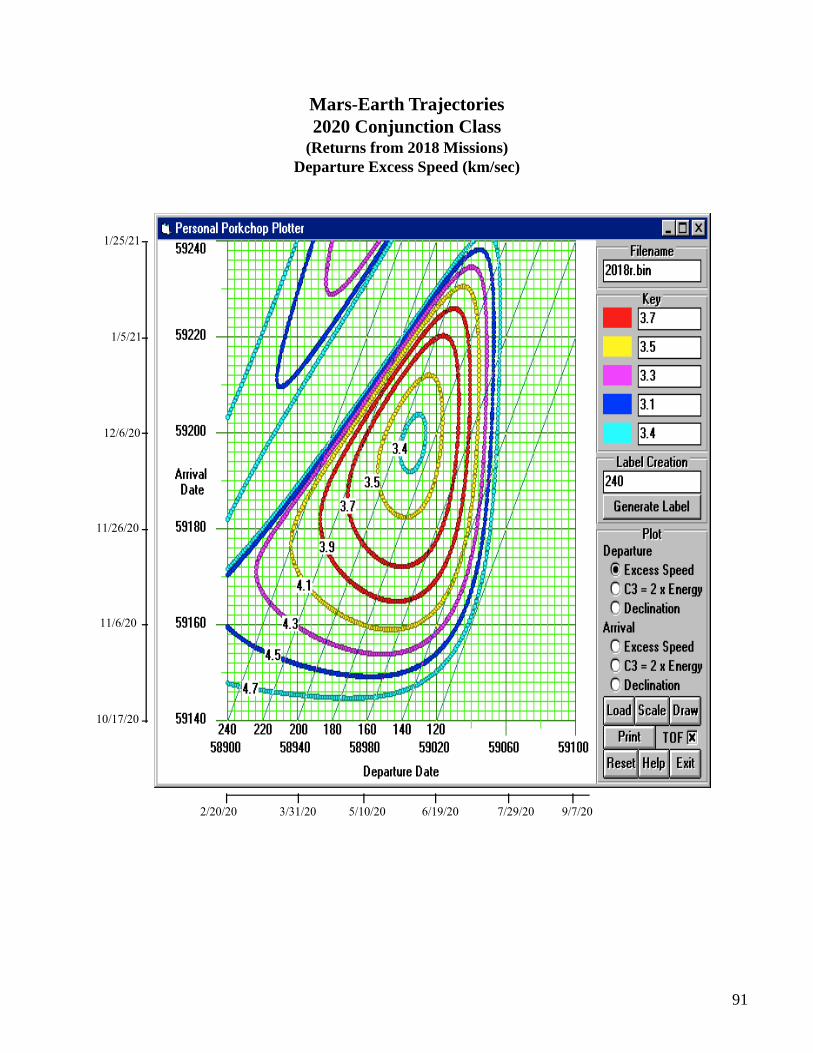
91
1/25/21
1/5/21
12/6/20
11/26/20
11/6/20
10/17/20
2/20/20 9/7/203/31/20 5/10/20 6/19/20 7/29/20
Mars-Earth Trajectories2020 Conjunction Class
(Returns from 2018 Missions)Departure Excess Speed (km/sec)
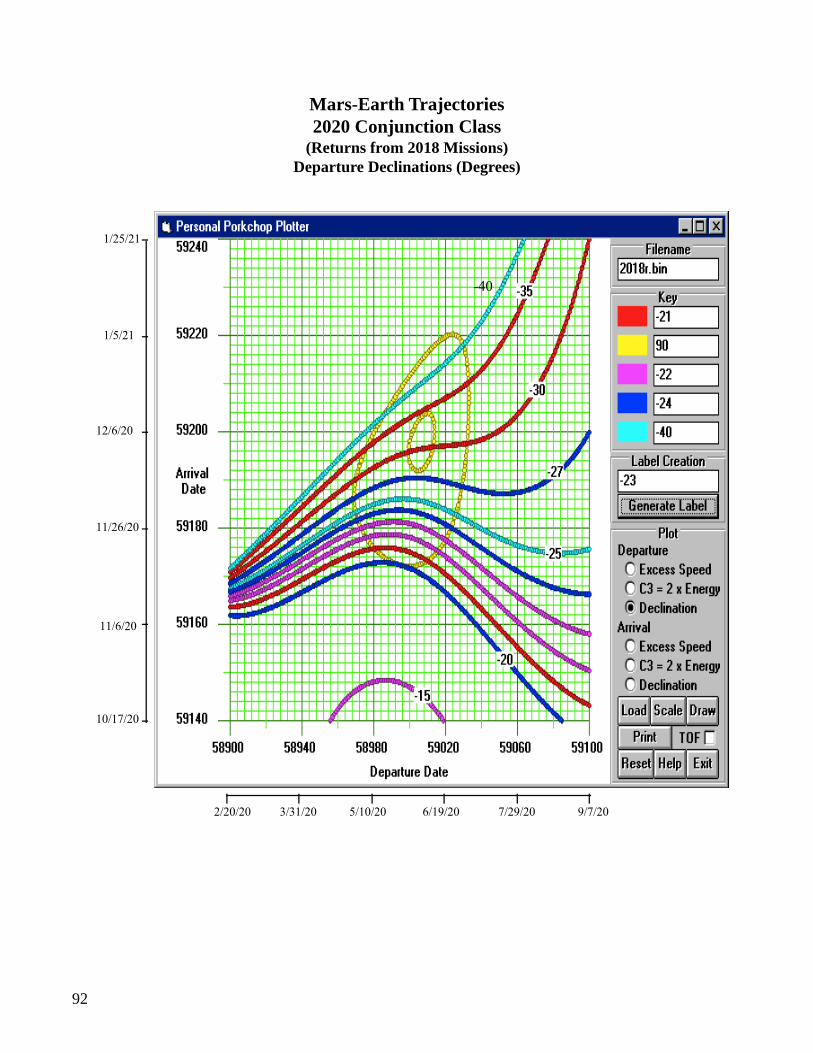
92
1/25/21
1/5/21
12/6/20
11/26/20
11/6/20
10/17/20
2/20/20 9/7/203/31/20 5/10/20 6/19/20 7/29/20
-40
Mars-Earth Trajectories2020 Conjunction Class
(Returns from 2018 Missions)Departure Declinations (Degrees)
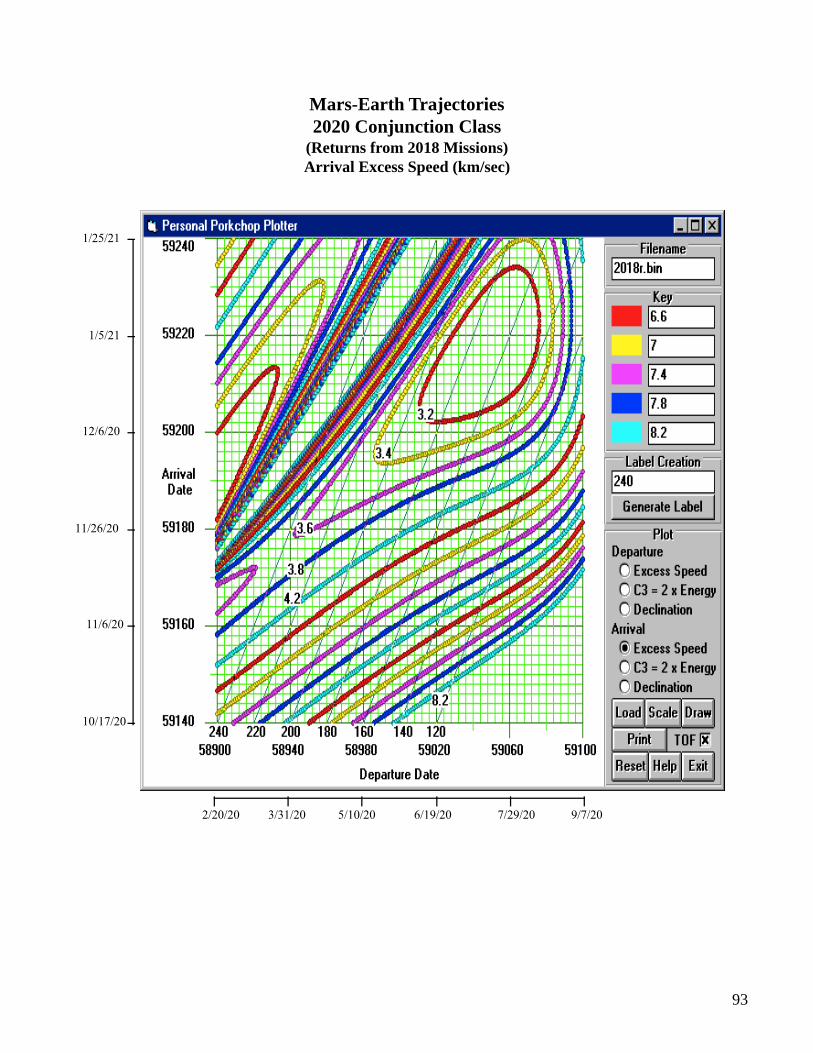
93
1/25/21
1/5/21
12/6/20
11/26/20
11/6/20
10/17/20
2/20/20 9/7/203/31/20 5/10/20 6/19/20 7/29/20
Mars-Earth Trajectories2020 Conjunction Class
(Returns from 2018 Missions)Arrival Excess Speed (km/sec)
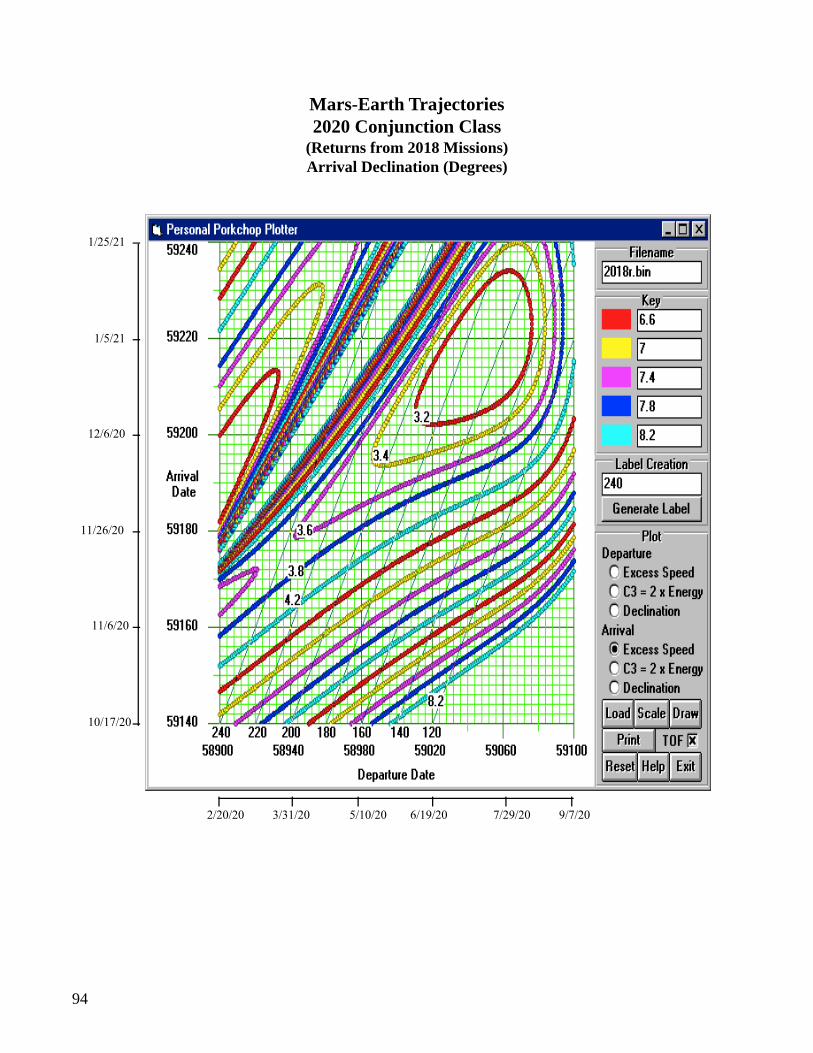
94
1/25/21
1/5/21
12/6/20
11/26/20
11/6/20
10/17/20
2/20/20 9/7/203/31/20 5/10/20 6/19/20 7/29/20
Mars-Earth Trajectories2020 Conjunction Class
(Returns from 2018 Missions)Arrival Declination (Degrees)
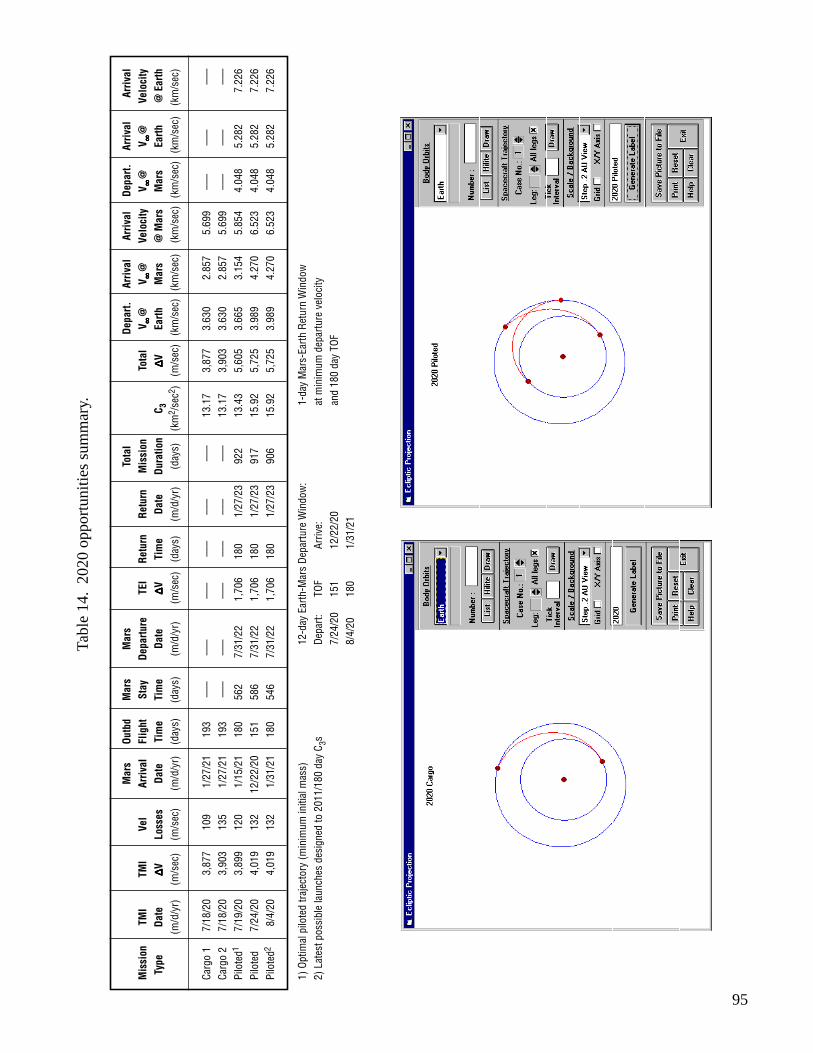
95
Tabl
e 14
. 20
20 o
ppor
tuni
ties
sum
mar
y.
Mar
sOu
tbd
Mar
sM
ars
Tota
lDe
part.
Arriv
alAr
rival
Depa
rt.Ar
rival
Arriv
alM
issi
onTM
ITM
IVe
lAr
rival
Flig
htSt
ayDe
partu
reTE
IRe
turn
Retu
rnM
issi
onTo
tal
V ∞ ∞ ∞ ∞ ∞ @
V ∞ ∞ ∞ ∞ ∞ @
Velo
city
V ∞ ∞ ∞ ∞ ∞ @
V ∞ ∞ ∞ ∞ ∞ @
Velo
city
Typ
eDa
te∆∆∆∆ ∆V
Loss
esDa
teTi
me
Tim
eDa
te∆∆∆∆ ∆V
Tim
eDa
teDu
ratio
nC 3
∆∆∆∆ ∆VEa
rthM
ars
@ M
ars
Mar
sEa
rth@
Ear
th(m
/d/y
r)(m
/sec
)(m
/sec
)(m
/d/y
r)(d
ays)
(day
s)(m
/d/y
r)(m
/sec
)(d
ays)
(m/d
/yr)
(day
s)(k
m2 /
sec2 )
(m/s
ec)
(km
/sec
) (k
m/s
ec)
(km
/sec
) (k
m/s
ec)
(km
/sec
) (k
m/s
ec)
Carg
o 1
7/18
/20
3,87
710
91/
27/2
119
3 –
–– –
–– –
–– –
–– –
–– –
––13
.17
3,87
73.
630
2.85
75.
699
–––
–––
–––
Carg
o 2
7/18
/20
3,90
313
51/
27/2
119
3 –
–– –
–– –
–– –
–– –
–– –
––13
.17
3,90
33.
630
2.85
75.
699
–––
–––
–––
Pilo
ted1
7/19
/20
3,89
912
01/
15/2
118
056
27/
31/2
21,
706
180
1/27
/23
922
13.4
35,
605
3.66
53.
154
5.85
44.
048
5.28
27.
226
Pilo
ted
7/24
/20
4,01
913
212
/22/
2015
158
67/
31/2
21,
706
180
1/27
/23
917
15.9
25,
725
3.98
94.
270
6.52
34.
048
5.28
27.
226
Pilo
ted2
8/4/
204,
019
132
1/31
/21
180
546
7/31
/22
1,70
618
01/
27/2
390
615
.92
5,72
53.
989
4.27
06.
523
4.04
85.
282
7.22
6
1) O
ptim
al p
ilote
d tra
ject
ory
(min
imum
initi
al m
ass)
12-d
ay E
arth
-Mar
s De
partu
re W
indo
w:
1-da
y M
ars-
Earth
Ret
urn
Win
dow
2) L
ates
t pos
sibl
e la
unch
es d
esig
ned
to 2
011/
180
day
C 3sDe
part:
TOF
Arriv
e:at
min
imum
dep
artu
re v
eloc
ity7/
24/2
015
112
/22/
20an
d 18
0 da
y TO
F8/
4/20
180
1/31
/21
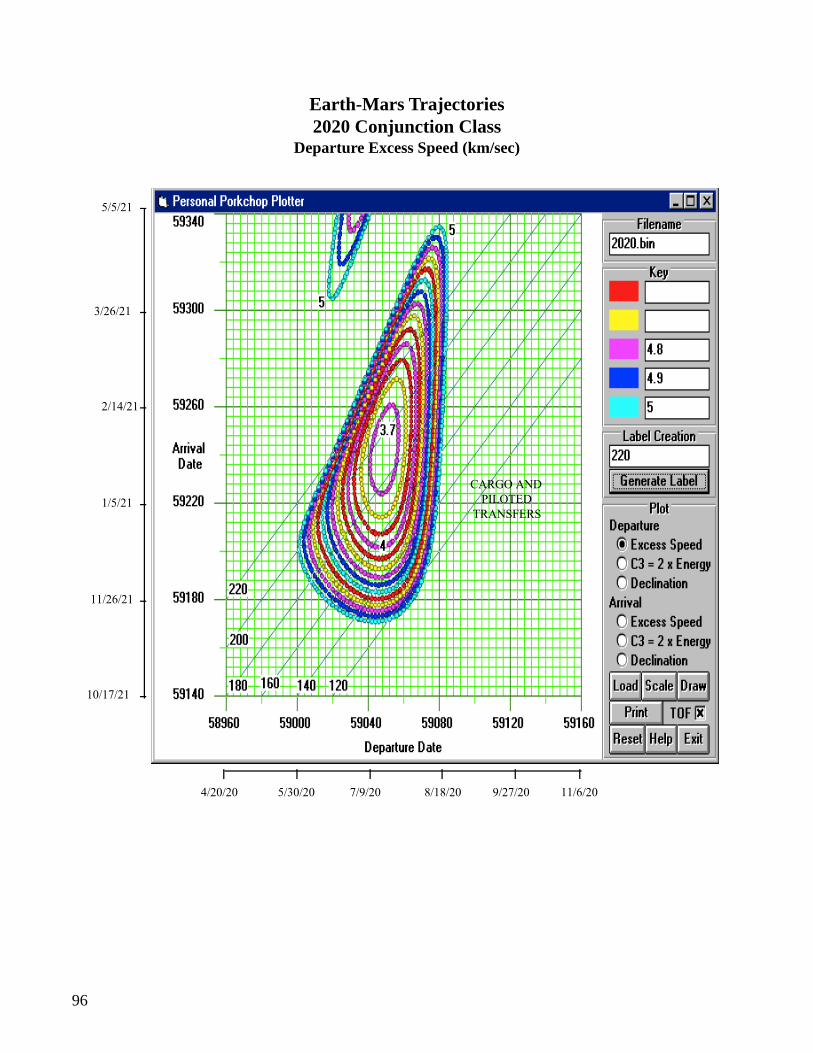
96
5/5/21
3/26/21
2/14/21
1/5/21
11/26/21
10/17/21
4/20/20 11/6/205/30/20 7/9/20 8/18/20 9/27/20
CARGO ANDPILOTED
TRANSFERS
Earth-Mars Trajectories2020 Conjunction Class
Departure Excess Speed (km/sec)
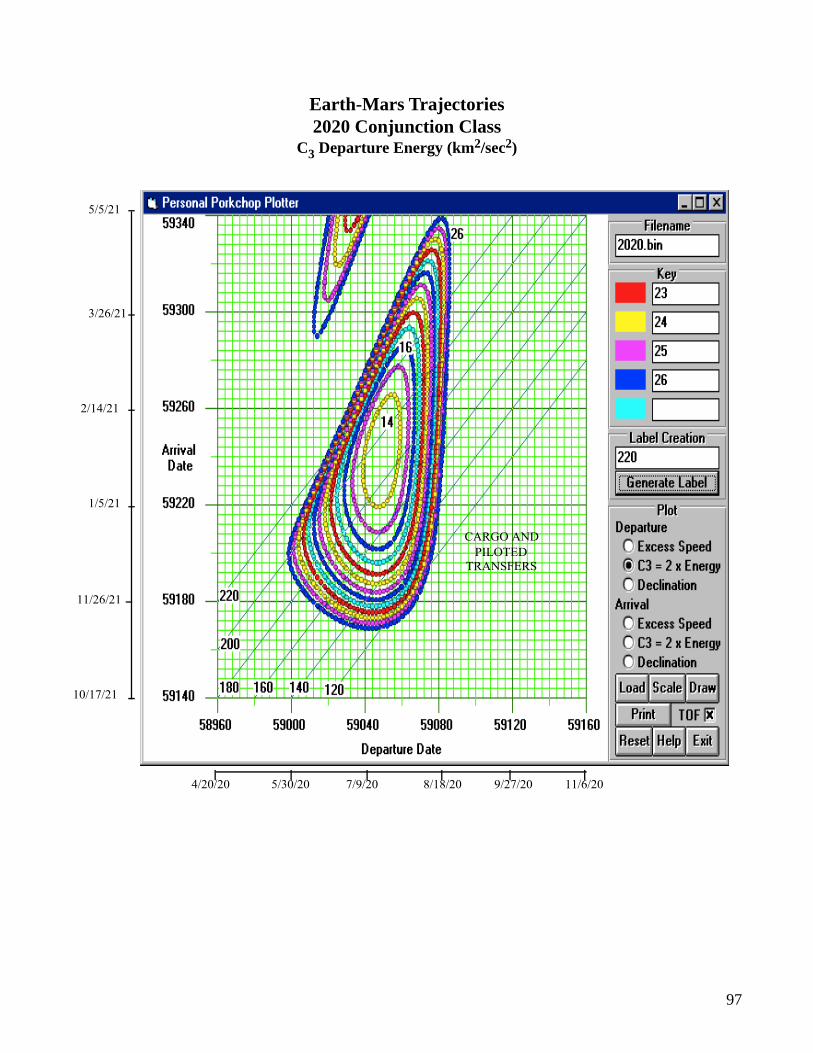
97
5/5/21
3/26/21
2/14/21
1/5/21
11/26/21
10/17/21
4/20/20 11/6/205/30/20 7/9/20 8/18/20 9/27/20
CARGO ANDPILOTED
TRANSFERS
Earth-Mars Trajectories2020 Conjunction Class
C3 Departure Energy (km2/sec2)
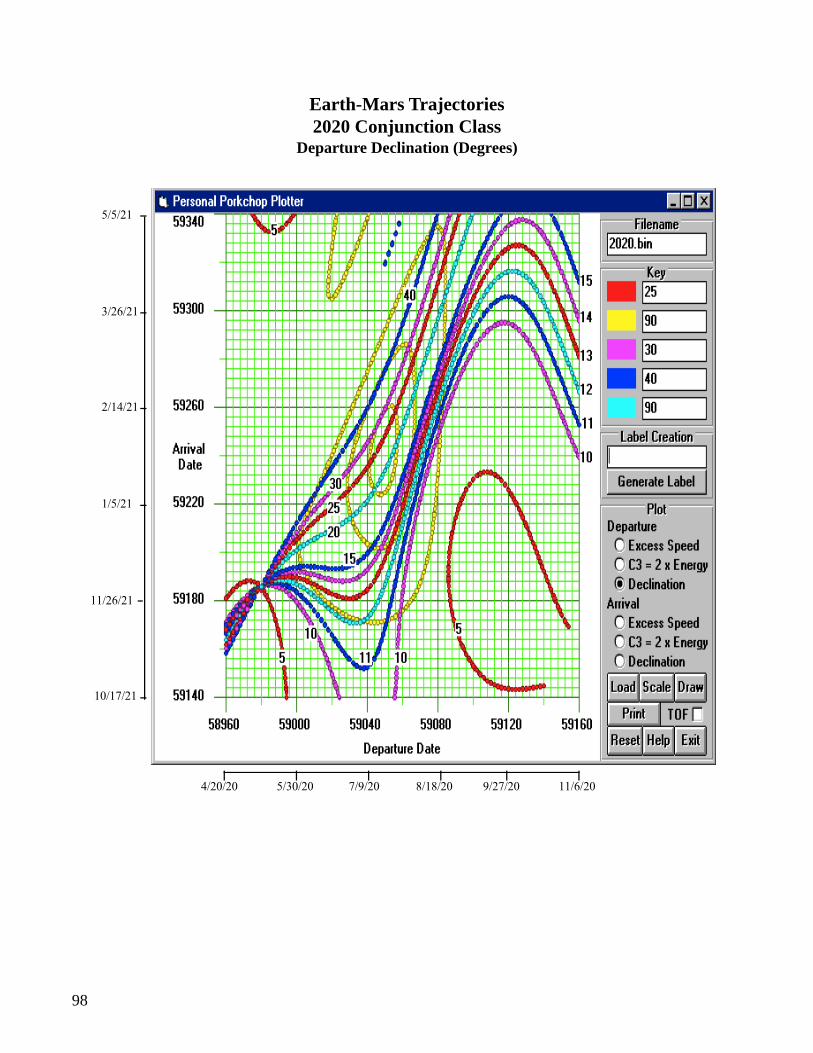
98
5/5/21
3/26/21
2/14/21
1/5/21
11/26/21
10/17/21
4/20/20 11/6/205/30/20 7/9/20 8/18/20 9/27/20
Earth-Mars Trajectories2020 Conjunction Class
Departure Declination (Degrees)
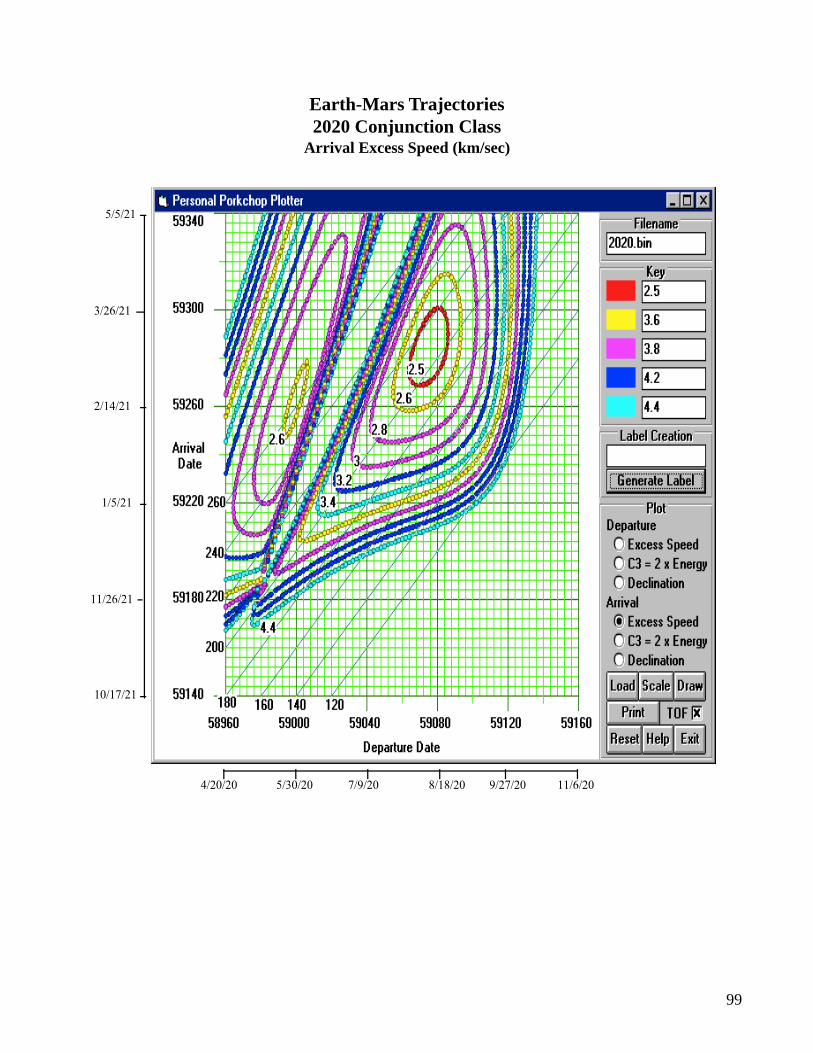
99
5/5/21
3/26/21
2/14/21
1/5/21
11/26/21
10/17/21
4/20/20 11/6/205/30/20 7/9/20 8/18/20 9/27/20
Earth-Mars Trajectories2020 Conjunction Class
Arrival Excess Speed (km/sec)
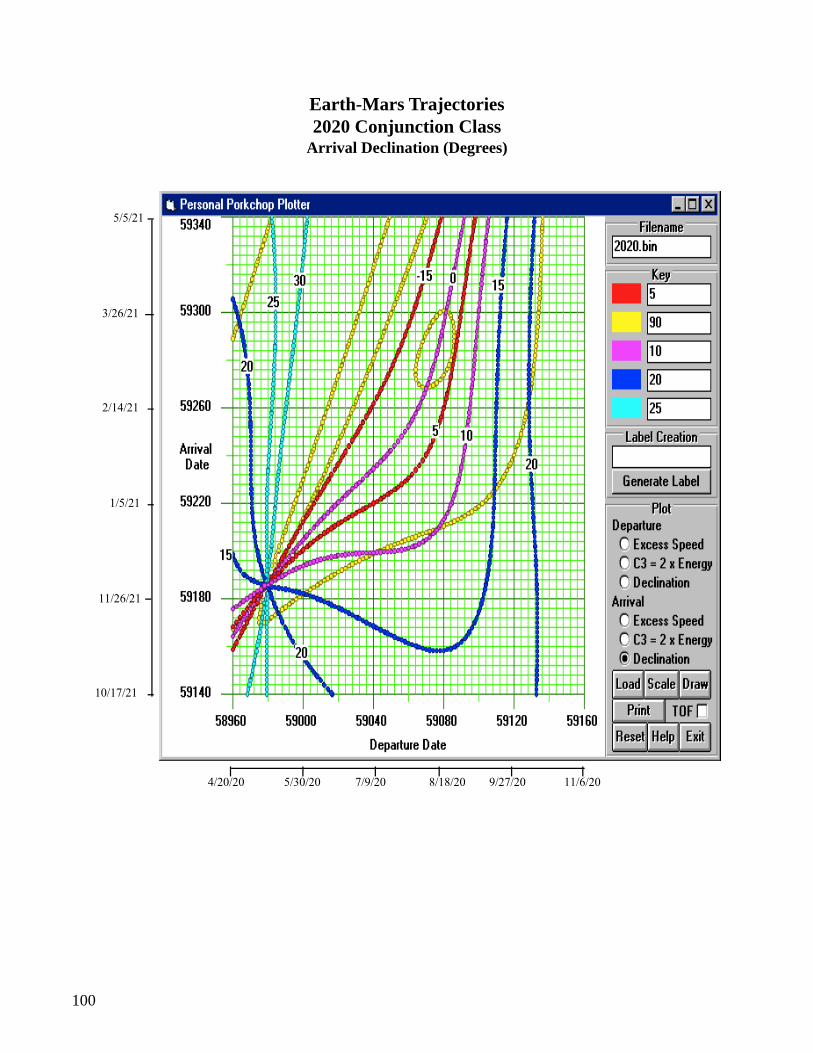
100
5/5/21
3/26/21
2/14/21
1/5/21
11/26/21
10/17/21
4/20/20 11/6/205/30/20 7/9/20 8/18/20 9/27/20
Earth-Mars Trajectories2020 Conjunction Class
Arrival Declination (Degrees)
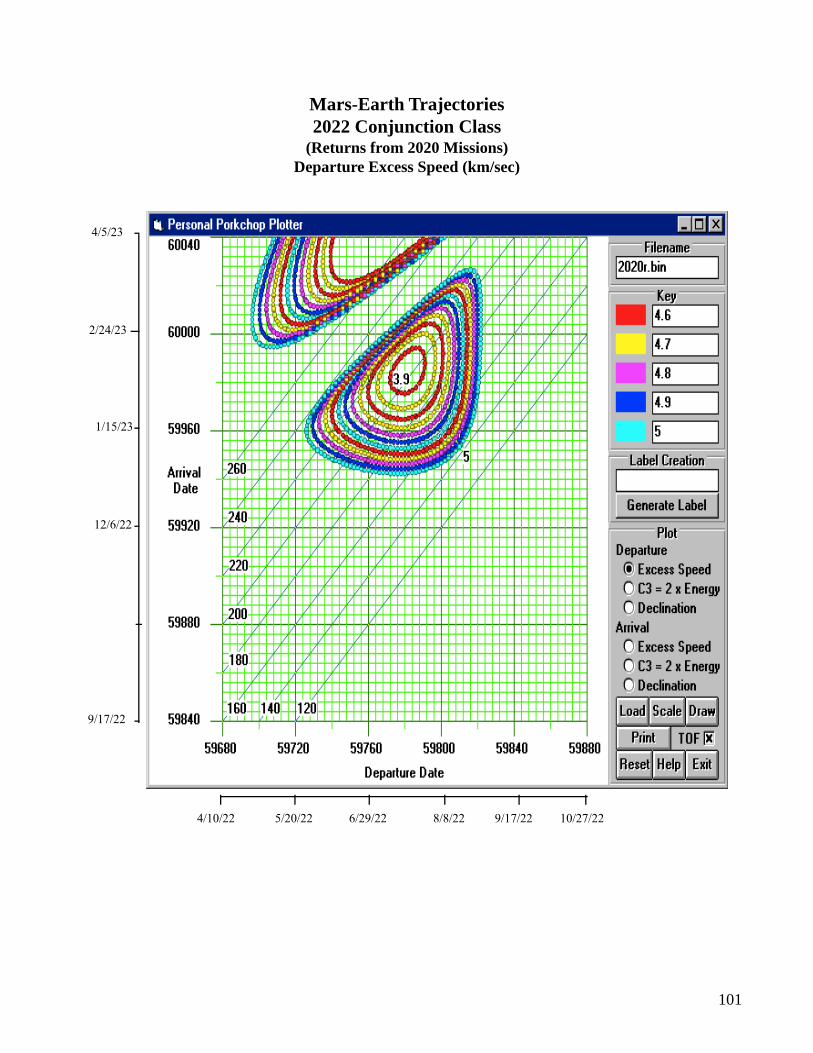
101
4/5/23
2/24/23
1/15/23
12/6/22
9/17/22
4/10/22 10/27/225/20/22 6/29/22 8/8/22 9/17/22
Mars-Earth Trajectories2022 Conjunction Class
(Returns from 2020 Missions)Departure Excess Speed (km/sec)
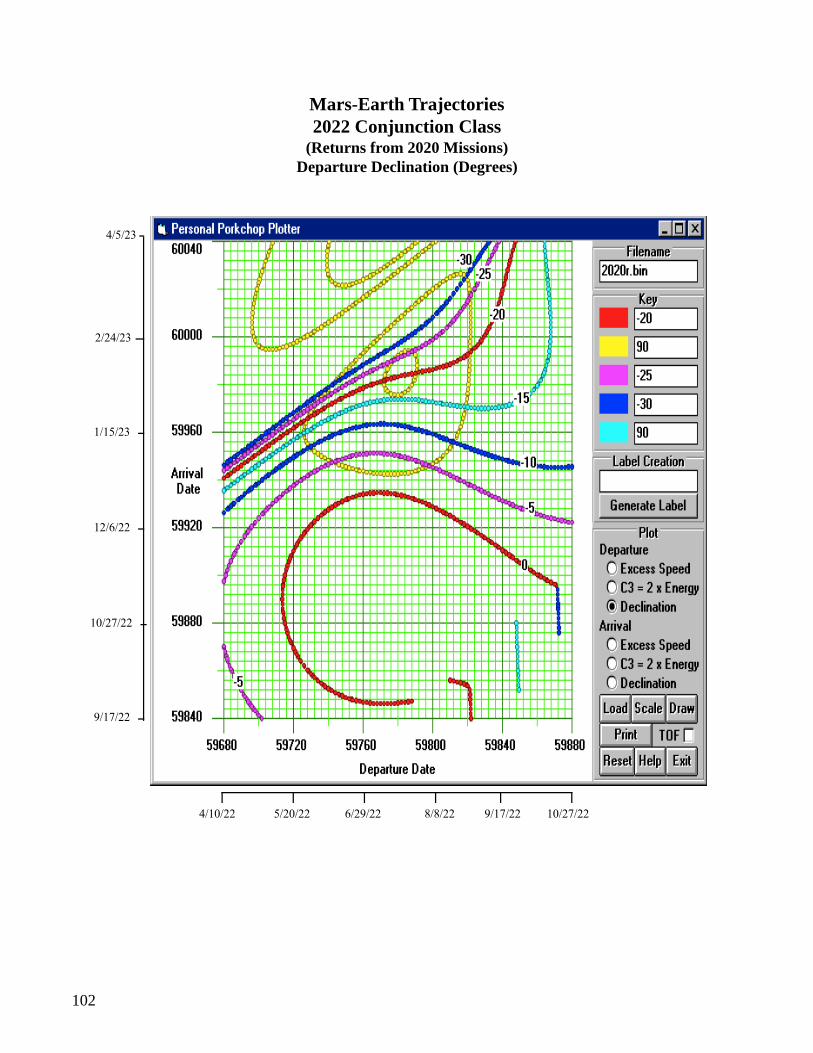
102
4/5/23
2/24/23
1/15/23
12/6/22
10/27/22
9/17/22
4/10/22 10/27/225/20/22 6/29/22 8/8/22 9/17/22
Mars-Earth Trajectories2022 Conjunction Class
(Returns from 2020 Missions)Departure Declination (Degrees)
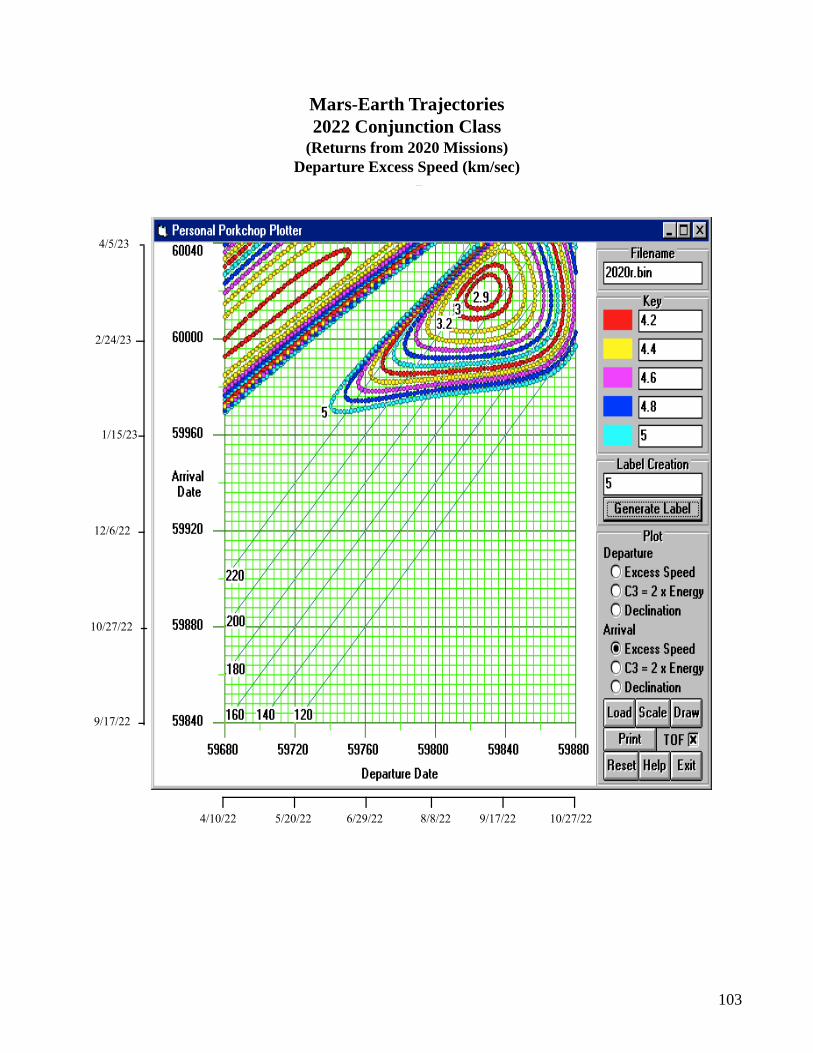
103
p ( )
4/5/23
2/24/23
1/15/23
12/6/22
10/27/22
9/17/22
4/10/22 10/27/225/20/22 6/29/22 8/8/22 9/17/22
Mars-Earth Trajectories2022 Conjunction Class
(Returns from 2020 Missions)Departure Excess Speed (km/sec)
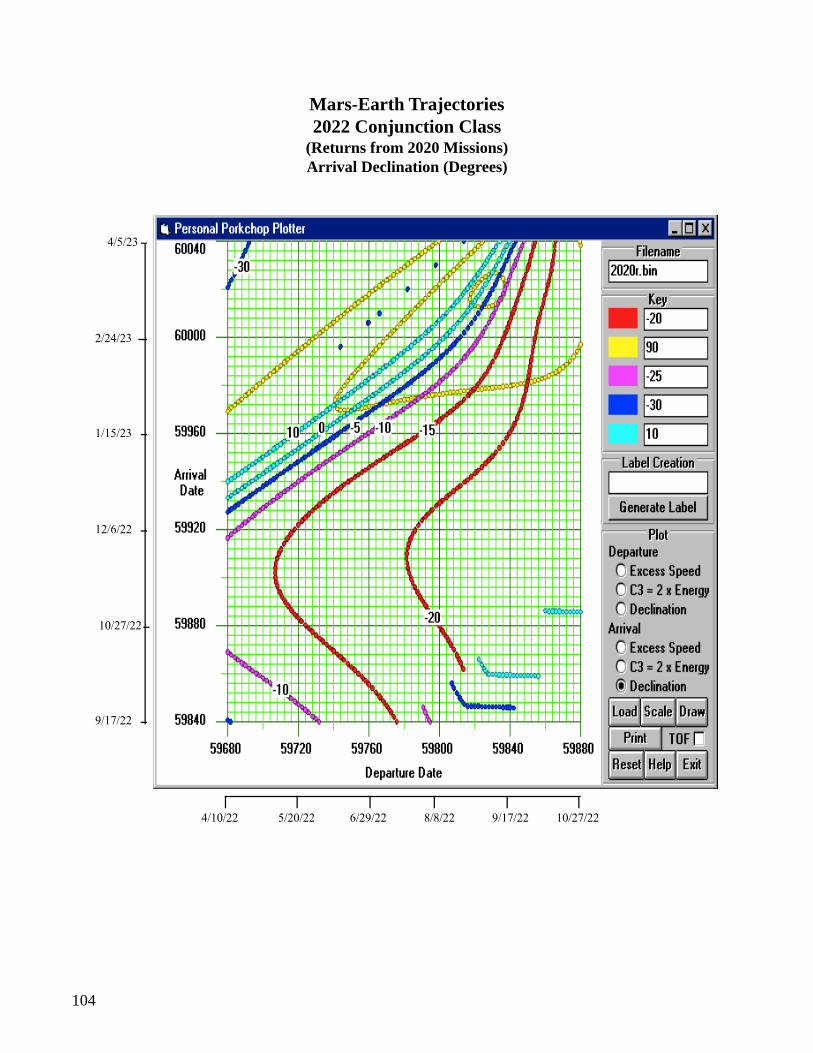
104
4/5/23
2/24/23
1/15/23
12/6/22
10/27/22
9/17/22
4/10/22 10/27/225/20/22 6/29/22 8/8/22 9/17/22
Mars-Earth Trajectories2022 Conjunction Class
(Returns from 2020 Missions)Arrival Declination (Degrees)
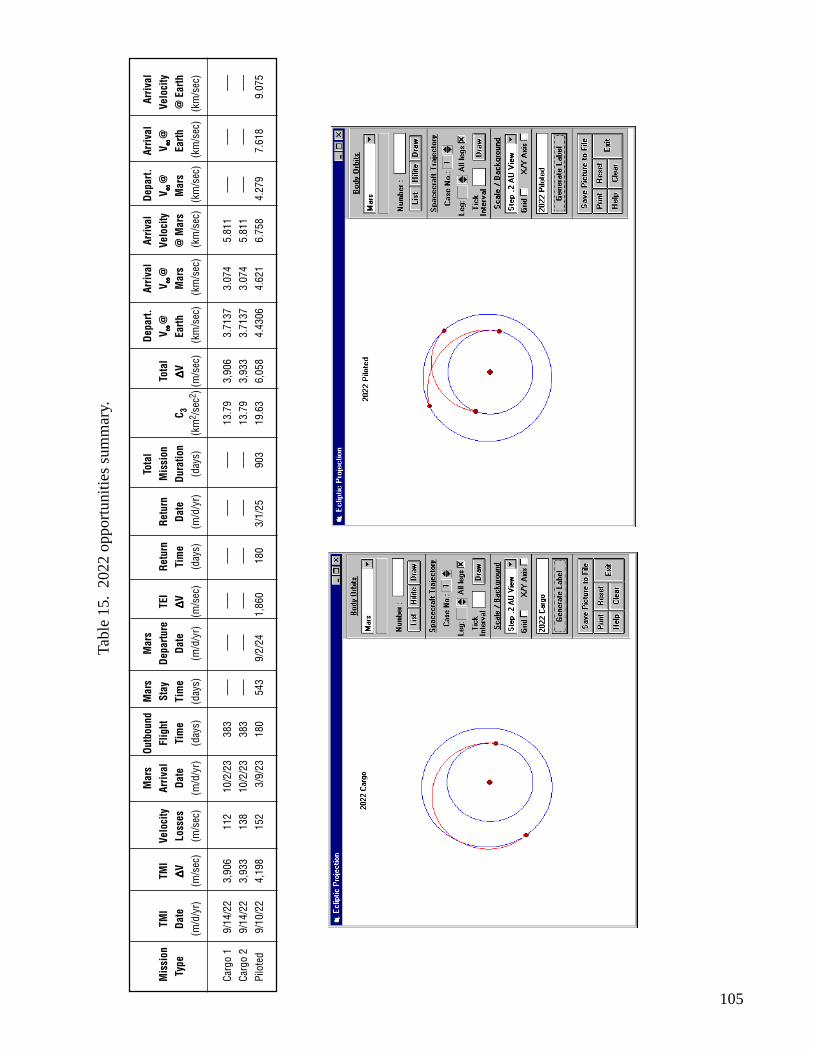
105
Tabl
e 15
. 20
22 o
ppor
tuni
ties
sum
mar
y.
Mar
sOu
tbou
ndM
ars
Mar
sTo
tal
Depa
rt.Ar
rival
Arriv
alDe
part.
Arriv
alAr
rival
Mis
sion
TMI
TMI
Velo
city
Arriv
alFl
ight
Stay
Depa
rture
TEI
Retu
rnRe
turn
Mis
sion
Tota
lV ∞ ∞ ∞ ∞ ∞
@V ∞ ∞ ∞ ∞ ∞
@Ve
loci
tyV ∞ ∞ ∞ ∞ ∞
@V ∞ ∞ ∞ ∞ ∞
@Ve
loci
ty T
ype
Date
∆∆∆∆ ∆VLo
sses
Date
Tim
eTi
me
Date
∆∆∆∆ ∆VTi
me
Date
Dura
tion
C 3∆∆∆∆ ∆V
Earth
Mar
s@
Mar
sM
ars
Earth
@ E
arth
(m/d
/yr)
(m/s
ec)
(m/s
ec)
(m/d
/yr)
(day
s)(d
ays)
(m/d
/yr)
(m/s
ec)
(day
s)(m
/d/y
r)(d
ays)
(km
2 /se
c2 )(m
/sec
) (k
m/s
ec)
(km
/sec
) (k
m/s
ec)
(km
/sec
) (k
m/s
ec)
(km
/sec
)
Carg
o 1
9/14
/22
3,90
611
210
/2/2
338
3 –
–– –
–– –
–– –
–– –
–– –
––13
.79
3,90
63.
7137
3.07
45.
811
–––
–––
–––
Carg
o 2
9/14
/22
3,93
313
810
/2/2
338
3 –
–– –
–– –
–– –
–– –
–– –
––13
.79
3,93
33.
7137
3.07
45.
811
–––
–––
–––
Pilo
ted
9/10
/22
4,19
815
23/
9/23
180
543
9/2/
241,
860
180
3/1/
2590
319
.63
6,05
84.
4306
4.62
16.
758
4.27
97.
618
9.07
5
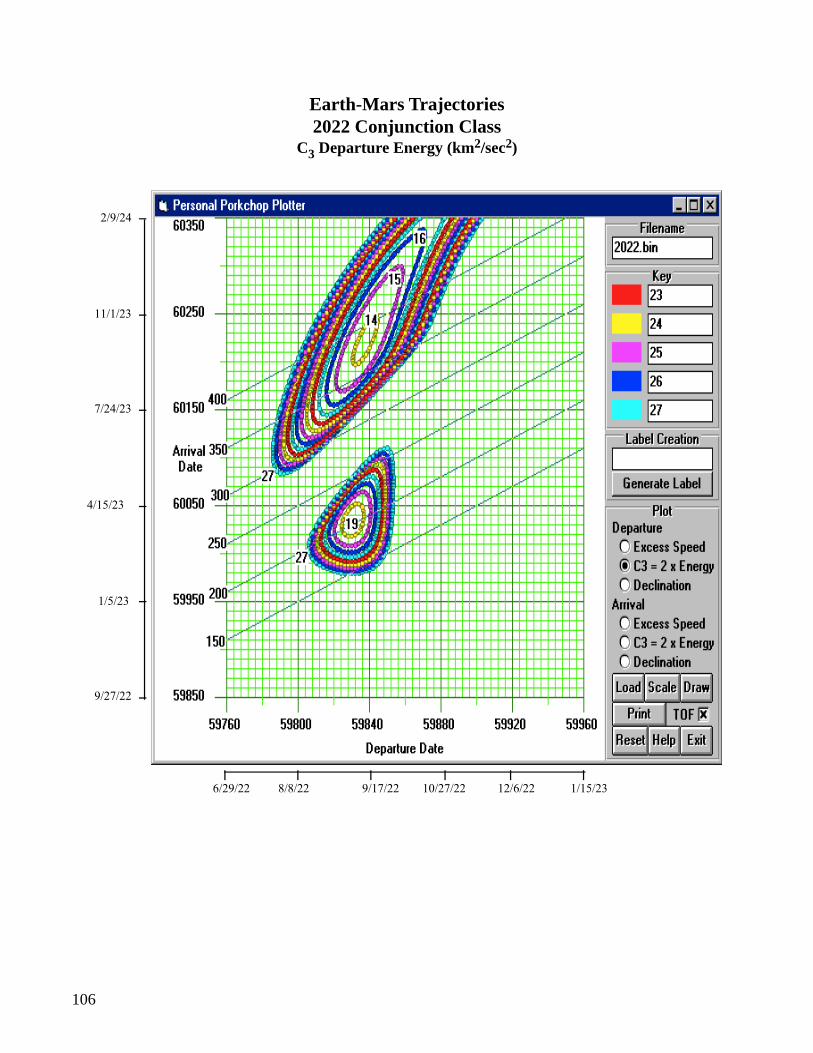
106
2/9/24
11/1/23
7/24/23
4/15/23
1/5/23
9/27/22
6/29/22 1/15/238/8/22 9/17/22 10/27/22 12/6/22
Earth-Mars Trajectories2022 Conjunction Class
C3 Departure Energy (km2/sec2)
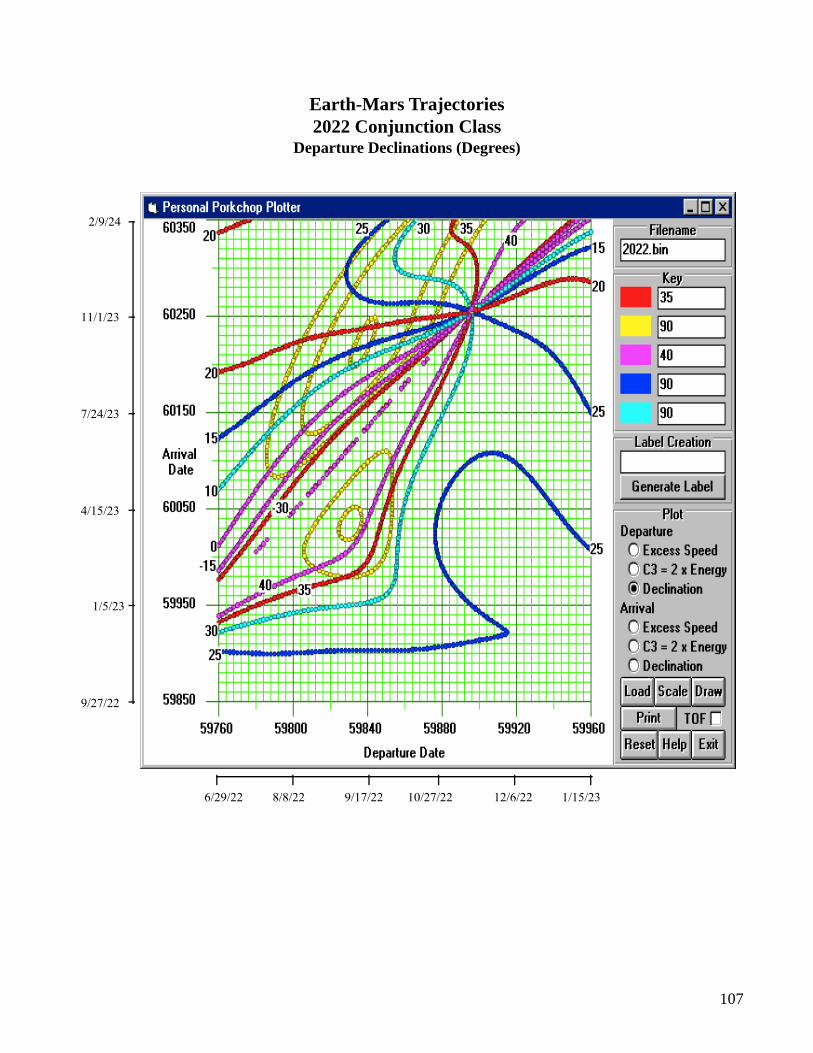
107
2/9/24
11/1/23
7/24/23
4/15/23
1/5/23
9/27/22
6/29/22 1/15/238/8/22 9/17/22 10/27/22 12/6/22
Earth-Mars Trajectories2022 Conjunction Class
Departure Declinations (Degrees)
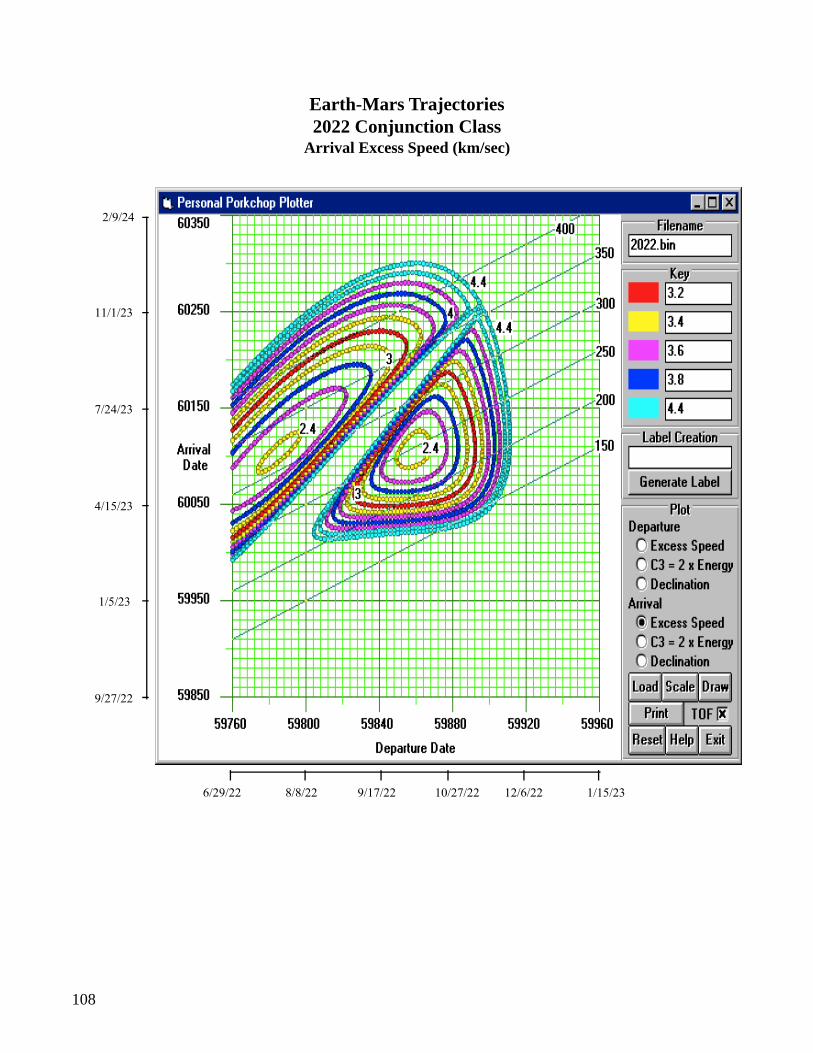
108
2/9/24
11/1/23
7/24/23
4/15/23
1/5/23
9/27/22
6/29/22 1/15/238/8/22 9/17/22 10/27/22 12/6/22
Earth-Mars Trajectories2022 Conjunction Class
Arrival Excess Speed (km/sec)
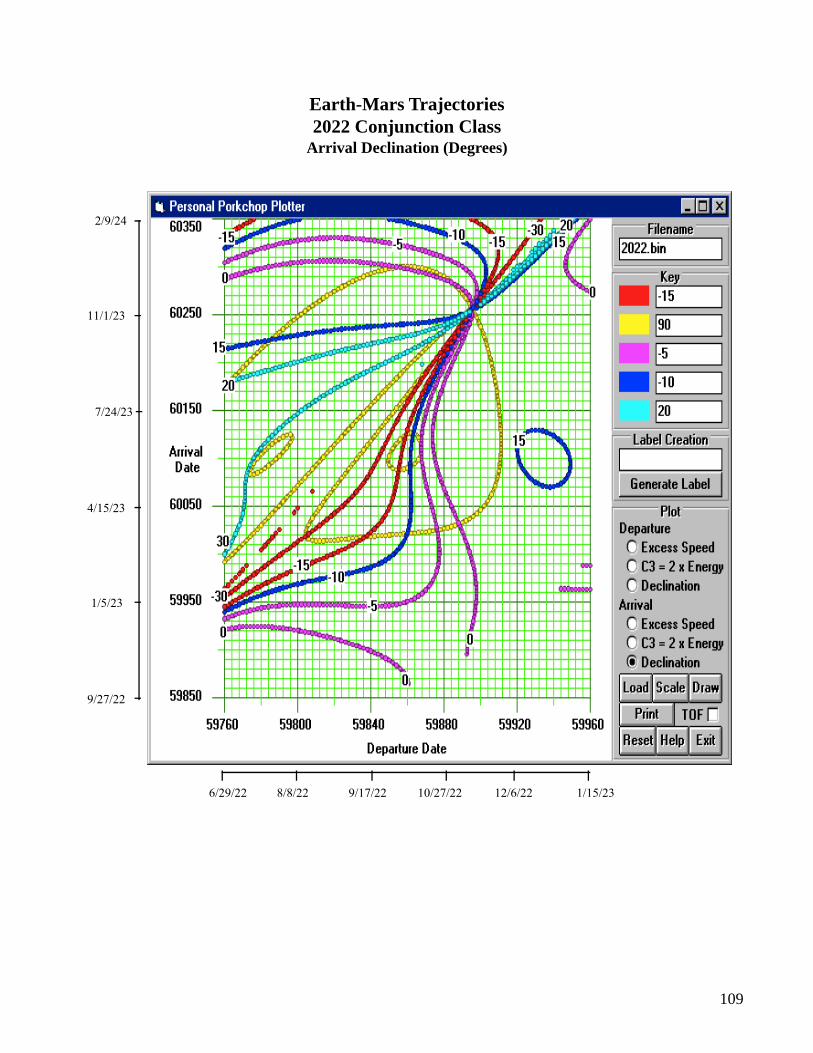
109
2/9/24
11/1/23
7/24/23
4/15/23
1/5/23
9/27/22
6/29/22 1/15/238/8/22 9/17/22 10/27/22 12/6/22
Earth-Mars Trajectories2022 Conjunction Class
Arrival Declination (Degrees)
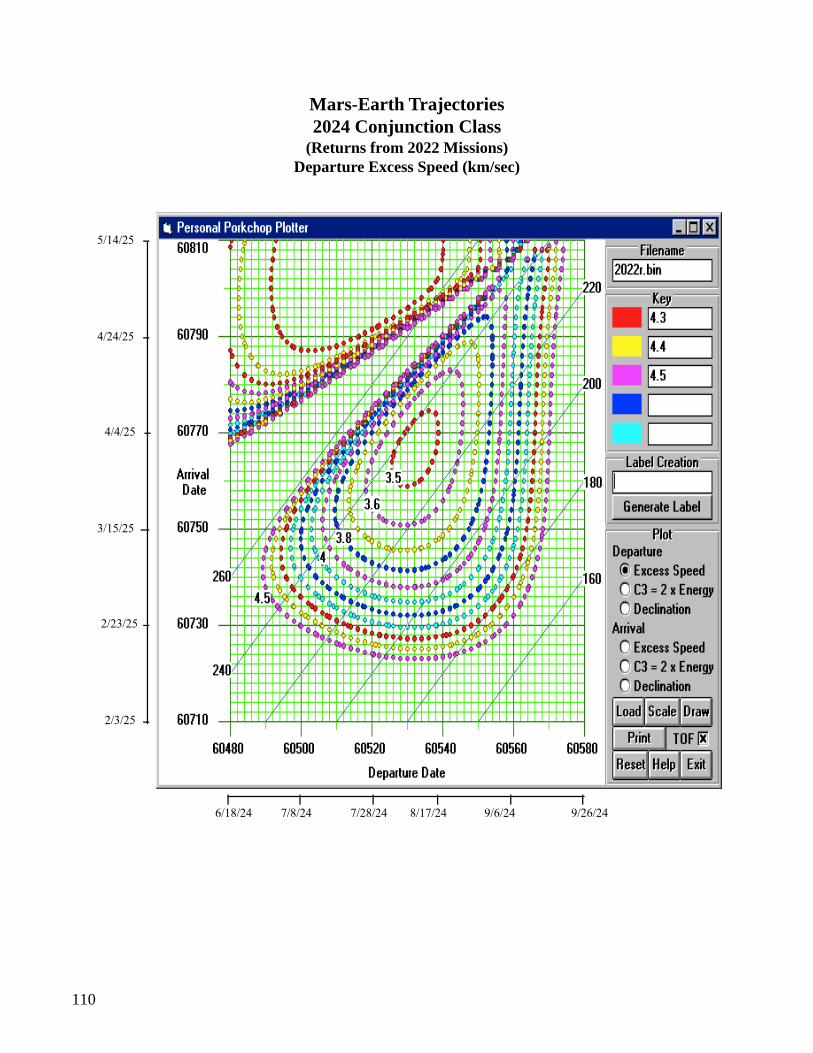
110
5/14/25
4/24/25
4/4/25
3/15/25
2/23/25
2/3/25
6/18/24 9/26/247/8/24 7/28/24 8/17/24 9/6/24
Mars-Earth Trajectories2024 Conjunction Class
(Returns from 2022 Missions)Departure Excess Speed (km/sec)
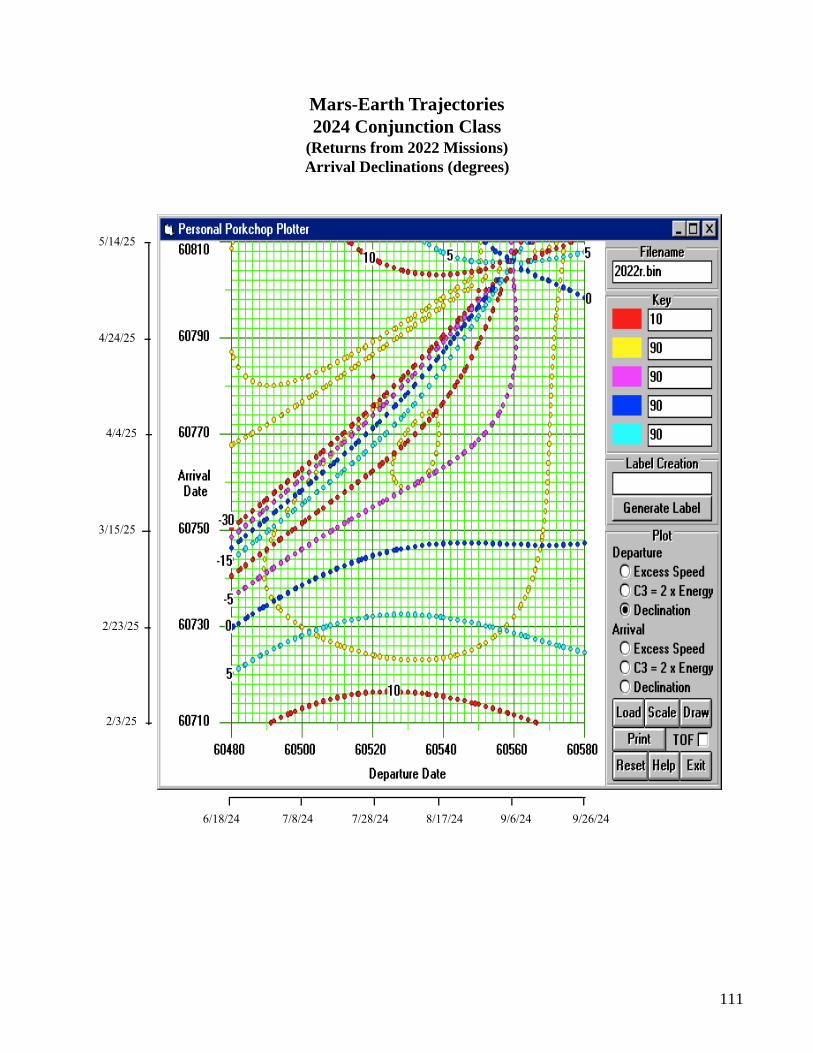
111
(
5/14/25
4/24/25
4/4/25
3/15/25
2/23/25
2/3/25
6/18/24 9/26/247/8/24 7/28/24 8/17/24 9/6/24
Mars-Earth Trajectories2024 Conjunction Class
(Returns from 2022 Missions)Arrival Declinations (degrees)
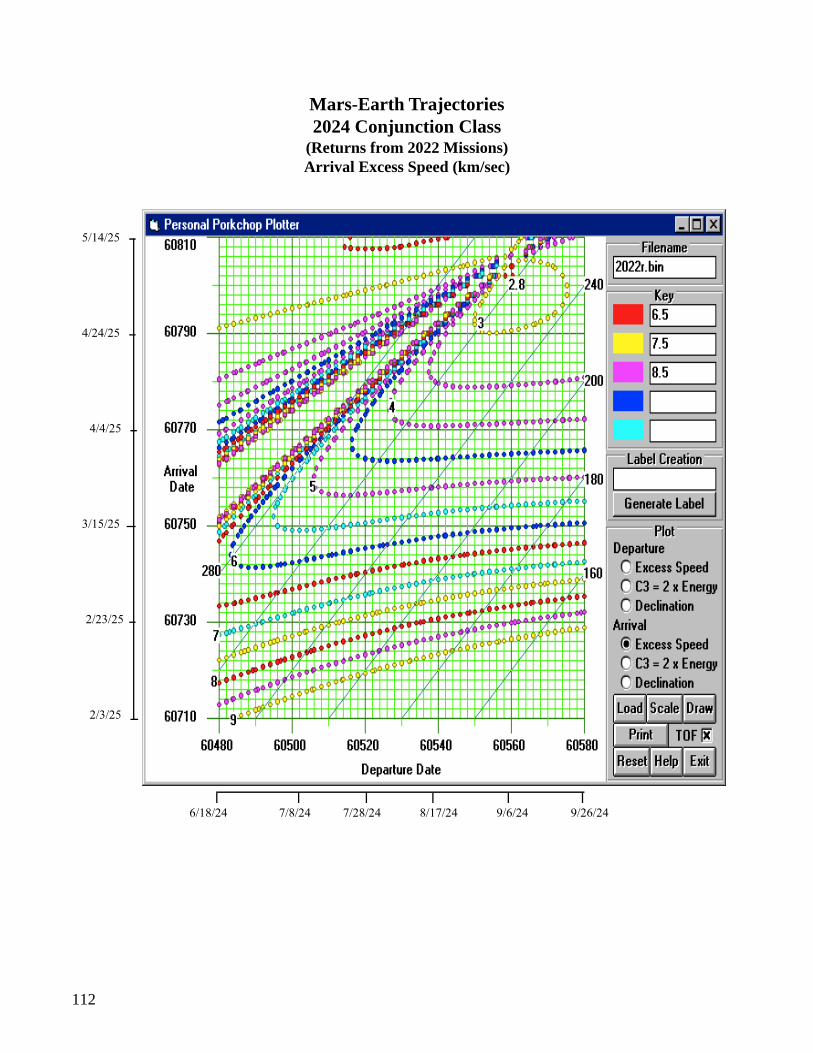
112
5/14/25
4/24/25
4/4/25
3/15/25
2/23/25
2/3/25
6/18/24 9/26/247/8/24 7/28/24 8/17/24 9/6/24
Mars-Earth Trajectories2024 Conjunction Class
(Returns from 2022 Missions)Arrival Excess Speed (km/sec)
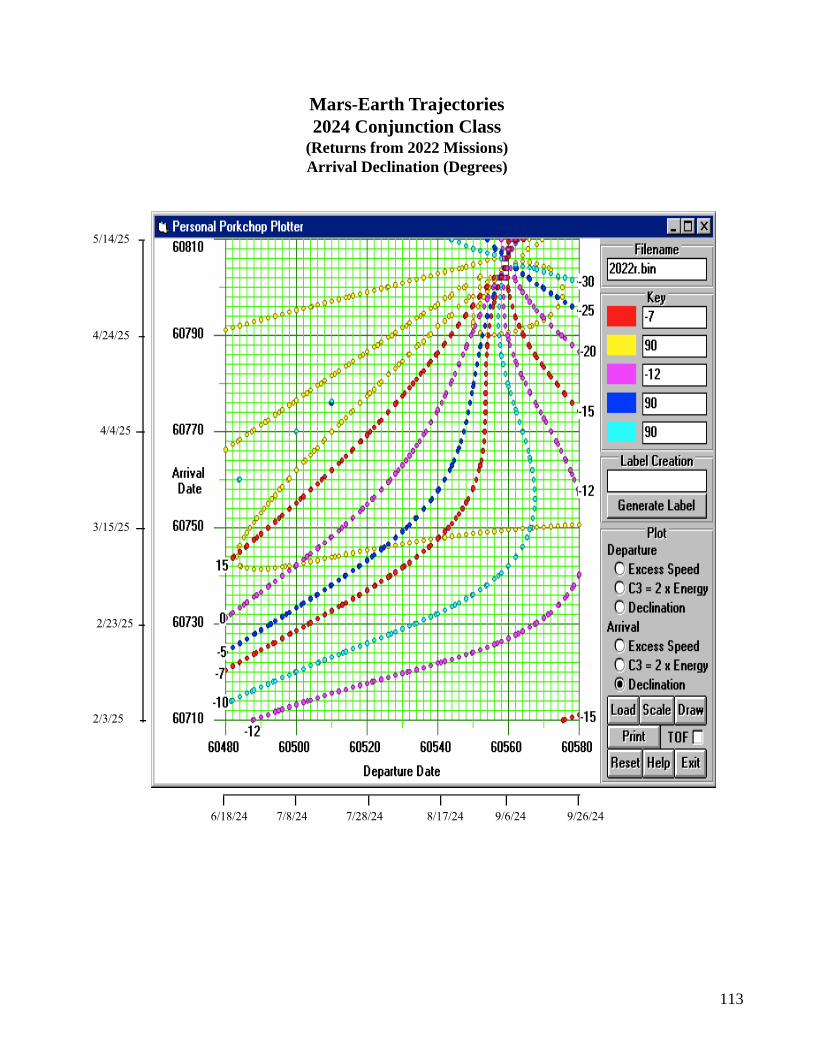
113
5/14/25
4/24/25
4/4/25
3/15/25
2/23/25
2/3/25
6/18/24 9/26/247/8/24 7/28/24 8/17/24 9/6/24
Mars-Earth Trajectories2024 Conjunction Class
(Returns from 2022 Missions)Arrival Declination (Degrees)
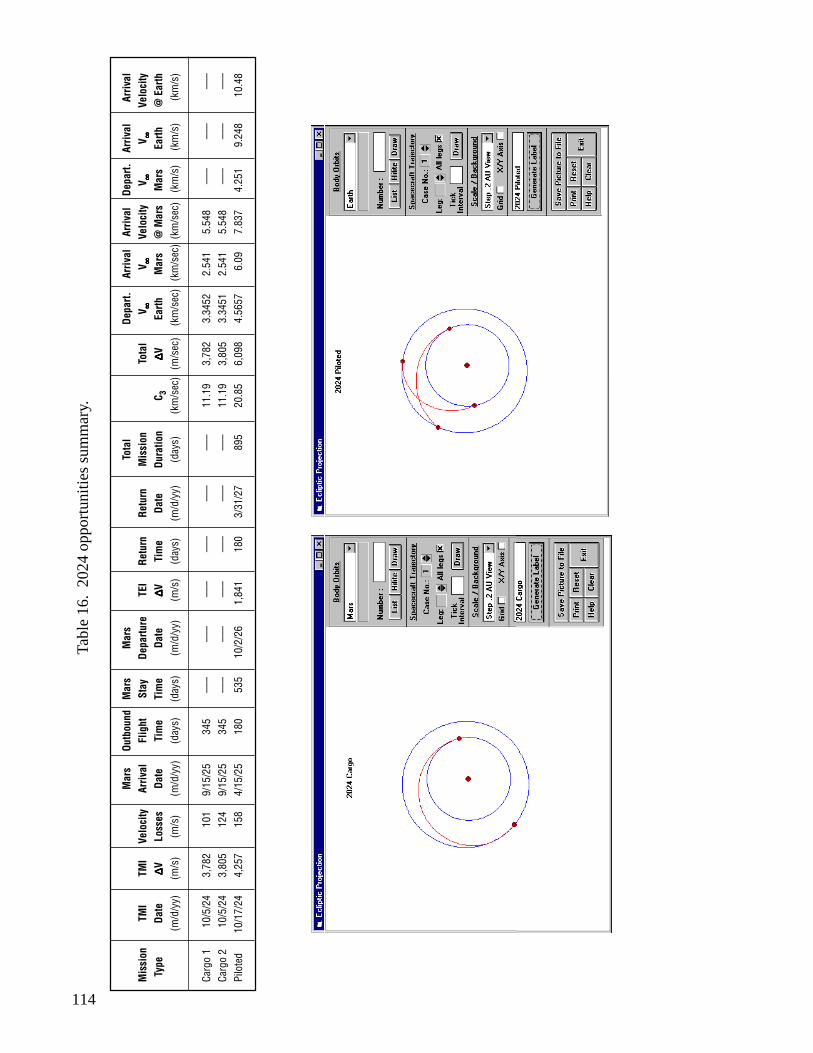
114
Tabl
e 16
. 20
24 o
ppor
tuni
ties
sum
mar
y.
Mar
sOu
tbou
ndM
ars
Mar
sTo
tal
Depa
rt.Ar
rival
Arriv
alDe
part.
Arriv
alAr
rival
Mis
sion
TMI
TMI
Velo
city
Arriv
alFl
ight
Stay
Depa
rture
TEI
Retu
rnRe
turn
Mis
sion
Tota
lV ∞∞∞∞ ∞
V ∞∞∞∞ ∞Ve
loci
tyV ∞∞∞∞ ∞
V ∞∞∞∞ ∞Ve
loci
ty T
ype
Date
∆∆∆∆ ∆VLo
sses
Date
Tim
eTi
me
Date
∆∆∆∆ ∆VTi
me
Date
Dura
tion
C 3∆∆∆∆ ∆V
Earth
Mar
s@
Mar
sM
ars
Earth
@ E
arth
(m/d
/yy)
(m/s
)(m
/s)
(m/d
/yy)
(day
s)(d
ays)
(m/d
/yy)
(m/s
)(d
ays)
(m/d
/yy)
(day
s)(k
m/s
ec)
(m/s
ec)
(km
/sec
) (k
m/s
ec)
(km
/sec
) (k
m/s
) (k
m/s
) (k
m/s
)
Carg
o 1
10/5
/24
3,78
210
19/
15/2
534
5 –
–– –
–– –
–– –
–– –
–– –
––11
.19
3,78
23.
3452
2.54
15.
548
–––
–––
–––
Carg
o 2
10/5
/24
3,80
512
49/
15/2
534
5 –
–– –
–– –
–– –
–– –
–– –
––11
.19
3,80
53.
3451
2.54
15.
548
–––
–––
–––
Pilo
ted
10/1
7/24
4,25
715
84/
15/2
518
053
510
/2/2
61,
841
180
3/31
/27
895
20.8
56,
098
4.56
576.
097.
837
4.25
19.
248
10.4
8
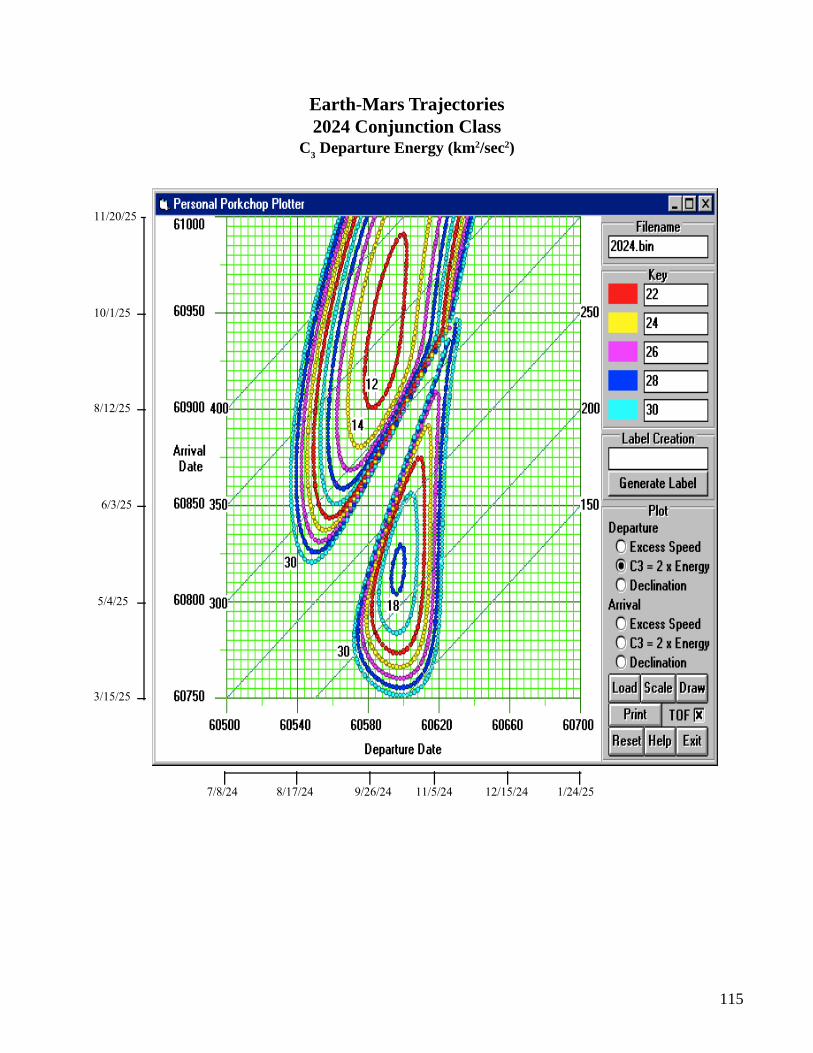
115
11/20/25
10/1/25
8/12/25
6/3/25
5/4/25
3/15/25
7/8/24 1/24/258/17/24 9/26/24 11/5/24 12/15/24
Earth-Mars Trajectories2024 Conjunction Class
C3 Departure Energy (km2/sec2)
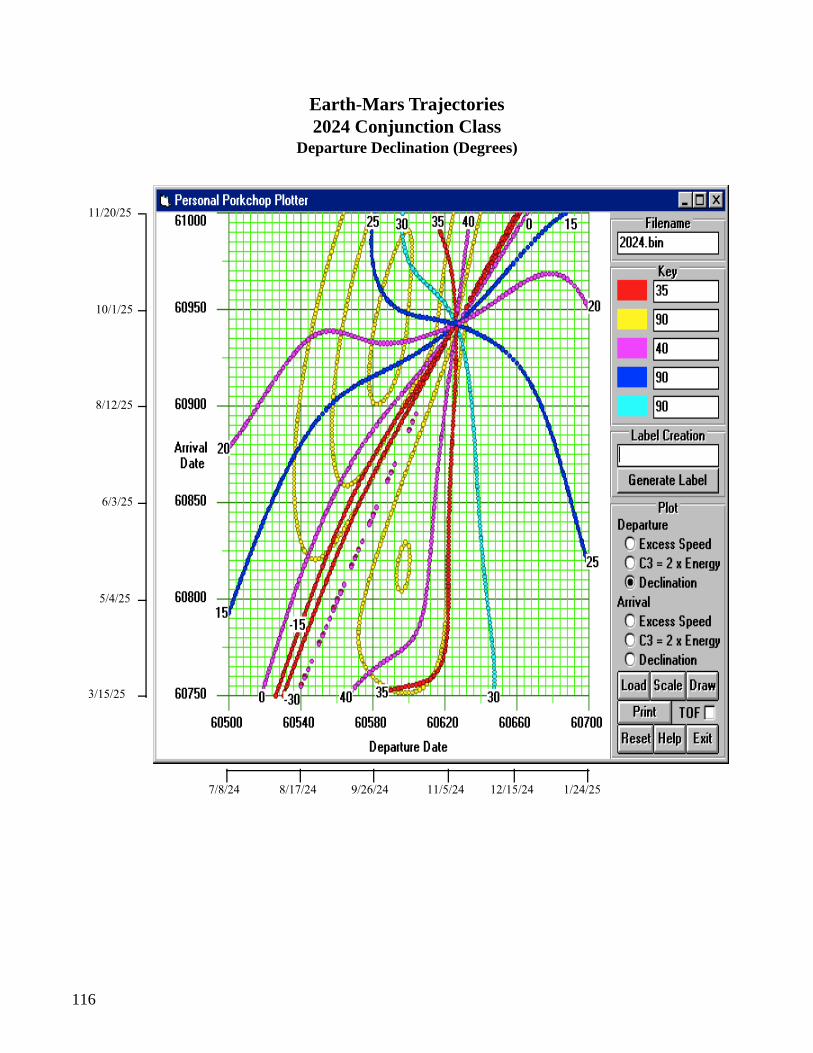
116
11/20/25
10/1/25
8/12/25
6/3/25
5/4/25
3/15/25
7/8/24 1/24/258/17/24 9/26/24 11/5/24 12/15/24
Earth-Mars Trajectories2024 Conjunction Class
Departure Declination (Degrees)
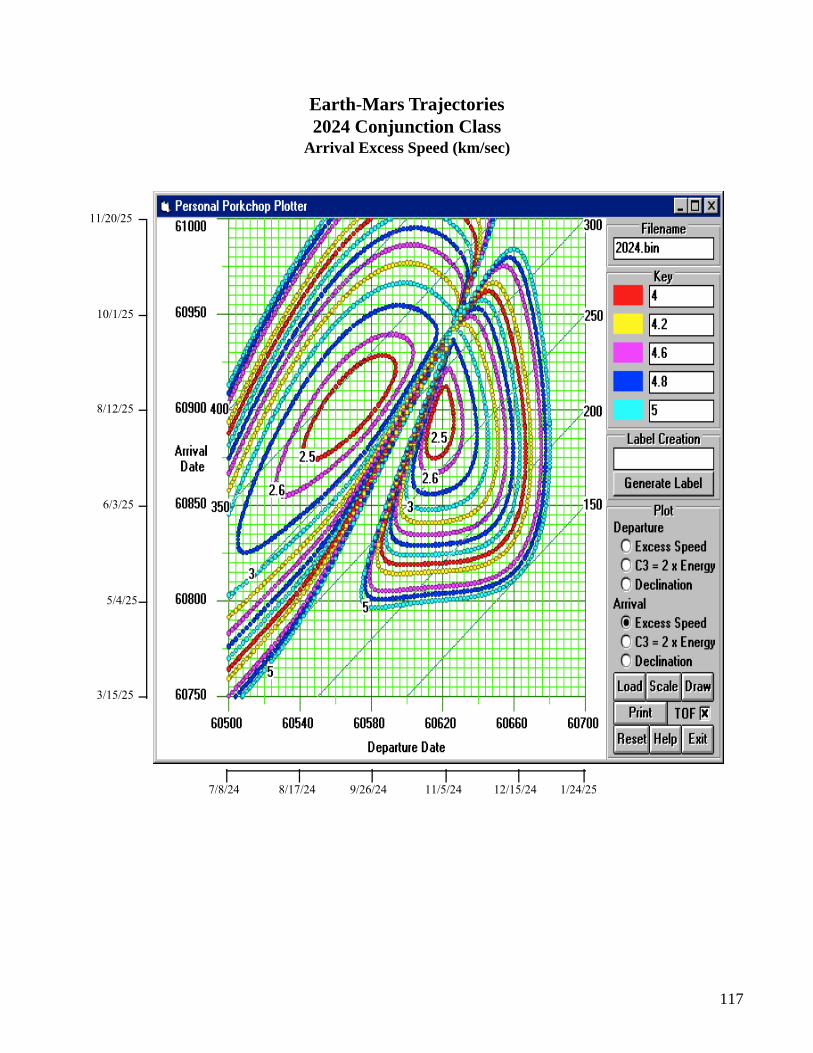
117
11/20/25
10/1/25
8/12/25
6/3/25
5/4/25
3/15/25
7/8/24 1/24/258/17/24 9/26/24 11/5/24 12/15/24
Earth-Mars Trajectories2024 Conjunction Class
Arrival Excess Speed (km/sec)
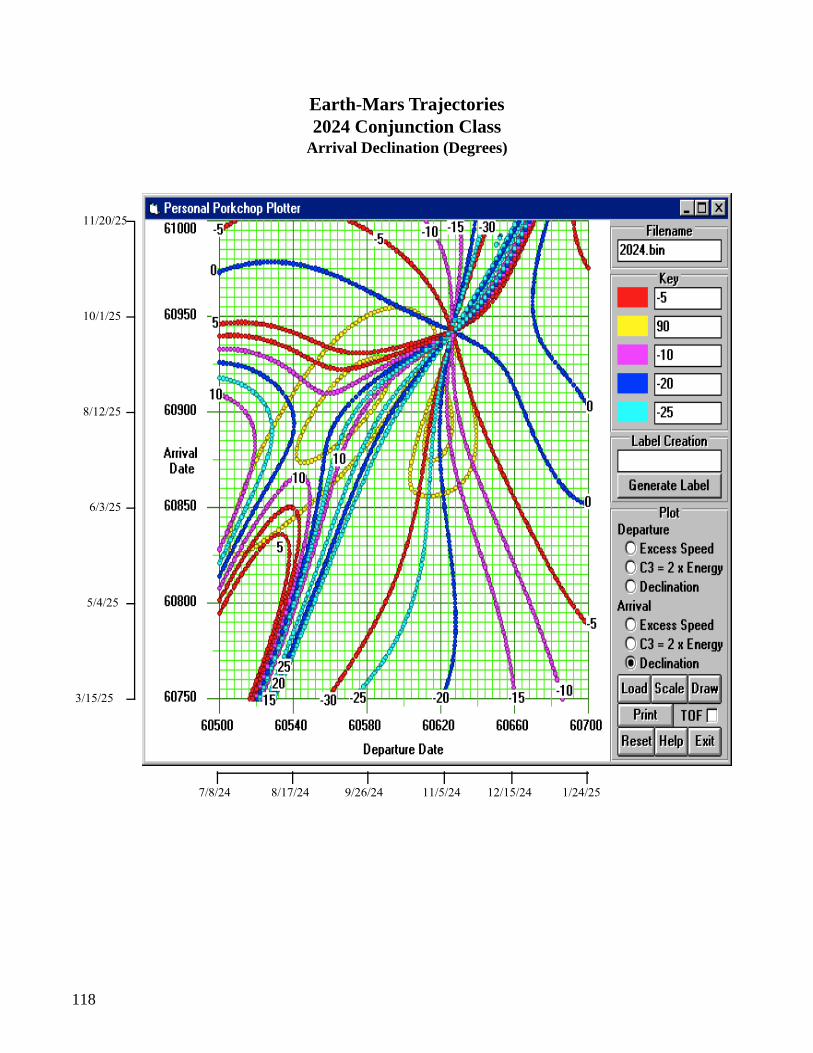
118
11/20/25
10/1/25
8/12/25
6/3/25
5/4/25
3/15/25
7/8/24 1/24/258/17/24 9/26/24 11/5/24 12/15/24
Earth-Mars Trajectories2024 Conjunction Class
Arrival Declination (Degrees)
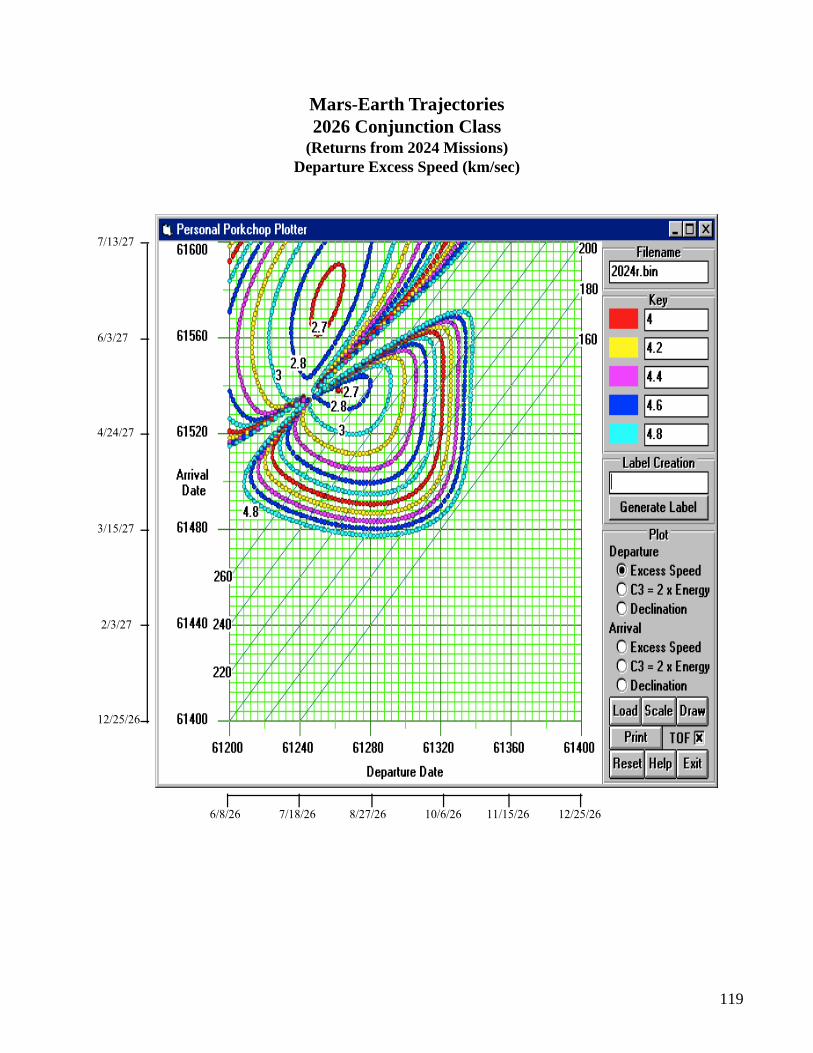
119
7/13/27
6/3/27
4/24/27
3/15/27
2/3/27
12/25/26
6/8/26 12/25/267/18/26 8/27/26 10/6/26 11/15/26
Mars-Earth Trajectories2026 Conjunction Class
(Returns from 2024 Missions)Departure Excess Speed (km/sec)
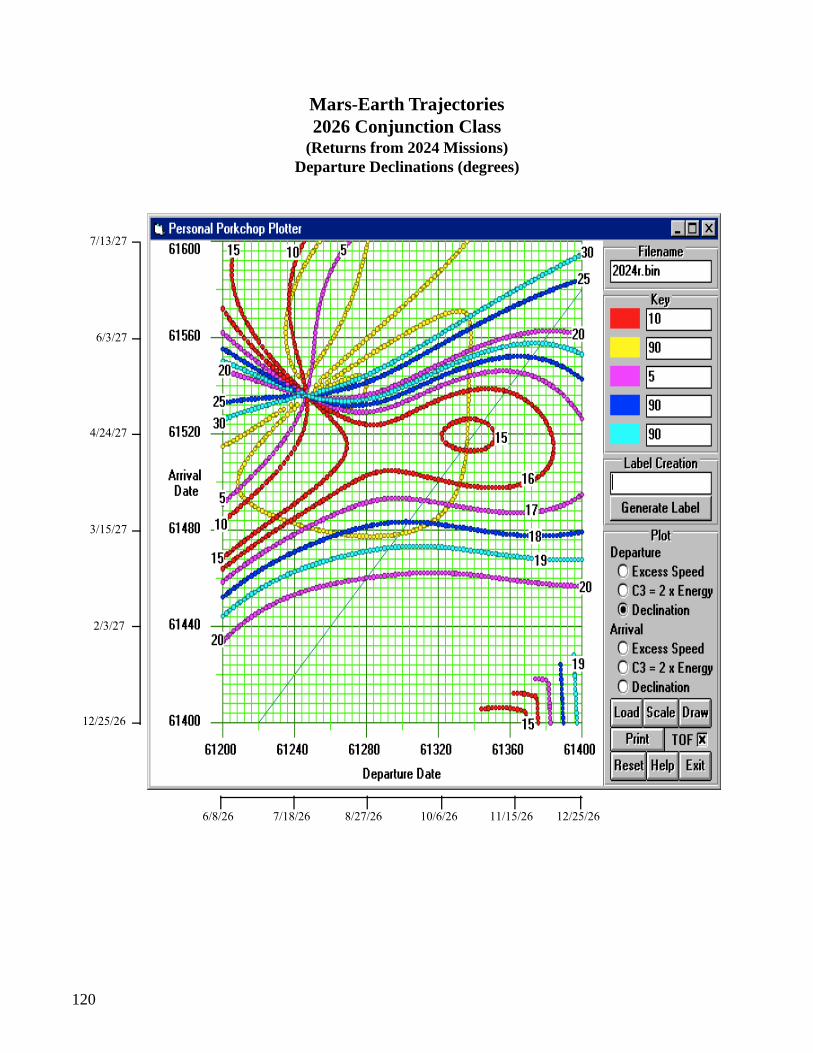
120
7/13/27
6/3/27
4/24/27
3/15/27
2/3/27
12/25/26
6/8/26 12/25/267/18/26 8/27/26 10/6/26 11/15/26
Mars-Earth Trajectories2026 Conjunction Class
(Returns from 2024 Missions)Departure Declinations (degrees)
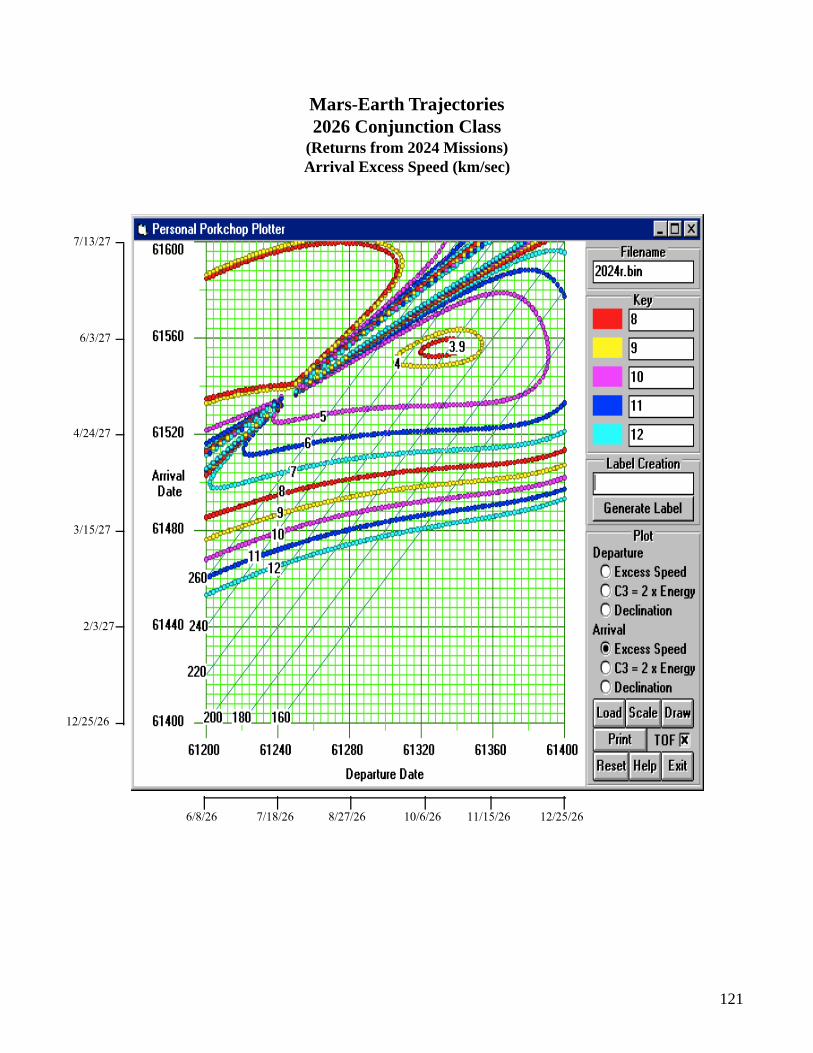
121
7/13/27
6/3/27
4/24/27
3/15/27
2/3/27
12/25/26
6/8/26 12/25/267/18/26 8/27/26 10/6/26 11/15/26
Mars-Earth Trajectories2026 Conjunction Class
(Returns from 2024 Missions)Arrival Excess Speed (km/sec)
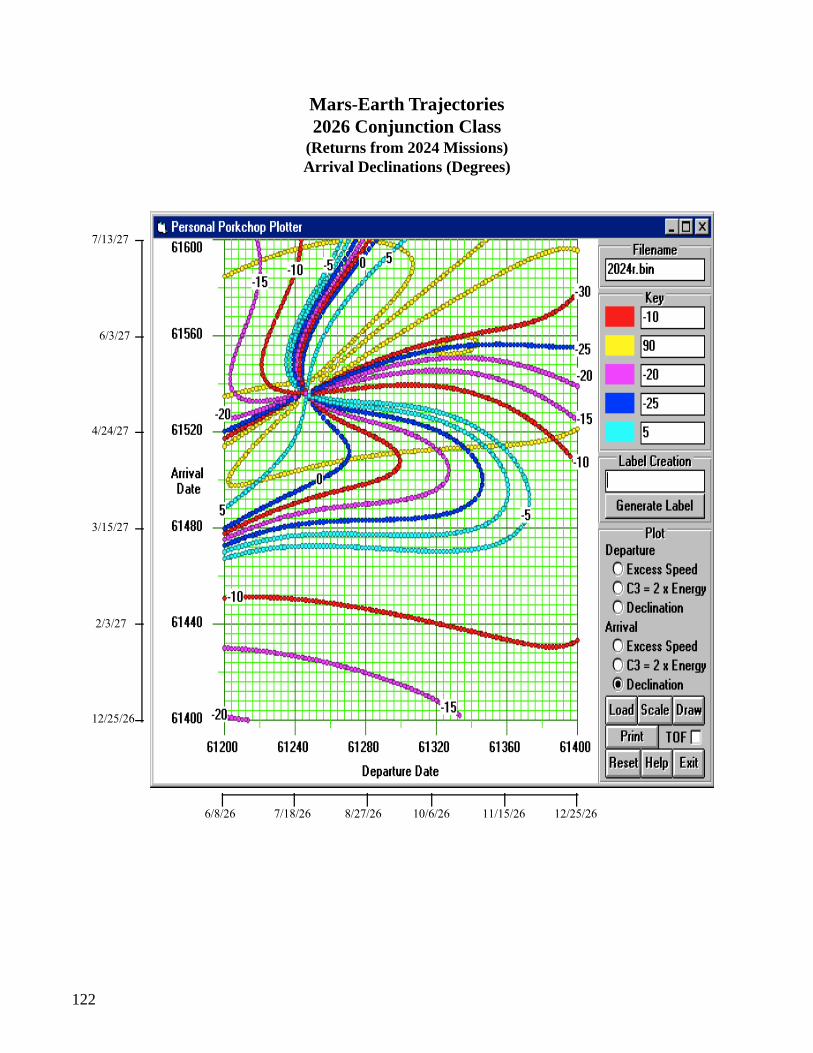
122
7/13/27
6/3/27
4/24/27
3/15/27
2/3/27
12/25/26
6/8/26 12/25/267/18/26 8/27/26 10/6/26 11/15/26
Mars-Earth Trajectories2026 Conjunction Class
(Returns from 2024 Missions)Arrival Declinations (Degrees)
123
APPENDIX B—FREE-RETURN TRAJECTORIES
For each opportunity, there exists a trajectory that will allow a “free return” in case of abort onthe outbound trip.10 These may become important if it is deemed necessary to keep open the opportu-nity to abort in case of a problem enroute. Instead of normal capture at Mars, a swingby would beperformed and the payload would immediately begin its return to Earth. Assuming there would be nofuel available (i.e., some problem in route with the descent vehicle), the only way for the crew to getback to Earth would be to perform a swingby of Mars. There supposedly are 2-year free-return trajecto-ries available; however, all of the ones derived from MAnE trajectories resulted in unacceptable Marsaerobraking entry velocities. The only trajectories that resulted in low enough entry velocities muchlonger return trip times (2 1/2 yrs) and higher departure velocities. All of the free return trajectories aresummarized in table 11. Note that the ∆Vs do not include velocity losses.
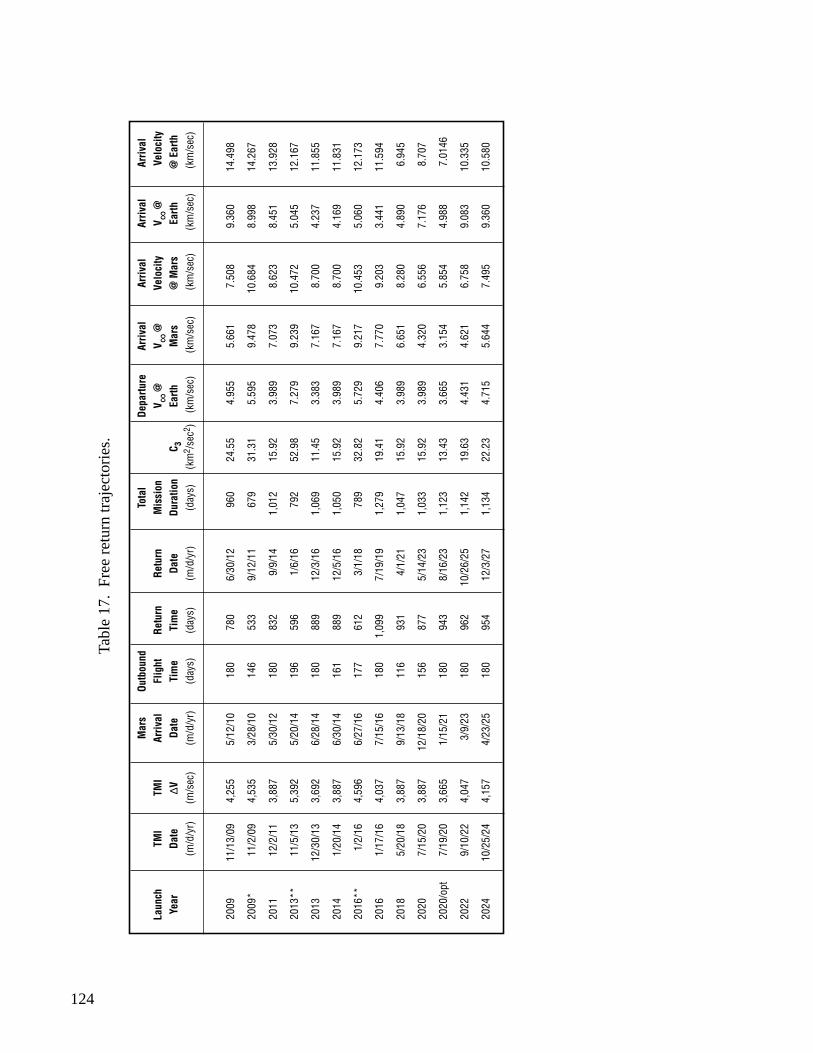
124
Tabl
e 17
. F
ree
retu
rn tr
ajec
torie
s.
Mar
sOu
tbou
ndTo
tal
Depa
rture
Arriv
alAr
rival
Arriv
al A
rriv
alLa
unch
TMI
TMI
Arriv
alFl
ight
Retu
rnRe
turn
Mis
sion
V ∞ @
V ∞ @
Velo
city
V ∞ @
V
eloc
ityYe
arDa
te∆V
Date
Tim
eTi
me
Date
Dura
tion
C 3Ea
rthM
ars
@ M
ars
Earth
@
Ear
th(m
/d/y
r)(m
/sec
)(m
/d/y
r)(d
ays)
(day
s)(m
/d/y
r)(d
ays)
(km
2 /se
c2 ) (k
m/s
ec)
(km
/sec
) (k
m/s
ec)
(km
/sec
) (k
m/s
ec)
2009
11/1
3/09
4,25
55/
12/1
018
078
06/
30/1
296
024
.55
4.95
55.
661
7.50
89.
360
14.4
98
2009
*11
/2/0
94,
535
3/28
/10
146
533
9/12
/11
679
31.3
15.
595
9.47
810
.684
8.99
814
.267
2011
12/2
/11
3,88
75/
30/1
218
083
29/
9/14
1,01
215
.92
3.98
97.
073
8.62
38.
451
13.9
28
2013
**11
/5/1
35,
392
5/20
/14
196
596
1/6/
1679
252
.98
7.27
99.
239
10.4
725.
045
12.1
67
2013
12/3
0/13
3,69
26/
28/1
418
088
912
/3/1
61,
069
11.4
53.
383
7.16
78.
700
4.23
711
.855
2014
1/20
/14
3,88
76/
30/1
416
188
912
/5/1
61,
050
15.9
23.
989
7.16
78.
700
4.16
911
.831
2016
**1/
2/16
4,59
66/
27/1
617
761
23/
1/18
789
32.8
25.
729
9.21
710
.453
5.06
012
.173
2016
1/17
/16
4,03
77/
15/1
618
01,
099
7/19
/19
1,27
919
.41
4.40
67.
770
9.20
33.
441
11.5
94
2018
5/20
/18
3,88
79/
13/1
811
693
14/
1/21
1,04
715
.92
3.98
96.
651
8.28
04.
890
6.9
45
2020
7/15
/20
3,88
712
/18/
2015
687
75/
14/2
31,
033
15.9
23.
989
4.32
06.
556
7.17
6 8
.707
2020
/opt
7/19
/20
3,66
51/
15/2
118
094
38/
16/2
31,
123
13.4
33.
665
3.15
45.
854
4.98
8
7.0
146
2022
9/10
/22
4,04
73/
9/23
180
962
10/2
6/25
1,14
219
.63
4.43
14.
621
6.75
89.
083
10.3
35
2024
10/2
5/24
4,15
74/
23/2
518
095
412
/3/2
71,
134
22.2
34.
715
5.64
47.
495
9.36
010
.580
125
APPENDIX C—ASSUMPTIONS
These following assumptions came from information provided by the author Larry Kos andreference 11.
General
Earth Departure
These assumptions are used for both the cargo and piloted missions. The only difference will bethe desired payload left at Mars. It is assumed that the TMI stages are initially assembled and launchedfrom a 400-km circular parking orbit at an inclination of approximately 28.5°. There will be two perigeeburns upon departure. The second burn will transfer the rocket into a hyperbolic escape orbit and on thetransfer to Mars. The TMI stage will be a nuclear thermal propulsion system (LH2) with a specificimpulse of 931 sec. (Nuclear propulsion system Isp is approximately 960 sec minus 3 percent to accountfor reactor cool-down losses) and a T/W ratio of approximately 0.14 (will vary depending on the totalstack masses for the particular mission). It will consist of three 15,000 lbf thrust engines. Dry weight ofthe stage/engine assembly is approximately 25.7 mt. The stage will be jettisoned immediately aftersecond perigee burn. A mid-course targeting correction ∆V of 50 m/sec is assumed but not included inthese calculations.
Mars Arrival
The resulting parking orbit at Mars will be a 1-solar-day orbit of 250-km perigee × 33,793-kmapogee (eccentricity, e = 0.8214) and inclination of approximately 40°. The landing site latitude isassumed to be approximately 30° North. The maximum allowable entry speed at Mars for aerobraking is8.7 km/sec (inertial). This corresponds to a limit at V∞ of 7.167 km/sec at Mars using equation (1) at theconventional entry altitude of 125 km.
Mars Departure
Departure is from 250-km perigee orbit (e = 0.8214). One burn is performed and the TEI stage isjettisoned after maneuver except for the RCS which is used for the transfer back to Earth. The TEI stageIsp is 379 sec with a T/W ratio of 0.2387 and a dry weight of 3.57 mt (not including RCS).
Earth Arrival
Near-ballistic entry limit (inertial) at Earth is 14.5 km/sec. This corresponds to a limit on V∞of 9.36 km/sec calculated using equation (2) at an assumed entry altitude of 125 km.
126
Mission Specific Assumptions and Mass Properties
Cargo 1 Mission
T/W ratio: 0.14915Thrust: 45,000 lbfWeight: 136.9 mt
Payload and parameters:Return habitat: 21.62 mtRCS: 1.1 mtTEI burnout mass: 3.57 mtTEI propellant: 31.3 mt (includes boil-off losses)
Total cargo 1: 61.67 mt Engine mass: 22.42 mt Aerobrake: 10.6 mt
Cargo 2 Mission
T/W ratio: 0.1354Thrust: 45,000 lbfWeight: 150.8 mt
Payload and parameters:Return capsule: 5.5 mtDescent stage: 4.19 mtStage propellant: 17.1 mt
Total cargo 2: 61.89 mt Engine mass: 22.42 mt Aerobrake: 15.99 mt
Piloted Mission Outbound
Outbound T/W ratio: 0.1434Thrust: 45,000 lbfWeight: 142.4 mt
Payload and parameters:Surface habitat: 18.47 mt (not including EVA’s)Surface payload: 9.8 mtDescent stage: 4.19 mtPropellant: 17.3 mt
Total payload left at Mars: 49.76 mt Engine mass: 25.7 mt (note this includes a 3.2 mt shield) Aerobrake: 14.04 mt Inert mass: 1.3 mt (crew 0.5 mt + EVA’s 0.8 mt)
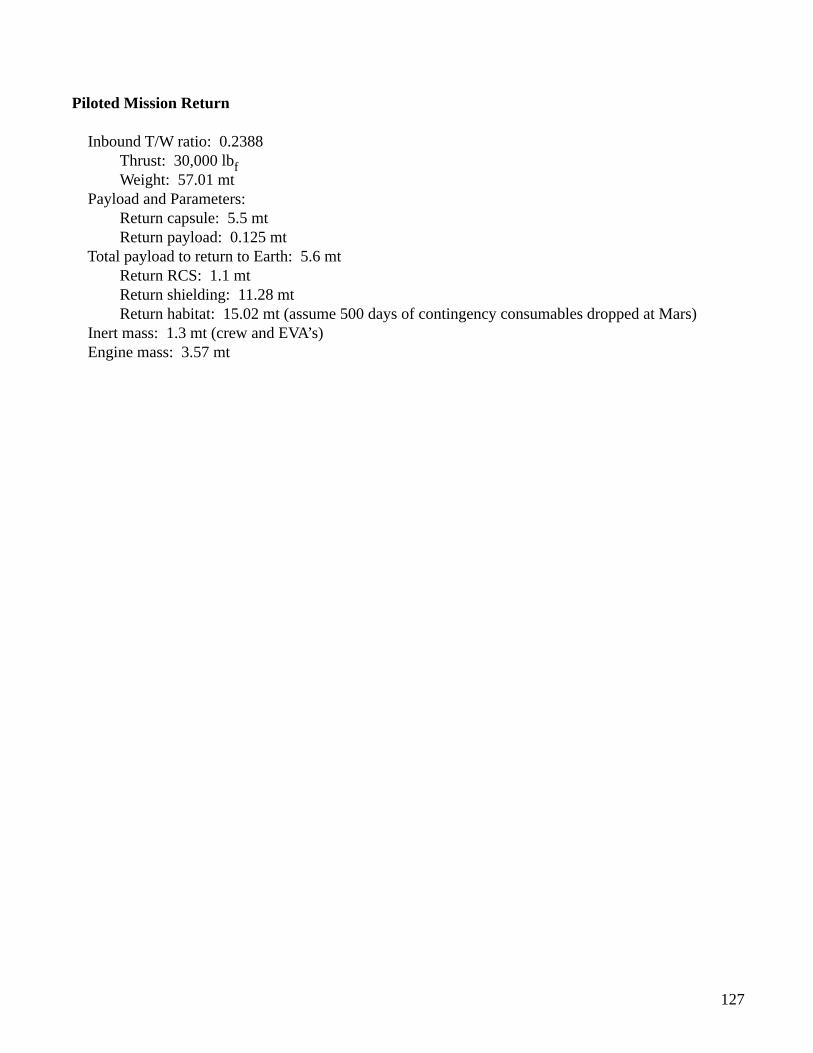
127
Piloted Mission Return
Inbound T/W ratio: 0.2388Thrust: 30,000 lbfWeight: 57.01 mt
Payload and Parameters:Return capsule: 5.5 mtReturn payload: 0.125 mt
Total payload to return to Earth: 5.6 mtReturn RCS: 1.1 mtReturn shielding: 11.28 mtReturn habitat: 15.02 mt (assume 500 days of contingency consumables dropped at Mars)
Inert mass: 1.3 mt (crew and EVA’s) Engine mass: 3.57 mt
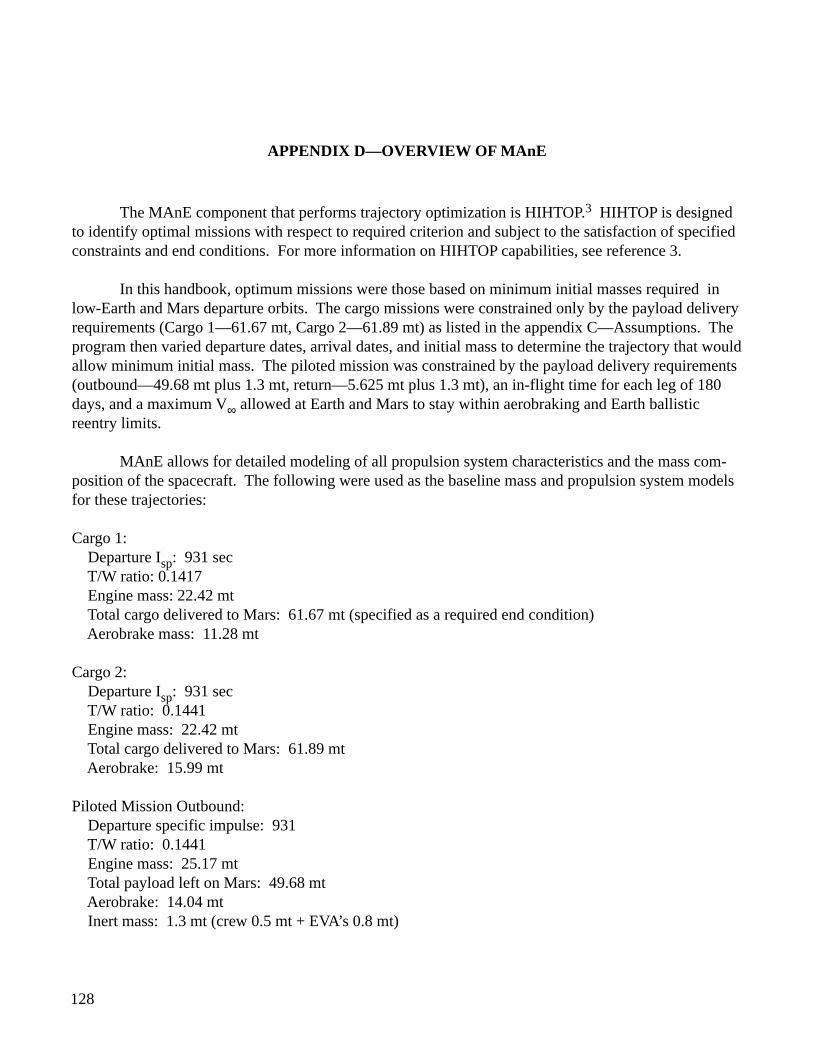
128
APPENDIX D—OVERVIEW OF MAnE
The MAnE component that performs trajectory optimization is HIHTOP.3 HIHTOP is designedto identify optimal missions with respect to required criterion and subject to the satisfaction of specifiedconstraints and end conditions. For more information on HIHTOP capabilities, see reference 3.
In this handbook, optimum missions were those based on minimum initial masses required inlow-Earth and Mars departure orbits. The cargo missions were constrained only by the payload deliveryrequirements (Cargo 1—61.67 mt, Cargo 2—61.89 mt) as listed in the appendix C—Assumptions. Theprogram then varied departure dates, arrival dates, and initial mass to determine the trajectory that wouldallow minimum initial mass. The piloted mission was constrained by the payload delivery requirements(outbound—49.68 mt plus 1.3 mt, return—5.625 mt plus 1.3 mt), an in-flight time for each leg of 180days, and a maximum V∞ allowed at Earth and Mars to stay within aerobraking and Earth ballisticreentry limits.
MAnE allows for detailed modeling of all propulsion system characteristics and the mass com-position of the spacecraft. The following were used as the baseline mass and propulsion system modelsfor these trajectories:
Cargo 1: Departure Isp: 931 sec T/W ratio: 0.1417 Engine mass: 22.42 mt Total cargo delivered to Mars: 61.67 mt (specified as a required end condition) Aerobrake mass: 11.28 mt
Cargo 2: Departure Isp: 931 sec T/W ratio: 0.1441 Engine mass: 22.42 mt Total cargo delivered to Mars: 61.89 mt Aerobrake: 15.99 mt
Piloted Mission Outbound: Departure specific impulse: 931 T/W ratio: 0.1441 Engine mass: 25.17 mt Total payload left on Mars: 49.68 mt Aerobrake: 14.04 mt Inert mass: 1.3 mt (crew 0.5 mt + EVA’s 0.8 mt)
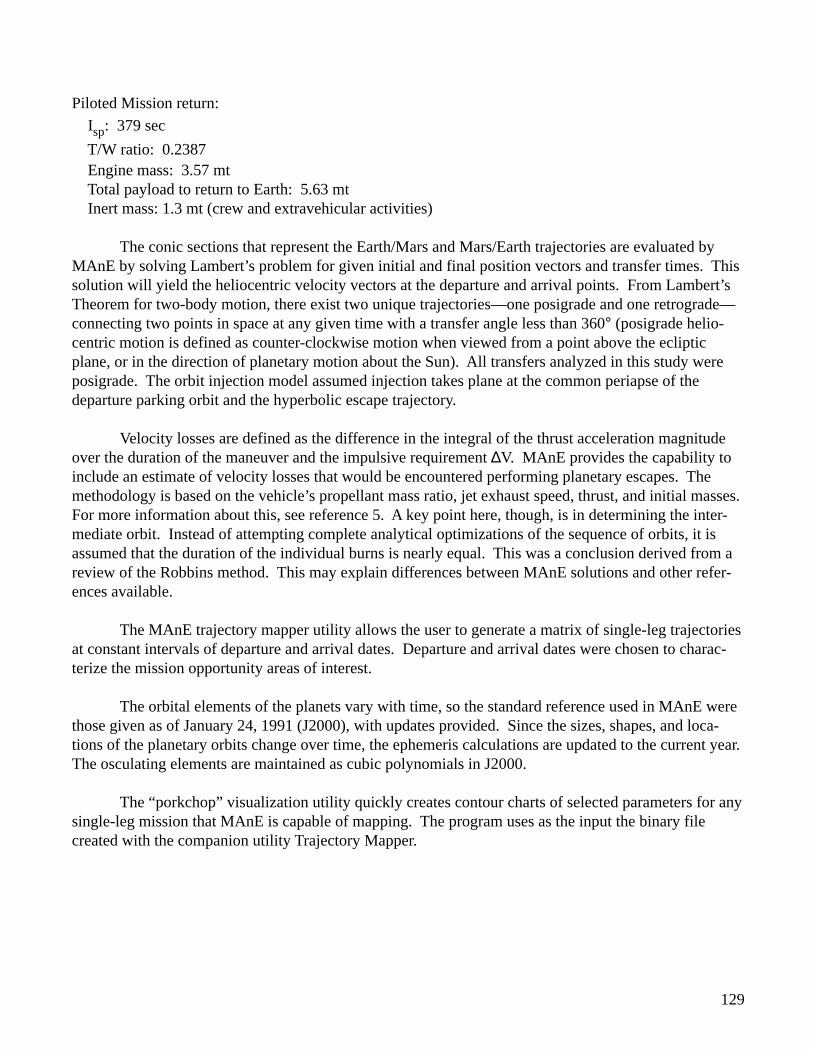
129
Piloted Mission return:
Isp: 379 sec
T/W ratio: 0.2387 Engine mass: 3.57 mt Total payload to return to Earth: 5.63 mt Inert mass: 1.3 mt (crew and extravehicular activities)
The conic sections that represent the Earth/Mars and Mars/Earth trajectories are evaluated byMAnE by solving Lambert’s problem for given initial and final position vectors and transfer times. Thissolution will yield the heliocentric velocity vectors at the departure and arrival points. From Lambert’sTheorem for two-body motion, there exist two unique trajectories—one posigrade and one retrograde—connecting two points in space at any given time with a transfer angle less than 360° (posigrade helio-centric motion is defined as counter-clockwise motion when viewed from a point above the eclipticplane, or in the direction of planetary motion about the Sun). All transfers analyzed in this study wereposigrade. The orbit injection model assumed injection takes plane at the common periapse of thedeparture parking orbit and the hyperbolic escape trajectory.
Velocity losses are defined as the difference in the integral of the thrust acceleration magnitudeover the duration of the maneuver and the impulsive requirement ∆V. MAnE provides the capability toinclude an estimate of velocity losses that would be encountered performing planetary escapes. Themethodology is based on the vehicle’s propellant mass ratio, jet exhaust speed, thrust, and initial masses.For more information about this, see reference 5. A key point here, though, is in determining the inter-mediate orbit. Instead of attempting complete analytical optimizations of the sequence of orbits, it isassumed that the duration of the individual burns is nearly equal. This was a conclusion derived from areview of the Robbins method. This may explain differences between MAnE solutions and other refer-ences available.
The MAnE trajectory mapper utility allows the user to generate a matrix of single-leg trajectoriesat constant intervals of departure and arrival dates. Departure and arrival dates were chosen to charac-terize the mission opportunity areas of interest.
The orbital elements of the planets vary with time, so the standard reference used in MAnE werethose given as of January 24, 1991 (J2000), with updates provided. Since the sizes, shapes, and loca-tions of the planetary orbits change over time, the ephemeris calculations are updated to the current year.The osculating elements are maintained as cubic polynomials in J2000.
The “porkchop” visualization utility quickly creates contour charts of selected parameters for anysingle-leg mission that MAnE is capable of mapping. The program uses as the input the binary filecreated with the companion utility Trajectory Mapper.
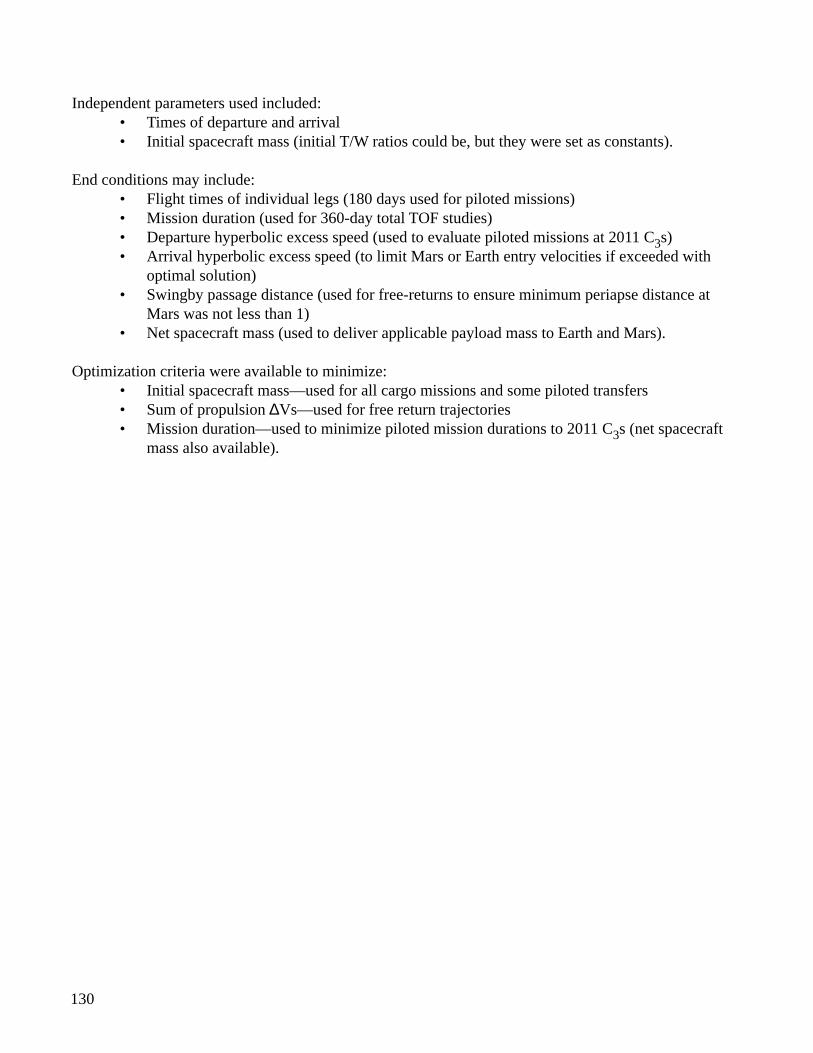
130
Independent parameters used included:• Times of departure and arrival• Initial spacecraft mass (initial T/W ratios could be, but they were set as constants).
End conditions may include:• Flight times of individual legs (180 days used for piloted missions)• Mission duration (used for 360-day total TOF studies)• Departure hyperbolic excess speed (used to evaluate piloted missions at 2011 C3s)• Arrival hyperbolic excess speed (to limit Mars or Earth entry velocities if exceeded with
optimal solution)• Swingby passage distance (used for free-returns to ensure minimum periapse distance at
Mars was not less than 1)• Net spacecraft mass (used to deliver applicable payload mass to Earth and Mars).
Optimization criteria were available to minimize:• Initial spacecraft mass—used for all cargo missions and some piloted transfers• Sum of propulsion ∆Vs—used for free return trajectories• Mission duration—used to minimize piloted mission durations to 2011 C3s (net spacecraft
mass also available).
131
APPENDIX E—FLIGHT TIME STUDIES
First, the 2011 conjunction piloted missions were evaluated by optimizing trajectories at out-bound legs longer than 180 days and return legs shorter than 180 days. The total flight time was kept at360 days (i.e., 178 out/182 return). Table 18 summarizes the results for 2011. The only constraintsimposed were on total flight time and the constraint to keep payload weights less than 80 mt. For theshorter legs outbound, 158 days was the minimum amount that would allow an acceptable TMI stagemass. For the shorter legs inbound, 162 days was found to be the minimum, at which point the TEIstage mass would be excessive. However, with the shorter outbound leg trips it was found that V∞limits at Mars would be excessive for aerobraking limits, and for short return legs the V∞ limit at Earthwould be excessive for allowable reentry limits.
The conclusion from the 2011 studies is that the maximum benefit comes with shortening theoutbound leg (increasing slightly the TMI propellant used) but lengthening the inbound leg. The overallresult is a decrease in both the TEI piloted stage mass required and the cargo 1 initial mass in LEO.However, with the shorter leg trips the incoming velocities are excessive and must be closely monitoredto prevent exceeding design specifications.
The 2011 study provided a starting point for the baseline 2014 mission studies. The method usedto evaluate the 2014 opportunity is summarized in figure 10. It was assumed that to minimize totalmission cost one would want to minimize initial masses of both the cargo 1 mission and the outboundpiloted mission. Table 19 provides more detailed information about the reduction in propellant loadingrequired for each individual mission in case a specific leg or mission was deemed more critical thananother.
To interpret the data in this plot, first, notice the optimal point marked with a bold o. This is thepoint associated with the minimum passage time associated with the 2011 C3s. Note the region with anoutbound TOF less than 161 days will result in an excessive Mars entry velocity. By lengthening thereturn TOF, the required initial mass in Mars departure orbit will be reduced, which in turn reduces therequired initial mass for the cargo 1 mission. In addition, by lengthening the outbound TOF, the re-quired initial mass in LEO for the outbound piloted mission was reduced. The greatest reduction was atdata points along the 360-day TOF line. What is not so obvious is at which particular point along thediagonal TOF lines the maximum reduction occurs. For the 360-day TOF line, several points werechosen along this line and it was found that the optimal point is at 171 days outbound and 189 daysreturn.
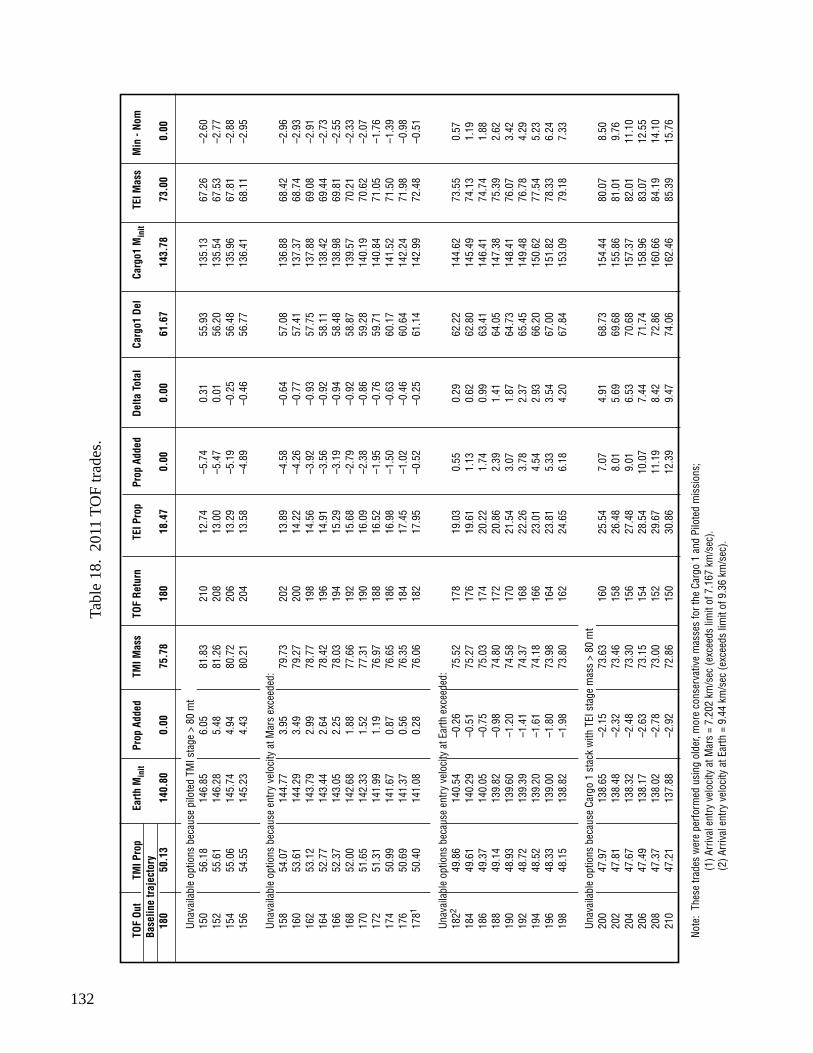
132
TOF
Out
TMI P
rop
Earth
Min
itPr
op A
dded
TMI M
ass
TOF
Retu
rnTE
I Pro
pPr
op A
dded
Delta
Tot
alCa
rgo1
Del
Carg
o1 M
init
TEI M
ass
Min
- No
mBa
selin
e tra
ject
ory
180
50.1
314
0.80
0.00
75.7
818
018
.47
0.00
0.00
61.6
714
3.78
73.0
00.
00
Unav
aila
ble
optio
ns b
ecau
se p
ilote
d TM
I sta
ge >
80
mt
150
56.1
814
6.85
6.05
81.8
321
012
.74
–5.7
40.
3155
.93
135.
1367
.26
–2.6
015
255
.61
146.
285.
4881
.26
208
13.0
0–5
.47
0.01
56.2
013
5.54
67.5
3–2
.77
154
55.0
614
5.74
4.94
80.7
220
613
.29
–5.1
9–0
.25
56.4
813
5.96
67.8
1–2
.88
156
54.5
514
5.23
4.43
80.2
120
413
.58
–4.8
9–0
.46
56.7
713
6.41
68.1
1–2
.95
Unav
aila
ble
optio
ns b
ecau
se e
ntry
vel
ocity
at M
ars
exce
eded
:15
854
.07
144.
773.
9579
.73
202
13.8
9–4
.58
–0.6
457
.08
136.
8868
.42
–2.9
616
053
.61
144.
293.
4979
.27
200
14.2
2–4
.26
–0.7
757
.41
137.
3768
.74
–2.9
316
253
.12
143.
792.
9978
.77
198
14.5
6–3
.92
–0.9
357
.75
137.
8869
.08
–2.9
116
452
.77
143.
442.
6478
.42
196
14.9
1–3
.56
–0.9
258
.11
138.
4269
.44
–2.7
316
652
.37
143.
052.
2578
.03
194
15.2
9–3
.19
–0.9
458
.48
138.
9869
.81
–2.5
516
852
.00
142.
681.
8877
.66
192
15.6
8–2
.79
–0.9
258
.87
139.
5770
.21
–2.3
317
051
.65
142.
331.
5277
.31
190
16.0
9–2
.38
–0.8
659
.28
140.
1970
.62
–2.0
717
251
.31
141.
991.
1976
.97
188
16.5
2–1
.95
–0.7
659
.71
140.
8471
.05
–1.7
617
450
.99
141.
670.
8776
.65
186
16.9
8–1
.50
–0.6
360
.17
141.
5271
.50
–1.3
917
650
.69
141.
370.
5676
.35
184
17.4
5–1
.02
–0.4
660
.64
142.
2471
.98
–0.9
817
8150
.40
141.
080.
2876
.06
182
17.9
5–0
.52
–0.2
561
.14
142.
9972
.48
–0.5
1
Unav
aila
ble
optio
ns b
ecau
se e
ntry
vel
ocity
at E
arth
exc
eede
d:18
2249
.86
140.
54–0
.26
75.5
217
819
.03
0.55
0.29
62.2
214
4.62
73.5
50.
5718
449
.61
140.
29–0
.51
75.2
717
619
.61
1.13
0.62
62.8
014
5.49
74.1
31.
1918
649
.37
140.
05–0
.75
75.0
317
420
.22
1.74
0.99
63.4
114
6.41
74.7
41.
8818
849
.14
139.
82–0
.98
74.8
017
220
.86
2.39
1.41
64.0
514
7.38
75.3
92.
6219
048
.93
139.
60–1
.20
74.5
817
021
.54
3.07
1.87
64.7
314
8.41
76.0
73.
4219
248
.72
139.
39–1
.41
74.3
716
822
.26
3.78
2.37
65.4
514
9.48
76.7
84.
2919
448
.52
139.
20–1
.61
74.1
816
623
.01
4.54
2.93
66.2
015
0.62
77.5
45.
2319
648
.33
139.
00–1
.80
73.9
816
423
.81
5.33
3.54
67.0
015
1.82
78.3
36.
2419
848
.15
138.
82–1
.98
73.8
016
224
.65
6.18
4.20
67.8
415
3.09
79.1
87.
33
Unav
aila
ble
optio
ns b
ecau
se C
argo
1 s
tack
with
TEI
sta
ge m
ass
> 80
mt
200
47.9
713
8.65
–2.1
573
.63
160
25.5
47.
074.
9168
.73
154.
4480
.07
8.50
202
47.8
113
8.48
–2.3
273
.46
158
26.4
88.
015.
6969
.68
155.
8681
.01
9.76
204
47.6
713
8.32
–2.4
873
.30
156
27.4
89.
016.
5370
.68
157.
3782
.01
11.1
020
647
.49
138.
17–2
.63
73.1
515
428
.54
10.0
77.
4471
.74
158.
9683
.07
12.5
520
847
.37
138.
02–2
.78
73.0
015
229
.67
11.1
98.
4272
.86
160.
6684
.19
14.1
021
047
.21
137.
88–2
.92
72.8
615
030
.86
12.3
99.
4774
.06
162.
4685
.39
15.7
6
Note
: Th
ese
trade
s w
ere
perfo
rmed
usi
ng o
lder
, mor
e co
nser
vativ
e m
asse
s fo
r the
Car
go 1
and
Pilo
ted
mis
sion
s;(1
) Arr
ival
ent
ry v
eloc
ity a
t Mar
s =
7.20
2 km
/sec
(exc
eeds
lim
it of
7.1
67 k
m/s
ec).
(2) A
rriv
al e
ntry
vel
ocity
at E
arth
= 9
.44
km/s
ec (e
xcee
ds li
mit
of 9
.36
km/s
ec).
Tabl
e 18
. 20
11 T
OF
trad
es.
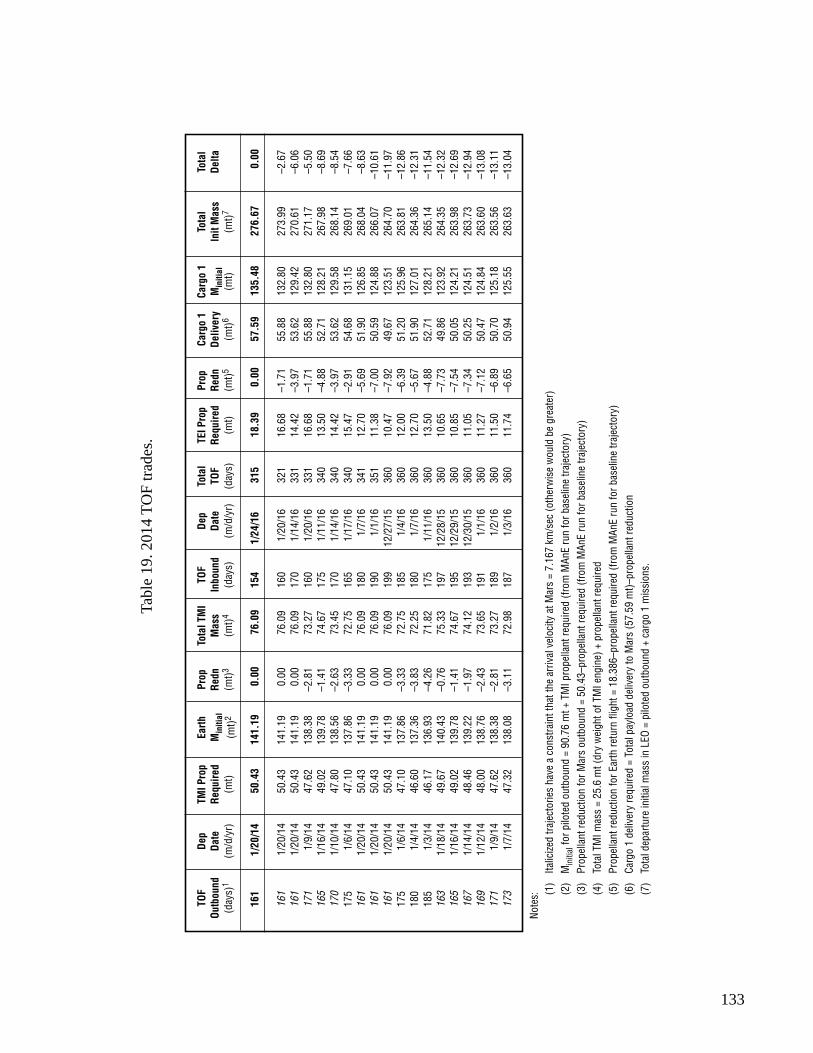
133
TOF
Dep
TMI P
rop
Earth
Prop
Tota
l TM
ITO
FDe
pTo
tal
TEI P
rop
Prop
Carg
o 1
Carg
o 1
Tota
lTo
tal
Outb
ound
Date
Requ
ired
Min
itial
Redn
Mas
sIn
boun
dDa
teTO
FRe
quire
dRe
dnDe
liver
yM
initi
alIn
it M
ass
Delta
(day
s)1
(m/d
/yr)
(mt)
(mt)2
(mt)3
(mt)4
(day
s)(m
/d/y
r)(d
ays)
(mt)
(mt)5
(mt)6
(mt)
(mt)7
161
1/20
/14
50.4
314
1.19
0.00
76.0
915
41/
24/1
631
518
.39
0.00
57.5
913
5.48
276.
670.
00
161
1/20
/14
50.4
314
1.19
0.00
76.0
916
01/
20/1
632
116
.68
–1.7
155
.88
132.
8027
3.99
–2.6
716
11/
20/1
450
.43
141.
190.
0076
.09
170
1/14
/16
331
14.4
2–3
.97
53.6
212
9.42
270.
61–6
.06
171
1/9/
1447
.62
138.
38–2
.81
73.2
716
01/
20/1
633
116
.68
–1.7
155
.88
132.
8027
1.17
–5.5
016
51/
16/1
449
.02
139.
78–1
.41
74.6
717
51/
11/1
634
013
.50
–4.8
852
.71
128.
2126
7.98
–8.6
917
01/
10/1
447
.80
138.
56–2
.63
73.4
517
01/
14/1
634
014
.42
–3.9
753
.62
129.
5826
8.14
–8.5
417
51/
6/14
47.1
013
7.86
–3.3
372
.75
165
1/17
/16
340
15.4
7–2
.91
54.6
813
1.15
269.
01–7
.66
161
1/20
/14
50.4
314
1.19
0.00
76.0
918
01/
7/16
341
12.7
0–5
.69
51.9
012
6.85
268.
04–8
.63
161
1/20
/14
50.4
314
1.19
0.00
76.0
919
01/
1/16
351
11.3
8–7
.00
50.5
912
4.88
266.
07–1
0.61
161
1/20
/14
50.4
314
1.19
0.00
76.0
919
912
/27/
1536
010
.47
–7.9
249
.67
123.
5126
4.70
–11.
9717
51/
6/14
47.1
013
7.86
–3.3
372
.75
185
1/4/
1636
012
.00
–6.3
951
.20
125.
9626
3.81
–12.
8618
01/
4/14
46.6
013
7.36
–3.8
372
.25
180
1/7/
1636
012
.70
–5.6
751
.90
127.
0126
4.36
–12.
3118
51/
3/14
46.1
713
6.93
–4.2
671
.82
175
1/11
/16
360
13.5
0–4
.88
52.7
112
8.21
265.
14–1
1.54
163
1/18
/14
49.6
714
0.43
–0.7
675
.33
197
12/2
8/15
360
10.6
5–7
.73
49.8
612
3.92
264.
35–1
2.32
165
1/16
/14
49.0
213
9.78
–1.4
174
.67
195
12/2
9/15
360
10.8
5–7
.54
50.0
512
4.21
263.
98–1
2.69
167
1/14
/14
48.4
613
9.22
–1.9
774
.12
193
12/3
0/15
360
11.0
5–7
.34
50.2
512
4.51
263.
73–1
2.94
169
1/12
/14
48.0
013
8.76
–2.4
373
.65
191
1/1/
1636
011
.27
–7.1
250
.47
124.
8426
3.60
–13.
0817
11/
9/14
47.6
213
8.38
–2.8
173
.27
189
1/2/
1636
011
.50
–6.8
950
.70
125.
1826
3.56
–13.
1117
31/
7/14
47.3
213
8.08
–3.1
172
.98
187
1/3/
1636
011
.74
–6.6
550
.94
125.
5526
3.63
–13.
04
Note
s: (1)
Italic
ized
traje
ctor
ies
have
a c
onst
rain
t tha
t the
arr
ival
vel
ocity
at M
ars
= 7.
167
km/s
ec (o
ther
wis
e w
ould
be
grea
ter)
(2)
Min
itial
for p
ilote
d ou
tbou
nd =
90.
76 m
t + T
MI p
rope
llant
requ
ired
(from
MAn
E ru
n fo
r bas
elin
e tra
ject
ory)
(3)
Prop
ella
nt re
duct
ion
for M
ars
outb
ound
= 5
0.43
–pro
pella
nt re
quire
d (fr
om M
AnE
run
for b
asel
ine
traje
ctor
y)(4
)To
tal T
MI m
ass
= 25
.6 m
t (dr
y w
eigh
t of T
MI e
ngin
e) +
pro
pella
nt re
quire
d(5
)Pr
opel
lant
redu
ctio
n fo
r Ear
th re
turn
flig
ht =
18.
386–
prop
ella
nt re
quire
d (fr
om M
AnE
run
for b
asel
ine
traje
ctor
y)(6
)Ca
rgo
1 de
liver
y re
quire
d =
Tota
l pay
load
del
iver
y to
Mar
s (5
7.59
mt)–
prop
ella
nt re
duct
ion
(7)
Tota
l dep
artu
re in
itial
mas
s in
LEO
= p
ilote
d ou
tbou
nd +
car
go 1
mis
sion
s.
Tabl
e 19
. 201
4 T
OF
trad
es.
134
APPENDIX F—GRAVITY LOSS STUDIES
A short side-study was performed to assess the effect of various T/W ratios on gravity losses atEarth. The larger the T/W ratio, the lower the effect of gravity losses. The gravity losses were deter-mined from MAnE runs for the following configurations:
T/W = 0.12 (envelope heaviest possible stack)T/W = 0.135T/W = 0.149T/W = 0.2 (approximately the effect of adding a third engine).
In addition, the effect of the following was looked at for the 2011 C3s:
(1) 2 burns/4 engines (increases T/W to 0.2 and adds 2 mt to the engine weight)(2) 3 burns/3 engines(3) 3 burns/4 engines.
As expected, case (1) should fall closely in line with the T/W=0.2 case (the exception being theactual added engine weight, which is a minimal effect). Also as expected, with an additional burn thegravity losses are reduced. The tradeoff is the longer in-flight time the crew would need to endure.According to the MAnE results, this would involve a coast period prior to the third burn of approxi-mately 8 hours. The other choice would be to add an additional engine to reduce gravity losses.
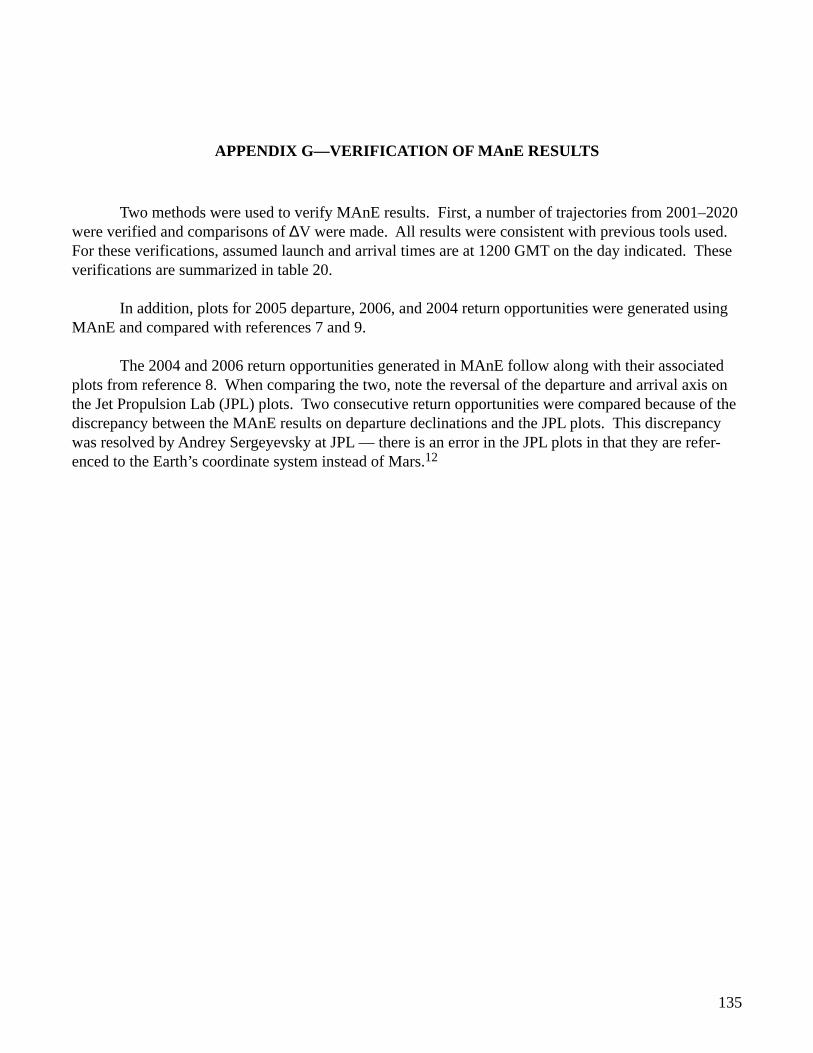
135
APPENDIX G—VERIFICATION OF MAnE RESULTS
Two methods were used to verify MAnE results. First, a number of trajectories from 2001–2020were verified and comparisons of ∆V were made. All results were consistent with previous tools used.For these verifications, assumed launch and arrival times are at 1200 GMT on the day indicated. Theseverifications are summarized in table 20.
In addition, plots for 2005 departure, 2006, and 2004 return opportunities were generated usingMAnE and compared with references 7 and 9.
The 2004 and 2006 return opportunities generated in MAnE follow along with their associatedplots from reference 8. When comparing the two, note the reversal of the departure and arrival axis onthe Jet Propulsion Lab (JPL) plots. Two consecutive return opportunities were compared because of thediscrepancy between the MAnE results on departure declinations and the JPL plots. This discrepancywas resolved by Andrey Sergeyevsky at JPL — there is an error in the JPL plots in that they are refer-enced to the Earth’s coordinate system instead of Mars.12
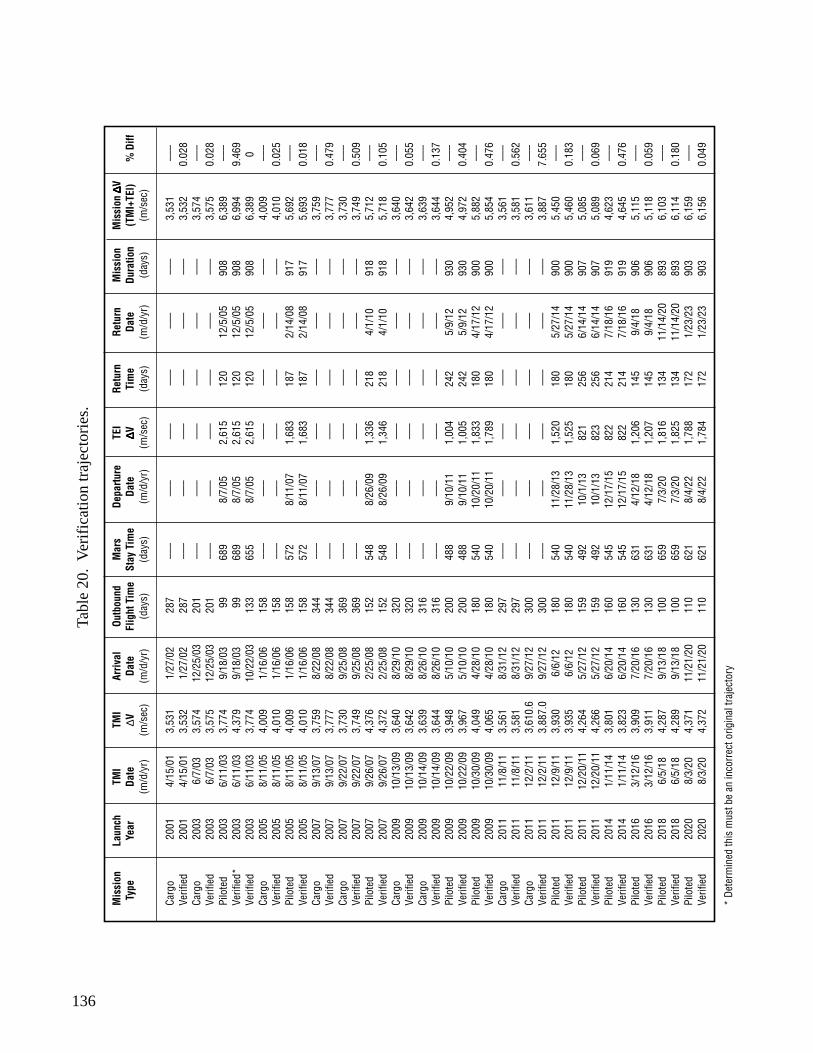
136
Mis
sion
Laun
chTM
ITM
IAr
rival
Outb
ound
Mar
sDe
partu
reTE
IRe
turn
Retu
rnM
issi
onM
issi
on ∆∆∆∆ ∆
V T
ype
Year
Date
∆VDa
teFl
ight
Tim
eSt
ay T
ime
Date
∆∆∆∆ ∆VTi
me
Date
Dura
tion
(TM
I+TE
I)%
Diff
(m/d
/yr)
(m/s
ec)
(m/d
/yr)
(day
s)(d
ays)
(m/d
/yr)
(m/s
ec)
(day
s)(m
/d/y
r)(d
ays)
(m/s
ec)
Carg
o20
014/
15/0
13,
531
1/27
/02
287
–––
–––
–––
–––
–––
–––
3,53
1 –
––Ve
rifie
d20
014/
15/0
13,
532
1/27
/02
287
–––
–––
–––
–––
–––
–––
3,53
20.
028
Carg
o20
036/
7/03
3,57
412
/25/
0320
1 –
–– –
–– –
–– –
–– –
–– –
––3,
574
–––
Verif
ied
2003
6/7/
033,
575
12/2
5/03
201
–––
–––
–––
–––
–––
–––
3,57
50.
028
Pilo
ted
2003
6/11
/03
3,77
49/
18/0
399
689
8/7/
052,
615
120
12/5
/05
908
6,38
9 –
––Ve
rifie
d*20
036/
11/0
34,
379
9/18
/03
9968
98/
7/05
2,61
512
012
/5/0
590
86,
994
9.46
9Ve
rifie
d20
036/
11/0
33,
774
10/2
2/03
133
655
8/7/
052,
615
120
12/5
/05
908
6,38
90
Carg
o20
058/
11/0
54,
009
1/16
/06
158
–––
–––
–––
–––
–––
–––
4,00
9 –
––Ve
rifie
d20
058/
11/0
54,
010
1/16
/06
158
–––
–––
–––
–––
–––
–––
4,01
00.
025
Pilo
ted
2005
8/11
/05
4,00
91/
16/0
615
857
28/
11/0
71,
683
187
2/14
/08
917
5,69
2 –
––Ve
rifie
d20
058/
11/0
54,
010
1/16
/06
158
572
8/11
/07
1,68
318
72/
14/0
891
75,
693
0.01
8Ca
rgo
2007
9/13
/07
3,75
98/
22/0
834
4 –
–– –
–– –
–– –
–– –
–– –
––3,
759
–––
Verif
ied
2007
9/13
/07
3,77
78/
22/0
834
4 –
–– –
–– –
–– –
–– –
–– –
––3,
777
0.47
9Ca
rgo
2007
9/22
/07
3,73
09/
25/0
836
9 –
–– –
–– –
–– –
–– –
–– –
––3,
730
–––
Verif
ied
2007
9/22
/07
3,74
99/
25/0
836
9 –
–– –
–– –
–– –
–– –
–– –
––3,
749
0.50
9Pi
lote
d20
079/
26/0
74,
376
2/25
/08
152
548
8/26
/09
1,33
621
84/
1/10
918
5,71
2 –
––Ve
rifie
d20
079/
26/0
74,
372
2/25
/08
152
548
8/26
/09
1,34
621
84/
1/10
918
5,71
80.
105
Carg
o20
0910
/13/
093,
640
8/29
/10
320
–––
–––
–––
–––
–––
–––
3,64
0 –
––Ve
rifie
d20
0910
/13/
093,
642
8/29
/10
320
–––
–––
–––
–––
–––
–––
3,64
20.
055
Carg
o20
0910
/14/
093,
639
8/26
/10
316
–––
–––
–––
–––
–––
–––
3,63
9 –
––Ve
rifie
d20
0910
/14/
093,
644
8/26
/10
316
–––
–––
–––
–––
–––
–––
3,64
40.
137
Pilo
ted
2009
10/2
2/09
3,94
85/
10/1
020
048
89/
10/1
11,
004
242
5/9/
1293
04,
952
–––
Verif
ied
2009
10/2
2/09
3,96
75/
10/1
020
048
89/
10/1
11,
005
242
5/9/
1293
04,
972
0.40
4Pi
lote
d20
0910
/30/
094,
049
4/28
/10
180
540
10/2
0/11
1,83
318
04/
17/1
290
05,
882
–––
Verif
ied
2009
10/3
0/09
4,06
54/
28/1
018
054
010
/20/
111,
789
180
4/17
/12
900
5,85
40.
476
Carg
o20
1111
/8/1
13,
561
8/31
/12
297
–––
–––
–––
–––
–––
–––
3,56
1 –
––Ve
rifie
d20
1111
/8/1
13,
581
8/31
/12
297
–––
–––
–––
–––
–––
–––
3,58
10.
562
Carg
o20
1112
/2/1
13,
610.
69/
27/1
230
0 –
–– –
–– –
–– –
–– –
–– –
––3,
611
–––
Verif
ied
2011
12/2
/11
3,88
7.0
9/27
/12
300
–––
–––
–––
–––
–––
–––
3,88
77.
655
Pilo
ted
2011
12/9
/11
3,93
06/
6/12
180
540
11/2
8/13
1,52
018
05/
27/1
490
05,
450
–––
Verif
ied
2011
12/9
/11
3,93
56/
6/12
180
540
11/2
8/13
1,52
518
05/
27/1
490
05,
460
0.18
3Pi
lote
d20
1112
/20/
114,
264
5/27
/12
159
492
10/1
/13
821
256
6/14
/14
907
5,08
5 –
––Ve
rifie
d20
1112
/20/
114,
266
5/27
/12
159
492
10/1
/13
823
256
6/14
/14
907
5,08
90.
069
Pilo
ted
2014
1/11
/14
3,80
16/
20/1
416
054
512
/17/
1582
221
47/
18/1
691
94,
623
–––
Verif
ied
2014
1/11
/14
3,82
36/
20/1
416
054
512
/17/
1582
221
47/
18/1
691
94,
645
0.47
6Pi
lote
d20
163/
12/1
63,
909
7/20
/16
130
631
4/12
/18
1,20
614
59/
4/18
906
5,11
5 –
––Ve
rifie
d20
163/
12/1
63,
911
7/20
/16
130
631
4/12
/18
1,20
714
59/
4/18
906
5,11
80.
059
Pilo
ted
2018
6/5/
184,
287
9/13
/18
100
659
7/3/
201,
816
134
11/1
4/20
893
6,10
3 –
––Ve
rifie
d20
186/
5/18
4,28
99/
13/1
810
065
97/
3/20
1,82
513
411
/14/
2089
36,
114
0.18
0Pi
lote
d20
208/
3/20
4,37
111
/21/
2011
062
18/
4/22
1,78
817
21/
23/2
390
36,
159
–––
Verif
ied
2020
8/3/
204,
372
11/2
1/20
110
621
8/4/
221,
784
172
1/23
/23
903
6,15
60.
049
* De
term
ined
this
mus
t be
an in
corr
ect o
rigin
al tr
ajec
tory
Tabl
e 20
. V
erifi
catio
n tr
ajec
torie
s.
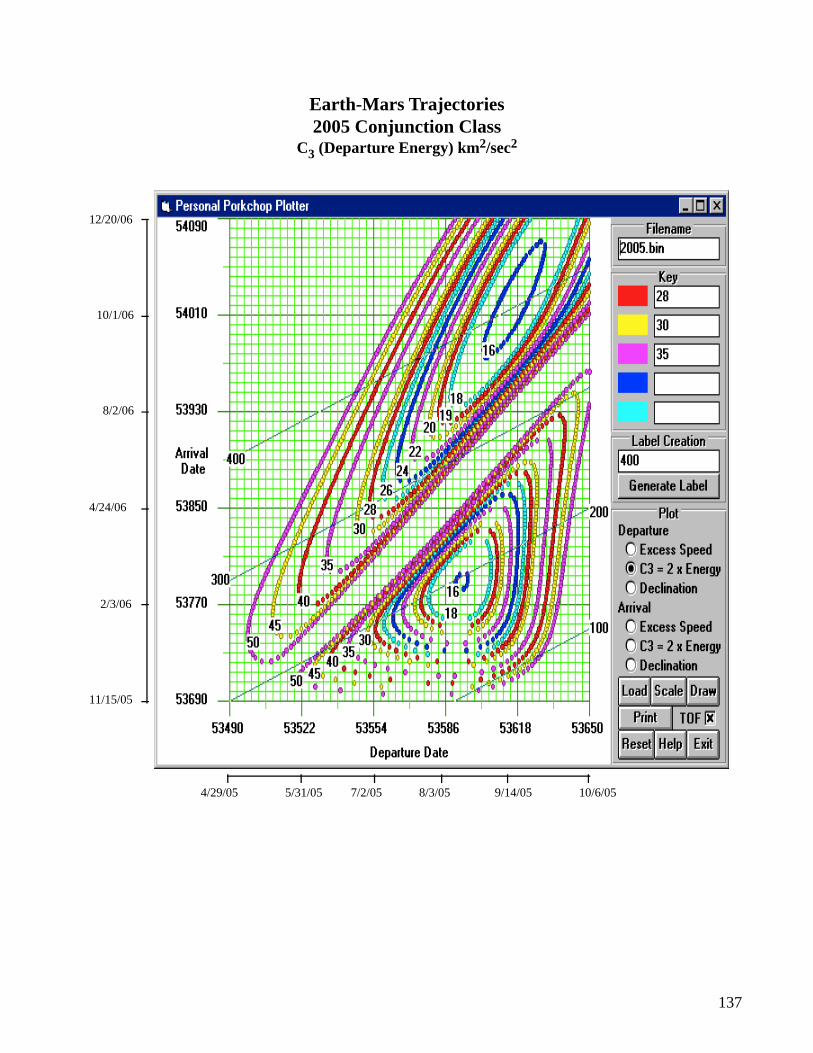
137
12/20/06
10/1/06
8/2/06
4/24/06
2/3/06
11/15/05
4/29/05 10/6/055/31/05 7/2/05 8/3/05 9/14/05
Earth-Mars Trajectories2005 Conjunction Class
C3 (Departure Energy) km2/sec2
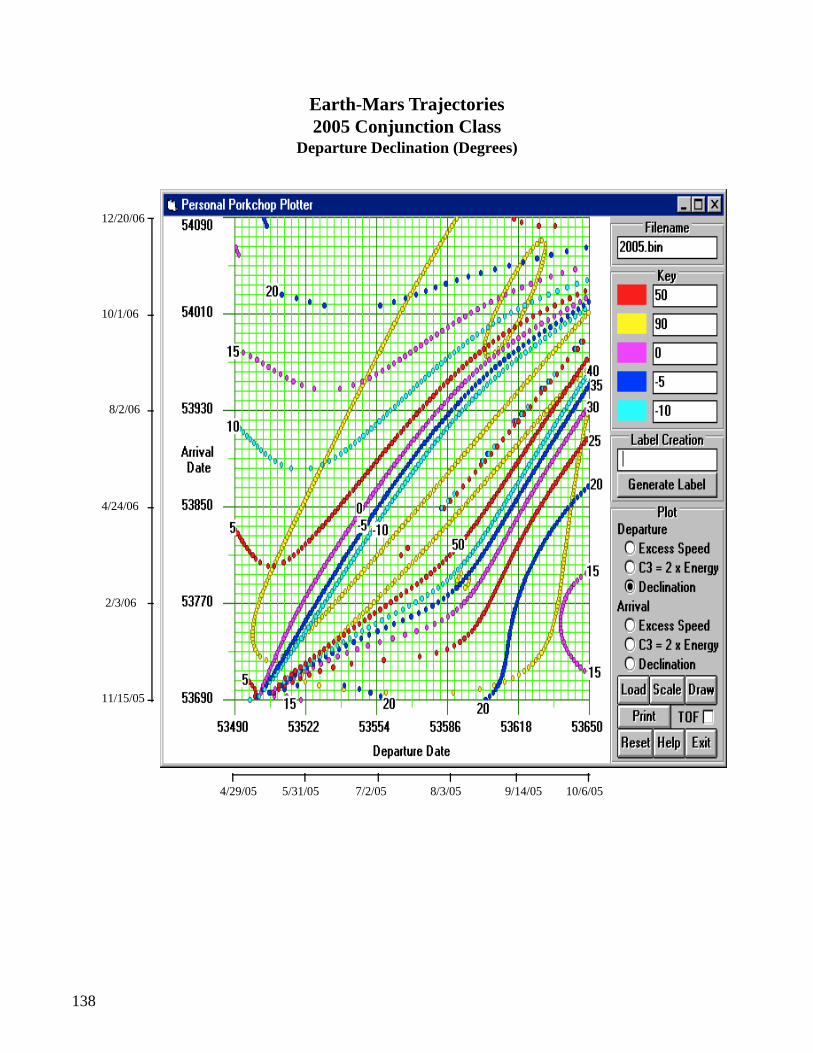
138
12/20/06
10/1/06
8/2/06
4/24/06
2/3/06
11/15/05
4/29/05 10/6/055/31/05 7/2/05 8/3/05 9/14/05
Earth-Mars Trajectories2005 Conjunction Class
Departure Declination (Degrees)
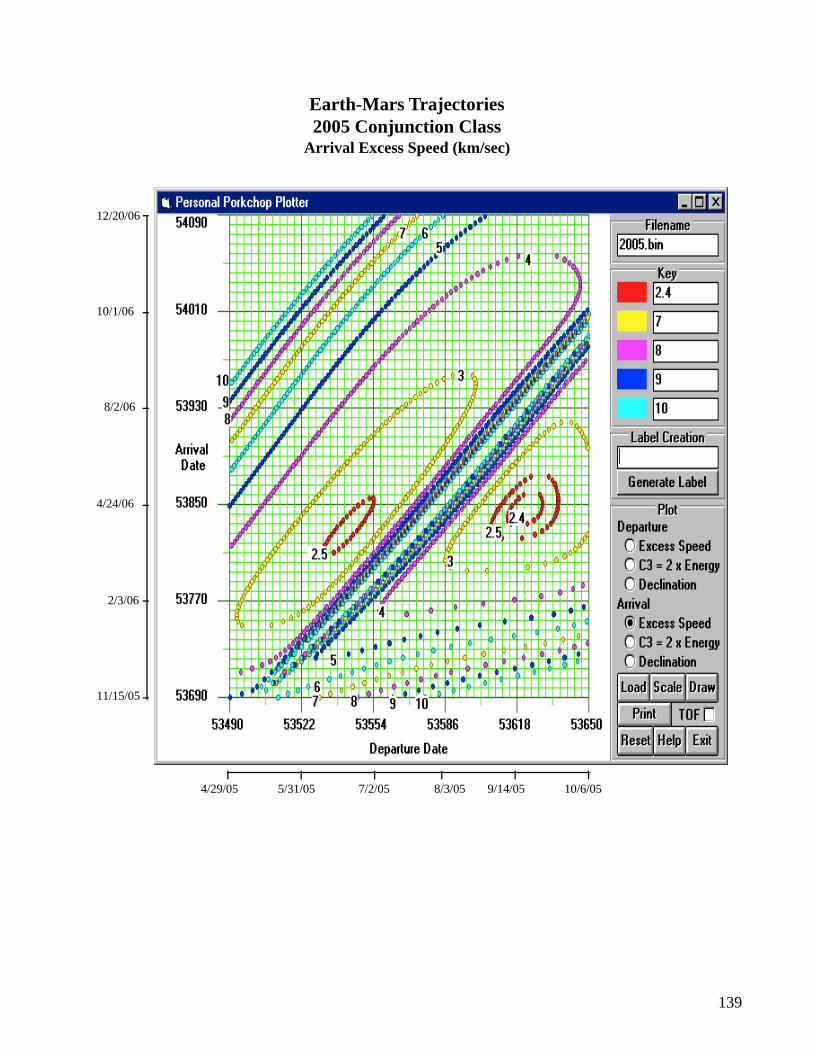
139
12/20/06
10/1/06
8/2/06
4/24/06
2/3/06
11/15/05
4/29/05 10/6/055/31/05 7/2/05 8/3/05 9/14/05
Earth-Mars Trajectories2005 Conjunction Class
Arrival Excess Speed (km/sec)
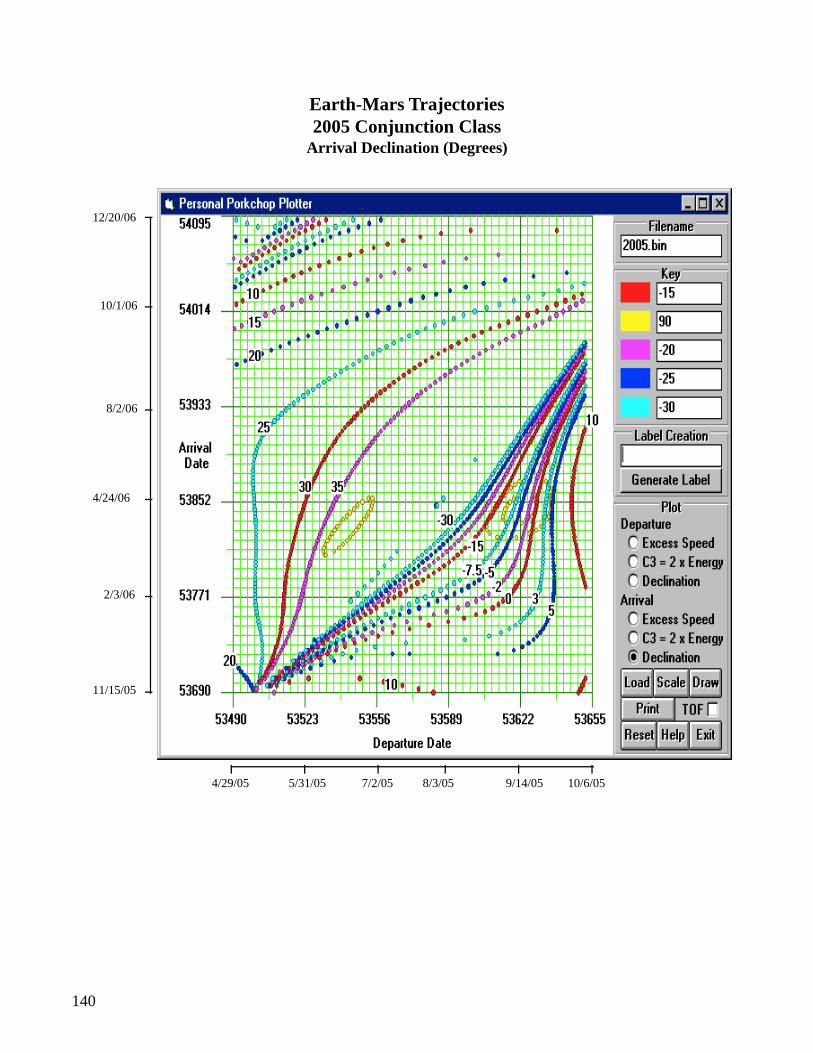
140
12/20/06
10/1/06
8/2/06
4/24/06
2/3/06
11/15/05
4/29/05 10/6/055/31/05 7/2/05 8/3/05 9/14/05
Earth-Mars Trajectories2005 Conjunction Class
Arrival Declination (Degrees)
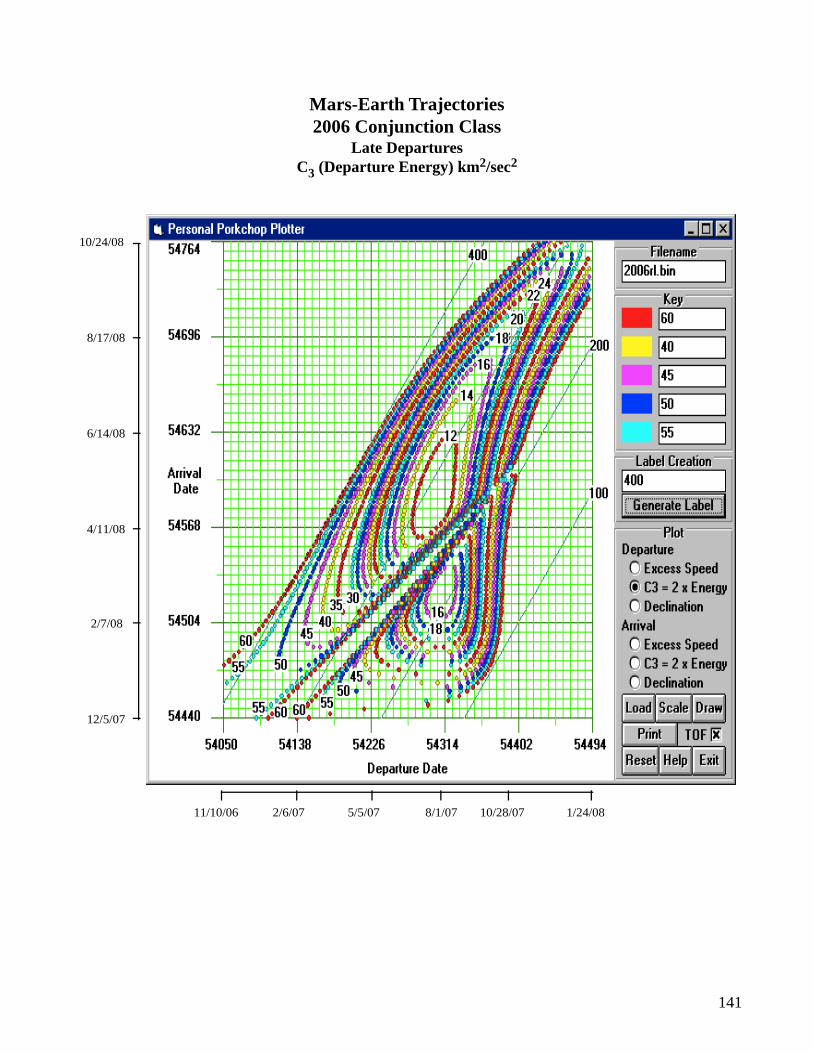
141
10/24/08
8/17/08
6/14/08
4/11/08
2/7/08
12/5/07
11/10/06 1/24/082/6/07 5/5/07 8/1/07 10/28/07
Mars-Earth Trajectories2006 Conjunction Class
Late DeparturesC3 (Departure Energy) km2/sec2
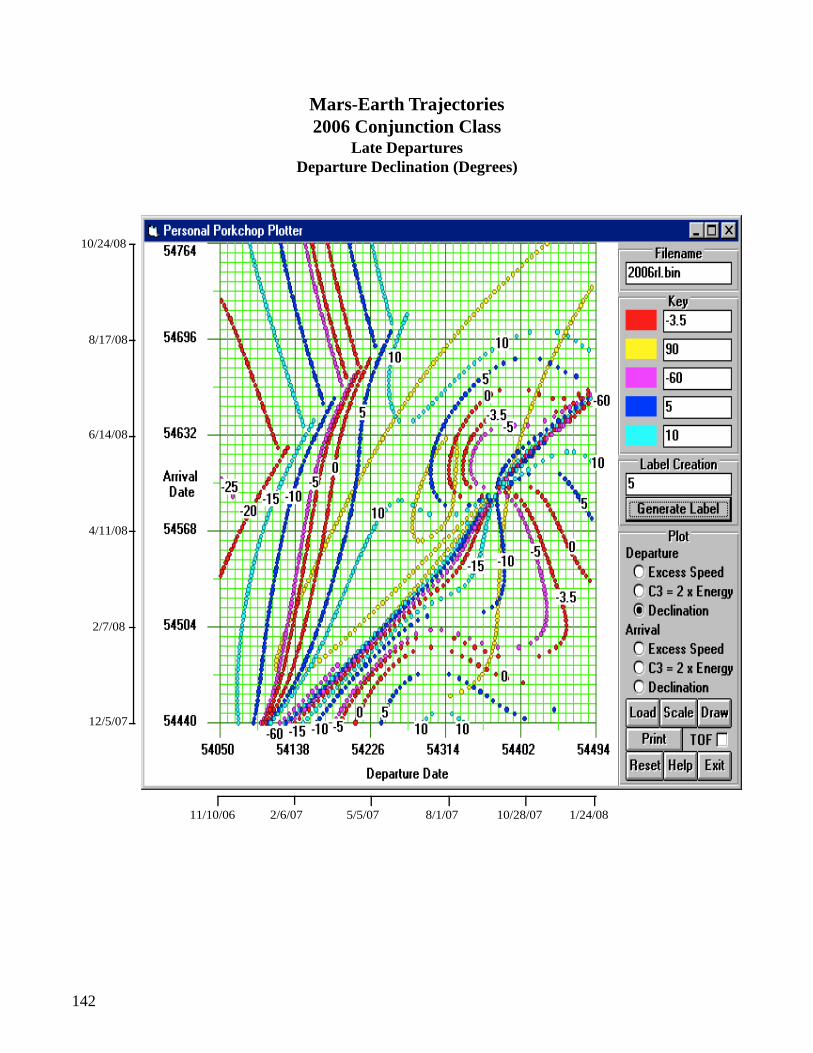
142
Mars-Earth Trajectories2006 Conjunction Class
Late DeparturesDeparture Declination (Degrees)
10/24/08
8/17/08
6/14/08
4/11/08
2/7/08
12/5/07
11/10/06 1/24/082/6/07 5/5/07 8/1/07 10/28/07
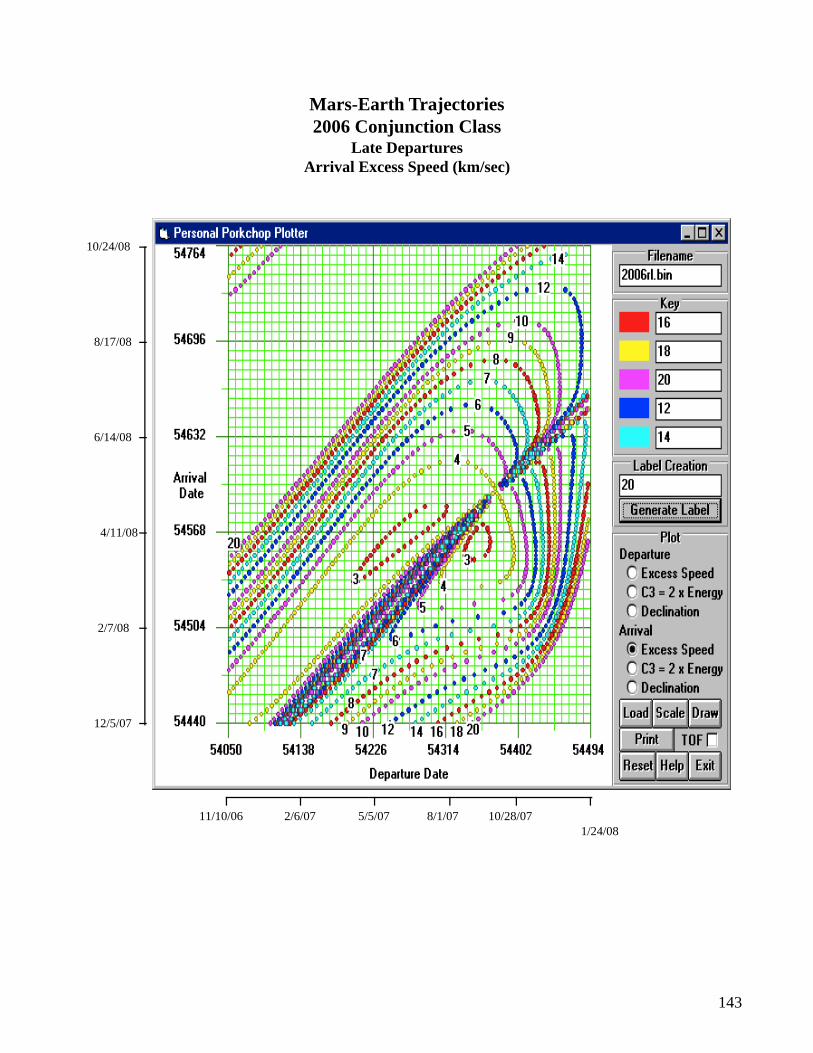
143
10/24/08
8/17/08
6/14/08
4/11/08
2/7/08
12/5/07
11/10/061/24/08
2/6/07 5/5/07 8/1/07 10/28/07
Mars-Earth Trajectories2006 Conjunction Class
Late DeparturesArrival Excess Speed (km/sec)
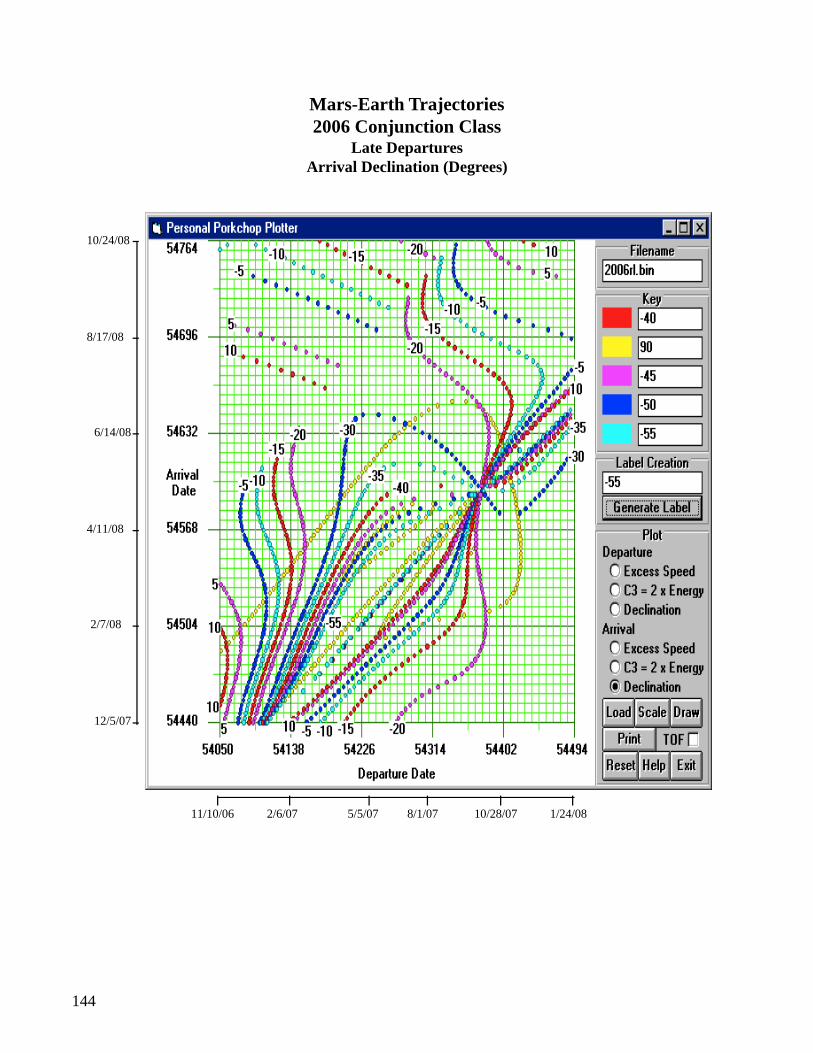
144
10/24/08
8/17/08
6/14/08
4/11/08
2/7/08
12/5/07
11/10/06 1/24/082/6/07 5/5/07 8/1/07 10/28/07
Mars-Earth Trajectories2006 Conjunction Class
Late DeparturesArrival Declination (Degrees)
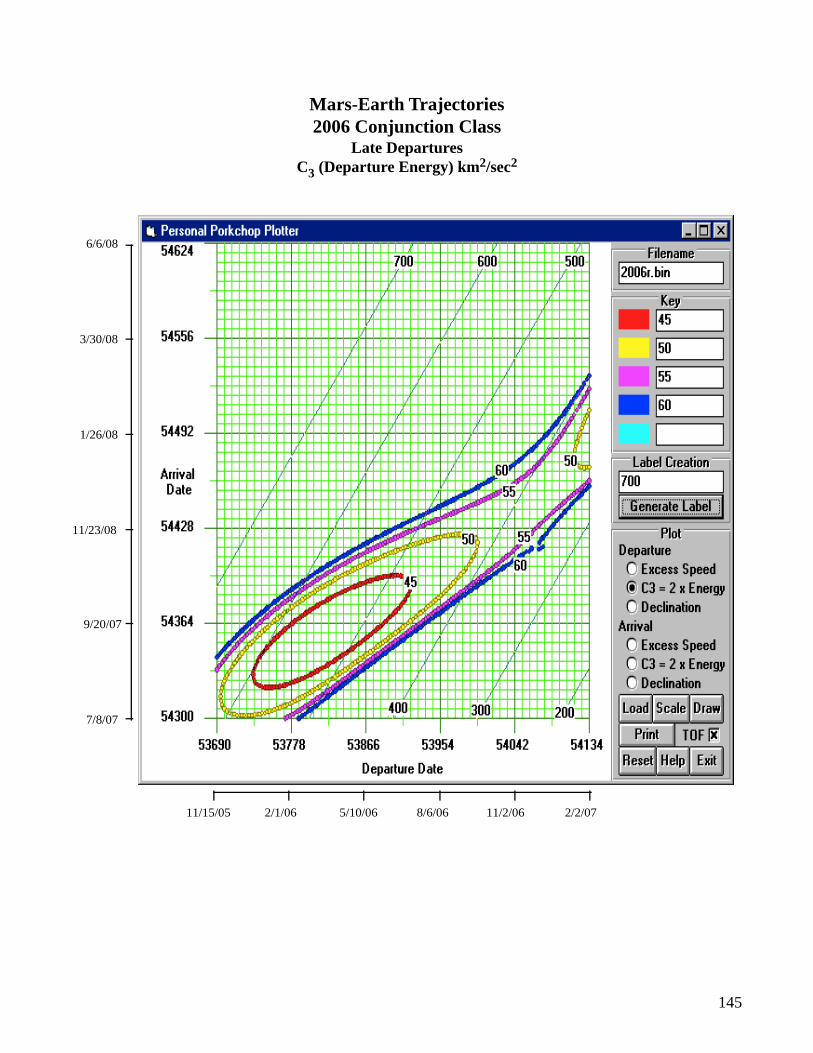
145
6/6/08
3/30/08
1/26/08
11/23/08
9/20/07
7/8/07
11/15/05 2/2/072/1/06 5/10/06 8/6/06 11/2/06
Mars-Earth Trajectories2006 Conjunction Class
Late DeparturesC3 (Departure Energy) km2/sec2
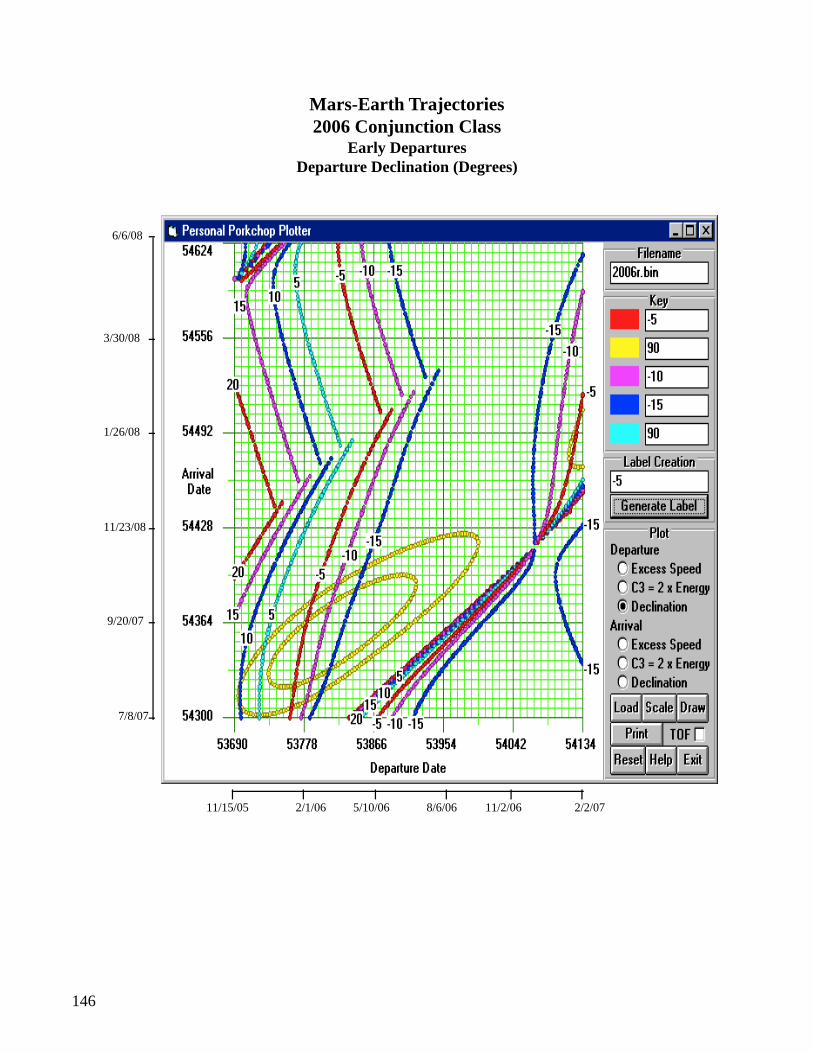
146
6/6/08
3/30/08
1/26/08
11/23/08
9/20/07
7/8/07
11/15/05 2/2/072/1/06 5/10/06 8/6/06 11/2/06
Mars-Earth Trajectories2006 Conjunction Class
Early DeparturesDeparture Declination (Degrees)
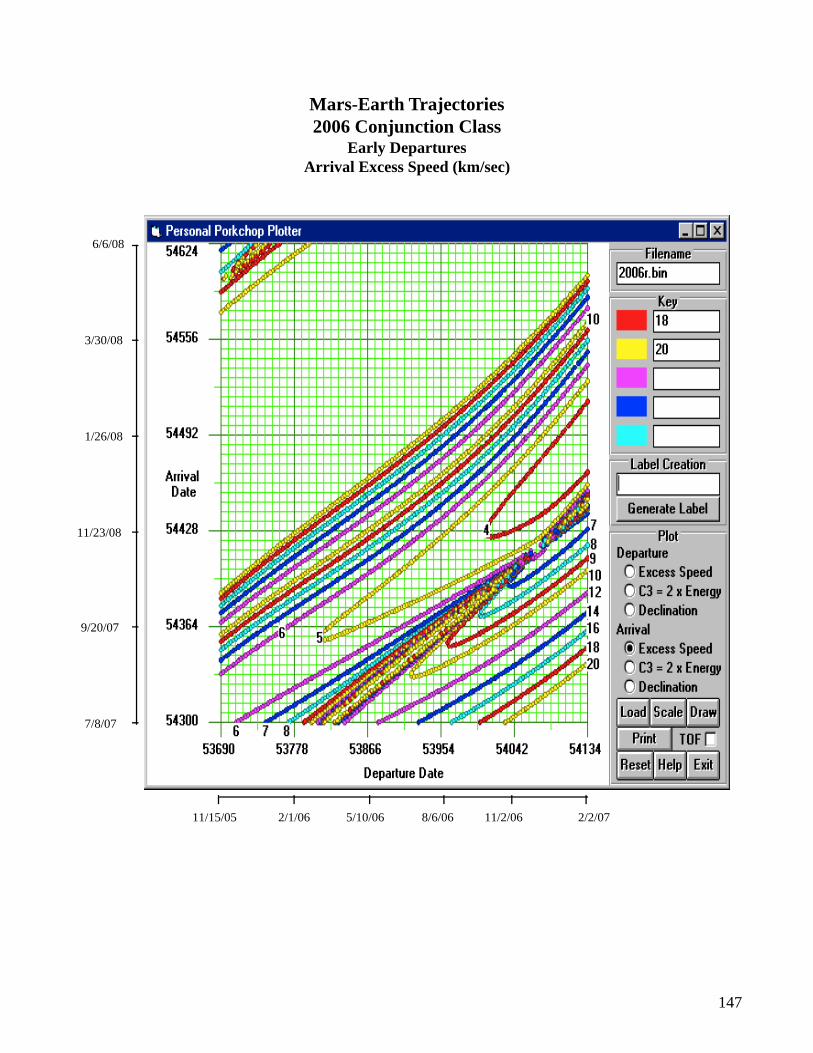
147
6/6/08
3/30/08
1/26/08
11/23/08
9/20/07
7/8/07
11/15/05 2/2/072/1/06 5/10/06 8/6/06 11/2/06
Mars-Earth Trajectories2006 Conjunction Class
Early DeparturesArrival Excess Speed (km/sec)
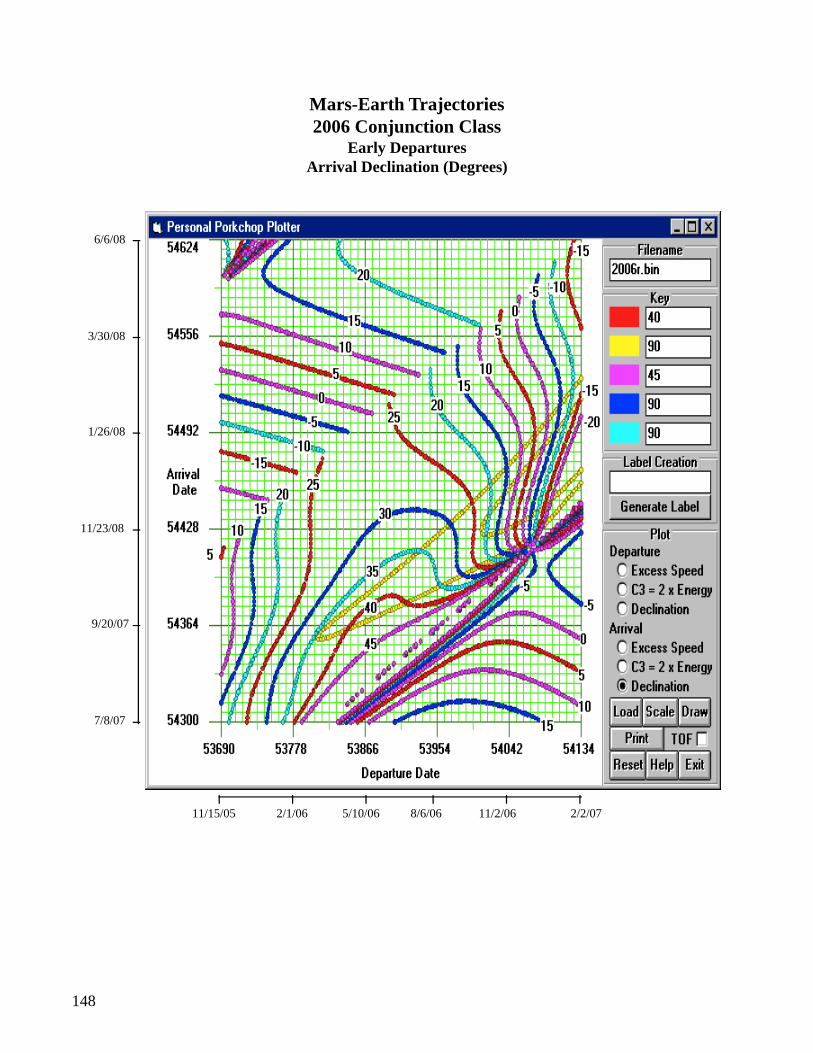
148
6/6/08
3/30/08
1/26/08
11/23/08
9/20/07
7/8/07
11/15/05 2/2/072/1/06 5/10/06 8/6/06 11/2/06
Mars-Earth Trajectories2006 Conjunction Class
Early DeparturesArrival Declination (Degrees)
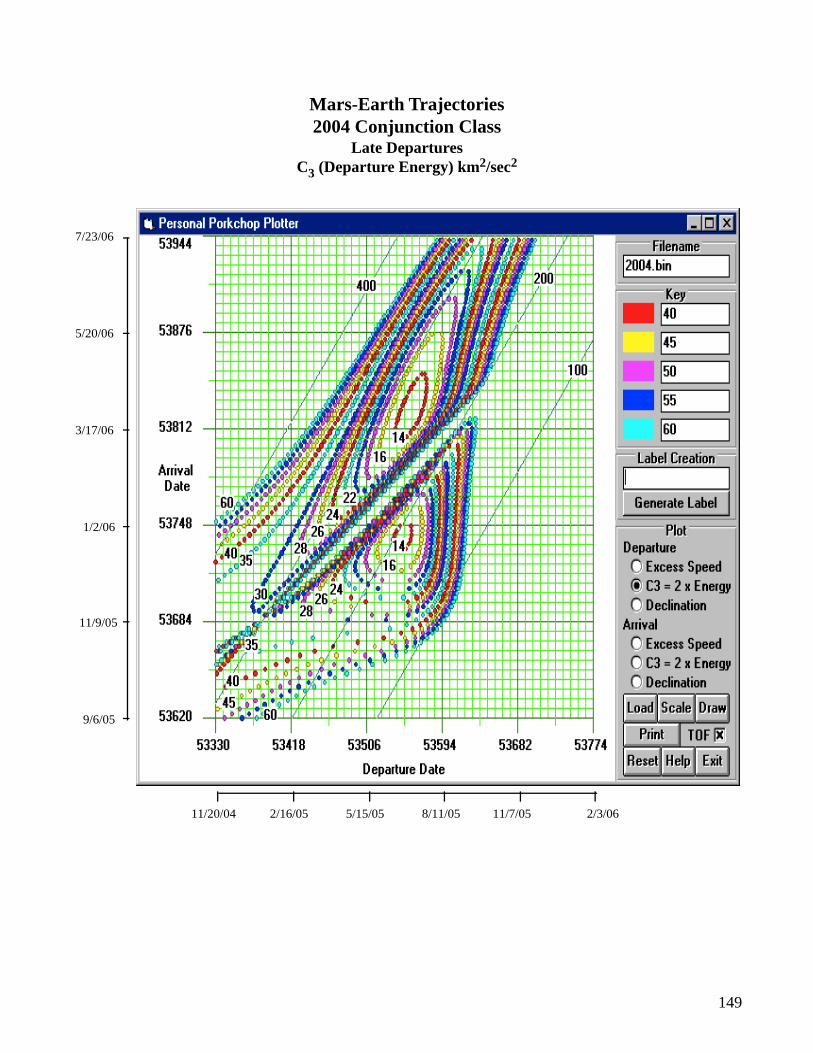
149
7/23/06
5/20/06
3/17/06
1/2/06
11/9/05
9/6/05
11/20/04 2/3/062/16/05 5/15/05 8/11/05 11/7/05
Mars-Earth Trajectories2004 Conjunction Class
Late DeparturesC3 (Departure Energy) km2/sec2
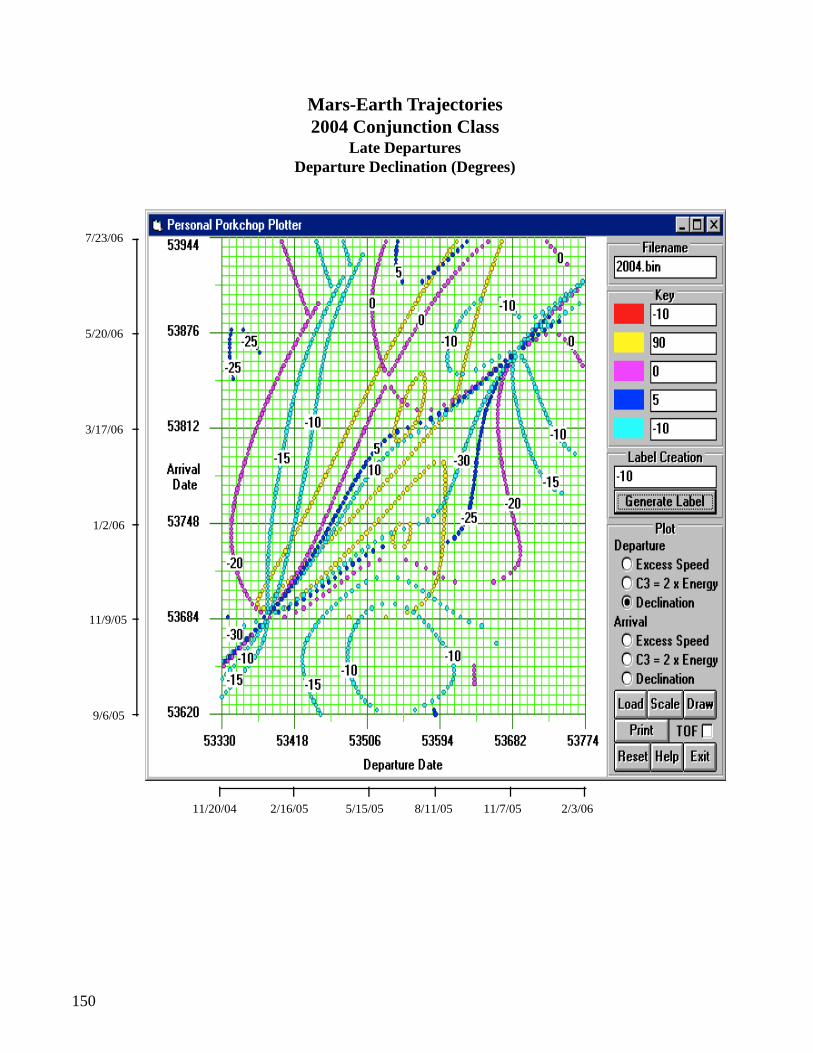
150
7/23/06
5/20/06
3/17/06
1/2/06
11/9/05
9/6/05
11/20/04 2/3/062/16/05 5/15/05 8/11/05 11/7/05
Mars-Earth Trajectories2004 Conjunction Class
Late DeparturesDeparture Declination (Degrees)
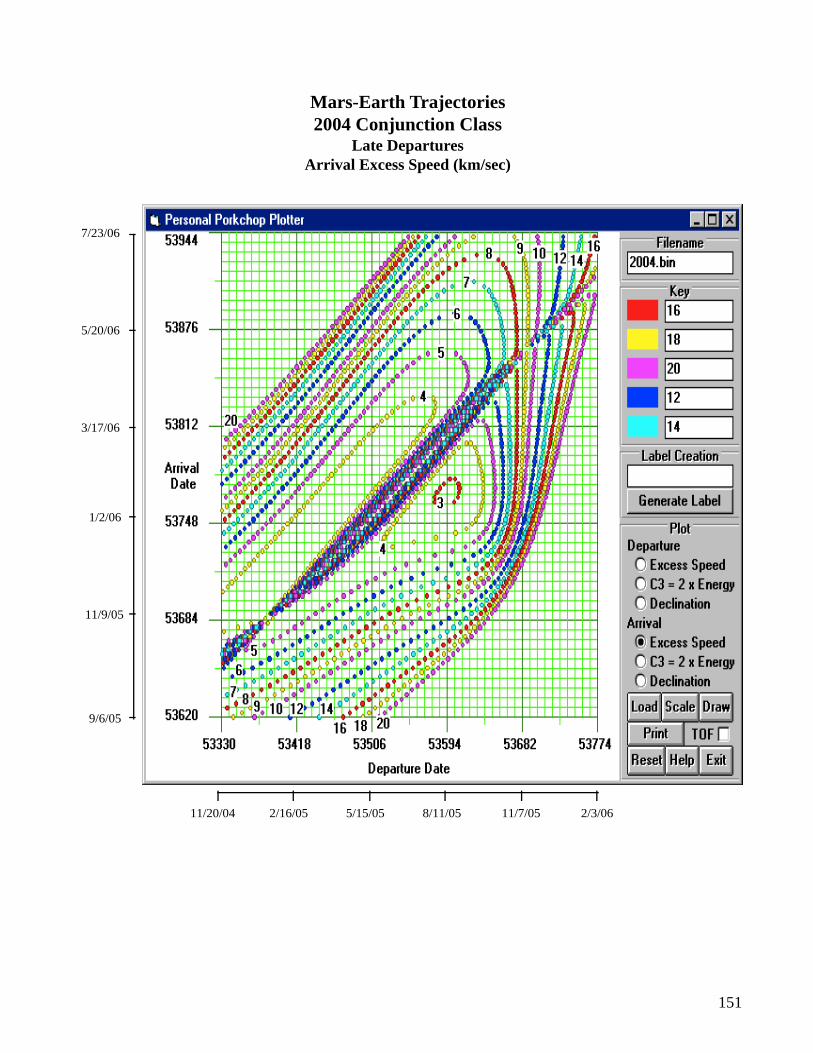
151
7/23/06
5/20/06
3/17/06
1/2/06
11/9/05
9/6/05
11/20/04 2/3/062/16/05 5/15/05 8/11/05 11/7/05
Mars-Earth Trajectories2004 Conjunction Class
Late DeparturesArrival Excess Speed (km/sec)
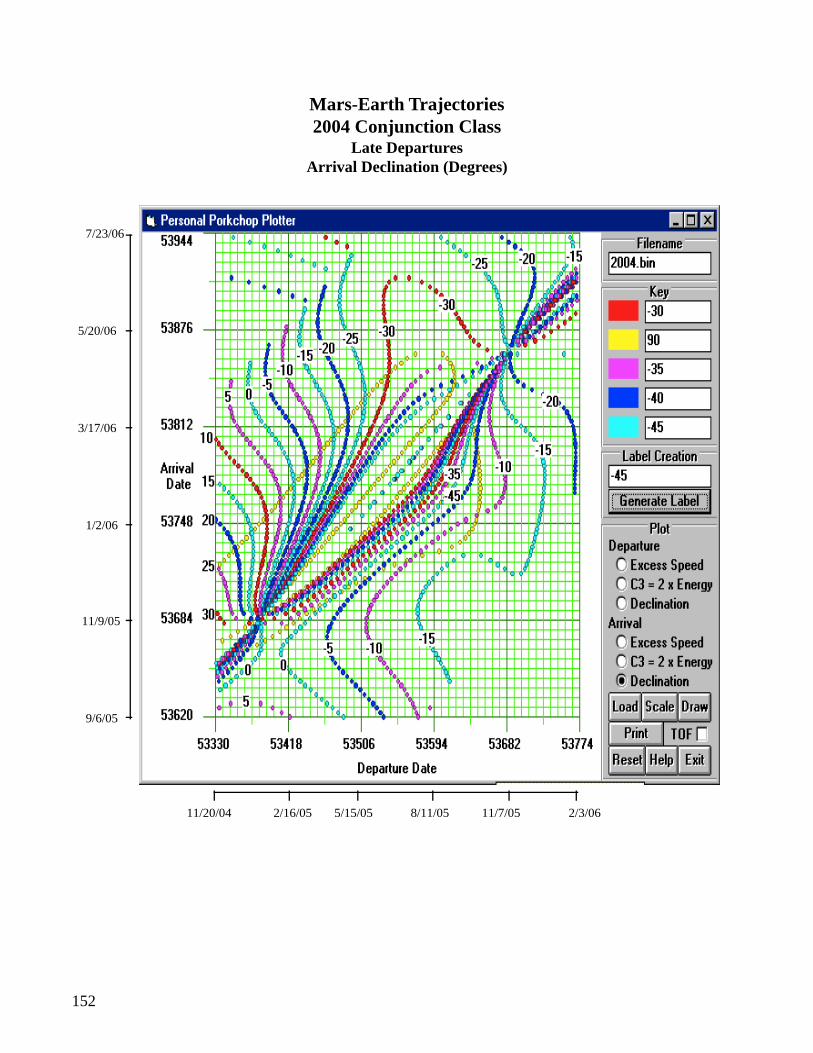
152
7/23/06
5/20/06
3/17/06
1/2/06
11/9/05
9/6/05
11/20/04 2/3/062/16/05 5/15/05 8/11/05 11/7/05
Mars-Earth Trajectories2004 Conjunction Class
Late DeparturesArrival Declination (Degrees)
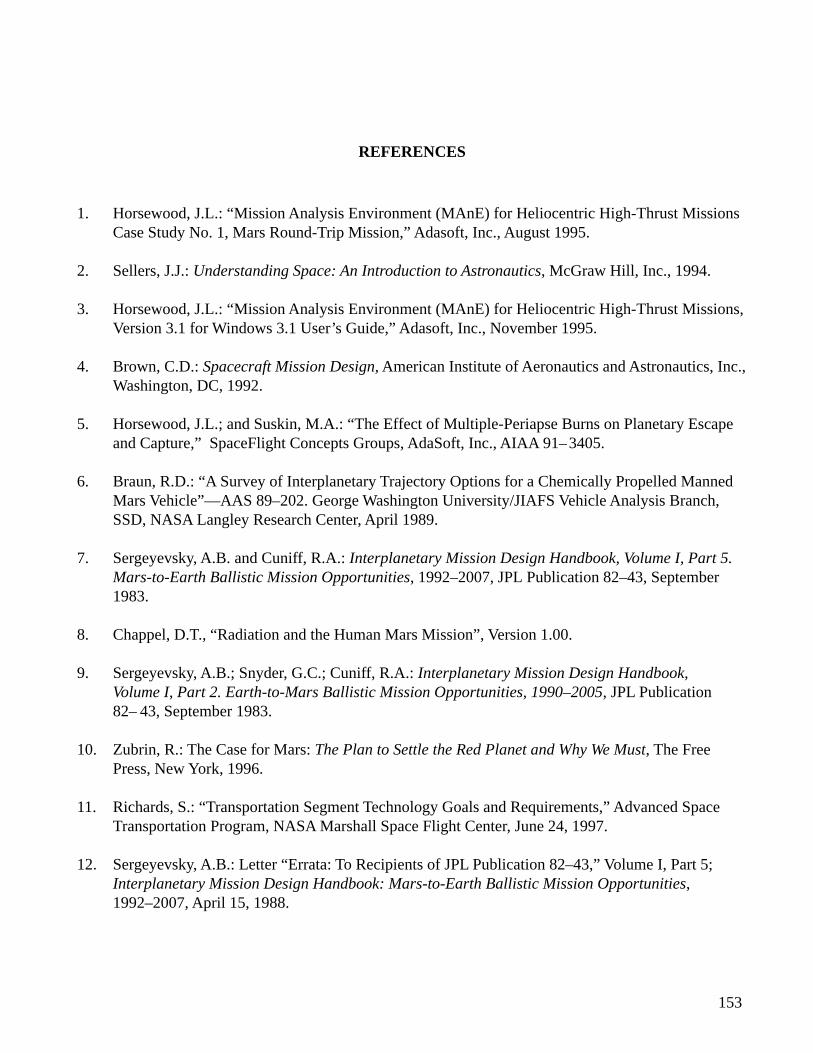
153
REFERENCES
1. Horsewood, J.L.: “Mission Analysis Environment (MAnE) for Heliocentric High-Thrust MissionsCase Study No. 1, Mars Round-Trip Mission,” Adasoft, Inc., August 1995.
2. Sellers, J.J.: Understanding Space: An Introduction to Astronautics, McGraw Hill, Inc., 1994.
3. Horsewood, J.L.: “Mission Analysis Environment (MAnE) for Heliocentric High-Thrust Missions,Version 3.1 for Windows 3.1 User’s Guide,” Adasoft, Inc., November 1995.
4. Brown, C.D.: Spacecraft Mission Design, American Institute of Aeronautics and Astronautics, Inc.,Washington, DC, 1992.
5. Horsewood, J.L.; and Suskin, M.A.: “The Effect of Multiple-Periapse Burns on Planetary Escapeand Capture,” SpaceFlight Concepts Groups, AdaSoft, Inc., AIAA 91–3405.
6. Braun, R.D.: “A Survey of Interplanetary Trajectory Options for a Chemically Propelled MannedMars Vehicle”—AAS 89–202. George Washington University/JIAFS Vehicle Analysis Branch,SSD, NASA Langley Research Center, April 1989.
7. Sergeyevsky, A.B. and Cuniff, R.A.: Interplanetary Mission Design Handbook, Volume I, Part 5.Mars-to-Earth Ballistic Mission Opportunities, 1992–2007, JPL Publication 82–43, September1983.
8. Chappel, D.T., “Radiation and the Human Mars Mission”, Version 1.00.
9. Sergeyevsky, A.B.; Snyder, G.C.; Cuniff, R.A.: Interplanetary Mission Design Handbook,Volume I, Part 2. Earth-to-Mars Ballistic Mission Opportunities, 1990–2005, JPL Publication82– 43, September 1983.
10. Zubrin, R.: The Case for Mars: The Plan to Settle the Red Planet and Why We Must, The FreePress, New York, 1996.
11. Richards, S.: “Transportation Segment Technology Goals and Requirements,” Advanced SpaceTransportation Program, NASA Marshall Space Flight Center, June 24, 1997.
12. Sergeyevsky, A.B.: Letter “Errata: To Recipients of JPL Publication 82–43,” Volume I, Part 5;Interplanetary Mission Design Handbook: Mars-to-Earth Ballistic Mission Opportunities,1992–2007, April 15, 1988.

154
155
APPROVAL
INTERPLANETARY MISSION DESIGN HANDBOOK:EARTH-TO-MARS MISSION OPPORTUNITIES AND
MARS-TO-EARTH RETURN OPPORTUNITIES 2004–2024
L.E. George and L.D. Kos
The information in this report has been reviewed for technical content. Review of any informa-tion concerning Department of Defense or nuclear energy activities or programs has been made by theMSFC Security Classification Officer. This report, in its entirety, has been determined to be unclassified.
______________________________________A. ROTH
DIRECTOR, PROGRAM DEVELOPMENT DIRECTORATE
156
REPORT DOCUMENTATION PAGE Form Approved OMB No. 0704-0188
Public reporting burden for this collection of information is estimated to average 1 hour per response, including the time for reviewing instructions, searching existing data sources,gathering and maintaining the data needed, and completing and reviewing the collection of information. Send comments regarding this burden estimate or any other aspect of thiscollection of information, including suggestions for reducing this burden, to Washington Headquarters Services, Directorate for Information Operation and Reports, 1215 JeffersonDavis Highway, Suite 1204, Arlington, VA 22202-4302, and to the Office of Management and Budget, Paperwork Reduction Project (0704-0188), Washington, DC 20503
1. AGENCY USE ONLY (Leave Blank)
17. SECURITY CLASSIFICATION OF REPORT
NSN 7540-01-280-5500 Standard Form 298 (Rev. 2-89)Prescribed by ANSI Std. 239-18298-102
14. SUBJECT TERMS
13. ABSTRACT (Maximum 200 words)
12a. DISTRIBUTION/AVAILABILITY STATEMENT
11. SUPPLEMENTARY NOTES
6. AUTHORS
7. PERFORMING ORGANIZATION NAMES(S) AND ADDRESS(ES) 8. PERFORMING ORGANIZATION REPORT NUMBER
9. SPONSORING/MONITORING AGENCY NAME(S) AND ADDRESS(ES) 10. SPONSORING/MONITORING AGENCY REPORT NUMBER
4. TITLE AND SUBTITLE 5. FUNDING NUMBERS
12b. DISTRIBUTION CODE
18. SECURITY CLASSIFICATION OF THIS PAGE
19. SECURITY CLASSIFICATION OF ABSTRACT
20. LIMITATION OF ABSTRACT
16. PRICE CODE
15. NUMBER OF PAGES
2. REPORT DATE 3. REPORT TYPE AND DATES COVERED
July 1998
Interplanetary Mission Design Handbook:Earth-to-Mars Mission Opportunities andMars-to-Earth Return Opportunities 2004–2024
L.E. George*L.D. Kos
George C. Marshall Space Flight CenterMarshall Space Flight Center, Alabama 35812
National Aeronautics and Space AdministrationWashington, DC 20546–0001
*U.S. Air Force Academy, Colorado Springs, ColoradoPrepared by the Preliminary Design Office, Program Development Directorate
Mars, Mars mission(s), trajectories, mission opportunities, interplanetarymissions, interplanetary orbits, interplanetary trajectories
Unclassified Unclassified Unclassified Unlimited
162
A08
Unclassified—UnlimitedSubject Category 13Nonstandard Distribution
NASA/TM—1998–208533
M–881
Technical Memorandum
This paper provides information for trajectory designers and mission planners to determine Earth-Mars and Mars-Earth mission opportunities for the years 2009–2024. These studies were performed in support of a human Mars mission scenario that will consist of two cargo launches followed by a piloted mission during the next opportunity approximately 2 years later. “Porkchop” plots defining all of these mission opportunities are provided which include departure energy, departure excess speed, departure declination arrival excess speed, and arrival declinations for the mission space surrounding each opportunity. These plots are intended to be directly applicable for the human Mars mission scenario described briefly herein. In addition, specific trajectories and several alternate trajectories are recommended for each cargo and piloted opportunity. Finally, additional studies were performed to evaluate the effect of various thrust-to-weight ratios on gravity losses and total time-of-flight tradeoff, and the resultant propellant savings and are briefly summarized.

![Hierarchical Adaptive Kalman Filtering for Interplanetary [3, · 2017-07-28 · after the Mars Pathfinder mission [14]. The results for this problem show that the proposed hierarchy](https://img.pdfslide.us/doc/110x75/5f257f3f0c5b7e1068273785/hierarchical-adaptive-kalman-filtering-for-interplanetary-3-2017-07-28-after.jpg)