Embed Size (px)
Citation preview

ORI GIN AL PA PER
Interpersonal behaviour styles of primary educationteachers during science lessons
Darrell Fisher • Perry den Brok • Bruce Waldrip • Jeffrey Dorman
Received: 18 March 2009 / Accepted: 28 August 2009 / Published online: 16 December 2011� The Author(s) 2011. This article is published with open access at Springerlink.com
Abstract This study reports the first development in Australia of primary science teacher
typologies of teacher–student interpersonal behaviour, which was measured by students’
perceptions using the Questionnaire on Teacher Interaction (QTI). Earlier work with the
QTI in The Netherlands has revealed eight different interpersonal styles, which were later
confirmed with an American sample of secondary-school teachers and which were similar
to types found with Australian secondary-school science teachers. The present study
investigated the extent to which typologies found in earlier studies also apply to primary
teachers. A cluster analysis was used to determine Australian typologies and to compare
these with earlier findings. Prior typologies could only be partially confirmed, and the
found typology of six styles was able to explain variance in both student outcomes and
perceptions of cultural elements of the learning environment.
Keywords Primary education � Student perceptions of teacher behaviour �Teacher–student interpersonal behaviour � Teaching profile � Typology
D. FisherScience and Mathematics Education Centre, Curtin University,Kent Street, Bentley, WA 6102, Australiae-mail: [email protected]
P. den Brok (&)Eindhoven School of Education, Eindhoven University of Technology,P. O. Box 513, Traverse 3.46, 5600 MB Eindhoven, The Netherlandse-mail: [email protected]
B. Waldrip � J. DormanFaculty of Education, Monash University (Gippsland Campus), Northways Road,Churchill, VIC 3842, Australiae-mail: [email protected]
J. Dormane-mail: [email protected]
123
Learning Environ Res (2011) 14:187–204DOI 10.1007/s10984-011-9093-z

Introduction
Recent reviews (e.g. Fraser 1998, 2002, 2007; Fraser and Walberg 2005) have demon-
strated the importance of the field of classroom environment research, particularly the use
of student perceptions, and how this field has contributed much to the understanding and
improvement of student outcomes. One common finding in this field is the enormous
variety in students’ (and teachers’) perceptions of the learning environment generally and
of perceptions of teacher behaviour specifically as part of this environment (Fraser 2007).
This variety can partly be explained by student-related factors that affect perceptions (such
as gender, ethnic background, age), class and school factors (such as school type,
denomination, location, class size, grade level, subject matter) and also teacher factors
(gender, ethnic background, age, experience) (den Brok et al. 2006; Fisher et al. 2006;
Fraser 2007; Levy et al. 2003; Wubbels et al. 2006). Research has also shown that
differences between classes in terms of the learning environment that remain after taking
into account all of the aforementioned factors are systematic and can be captured in
terms of classroom profiles or typologies (den Brok et al. 2006; Rickards et al. 2005;
Telli et al. 2007b; Wubbels and Brekelmans 1998; Wubbels et al. 2006; Wubbels and
Levy 1993). Many of these profiles were established within one particular strand of
learning environments research, namely, research on the teacher–student interpersonal
relationship, and used one particular instrument to map this behaviour, the Questionnaire
on Teacher Interaction (QTI; Wubbels et al. 1985).
Profiles are of importance to both researchers and teacher (educators), as explained by
Rickards et al. (2005, p. 268):
Teacher reflection on their own and their students’ perceptions of teaching may be
further enhanced if information containing these perceptions is presented in various
ways (Wubbels 1992). Images or profiles are one of these alternative ways of presenting
such information, next to written information on item, scale or (higher order) dimension
scores. Images and profiles are powerful tools for reflection because they can be used to
conceptualise complex and interrelated information (as is the case with the teacher–
student relationship), because they can summarise information into (smaller) chunks
that are easier to comprehend, and because they can stimulate associations and links
within the teachers’ own knowledge if they are accompanied with powerful labels
(e.g. Copeland et al. 1993; Weber and Mitchell 1996; Wubbels 1992).
The present study investigated interpersonal profiles of Australian primary-school
teachers while teaching science—using the Australian primary version of the QTI. There
were several reasons for undertaking this study. There is some research that suggests
different teacher–student interpersonal behaviour exists in primary education compared
with secondary education. Speering and Rennie (1996), for example, stated that, in primary
education, classroom climate often is more cooperative and caring, whereas classroom
climate in secondary education is more academically-oriented, fragmented and competi-
tive. According to these researchers, students perceive their teachers in primary education
often as more cooperative and report better contact with their teachers. Their findings seem
to be supported by research conducted in primary education with the QTI showing student
perceptions of higher teacher influence and proximity compared with secondary education
(e.g. den Brok et al. 2005; Ferguson and Fraser 1998). An interesting question is whether
these trends are also reflected in the present study. If this is the case, it is not unthinkable
that interpersonal profiles will be found that complement known established profiles or that
are variants of these known profiles (Wubbels et al. 2006, see also the next section on
188 Learning Environ Res (2011) 14:187–204
123

teacher–student interpersonal behaviour and interpersonal profiles). Finally, typologies in
previous studies were judged by the amount of variance that they could explain in the
scores on the QTI and by differences resulting from classroom observations. However, in
most studies, no check was made of whether the new typology could explain significant
amounts of variance in student outcomes or other learning environment elements. Such a
check would add to current research into associations between student outcomes and the
two interpersonal dimensions of influence and proximity, because profiles capture the
interaction between the two dimensions in a comprehensive and non-linear manner—rather
than treating them as separate, linear entities—and therefore provide a less fragmented
picture in explaining outcomes.
Research on teacher–student interpersonal profiles is also important for a number of
general reasons:
• Teachers with different interpersonal profiles show different capacity and effectiveness
in classroom management (Wubbels et al. 1988, 2006).
• Teachers with different profiles differ in the degree to which they are able to stimulate
students in the classroom, the degree to which they differentiate their teaching in terms
of teaching methods and the degree to which they provide clear instructions
(Brekelmans et al. 2000; den Brok 2001; Wubbels et al. 2006; Wubbels and Levy 1993).
• Teachers with different profiles differ in the degree to which they are able to motivate
students in their subject or in the degree to which they stimulate achievement (Wubbels
and Brekelmans 1998; Wubbels et al. 2006).
• Teachers with different profiles differ in terms of satisfaction with the profession, the
chance to experience burn-out or the chance to leave the profession (Ben-Chaim and
Zoller 2001; Wubbels and Levy 1993).
Teacher–student interpersonal behaviour and interpersonal profiles
The conceptualisation of teacher–student interpersonal behaviour used in the present study
has been described by Wubbels and Levy (1993) more completely and is only summarised
here. Students’ perceptions are studied with the Leary-based (1957) Model for Interper-
sonal Teacher Behaviour (Wubbels et al. 1985) which describes interpersonal teacher
behaviour along two dimensions: Influence (DS, Dominance-Submission) and Proximity(CO, Cooperation-Opposition). The Influence dimension represents the degree of domi-
nance or control displayed by the teacher, while Proximity describes the level of coop-
eration between teacher and students. The two dimensions can be represented in a
coordinate system divided into eight equal sectors (see Fig. 1). The sectors are labelled
DC, CD and so on according to their position on the graph. The sectors of the model
describe eight different behaviour types: Leadership, Helpful/Friendly, Understanding,
Student Freedom, Uncertain, Dissatisfied, Admonishing and Strict.
The Questionnaire on Teacher Interaction (QTI) was developed in The Netherlands in
1984 to gather student and teacher perception data (Wubbels et al. 1985) based on the Model
for Interpersonal Teacher Behaviour. Research with the QTI has resulted in a vast and
evolving knowledge base on teacher–student interpersonal behaviour (Fraser 1998; Levy
et al. 2003; Wubbels and Brekelmans 1998; Wubbels et al. 2006). The QTI has been reliably
and extensively used in a host of countries, such as The Netherlands, Australia, the USA,
Israel, Korea, Singapore, Brunei, Indonesia and India, among many others (Wubbels et al.
2006).
Learning Environ Res (2011) 14:187–204 189
123

Using data gathered with the QTI, researchers in The Netherlands conducted cluster
analyses to derive a typology of interpersonal teaching styles of secondary education
teachers (e.g. Brekelmans et al. 1993a; Wubbels et al. 1987). The typology found was
further validated by observations in classrooms that revealed qualitative differences
between each of the eight resulting types. For example, observations of Tolerant-
Authoritative teachers in secondary education showed the following picture (Brekelmans
et al. 1993a, p. 50; for descriptions of observations of the other profiles, see Wubbels et al.
2006):
Tolerant and Authoritative teachers maintain a structure which supports student
responsibility and freedom. They use a variety of methods, to which students respond
well. They frequently organize their lessons around small group work. While the
class environment resembles that of the Authoritative teacher, the Tolerant-
Authoritative teacher develops closer relationships with students. They enjoy the
class and are highly involved in most lessons. Both students and teacher can
occasionally be seen laughing, and there is very little need to enforce the rules.
The teacher ignores minor disruptions, choosing instead to concentrate on the
lesson. Students work to reach their own and the teacher’s instructional goals with
little or no complaints.
A graphical display of the eight types is presented in Fig. 2. The interpersonal profiles
have been labelled as Directive, Authoritative, Tolerant-Authoritative, Tolerant, Uncer-
tain-Tolerant, Uncertain-Aggressive, Repressive and Drudging.
The eight types can be characterised by means of the two dimensions in the Model for
Interpersonal Teacher Behaviour (see Fig. 3). The Authoritative, Tolerant-Authoritative
and Tolerant profiles are patterns in which students perceive their teachers relatively high
on the Proximity Dimension, with the Tolerant type lowest on the Influence Dimension.
Fig. 1 The model for interpersonal teacher behaviour
190 Learning Environ Res (2011) 14:187–204
123

Less cooperative than the three previous types are the Directive, Uncertain-Tolerant, and
Drudging profiles, with the Uncertain-Tolerant type lowest on the Dominance Dimension.
The least cooperative pattern of interpersonal relationships is demonstrated by the
Repressive and Uncertain-Aggressive types. Repressive teachers are the most dominant of
all eight types.
The eight interpersonal types have also been linked to student outcomes (Brekelmans
et al. 1993a). Repressive teachers, followed by Tolerant and Directive teachers, realised
highest cognitive achievement. The lowest cognitive achievement was found in classes of
Uncertain-Tolerant and Uncertain-Aggressive teachers. The highest motivation has been
found in classes of Authoritative, Tolerant-Authoritative and Directive teachers, while the
Directive Authoritative Tolerant-Authoritative Tolerant
Uncertain- Tolerant
Uncertain-Aggressive
Repressive Drudging
Fig. 2 Graphic representations of the eight types of patterns of interpersonal relationships
1,5
1
-1,5
-1
Dr
Di A TA
T
R
UT
UA
D
C
S
O
Fig. 3 The eight interpersonal profiles positioned on the two interpersonal dimensions
Learning Environ Res (2011) 14:187–204 191
123

lowest motivation occurred in classes of Drudging and Uncertain-Aggressive teachers. The
pattern found for the Tolerant-Authoritative teachers approximates the image of the ‘best’
or ‘ideal’ teacher (Wubbels and Levy 1993).
Because students’ (and teachers’) perceptions on the QTI comprise observations over
a longer period of time, interpersonal styles (and therefore the typology) are rather
stable. Nevertheless, different profiles can be found in different classes of teachers (e.g.
Wubbels and Levy 1993) and teachers seem to change from type to type over their
teaching careers (e.g. Brekelmans et al. 2005). Major types during the student teaching
period are the Tolerant and Tolerant-Uncertain profiles. Authoritative and Tolerant-
Authoritative profiles can be found more often after 2 years of experience in teaching.
Towards the end of the teaching career the number of teachers with Repressive profiles
increases. No differences in profiles have been reported between male and female
teachers.
The eight typical profiles originally found in Dutch samples were confirmed in a USA
sample (Wubbels and Levy 1993), and appeared to be similarly distributed over the
population of teachers. When Telli et al. (2007a) conducted cluster analyses on student
perception data of Turkish secondary science teachers with a sample of 7,484 students in
278 classes, they found different interpersonal profiles. The most common—in terms of the
original typology—were the Authoritative and Tolerant-Authoritative teachers (with
88 classes, 31.7% each and 63.4% in total). These were followed by Directive teachers
(69 classes, 24.8%). Other types were found in considerably smaller numbers compared
with the first three. The results of the cluster analyses showed that the best and most
distinctive typology found in the data consisted of six types that were labelled Tolerant-
Directive, Tolerant-Authorative (with a higher score for strict than the original),
Uncertain-Tolerant (with a higher amount of leadership and lower amount of student
freedom than the original), Directive, Authoritative and Repressive. However, many
teachers in this typology could be classified in terms of the original USA/Dutch typology.
Because the Turkish typology explained similar or lower amounts of variance in
QTI scales and dimensions, and because profiles to a large degree corresponded with the
original typology, it seemed that the original typology also applied to the Turkish context.
Rickards et al. (2005) investigated interpersonal styles with Australian secondary
education science teachers with a sample of 6,148 students. Their study showed a number
of interesting results. In the Australian sample, several profiles were less common, such as
the Tolerant, Uncertain-Aggressive and Uncertain-Tolerant types, whereas other profiles
were much more common, such as the Authoritative and Tolerant-Authoritative types.
According to the authors, these findings reflected a lower presence of uncertainty in
Australian teachers’ behaviour and a higher degree of respect and formality compared with
Dutch or American classrooms. The results of their analyses provided support for the
existence of a relatively replicable typology of seven distinct interpersonal patterns. Four
out of the seven types in the Australian sample resembled earlier constructed types to such
a degree that they were considered similar: Tolerant-Authoritative, Authoritative, Directive
and Uncertain-Aggressive. However, three new profiles were found. One of these seemed
to be a clear-cut combination of two existing types and was labelled as Directive-
Authoritative. The two remaining types seemed unique to the Australian context and were
labelled as Flexible and Cooperative-Supportive. These last two types were characterised
by large amounts of helping/friendly and understanding behaviours, and moderately high
amounts of both leadership and student freedom behaviours. The three new Australian
profiles (secondary education) are displayed in Fig. 4.
192 Learning Environ Res (2011) 14:187–204
123

Research objectives
The objectives of this study were to investigate:
• the distribution of interpersonal profiles (as used in prior research) for a large sample of
Australian primary-school teachers
• whether a specific Australian typology of interpersonal teacher behaviour for primary
education exists and to what degree it resembles typologies found in earlier research
• associations between the primary education typology, students’ enjoyment of their
science lessons and their perceptions of other learning environment elements (here the
cultural climate in their classroom).
The last research question was added because research investigating associations
between interpersonal profiles and outcomes or other teacher behaviours is relatively
scarce (see Introduction section for some exceptions) and usually concerns teaching
methods or teacher regulation strategies. Because the data set analysed for the present
study originated from a larger national teacher professional development project, it con-
veniently contained data on student perceptions of cultural dimensions of their classroom;
this opportunity was taken to add a new perspective to the current knowledge base on
interpersonal profiles.
Method
Sample
The study involved 2,178 students in 103 years 5, 6 and 7 primary classrooms in three
Australian states. The survey was administered to the sample to collect information on
students’ perceptions of their teachers’ interpersonal behaviour when teaching science,
perceptions of the cultural climate of the classroom and students’ enjoyment of their
science lessons.
From the sample, only students (and classes) with complete data on all instruments were
used in analyses. Because data on students’ perceptions of teacher–student interpersonal
behaviour were not available for 23 classes, data from the remaining 80 classes (1,697
students) were used for achieving the research objectives. A t test comparing ratings of
student enjoyment and cultural dimensions of the classroom between the selected and
Directive-Authoritative Flexible Cooperative-Supportive
Fig. 4 Three original Australian interpersonal types (secondary science)
Learning Environ Res (2011) 14:187–204 193
123

non-selected classes showed that the non-selected classes had statistically significant
lower ratings of enjoyment (t = -6.45, p \ 0.01) but higher ratings of equity (t = 2.06,
p \ 0.025) and congruence (t = 2.60, p \ 0.01) in the classroom. The selected classes did
not differ in terms of student gender or grade level; however, they did come from a small
number of schools (equally spread across the different states).
Of the students included in the analyses, 51.4% were female. Also, 32.7% were Grade 5
students, 32.1% were in Grade 6 and the remainder of the students (35.3%) were in Grade
7. No information is available on how representative this sample is of the Australian
primary education population of students.
Instrumentation
Teacher–student interpersonal behaviour
Data about the perceptions of students of their teachers’ interpersonal behaviour were
gathered by means of the QTI, which has demonstrated high validity and reliability in
various countries (e.g. den Brok 2001; Wubbels and Levy 1993). The Australian primary
education version of the QTI was distributed among the students. This version consists of
48 items which are answered on a five-point frequency scale. These items are divided into
eight scales which conform to the eight sectors of the model. The Australian version of the
QTI has shown adequate reliability and validity, both for primary and secondary education
students (e.g. den Brok 2001; Fraser 2002; Wubbels and Levy 1993).
For the present sample, reliability (Cronbach’s alpha) of the QTI scales ranged from
0.60 to 0.81 for the student level and from 0.80 to 0.92 for the class level (see Table 1). We
analysed the perceptions of the teacher–student relationship on the basis of dimension
scores (linear combinations of the eight scale scores): an Influence score and a Proximity
score (see Wubbels and Brekelmans 2005). The higher these scores are, the more influence
or proximity was perceived in the behaviour of a teacher. The intra-class correlation ranged
between 0.15 and 0.28 for QTI scales, was 0.18 for Influence and was 0.32 for Proximity.
These results suggest that the instrument is capable of distinguishing between Australian
primary education classes.
The construct validity of the Australian primary education QTI was investigated in a
number of ways. First, an exploratory factor analysis (maximum likelihood, rotation by
hand; e.g. den Brok 2001) was conducted on the (aggregated) scale scores in order to see
whether two dimensions (or factors) were present in the data. This analysis indicated that
Table 1 Cronbach’s alpha coef-ficient at the student and classlevels and intraclass correlationsfor QTI scales
Each scale contains 6 items
Scale a reliability Intra-classcorrelation
Student Class
DC—Leadership 0.68 0.80 0.15
CD—Helpful/friendly 0.81 0.90 0.22
CS—Understanding 0.80 0.92 0.20
SC—Student freedom 0.72 0.83 0.20
SO—Uncertain 0.61 0.81 0.15
OS—Dissatisfied 0.69 0.88 0.22
OD—Admonishing 0.74 0.90 0.28
DO—Strict 0.60 0.82 0.22
194 Learning Environ Res (2011) 14:187–204
123

two factors with eigenvalues larger than 1.0 could be extracted. These two factors
explained 78.5% of the variance. Factor loadings could be interpreted in terms of a
Proximity dimension (first factor) and an Influence dimension (second factor). The scales
of Helping/Friendly and Understanding were closely located on the interpersonal circle
indicating an overlap, and a similar finding occurred for Dissatisfied and Admonishing.
Secondly, to further explore whether the MITB (Model for Interpersonal Teacher
Behaviour) applied to the data, multilevel confirmatory factor analyses (with Mplus) were
conducted. Two models were tested, an ideal interpersonal circumplex model (e.g. Fab-
rigar et al. 1997; Gaines et al. 1997), exactly representing Fig. 1, and an irregular cir-cumplex model (a model with two, independent dimensions and free factor loadings e.g.
Fabrigar et al. 1997; Gaines et al. 1997). These confirmatory factor analyses (Mplus)
indicated that the ideal circumplex model displayed moderate fit (v2 = 189.87 with df (26)
and p-value of 0.00; CFI = 0.97; TLI = 0.93; RMSEA = 0.06 and SRMR (between) =
0.17). The irregular circumplex model with two uncorrelated dimensions and scales
ordered in a circle with free positions on circumplex showed satisfying fit (v2 = 81.23 with
df (15) and p = 0.00; CFI = 0.99; TLI = 0.95; RMSEA = 0.05; SRMR (between) =
0.09).
Thirdly, the correlation between the two dimensions of Influence and Proximity was
statistically nonsignificant (0.04) and in line with model assumptions (e.g. Fabrigar et al.
1997).
Students’ science-related attitudes
To assess students’ attitude to their class, a seven-item scale based on the Test of Science-
Related Attitudes (TOSRA; Fraser 1981) was devised (Fisher et al. 1997). The TOSRA
scale Enjoyment of Science Lessons (Fraser 1981) was chosen for this study. It has been
shown that enjoyment (or pleasure) is strongly related to other attitudinal concepts and
elements, such as relevance, confidence, interest and effort (e.g. den Brok 2001). Thus, the
more enjoyment that students experience in science, the more relevance that they attach to
science for their future education and occupation, the more confidence that they have in
performing well in science, the more interested that they are in science, and the more effort
that they are willing to invest into learning science. For the Enjoyment scale, a Cronbach
alpha of 0.88 was found at the student level and of 0.95 at the class level. On a scale of 0–1,
the average score was 0.68 and the standard deviation was 0.20. The ICC was 0.20,
indicating that about 20% of the variance was at the class (and school) levels.
Cultural learning environment
Fisher and Waldrip (1999, 2002) developed the Cultural Learning Environment Ques-
tionnaire (CLEQ) specifically to assess cultural factors of the classroom learning envir-
onment. This questionnaire contains 35 items in seven scales: Equity, Collaboration,
Deference, Competition, Teacher Authority, Modelling and Congruence. Each scale
contains five items that are responded to on a five-point scale. Students are asked to
indicate to what extent they agree that each item describes their classroom. The CLEQ has
been shown to be a valid and reliable instrument (Dhindsa 2005; Dhindsa and Fraser 2004;
Fisher and Waldrip 1999). It was decided to modify the CLEQ for use in primary schools
in this study. Part of this modification involved a reduction in the number of scales to three,
namely, Equity, Collaboration and Congruence, to alleviate workload for the students.
These scales were selected because they were consistent predictors of students’ attitudes
Learning Environ Res (2011) 14:187–204 195
123
and cognitive achievement in previous research using the questionnaire (Fisher and
Waldrip 2002). Therefore, the CLEQ (primary) contained 15 items which had been con-
struct and content validated by teachers, students and fellow researchers. Given the fact
that the CLEQ was originally devised for secondary education students, it was decided to
elaborately establish validity and reliability for the present study conducted in primary
education. First, a factor analysis was conducted on the 15 CLEQ items at the class level.
This analysis indicated that three factors with an eigenvalue larger than 1.0 could be
extracted, explaining 68.0% of the variance. A varimax rotation of the factor loadings
indicated that most of the items conformed to their a priori scales (see the Appendix). As a
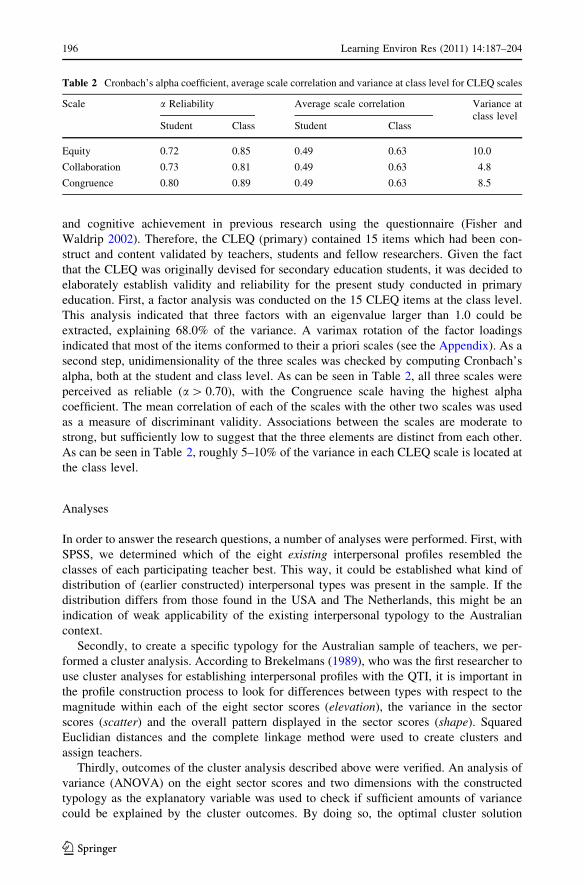
second step, unidimensionality of the three scales was checked by computing Cronbach’s
alpha, both at the student and class level. As can be seen in Table 2, all three scales were
perceived as reliable (a[ 0.70), with the Congruence scale having the highest alpha
coefficient. The mean correlation of each of the scales with the other two scales was used
as a measure of discriminant validity. Associations between the scales are moderate to
strong, but sufficiently low to suggest that the three elements are distinct from each other.
As can be seen in Table 2, roughly 5–10% of the variance in each CLEQ scale is located at
the class level.
Analyses
In order to answer the research questions, a number of analyses were performed. First, with
SPSS, we determined which of the eight existing interpersonal profiles resembled the
classes of each participating teacher best. This way, it could be established what kind of
distribution of (earlier constructed) interpersonal types was present in the sample. If the
distribution differs from those found in the USA and The Netherlands, this might be an
indication of weak applicability of the existing interpersonal typology to the Australian
context.
Secondly, to create a specific typology for the Australian sample of teachers, we per-
formed a cluster analysis. According to Brekelmans (1989), who was the first researcher to
use cluster analyses for establishing interpersonal profiles with the QTI, it is important in
the profile construction process to look for differences between types with respect to the
magnitude within each of the eight sector scores (elevation), the variance in the sector
scores (scatter) and the overall pattern displayed in the sector scores (shape). Squared
Euclidian distances and the complete linkage method were used to create clusters and
assign teachers.
Thirdly, outcomes of the cluster analysis described above were verified. An analysis of
variance (ANOVA) on the eight sector scores and two dimensions with the constructed
typology as the explanatory variable was used to check if sufficient amounts of variance
could be explained by the cluster outcomes. By doing so, the optimal cluster solution
Table 2 Cronbach’s alpha coefficient, average scale correlation and variance at class level for CLEQ scales
Scale a Reliability Average scale correlation Variance atclass level
Student Class Student Class
Equity 0.72 0.85 0.49 0.63 10.0
Collaboration 0.73 0.81 0.49 0.63 4.8
Congruence 0.80 0.89 0.49 0.63 8.5
196 Learning Environ Res (2011) 14:187–204
123

(in terms of the number of types) could be established. In order to interpret findings,
outcomes of the Australian classification were also represented graphically in terms of the
eight sector or scale scores.
Fourth, analyses of variance were conducted on class aggregated scores for Enjoyment
of Science Lessons and perceptions of Equity, Collaboration and Congruence with the new
and old typology as the explanatory variable. This way, it could be checked whether the old
and new typologies explained similar amounts of variance in these variables and which
profiles showed highest, and lowest scores. A qualitatively distinct set of profiles should be
able to explain similar or higher amounts of variance than the existing set of profiles, in
order to be of significant (research) value. Finally, differences in class size, percentage of
girls in the classroom and grade level were determined between the profiles in order to see
whether any distinctive trends could be found in the data, and therefore help to explain
some of the findings for the first three research objectives.
Results
Distribution of existing profiles
Based on scale scores, teachers were classified in terms of the existing, eightfold typology
of interpersonal styles. The percentages of teachers belonging to each type are reported in
Table 3 and compared with the results of previous studies.
When compared with previous findings, our results showed that 83.6% of the teachers
belonged to the first three types (Directive, Authoritative or Tolerant-Authoritative). More
Drudging, Authoritative and Tolerant-Authoritative teachers and less Uncertain-Aggres-
sive, Uncertain, Tolerant teachers were found in this primary education sample as com-
pared to a Dutch (secondary) sample. However, apart from different proportions of
Repressive and Authoritative teachers, a similar distribution was found with the primary
education Australian sample as with the secondary Australian teachers.
The Brekelmans et al. (1993a) typology explained between 41.7% (Uncertain) and
80.3% (Dissatisfied) of the variance in scale scores. Also, it explained 17.3% of the
variance in Influence and 87.7% of the variance in Proximity.
Table 3 Percentages of teachersbelonging to interpersonal pro-files in the present study and inprevious (QTI) studies (absolutenumber of teachers betweenbrackets)
a Rickards et al. (2005)b Brekelmans et al. (1993a)
Interpersonal type Australianprimary
Australiansecondarya
Dutch samplesecondaryb
% n % %
Directive 22.4 18 15.5 18.2
Authoritative 25.0 20 37.5 14.9
Tolerant-Authoritative 36.2 29 33.9 10.4
Tolerant 6.3 5 6.0 23.5
Uncertain-Tolerant 1.3 1 1.4 15.3
Uncertain-Aggressive 0.0 – 1.1 6.5
Repressive 3.8 3 0.7 3.2
Drudging 5.0 4 3.9 0.3
Unable to classify – – – 7.7
Total 100.0 80 100.0 100.0
Learning Environ Res (2011) 14:187–204 197
123

Creating a new typology
Using cluster analysis (squared Euclidian distances, complete linkage method), cluster
solutions between three and 10 types were tested. With more than six clusters in the
solution, the last clusters consisted of one or two classes with less typical profiles. With
less than six clusters, the solutions explained little variance in scales or dimensions and
some clusters seemed to contain much within-type variation. Based on these findings, a
cluster solution with six different types was chosen. The cluster solution explained 17.1%
of the variance in Influence and 90.8% of the variance in Proximity. Also, it explained
between 44.3% (Uncertain) and 82.4% (Dissatisfied) of the variance in scale scores. These
percentages are slightly higher than for the original typology (between 40.6 and 80.0%).
Nevertheless, the new typology explained slightly less variance in Influence compared to
the old typology (22.8%), but slightly more variance in Proximity (old typology 87.7%).
Figure 5 provides a graphical display of the six types found.
Type 1 is a combination of the Directive and Tolerant-Authoritative teacher and seems
to be a new profile. It contains similar amounts of Leadership, Helpful/Friendly and
Understanding from the original Directive teacher profile, but has higher amounts of
Student Freedom (actually the amount to be found with the Tolerant-Authoritative tea-
cher). On the other hand, this profile has more Strictness and Admonishing than can be
found in the original Directive profile. This profile is labelled as a Directive-Authoritative
teacher.
Type 2 closely resembles the Supportive profile from the Rickards et al. (2005)
typology. It comes closest to the original Tolerant teacher (Brekelmans et al. 1993b) but
has a much higher amount of student freedom and a somewhat lower amount of uncertainty
compared with the Tolerant teacher.
Type 3 is labelled as the Supportive-Demanding teacher because it resembles best the
Rickards et al. (2005) Supportive teacher, but contains higher amounts of strictness. Thus,
it has all the hallmarks of the Tolerant teacher, with higher amounts of Student Freedom
Directive-Authoritative
Proximity
Supportive
Proximity
Supportive-Demanding
Proximity
Tolerant-Authoritative
Proximity
Drudging
Proximity
Repressive
Influence Influence Influence
Influence Influence Influence
Proximity
Fig. 5 Graphical profile of the six types of the cluster solution
198 Learning Environ Res (2011) 14:187–204
123

and lower amounts of Uncertainty than the Tolerant teacher, but with higher amounts of
Strictness than the original Supportive teacher. It seems to combine characteristics of the
Tolerant-Authoritative, Tolerant and Directive teachers from the original Brekelmans et al.
typology.
Type 4 seems to resemble the Tolerant-Authoritative teacher from the original Bre-
kelmans typology most closely, although it has a slightly higher amount of tolerance
(in particular Student Freedom) compared with the original Tolerant-Authoritative teacher.
The Tolerant-Authoritative teacher is the most common profile found in the present study.
Types 5 and 6 resemble the Drudging and Repressive teachers from the original Bre-
kelmans typology. The Repressive teacher (type 6) has the lowest amount of Proximity (it
is the only type with a negative amount of Proximity) and the highest amount of Influence
of all six types found. The Drudging type has the second lowest (but slightly positive)
amount of Proximity and a medium amount of Influence compared with the other five
types.
In Table 4, the percentages of occurrence of each of the six types are displayed. As can
be seen, the Tolerant-Authoritative profile is most common, followed by the Directive-
Authoritative profile and the Supportive profile. Drudging teachers were least common in
the sample.
Interpersonal profiles and other classroom environment variables
For each of the six new interpersonal profiles, the mean amount of Enjoyment, Equity,
Collaboration and Congruence (as well as the variance) was computed. The results of this
analysis are presented in Table 5.
The results show that, in the classes of Tolerant-Authoritative teachers, students enjoyed
their classes more than did other types. The students in the classrooms of Drudging
teachers had the least Enjoyment. The cluster solution of six types explained 22.6% of the
variance in Enjoyment. This percentage is a little higher than the amount of variance
explained by the original typology (which was 20.0%).
As for Equity, it appears that this was perceived to be highest in Supportive classes,
followed by Tolerant-Authoritative classes. Teachers with Drudging profiles were per-
ceived lowest in terms of Equity. The new typology explained 7.8% of the variance in
Equity, which was lower than the amount of variance explained by the old typology
(18.1%). Supportive teachers were perceived highest on Collaboration, while Supportive-
Demanding teachers were perceived lowest on Collaboration. The old typology explained
16.5% of the variance in Collaboration, whereas the new typology explained 25.6%. As for
Congruence, Tolerant-Authoritative teachers and Supportive teachers were perceived
highest with respect to this learning environment element, Drudging teachers were
Table 4 Percentage frequencyof occurrence of the new clusterprofiles
Cluster type (new) % f
Directive-Authoritative 20.0 16
Supportive 15.0 12
Supportive-Demanding 12.5 10
Tolerant-Authoritative 30.0 24
Drudging 10.0 8
Repressive 12.5 10
Total 100.0 80
Learning Environ Res (2011) 14:187–204 199
123
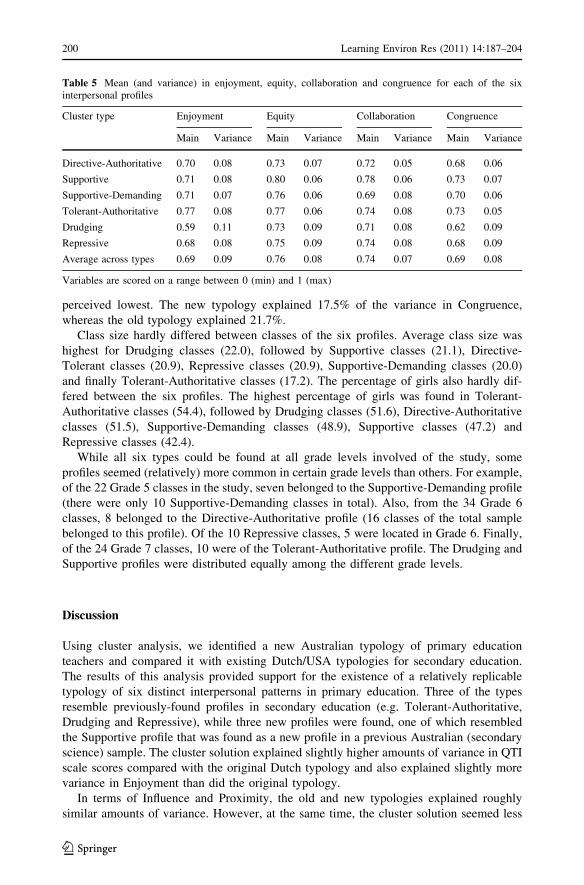
perceived lowest. The new typology explained 17.5% of the variance in Congruence,
whereas the old typology explained 21.7%.
Class size hardly differed between classes of the six profiles. Average class size was
highest for Drudging classes (22.0), followed by Supportive classes (21.1), Directive-
Tolerant classes (20.9), Repressive classes (20.9), Supportive-Demanding classes (20.0)
and finally Tolerant-Authoritative classes (17.2). The percentage of girls also hardly dif-
fered between the six profiles. The highest percentage of girls was found in Tolerant-
Authoritative classes (54.4), followed by Drudging classes (51.6), Directive-Authoritative
classes (51.5), Supportive-Demanding classes (48.9), Supportive classes (47.2) and
Repressive classes (42.4).
While all six types could be found at all grade levels involved of the study, some
profiles seemed (relatively) more common in certain grade levels than others. For example,
of the 22 Grade 5 classes in the study, seven belonged to the Supportive-Demanding profile
(there were only 10 Supportive-Demanding classes in total). Also, from the 34 Grade 6
classes, 8 belonged to the Directive-Authoritative profile (16 classes of the total sample
belonged to this profile). Of the 10 Repressive classes, 5 were located in Grade 6. Finally,
of the 24 Grade 7 classes, 10 were of the Tolerant-Authoritative profile. The Drudging and
Supportive profiles were distributed equally among the different grade levels.
Discussion
Using cluster analysis, we identified a new Australian typology of primary education
teachers and compared it with existing Dutch/USA typologies for secondary education.
The results of this analysis provided support for the existence of a relatively replicable
typology of six distinct interpersonal patterns in primary education. Three of the types
resemble previously-found profiles in secondary education (e.g. Tolerant-Authoritative,
Drudging and Repressive), while three new profiles were found, one of which resembled
the Supportive profile that was found as a new profile in a previous Australian (secondary
science) sample. The cluster solution explained slightly higher amounts of variance in QTI
scale scores compared with the original Dutch typology and also explained slightly more
variance in Enjoyment than did the original typology.
In terms of Influence and Proximity, the old and new typologies explained roughly
similar amounts of variance. However, at the same time, the cluster solution seemed less
Table 5 Mean (and variance) in enjoyment, equity, collaboration and congruence for each of the sixinterpersonal profiles
Cluster type Enjoyment Equity Collaboration Congruence
Main Variance Main Variance Main Variance Main Variance
Directive-Authoritative 0.70 0.08 0.73 0.07 0.72 0.05 0.68 0.06
Supportive 0.71 0.08 0.80 0.06 0.78 0.06 0.73 0.07
Supportive-Demanding 0.71 0.07 0.76 0.06 0.69 0.08 0.70 0.06
Tolerant-Authoritative 0.77 0.08 0.77 0.06 0.74 0.08 0.73 0.05
Drudging 0.59 0.11 0.73 0.09 0.71 0.08 0.62 0.09
Repressive 0.68 0.08 0.75 0.09 0.74 0.08 0.68 0.09
Average across types 0.69 0.09 0.76 0.08 0.74 0.07 0.69 0.08
Variables are scored on a range between 0 (min) and 1 (max)
200 Learning Environ Res (2011) 14:187–204
123

effective in explaining differences between classes in Equity, Collaboration and Congru-
ence than did the old typology. It should be noted that some profiles in the old typology
could be found in only 1 or 2 classes, which could have resulted in relatively large
differences between them with respect to some associating variables, while profile dis-
tribution was much more equivalent in the new typology. As a result, one or two classes
could have affected the results of the old typology much more strongly than they did in the
new typology. Also, even though some percentages of explained variance were lower, they
were still considerable (up to 20%), suggesting that the typology is useful in explaining
other learning environment elements and student outcomes as well.
The results of this study again confirmed that earlier classifications only partially apply
to the Australian primary education situation. Moreover, the fact that only some of the
previous profiles found in secondary education emerged for this sample seemed to suggest
that teachers in primary education actually do have different interpersonal styles compared
with secondary education teachers and that they realise different types of classroom
climates. In particular, we found a high number of (teachers with) profiles with high
Proximity, which is in line with previous work (e.g. den Brok et al. 2005; Ferguson and
Fraser 1998; Speering and Rennie 1996).
While the findings of this study seem to indicate that additional styles might be nec-
essary to describe the interpersonal climate in Australian primary education classes, future
research is needed to verify these findings. No explanation could be provided, or was
sought in this study, for the emergence of new teacher profiles. Also, teachers participated
on a voluntary basis, which could have limited the range of interpersonal profiles found
compared with what actually might be present in the population of primary science
teachers in Australia. One indication for this was the fact that the selected classes had
higher Enjoyment scores than classes excluded from the analyses because of missing data
for perceptions of teacher–student interpersonal behaviour. In addition, no information was
available with respect to the representativeness of our sample.
The outcomes of this study are important for both researchers and teachers. The results
of this study show that there are several teaching styles that incorporate high amounts of
both Influence and Proximity, properties which in the past have been associated with high
scores for cognitive and affective student outcomes (Wubbels et al. 2006). Nevertheless,
because distinctive differences exist between each of these styles, which range from
Repressive to Supportive, teachers and educators should develop sensitivity and skill to
distinguish between them. Such competencies might help in providing teachers with more
detailed and adequate feedback and showing teachers that there are several ways to achieve
their goals in the classroom.
For researchers and teachers alike, it is important to verify the stability of our findings
and to provide more suggestions and explanations for differences between our findings and
those in earlier work. Such research should also include qualitative data, such as interviews
and observations of both teacher and student participants, in order to provide descriptions
for newly-found types and to validate the labels attached to them. Moreover, such
observations could also verify descriptions of existing types that have been found to apply
to the Australian setting. While profiles might be similar in different cultures, it might very
well be that they are based on different behaviours and situations, or inferred from different
observational cues.
Open Access This article is distributed under the terms of the Creative Commons Attribution Noncom-mercial License which permits any noncommercial use, distribution, and reproduction in any medium,provided the original author(s) and source are credited.
Learning Environ Res (2011) 14:187–204 201
123

Appendix
References
Ben-Chaim, D., & Zoller, U. (2001). Self-perception versus students’ perceptions of teachers’ personal stylein college science and mathematics courses. Research in Science Education, 31, 437–454.
Brekelmans, M. (1989). Interpersonal teacher behaviour in the classroom. [In Dutch]. Utrecht, TheNetherlands: W.C.C.
Brekelmans, M., Levy, J., & Rodriguez, R. (1993a). A typology of teacher communication style. In T.Wubbels & J. Levy (Eds.), Do you know what you look like? (pp. 46–55). London: Falmer Press.
Brekelmans, M., Sleegers, P., & Fraser, B. (2000). Teaching for active learning. In R. J. Simons, J. van derLinden, & T. Duffy (Eds.), New learning (pp. 227–242). Dordrecht, The Netherlands: Kluwer.
Brekelmans, M., Wubbels, T., & Levy, J. (1993b). Student performance, attitudes, instructional strategiesand teacher-communication style. In T. Wubbels & J. Levy (Eds.), Do you know what you look like?(pp. 56–63). London: Falmer Press.
Brekelmans, M., Wubbels, T., & van Tartwijk, J. (2005). Teacher-student relationships across the teachingcareer. International Journal of Educational Research, 43, 55–71.
Copeland, W. D., Birmingham, C., de la Cruz, E., & Lewin, B. (1993). The reflective practitioner inteaching: Toward a research agenda. Teaching and Teacher Education, 9(4), 347–359.
Item wording and factor loadings for each item of the CLEQ used in the present study
Item Item wording Factor loadings
F1 F2 F3
Eq1 I like it when my work receives as much praise asother students’ work.
0.642 0.403
Eq2 I like to get the same amount of help from the teacheras do other students.
0.544
Eq3 I like to have the same amount of say in this classas other students.
0.851
Eq4 I like to be treated the same as other students in this class. 0.822
Eq5 I like it when I get the same chance to answer questionsas other students.
0.746
Col1 I like working in groups. 0.860
Col2 I feel that it is important for the class to work togetheras a team.
0.422 0.498 0.524
Col3 I would rather decide what to do as a group than to makea decision by myself.
0.669
Col4 It is important for me to be involved in class discussions. 0.591 0.440
Col5 I like to work with other students. 0.762
Con1 What I learn at home helps me to do things at school. 0.787
Con2 What I learn in school helps me to do things at home. 0.743
Con3 I feel that ideas I learn at school are similar to thoseI learn at home.
0.813
Con4 What I learn in this class agrees with what I learn at home. 0.776
Con5 What I learn in this class helps me at home. 0.494 0.695
Eq Equity, Col Collaboration, Con Congruence, F1 Factor loadings on factor analysis for factor 1, F2 Factorloadings of factor 2, F3 Factor loadings of factor 3. Only factor loadings larger than 0.4 are displayed
202 Learning Environ Res (2011) 14:187–204
123

den Brok, P. (2001). Teaching and student outcomes. Utrecht, The Netherlands: W. C. C.den Brok, P., Fisher, D., Rickards, T., & Bull, E. (2006). Californian secondary students’ perceptions of their
classroom learning environments. Educational Research and Evaluation, 12(1), 3–25.den Brok, P., Fisher, D., & Scott, R. (2005). The importance of teacher interpersonal behaviour for student
attitudes in Brunei primary science classes. International Journal of Science Education, 27(3),765–779.
Dhindsa, H. S. (2005). Cultural learning environment of upper secondary students. International Journal ofScience Education, 27(5), 575–592.
Dhindsa, H. S., & Fraser, B. J. (2004). Culturally-sensitive factors in teacher trainees’ learning environ-ments. Learning Environments Research, 7, 165–181.
Fabrigar, L. R., Visser, P. S., & Browne, M. W. (1997). Conceptual and methodological issues in testing thecircumplex structure of data in personality and social psychology. Personality and Social PsychologyReview, 1, 184–203.
Ferguson, P. D., & Fraser, B. J. (1998). Changes in learning environment during the transition from primaryto secondary school. Learning Environments Research, 1(3), 369–383.
Fisher, D., den Brok, P., & Rickards, T. (2006). Factors influencing students’ perceptions of their teachers’interpersonal behaviour: A multilevel analysis. In D. L. Fisher & M. S. Khine (Eds.), Contemporaryapproaches to research on learning environments: World views (pp. 51–74). Singapore: WorldScientific.
Fisher, D., Rickards, T., Goh, S., & Wong, A. (1997). Perceptions of interpersonal teacher behavior insecondary science classrooms in Singapore and Australia. Journal of Applied Research in Education,1(2), 2–11.
Fisher, D. L., & Waldrip, B. G. (1999). Cultural factors of science classroom learning environments,teacher–student interactions and student outcomes. Journal of Science Education and Technology,17(1), 83–96.
Fisher, D. L., & Waldrip, B. G. (2002). Measuring culturally sensitive factors of classroom learningenvironments with the CLEQ. In S. C. Goh & M. S. Khine (Eds.), Studies in educational learningenvironments: An international perspective (pp. 27–48). Singapore: World Scientific.
Fraser, B. J. (1981). Test of science-related attitudes. Melbourne, Australia: Australian Council forEducational Research.
Fraser, B. J. (1998). Science learning environments: Assessment, effects and determinants. In B. J. Fraser &K. Tobin (Eds.), International handbook of science education (pp. 527–564). Dordrecht, TheNetherlands: Kluwer.
Fraser, B. J. (2002). Learning environments research: Yesterday, today and tomorrow. In S. C. Goh & M.S. Khine (Eds.), Studies in educational learning environments: An international perspective (pp. 1–27).Singapore: World Scientific.
Fraser, B. J. (2007). Classroom learning environments. In S. K. Abell & N. G. Lederman (Eds.), Handbookof research on science education (pp. 103–125). London: Routledge.
Fraser, B. J., & Walberg, H. J. (2005). Classroom learning environments: Retrospect, context and prospect.International Journal of Educational Research, 43, 103–109.
Gaines, S. O., Panter, A. T., Lyde, M. D., Steers, W. N., Rusbult, C. E., Cox, C. L., et al. (1997). Evaluatingthe circumplexity of interpersonal traits and the manifestation of interpersonal traits in interpersonaltrust. Journal of Personality and Social Psychology, 73, 610–623.
Leary, T. (1957). An interpersonal diagnosis of personality. New York: Ronald Press Company.Levy, J., den Brok, P., Wubbels, T., & Brekelmans, M. (2003). Students’ perceptions of interpersonal
aspects of the learning environment. Learning Environments Research, 6, 5–37.Rickards, T., den Brok, P., & Fisher, D. (2005). The Australian science teacher: A typology of teacher-
student interpersonal behaviour in Australian science classes. Learning Environments Research, 8,267–287.
Speering, W., & Rennie, L. (1996). Students’ perceptions about science: The impact of transition fromprimary to secondary school. Research in Science Education, 26(3), 283–298.
Telli, S., Cakirgolu, J., & den Brok, P. (2007a, August). The Turkish teacher: Profiles of teacher-studentinterpersonal behaviour in Turkish secondary science classes. Paper presented at the bi-annual meetingof the European Association for Research on Learning and Instruction, Budapest, Hungary.
Telli, S., den Brok, P., & Cakiroglu, J. (2007b). Students’ perceptions of science teachers’ interpersonalbehaviour in secondary schools: Development of the Turkish version of the Questionnaire on TeacherInteraction. Learning Environments Research, 10, 115–129.
Weber, S., & Mitchell, C. (1996). Drawing ourselves into teaching: Studying the images that shape anddistort teacher education. Teaching and Teacher Education, 12(3), 303–313.
Learning Environ Res (2011) 14:187–204 203
123

Wubbels, Th. (1992). Taking account of student teachers’ preconceptions. Teaching and Teacher Education,8(2), 137–149.
Wubbels, Th., & Brekelmans, M. (1998). The teacher factor in the social climate of the classroom. InB. J. Fraser & K. G. Tobin (Eds.), International handbook of Science education (pp. 565–580).London: Kluwer.
Wubbels, T., & Brekelmans, M. (2005). Two decades of research on teacher-student relationships in class.International Journal of Educational Research, 43, 6–24.
Wubbels, T., Brekelmans, M., den Brok, P., & van Tartwijk, J. (2006). An interpersonal perspective onclassroom management in secondary classrooms in the Netherlands. In C. Evertson & C. S. Weinstein(Eds.), Handbook of classroom management: Research, practice and contemporary issues(pp. 1161–1191). New York: Lawrence Erlbaum Associates.
Wubbels, T., Brekelmans, M., & Hermans, J. (1987). Teacher behavior: An important aspect of the learningenvironment. In B. J. Fraser (Ed.), The study of learning environments, Vol. 3 (pp. 10–25). Perth,Australia: Curtin University.
Wubbels, Th., Creton, H., & Holvast, A. J. C. D. (1988). Undesirable classroom situations. Interchange, 19,25–40.
Wubbels, T., Creton, H. A, & Hooymayers, H. P. (1985, April). Discipline problems of beginning teachers,interactional behavior mapped out. Paper presented at the annual meeting of the American EducationalResearch Association, Chicago.
Wubbels, T., & Levy, J. (1993). Do you know what you look like? London: Falmer Press.
204 Learning Environ Res (2011) 14:187–204
123