Embed Size (px)
Citation preview
Report on a Port-Based Projectto
Reduce Marine Debris
by
Fran Recht
Internship Report
Submitted to
Marine Resources Management ProgramCollege of OceanographyOregon State UniversityCorvallis, Oregon 97331
1988
In partial fulfillment ofthe requirements for the
degree of
Master of ScienceCommencement June 1989
Internship: Port of Newport, 600 SE Bay Blvd., Newport, Oregon
Funding: The port project and this report was funded by theMarine Entanglement Research Program of the NationalMarine Fisheries Service.
An Abstract of the Internship Report of Fran Rechtfor the degree of Master of Science in Marine Resources
Management presented on October 5, 1988
Title: Report on a Port-Based Project to Reduce Marine Debris
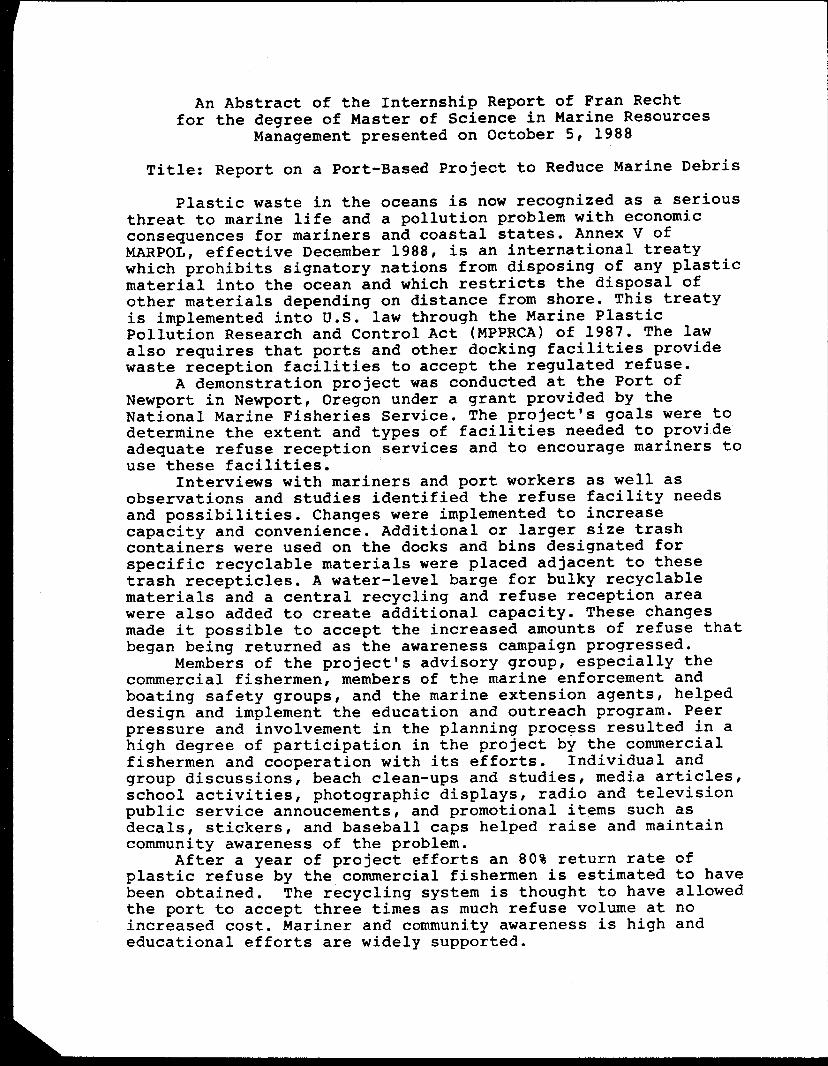
Plastic waste in the oceans is now recognized as a seriousthreat to marine life and a pollution problem with economicconsequences for mariners and coastal states. Annex V ofMARPOL, effective December 1988, is an international treatywhich prohibits signatory nations from disposing of any plasticmaterial into the ocean and which restricts the disposal ofother materials depending on distance from shore. This treatyis implemented into U.S. law through the Marine PlasticPollution Research and Control Act (MPPRCA) of 1987. The lawalso requires that ports and other docking facilities providewaste reception facilities to accept the regulated refuse.
A demonstration project was conducted at the Port ofNewport in Newport, Oregon under a grant provided by theNational Marine Fisheries Service. The project's goals were todetermine the extent and types of facilities needed to provideadequate refuse reception services and to encourage mariners touse these facilities.
Interviews with mariners and port workers as well asobservations and studies identified the refuse facility needsand possibilities. Changes were implemented to increasecapacity and convenience. Additional or larger size trashcontainers were used on the docks and bins designated forspecific recyclable materials were placed adjacent to thesetrash recepticles. A water-level barge for bulky recyclablematerials and a central recycling and refuse reception areawere also added to create additional capacity. These changesmade it possible to accept the increased amounts of refuse thatbegan being returned as the awareness campaign progressed.
Members of the project's advisory group, especially thecommercial fishermen, members of the marine enforcement andboating safety groups, and the marine extension agents, helpeddesign and implement the education and outreach program. Peerpressure and involvement in the planning process resulted in ahigh degree of participation in the project by the commercialfishermen and cooperation with its efforts. Individual andgroup discussions, beach clean-ups and studies, media articles,school activities, photographic displays, radio and televisionpublic service annoucements, and promotional items such asdecals, stickers, and baseball caps helped raise and maintaincommunity awareness of the problem.
After a year of project efforts an 80% return rate ofplastic refuse by the commercial fishermen is estimated to havebeen obtained. The recycling system is thought to have allowedthe port to accept three times as much refuse volume at noincreased cost. Mariner and community awareness is high andeducational efforts are widely supported.
Many of the lessons learned, such as the use ofrecycling to reduce solid waste disposal costs, the use of water-level refuse reception facilities, and the color coding of thesefacilities to improve visibility and convenience, will beapplicable to other ports and communities. In all ports it willbe important to involve the mariners in defining refuse facilityneeds and in encouraging peer awareness. The importance of a highvisibility media and community awareness campaign is alsogenerally applicable. These measures will help ports not onlycomply effectively with new regulations, but will allow them totake a leadership role in efforts to solve the marine debris
problem.
ACKNOWLEDGEMENTS
I am grateful to the many people from Oregon StateUniversity who have assisted me and enriched my learning.
I am indebted to Dr. Howard Horton and AssociateProfessor Jim Good for helping me to secure thisinternship position and for their encouragement,assistance, and warmth throughout my graduate studiesprogram. Dr. David Carlson's dedication to teaching and tolearning was a source of academic inspiration. I havebenefited from his willingness to apply his knowledgetowards positive change and help me do so as well. I owemuch thanks to Associate Professor Barry Fisher for hisadvocacy of both myself and the project. Without hischampionship neither the marine debris issue nor the portproject would have advanced so far.
The Oregon State University Extension Sea GrantProgram and the Hatfield Marine Science Center alsodeserve acknowledgement. Their personnel provided mephysical resources and support throughout my internshipproject. Special thanks are due to Marine Extension AgentsGinny Goblirsch and Bob Jacobson. Jake helped to establishcredibility and gain acceptance for the project. Theproject video would never have been accomplished withouthis support and well-placed urgings. Ginny's advicewas invaluable in making the project a successful one. Hersuggestions were always right on target and herencouragement often came at critical times.
The friendship and sharing of my fellow MRM studentsmade my time at the university a very pleasant andinteresting one.
Thank-you all.
PREFACE
A Marine Resources Management program internshiphandling garbage? You've got to be kidding. That was myinitial and unenthused reaction to the proposal.
Fortunately the opportunity was still around monthslater when I decided I'd give it a try. From January 1987until May of 1988 I served as the project manager for thePort of Newport's Marine Refuse Disposal Project(Project). The Project was funded by a grant from theNational Marine Fisheries Service Marine EntanglementResearch Program.
The grant proposal was written by Ginny Goblirsch andDr. Howard Horton from Oregon State University'sExtension/Sea Grant Program after a workshop held inNewport, Oregon in June 1986. The workshop broughttogether the National Marine Fisheries Service, the Portof Newport, the commercial fishing industry as representedby individuals, The Highliners, and Natural ResourcesConsultants, and Oregon State University's academiccommunity to discuss the marine debris problem and itsremedies. The objectives of a pilot port project werediscussed and refined in a round-table discussionconducted during this workshop.
This report, finished in August 1988, is one of theproducts of that grant. A video tape production and areference guide for ports (see information on page 22) areadditional products of the Project.

REPORT ON A PORT DASED PROJECT TO REDUCE MARINE DEBRIS
by Fran RechtProject Manager
Port of Newport600 SE Bay Blvd.Newport, Oregon 97365
Marine Refuse Disposal Project sponsored by:Marine Entanglement Research ProgramNorthwest and Alaska Fisheries CenterNational Marine Fisheries Service
National Oceanic and Atmospheric Administration7600 Sand Point Way NE, Seattle WA 98115
Cooperative Agreement Number NA86.,..A3R-00022
REPORT ON A PORT BASED PROJECT TO REDUCE MARINE DEBRIS
This report is dedicated to the fishermen of Newport,Oregon and to port harbormaster Bud Shoemake and crew,who created a remarkable model.
The author wishes to acknowledge the help and support ofthe Port of Newport, the members of the Marine RefuseDisposal Project Advisory Group, the Oregon State UniversityExtension/Sea Grant Program, the Marine Entanglement ResearchProgram, the Oregon State University Marine ResourcesManagement Program, and my friends.
Special thanks go to:Jim Boeder, Craig Cochran, Jim Coe, Bill Chrisler, FrankCrocker, Barry Fisher, Tom Gentle, Ginny Goblirsch, Jim Good,Dan Guthrie, Bill Hall, Jim Hatch, Howard Horton, BobJacobson, David Jincks, Bill Kunz, Sidney Lasseigne, PattyLittlehales, Robin Manning, Joe McNeill, Terry McNeill, WhitPatrick, Mike Pettis, Harris Recht, Judith Recht, Lee Reilly,Linda Reilly, Jim Robinson, Bud Shoemake, Billie Jo Smith,Dale Snow, Kojak Spears, Virginia Tardaewether, TerryThompson, Svein Waalen, Lillian Whitney, and George Wilhelmi.
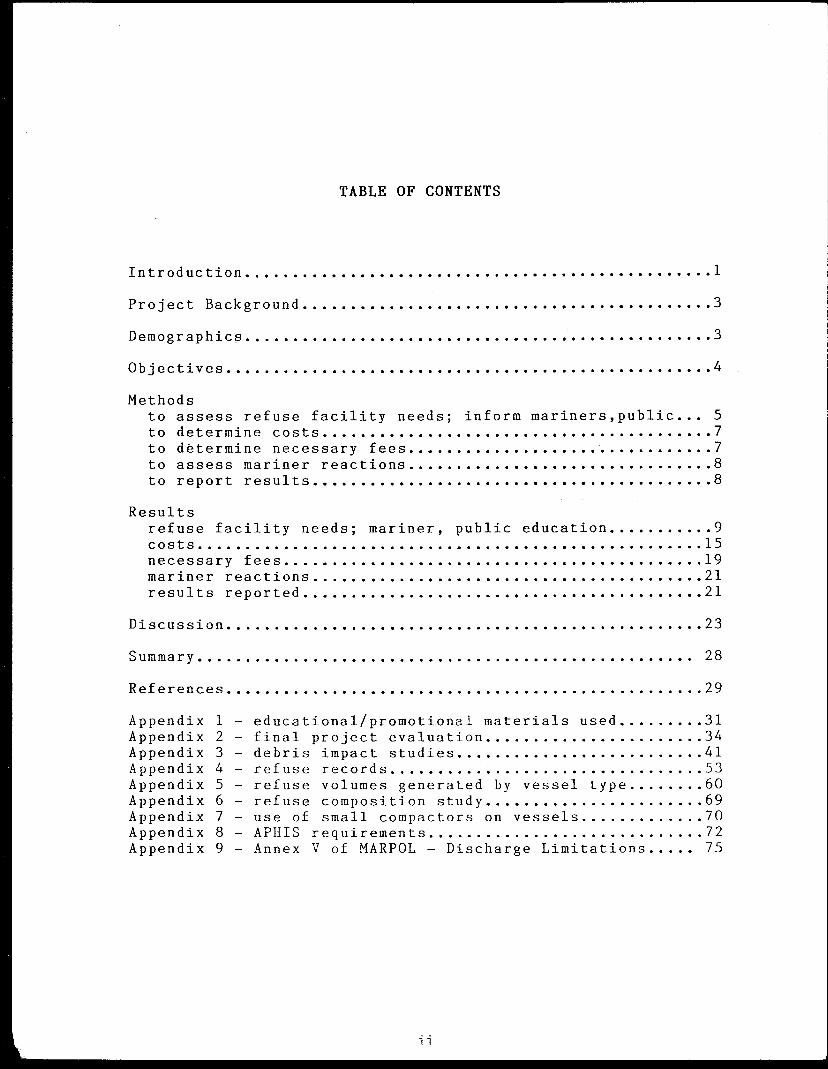
TABLE OF CONTENTS
Introduction 1
Project Background 3
Demographics 3
Objectives 4
Methodsto assess refuse facility needs; inform mariners,public... 5to determine costs 7to determine necessary fees 7to assess mariner reactions 8to report results 8
Resultsrefuse facility needs; mariner, public education 9costs 15necessary fees 19mariner reactions 21results reported 21
Discussion 23
Summary 28
References 29
Appendix 1Appendix 2Appendix 3Appendix 4Appendix 5Appendix 6Appendix 7Appendix 8Appendix 9
educational/promotional materials used 31final project evaluation 34debris impact studies 41refuse records 53refuse volumes generated by vessel type 60refuse composition study 69
- use of small compactors on vessels 70- APHIS requirements 72Annex V of MARPOL - Discharge Limitations 75
ii
INTRODUCTION
New U.S. law requires operators of port or dockingfacilities to provide adequate refuse reception facilities fortheir vessels. Failure to do so by December 1988, asdetermined by Coast Guard inspections, may result inrestriction or closure of port operations. The new law isentitled the Marine Plastic Pollution Research and Control Actof 1987 (MPPRCA) and implements the provisions of aninternational treaty called Annex V of MARPOL (TheInternational Convention for the Prevention of Pollution fromShips).
This harsh sounding measure is designed to end a seriousand pervasive ocean pollution problem-- plastic debris. Theconvenience of the ocean as a disposal site and the perceptionof the ocean as limitless have long made ocean disposal ofwastes common place. Only recently have the extent andeffects of this marine debris problem been recognized. In theearly 1970's the National Academy of Science estimated that6.4 million metric tons of garbage were being discarded intothe ocean each year from vessels alone (1). Each year as muchgarbage enters the oceans of the world as there are fishcaught in the United States!
A growing proportion of this garbage is plastic,virtually non-degradable in the ocean. Now even the ocean'svastness can't hide this persistent material. Even remotebeaches in the Arctic and surface waters in the middle of theoceans are littered with plastic items from cargo, petroleum,and fishing industry operations, as well as crew-generatedpackaging materials and the small plastic resin pellets fromwhich all other plastic items are manufactured (2).
Economic losses are experienced by mariners and livesare threatened when propellers are fouled with ropes, sheetingand nets, or when water intakes are blocked by plastic bagsand sheeting. These problems are well known to mariners andseem quite common. Three studies of problems related to debriswere conducted as part of the work of this project (seeAppendix 3). Of the 90 fishermen interviewed at a trade showheld in Seattle, Washington in 1987, 64% had experiencedvessel problems due to plastic debris and had incurred anaverage cost of $1910 for repairs and lost fishing time.Similarly, 58% of the 102 commercial fishermen interviewedin Newport, Oregon had debris related problems, with costsaveraging $2376 per vessel. Almost one out of every five ofthe 280 sports fishermen surveyed in Newport also reportedproblems with plastic garbage. The average repair bills forthese 52 boats were $92.
1
Other economic concerns are noted by coastal states suchas New Jersey and Texas as a growing amount of debris litterstheir beaches, causing losses in tourism revenues andrequiring many millions of dollars in clean-up efforts (3).
Though exact number are unavailable, it is commonlyestimated that a few million marine organisms, includingmarine mammals, sea turtles, sea birds, and fish die fromentanglement in or ingestion of plastic debris. Animals areentrapped in such common items as fish net, line, rope,cargo strapping bands, monofilament line, and six-pack loopconnectors. Items ingested include plastic bags, sheeting,plastic resin pellets, packing materials, small plasticitems such as cigarette lighters, and the pieces resultingfrom the disintegration of styrofoam and hard plastic items.
Some studies such as those done by Dr. Charles Fowler andothers for the National Marine Fisheries Service (NMFS) in thePribilof Islands of Alaska (4), indicate that entanglement maybe a principle cause of mortality for the threatened northernfur seal population whose numbers may decline by as many as50,000 animals a year. Other marine mammal populations may besimilarly effected. Entanglement of the protected brownpelicans in monofilament line is considered a major problem bythe U.S. Fish and Wildlife Service (5). In the North Pacific,entanglement of other sea birds such as auklets, puffins,murres, and shearwaters has been noted. Hundreds of sea birdsat a time have been observed entangled in lost or abandonedpieces of high seas gill nets (6). The entrapment of sea-turtles in pieces of net and line has also been documented(7).
Plastic items ar ingested by many marine organisms eithernon-selectively during normal feeding operations or by choicewhen plastic items are mistaken for their preferred fooditems. Large quantities of ingested plastic may causeintestinal blockage, may damage intestinal walls or maycause nutritional problems by creating a false feeling ofsatiation, or by reducing the absorption of nutrients (8,9).Studies conducted by Day and others show that at least 50 ofthe world's 280 sea bird species are known to ingest plastics(10). The Smithsonian Institute reports nine species ofwhales and dolphins known to have ingested plastic bags (11).NMFS studies also show that five species of sea turtles, allconsidered threatened or endangered, commonly ingest plasticbags and sheeting, apparently mistaking these items for theirjellyfish prey (12).
Because of international concern over these impacts,Annex V of MARPOL was ratified by the United States inDecember, 1987. Having received the required ratification by27 nations representing 50% of the world's shipping tonnage,Annex V of the treaty becomes binding in December, 1988. Itprohibits vessels from signatory nations from disposing of
2
any plastic material into the ocean (as well as othermaterials, depending on distance from shore and location, seeAppendix 9). It also requires that adequate refuse receptionfacilities be available in these nations' ports so thatvessels can dispose of these retained materials.
Restriction of disposal of plastic at sea coupled withconvenient means to get rid of this refuse upon return toport are basic to solving the marine debris problem.Education is also widely recognized as essential. Title II ofthe MPPRCA calls for an outreach program to educate boaters,fishermen, other users of the marine environment, and thegeneral public about plastic pollution and its effects andremedies. This public education program is to be coordinatedby the National Oceanic and Atmospheric Administration, theEnvironmental Protection Agency, and the U.S. Coast Guard.
PROJECT BACKGROUND
The NMFS Marine Entanglement Research Program realizedthat the nation's ports would play a crucial role in endingthe marine debris problem. In order to provide informationand guidance to ports, they funded a pilot port programrelated to the development of refuse reception facilities andmariner awareness.
The goals and outline for such a pilot project wererefined through the coordinated efforts of NMFS, West Coasttrawl fishermen, the Oregon State University Extension/SeaGrant Program and the Port of Newport. This project wasconducted at the Port of Newport, Newport, Oregon fromJanuary 1987 through March 1988. It was called "The MarineRefuse Disposal Project". NMFS granted a total of $97,000 andthe Port of Newport pledged $28,780 in—kind support to theproject.
DEMOGRAPHICS
Though the Port of Newport was relatively small in size,its diversity and activity were anticipated to be able toprovide experiences applicable to ports both larger andsmaller. Newport is a city of 8300 people located on thecentral Oregon coast. Commercial fishing is of primeimportance to the area's economy and is supported by manymarine industries and suppliers. This work brought $84million dollars in income to the local area in 1987 (13).Forestry, recreational fishing, and tourism also contributesignificantly to the area economy. The Port of Newport isimportant to all these industries. It supplies moorage andservices to between 200 and 800 commercial fishing vessels,operates a launch ramp and a 600 berth recreational vesselmarina which caters to about 1400 recreational fishermen
3
annually, and has a two-berth deep draft shipping terminalwhich loads 20 or more ships and barges with logs and lumberfor domestic and foreign markets. The commercial vesselmoorages, the recreational vessel marina, and the shippingterminals occupy physically distinct areas of the portproperty, and are managed separately.
Commercial fish landings in Newport are among thehighest on the West Coast. Between 26 and 48 million poundsof shrimp, groundfish, salmon, crab, tuna, and scallops aredelivered annually to the fish processing plants by trawlers,draggers, trollers, and pot fishermen. These fish are soldfor an ex-vessel value of between $9 and $21 million dollars(14). Additionally, Newport is a major port for the vesselsof the "Distant Water Fleet"- those trawl fishermen who fishin joint venture operations with foreign nations, principallyoff Alaska. In contrast to the commercial fleet, whosevessels are fished year round by community members, about 75%of the recreational fishermen live out of town, making use oftheir 'vessels predominantly during late spring through earlyfall weekends and vacation time.
OBJECTIVES
The objectives of the Marine Refuse Disposal Projectwere expressed in the grant proposal prepared in cooperationwith Oregon State University Extension/Sea Grant Program, andsubmitted by the Port of Newport to the NMFS MarineEntanglement Research Program. The Port was to establishconvenient refuse reception facilities and encourage the useof those facilities by educating port users and the communityabout the marine debris problem. The lessons learned whileconducting the project were to be reported in a manner whichwould allow other ports to budget and plan according to ourexperiences.
The grant outlined these objectives as five tasks:
Task 1Determine the extent and scheduling of the labor and
equipment needed and arrange these services so each vesselreturning to port has the opportunity to off-load itsnon-biodegradable refuse.
Develop an efficient system for vessels to communicatetheir needs to the waste management operators.
Undertake such advertising and annoucements as necessaryto notify mariners and the public of the purpose for and theavailability of the refuse reception services and toencourage their use.
4
Task 2Maintain a complete record of all services rendered and
expenses incurred in the set-up and operation of theprototype system.
Task 3Devise, but not enact, schedules of charges, taxes,
levees or other revenue generating mechanisms as may besuitable to pay for the refuse reception system.
Task 4Solicit and record vessel owner and operator reactions
to the system and its intent.
Task 5Provide NMFS with a detailed report of the entire
project such that other ports considering the development ofsimilar systems may derive maximum benefit from thisexperience.
METHODS
The methods which were used to accomplish these multipleobjectives were varied and are presented below according totask.
Task 1(Provide refuse reception services, assure mariner/port
communication, encourage awareness/use of services).
Annex V of MARPOL requires ports to provide adequaterefuse reception facilities for their vessels. As some refusereception facilities and services were already provided atthe Port of Newport, an assessment of the existing system wasneeded. We defined "adequate" in terms of service andcapacity: reception facilities should be located close to thevessels, be easy to find and use, and be able to accept thefull volume and types of non-degradable refuse that vesselsneeded to dispose of. As we identified the neededimprovements, we also kept in mind cost effectiveness.
The following methods were used to evaluate and improveour refuse system and solicit the input of mariners:
1. Discussed and analyzed refuse facility needs,problems, and improvement ideas with fishermen, port workers,and port management.
5
2. Identified refuse materials likely to be returned toport through discussions, observations or studies of refusecomposition, refuse volume and vessel refusehandling/containment methods.
3. Surveyed refuse handling costs and investigatedoptions by studying:
a. past refuse disposal cost records to understand andassess refuse volume and cost patterns.
b. costs for various types of containers and haulingschedules.
c. costs for the services provided by different refusecompanies and for different disposal options.
d. laws and regulations applicable to refuse service andhandling.
e. port labor involvement required by different options.
4. Identified ways to improve service, maximizeefficiency, minimize costs, and benefit community by:
d. surveying on hand equipment, labor, and port serviceswhich could be used to improve refuse service.
b. involving port personnel in efforts to planimprovements in services and facilities and keeprecords.
c. identifying and investigating the need, markets, andservices available for recycling and reusing wasteresources.
d. considering the efficiency of other handling/haulingoptions as the use of compactors, the use of theport's own garbage truck, or refuse sorting measures.
5. Investigated refuse handling services or potential atother places that serve mariners, e.g. fuel docks and fishprocessing plants or buying stations.
The following methods were used to inform and educateport users and the public about the marine debris problem andto motivate mariners to use the port refuse receptionfacilities:
1. Formed an advisory group whose members served toinform mariners and community members about the debris issueand generate peer pressure. Members were chosen to representport users, port management, extension, fish and wildlife,enforcement, and boating safety groups, as well as refuse andrecycling interests, the schools, and the community.
2. Encouraged the use of trash compactors and simplerefuse containers on board the vessels.
6
3. Prepared and distributed written information such aspress articles, signs, notices, letters, brochures, andresource lists.
4. Prepared and distributed visual and auditoryinformation such as radio and tv public service annoucements,posters, and photographic displays, and granted interviews toradio and tv programs.
5. Prepared and distributed promotional items such asdecals, stickers, clothing, and coloring books.
6. Encouraged dialogue and involvement through slideshows and presentations, survey taking, and discussions withport users.
7. Encouraged participation building/awarenessgenerating activities such as distributing posters andbrochures, speaking to peers, teaching classes, coordinatingand participating in beach clean—up activities and debrisstudies, evaluating and improving refuse facilities, andparticipating in media and promotional events.
8. Promoted interagency cooperation in marine debriseducational efforts by conducting presentations, providingideas and resources to encourage agency action, and bysupplying information for agency newsletters and activities.
9. Gave presentations, provided information andsuggested activities to involve and educate school childrenand their teachers.
Task 2(Keep complete records of the costs and services
involved).
Marine Refuse Disposal Project Activities were recordedby keeping daily records of activities, maintaining copies ofall work, bills, and correspondence, and by the preparationof periodic progress reports.
Task 3(Determine the charges necessary to recover costs).
Under interpretation of the MPPRCA of 1987, ports willbe allowed to recover the costs for setting up and operatingrefuse reception facilties. In order to assess what chargesmight be necessary, records of costs for the Port ofNewport's refuse reception facilities and services weregathered and analyzed on the basis of estimates of port use.
7
Task 4(Assess the reactions of mariners to refuse
system/intent).
Vessel owners were surveyed through the mail and vesselowners and operators were surveyed on the docks, with oraland written surveys to obtain their initial ideas andsuggestions and to solicit their responses as changes weremade. Reactions to the system were also solicited moreinformally by initiating discussions with port users on thedocks on a periodic basis.
At the end of the project a final opinion and commentsurvey was conducted to record vessel owners' and operators'reactions to the marine debris program and the refusefacilities.
Task 5(Report experiences).
Periodic and detailed progress reports were submitted tothe National Marine Fisheries Service. The appendix of eachreport contained copies of materials prepared or used duringeach reporting period. Additionally, as studies werecompleted, the results were reported to NMFS for their use.Copies of papers presented at conferences were also providedNMFS to update project progress. Finally, this summaryreport, another report entitled "Dealing with Annex V-Guidelines for Ports" and a videotape called "The MarineRefuse Disposal Project"* will provide information that willassist other ports meet their refuse reception obligations.**
* This 9 minute videotape was produced by NMFS in conjunctionwith Barry Fisher, Yankee Fisheries, The HighlinersAssociation, and the Oregon State University Extension/SeaGrant Program.
** See ordering information on page 22.
RESULTS
Pilot project results are reported below according totask,
TASK 1(Provide refuse reception services, assure mariner/port
communication, encourage awareness/use of services).
The surveys, discussions, and investigations conductedto evaluate refuse reception needs indicated someimprovements were required in the refuse reception systems ineach of the port areas-- the shipping terminals, thecommercial fishing vessel moorages, and the recreationalmarina. The changes made at the recreational and commercialmoorages are summarized in Tables 1 and 2 respectively anddiscussed below.
Changes required at the shipping terminals have not yetbeen accomplished. Sterilization or incineration facilitieswhich conform to Department of Agriculture Animal and PlantHealth Inspection Service (APHIS) requirements will need tobe established. An investigation of these requirements wasundertaken (see Appendix 8).
At the recreational vessel marina and at the mooragesserving commercial fishing vessels changes were made toprovide mariners with refuse reception facilities which aremore convenient, ample, and comprehensive (see Diagrams 1 and2). Refuse reception capacity for the commercial fishingvessels was increased by establishing areas for refuseadjacent to a dock where a hoist was available and on a barge(see Diagram 2 D,E). Additional refuse reception capacityalso resulted from increases in the size or number ofcontainers available to the recreational and commercialvessels on land-accessed docks (2B), at the head of each ofthe ramps providing access to floating docks (1A,2A), and onthe boat launch ramp (1B). Windscreens and compounds werebuilt around the refuse containers at the access and launchramps (1A,B, 2A) to make the facilities less visible and lessaccessible so as to discourage the disposal of home generatedrefuse and maintain the aesthetic qualities of thewaterfront. Refuse disposal facilities are completelyaccessible to mariners however, and are located as close tothe vessels as possible while still allowing the access ofthe equipment needed to empty them.
Use of larger refuse containers at the recreationalmarina allowed the port to reduce the time required to handlerefuse by about half and take better advantage of refusecompany services. Changes in the refuse system at thecommercial moorages also reduced the port labor required tohandle refuse containers by half, allowing expansion of
9
worker duties into recycling tasks. Recycling bins or spacefor fishermen to put recyclables have been made available ona barge (2D), adjacent to the refuse containers (2A), and inthe hoist dock area (2E) for use by the fishermen.
These recycling facilities accept items of net, line,cable, wood, metal, and cardboard. It is estimated that theport's capacity to receive plastic refuse has been increasedby at least a third by having these large volume itemsdiverted from the refuse containers. As mariners, recyclers,residents, and tourists find these collected materialsdesirable, they remove them from the port at no charge,resulting in decreased solid waste disposal costs. A smallamount of revenue is even generated by the sale of theunwanted metal items. This recycling system has thereforeallowed and encouraged vessels to conveniently dispose of afull range of waste materials (used-oil recycling has alsobeen expanded).
On-board storage of refuse was facilitated byencouraging the development of convenient, inexpensive trashcontainers for vessels and the use of trash compactors.Compactor use was studied (Appendix 7) and proved to be auseful means of containing refuse on the larger vessels whichspend long periods of time at sea. The SEARS corporation wasencouraged to make trash compactors available to vessels atreduced rates. They have agreed to provide them to all oceangoing vessels in the United States at near cost.
The involvement of the port refuse workers in theevaluation and planning of the refuse reception system,resulted in increased awareness and dedication of the workersto the refuse tasks. This dedication improves both efficiencyand service. Port employees make sure full refuse containersare quickly emptied, misplaced recyclable materials aresorted, and refuse is efficiently distributed and compactedin the dumpsters.
To generate awareness and promote the use of thesefacilities, much time was spent talking with port users toinform and motivate them. A wide variety of informativematerials was also produced and used (see Appendix 1).Additionally many of the port's users and other communitymembers helped promote awareness of the marine debris issue.Many served on the project's advisory group, helping to planand coordinate activities, some distributed posters andbrochures, arranged seminars and displays, talked with theirpeers, and spoke to school classes. Advisory group membersand others also promoted the program by wearing project hatsand sweatshirts, producing public service annoucements,helping with clean-up events, participating in a parade, andspeaking with the media.
10
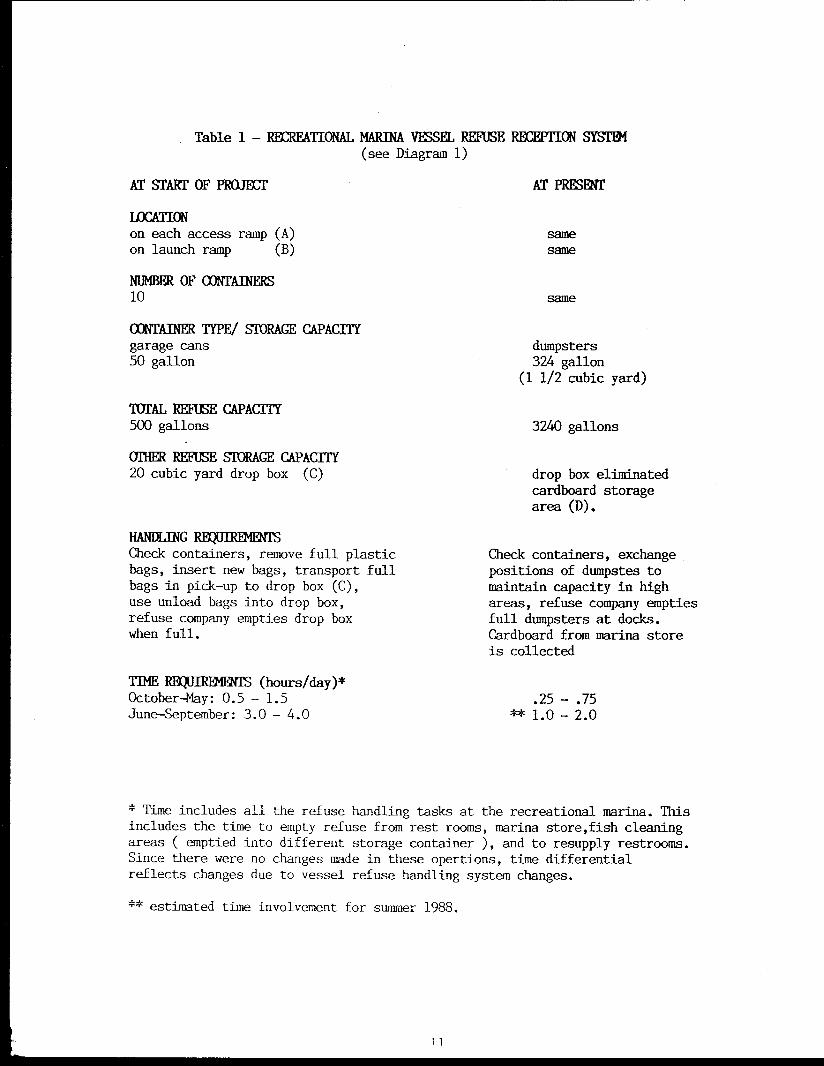
Table 1 - RECREATIONAL MARINA VESSEL REFUSE RECEPTION SYSTEM(see Diagram 1)
AT START OF PROJECT
LOCATIONon each access ramp (A)on launch ramp (B)
NUMBER OF CONTAINERS10
CONTAINER TYPE/ STORAGE CAPACITYgarage cans50 gallon
TOTAL REFUSE CAPACITY500 gallons
OTHER REFUSE S1URAGE CAPACITY20 cubic yard drop box (C)
HANDLING REQUIREMENTSCheck containers, remove full plasticbags, insert new bags, transport fullbags in pick-up to drop box (C),use unload bags into drop box,refuse company empties drop boxwhen full.
TIME REWIRDIENTS (hours/day)`OctoberMay: 0.5 - 1.5June-September: 3.0 - 4.0
AT PRESENT
samesame
same
dumpsters324 gallon
(1 1/2 cubic yard)
3240 gallons
drop box eliminatedcardboard storagearea (D).
Check containers, exchangepositions of dumpstes tomaintain capacity in highareas, refuse company emptiesfull dumpsters at docks.Cardboard from marina storeis collected
.25 - .75** 1.0 - 2.0
* Time includes all the refuse handling tasks at the recreational marina. Thisincludes the time to empty refuse from rest rooms, marina store,fish cleaningareas ( emptied into different storage container ), and to resupply restrooms.Since there were no changes made in these opertions, time differentialreflects changes due to vessel refuse handling system changes.
** estimated time involvement for summer 1988.
1 1
S
G
11 11 1 tt 1 1 1 " 1 1 1
I '1 1 ; I H 1 I 1
1 } '1[ '1111 1M
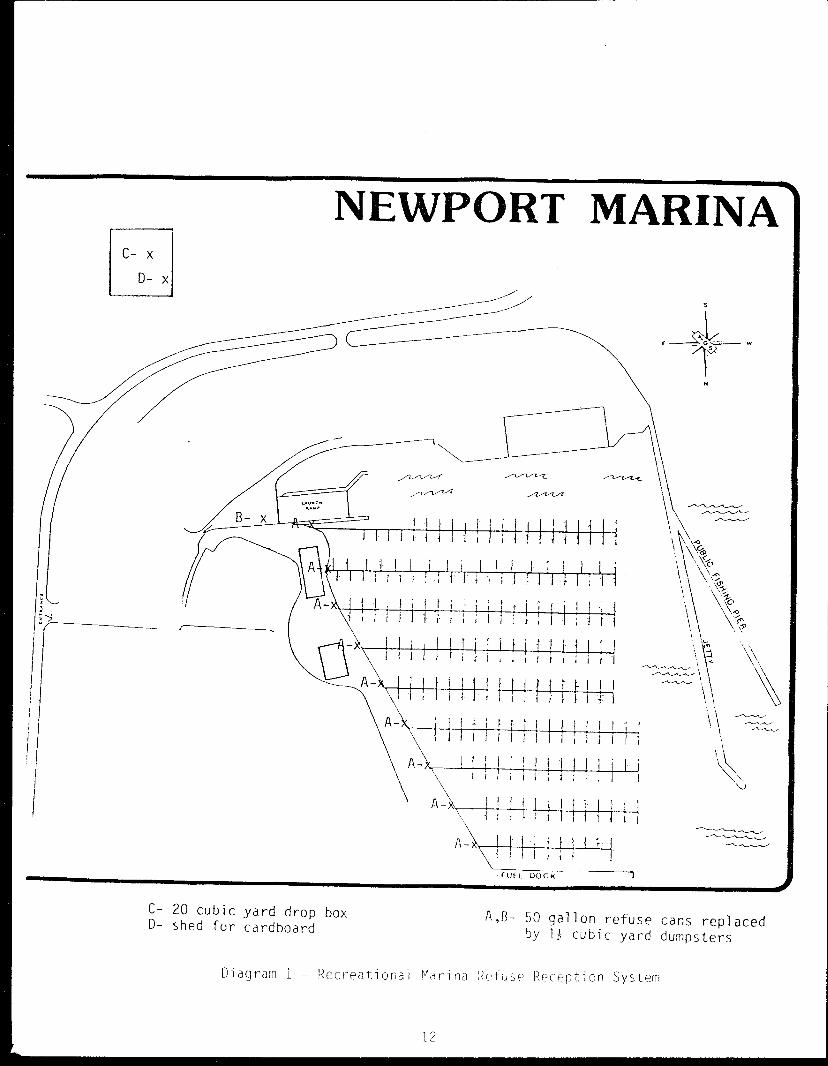
NEWPORT MARINA
C- 20 cubic yard drop boxD- shed for cardboard
A,B- 50 gallon refuse cans replacedby 13 cubic yard dumpsters
Diagram 1 - Recreational Marina Refu s e Recep tion System
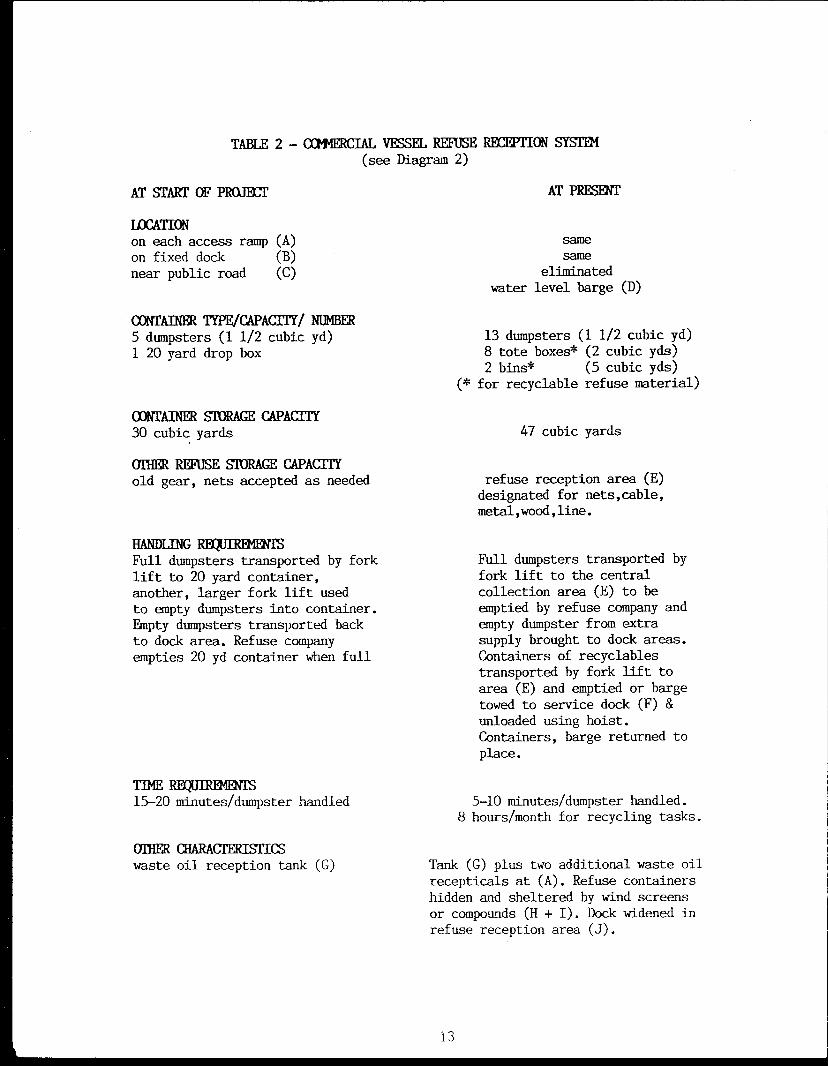
TABLE 2 - COMMERCIAL VESSEL REFUSE RECEPTION SYSTEM(see Diagram 2)
HANDLING REQUIREMENTSFull dumpsters transported by forklift to 20 yard container,another, larger fork lift usedto empty dumpsters into container.Empty dumpsters transported backto dock area. Refuse companyempties 20 yd container when full
TIME REQUIREMENTS15-20 minutes/dumpster handled
OTHER CHARACTERISTICSwaste oil reception tank (G)
AT PRESENT
samesame
eliminatedwater level barge (D)
13 dumpsters (1 1/2 cubic yd)8 tote boxes* (2 cubic yds)2 bins* (5 cubic yds)
(* for recyclable refuse material)
47 cubic yards
refuse reception area (E)designated for nets,cable,metal,wood,line.
Full dumpsters transported byfork lift to the centralcollection area (E) to beemptied by refuse company andempty dumpster from extrasupply brought to dock areas.Containers of recyclablestransported by fork lift toarea (E) and emptied or bargetowed to service dock (F) &unloaded using hoist.Containers, barge returned toplace.
5-10 minutes/dumpster handled.8 hours/month for recycling tasks.
Tank (G) plus two additional waste oilrecepticals at (A). Refuse containershidden and sheltered by wind screensor compounds (H + I). Dock widened inrefuse reception area (J).
AT START OF PROJECT
LOCATIONon each access ramp (A)on fixed dock (B)near public road (C)
CONTAINER TYPE/CAPACITY/ NUMBER5 dumpsters (1 1/2 cubic yd)1 20 yard drop box
CONTAINER STORAGE CAPACITY30 cubic yards
OTHER REFUSE STORAGE CAPACITYold gear, nets accepted as needed
13
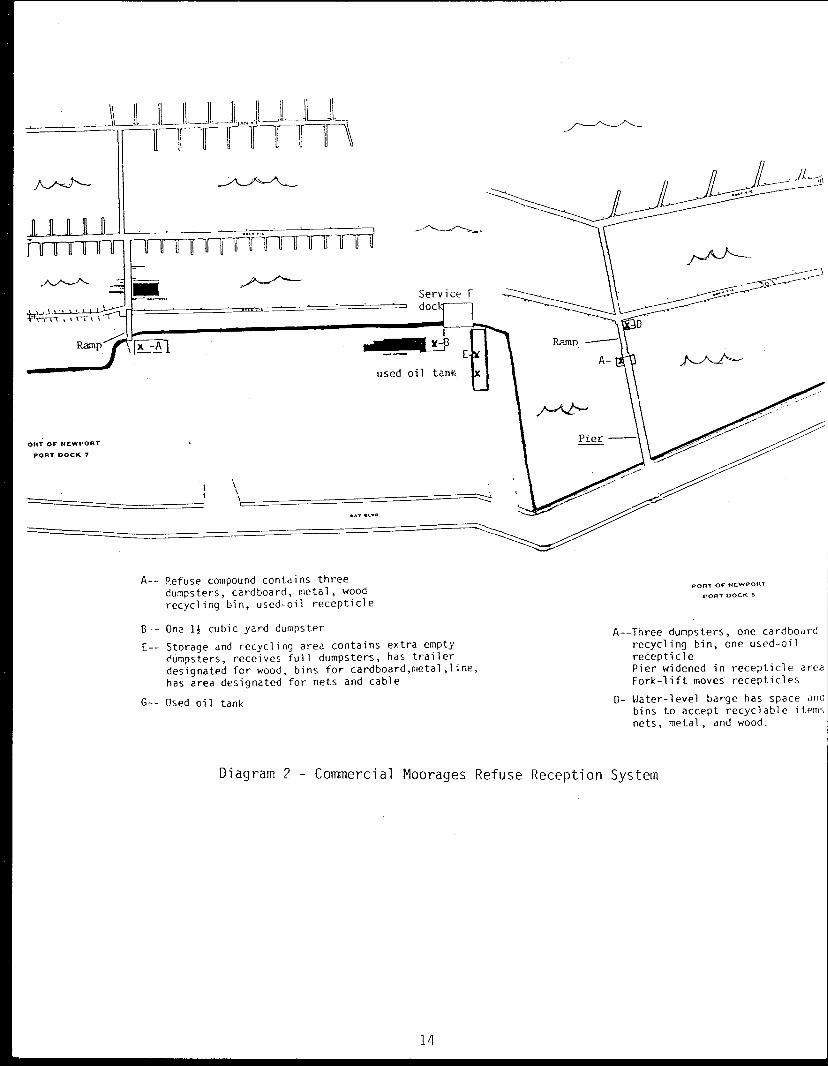
II 11. LULLFE
Refuse compound contains three
dumpsters, cardboard, metal, wood
recycling bin, used-oil recepticle
One lZ cubic yard dumpster
Storage and recycling area contains extra empty
dumpsters, receives full dumpsters, has trailer
designated for wood, bins for cardboard,metal,line,
has area designated for nets and cable
G-- Used oil tank
PORT OF NEWPORTPORT DOCK 5
A--Three dumpsters, one cardboard
recycling bin, one used-oil
recepticlePier widened in recepticle area
Fork-lift moves recepticles
D- Water-level barge has space anc
bins to accept recyclable items
nets, metal, and wood.
Diagram 2 - Commercial Moorages Refuse Reception System
14
A high degree of fishermen and community awareness andinterest resulted from these outreach efforts as indicated bythe participation in and responses to the project's finalsurveys (see Appendix 2). At least 20% of the fishermenfilled out a survey form as did about 1% of the community. Atotal of 91% of the fishermen, and 98% of the communityrespondents indicated that they were aware of Marine DebrisProject activities.
Thirty-four percent of the fishermen and 55% of thecommunity members considered educational and awarenessgenerating efforts to be of primary importance in solving themarine debris problem. Over half the fishermen (54%) and 86%of the community members thought the project had beeneffective in changing refuse disposal practices.
Signs, posters, and notices around the docks werementioned by 31% of the fishermen as having created awarenessof the marine debris problem or project. Newspaper articles,TV, and radio annoucements were also effective, as they werementioned by 22% of the fishermen surveyed. Awareness of theprogram among the fishermen was also significantly fosteredby word of mouth (15% mention) and by seeing the refuse andrecycling containers on the docks (15% mention).
A quarter (25%) of the community members mentionednewspapers as having created awareness of the marine debrisproblem or project, with TV and radio annoucements alsoraising awareness (21%). Signs and posters were mentioned by13% of the respondents and presentations were mentioned by12% of the respondents as having being sources of informationabout the problem.
TASK 2(Keep records of costs,services).
About $20,000 was spent to develop the refuse receptionfacilities. These costs are outlined in Table 3. Costs forthe materials used in the educational and promotional effortswere about $13,000 and are categorized in Table 4. Theexpenditures of the $97,000 worth of grant funds arecategorized in Table 5.
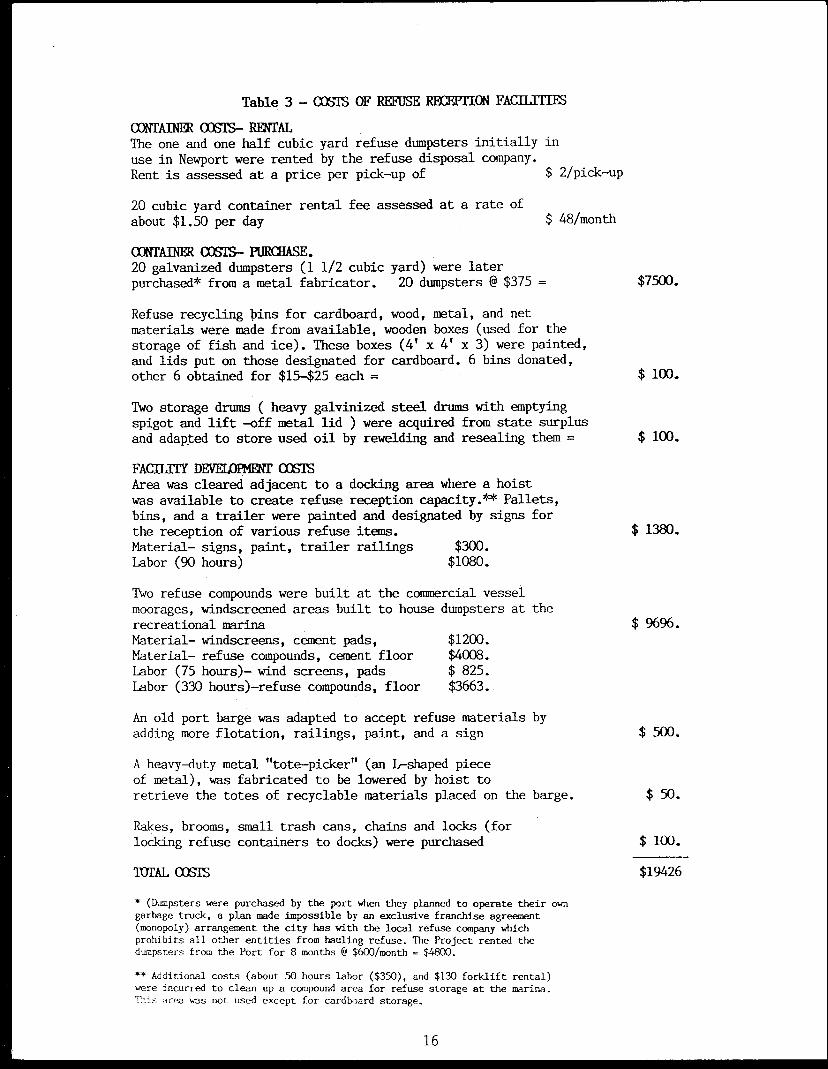
Table 3 - COSTS OF REFUSE RECEPTION FACILITIES
CONTAINER COSTS- RENTALThe one and one half cubic yard refuse dumpsters initially inuse in Newport were rented by the refuse disposal company.Rent is assessed at a price per pick-up of $ 2/pick-up
20 cubic yard container rental fee assessed at a rate ofabout $1.50 per day $ 48/month
°MAIN:ER COSTS- PURCHASE.20 galvanized dumpsters (1 1/2 cubic yard) were laterpurchased* from a metal fabricator. 20 dumpsters @ $375 =
Refuse recycling bins for cardboard, wood, metal, and netmaterials were made from available, wooden boxes (used for thestorage of fish and ice). These boxes (4' x 4' x 3) were painted,and lids put on those designated for cardboard. 6 bins donated,other 6 obtained for $15-$25 each =
Two storage drums ( heavy galvinized steel drums with emptyingspigot and lift -off metal lid ) were acquired from state surplusand adapted to store used oil by rewelding and resealing them =
FACILITY DEVELOPMENT COSTS
Area was cleared adjacent to a docking area where a hoistwas available to create refuse reception capacity.** Pallets,bins, and a trailer were painted and designated by signs forthe reception of various refuse items.Material- signs, paint, trailer railings $300.Labor (90 hours) $1080.
Two refuse compounds were built at the commercial vesselmoorages, windscreened areas built to house dumpsters at therecreational marinaMaterial- windscreens, cement pads, $1200.Material- refuse compounds, cement floor $4008.Labor (75 hours)- wind screens, pads $ 825.Labor (330 hours)-refuse compounds, floor $3663.
$7500.
$ 100.
$ 100.
$ 1380.
$ 9696.
An old port barge was adapted to accept refuse materials byadding more flotation, railings, paint, and a sign $ 500.
A heavy-duty metal "tote-picker" (an L-shaped pieceof metal), was fabricated to be lowered by hoist toretrieve the totes of recyclable materials placed on the barge.
Rakes, brooms, small trash cans, chains and locks (forlocking refuse containers to docks) were purchased
itnAL COSTS
* (Dumpsters were purchased by the port when they planned to operate their owngarbage truck, a plan made impossible by an exclusive franchise agreement(monopoly) arrangement the city has with the local refuse company whichprohibits all other entities from hauling refuse. The Project rented thedumpsters from the Port for 8 months @ $600/month = $4800.
** Additional costs (about 50 hours labor ($350), and $130 forklift rental)were incurred to clean up a compound area for refuse storage at the marina.This Irea was not used except for cardboard storage.
$ 50.
$ 100.
$19426
16
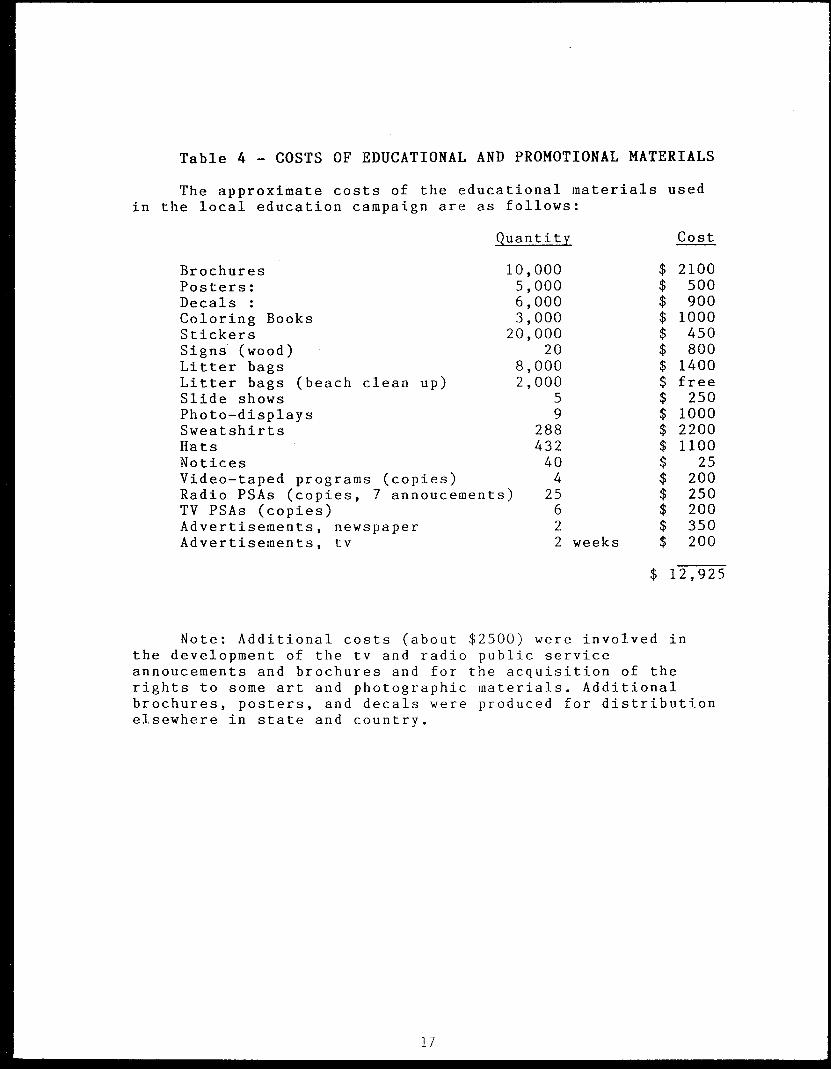
Table 4 — COSTS OF EDUCATIONAL AND PROMOTIONAL MATERIALS
The approximate costs of the educational materials usedin the local education campaign are as follows:
Quantity Cost
Brochures 10,000 $ 2100Posters: 5,000 $ 500Decals : 6,000 $ 900Coloring Books 3,000 $ 1000Stickers 20,000 $ 450Signs (wood) 20 $ 800Litter bags 8,000 $ 1400Litter bags (beach clean up) 2,000 $ freeSlide shows 5 $ 250Photo—displays 9 $ 1000Sweatshirts 288 $ 2200Hats 432 $ 1100Notices 40 $ 25Video—taped programs (copies) 4 $ 200Radio PSAs (copies, 7 annoucements) 25 $ 250TV PSAs (copies) 6 $ 200Advertisements, newspaper 2 $ 350Advertisements, tv 2 weeks $ 200
$ 12,925
Note: Additional costs (about $2500) were involved inthe development of the tv and radio public serviceannoucements and brochures and for the acquisition of therights to some art and photographic materials. Additionalbrochures, posters, and decals were produced for distributionelsewhere in state and country.
17
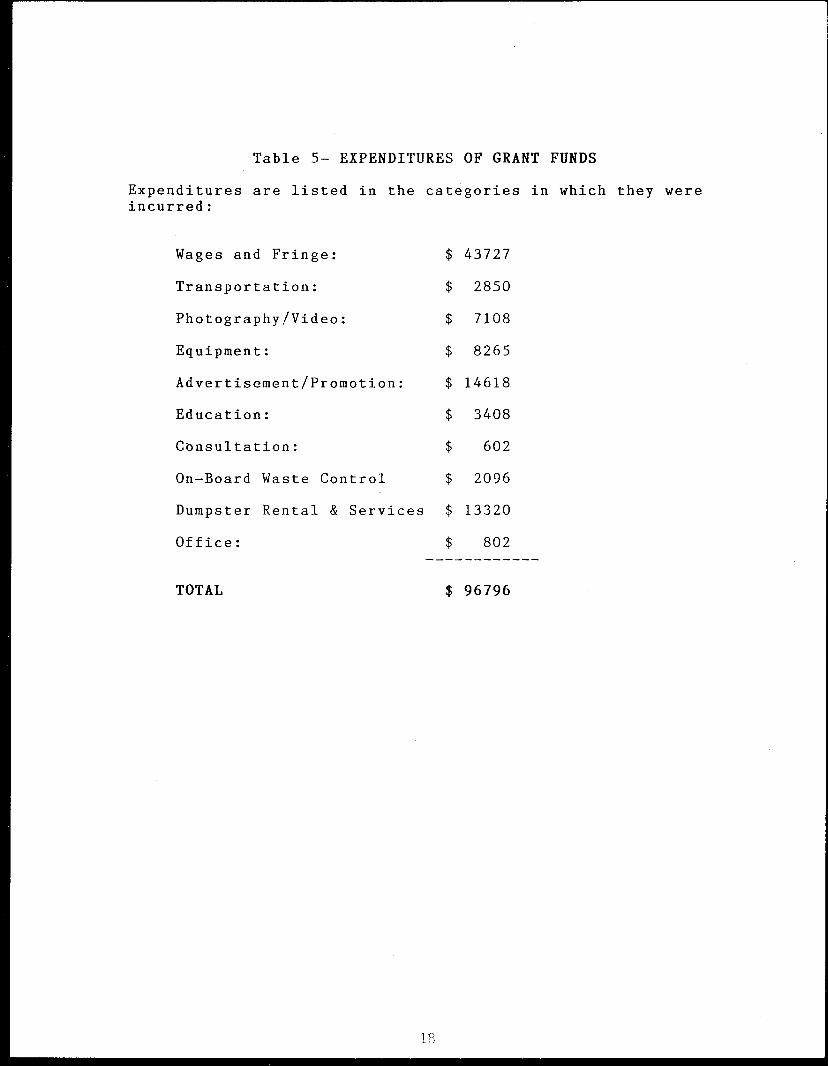
Table 5— EXPENDITURES OF GRANT FUNDS
Expenditures are listed in the categories in which they wereincurred:
Wages and Fringe: $ 43727
Transportation: $ 2850
Photography/Video: $ 7108
Equipment: $ 8265
Advertisement/Promotion: $ 14618
Education: $ 3408
Consultation: $ 602
On—Board Waste Control $ 2096
Dumpster Rental & Services $ 13320
Office: $ 802
TOTAL $ 96796
18
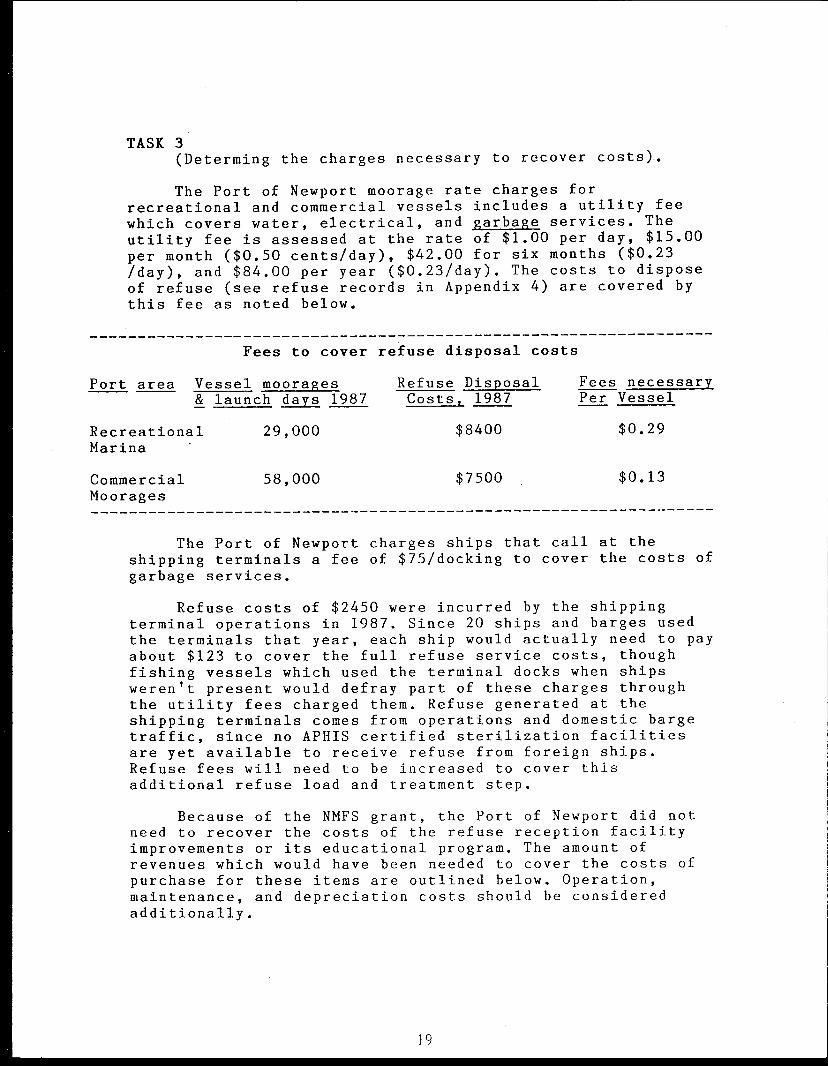
TASK 3(Determing the charges necessary to recover costs).
The Port of Newport moorage rate charges forrecreational and commercial vessels includes a utility feewhich covers water, electrical, and garbage services. Theutility fee is assessed at the rate of $1.00 per day, $15.00per month ($0.50 cents/day), $42.00 for six months ($0.23/day), and $84.00 per year ($0.23/day). The costs to disposeof refuse (see refuse records in Appendix 4) are covered bythis fee as noted below.
Fees to cover refuse disposal costs
Port area Vessel moorages Refuse Disposal Fees necessary& launch days 1987 Costs, 1987 Per Vessel
Recreational 29,000Marina
Commercial 58,000Moorages
$8400
$7500
$0.29
$0.13
The Port of Newport charges ships that call at theshipping terminals a fee of $75/docking to cover the costs ofgarbage services.
Refuse costs of $2450 were incurred by the shippingterminal operations in 1987. Since 20 ships and barges usedthe terminals that year, each ship would actually need to payabout $123 to cover the full refuse service costs, thoughfishing vessels which used the terminal docks when shipsweren't present would defray part of these charges throughthe utility fees charged them. Refuse generated at theshipping terminals comes from operations and domestic bargetraffic, since no APHIS certified sterilization facilitiesare yet available to receive refuse from foreign ships.Refuse fees will need to be increased to cover thisadditional refuse load and treatment step.
Because of the NMFS grant, the Port of Newport did notneed to recover the costs of the refuse reception facilityimprovements or its educational program. The amount ofrevenues which would have been needed to cover the costs ofpurchase for these items are outlined below. Operation,maintenance, and depreciation costs should be consideredadditionally.
19
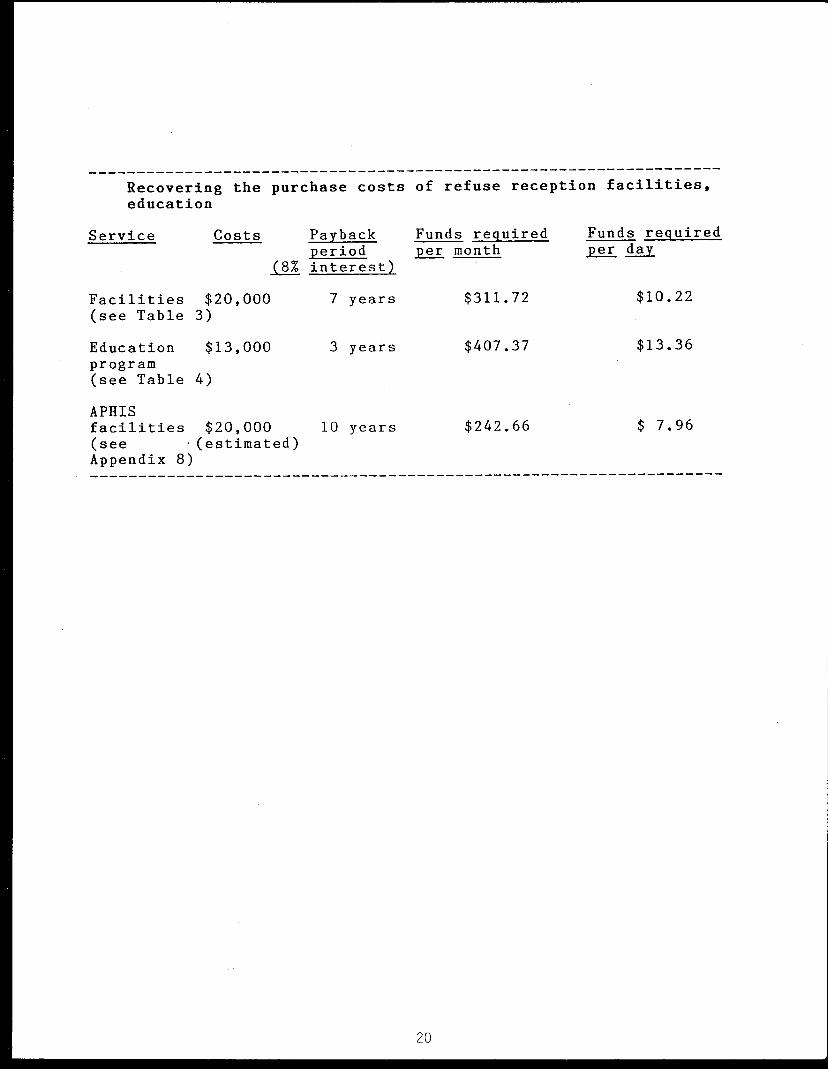
Recovering the purchase costs of refuse reception facilities,education
Service Costs Payback Funds required Funds required
(8%period per, month per dayinterest)
Facilities $20,000(see Table 3)
7 years $311.72 $10.22
Education $13,000program(see Table 4)
3 years $407.37 $13.36
APHISfacilities $20,000(see -(estimated)
10 years $242.66 $ 7.96
Appendix 8)
20
TASK 4(Assessing the reactions of mariners to refuse
system/intent).
Fishermen and community members were asked to comment onthe Marine Refuse Disposal Project (referred to below as"Project") in January and February 1988, just over a yearafter its inception. Results of these evaluations arepresented in full in Appendix 2 and summarized below:
Ninety-one percent of the 117 fishermen and 98% of the 87community members providing written responses to the finalopinion and comment survey were aware of the Projectactivities.
-96% of the fishermen and 86% of the community memberswere convinced that the Project had been at least somewhateffective in changing ocean disposal of plastics.
-79% of the fishermen felt that refuse service at thePort of Newport met their needs, with better used-oildisposal and more dumpster capacity being requested bythose that wanted further improvements.
-93% of the fishermen thought that this project had had apostive effect on the fishing community.
-77% of the fishermen surveyed felt that other ports andcommunities should pursue similar activities to thosepursued under the Project (education & community awareness,providing facilities) with 35% specifically suggestingthat a project similar to the Newport Project beconducted.
TASK 5(Report results)
In order to provide guidance to other ports and assist inour own refuse planning efforts, studies were conducted todetermine the amount of refuse generated on board fishingvessels, the composition of the refuse returned to port, theusefulness of trash compactors in reducing vessel refusestorage problems, and the refuse volumes generated by vessels.These studies are included in the appendices of this reportand are summarized below. Additional information andguidelines resulting from this pilot project are reported in apublication called "Dealing with Annex V-- Reference Guide forPorts"* and are presented in a nine minute videotape called"The Marine Refuse Disposal Project"**.
Fishermen's reports reveal that their vessels generateon average 11.6 gallons of refuse per vessel per day witheach person aboard generating about 4.4 gallons of refuse perday (see Appendix 5). Between 45% and 60% of this refuse (byvolume) is likely to be non-degradable materials (seeAppendix 6). Additional refuse is generated when repair workis done or vessels are provisioned.
Other calculations of the amount of refuse generated onvessels reveal that commercial fishing vessels generatebetween 12 and 16.5 gallons of refuse for each day registeredin port, and that recreational vessels will generate between4 and 9 gallons of refuse per day of vessel use. Crewgenerated plastic refuse might be expected to accumulate atabout 0.4 gallons per person per day (see Appendix 5).
Trash compactors allow vessels a method for reducing (by5 to 7 times) the storage space required to contain refuse.Kitchen sized compactors have proved practical on vesselswhich 'are at least 60 feet in length and which spend longperiods of time at sea (see Appendix 8).
* These guidelines are available by writing to the NationalMarine Fisheries Service, Marine Entanglement ResearchProgram, 7600 Sand Point Way NE, Seattle, WA 98119. Specifyyou want the publication called "Dealing with Annex V--Guidelines for Ports".
** To obtain a VHS copy of this videotape send a check ormoney order for $8.00 (includes postage and handling) toWestcom Productions, Attention Customer Service Department,1925 Bailey Hill Road, Eugene, Oregon 97405. Specify that youwant the Port of Newport Marine Refuse Disposal Project tape.
22
DISCUSSION
Annex V of MARPOL requires only that ports provideadequate refuse reception facilties for plastics and othermaterials regulated under the law. However, the experiencesof the Port of Newport's project indicate that much is to begained if ports take a broader approach to solving the marinedebris problem. By conducting an awareness program andproviding comprehensive refuse reception service, ports canencourage mariners' compliance with the new restrictions andgain the support and assistance of their users and thecommunity in accomplishing these goals.
In Newport, the greatest majority of port users now returntheir reufse to port and find refuse facilities available tohandle the full range of refuse materials needing disposal.Despite large increases in refuse being returned, increasedefficiency has allowed the port to keep refuse disposal costslow. The marine debris project has improved the relationshipbetween the port and the fishing industry as service andresponsiveness to suggestion were demonstrated. Improvedpublic relations for the Port also resulted from theinvolvement of community members in Marine Refuse DisposalProject (referred to below as "Project") activities and thecontinuous and postive media attention the Project received.
The most critical determinants of the Project's successhave been the port's genuine interest in trying to end themarine debris problem by addressing the refuse disposal needsof their users, the involvement of port users in efforts toeducate their peers, and widespread community support.
Refuse reception facilities and services
While some of the refuse system changes made may have beenspecific to this port's situation, many ideas are general andmay be directly applicable to other ports. Recycling toreduce port solid waste disposal costs, color coding of refusereceptacles, clearly designating refuse areas, displayingnotices on the docks and in user frequented stores, usingwater-level refuse reception barges, and positioning refuseareas near hoists and other refuse handling equipment, areactions that can be helpful to any port.
Though plastics are the material of concern to Annex Vregulations, the issue of refuse disposal is a more integratedone from the user's perspective. The need for a placeto dispose of used oil or cable, for example, is not a separateissue from the need for a place to dispose of plasticpackaging or net materials. It seems clear then that thehandling of plactic should be only a part of the larger andmore comprehensive port waste management picture.
Expansion of refuse services and reception capacity
The Port expanded refuse services in response to theneed demonstrated and the suggestions resulting from surveys,analyses, and discussions with fishermen and port personnel.Refuse reception capacity was increased in five differentways:
1. Larger sized containers were used.2. Refuse reception areas and containers were designated.3. Recycling was instigated.4. Containers were emptied with increased frequency.5. Port workers increased system efficiency.
The use of additional or larger sized containers aloneexpanded the refuse handling capacity by about seven times.This reduced the frequency and effort required by port laborto keep the containers emptied and reduced the overflowproblms during high—use times. Additionally, a large amountof reception capacity was provided at low cost by designatingrefuse areas adjacent to the vessel service dock and on afloating barge. These changes provided sufficient facilitiesto handle all the refuse the fishing vessels wanted todeliver.
These additional or larger containers and clearlydesignated refuse areas also served to emphasize that theport expected and was able to handle more refuse and wastrying to make refuse disposal as convenient as possible. Ifmariners had to expend effort to stuff bags of refuse intoalready full containers, or go far to dispose of large items,the ease of at—sea disposal might become more attractiveagain.
The bright and uniform coloration of the recycling binsand signs also drew attention to the port's efforts toprovide increased levels of service to the users. Fishermenwe found, will cooperate with the recycling efforts not onlybecause recycling bins are convenient, but also because theyoften find useful matrials in them. The recycling bins fornet, line, metal, and wood make readily available somematerials for vessel and gear repairs and invention-- withouthaving to go to the store.
From the port's perspective this recycling not onlyallowed comprehensive service, but kept the refuse containersavailable for plastic refuse. This increased refuse systemefficiency and decreased refuse disposal costs. Port laborinvolvement in recycling tasks was minimized by collaborationwith recyclers to allow for the automated hauling ofcardboard and metal materials, and by making recyclablematerials available to others. Wood materials were eitherburned or provided to service agencies helping elderly andhandicapped citizens meet their heating needs. Many people
24
came to the port recycling areas to take nets, barrels, line,wood, cable, and other useful items. Nets and net pieces wereused to fish or to repair other nets, to construct playgroundequipment, baseball and golf backstops, erosion controlstructures, horticultural supports, or for decoration.
These recycling efforts have also brought the portpraise and recognition not only from those fishermen,residents, and tourists who used the material directly, butfrom resource agencies, environmental groups, and individuals.
Increases in refuse service efficiency
The changes made in the refuse handling system increasedthe efficiency of port operations and reduced port laborhandling. Port workers had been carrying out much of the workthat the refuse company would do at no additional cost.However, since refuse service was not provided on theweekends, it was necessary, if we were to rely on thisservice, to increase either the capacity or the number ofrefuse containers. With these changes made, port worker timehas been freed up to provide recycling services or to bedevoted to other tasks.
Role of management support
Support by the port management was critical for thesuccessful workings of the marine debris project. Wheremanagement was committed to the port role in solving themarine debris problem, facilities were planned with serviceto the port users in mind, facilities were put in placequickly, and refuse handling tasks were integrated into theother duties of the port workers.
Given this management support, worker understanding ofthe marine debris problem and involvement in the workings ofthe marine debris program led to increased attention torefuse handling operations. This resulted in more frequentrefuse container emptying, the willingness to participate andaid in the recycling efforts, accurate record keeping,attention paid to efficient utilization of refuse containerspace, and efforts to keep refuse areas clean. Workers tookpride in the high level of service provided. They voluntarilyinformed the fishermen about the refuse program and relayedsuggestions, comments, and critiques related to progress andproblems.
In contrast, where management support and supervisonwere lacking, refuse facility projects were often put off ordelayed, and it was difficult to foster employee initiativeand involvement in the marine debris program. As a result,worker participation in project related actions was sporadic
and undependable, record keeping inaccurate, and public
outreach non-existant.
Fee assessment
It is important that vessels are not penalized by theirefforts to comply with Annex V. Fees charged to offloaddebris would deter the return of refuse and the retrieval ofthe debris many trawl fishermen and other mariners may drag upor encounter at sea. Collection of revenues throught the useof a moorage charge system, through the port operating funds,vessel licensing fees, taxes on debris items, etc. might bebetter methods. Ports could even consider means of encouragingthe return of retrieved refuse, such as waiving fees for theuse of hoists and fork lifts.
Involvement and awareness
In approaching the users directly, asking to hear theirideas, and paying attention to their suggestions and comments,the port gained valuable insight and was able to instigatepopular changes to make refuse disposal convenient and easy.Additionally this input created support for the program andresulted in the continued involvement of the fishingcommunity. This interaction fostered a genuine feeling ofpride and ownership by the fishermen in the changes made andaccomplishments realized. The involvement of the portworkers was also important for generating ideas,troubleshooting, and problem solving. Worker involvementgenerated support and commitment to the project and resultedin efficient and conscientious service.
When pursuing educational activities, it was important tospeak about the magnitude of the plastic debris problem (onthe regional or local level where possible), to avoid pointingfingers or targeting any one user group, and to point out howthis marine debris problem effected mariners directly. Forexample, considerable mariner attention was generated byreporting the quantities of plastics on local beaches and thecosts incurred by the area's fishermen and boaters whenplastic debris impaired vessel operations.
Peer pressure and the competitive spirit also seemed toplay a role in influencing support and cooperation. Theinvolvement of captains who brought back their refuse andinsisted on their crew's compliance was important ingenerating support as were the conversations fishermeninitiated with others about refuse containment. Peermotivation was fostered by those port users who participatedin the Project's advisory group, helped to post posters,joined promotional and educational activities, and appeared inmedia articles.
26
The advisory group, made up of influential port usergroup and community members, also played a key role ingenerating awareness. This group originated and executed
ideas related to effectively influencing user, port, andcommunity support. By involving themselves in educationaland promotional activities, port users as well ascommunity members became aware of the marine debrisproblem and the effects of this program were extended intothe future. Involvement and commitment of fishermen andthe fishermen's wives group, the area's schools, the U.S.Coast Guard, the fish and wildlife agency, and thesheriffs and state police, were fostered through theactions of advisory group members.
The media too played an influential role in generatingawareness and maintaining and increasing support.Frequent reports were made not only about the marinedebris problem, but also about the positive actions beingtaken by individuals and groups and the progress beingmade.
Other Benefits
The good will fostered within the community by theProject may allow the port to gain support more quickly infuture, unrelated endeavors. The name recognitionfostered by regional and national attention to thisProject may also help in future port marketing efforts.
Educational Experience
To prepare one for working with people andbureaucracies, as resource managers inevitably do, aninternship period is invaluable in providing that "hands-on" experience. It brings into clear focus professionalexpectations and one's strengths and weaknessess.
Through my internship with this project, therequirements and responsibilities of grant management cameclearly into view. I discovered that a grant proposal isnot a sketch of responsibilities and goals, but a legalmandate of requirements. I was able to improve my skillsin relating to people and improve my writing andorganizational abilities. I discovered problems inprioritizing, focusing, and delegating responsibilities,an awareness which will help to solve them. I foundmyself unprepared to deal with the questionable handlingof grant funds by the port management. I had littleability to distance myself from this problem so as tomore clearly consider options and solutions. Thisexperience too, though unfortunate, provided valuablelessons about the legal remedies in the system and thepolitical power that can be brought to bear on a problem.It taught me too about the importance of developing skillsin concentration and problem solving.
27
SUMMARY
The Marine Refuse Disposal Project had two main goals,to encourage the return of refuse to port through educationof port users and to make facilities available to receivethis refuse. The focus of Project activities was not toimpose a structure from the outside, but to involve theport's users, port workers, and management, in thedevelopment of the refuse reception system and in efforts toheighten awareness of the marine debris problem.
The refuse system that was developed through thisprocess not only met user needs for refuse disposalconvenience and port needs for economic efficiency, it alsogenerated commitments to action and involvement. Indicationsare that 80% of the fishermen are now voluntarily returningtheir plastics to port and encouraging similar actions amongtheir peers. Port employees are diligently trying to providea complete and accomodating service to help them. A sense ofpride and ownership and even enjoyment of the Project hasbeen apparent. Both the fishermen and the Port have receivedmuch positive attention from the community and from the mediafor their on-going efforts.
Refuse reception facilities are now able to handle thecomprehensive waste disposal needs of the port's users. Theyare conveniently located, readily apparent, and have amplecapacity. Refuse facility costs and refuse disposal costshave been minimized by encouraging recycling, increasingefficiency of the refuse containers used, utilizing low costand readily available materials, and choosing facilitieswhich allowed for the use of on-hand port equipment and labor.
The educational and promotional activities of theProject were furthered substantially by the participation ofa broad spectrum of community members in the Project'sadvisory group. These members provided not only advice on howbest to influence user and community awareness and support,but initiated and supported activities of the Project andgenerated interest within their own organizations. Theassistance of these community members and agency groups hasnot only greatly expanded the reach and effect of theProject, but has served to strenthen the ties and cooperationbetween the port and these groups.
Ports will play a crucial role in solving the marinedebris problem by the provision of adequate garbage receptionfacilities as required by Annex V of MARPOL. Ports can alsoserve as catalysts of public awareness by fostering userinvolvement and community education. Experiences at the Portof Newport show that these efforts will be widely recognizedand pay off in high level reduction in the disposal of
persistent wastes into ocean and coastal environments.
28
LITERATURE CITED
1. Annonymous. 1975. Marine litter. Assessing potential
ocean pollutants. A report to the Ocean Affairs Board.Commission on Natural Resouces, National Research Council,National Academy of Sciences, Washington, D.C. Pp. 405-
438.
2. Atkins, N., K. O'Hara, and S. Iudicello. 1987. Plastics
in our ocean. More than a litter problem. Center forEnvironmental Education, Washington, D.C. Pp. 4-18.
3. Gurwitt, R. 1988. Now ships trash must come ashore.Governing, June 1988, Congressional Quarterly, Inc.,Washington, D.C. P. 10.
4. Fowler, C. 1982. Entanglement as an explanation for thedecline in northern furseals on the Pribilof Islands. A
report submitted to the 25th Annual Meeting of theStanding Scientific Committee, March 1982. National MarineMammal Lab., Northwest and Alaska Fisheries Center,National Marine Fisheries Service, Seattle, Washington.
5. Gress, F., and D. Anderson. 1983. California brownpelican recovery plan. United States Fish and WildlifeService, Portland, Oregon.
Also see: Weisskopf, M. 1988. Plastic reaps a grim harvest
in the oceans of the world. Smithsonian, Vol.18, No.12,March 1988. Pp. 58-67.
6. Ibid. 2 above, p. 34.
7. Jones, L., and R. Ferrero. 1985. Observations of netdebris and associated entanglements in the North PacificOcean and Bering Sea, 1978-1984. In Shomura, R. and Y.Yoshida (editors), Proceedings of the workshop on the fateand impact of marine debris, 27-29 November 1984,Honolulu, Hawaii. U.S. Department of Commerce, NOAA, NMFS,NOAA-TM-NMFS-SWFC-54. Pp. 387-431.
8. Balazs, G. 1985. Impacts of ocean debris on marineturtles: entanglement and ingestion. In Shomura, R. and Y.Yoshida (editors), Proceedings of the workshop on the fateand impact of marine debris, 27-29 November 1984,Honolulu, Hawaii. U.S. Department of Commerce, NOAA, NMFS,NOAA-TM-NMFS-SWFC-54. Pp. 387-431.
29
9. R. Day, D. Wehle, and F. Coleman. 1985. Ingestion ofplstic pollutants by marine birds. In Shomura, R. and Y.Yoshida (editors), Proceedings of the workshop on the fateand impact of marine debris, 27-29 November 1984,Honolulu, Hawaii. U.S. Department of Commerce, NOAA, NMFS,NOAA-TM-NMFS-SWFC-54. Pp.344-386.
10. Ibid. 2 above, p. 41.
11. Ibid. 7 above.
12. Ibid. 6 above.
13. Radtke, Hans., Ph.D. Agricultural and resourceeconomist, P.O. Box 844, Yachats, Oregon 97498. PersonalCommunication, May 1988.
14. Carter, Chris, and Jerry Lucas, Oregon Department ofFish and Wildlife, P.O. Box 59, Portland, Oregon 97207.Personal communication, March 1988.
30
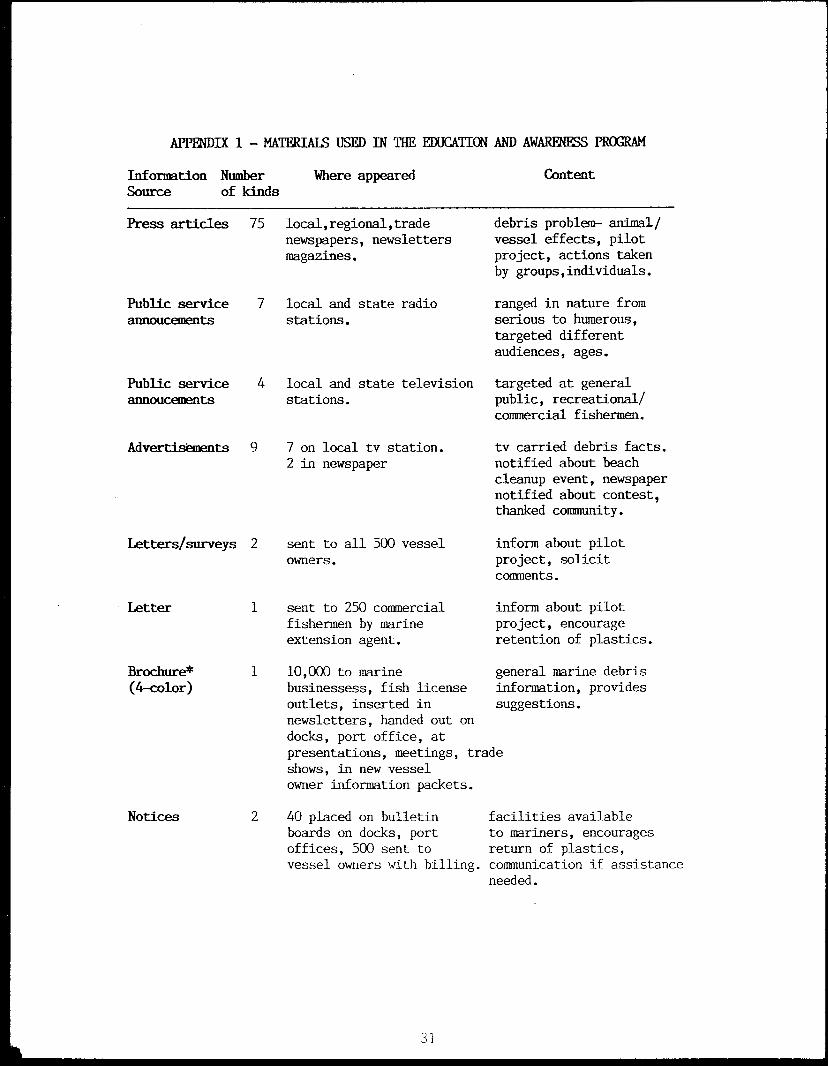
APPENDIX 1 - MATERIALS USED IN THE EDUCATION AND AWARENESS PROGRAM
Information Number Where appeared
ContentSource of kinds
Press articles 75 local,regional,tradenewspapers, newslettersmagazines.
debris problem- animal/vessel effects, pilotproject, actions takenby groups,individuals.
ranged in nature fromserious to humerous,targeted differentaudiences, ages.
Public service 7 local and state radioannoucements stations.
Public service 4 local and state television targeted at generalannoucements stations. public, recreational/
commercial fishermen.
Advertisements 9 7 on local tv station.2 in newspaper
Letters/surveys 2 sent to all 500 vesselowners.
tv carried debris facts.notified about beachcleanup event, newspapernotified about contest,thanked community.
inform about pilotproject, solicitcomments.
Letter
Brochure*(4-color)
Notices
1 sent to 250 commercialfishermen by marineextension agent.
2 40 placed on bulletinboards on docks, portoffices, 500 sent tovessel owners with billing.
inform about pilotproject, encourageretention of plastics.
facilities availableto mariners, encouragesreturn of plastics,communication if assistanceneeded.
1 10,000 to marine general marine debrisbusinessess, fish license
information, providesoutlets, inserted in suggestions.newsletters, handed out ondocks, port office, atpresentations, meetings, tradeshows, in new vesselowner information packets.
31
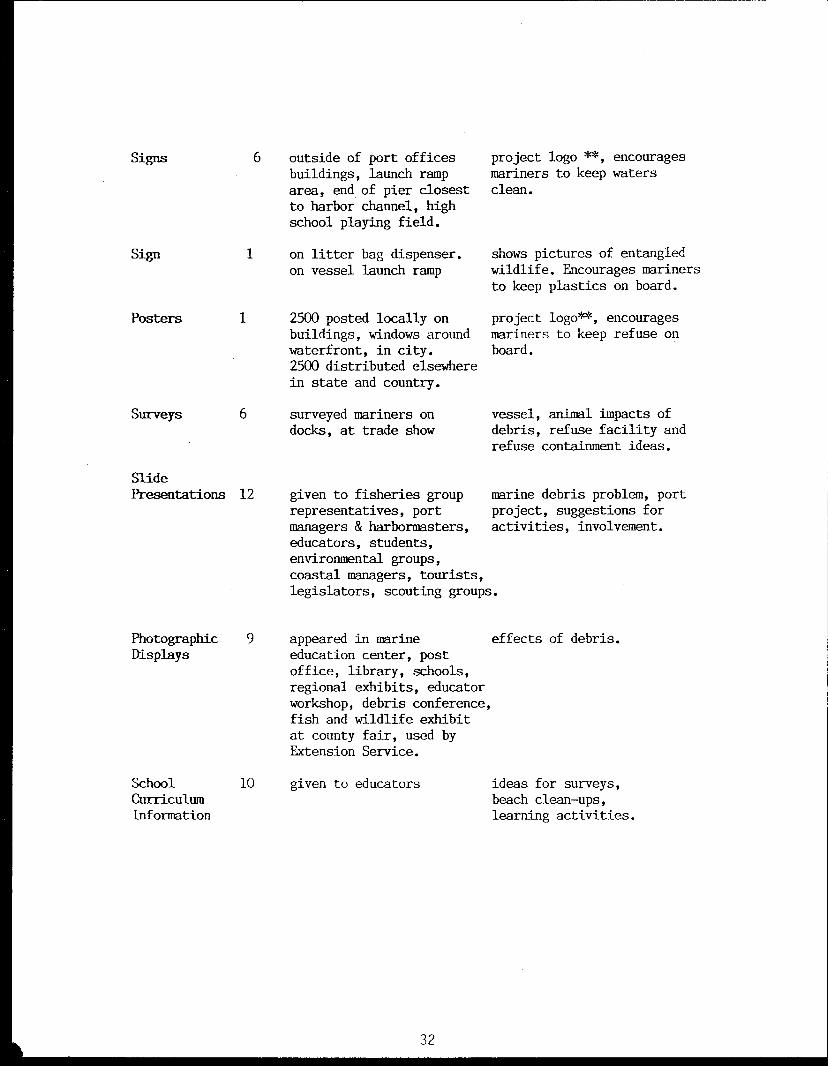
Signs 6
Sign 1
Posters 1
Surveys 6
SlidePresentations 12
outside of port offices project logo **, encouragesbuildings, launch ramp mariners to keep watersarea, end of pier closest clean.to harbor channel, highschool playing field.
on litter bag dispenser. shows pictures of entangledon vessel launch ramp wildlife. Encourages mariners
to keep plastics on board.
2500 posted locally on project logo**, encouragesbuildings, windows around mariners to keep refuse onwaterfront, in city. board.2500 distributed elsewherein state and country.
surveyed mariners on vessel, animal impacts ofdocks, at trade show
debris, refuse facility andrefuse containment ideas.
given to fisheries group marine debris problem, portrepresentatives, port project, suggestions formanagers & harbormasters, activities, involvement.educators, students,environmental groups,coastal managers, tourists,legislators, scouting groups.
PhotographicDisplays
9 appeared in marineeducation center, postoffice, library, schools,regional exhibits, educatorworkshop, debris conference,fish and wildlife exhibitat county fair, used byExtension Service.
effects of debris.
School 10 given to educators ideas for surveys,Curriculum
beach clean-ups,Information
learning activities.
32
Promotional 5 6000 decals, 20,000 project logo **,items stickers, 3000 coloring debris messages
books, 432 hats, and 288sweatshirts, distributedat port, marine businesses,by Ext./Sea Grant program,at community offices,inschools (some number ofsweatshirts/hats sold at cost,other items for free)
Litter 2 8000 bags (5 gallon) project logo**, debris,bags04* handed to boaters by boating messages on vessel
port, boating safety size bag.group(Coast Guard Auxiliary),and enforcement agents,available from dispenseron launch ramp and in portoffices. 2000 large(35 gallon) beach cleanup bagsgiven to individuals, groups,school classes.
* Brochure was made available for reprinting to other groups and organizationsacross the United States. State agencies, Sea Grant Programs, organizations,and legislators in Alaska, California, Florida, Mississippi, Oregon, SouthCarolina, Texas, and Washington have received copies of the brochure as haveDefenders of Wildlife, National Oceanic and Atmospheric Administration/NMFS,the U.S. Fish and Wildlife Service, and the U.S. Navy.To date 100,000 brochures have been produced for others.
** Project logo is a fish entrapped in a six pack ring, caption reads "Don'tTeach Your Trash to Swim !"
*** Litter bags were designed by Oregon Department of Fish and Wildlife, andOregon State Marine Board with Project assistance.These agencies ordered a total of 40,000 bags, our 8000 bags were orderedadditionally. Beach clean-up bags were made available for free from a groupworking under the State Department of Transportation, called Stop OregonLitter and Vandalism (SOLV).
33
APPENDIX 2 — FINAL PROJECT EVALUATIONS
SUMMARY OF OPINION AND COMMENT SURVEY OF NEWPORT'S COMMERCIAL FISHERMEN
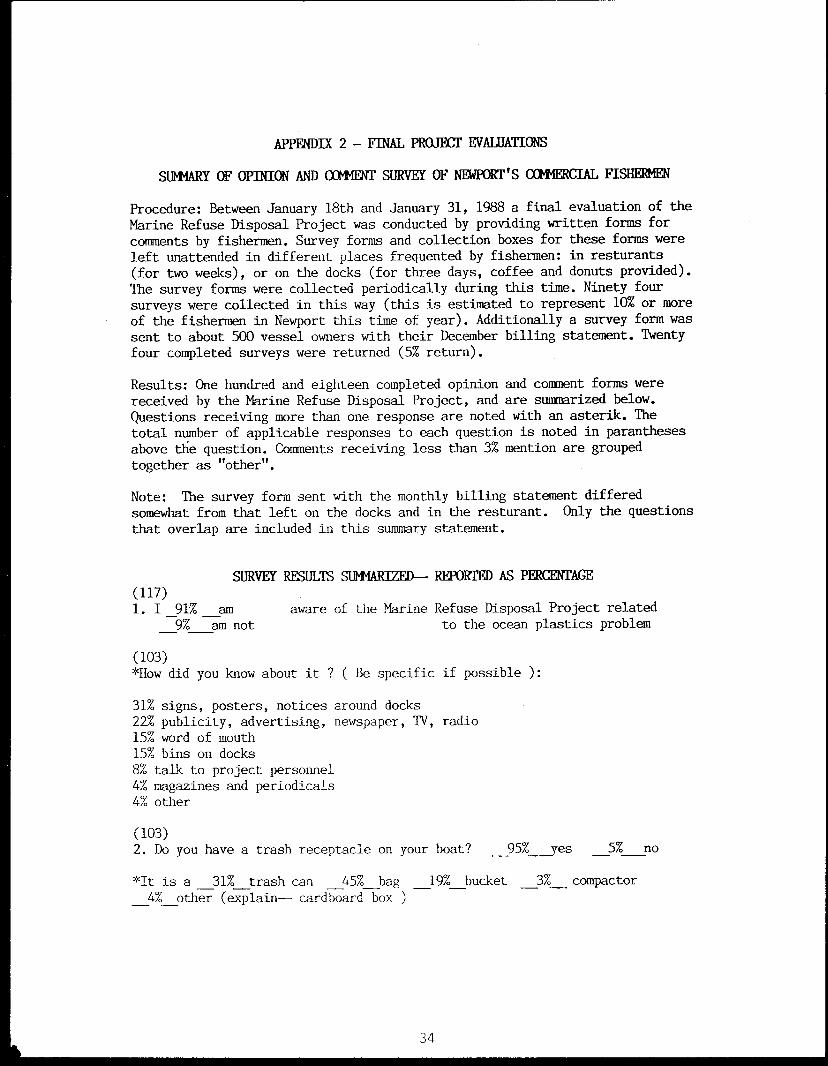
Procedure: Between January 18th and January 31, 1988 a final evaluation of theMarine Refuse Disposal Project was conducted by providing written forms forcomments by fishermen. Survey forms and collection boxes for these forms wereleft unattended in different places frequented by fishermen: in resturants(for two weeks), or on the docks (for three days, coffee and donuts provided).The survey forms were collected periodically during this time. Ninety foursurveys were collected in this way (this is estimated to represent 10% or moreof the fishermen in Newport this time of year). Additionally a survey form wassent to about 500 vessel owners with their December billing statement. Twentyfour completed surveys were returned (5% return).
Results: One hundred and eighteen completed opinion and comment forms werereceived by the Marine Refuse Disposal Project, and are summarized below.Questions receiving more than one response are noted with an asterik. Thetotal number of applicable responses to each question is noted in paranthesesabove the question. Comments receiving less than 3% mention are groupedtogether as "other".
Note: The survey form sent with the monthly billing statement differedsomewhat from that left on the docks and in the resturant. Only the questionsthat overlap are included in this summary statement.
SURVEY RESULTS SII44ARIZED— REPORTED AS PERCENTAGE(117)1. I 91% am aware of the Marine Refuse Disposal Project related
9% am not to the ocean plastics problem
(103)*How did you know about it ? ( Be specific if possible ):
31% signs, posters, notices around docks22% publicity, advertising, newspaper, TV, radio15% word of mouth15% bins on docks8% talk to project personnel4% magazines and periodicals4% other
(103)2. Do you have a trash receptacle on your boat? 95% yes 5% no
*It is a 31% trash can 45% bag 19% bucket 3% compactor4% other (explain— cardboard box )
34
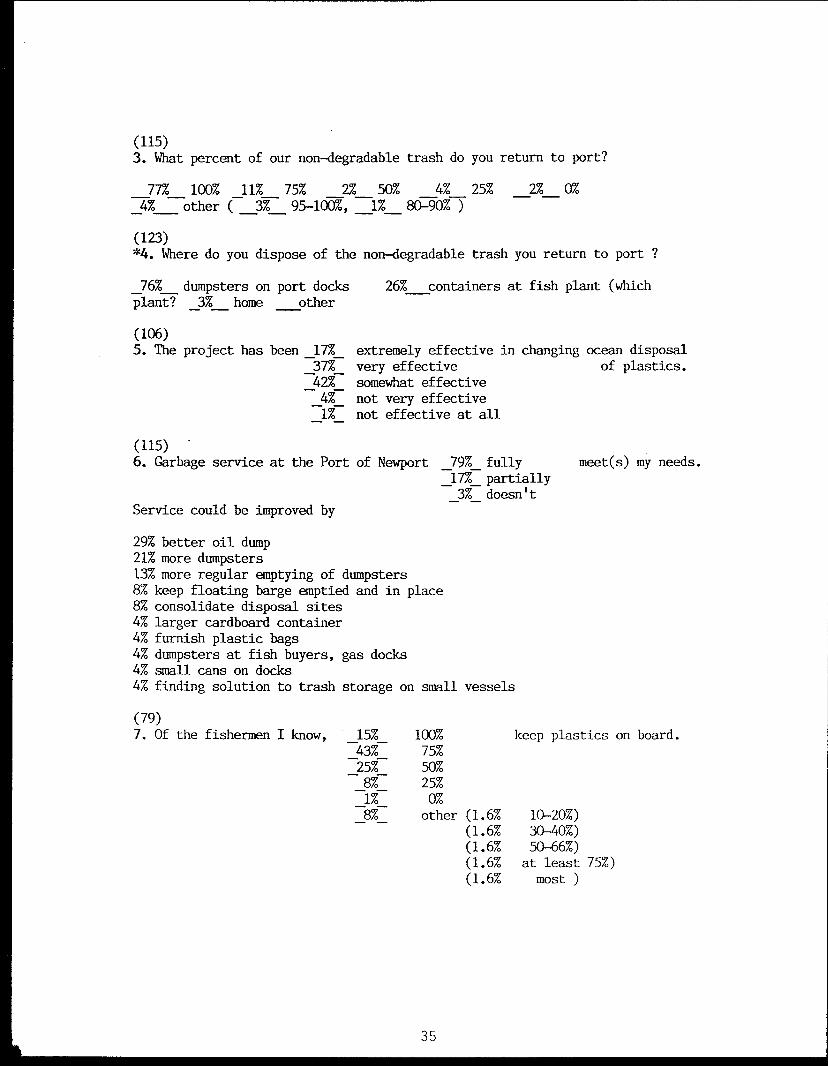
(115)3. What percent of our non-degradable trash do you return to port?
77% 100% 11% 75% 2% 50% 4% 25% 2% 0%4% other ( 37 95-100%, 1% 80-90% )
(123)*4. Where do you dispose of the non-degradable trash you return to port ?
76% dumpsters on port docks 26% containers at fish plant (whichplant? 3% home other
(106)5. The project has been _17% extremely effective in changing ocean disposal
37% very effective of plastics.42% somewhat effective4% not very effective1% not effective at all
(115) •6. Garbage service at the Port of Newport 79% fully
17% partially3% doesn't
Service could be improved by
29% better oil dump21% more dumpsters13% more regular emptying of dumpsters8% keep floating barge emptied and in place8% consolidate disposal sites4% larger cardboard container4% furnish plastic bags4% dumpsters at fish buyers, gas docks4% small cans on docks4% finding solution to trash storage on small vessels
meet(s) my needs.
(79)7. Of the fishermen I know, 15% 100% keep plastics on board.
43% 75%
25% 50%
8% 25%
1% 0%
8% other (1.6% 10-20%)(1.6% 30-40%)(1.6% 50-66%)(1.6% at least 75%)(1.6% most )
35
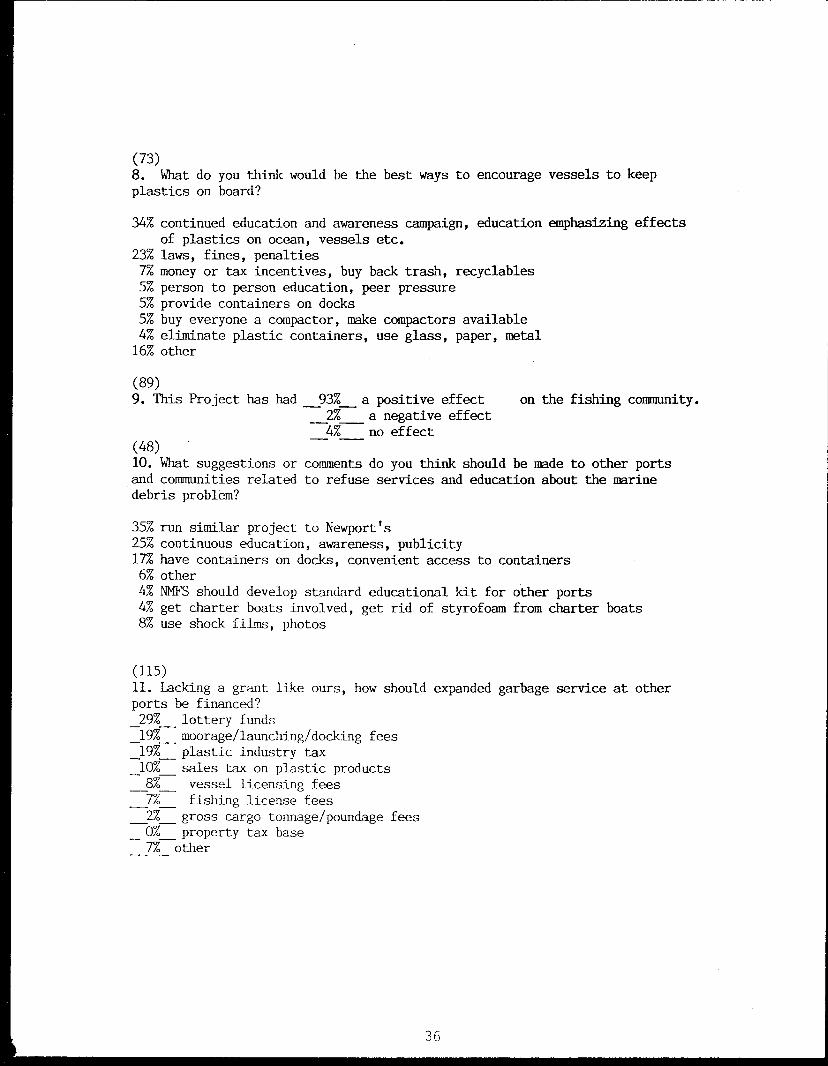
(73)8. What do you think would be the best ways to encourage vessels to keepplastics on board?
34% continued education and awareness campaign, education emphasizing effectsof plastics on ocean, vessels etc.
23% laws, fines, penalties7% money or tax incentives, buy back trash, recyclables5% person to person education, peer pressure5% provide containers on docks5% buy everyone a compactor, make compactors available4% eliminate plastic containers, use glass, paper, metal16% other
(89)9. This Project has had 93% a positive effect on the fishing community.
2% a negative effect
4% no effect(48)10. What suggestions or comments do you think should be made to other portsand comunities related to refuse services and education about the marinedebris problem?
35% run similar project to Newport's25% continuous education, awareness, publicity17% have containers on docks, convenient access to containers6% other4% NMFS should develop standard educational kit for other ports4% get charter boats involved, get rid of styrofoam from charter boats8% use shock films, photos
(115)11. Lacking a grant like ours, how should expanded garbage service at otherports be financed?29% lottery funds
_19% moorage/launching/docking fees19% plastic industry tax_10% sales tax on plastic products8% vessel licensing fees7% fishing license fees2% gross cargo tonnage/poundage fees0% property tax base7% other
36
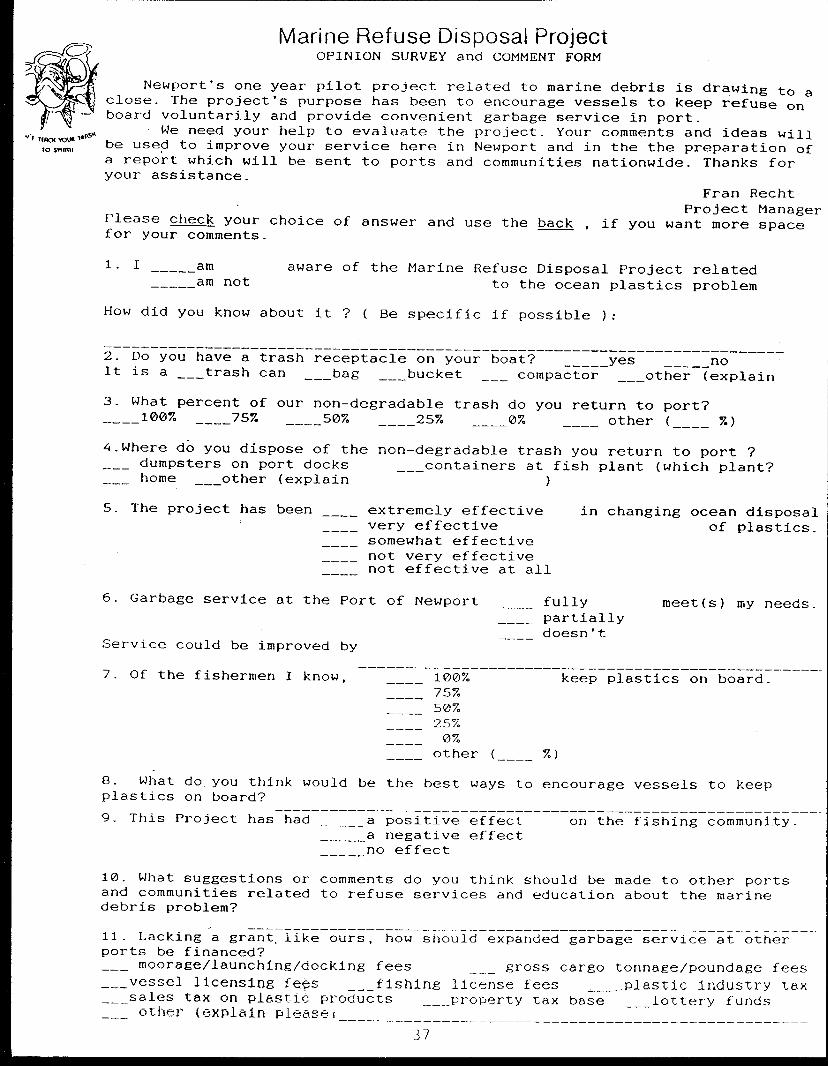
Marine Refuse Disposal ProjectOPINION SURVEY and COMMENT FORM
Newport's one year pilot project related to marine debris is drawing to aclose. The project's purpose has been to encourage vessels to keep refuse onboard voluntarily and provide convenient garbage service in port.
We need your help to evaluate the project. Your comments and ideas willTif104 YOUR 7777° '
be used to improve your service here in Newport and in the the preparation of
Fran RechtProject Manager
Please check your choice of answer and use the back , if you want more spacefor your comments.
1. I am aware of the Marine Refuse Disposal Project related
am not to the ocean plastics problem
How did you know about it ? ( Be specific if possible ):
2. Do you have a trash receptacle on your boat? yes noIt is a trash can bag bucket compactor other (explain___ ___ ___ ___
3. What percent of our non-degradable trash do you return to port?100% 75% 50% 25% 0% other ( 7.)_ ____ ____ ____ ____ ____
4.Where do you dispose of the non-degradable trash you return to port ?dumpsters on port docks containers at fish plant (which plant?___ ___home other (explain )
5. The project has been ____ extremely effective in changing ocean disposalvery effective of plastics.somewhat effectivenot very effectivenot effective at all
6. Garbage service at the Port of Newport
fully meet(s) my needs.____ partially
doesn'tService could be improved by
7. Of the fishermen I know, 100%75%50%25%0%
other ( %)
keep plastics on board.
8. What do you think would be the best ways to encourage vessels to keepplastics on board?
9. This Project has had a positive effect on the fishing community. a negative effect
no effect
10. What suggestions or comments do you think should be made to other portsand communities related to refuse services and education about the marinedebris problem?
11. Lacking a grant , like ours, how should expanded garbage service at otherports be financed?
moorage/launching/docking fees gross cargo tonnage/poundage feesvessel licensing fees fishing license fees _Plastic industry taxsales tax on plastic products property tax base lottery fundsother (explain please
To s.sma report which will be sent to ports and communities nationwide. Thanks foryour assistance.
37
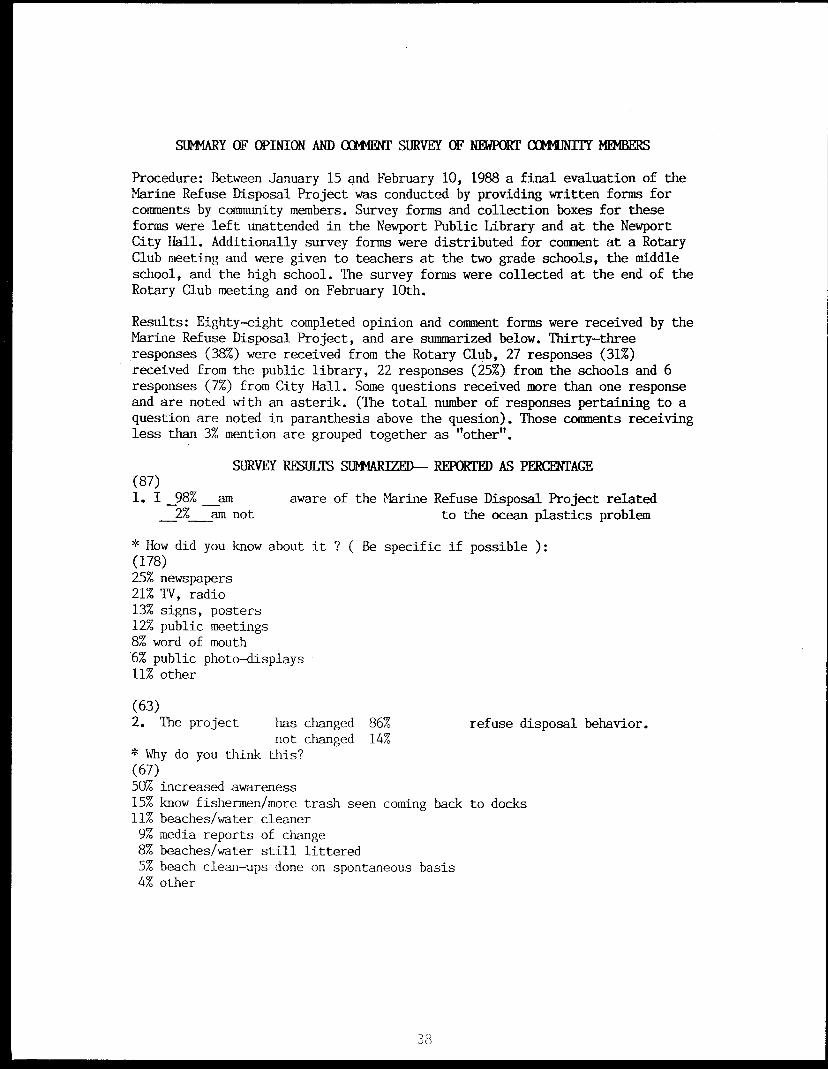
SUMMARY OF OPINION AND COMMENT SURVEY OF NEWPORT COMUNITY MEMBERS
Procedure: Between January 15 and February 10, 1988 a final evaluation of theMarine Refuse Disposal Project was conducted by providing written forms forcomments by community members. Survey forms and collection boxes for theseforms were left unattended in the Newport Public Library and at the NewportCity Hall. Additionally survey forms were distributed for comment at a RotaryClub meeting and were given to teachers at the two grade schools, the middleschool, and the high school. The survey forms were collected at the end of theRotary Club meeting and on February 10th.
Results: Eighty-eight completed opinion and comment forms were received by theMarine Refuse Disposal Project, and are summarized below. Thirty-threeresponses (38%) were received from the Rotary Club, 27 responses (31%)received from the public library, 22 responses (25%) from the schools and 6responses (7%) from City Hall. Some questions received more than one responseand are noted with an asterik. (The total number of responses pertaining to aquestion are noted in paranthesis above the quesion). Those comments receivingless than 3% mention are grouped together as "other".
SURVEY RESULTS SUMMARIZED- REPORTED AS PERCEENGE(87)1. I 98% am aware of the Marine Refuse Disposal Project related
2% am not
to the ocean plastics problem
* How did you know about it ?(178)25% newspapers21% TV, radio13% signs, posters12% public meetings8% word of mouth6% public photo-displays11% other
( Be specific if possible ):
(63)2. The project has changed 86%
refuse disposal behavior.not changed 14%
* Why do you think this?(67)50% increased awareness15% know fishermen/more trash seen coming back to docks11% beaches/water cleaner9% media reports of change8% beaches/water still littered5% beach clean-ups done on spontaneous basis4% other
38
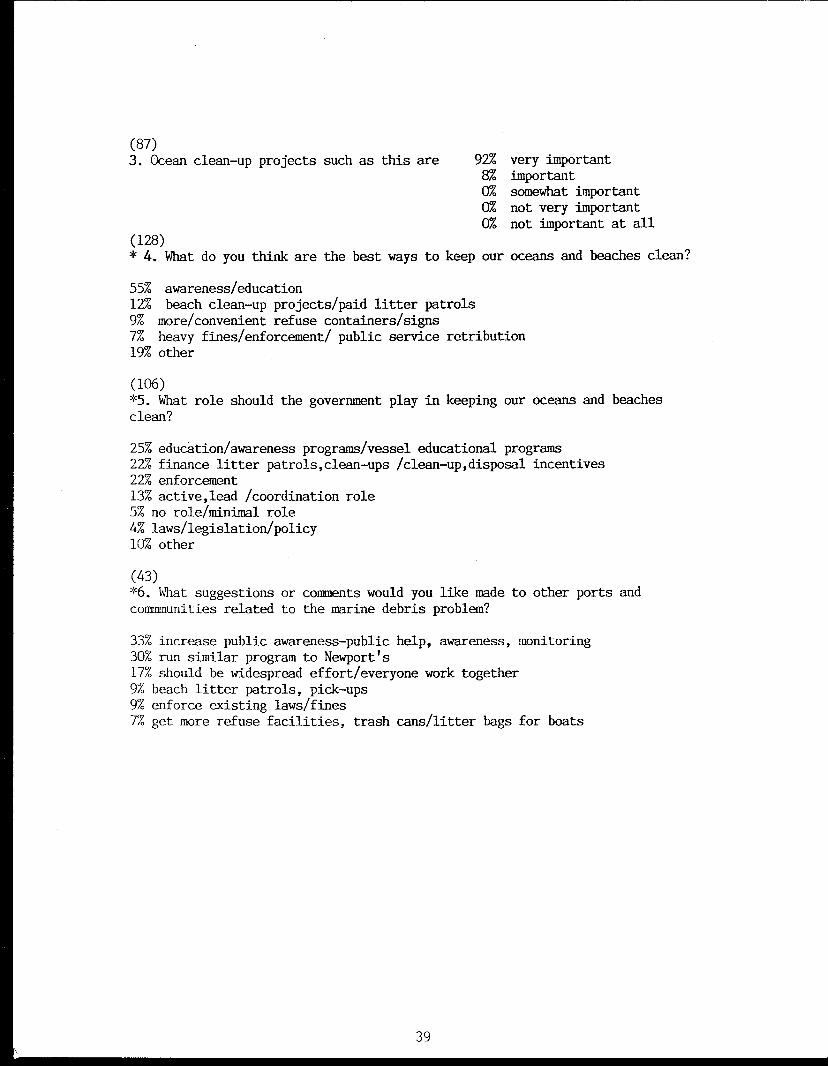
(87)3. Ocean clean-up projects such as this are 92% very important
8% important0% somewhat important0% not very important0% not important at all
(128)* 4. What do you think are the best ways to keep our oceans and beaches clean?
55% awareness/education12% beach clean-up projects/paid litter patrols9% more/convenient refuse containers/signs7% heavy fines/enforcement/ public service retribution19% other
(106)*5.What role should the government play in keeping our oceans and beachesclean?
25% education/awareness programs/vessel educational programs22% finance litter patrols,clean-ups /clean-up,disposal incentives22% enforcement13% active,lead /coordination role5% no role/minimal role4% laws/legislation/policy10% other
(43)*6. What suggestions or comments would you like made to other ports andcommmunities related to the marine debris problem?
33% increase public awareness-public help, awareness, monitoring30% run similar program to Newport's17% should be widespread effort/everyone work together9% beach litter patrols, pick-ups9% enforce existing laws/fines7% get more refuse facilities, trash cans/litter bags for boats
39
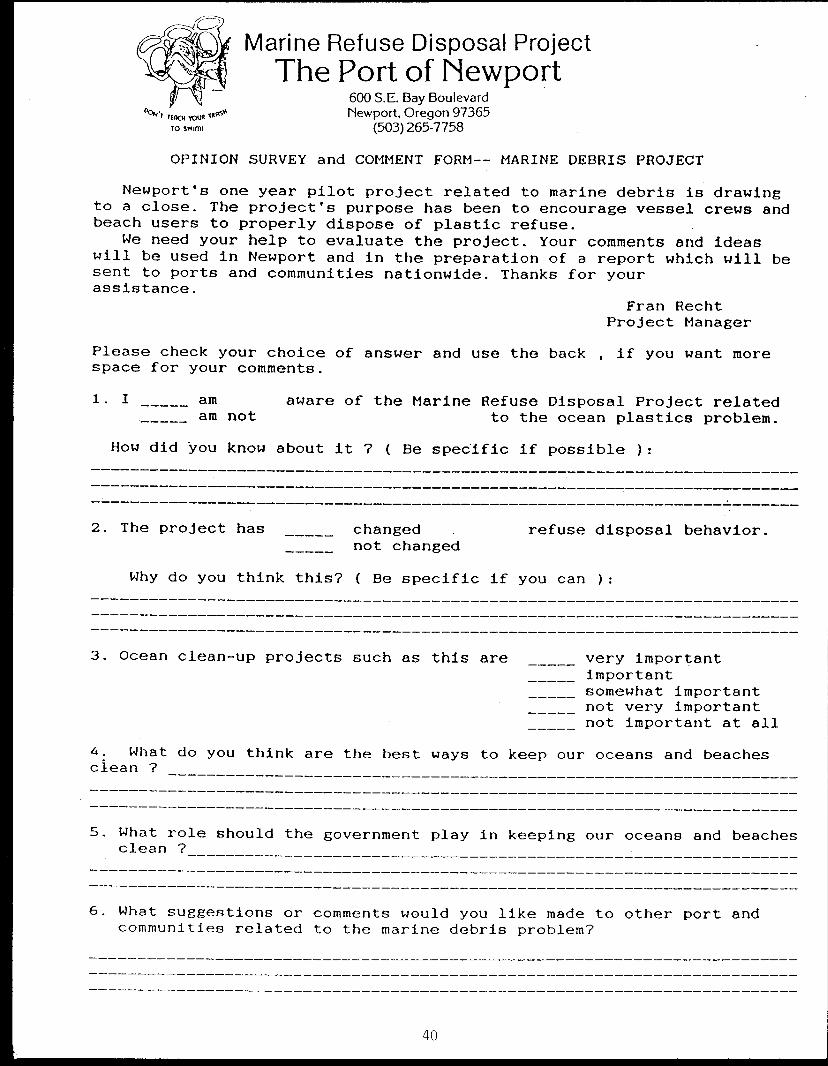
Marine Refuse Disposal ProjectThe Port of Newport
600 S.E. Bay BoulevardNewport, Oregon 97365
(503) 265-7758
OPINION SURVEY and COMMENT FORM-- MARINE DEBRIS PROJECT
Newport's one year pilot project related to marine debris is drawingto a close. The project's purpose has been to encourage vessel crews andbeach users to properly dispose of plastic refuse.
We need your help to evaluate the project. Your comments and ideaswill be used in Newport and in the preparation of a report which will besent to ports and communities nationwide. Thanks for yourassistance.
Fran RechtProject Manager
Please check your choice of answer and use the back , if you want morespace for your comments.
1. I am aware of the Marine Refuse Disposal Project related am not to the ocean plastics problem.
How did you know about it ? ( Be specific if possible ):
2. The project has changed refuse disposal behavior.not changed
Why do you think this? ( Be specific if you can ):
3. Ocean clean-up projects such as this are very important important somewhat important not very important not important at all
4 : what do you think are the best ways to keep our oceans and beachesclean ?
S. What role should the government play in keeping our oceans and beachesclean ?
6. What suggestions or comments would you like made to other port andcommunities related to the marine debris problem?
40
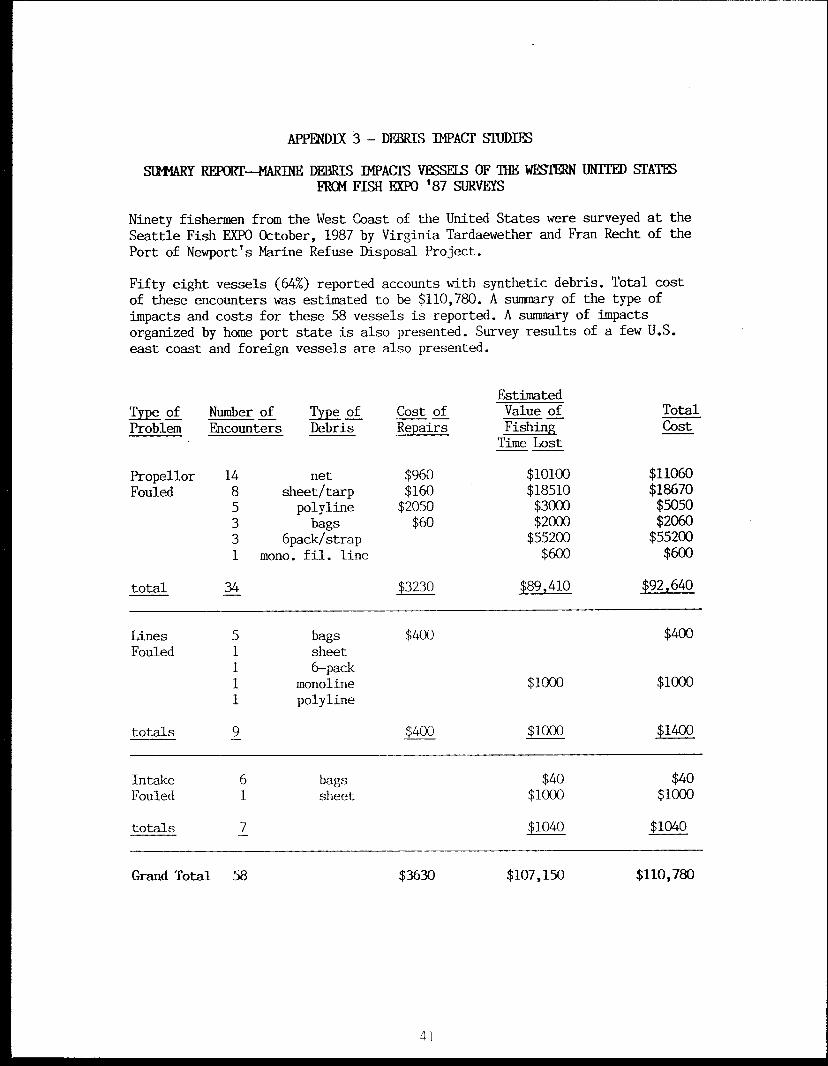
APPENDIX 3 - DEBRIS IMPACT STUDIES
SUMMARY REPORT—MARINE DEBRIS IMPACTS VESSELS OF THE WESTERN UNITED STATESFROM FISH EXPO '87 SURVEYS
Ninety fishermen from the West Coast of the United States were surveyed at theSeattle Fish EXPO October, 1987 by Virginia Tardaewether and Fran Recht of thePort of Newport's Marine Refuse Disposal Project.
Fifty eight vessels (64%) reported accounts with synthetic debris. Total costof these encounters was estimated to be $110,780. A summary of the type ofimpacts and costs for these 58 vessels is reported. A summary of impactsorganized by home port state is also presented. Survey results of a few U.S.east coast and foreign vessels are also presented.
EstimatedType of Number of Type of Cost of Value of TotalProblem Encounters Debris Repairs Fishing Cost
Time Lost
Propellor 14 net $960 $10100 $11060Fouled 8 sheet/tarp $160 $18510 $18670
5 polyline $2050 $3000 $50503 bags $60 $2000 $20603 6pack/strap $55200 $552001 mono. fil. line $600 $600
total 34 $3230 $89,410 $92,640
Lines 5 bags $400 $400Fouled 1 sheet
1 6-pack1 monoline $1000 $10001 polyline
totals 9 $400 $1000 $1400
Intake 6 bags $40 $40Fouled 1 sheet $1000 $1000
totals 7 $1040 $1040
Grand Total 58 $3630 $107,150 $110,780
41
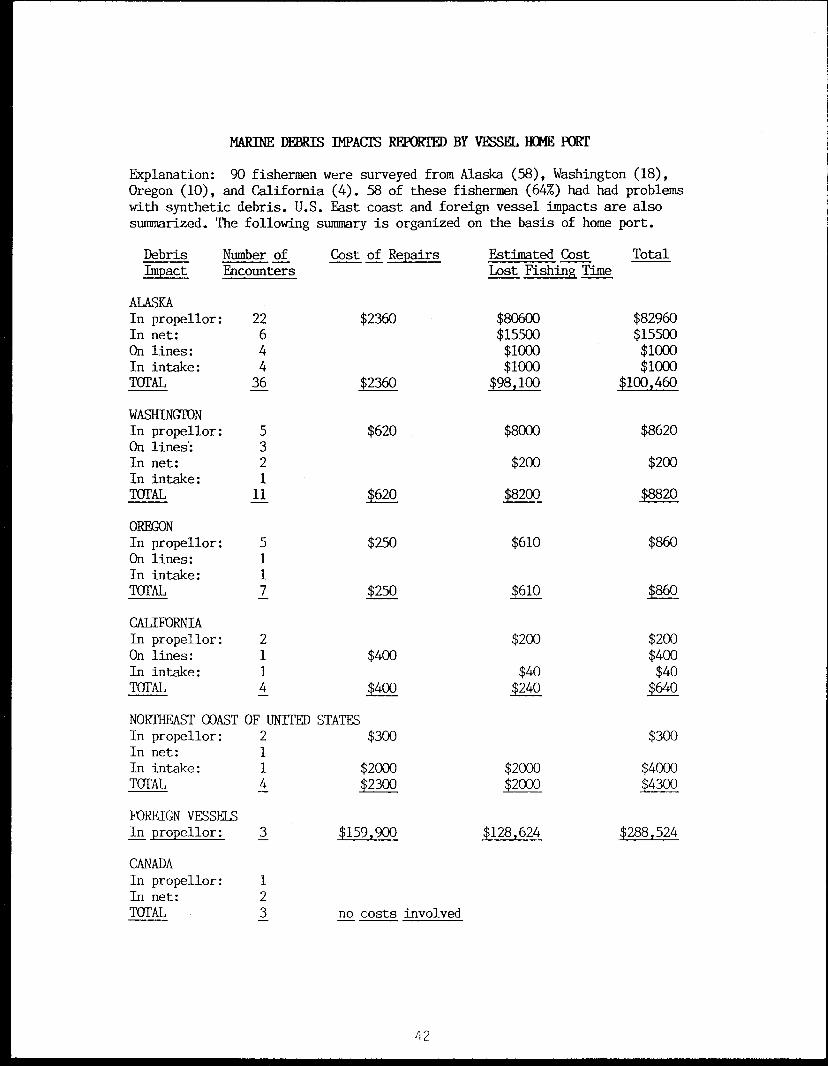
MARINE DEBRIS IMPACIS REPORTED BY VESSEL HOME PORT
Explanation: 90 fishermen were surveyed from Alaska (58), Washington (18),Oregon (10), and California (4). 58 of these fishermen (64%) had had problemswith synthetic debris. U.S. East coast and foreign vessel impacts are alsosummarized. The following summary is organized on the basis of home port.
Debris Number of Cost of Repairs Estimated Cost TotalImpact Encounters Lost Fishing Time
ALASKAIn propellor: 22 $2360 $80600 $82960In net: 6 $15500 $15500On lines: 4 $1000 $1000In intake: 4 $1000 $1000TOTAL 36 $2360 $98,100 $100,460
WASHINGTONIn propellor: 5 $620 $8000 $8620On lines: 3In net: 2 $200 $200In intake: 1TOTAL 11 $620 $8200 $8820
OREGONIn propellor: 5 $250 $610 $860On lines: 1In intake: 1TOTAL 7 $250 $610 $860
CALIFORNIAIn propellor: 2 $200 $200On lines: 1 $400 $400In intake: 1 $40 $40TOTAL 4 $400 $240 $640
NORTHEAST COAST OF UNITED STATESIn propellor: 2 $300 $300In net: 1In intake: 1 $2000 $2000 $4000TOTAL 4 $2300 $2000 $4300
FOREIGN VESSELSIn propellor: 3 $159,900 $128,624 $288,524
CANADAIn propellor: 1In net: 2TOTAL 3 no costs involved
42
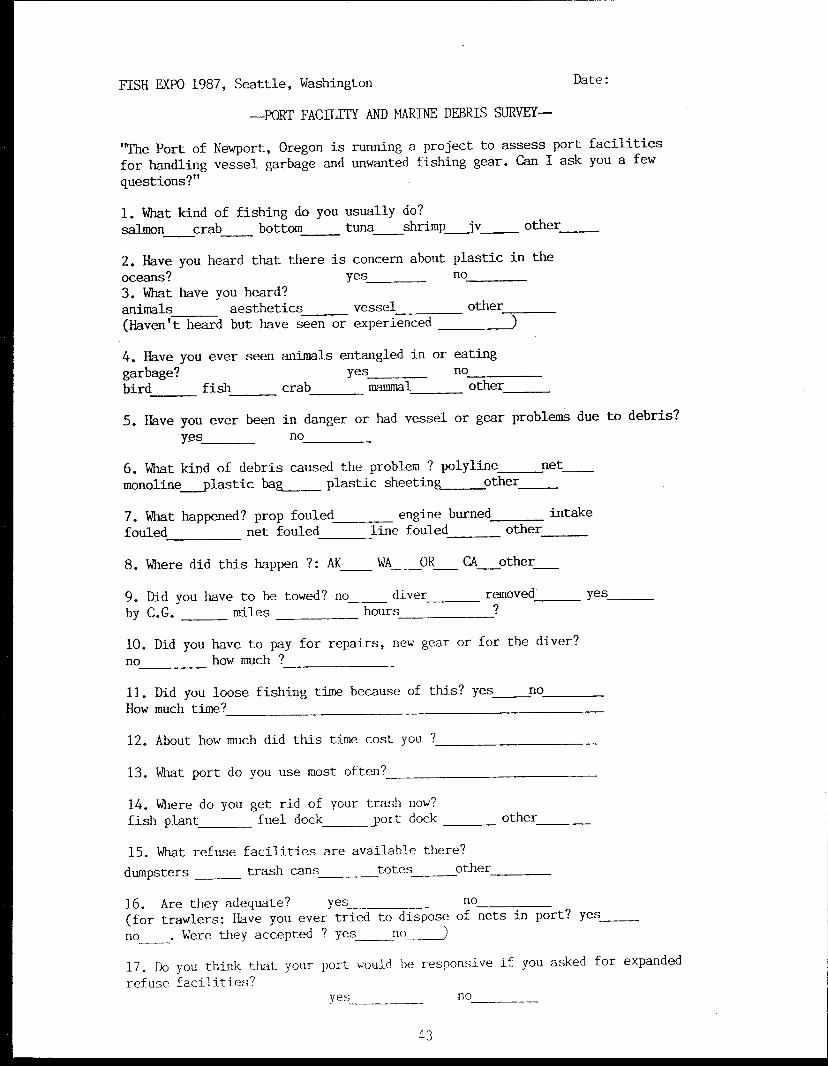
FISH EXPO 1987, Seattle, Washington Date:
—PORT FACILITY AND MARINE DEBRIS SURVEY
"The Port of Newport, Oregon is running a project to assess port facilitiesfor handling vessel garbage and unwanted fishing gear. Can I ask you a few
questions?"
1. What kind of fishing do you usually do?salmon crab bottom tuna shrimp jv other
2. Have you heard that there is concern about plastic in the
oceans? yes no
3. What have you heard?animals aesthetics vessel other
(Haven't heard but have seen or experienced )
4. Have you ever seen animals entangled in or eating
garbage? yes no
bird fish crab mammal other
5. Have you ever been in danger or had vessel or gear problems due to debris?
yes no
6. What kind of debris caused the problem ? polyline net
monoline plastic bag plastic sheeting other
7. What happened? prop fouled engine burned intake
fouled net fouled line fouled other
8. Where did this happen ?: AK WA OR CA other
9. Did you have to be towed? no diver removed yes
by C.G. miles hours
10. Did you have to pay for repairs, new gear or for the diver?
no how much ?
11. Did you loose fishing time because of this? yes no
How much time?
12. About how much did this time cost you ?
13. What port do you use most often?
14. Where do you get rid of your trash now?fish plant fuel dock port dock other
15. What refuse facilities are available there?
dumpsters trash cans totes other
16. Are they adequate? yes no(for trawlers: Have you ever tried to dispose of nets in port? yes
no . Were they accepted ? yes no )
17. Do you think that your port would be responsive if you asked for expanded
refuse facilities?yes no
43
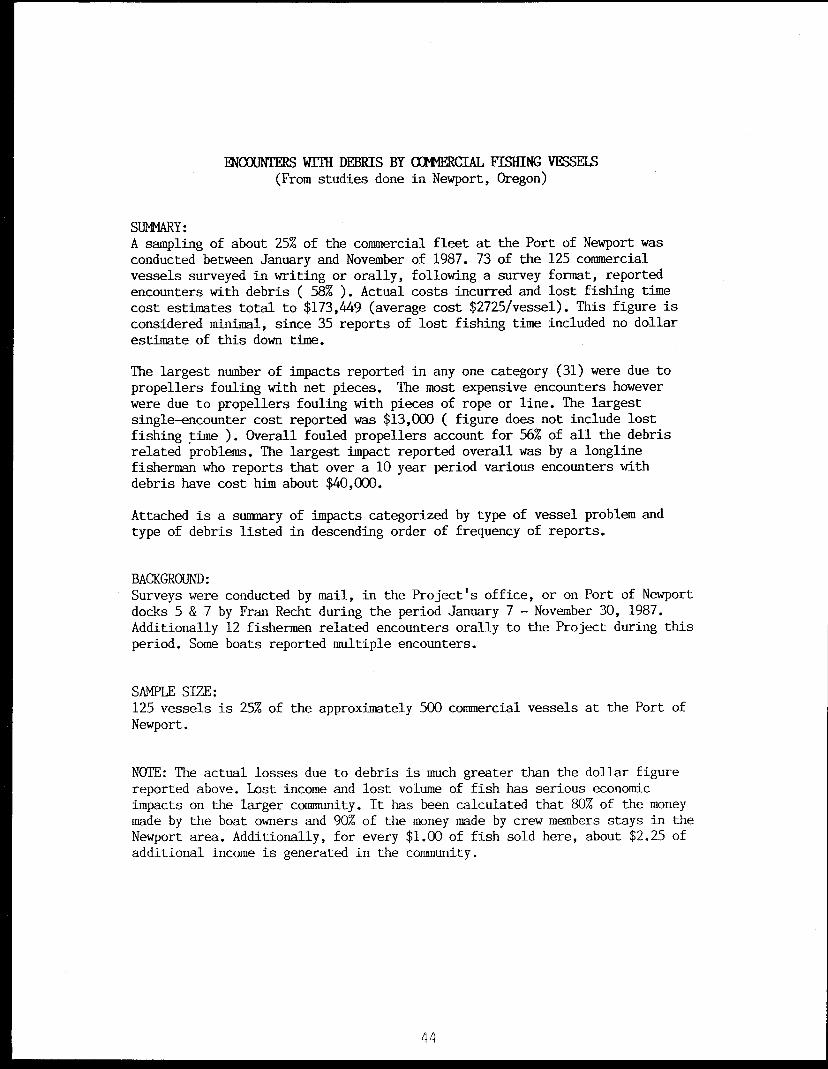
ENCOUNTERS WITH DEBRIS BY COMMERCIAL FISHING VESSEIS(From studies done in Newport, Oregon)
SUMMARY:A sampling of about 25% of the commercial fleet at the Port of Newport wasconducted between January and November of 1987. 73 of the 125 commercialvessels surveyed in writing or orally, following a survey format, reportedencounters with debris ( 58% ). Actual costs incurred and lost fishing timecost estimates total to $173,449 (average cost $2725/vessel). This figure isconsidered minimal, since 35 reports of lost fishing time included no dollarestimate of this down time.
The largest number of impacts reported in any one category (31) were due topropellers fouling with net pieces. The most expensive encounters howeverwere due to propellers fouling with pieces of rope or line. The largestsingle-encounter cost reported was $13,000 ( figure does not include lostfishing time ). Overall fouled propellers account for 56% of all the debrisrelated problems. The largest impact reported overall was by a longlinefisherman who reports that over a 10 year period various encounters withdebris have cost him about $40,000.
Attached is a summary of impacts categorized by type of vessel problem andtype of debris listed in descending order of frequency of reports.
BACKGROUND:Surveys were conducted by mail, in the Project's office, or on Port of Newportdocks 5 & 7 by Fran Recht during the period January 7 - November 30, 1987.Additionally 12 fishermen related encounters orally to the Project during thisperiod. Some boats reported multiple encounters.
SAMPLE SIZE:125 vessels is 25% of the approximately 500 commercial vessels at the Port ofNewport.
NOTE: The actual losses due to debris is much greater than the dollar figurereported above. Lost income and lost volume of fish has serious economicimpacts on the larger community. It has been calculated that 80% of the moneymade by the boat owners and 90% of the money made by crew members stays in theNewport area. Additionally, for every $1.00 of fish sold here, about $2.25 ofadditional income is generated in the community.
44
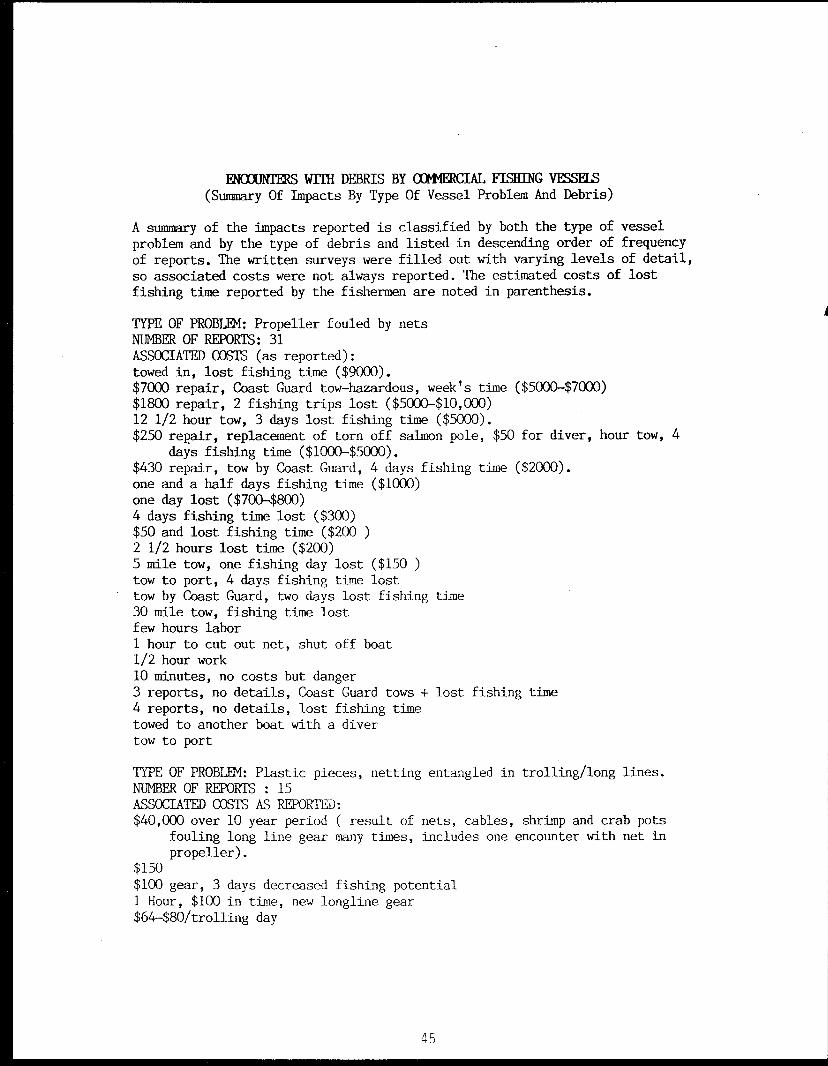
ENCOUNTERS WITH DEBRIS BY COMMERCIAL FISHING VESSELS(Summary Of Impacts By Type Of Vessel Problem And Debris)
A summary of the impacts reported is classified by both the type of vesselproblem and by the type of debris and listed in descending order of frequencyof reports. The written surveys were filled out with varying levels of detail,so associated costs were not always reported. The estimated costs of lostfishing time reported by the fishermen are noted in parenthesis.
TYPE OF PROBLEM: Propeller fouled by netsNUMBER OF REPORTS: 31ASSOCIATED COSTS (as reported):towed in, lost fishing time ($9000).$7000 repair, Coast Guard tow-hazardous, week's time ($5000-$7000)$1800 repair, 2 fishing trips lost ($5000-$10,000)12 1/2 hour tow, 3 days lost fishing time ($5000).$250 repair, replacement of torn off salmon pole, $50 for diver, hour tow, 4
days fishing time ($1000-$5000).$430 repair, tow by Coast Guard, 4 days fishing time ($2000).one and a half days fishing time ($1000)one day lost ($700-$800)4 days fishing time lost ($300)$50 and lost fishing time ($200 )2 1/2 hours lost time ($200)5 mile tow, one fishing day lost ($150 )tow to port, 4 days fishing time losttow by Coast Guard, two days lost fishing time30 mile tow, fishing time lostfew hours labor1 hour to cut out net, shut off boat1/2 hour work10 minutes, no costs but danger3 reports, no details, Coast Guard tows + lost fishing time4 reports, no details, lost fishing timetowed to another boat with a divertow to port
TYPE OF PROBLEM: Plastic pieces, netting entangled in trolling/long lines.NUMBER OF REPORTS : 15ASSOCIATED COSTS AS REPORTED:$40,000 over 10 year period ( result of nets, cables, shrimp and crab pots
fouling long line gear many times, includes one encounter with net inpropeller).
$150$100 gear, 3 days decreased fishing potential1 Hour, $100 in time, new longline gear$64-$80/trolling day
45
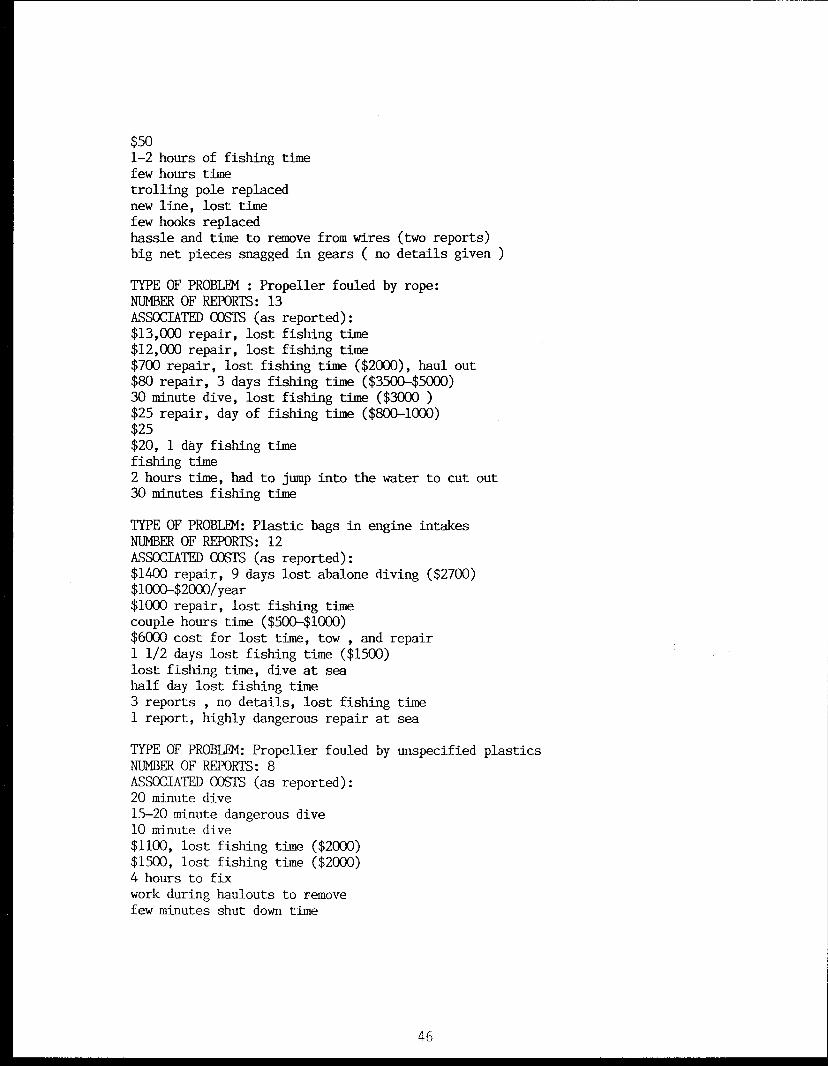
$501-2 hours of fishing timefew hours timetrolling pole replacednew line, lost timefew hooks replacedhassle and time to remove from wires (two reports)big net pieces snagged in gears ( no details given )
TYPE OF PROBLEM : Propeller fouled by rope:NUMBER OF REPORTS: 13ASSOCIATED COSTS (as reported):$13,000 repair, lost fishing time$12,000 repair, lost fishing time$700 repair, lost fishing time ($2000), haul out$80 repair, 3 days fishing time ($3500-$5000)30 minute dive, lost fishing time ($3000 )$25 repair, day of fishing time ($800-1000)$25$20, 1 day fishing timefishing time2 hours time, had to jump into the water to cut out30 minutes fishing time
TYPE OF PROBLEM: Plastic bags in engine intakesNUMBER OF REPORTS: 12ASSOCIATED COSTS (as reported):$1400 repair, 9 days lost abalone diving ($2700)$1000-$2000/year$1000 repair, lost fishing timecouple hours time ($500-$1000)$6000 cost for lost time, tow , and repair1 1/2 days lost fishing time ($1500)lost fishing time, dive at seahalf day lost fishing time3 reports , no details, lost fishing time1 report, highly dangerous repair at sea
TYPE OF PROBLEM: Propeller fouled by unspecified plasticsNUMBER OF REPORTS: 8ASSOCIATED COSTS (as reported):20 minute dive15-20 minute dangerous dive10 minute dive$1100, lost fishing time ($2000)$1500, lost fishing time ($2000)4 hours to fixwork during haulouts to removefew minutes shut down time
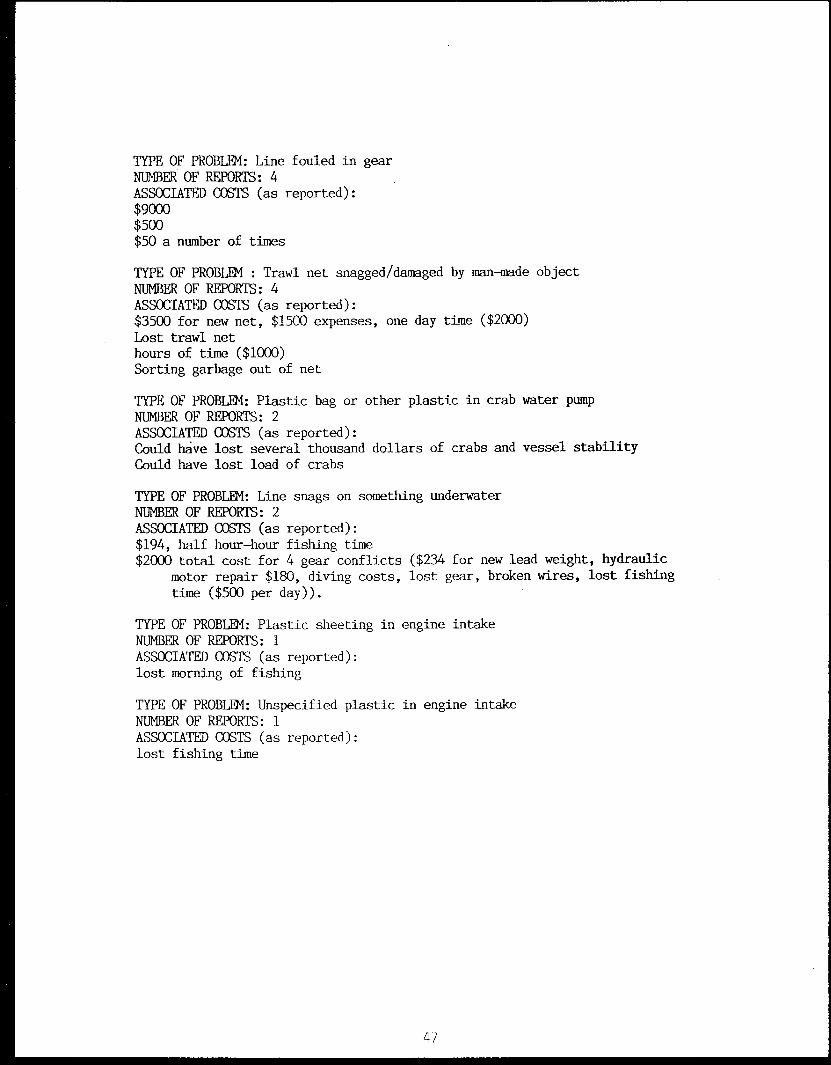
TYPE OF PROBLEM: Line fouled in gearNUMBER OF REPORTS: 4ASSOCIATED COSTS (as reported):$9000$500$50 a number of times
TYPE OF PROBLEM : Trawl net snagged/damaged by man-made objectNUMBER OF REPORTS: 4ASSOCIATED COSTS (as reported):$3500 for new net, $1500 expenses, one day time ($2000)Lost trawl nethours of time ($1000)Sorting garbage out of net
TYPE OF PROBLEM: Plastic bag or other plastic in crab water pumpNUMBER OF REPORTS: 2ASSOCIATED COSTS (as reported):Could have lost several thousand dollars of crabs and vessel stabilityCould have lost load of crabs
TYPE OF PROBLEM: Line snags on something underwaterNUMBER OF REPORTS: 2ASSOCIATED COSTS (as reported):$194, half hour-hour fishing time$2000 total cost for 4 gear conflicts ($234 for new lead weight, hydraulic
motor repair $180, diving costs, lost gear, broken wires, lost fishingtime ($500 per day)).
TYPE OF PROBLEM: Plastic sheeting in engine intakeNUMBER OF REPORTS: 1ASSOCIATED COSTS (as reported):lost morning of fishing
TYPE OF PROBLEM: Unspecified plastic in engine intakeNUMBER OF REPORTS: 1ASSOCIATED COSTS (as reported):lost fishing time
47
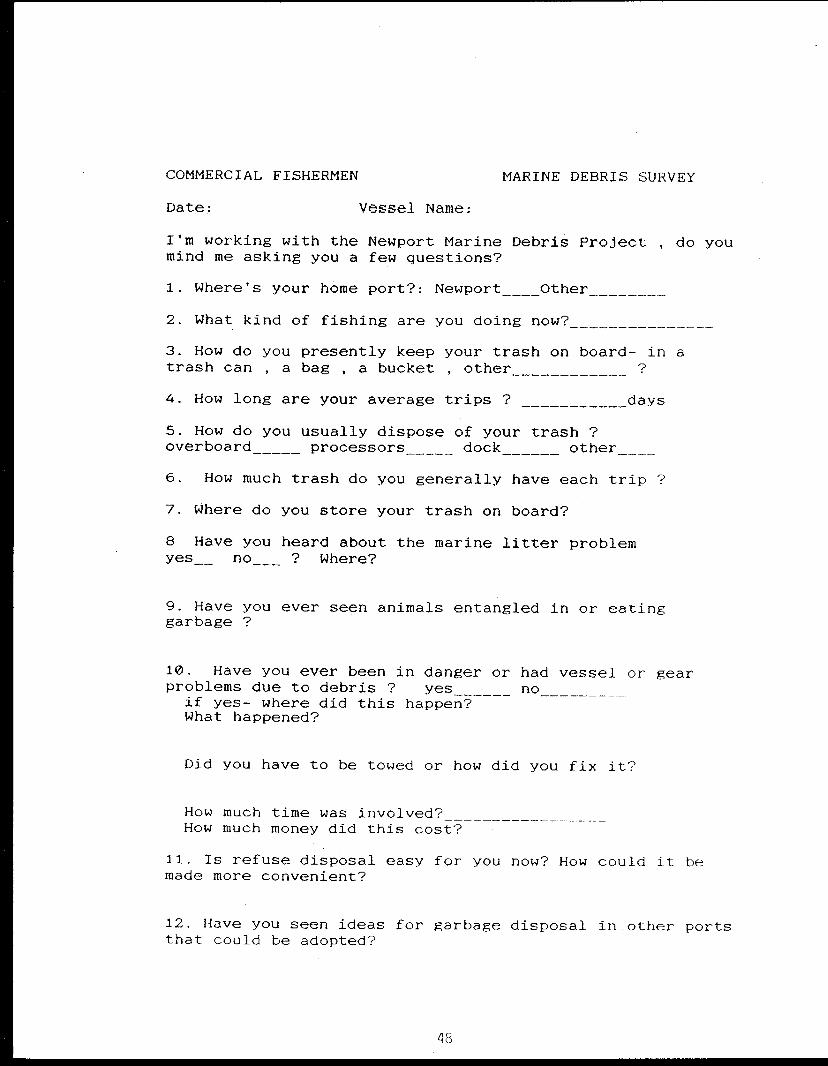
COMMERCIAL FISHERMEN MARINE DEBRIS SURVEY
Date: Vessel Name:
I'm working with the Newport Marine Debris Project , do youmind me asking you a few questions?
1. Where's your home port?: Newport____Other
2. What kind of fishing are you doing now?
3. How do you presently keep your trash on board- in atrash can , a bag , a bucket , other
4. How long are your average trips ? days
5. How do you usually dispose of your trash ?overboard processors dock other
6. How much trash do you generally have each trip ?
7. Where do you store your trash on board?
8 Have you heard about the marine litter problemyes__ no___ ? Where?
9. Have you ever seen animals entangled in or eatinggarbage ?
10. Have you ever been in danger or had vessel or gearproblems due to debris ? yes no if yes- where did this happen?What happened?
Did you have to be towed or how did you fix it?
How much time was involved?How much money did this cost?
11. Is refuse disposal easy for you now? How could it bemade more convenient?
12. Have you seen ideas for garbage disposal in other portsthat could be adopted?
48
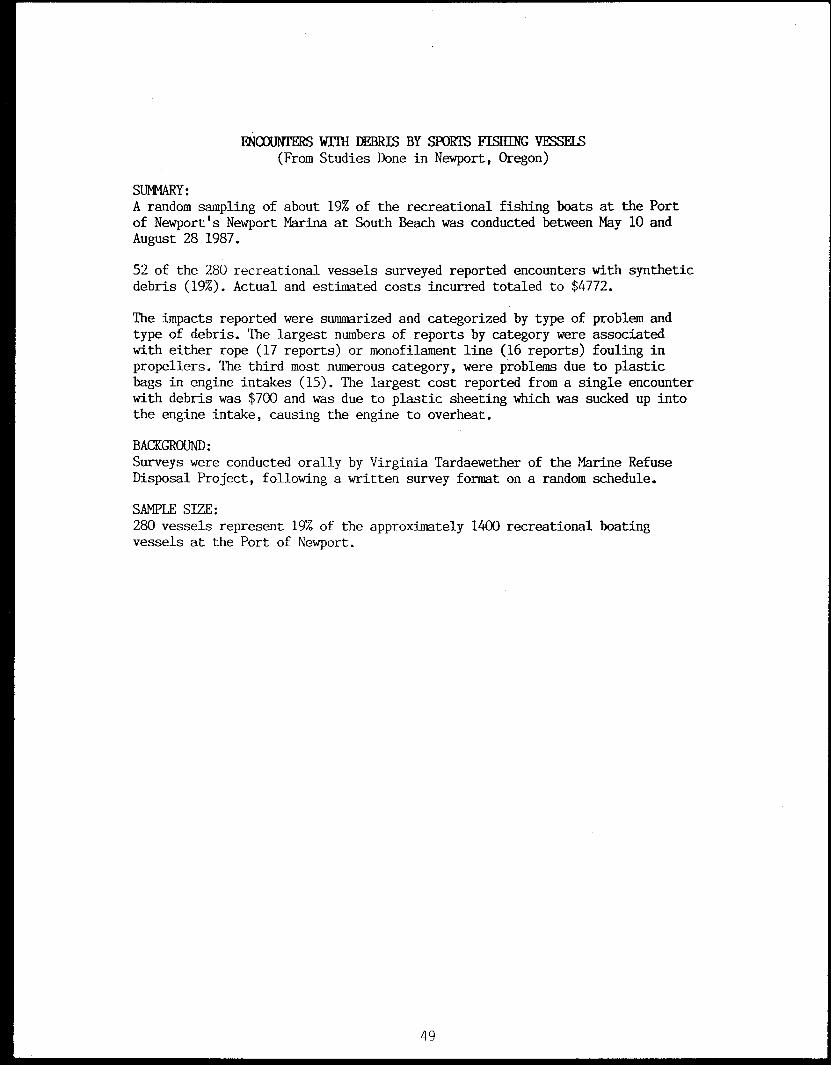
ENCOUNTERS WITH DEBRIS BY SPORTS FISHING VESSELS(From Studies Done in Newport, Oregon)
SUMMARY:A random sampling of about 19% of the recreational fishing boats at the Portof Newport's Newport Marina at South Beach was conducted between May 10 andAugust 28 1987.
52 of the 280 recreational vessels surveyed reported encounters with syntheticdebris (19%). Actual and estimated costs incurred totaled to $4772.
The impacts reported were summarized and categorized by type of problem andtype of debris. The largest numbers of reports by category were associatedwith either rope (17 reports) or monofilament line (16 reports) fouling inpropellers. The third most numerous category, were problems due to plasticbags in engine intakes (15). The largest cost reported from a single encounterwith debris was $700 and was due to plastic sheeting which was sucked up intothe engine intake, causing the engine to overheat.
BACKGROUND:Surveys were conducted orally by Virginia Tardaewether of the Marine RefuseDisposal Project, following a written survey format on a random schedule.
SAMPLE SIZE:280 vessels represent 19% of the approximately 1400 recreational boatingvessels at the Port of Newport.
49
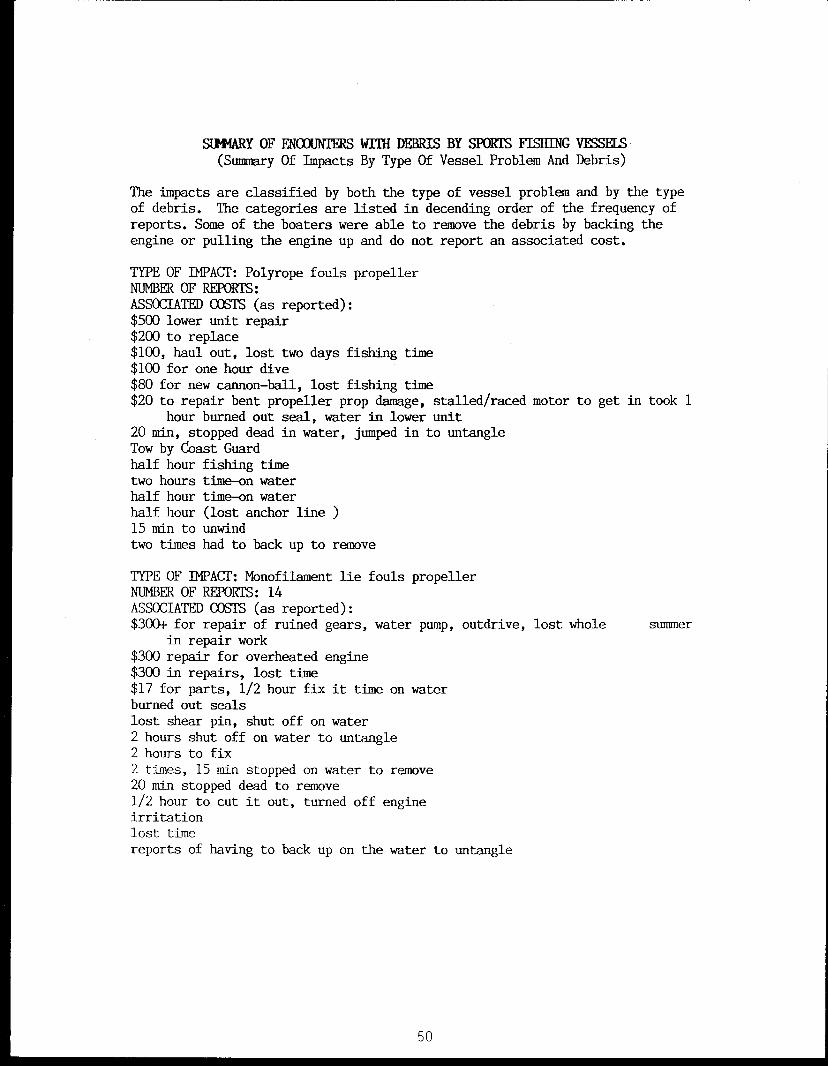
SUMMARY OF ENCOUNTERS WITH DEBRIS BY SPORTS FISHING VESSFLS(Summary Of Impacts By Type Of Vessel Problem And Debris)
The impacts are classified by both the type of vessel problem and by the typeof debris. The categories are listed in decending order of the frequency ofreports. Some of the boaters were able to remove the debris by backing theengine or pulling the engine up and do not report an associated cost.
TYPE OF IMPACT: Polyrope fouls propellerNUMBER OF REPORTS:ASSOCIATED COSTS (as reported):$500 lower unit repair$200 to replace$100, haul out, lost two days fishing time$100 for one hour dive$80 for new cannon-ball, lost fishing time$20 to repair bent propeller prop damage, stalled/raced motor to get in took 1
hour burned out seal, water in lower unit20 min, stopped dead in water, jumped in to untangleTow by Coast Guardhalf hour fishing timetwo hours time-on waterhalf hour time-on waterhalf hour (lost anchor line )15 min to unwindtwo times had to back up to remove
TYPE OF IMPACT: Monofilament lie fouls propellerNUMBER OF REPORTS: 14ASSOCIATED COSTS (as reported):$300+ for repair of ruined gears, water pump, outdrive, lost whole summer
in repair work$300 repair for overheated engine$300 in repairs, lost time$17 for parts, 1/2 hour fix it time on waterburned out sealslost shear pin, shut off on water2 hours shut off on water to untangle2 hours to fix2 times, 15 min stopped on water to remove20 min stopped dead to remove1/2 hour to cut it out, turned off engineirritationlost timereports of having to back up on the water to untangle
50
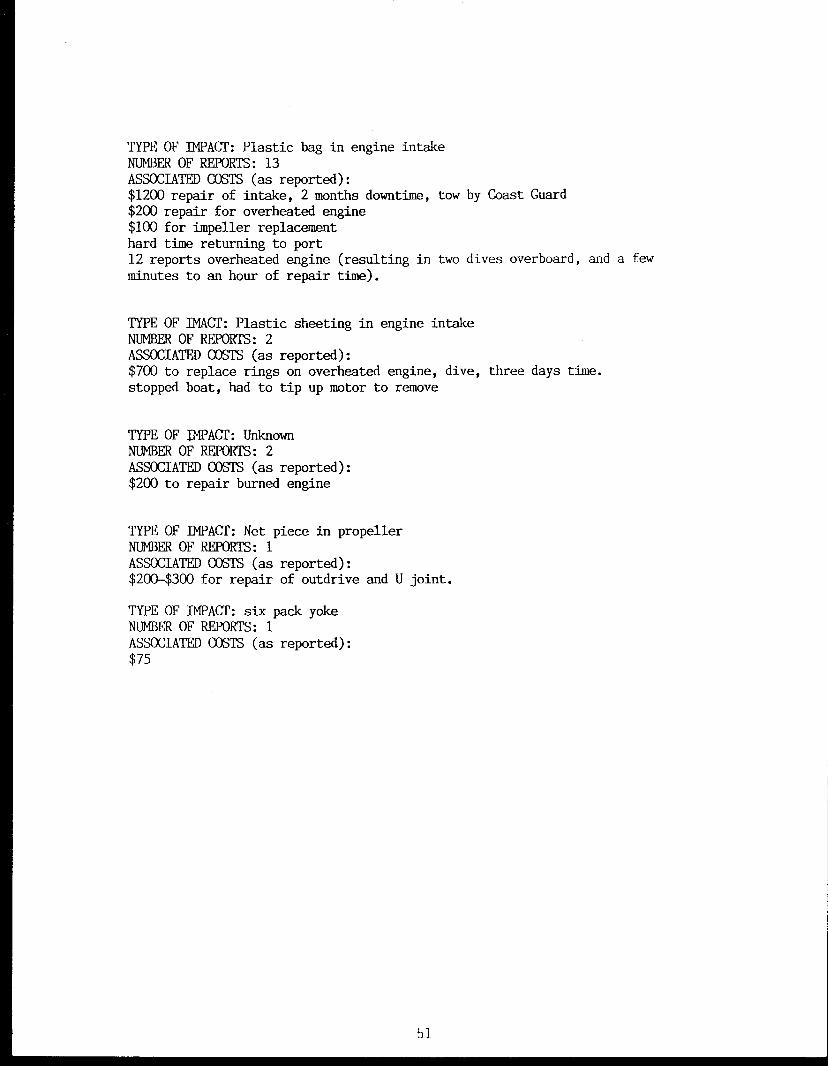
TYPE OF IMPACT: Plastic bag in engine intakeNUMBER OF REPORTS: 13ASSOCIATED COSTS (as reported):$1200 repair of intake, 2 months downtime, tow by Coast Guard$200 repair for overheated engine$100 for impeller replacementhard time returning to port12 reports overheated engine (resulting in two dives overboard, and a fewminutes to an hour of repair time).
TYPE OF IMAM': Plastic sheeting in engine intakeNUMBER OF REPORTS: 2ASSOCIATED COSTS (as reported):$700 to replace rings on overheated engine, dive, three days time.stopped boat, had to tip up motor to remove
TYPE OF IMPACT: UnknownNUMBER OF REPORTS: 2ASSOCIATED COSTS (as reported):$200 to repair burned engine
TYPE OF IMPACT: Net piece in propellerNUMBER OF REPORTS: 1ASSOCIATED COSTS (as reported):$200-$300 for repair of outdrive and U joint.
TYPE OF IMPACT: six pack yokeNUMBER OF REPORTS: 1ASSOCIATED COSTS (as reported):$75
51
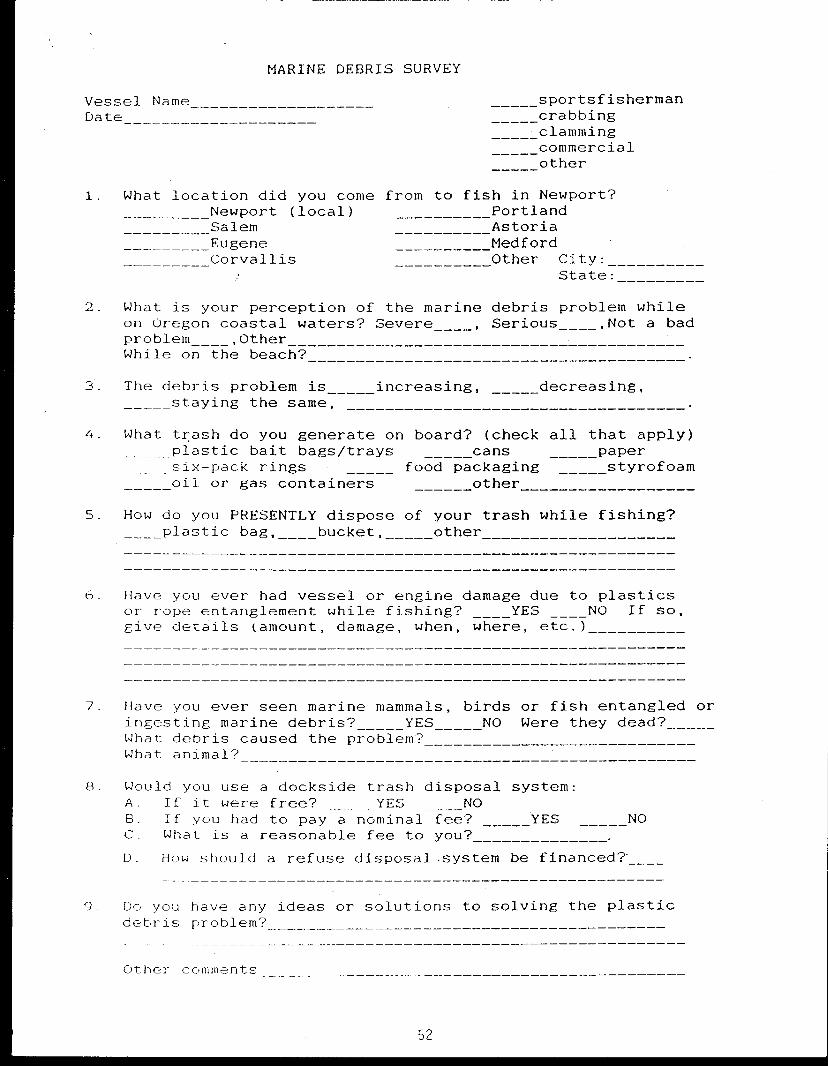
MARINE DEBRIS SURVEY
Vessel NameDate
sportsfisherman crabbing clamming commercial
other
1. What location did you come from to fish in Newport? Newport (local) Portland Salem Astoria Eugene Medford Corvallis Other City:
State:
2. What is your perception of the marine debris problem whileon Oregon coastal waters? Severe____, Serious____,Not a badproblem____,Other While on the beach?
3. The debris problem is increasing, decreasing, staying the same,
4. What trash do you generate on board? (check all that apply) plastic bait bags/trays cans paper six-pack rings food packaging styrofoam oil or gas containers other
5. How do you PRESENTLY dispose of your trash while fishing?____plastic bag,____ bucket, other
6 Have you ever had vessel or engine damage due to plasticsor rope entanglement while fishing? ____YES ____NO If so,give details (amount, damage, when, where, etc.)
7 Have you ever seen marine mammals, birds or fish entangled oringesting marine debris? YES NO Were they dead? What debris caused the problem? What animal?
8 Would you use a dockside trash disposal system:A. If it were free? YES NOB. If you had to pay a nominal fee? YES NOC. What is a reasonable fee to you?
D. How should a refuse disposal-system be financed?-____
9 Do you have any ideas or solutions to solving the plasticdebris problem?
Other comments
52
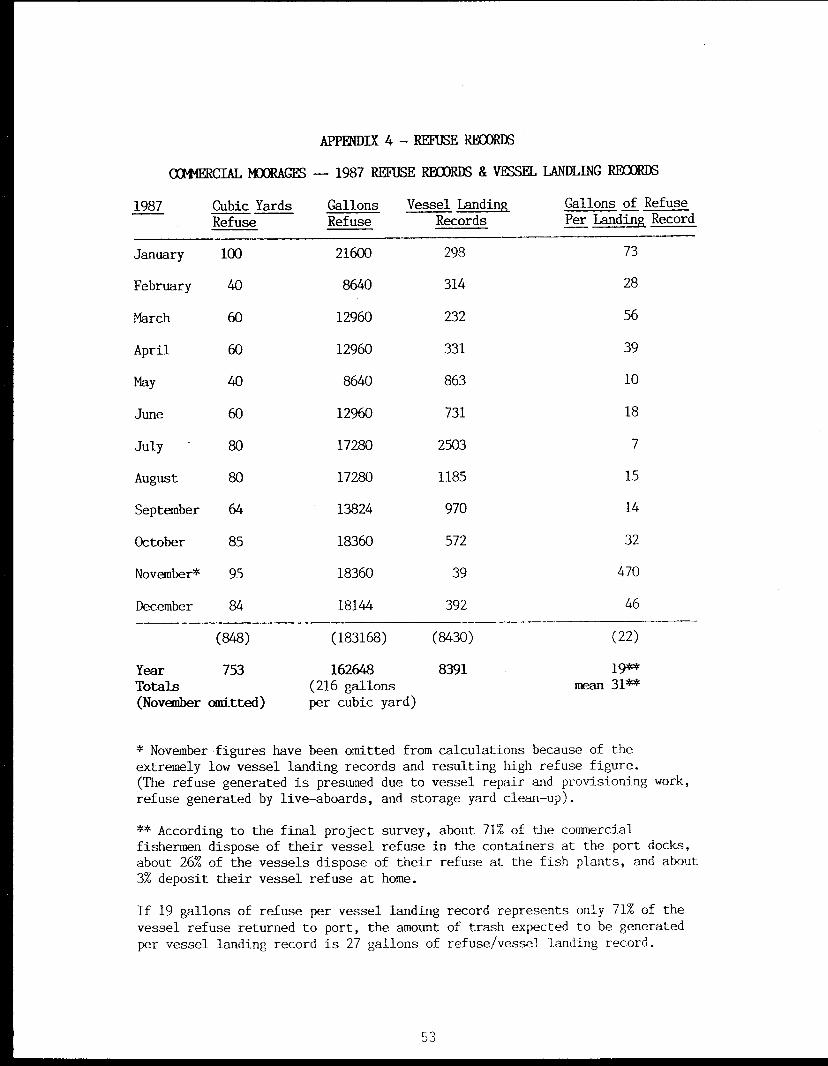
APPENDIX 4 - REFUSE RECORDS
(IRIERCIAL MOORAGES — 1987 REFUSE RECORDS & VESSEL LANDLING RECORDS
1987 Cubic Yards Gallons Vessel Landing Gallons of Refuse
Refuse Refuse Records Per Landing Record
January 100 21600 298 73
February 40 8640 314 28
March 60 12960 232 56
April 60 12960 331 39
May 40 8640 863 10
June 60 12960 731 18
July 80 17280 2503 7
August 80 17280 1185 15
September 64 13824 970 14
October 85 18360 572 32
November* 95 18360 39 470
December 84 18144 392 46
(848) (183168) (8430) (22)
Year 753 162648 8391 19**
Totals (216 gallons mean 31**
(November omitted) per cubic yard)
* November figures have been omitted from calculations because of theextremely low vessel landing records and resulting high refuse figure.(The refuse generated is presumed due to vessel repair and provisioning work,refuse generated by live-aboards, and storage yard clean-up).
** According to the final project survey, about 71% of the commercialfishermen dispose of their vessel refuse in the containers at the port docks,about 26% of the vessels dispose of their refuse at the fish plants, and about3% deposit their vessel refuse at home.
If 19 gallons of refuse per vessel landing record represents only 71% of thevessel refuse returned to port, the amount of trash expected to be generatedper vessel landing record is 27 gallons of refuse/vessel landing record.
53
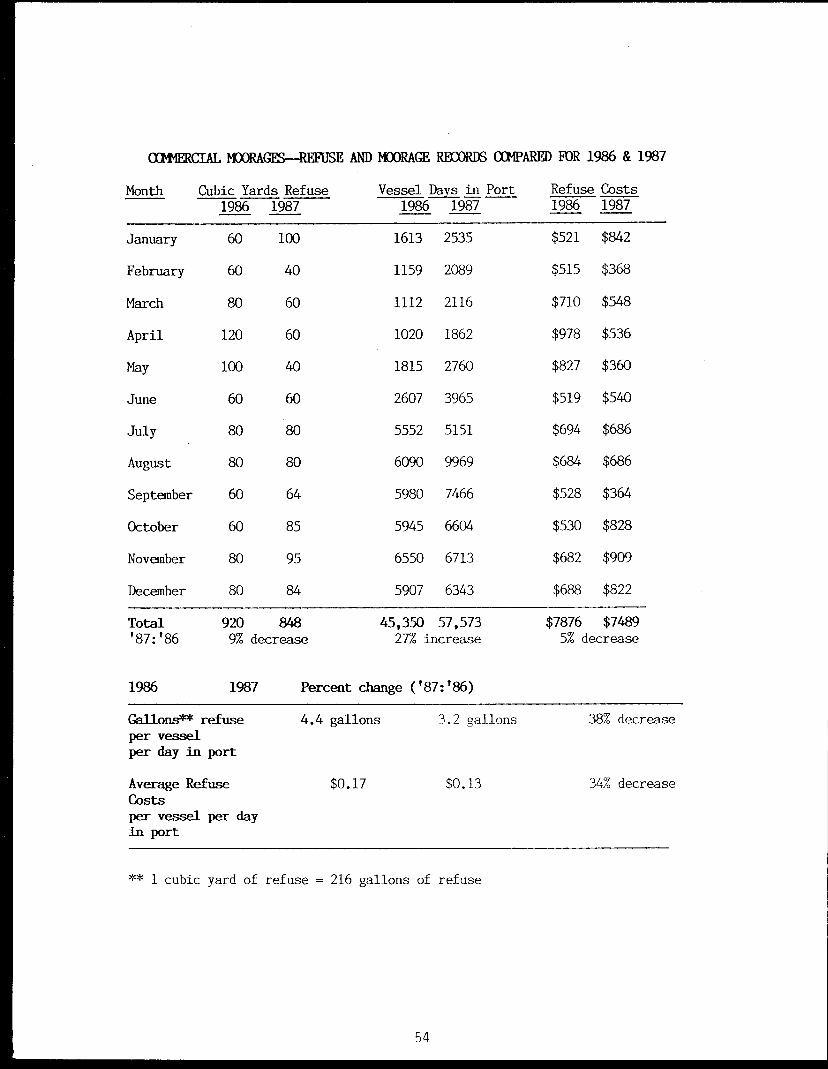
COMMERCIAL MOORON---REFUSE AND MOORAGE RECORDS COMPARED FOR 1986 & 1987
Month Cubic Yards Refuse Vessel Days in Port Refuse Costs1986 1987 1986 1987 1986 1987
January 60 100 1613 2535 $521 $842
February 60 40 1159 2089 $515 $368
March 80 60 1112 2116 $710 $548
April 120 60 1020 1862 $978 $536
May 100 40 1815 2760 $827 $360
June 60 60 2607 3965 $519 $540
July 80 80 5552 5151 $694 $686
August 80 80 6090 9969 $684 $686
September 60 64 5980 7466 $528 $364
October 60 85 5945 6604 $530 $828
November 80 95 6550 6713 $682 $909
December 80 84 5907 6343 $688 $822
Total 920 848 45,350 57,573 $7876 $7489'87:'86 9% decrease
27% increase
5% decrease
1986 1987 Percent change ('87:'86)
Gallons** refuseper vesselper day in port
Average RefuseCostsper vessel per dayin port
4.4 gallons
3.2 gallons 38% decrease
$0.17 $0.13 34% decrease
** 1 cubic yard of refuse = 216 gallons of refuse
54
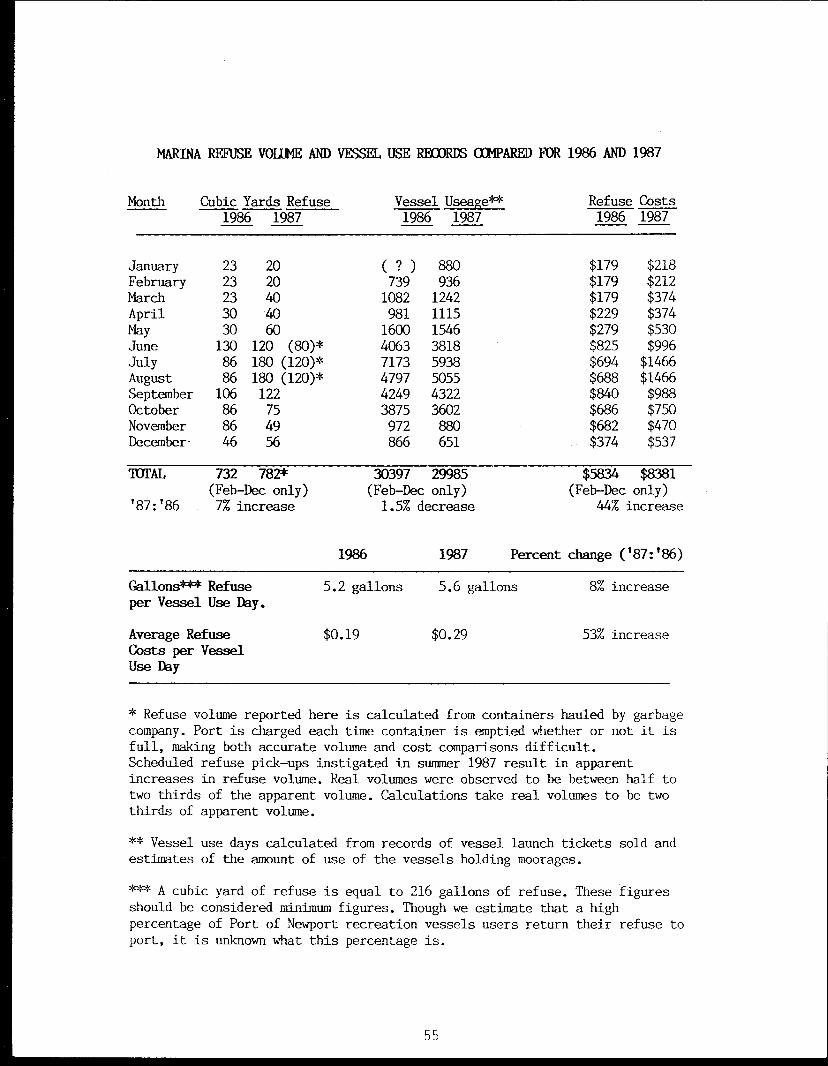
MARINA REFUSE VOLUME AND VESSEL USE RECORDS COMPARED FOR 1986 AND 1987
Month Cubic Yards Refuse Vessel Useage** Refuse Costs1986 1987 1986 1987 1986 1987
January 23 20 ( ? ) 880 $179 $218February 23 20 739 936 $179 $212March 23 40 1082 1242 $179 $374April 30 40 981 1115 $229 $374May 30 60 1600 1546 $279 $530June 130 120 (80)* 4063 3818 $825 $996July 86 180 (120)* 7173 5938 $694 $1466August 86 180 (120)* 4797 5055 $688 $1466September 106 122 4249 4322 $840 $988October 86 75 3875 3602 $686 $750November 86 49 972 880 $682 $470December- 46 56 866 651 $374 $537
TOTAL 732 782* 30397 29985 $5834 $8381(Feb-Dec only) (Feb-Dec only) (Feb-Dec only)
'87:'86 7% increase 1.5% decrease 44% increase
1986 1987 Percent change ('87:'86)
Gallons*** Refuse 5.2 gallons
5.6 gallons 8% increaseper Vessel Use Day.
Average Refuse
$0.19 $0.29 53% increaseCosts per VesselUse Day
* Refuse volume reported here is calculated from containers hauled by garbagecompany. Port is charged each time container is emptied whether or not it isfull, making both accurate volume and cost comparisons difficult.Scheduled refuse pick-ups instigated in summer 1987 result in apparentincreases in refuse volume. Real volumes were observed to be between half totwo thirds of the apparent volume. Calculations take real volumes to be twothirds of apparent volume.
** Vessel use days calculated from records of vessel launch tickets sold andestimates of the amount of use of the vessels holding moorages.
*** A cubic yard of refuse is equal to 216 gallons of refuse. These figuresshould be considered minimum figures. Though we estimate that a highpercentage of Port of Newport recreation vessels users return their refuse toport, it is unknown what this percentage is.
55
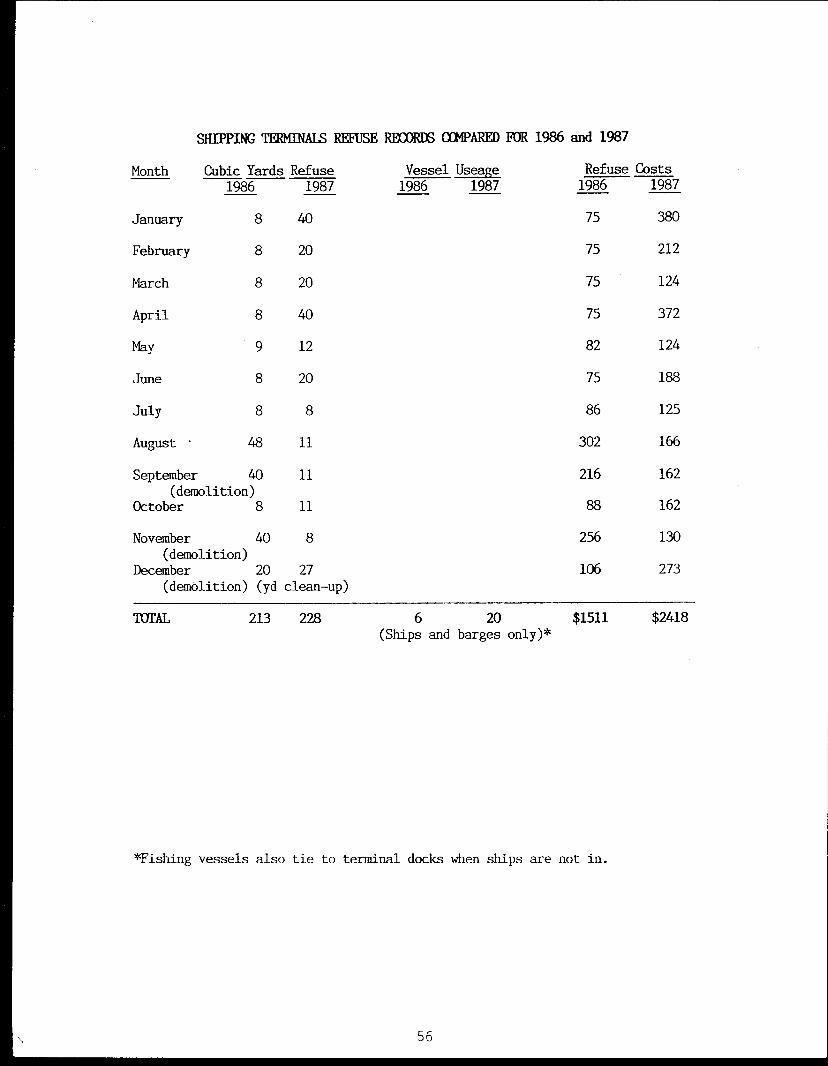
SHIPPING TERMINALS REFUSE RECORDS COMPARED FOR 1986 and 1987
Month Cubic Yards Refuse
Vessel Useage Refuse Costs 1986 1987 1986 1987 1986 1987
January 8 40 75 380
February 8 20 75 212
March 8 20 75 124
April 8 40 75 372
May 9 12 82 124
June 8 20 75 188
July 8 8 86 125
August • 48 11 302 166
September 40 11 216 162(demolition)
October 8 11 88 162
November 40 8 256 130(demolition)
December 20 27 106 273(demolition) (yd clean–up)
TOTAL 213 228 6 20 $1511 $2418(Ships and barges-only)*
*Fishing vessels also tie to terminal docks when ships are not in.
56
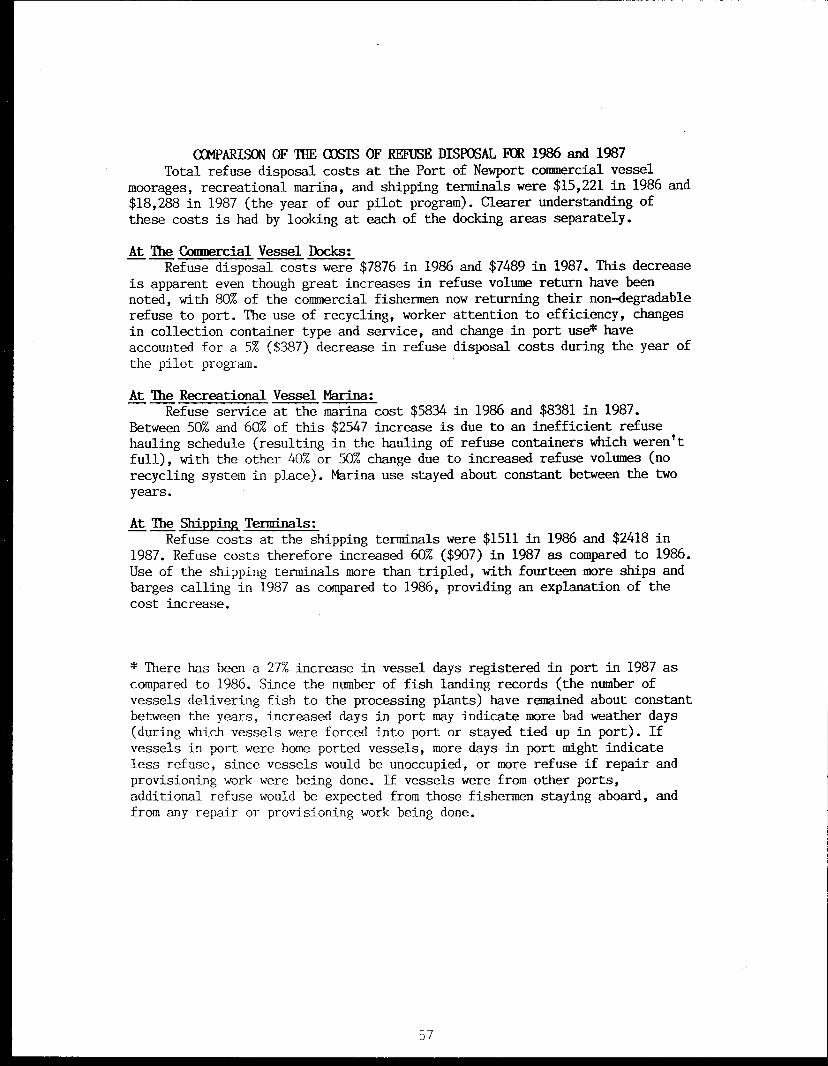
COMPARISON OF THE COSTS OF REFUSE DISPOSAL FOR 1986 and 1987Total refuse disposal costs at the Port of Newport commercial vessel
moorages, recreational marina, and shipping terminals were $15,221 in 1986 and$18,288 in 1987 (the year of our pilot program). Clearer understanding ofthese costs is had by looking at each of the docking areas separately.
At The Commercial Vessel Docks: Refuse disposal costs were $7876 in 1986 and $7489 in 1987. This decrease
is apparent even though great increases in refuse volume return have beennoted, with 80% of the commercial fishermen now returning their non-degradablerefuse to port. The use of recycling, worker attention to efficiency, changesin collection container type and service, and change in port use* haveaccounted for a 5% ($387) decrease in refuse disposal costs during the year ofthe pilot program.
At The Recreational Vessel Marina: Refuse service at the marina cost $5834 in 1986 and $8381 in 1987.
Between 50% and 60% of this $2547 increase is due to an inefficient refusehauling schedule (resulting in the hauling of refuse containers which weren'tfull), with the other 40% or 50% change due to increased refuse volumes (norecycling system in place). Marina use stayed about constant between the twoyears.
At The Shipping Terminals: Refuse costs at the shipping terminals were $1511 in 1986 and $2418 in
1987. Refuse costs therefore increased 60% ($907) in 1987 as compared to 1986.Use of the shipping terminals more than tripled, with fourteen more ships andbarges calling in 1987 as compared to 1986, providing an explanation of thecost increase.
* There has been a 27% increase in vessel days registered in port in 1987 ascompared to 1986. Since the number of fish landing records (the number ofvessels delivering fish to the processing plants) have remained about constantbetween the years, increased days in port may indicate more bad weather days(during which vessels were forced into port or stayed tied up in port). Ifvessels in port were home ported vessels, more days in port might indicateless refuse, since vessels would be unoccupied, or more refuse if repair andprovisioning work were being done. If vessels were from other ports,additional refuse would be expected from those fishermen staying aboard, andfrom any repair or provisioning work being done.
57
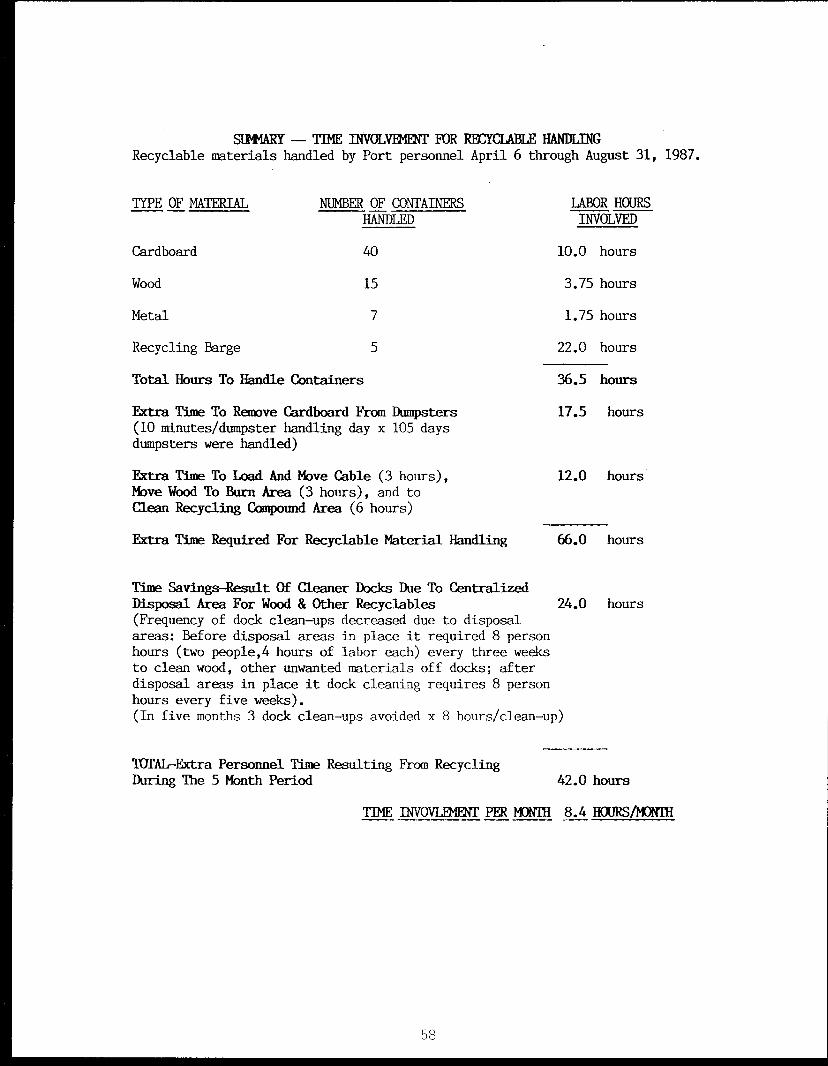
SUMAARY -- TIME INVOLVEMENT FOR RECYCLABLE HANDLINGRecyclable materials handled by Port personnel April 6 through August 31, 1987.
TYPE OF MATERIAL NUMBER OF CONTAINERS HANDLED
Cardboard
40
Wood
15
Metal
7
Recycling Barge
5
LABOR HOURSINVOLVED
10.0 hours
3.75 hours
1.75 hours
22.0 hours
Total Hours To Handle Containers 36.5 hours
Extra Time To Remove Cardboard From Dumpsters(10 minutes/dumpster handling day x 105 daysdumpsters were handled)
Extra Time To Load And Move Cable (3 hours),Move Wood To Burn Area (3 hours), and toClean Recycling Compound Area (6 hours)
17.5 hours
12.0 hours
Extra Time Required For Recyclable Material Handling 66.0 hours
Time Savings-Result Of Cleaner Docks Due To CentralizedDisposal Area For Wood & Other Recyclables 24.0 hours(Frequency of dock clean-ups decreased due to disposalareas: Before disposal areas in place it required 8 personhours (two people,4 hours of labor each) every three weeksto clean wood, other unwanted materials off docks; afterdisposal areas in place it dock cleaning requires 8 personhours every five weeks).(In five months 3 dock clean-ups avoided x 8 hours/clean-up)
TUfAL-Extra Personnel Time Resulting From RecyclingDuring The 5 Month Period 42.0 hours
TIME INVOVIIMENT PER MONTH 8.4 HOURS/MONTH
58
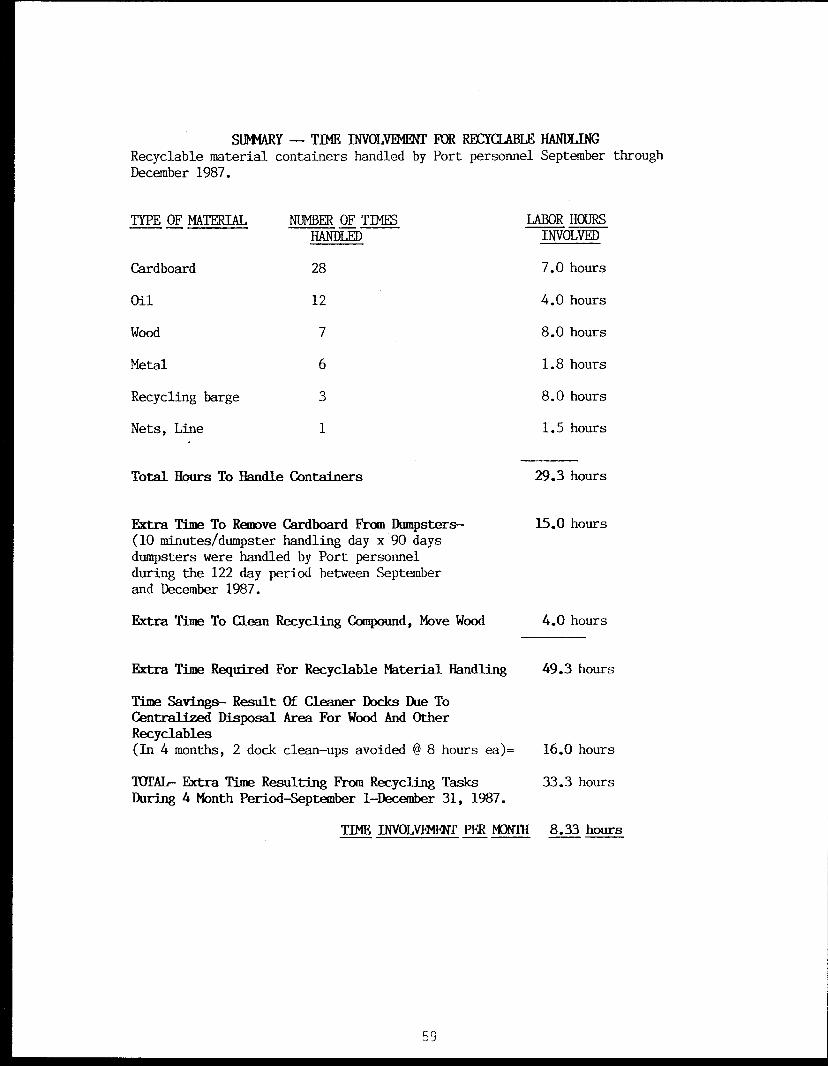
SUMMARY -- TIME INVOLVEMENT FOR RECYCLABLE HANDLINGRecyclable material containers handled by Port personnel September throughDecember 1987.
TYPE OF MATERIAL NUMBER OF TIMES LABOR HOURS HANDLED INVOLVED
Cardboard 28 7.0 hours
Oil 12 4.0 hours
Wood 7 8.0 hours
Metal 6 1.8 hours
Recycling barge 3 8.0 hours
Nets, Line 1 1.5 hours
Total Hours To Handle Containers 29.3 hours
Extra Time To Remove Cardboard From Dumpsters-(10 minutes/dumpster handling day x 90 daysdumpsters were handled by Port personnelduring the 122 day period between Septemberand December 1987.
15.0 hours
Extra Time To Clean Recycling Compound, Move Wood 4.0 hours
Extra Time Required For Recyclable Material Handling 49.3 hours
Time Savings- Result Of Cleaner Docks Due ToCentralized Disposal Area For Wood And OtherRecyclables(In 4 months, 2 dock clean-ups avoided @ 8 hours ea)= 16.0 hours
TOTAL- Extra Time Resulting From Recycling Tasks 33.3 hoursDuring 4 Month Period-September 1-December 31, 1987.
TIME INVOLVEMENT PER MONTH 8.33 hours
59
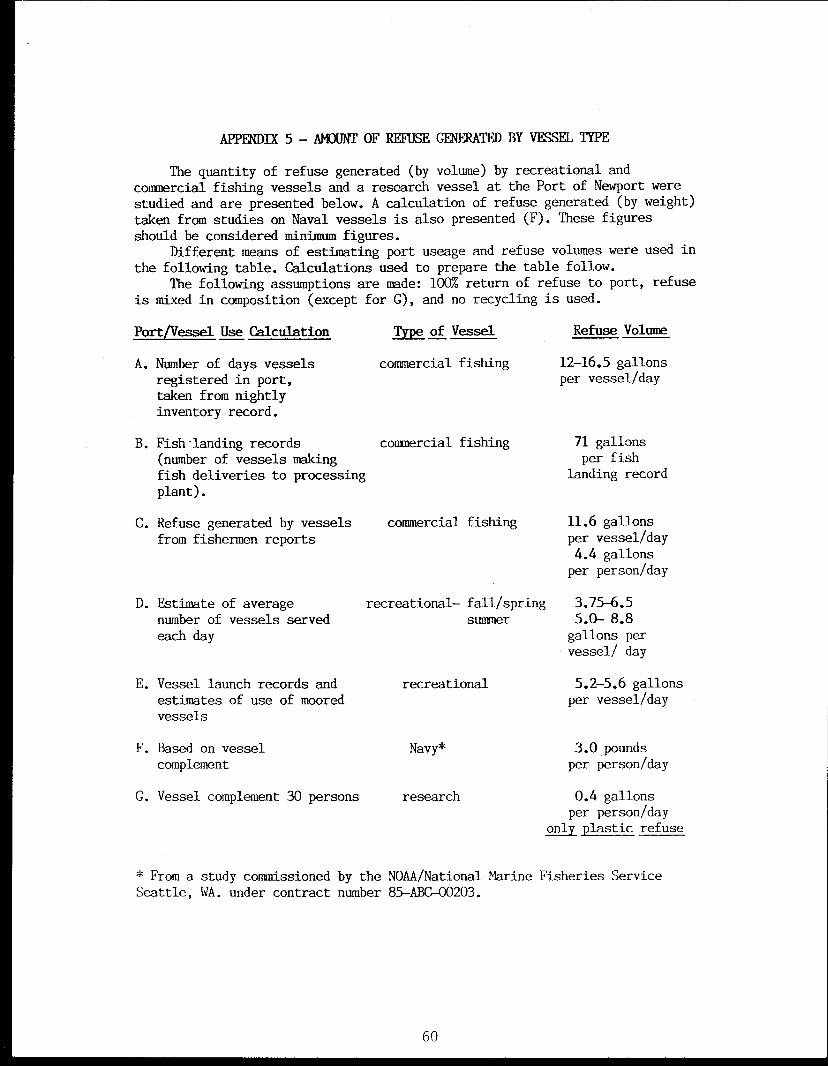
APPENDIX 5 - AMOUNT OF REFUSE GENEaArLD BY VESSEL TYPE
The quantity of refuse generated (by volume) by recreational andcommercial fishing vessels and a research vessel at the Port of Newport werestudied and are presented below. A calculation of refuse generated (by weight)taken from studies on Naval vessels is also presented (F). These figuresshould be considered minimum figures.
Different means of estimating port useage and refuse volumes were used inthe following table. Calculations used to prepare the table follow.
The following assumptions are made: 100% return of refuse to port, refuseis mixed in composition (except for G), and no recycling is used.
Port/Vessel Use Calculation
A. Number of days vesselsregistered in port,taken from nightlyinventory record.
C. Refuse generated by vesselsfrom fishermen reports
D. Estimate of averagenumber of vessels servedeach day
E. Vessel launch records andestimates of use of mooredvessels
Type of Vessel
Refuse Volume
commercial fishing
12-16.5 gallonsper vessel/day
commercial fishing 71 gallons
per fishlanding record
commercial fishing
11.6 gallonsper vessel/day4.4 gallonsper person/day
recreational- fall/spring
3.75-6.5
summer
5.0- 8.8gallons pervessel/ day
recreational
5.2-5.6 gallonsper vessel/day
B. Fish-landing records(number of vessels makingfish deliveries to processingplant).
F. Based on vesselcomplement
G. Vessel complement 30 persons
Navy*
research
3.0 poundsper person/day
0.4 gallonsper person/day
only plastic refuse
* From a study commissioned by the NOAA/National Marine Fisheries ServiceSeattle, WA. under contract number 85-ABC-00203.
60
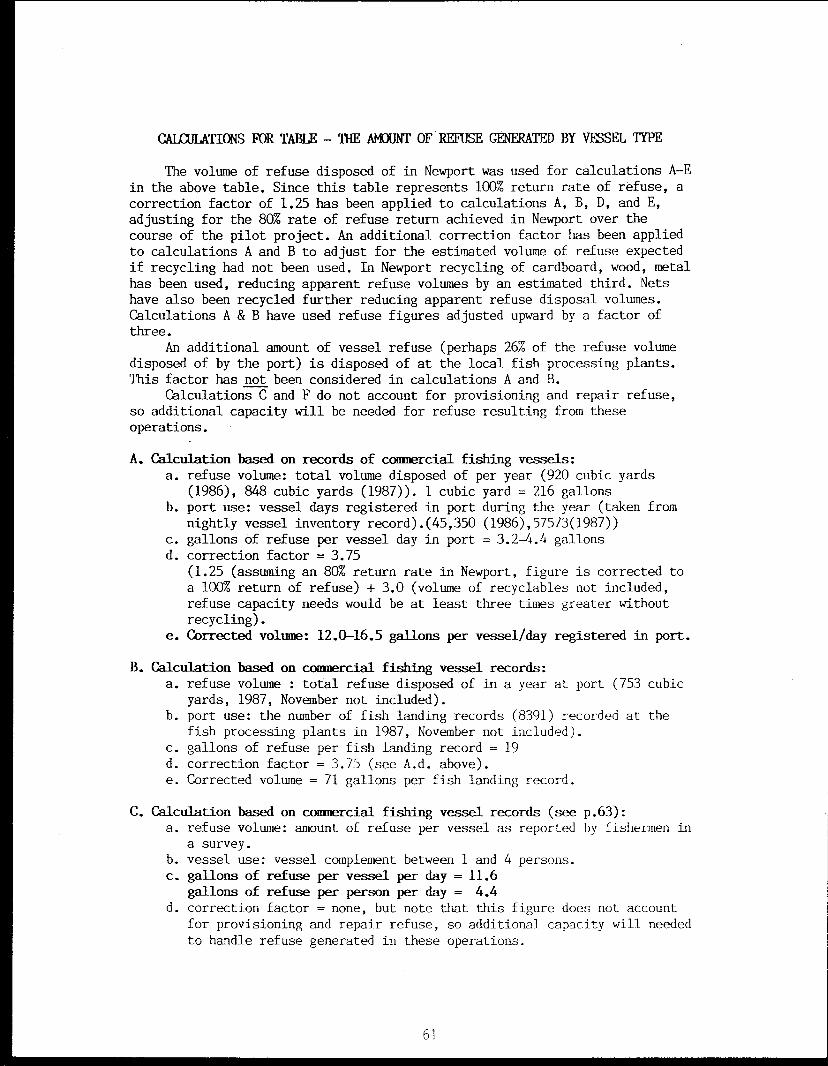
CALCULATIONS FOR TABLE - THE AMOUNT OF REFUSE GENERATED BY VESSEL TYPE
The volume of refuse disposed of in Newport was used for calculations A-Ein the above table. Since this table represents 100% return rate of refuse, acorrection factor of 1.25 has been applied to calculations A, B, D, and E,adjusting for the 80% rate of refuse return achieved in Newport over thecourse of the pilot project. An additional correction factor has been appliedto calculations A and B to adjust for the estimated volume of refuse expectedif recycling had not been used. In Newport recycling of cardboard, wood, metalhas been used, reducing apparent refuse volumes by an estimated third. Netshave also been recycled further reducing apparent refuse disposal volumes.Calculations A & B have used refuse figures adjusted upward by a factor ofthree.
An additional amount of vessel refuse (perhaps 26% of the refuse volumedisposed of by the port) is disposed of at the local fish processing plants.This factor has not been considered in calculations A and B.
Calculations C and F do not account for provisioning and repair refuse,so additional capacity will be needed for refuse resulting from theseoperations.
A. Calculation based on records of commercial fishing vessels:a. refuse volume: total volume disposed of per year (920 cubic yards
(1986), 848 cubic yards (1987)). 1 cubic yard = 216 gallonsb. port use: vessel days registered in port during the year (taken from
nightly vessel inventory record).(45,350 (1986),57573(1987))c. gallons of refuse per vessel day in port = 3.2-4.4 gallonsd. correction factor = 3.75
(1.25 (assuming an 80% return rate in Newport, figure is corrected toa 100% return of refuse) + 3.0 (volume of recyclables not included,refuse capacity needs would be at least three times greater withoutrecycling).
e. Corrected volume: 12.0-16.5 gallons per vessel/day registered in port.
B. Calculation based on commercial fishing vessel records:a. refuse volume : total refuse disposed of in a year at port (753 cubic
yards, 1987, November not included).b. port use: the number of fish landing records (8391) recorded at the
fish processing plants in 1987, November not included).c. gallons of refuse per fish landing record = 19d. correction factor = 3.75 (see A.d. above).e. Corrected volume = 71 gallons per fish landing record.
C. Calculation based on commercial fishing vessel records (see p.63):a. refuse volume: amount of refuse per vessel as reported by fishermen in
a survey.b. vessel use: vessel complement between 1 and 4 persons.c. gallons of refuse per vessel per day = 11.6
gallons of refuse per person per day = 4.4d. correction factor = none, but note that this figure does not account
for provisioning and repair refuse, so additional capacity will neededto handle refuse generated in these operations.
61
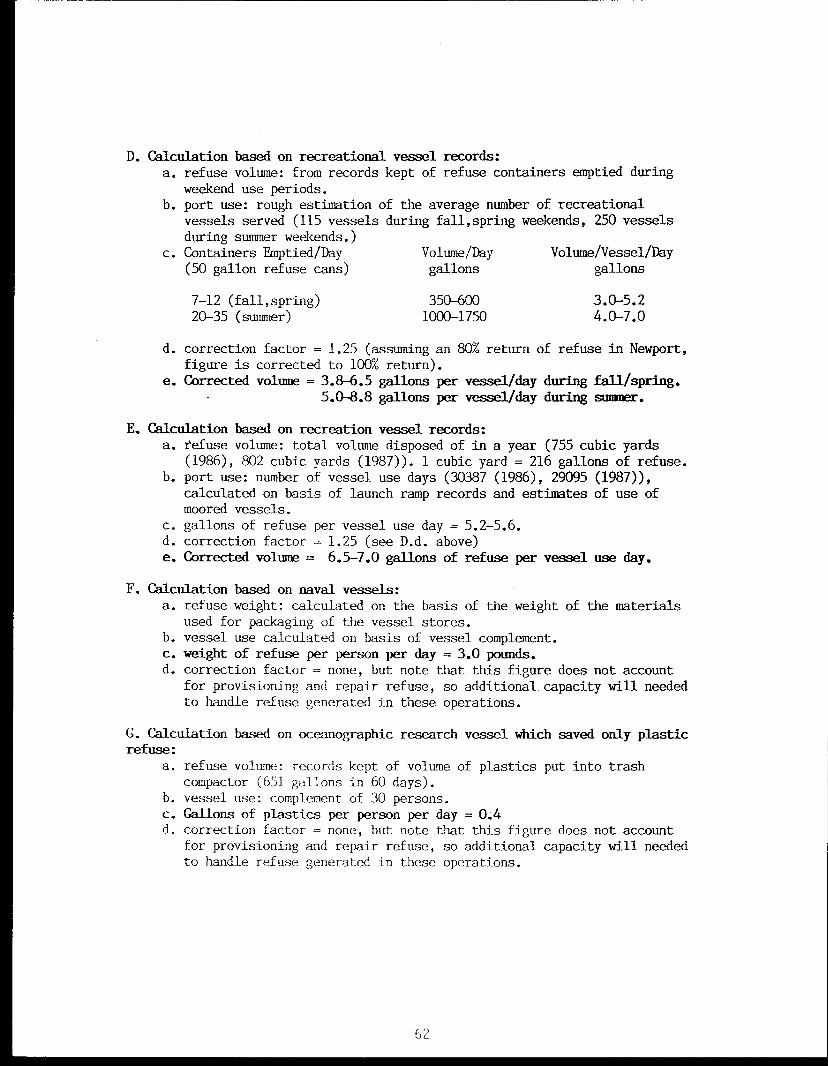
D. Calculation based on recreational vessel records:a. refuse volume: from records kept of refuse containers emptied during
weekend use periods.b. port use: rough estimation of the average number of recreational
vessels served (115 vessels during fall,spring weekends, 250 vesselsduring summer weekends.)
c. Containers Emptied/Day Volume/Day Volume/Vessel/Day(50 gallon refuse cans) gallons gallons
7-12 (fall,spring)
350-600 3.0-5.220-35 (summer)
1000-1750 4.0-7.0
d. correction factor = 1.25 (assuming an 80% return of refuse in Newport,figure is corrected to 100% return).
e. Corrected volume = 3.8-6.5 gallons per vessel/day during fall/spring.5.0-8.8 gallons per vessel/day during summer.
E. Calculation based on recreation vessel records:a. refuse volume: total volume disposed of in a year (755 cubic yards
(1986), 802 cubic yards (1987)). 1 cubic yard = 216 gallons of refuse.b. port use: number of vessel use days (30387 (1986), 29095 (1987)),
calculated on basis of launch ramp records and estimates of use ofmoored vessels.
c. gallons of refuse per vessel use day = 5.2-5.6.d. correction factor = 1.25 (see D.d. above)e. Corrected volume = 6.5-7.0 gallons of refuse per vessel use day.
F. Calculation based on naval vessels:a. refuse weight: calculated on the basis of the weight of the materials
used for packaging of the vessel stores.b. vessel use calculated on basis of vessel complement.c. weight of refuse per person per day = 3.0 pounds.d. correction factor = none, but note that this figure does not account
for provisioning and repair refuse, so additional capacity will neededto handle refuse generated in these operations.
G. Calculation based on oceanographic research vessel which saved only plasticrefuse:
a. refuse volume: records kept of volume of plastics put into trashcompactor (651 gallons in 60 days).
b. vessel use: complement of 30 persons.c. Gallons of plastics per person per day = 0.4d. correction factor = none, but note that this figure does not account
for provisioning and repair refuse, so additional capacity will neededto handle refuse generated in these operations.
62
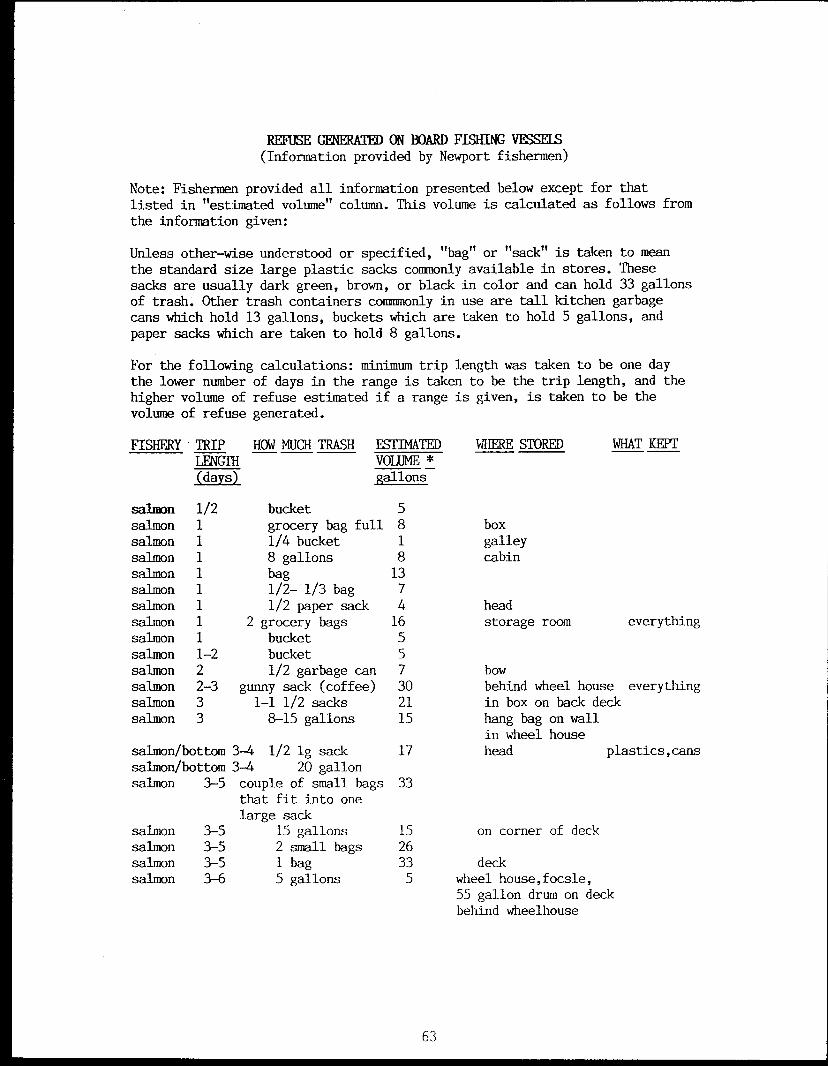
REFUSE GENERATED ON BOARD FISHING VESSELS(Information provided by Newport fishermen)
Note: Fishermen provided all information presented below except for thatlisted in "estimated volume" column. This volume is calculated as follows fromthe information given:
Unless other-wise understood or specified, "bag" or "sack" is taken to meanthe standard size large plastic sacks commonly available in stores. Thesesacks are usually dark green, brown, or black in color and can hold 33 gallonsof trash. Other trash containers commmonly in use are tall kitchen garbagecans which hold 13 gallons, buckets which are taken to hold 5 gallons, andpaper sacks which are taken to hold 8 gallons.
For the following calculations: minimum trip length was taken to be one daythe lower number of days in the range is taken to be the trip length, and thehigher volume of refuse estimated if a range is given, is taken to be thevolume of refuse generated.
FISHERY • TRIP HOW MUCH TRASH ESTIMATED
WHERE STORED WHAT KEPT LFNGTH
VOLUME *(days)
gallons
salmon 1/2salmon 1salmon 1salmon 1salmon 1salmon 1salmon 1salmon 1salmon 1salmon 1-2salmon 2salmon 2-3salmon 3salmon 3
bucket 5grocery bag full 81/4 bucket 18 gallons 8bag 131/2- 1/3 bag 71/2 paper sack 4
2 grocery bags 16bucket 5bucket 51/2 garbage can 7
gunny sack (coffee) 30
1-1 1/2 sacks 218-15 gallons 15
salmon/bottom 3-4 1/2 lg sack 17salmon/bottom 3-4 20 gallonsalmon 3-5 couple of small bags 33
that fit into onelarge sack
salmon 3-5 15 gallons 15salmon 3-5 2 small bags 26salmon 3-5 1 bag 33salmon 3-6 5 gallons 5
boxgalleycabin
headstorage room everything
bowbehind wheel house everythingin box on back deckhang bag on wallin wheel househead plastics,cans
on corner of deck
deckwheel house,focsle,55 gallon drum on deckbehind wheelhouse
63
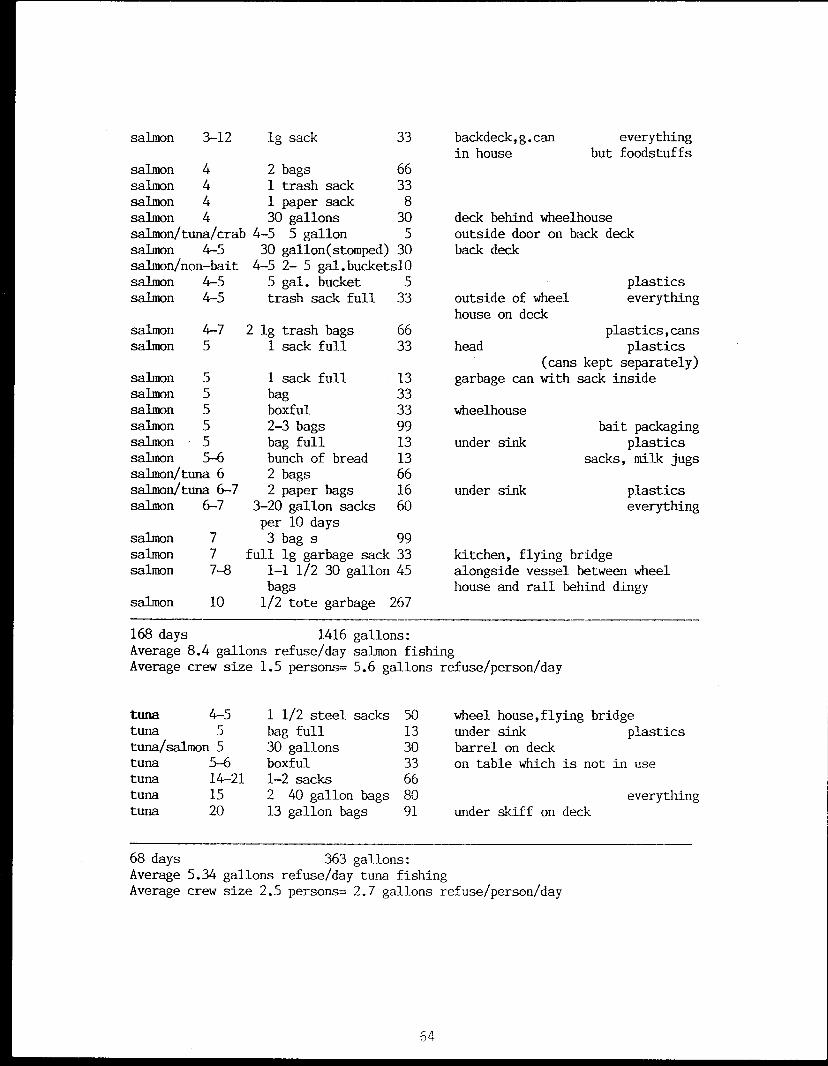
salmon 3-12
ig sack
33 backdeck,g.can everything
salmon 4salmon 4salmon 4salmon 4salmon/tuna/crabsalmon 4-5salmon/non-baitsalmon 4-5salmon 4-5
salmonsalmon
2 bags 661 trash sack 331 paper sack 830 gallons 30
4-5 5 gallon 530 gallon(stomped) 30
4-5 2- 5 gal.bucketsl05 gal. bucket 5trash sack full 33
1 sack full 13bag 33boxful 332-3 bags 99bag full 13bunch of bread 132 bags 662 paper bags 16
3-20 gallon sacks 60per 10 days3 bag s 99
full lg garbage sack 331-1 1/2 30 gallon 45bags1/2 tote garbage 267
salmon 5salmon 5salmon 5salmon 5salmon • 5salmon 5-6salmon/tuna 6salmon/tuna 6-7salmon 6-7
salmon
7salmon
7salmon
7-8
salmon 10
in house but foodstuffs
deck behind wheelhouseoutside door on back deckback deck
plasticsoutside of wheel everythinghouse on deck
plastics,canshead plastics
(cans kept separately)garbage can with sack inside
wheelhousebait packaging
under sink plasticssacks, milk jugs
under sink plasticseverything
kitchen, flying bridgealongside vessel between wheelhouse and rail behind dingy
4-7 2 ig trash bags 665 1 sack full 33
168 days 1416 gallons:Average 8.4 gallons refuse/day salmon fishingAverage crew size 1.5 persons= 5.6 gallons refuse/person/day
tuna 4-5tuna 5tuna/salmon 5tuna 5-6tuna 14-21tuna 15tuna 20
1 1/2 steel sacks 50bag full 1330 gallons 30boxful 331-2 sacks 662 40 gallon bags 8013 gallon bags 91
wheel house,flying bridgeunder sink plasticsbarrel on deckon table which is not in use
everythingunder skiff on deck
68 days 363 gallons:Average 5.34 gallons refuse/day tuna fishingAverage crew size 2.5 persons= 2.7 gallons refuse/person/day
64
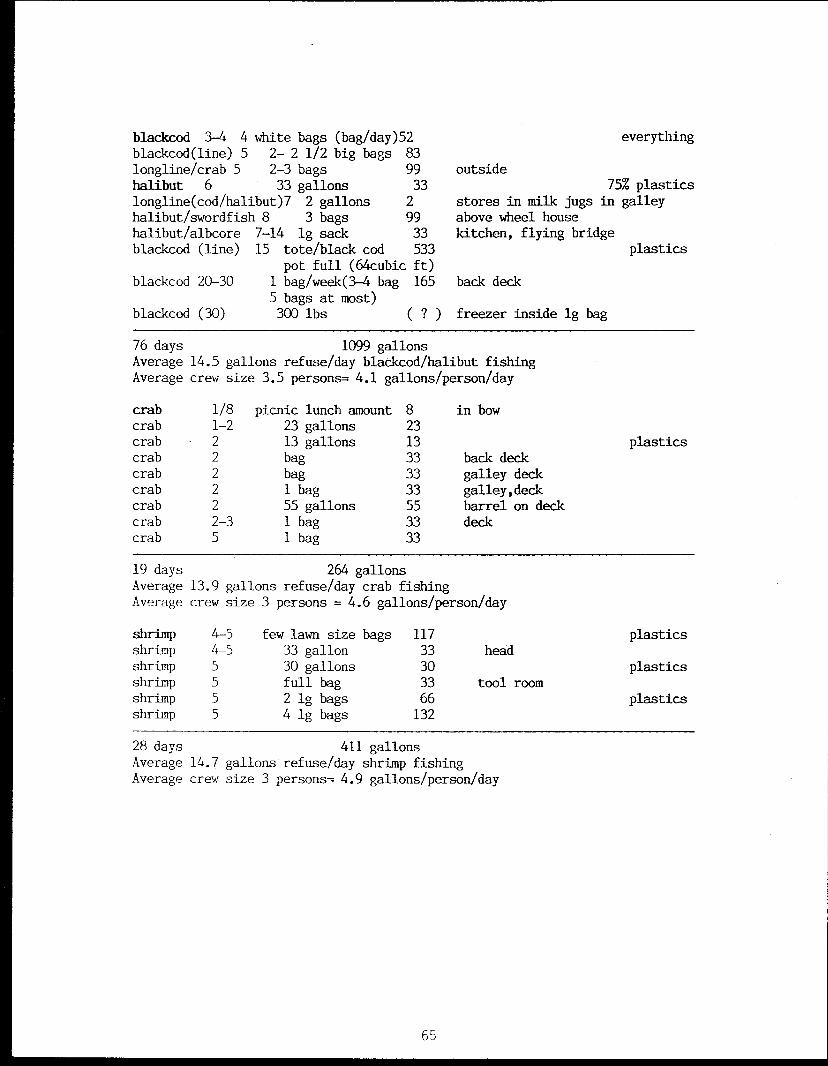
blackcod 3-4 4 white bags (bag/day)52blackcod(line) 5 2- 2 1/2 big bags 83longline/crab 5 2-3 bags 99halibut 6 33 gallons 33longline(cod/halibut)7 2 gallons 2halibut/swordfish 8 3 bags 99halibut/albcore 7-14 lg sack 33blackcod (line) 15 tote/black cod 533
pot full (64cubic ft)blackcod 20-30 1 bag/week(3-4 bag 165
5 bags at most)blackcod (30)
300 lbs ( ? ) freezer inside lg bag
everything
outside75% plastics
stores in milk jugs in galleyabove wheel housekitchen, flying bridge
plastics
back deck
76 days 1099 gallonsAverage 14.5 gallons refuse/day blackcod/halibut fishingAverage crew size 3.5 persons= 4.1 gallons/person/day
crab 1/8 picnic lunch amount 8 in bowcrab 1-2 23 gallons 23crab 2 13 gallons 13 plasticscrab 2 bag 33 back deckcrab 2 bag 33 galley deckcrab 2 1 bag 33 galley,deckcrab 2 55 gallons 55 barrel on deckcrab 2-3 1 bag 33 deckcrab 5 1 bag 33
19 days 264 gallonsAverage 13.9 gallons refuse/day crab fishingAverage crew size 3 persons = 4.6 gallons/person/day
shrimp 4-5shrimp 4-5shrimp 5shrimp 5shrimp 5shrimp 5
few lawn size bags 11733 gallon 3330 gallons 30full bag 332 lg bags 664 lg bags 132
head
tool room
plastics
plastics
plastics
28 days 411 gallonsAverage 14.7 gallons refuse/day shrimp fishingAverage crew size 3 persons= 4.9 gallons/person/day
65
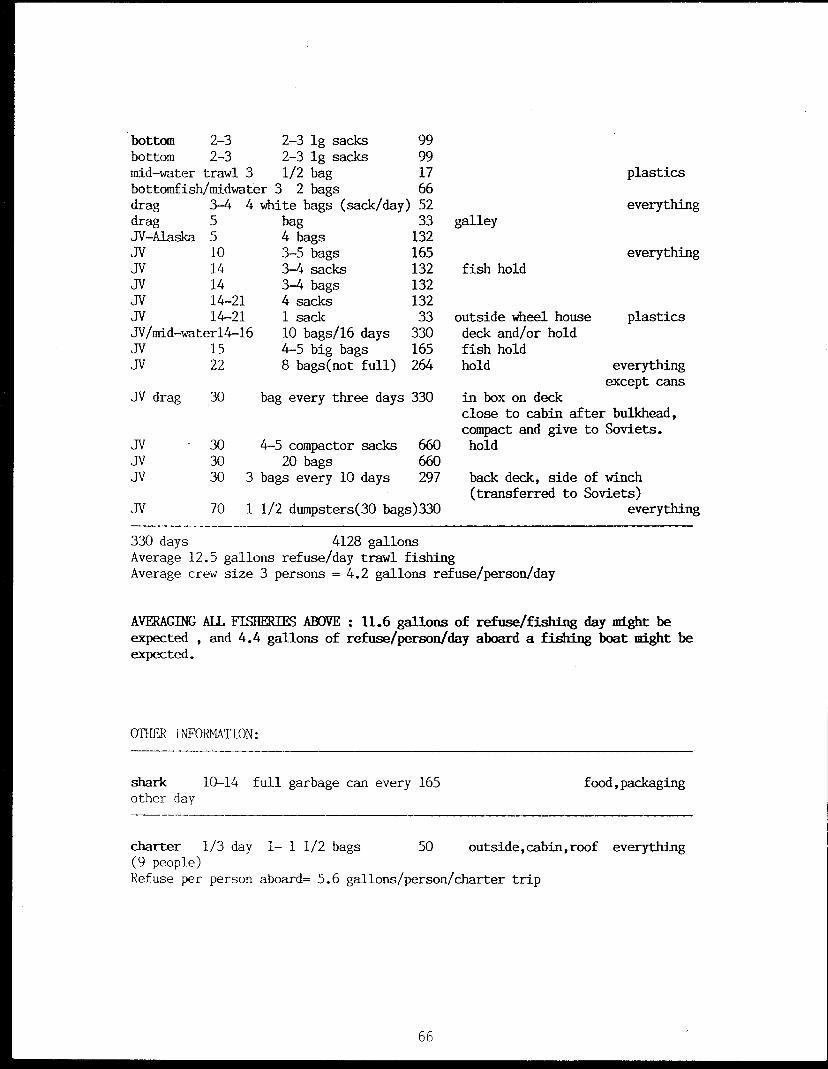
bottom 2-3 2-3 lg sacks 99bottom 2-3 2-3 lg sacks 99mid-water trawl 3 1/2 bag 17bottomfish/midwater 3 2 bags 66drag 3-4 4 white bags (sack/day) 52drag 5 bag 33JV-Alaska 5 4 bags 132JV 10 3-5 bags 165JV 14 3-4 sacks 132JV 14 3-4 bags 132JV 14-21 4 sacks 132JV 14-21 1 sack 33JV/mid-waterl4-16 10 bags/16 days 330JV 15 4-5 big bags 165JV 22 8 bags(not full) 264
JV drag 30 bag every three days 330
JV
30 4-5 compactor sacks 660JV
30 20 bags
660JV
30 3 bags every 10 days
297
JV 70 1 1/2 dumpsters(30 bags)330
plastics
everythinggalley
everythingfish hold
outside wheel house plasticsdeck and/or holdfish holdhold everything
except cansin box on deckclose to cabin after bulkhead,compact and give to Soviets.hold
back deck, side of winch(transferred to Soviets)
everything
330 days 4128 gallonsAverage 12.5 gallons refuse/day trawl fishingAverage crew size 3 persons = 4.2 gallons refuse/person/day
AVERAGING ALL FISHERIES ABOVE : 11.6 gallons of refuse/fishing day might beexpected , and 4.4 gallons of refuse/person/day aboard a fishing boat might beexpected.
OTHER INFORMATION:
shark 10-14 full garbage can every 165
food,packagingother day
charter 1/3 day 1- 1 1/2 bags 50 outside,cabin,roof everything(9 people)Refuse per person aboard= 5.6 gallons/person/charter trip
66
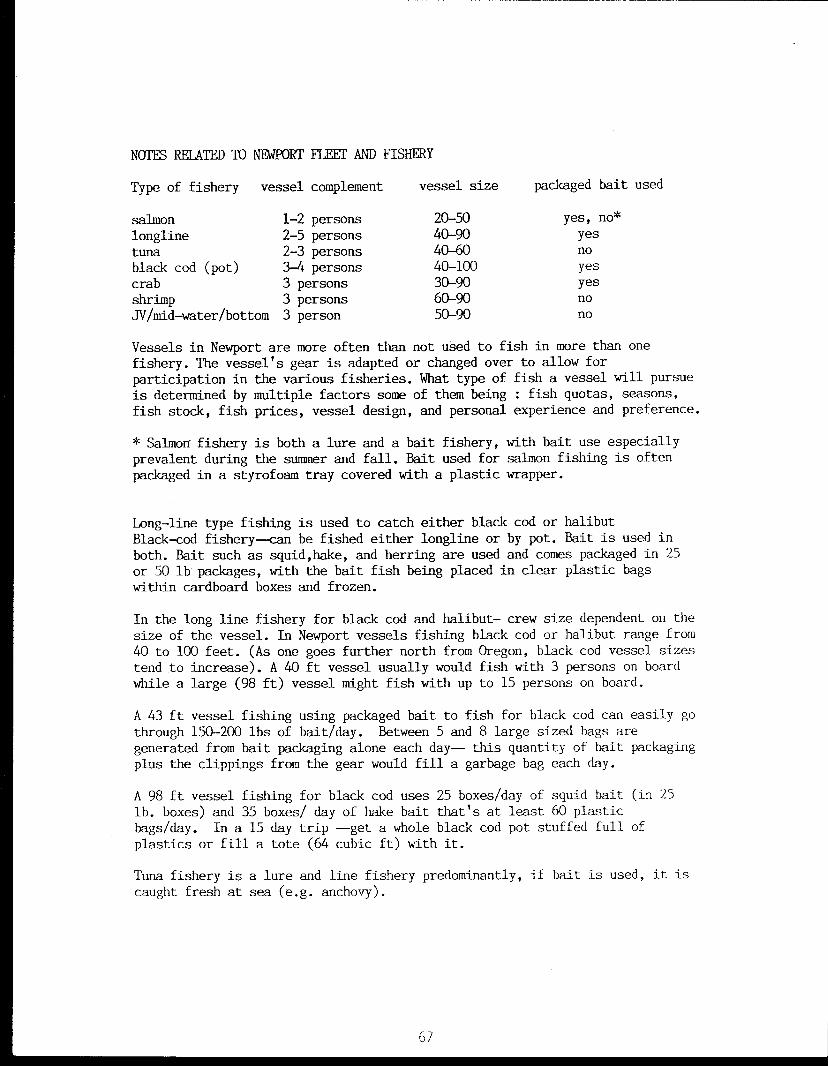
NOTES RELATED TO NEWPORT FLEET AND FISHERY
Type of fishery vessel complement vessel size packaged bait used
salmon 1-2 persons 20-50 yes, no*
longline 2-5 persons 40-90 yes
tuna 2-3 persons 40-60 noblack cod (pot) 3-4 persons 40-100 yes
crab 3 persons 30-90 yesshrimp 3 persons 60-90 no
JV/mid-water/bottom 3 person 50-90 no
Vessels in Newport are more often than not used to fish in more than onefishery. The vessel's gear is adapted or changed over to allow forparticipation in the various fisheries. What type of fish a vessel will pursueis determined by multiple factors some of them being : fish quotas, seasons,fish stock, fish prices, vessel design, and personal experience and preference.
* Salmon fishery is both a lure and a bait fishery, with bait use especiallyprevalent during the summer and fall. Bait used for salmon fishing is oftenpackaged in a styrofoam tray covered with a plastic wrapper.
Long-line type fishing is used to catch either black cod or halibutBlack-cod fishery--can be fished either longline or by pot. Bait is used inboth. Bait such as squid,hake, and herring are used and comes packaged in 25or 50 lb packages, with the bait fish being placed in clear plastic bagswithin cardboard boxes and frozen.
In the long line fishery for black cod and halibut- crew size dependent on thesize of the vessel. In Newport vessels fishing black cod or halibut range from40 to 100 feet. (As one goes further north from Oregon, black cod vessel sizestend to increase). A 40 ft vessel usually would fish with 3 persons on boardwhile a large (98 ft) vessel might fish with up to 15 persons on board.
A 43 ft vessel fishing using packaged bait to fish for black cod can easily gothrough 150-200 lbs of bait/day. Between 5 and 8 large sized bags aregenerated from bait packaging alone each day— this quantity of bait packagingplus the clippings from the gear would fill a garbage bag each day.
A 98 ft vessel fishing for black cod uses 25 boxes/day of squid bait (in 25lb. boxes) and 35 boxes/ day of hake bait that's at least 60 plasticbags/day. In a 15 day trip —get a whole black cod pot stuffed full ofplastics or fill a tote (64 cubic ft) with it.
Tuna fishery is a lure and line fishery predominantly, if bait is used, it iscaught fresh at sea (e.g. anchovy).
67
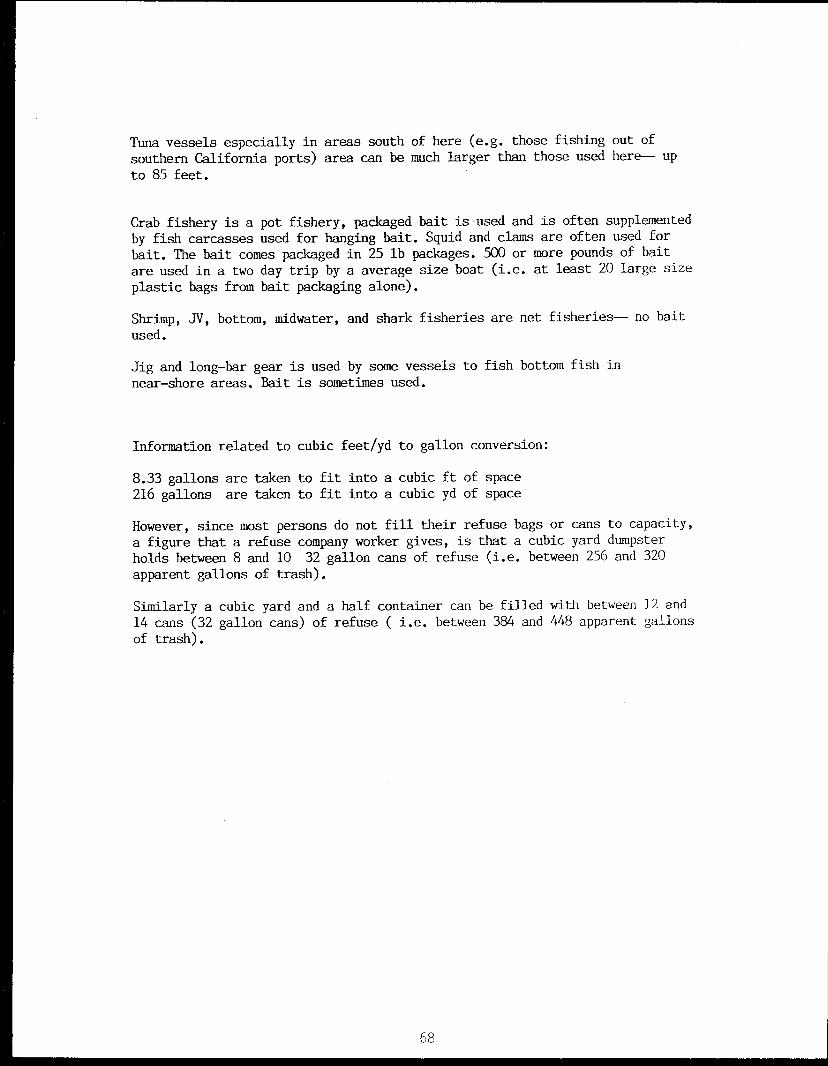
Tuna vessels especially in areas south of here (e.g. those fishing out ofsouthern California ports) area can be much larger than those used here— upto 85 feet.
Crab fishery is a pot fishery, packaged bait is used and is often supplementedby fish carcasses used for hanging bait. Squid and clams are often used forbait. The bait comes packaged in 25 lb packages. 500 or more pounds of baitare used in a two day trip by a average size boat (i.e. at least 20 large size
plastic bags from bait packaging alone).
Shrimp, JV, bottom, midwater, and shark fisheries are net fisheries— no baitused.
Jig and long-bar gear is used by some vessels to fish bottom fish innear-shore areas. Bait is sometimes used.
Information related to cubic feet/yd to gallon conversion:
8.33 gallons are taken to fit into a cubic ft of space216 gallons are taken to fit into a cubic yd of space
However, since most persons do not fill their refuse bags or cans to capacity,a figure that a refuse company worker gives, is that a cubic yard dumpsterholds between 8 and 10 32 gallon cans of refuse (i.e. between 256 and 320apparent gallons of trash).
Similarly a cubic yard and a half container can be filled with between 12 and14 cans (32 gallon cans) of refuse ( i.e. between 384 and 448 apparent gallonsof trash).
68
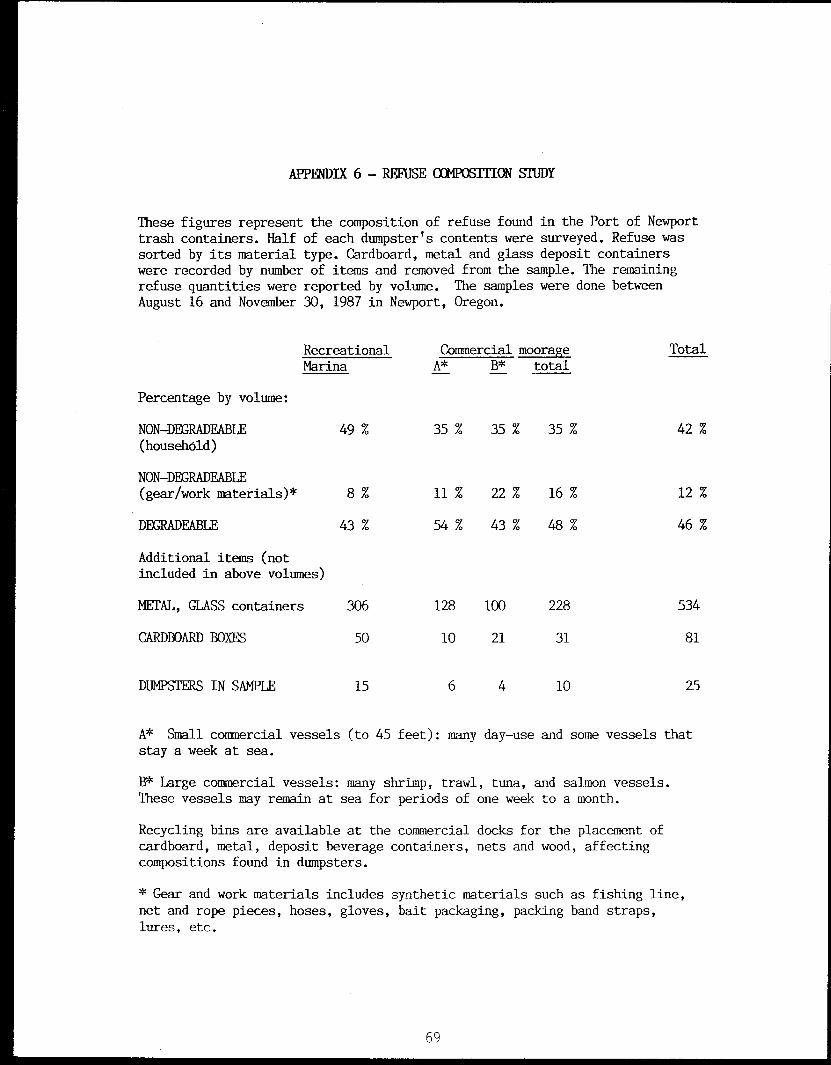
APPENDIX 6 - REFUSE COMPOSII1ON STUDY
These figures represent the composition of refuse found in the Port of Newporttrash containers. Half of each dumpster's contents were surveyed. Refuse wassorted by its material type. Cardboard, metal and glass deposit containerswere recorded by number of items and removed from the sample. The remainingrefuse quantities were reported by volume. The samples were done betweenAugust 16 and November 30, 1987 in Newport, Oregon.
Recreational Commercial moorage TotalMarina A* B* total
Percentage by volume:
NON-DEGRADEABLE(household)
49 % 35 % 35 % 35 % 42 %
NON-DEGRADFABLF(gear/work materials)* 8 % 11 % 22 % 16 % 12%
DEGRADFABLE 43 % 54 % 43 % 48 46%
Additional items (notincluded in above volumes)
METAL, GLASS containers 306 128 100 228 534
CARDBOARD BOXES 50 10 21 31 81
DUMPSTERS IN SAMPLE 15 6 4 10 25
A* Small commercial vessels (to 45 feet): many day-use and some vessels thatstay a week at sea.
B* Large commercial vessels: many shrimp, trawl, tuna, and salmon vessels.These vessels may remain at sea for periods of one week to a month.
Recycling bins are available at the commercial docks for the placement ofcardboard, metal, deposit beverage containers, nets and wood, affectingcompositions found in dumpsters.
* Gear and work materials includes synthetic materials such as fishing line,net and rope pieces, hoses, gloves, bait packaging, packing band straps,lures, etc.
69
APPENDIX 7 - TRASH COMPACTOR USE
Trash Compactor Use Aboard Fishing and Research Vessels
Background:
Refuse storage space on vessels is often limited, potentially makingcompliance with Annex V difficult especially for those vessels which spendlong times at sea.
Compactors have been in use for some years now, on at least five fishingvessels on the West coast, whose sizes range between 60 and 87 feet in length.Three to five persons work on these space limited vessels which spend between15 and 45 days at sea between port calls. In June 1987, three additionalvessels in Newport, Oregon (two fishing vessels and a research vessel)experimented with the use of trash compactors as a means of containing theirrefuse on board. Written surveys were filled out by the operators of thesevessels and interviews were conducted to evaluate compactor effectiveness. Thecompactors used were small, kitchen sized SEARS Kenmore trash compactors whichmeasure -(in inches) 34h x 15w x 25d, and weigh 170 pounds.
Results:
The longest period of time between port calls for one fishing vessel(Pacific Future, length 75 feet) is two weeks. With a crew of four, 4compactor bags are filled during this time. The other fishing vessel(Marathon, 87 feet), has a three person crew. This vessel spends betweentwenty and thirty days at sea between port calls and generates 4 compactorbags of refuse. The refuse placed into the compactor was mixed in composition.
Fishing vessel operators estimated that between five and seven standardkitchen sized bags (13 gallons) were compacted into one compactor bag. ThePacific Future stores compacted refuse by the side of the wheel house, whilethe Marathon stores its compacted trash in the fish hold. The compacted bag ofrefuse on both these vessels is placed in a large plastic bag which is thensealed before storage, to eliminate smell and sanitary problems and preventany fluid leakage.
By separating and compacting only the plastic wastes, the Research VesselWECOMA with a crew of 30 persons, generated a compacted bag of plastic refuseevery 3 to 6 days. The compacted bag held 50 gallons of uncompacted plasticrefuse on the average (range 30 to 88 gallons). The separation of the plasticwastes from the degradable wastes was accomplished at the point of disposal,by placing an additional refuse container along-side each existing containerand clearly labeling it for "plastics only". About 99% of the plasticsgenerated on board is estimated to stay on board, using this method. Thelongest continuous time at sea between port calls during the survey period was23 days, during which time 6 compacted bags were generated and stored on board.
70
Thirty minutes of work is required each day on the WECCMA to collect therefuse containers containing plastics, load the compactor, and compact therefuse. (The plastic refuse is loaded into the compactor a small amount at atime and several compaction cycles started). Additionally, whenever a bag isremoved from the compactor, the compactor is cleaned and disinfected. Thisoperation takes an additional 30 minutes. During the two month researchcruise, 13 compactor bags were filled and emptied. Thus, the additional timefor cleaning amounted to 6.5 hours over the 60 day period.
Comments by the captains or crew members responsible for the refusehandling tasks on these three vessels reveal that compaction is a method whichwill minimize the time and work required to handle refuse on board and onewhich will facilitate refuse storage and compliance with regulationspreventing disposal of refuse at sea. Though it may take some initialadjustments to find a place to install a compactor and the compacted refuse,these are not difficult problems to resolve.
Summary:
Trash compactor use may allow persons on space limited vessels to moreeasily handle and store refuse on board.
71
APPENDIX 8 - APHIS REQUIREMENTS
HANDLING OF REFUSE RCM VESSFIS WITH FOREIGN PORT CALLS
Any garbage offloaded from a vessel (foreign and domestic) which has beenin any ports outside of the continental United States or Canada is a potentialsource of plant and livestock pests and diseases. The introduction and spreadof these pests could spell disaster for United States food production and theeconomy.
Handling of such refuse is regulated by the United States Department ofAgriculture, Animal and Plant Health Inspection Service (APHIS).
Special Requirements"Garbage" regulated under these USDA ARKS rules means all waste
materials acquired from outside the continental United States and Canada whichare derived in whole or part from all types of produce and meat materials, andany other refuse of any type that has been associated with such materials onthe vessels. This includes not only the food scraps, table refuse, and galleyrefuse, but the food wrappers and packaging materials too. (This also includesany other food and food packaging material from stores, food preparationareas, passengers or crews' quarters, and dining rooms).
While on board the vessel, APHIS regulations require that all of thisgarbage be contained in tight, leak-proof, covered receptacles within theguard rails of the vessel. This garbage cannot be unloaded in port unless itis removed in these containers under direction of an APHIS inspector. Thegarbage must go into an APHIS approved facility for sterilization,incineration, or grinding into an APHIS approved sewage system (or for otherhandling specifically allowed by APHIS). Sterilization is accomplished bycooking the refuse at 212 F for 30 minutes, incineration involves reducing therefuse to ash, and an approved sewage system is one which keeps discharge offland, lagoons or stationary waters (e.g. one that goes into a sewage treatmentplant).
APHIS inspectors have been authorized to coordinate their regulatoryefforts with activities of representatives of the Environmental ProtectionAgency, and other Federal, State, and local agencies which also havejurisdiction over such garbage.
Ports Must Apply For Facility Approval From APHISPort officials or the owners of the facilities where such refuse will be
accepted need to apply for the approval of their facilities. Write to theAdministrator, Animal and Plant Health Inspection Service, U.S. Department ofAgriculture, WA, D.C. 20250. More information is also available from thisaddress.
72
Disposal Of Refuse After APHIS Treatment The refuse which results from the sterilizer (volume is reduced by about
25%) can then be disposed of in regular refuse disposal containers.The ash that results from operation of an incinerator can then also be
disposed of in a regular disposal container (unless its composition requiresthat it be disposed of in a landfill designated for hazardous wastes).
Considerations For Choosing APHIS Reception Facilities The capacity of the APHIS approved equipment or facility will be
important for port consideration. The number of operating cycles possible perday and the volume of refuse accepted each operating cycle will determine thesystem's capacity.
While vessels are, under MARPOL ANNEX V, only required to keep certaintypes of materials on board (see Appendix 9), refuse returned to port will bemixed. The amount of refuse expected should be calculated with this in mind.If studies in Newport regarding the volume of refuse generated on commercialand recreational fishing vessels are any indication of refuse generation onother types of vessels, one might approximate a volume of refuse of between 4and 6 gallons per person per day on a vessel. (See Appendix 5).
Notes Regarding Sterilization Facilities All airports which receive planes from airports outside the continental
United States and Canada are similarly regulated. In these airports refusefrom flights is usually handled by an autoclave machine.
The Port of Seattle airport, for example now uses a sterilizer machinewhich is 5' in diameter and 10'long, which they fill up to 3/4 full of refuseone to three times per day. A sterilization cycle runs about 1.5-2 hours andis accomplished at 250 F and 15 pounds per square inch of pressure. Fuel costsfor each load run about $1.00 per load. About 30 minutes of labor is involvedeach load for cleaning out sterilized refuse and loading an unsterilizedbatch. Maintanence is minimal and costs less than $100 per year. Maintenanceinvolves cleaning the steam trap and the steamer regularly and the door sealabout once every 3 years. This type of machine costs about $20,000, notincluding installation costs.
One needs to have a source of steam to run such a sterilizer. The airportuses steam from the boiler room which is used to heat the airport terminal,but must reduce the pressure of the line from 125 psi to 20 psi through apressure reducing coupling valve. A ship's boilers could provide that sourceof steam. If no such source of steam exists a small boiler would need to bepurchased (boilers may cost $20,000 as well).
Operators have found that to efficiently sterilize refuse, plastic bagscontaining refuse must be punctured before being sterilized to allow theescapement of any liquids while the refuse is being cooked, or all the refusewill not reach the required temperature. The fewer liquids in the refuse theeasier it is for the refuse to heat up.
73
Notes Regarding Incineration Facilities Incinerators are commercially available for use both on land and on
vessels, though their use is controversial. Concern centers around thepollutants (particulates, heavy metals, and complex organic molecules) whichmay emit from incinerators. The Environmental Protection Agency is presentlyreviewing regulations applying to incinerator facilities.
A small commercial sized incinerator which may prove feasible for a smallport operation might be similar to the one in use on some U.S. Corps ofEngineer dredging vessels.
The dredging vessel, Yaquina, uses an incinerator to burn all standardrefuse (no hazardous wastes). Having had trouble incinerating wet refuse, theytry to divert all organic "wet" refuse from that which will be burned, byhaving separate recepticles in the galley. The incinerator unit measures about3' in diameter and 5' in length, and can handle about 7 cubic feet of refuse(about 58 gallons) in each two hour cycle (a cool down period is alsonecessary). Diesel fuel is burned to run the incinerator. Incinerators such asthese may cost about $16,000 (not including installation) with larger capacityincinerators costing up to $50,000.
An incinerator was in operation at the Port of Seattle airport, beforetheir conversion to a sterilization system, in 1977. The incinerator wasexpensive to operate, with the fuel costs of each load of $25.00 (1977prices). Maintanence costs were also reported to be much higher. Anotherdisadvantage of incinerator operation was seen to be the desire of othergovernmental agencies to use the incinerator for disposal of drugs andmaterials contaminated with animal or plant diseases.
Recovering CostsTo cover the purchase costs of a $20,000 facility in a 10 year period
(given a 8% interest rate) the port should recover a total of $242.66 a month.Operational, maintenance, and depreciation costs are additional.
74
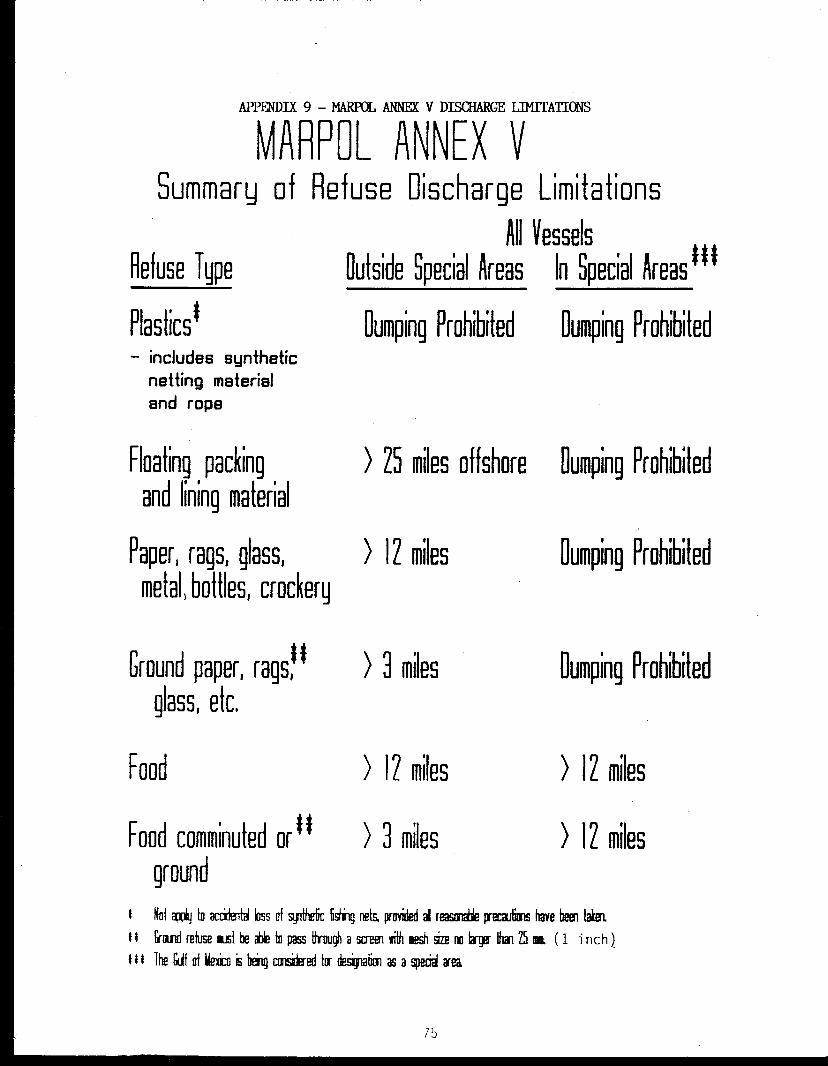
APPENDIX 9 — MARPOL ANNEX V DISCHARGE LIMITATIONS
MEL A NEX VSummary of Refuse Discharge Limitations
All VesselsOutside Special Areas In Special AreasM
Dumping Prohibited Dumping Prohibited- includes synthetic
netting materialand rope
Ilefuse Type
Plastics'
Floating packingand lining material
Paper, rags, glass,metal, bottles, crockery
Ground paper, rags,1glass, etc.
Food
) 25 miles offshore Dumping Prohibited
) 17 miles
Dumping Prohibited
) 3 miles
Dumping Prohibited
) 12 miles
) 12 miles
Food comminuted or"
) 3 miles
) 12 milesground
I Not aptly to accidental loss id sgrilfefic fisting nets, provided al reasonable millions have hemkind rehire nisi be able to pass through a screen iith mesh sin no irger Oran 3 ra (1 inch)
M The Cult id Imo is !via] conidered for designation as a special area
75