Embed Size (px)
Citation preview
Internet use and attitudes
2017 Metrics Bulletin
Research Document
Publication date: 3 August 2017
Contents
Section Page
1 Introduction 1
2 Internet reach 7
3 Internet breadth of use 9
4 Internet attitudes and understanding 11
5 Non-users of the internet 16
Annex Page
1 Technical note 19
Internet use and attitudes bulletin 2017
1
Section 1
1 Introduction
1.1 Scope of the report
This purpose of this 2017 internet use and attitudes bulletin is to provide a single home for a number of key internet metrics across a variety of sub-groups within the UK adult population. It is designed to be a reference document for our stakeholders.
It draws primarily on the annual Ofcom Adults’ Media Literacy Tracker survey1, for which 1,846 interviews with UK adults aged 16 and over were conducted in November and December 2016. It also includes data from the Ofcom Technology Tracker2, drawn from 3,743 interviews with adults aged 16 and over, in January and February 20173. It provides the following data:
• Who is online and how this changed: between 2015 and 2016 (for the MediaLiteracy Tracker) and between 2016 and 2017 (for the Technology Tracker). It setsout the percentage of the UK population who ever use the internet on any device;who has broadband access at home; and who accesses it from different types oflocation outside the home. This section also looks at the incidence of UK adults whogo online only using devices other than a desktop or laptop computer, and those whogo online only using a smartphone.
• The ‘breadth’ of people’s internet use: this is measured in two ways; by anaggregation of the numbers of types of activities carried out by those who use theinternet at home or elsewhere, and by focusing on selected types of activity. Thetypes of activity featured in the Technology Tracker have been amended since2016, so it is not possible to compare the findings for the aggregated data with thosefrom 2016.
• Information relating to people’s understanding of issues related to criticalthinking and their attitudes towards internet safety. The bulletin explores whetherpeople check the accuracy of factual information they find online, and looks at theirawareness of the funding of online content and their trust in social media content. Italso looks at attitudes towards the sharing and management of personal data online.All the data in this section relate to 2016 and show, where applicable, how thesemetrics have changed since 2015.
• Information about non-users of the internet. This includes the incidence of non-use of the internet, the levels of likely internet take-up, the proportion of non-userswithout any intention of getting home internet access, the proportion of these whogive reasons relating to cost or to interest/ need, and the incidence of proxy use inthe past year. This section also shows any change since 2015 (for the Media LiteracyTracker) and since 2016 (for the Technology Tracker).
1 https://www.ofcom.org.uk/__data/assets/pdf_file/0032/98474/Media-Literacy-Tracker-2016-Adults-data-tables-for-publication.pdf 2 https://www.ofcom.org.uk/__data/assets/pdf_file/0015/101292/technology-tracker-data-tables-h1-2017.pdf 3 Data are available at https://www.ofcom.org.uk/research-and-data/data/statistics/stats17
Internet use and attitudes bulletin 2017
2
1.2 Key findings
Findings from the Ofcom Adults’ Media Literacy Tracker (2016) and the Ofcom Technology Tracker (2017)
• In 2017, eight in ten (83%) UK adults aged 16+ say they have broadband internetaccess at home, and nine in ten (89%) UK adults aged 16+ say they use the interneteither at home or in other locations. Use of the internet anywhere (i.e. at home or inother locations) has increased since 2016. As in previous years, differences by agegroup are considerable; 99% of 16-24s say they use the internet, compared to 50%of those aged 75+.
• Two-thirds of UK adults (66%) say they go online via their mobile phone, unchangedsince 2016. Nine in ten (89%) of 16-24s say they do this, compared to 22% of thoseaged 65+. Similar to the proportion going online in any location, use of a mobilephone to go online is less likely in DE households (54%) than in ABC1 households(74%).
• A quarter of UK adults (24%) only use devices other than a desktop or laptopcomputer to go online, an increase of eight percentage points on 2015. Only using analternative device is more likely in DE households (33%) than in ABC1 households(18%).
• About one in ten UK adults (8%) only use a smartphone to go online, up from 6% in2015. Again, this is more likely in DE households (13%) than in ABC1 households(6%).
• Thirty-one per cent of those who use the internet at home or elsewhere are broadusers of the internet (carrying out 10-15 of the 15 types of activity asked about4).Internet users aged 25-44 are more likely to be broad users (39% of both 25-34s and35-44s) while those aged 55+ are less likely (18%). Four in ten (39%) of those inABC1 households are broad users, compared to 19% of those in DE households.
• Three in ten (28%) of those who use the internet at home or elsewhere are narrowusers of the internet (carrying out one to four of the 15 types of activity asked aboutin 20175). Close to half (47%) of those aged 65 and over are narrow users, comparedto 25% or less of those aged under 55. Those in C2DE households are more likelythan all UK internet users to be narrow users (36% vs. 28%).
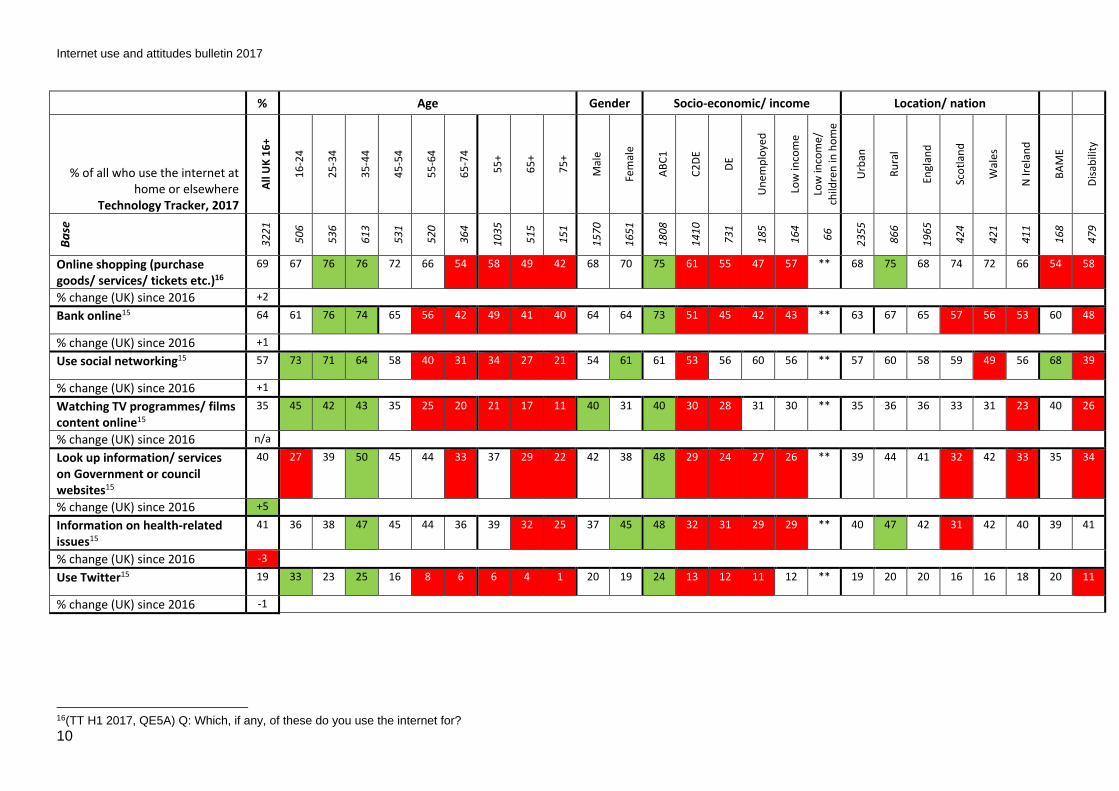
• Around two-thirds (69%) of those who use the internet at home or elsewhere saythey use the internet for online shopping. A similar proportion of adults bank online(64%), with fewer using social networking (57%), while four in ten (40%) look upinformation or services on government or council websites; an increase of fivepercentage points since 2016. Internet users aged 55 and over are less likely than allusers to say they buy things online, bank online or use social networking. Adults inthe DE socio-economic group are less likely to buy things online, bank online or usegovernment or council services online. Women are more likely than men to usesocial networking.
• In 2016, around six in ten (58%) search engine users recognised that search engineresults may or may be inaccurate or biased, and a similar proportion (57%)
4 The types of activity featured in the Technology Tracker have been amended since 2016, so it is not possible to compare the aggregated data on categories of use in 2017 with those from 2016 5 See footnote 4

Internet use and attitudes bulletin 2017
3
recognised that certain results listed on Google are adverts. Both findings are unchanged since 2015.
• Seven in ten (72%) internet users say they are confident in knowing how to managewho has access to their personal data online. While 27% say they give out inaccurateor false details to protect their identity online, 35% say they are happy to providepersonal information online so long as they get what they want.
• Seven in ten internet users say they carry out appropriate checks before enteringtheir personal details online (70%) or before entering their credit/ debit card detailsonline (74%).
• Across all UK adults, 14% are non-users of the internet, unchanged since 2015.Among those aged 75 and over, more than half (56%) are non-users of the internet,but very few aged 16-24 (2%) or 25-34 (3%) are non-users. Non-use remains higheramong adults in DE households (27%) compared to ABC1 households (7%).
• More non-users cite lack of perceived need as their main reason for not going online(43%) than cite reasons relating to cost (11%).
• Among non-users, ‘proxy’ use of the internet (by someone else on their behalf)stands at 38%.

Internet use and attitudes bulletin 2017
4
1.3 Overall trends over time
It is useful to provide some initial context of how take-up rates have developed over time, and to compare the internet with other digital media. Figure 1 sets out how take-up has changed across a range of digital media. More detailed discussion of take-up of media and communications devices and services is available in the Communications Market Report 20176.
Figure 1: Take-up of key media since 2000
Proportion of individuals (%)
63%
83%
44%
28%38%
60%
76%
26%
0%
20%
40%
60%
80%
100%
2000 2001 2002 2003 2004 2005 2006 2007 2008 2009 2010 2011 2012 2013 2014 2015 2016 2017
DVD player
Broadband
Games console
MP3 player
DAB digital radio
DVR
Smartphone
E-reader
Source: Ofcom research. (Technology Tracker H1, 2017) Note: The question wording for DVD player and DVR was changed in Q1 2009, so data are not directly comparable with previous years
Figure 2 shows the extent to which UK adults in 2011, 2012, 2013, 2014, 2015, 2016 and 2017 use a computer or laptop at home to go online, and also shows those using mobile phones or games consoles/ games players to go online.
Figure 2: Devices used to go online: 2011 to 2017
76%74%
32%
15%
78% 77%
39%
20%
80%78%
49%
18%
82%80%
57%
25%
85%82%
61%
24%
86%84%
66%
21%
88%84%
66%
21%
0%
20%
40%
60%
80%
100%
ANY OF THESE PC or laptop at home Mobile phone Games console/ player
2011 2012 2013 2014 2015 2016 2017
Source: Ofcom research. (Technology Tracker H1, 2017)
6 https://www.ofcom.org.uk/__data/assets/pdf_file/0017/105074/cmr-2017-uk.pdf

Internet use and attitudes bulletin 2017
5
1.4 Who is measured
It is important to monitor different sub-groups within the UK, as take-up and use of the internet varies greatly, particularly by age and by socio-economic group. For example, while 99% of those aged 16-24 use the internet (anywhere), only 50% of over-74s do so, and users in ABC1 households are more likely than those in C2DE households to be categorised as ‘broad’ internet users (39% vs. 21%).
This Metrics Bulletin tracks the following groups wherever possible, given the survey base sizes and sampling:
• Age
• Gender
• Socio-economic group
• Low income / unemployed
• Rural / urban
• Black /Asian/ minority ethnic group (BAME)
• Disability
• Devolved nations
The following considerations should be taken into account when looking at these groups:
Low income
Questions about levels of income in surveys tend to attract higher rates of refusal, especially among those on low incomes. This group is included in the report, but as refusal rates vary year by year, there is a degree of uncontrolled variation, so trend data should be viewed with caution.
The income bands used in one of the two surveys (the Technology Tracker study) have been amended since 2016, so it is not possible to compare the findings in 2017 with those from 2016.
Rural/ urban
The government definitions of rural and urban differ between England and Wales, and Scotland, while the Northern Ireland Assembly allows definitions based on the research need. Therefore, to enable consistent analysis by rurality, we use UK Geographics’ Locale Classification instead. This is a proprietary measure based on the ONS criteria. A full description of the seven definitions and how they are classified as rural or urban can be found in Annex 1 of this report.
Black / Asian minority ethnic group (BAME)
The ‘ethnic minority’ group comprises all those who answered that they belonged to groups within: Asian and British Asian; Black and Black British; Middle East and Arabic origin; Chinese or other ethnic group; mixed; or other. It should be noted that the group does not include other white ethnic groups such as people from Poland, Australia etc. Ofcom is aware of the limitations of such a broad categorisation, but surveying all these groups to provide robust individual measures would be prohibitive in terms of cost. There are no internal controls for sub-category, resulting in a degree of uncontrolled variation, so we do not report trend data. Special weighting, derived from ONS data and an examination of Ofcom’s previous research, has been applied to these data to create an appropriate analysis group. We provide this summary information as an indicative measure, to show differences

Internet use and attitudes bulletin 2017
6
in take-up or attitudes, which may enable stakeholder understanding and targeting of particular issues.
Disability
The ‘disability’ group comprises all those who answered that they had any conditions that limited their daily activities or the work they could do. In 2017, 16% of UK adults gave this response. The surveys did not set any quotas or sampling framework for the incidence of disability, and so, like the BAME group, data from this group should be seen only as an indicative measure of the habits and opinions of disabled people. Likewise, due to the degree of uncontrolled variation, trend data are not reported. Special weighting, derived from examination of Ofcom’s previous research, has been applied to these data to create an appropriate analysis group.
1.5 Understanding the results
Measures from Ofcom’s 2016 Media Literacy Tracker (conducted at the end of 2016) are reported alongside measures from Half 1 2017 of Ofcom’s Technology Tracker (conducted at the beginning of 2017). Habits may have shifted in the intervening months, but relative differences between the sub-groups remain pertinent.
Within each section, we compare the sub-group response and the all-UK figure for each of the age, socio-economic/ income and location/ nation groups, and for BAME and disability. Where a response is different to the all-UK figure, the cell is coloured (green, if the sub-group response is higher than the all-UK figure; or red, if it is lower), as shown in the example below. The exceptions are male/ female and urban/ rural, where the comparisons are to each other. Differences are statistically significant at the 95% level.
xx Signifies higher response
xx Signifies lower response
Tracking sub-groups over time requires large base sizes in order that percentage change can be deemed statistically significant. All significant changes between 2016 and 2017 for measures from the Technology Tracker, and between 2015 and 2016 for measures from the Media Literacy Tracker, are indicated by coloured cells within each section in the rows labelled ‘% change since 2016/ 2015’ for the UK overall figure.
The number of interviews conducted with the different sub-groups of UK adults detailed in this report is indicated in the rows labelled ‘base’. Where a sub-group base size is less than 100 interviews, these responses have been excluded from the analysis and are indicated ‘**’ within the grid of measures.

Internet use and attitudes bulletin 2017
7
Section 2
2 Internet reach This section provides information about who is online, and how this has changed compared to the previous year. It sets out the percentage of the UK population who ever use the internet on any device, who has home broadband access, and who goes online from different types of location outside the home. The incidence of UK adults only using devices other than a desktop or laptop computer to go online or only using a smartphone to go online is also detailed in this section. Coloured cells in the All UK column indicate whether there has been a significant year-on-year change, coloured cells in the gender and urban/rural columns indicate whether the sub-groups are significantly different to each other, and coloured cells in the other columns indicate whether the sub-group response is different to the all-UK figure7.
% Age Gender Socio-economic/ income Location/ nation
% of all respondents Technology Tracker, 2017
All
UK
16
+
16
-24
25
-34
35
-44
45
-54
55
-64
65
-74
55
+
65
+
75
+
Mal
e
Fem
ale
AB
C1
C2
DE
DE
Un
emp
loye
d
Low
inco
me
Low
inco
me/
child
ren
in
ho
me
Urb
an
Ru
ral
Engl
and
Sco
tlan
d
Wal
es
N Ir
elan
d
BA
ME
Dis
abili
ty
Ba
se
37
43
51
2
54
4
64
0
56
2
62
6
50
0
14
85
85
9
35
9
18
27
19
16
19
35
18
05
99
4
21
7
28
9
69
27
17
10
26
22
45
51
0
49
5
49
3
18
3
71
9
Ever use the internet anywhere8 89 99 98 97 96 87 78 74 65 50 90 89 95 83 78 89 62 ** 89 90 90 85 88 86 92 69
% change since 2016 +2 +7 +3 +2 n/a +2 +3 n/a n/a
Broadband take-up9 83 87 89 89 91 83 75 70 63 49 84 81 90 74 66 64 47 ** 82 86 84 73 79 79 84 61
% change since 2016 +2 +8 +3 n/a +3 n/a n/a
Use mobile phone to go online10 66 89 87 86 71 51 30 34 22 13 67 65 74 58 54 64 41 ** 66 67 68 57 58 68 80 34
% change since 2016 0 +7 +4 n/a n/a n/a
Use internet at work/ college11 39 64 48 54 44 26 6 13 3 1 44 34 52 24 15 7 12 ** 38 42 39 42 34 42 41 11
% change since 2016 -1 -4 n/a -3 +7 n/a n/a
Use internet at a library10 5 11 3 8 3 4 3 3 2 1 5 5 7 3 4 7 5 ** 5 6 5 4 6 4 13 3
% change since 2016 -2 -5 -2 -2 n/a -2 +3 -2 n/a n/a
7Differences are statistically significant at the 95% level. Red cells indicate a significantly lower figure and green cells indicate a significantly higher one. 8(TT H1 2017, IN6) Q: Do you/ does anyone in your household have access to the internet at home? / Do you ever go online anywhere other than in your home at all? 9 (TT H1 2017, QE9) Q: Which of these methods does your household use to connect to the internet at home? 10 (TT H1 2017, QD28) Q: Which, if any, of the following activities, other than making and receiving calls, do you use your mobile for? 11 (TT H1 2017, IN6) Q: Do you ever access the internet anywhere other than in your home at all? ** = Sub-group base size lower than 100 and therefore excluded from the analysis

Internet use and attitudes bulletin 2017
8
% Age Gender Socio-economic/ income Location/ nation
% of all respondents Media Literacy Tracker, 201612
All
UK
16
+
16
-24
25
-34
35
-44
45
-54
55
-64
65
-74
55
+
65
+
75
+
Mal
e
Fem
ale
AB
C1
C2
DE
DE
Un
emp
loye
d
Low
inco
me
Low
inco
me/
child
ren
in h
om
e
Urb
an
Ru
ral
Engl
and
Sco
tlan
d
Wal
es
N Ir
elan
d
BA
ME
Dis
abili
ty
Ba
se
18
46
23
4
27
2
31
3
28
4
27
0
21
8
74
3
47
3
25
5
88
5
96
1
99
3
85
3
48
4
46
26
5
56
15
41
30
5
11
72
22
7
22
3
22
4
12
9
25
1
Only use devices other than PC/laptop to go online13
24 31 37 25 23 17 12 14 12 11 19 28 18 30 33 ** 30 ** 24 25 23 24 26 40 25 21
% change since 2015 +8 +11 +18 +5 +7 +9 +6 +9 +9 +10 +8 +11 +8 +8 n/a n/a
Only use a smartphone to go online12
8 12 17 10 8 2 1 1 0 0 7 9 6 11 13 ** 8 ** 8 7 8 8 11 5 13 4
% change since 2015 +2 +8 +4 +6 -6 n/a n/a
12 These measures are shown in a separate table as they are taken from the Media Literacy Tracker and not the Technology Tracker 13(MLT 2016, IN1/ IN2) Q: Do you ever go online?/ Do you ever go online using any of these devices? ** = Sub-group base size lower than 100 and therefore excluded from the analysis

Internet use and attitudes bulletin 2017
9
Section 3
3 Internet breadth of use The ‘breadth’ of people’s internet use is indicated in this section in two ways – by an aggregation of the numbers of types of activities carried out by those who use the internet at home or elsewhere, and by focusing on selected types of activity. Coloured cells in the All UK column indicate whether there has been a significant year-on-year change, coloured cells in the gender and urban/rural columns indicate whether the sub-groups are significantly different to each other and coloured cells in the other columns indicate whether the sub-group response is different to the all-UK figure14. The types of activity are ranked by the percentage of those saying that they ever do such things.
% Age Gender Socio-economic/ income Location/ nation
% of all who use the internet at home or elsewhere
Technology Tracker, 2017
All
UK
16
+
16
-24
25
-34
35
-44
45
-54
55
-64
65
-74
55
+
65
+
75
+
Mal
e
Fem
ale
AB
C1
C2
DE
DE
Un
emp
loye
d
Low
inco
me
Low
inco
me/
ch
ildre
n in
ho
me
Urb
an
Ru
ral
Engl
and
Sco
tlan
d
Wal
es
N Ir
elan
d
BA
ME
Dis
abili
ty
Ba
se
32
21
50
6
53
6
61
3
53
1
52
0
36
4
10
35
51
5
15
1
15
70
16
51
18
08
14
10
73
1
18
5
16
4
66
23
55
86
6
19
65
42
4
42
1
41
1
16
8
47
9
Carrying out 1-4 of the 15 types of internet activity15
28 25 23 21 25 32 44 39 47 51 26 29 21 36 40 37 44 ** 28 26 26 34 33 36 25 41
% change (UK) since 2016 n/a
Carrying out 5-9 of the 15 types of activity14
37 39 37 39 40 37 30 33 28 24 35 39 38 36 35 35 30 ** 38 32 37 38 38 36 43 28
% change (UK) since 2016 n/a
Carrying out 10-15 of the 15 types of activity14
31 35 39 39 32 23 17 18 13 7 34 29 39 21 19 21 21 ** 30 38 33 23 25 22 29 23
% change (UK) since 2016 n/a
14Differences are statistically significant at the 95% level. Red cells indicate a significantly lower figure and green cells indicate a significantly higher one. 15(TT H1 2017, QE5A) Q: Which, if any, of these do you use the internet for? The 15 types of internet activity in 2017 are: email, transactions, communications, banking, social media, news, information (work/ school/ college), watch short video clips, health information, government services, watching TV content, radio/ audio services, upload/ add content to the internet, remote use (cloud services/ control household services), games.
Internet use and attitudes bulletin 2017
10
% Age Gender Socio-economic/ income Location/ nation
% of all who use the internet at home or elsewhere
Technology Tracker, 2017
All
UK
16
+
16
-24
25
-34
35
-44
45
-54
55
-64
65
-74
55
+
65
+
75
+
Mal
e
Fem
ale
AB
C1
C2
DE
DE
Un
emp
loye
d
Low
inco
me
Low
inco
me/
ch
ildre
n in
ho
me
Urb
an
Ru
ral
Engl
and
Sco
tlan
d
Wal
es
N Ir
elan
d
BA
ME
Dis
abili
ty
Ba
se
32
21
50
6
53
6
61
3
53
1
52
0
36
4
10
35
51
5
15
1
15
70
16
51
18
08
14
10
73
1
18
5
16
4
66
23
55
86
6
19
65
42
4
42
1
41
1
16
8
47
9
Online shopping (purchase goods/ services/ tickets etc.)16
69 67 76 76 72 66 54 58 49 42 68 70 75 61 55 47 57 ** 68 75 68 74 72 66 54 58
% change (UK) since 2016 +2
Bank online15 64 61 76 74 65 56 42 49 41 40 64 64 73 51 45 42 43 ** 63 67 65 57 56 53 60 48
% change (UK) since 2016 +1
Use social networking15 57 73 71 64 58 40 31 34 27 21 54 61 61 53 56 60 56 ** 57 60 58 59 49 56 68 39
% change (UK) since 2016 +1
Watching TV programmes/ films content online15
35 45 42 43 35 25 20 21 17 11 40 31 40 30 28 31 30 ** 35 36 36 33 31 23 40 26
% change (UK) since 2016 n/a
Look up information/ services on Government or council websites15
40 27 39 50 45 44 33 37 29 22 42 38 48 29 24 27 26 ** 39 44 41 32 42 33 35 34
% change (UK) since 2016 +5
Information on health-related issues15
41 36 38 47 45 44 36 39 32 25 37 45 48 32 31 29 29 ** 40 47 42 31 42 40 39 41
% change (UK) since 2016 -3
Use Twitter15 19 33 23 25 16 8 6 6 4 1 20 19 24 13 12 11 12 ** 19 20 20 16 16 18 20 11
% change (UK) since 2016 -1
16(TT H1 2017, QE5A) Q: Which, if any, of these do you use the internet for?

Internet use and attitudes bulletin 2017
11
Section 4
4 Internet attitudes and understanding This section provides information relating to people’s understanding of issues relating to critical thinking; it explores whether people check the accuracy of factual information they find online and looks at their awareness of the funding of online content. It also examines trust in social media content, attitudes towards the sharing and management of personal data online, and the extent to which internet users make appropriate checks before entering personal information online.
Coloured cells in the All UK column indicate whether there has been a significant year-on-year change, coloured cells in the gender and urban/rural columns indicate whether the sub-groups are significantly different to each other, and coloured cells in the other columns indicate whether the sub-group response is different to the all-UK figure17.
% Age Gender Socio-economic/ income Location/ nation
% of all search engine site users Media Literacy Tracker, 2016
All
UK
16
+
16
-24
25
-34
35
-44
45
-54
55
-64
65
-74
55
+
65
+
75
+
Mal
e
Fem
ale
AB
C1
C2
DE
DE
Un
emp
loye
d
Low
inco
me
Low
inco
me/
ch
ildre
n in
ho
me
Urb
an
Ru
ral
Engl
and
Sco
tlan
d
Wal
es
N Ir
elan
d
BA
ME
Dis
abili
ty
Ba
se
15
16
22
8
26
1
28
8
25
9
21
6
13
8
48
0
26
4
12
6
72
3
79
3
89
1
62
5
33
1
38
16
8
54
12
75
24
1
97
5
17
5
18
3
18
3
11
0
15
2
Search engine users who understand that the accuracy of the information in the websites shown in results is variable18
58 61 58 55 59 62 52 58 52 52 57 58 63 51 49 ** 54 ** 58 58 57 66 68 59 46 54
% change (UK) since 2015 -4
Search engine users who recognise that certain results listed on Google are adverts19
57 58 60 54 58 56 59 57 55 46 59 56 63 49 49 ** 46 ** 58 54 58 53 65 43 51 57
% change (UK) since 2015 -3
17Differences are statistically significant at the 95% level. Red cells indicate a significantly lower figure and green cells indicate a significantly higher one. 18(MLT 2016, IN50) Q: Which one of these is closest to your opinion about the level of accuracy or bias of the information detailed in the websites that appear in the results pages? I think that some of the websites will be accurate or unbiased and some won’t be. 19 (MLT 2016, IN51) Q: Here's an image from a Google search for 'walking boots'. Do any of these apply to the first four results that are shown on the left? These are adverts/ sponsored links/ paid to appear here. ** = Sub-group base size lower than 100 and therefore excluded from the analysis

Internet use and attitudes bulletin 2017
12
% Age Gender Socio-economic/ income Location/ nation
% of all internet users Media Literacy Tracker, 2016
All
UK
16
+
16
-24
25
-34
35
-44
45
-54
55
-64
65
-74
55
+
65
+
75
+
Mal
e
Fem
ale
AB
C1
C2
DE
DE
Un
emp
loye
d
Low
inco
me
Low
inco
me/
ch
ildre
n in
ho
me
Urb
an
Ru
ral
Engl
and
Sco
tlan
d
Wal
es
N Ir
elan
d
BA
ME
Dis
abili
ty
Ba
se
15
53
23
1
26
5
29
3
26
5
22
0
14
1
49
9
27
9
13
8
74
5
80
8
91
5
63
8
33
8
38
17
2
54
13
02
25
1
99
9
17
6
18
9
18
9
11
4
15
8
Internet users who say they check the accuracy of factual information found online20
67 75 70 69 66 70 53 60 50 44 68 66 73 59 57 ** 60 ** 67 70 67 70 68 59 69 60
% change (UK) since 2015 n/a
Internet users who agree with the statement ‘As long as the internet provides good websites it doesn’t really matter who owns the websites or how they’re funded’21
39 42 42 35 40 36 42 39 42 42 44 35 37 42 41 ** 40 ** 40 37 40 37 28 35 47 38
% change (UK) since 2015 +1
20(MLT 2016, IN39) Q: When you find factual information online, perhaps on social media or on search engines like Google do you ever check the accuracy of the information in any of these ways? The incidence shown reflects those making at least one of the six checks they were prompted with. ** = Sub-group base size lower than 100 and therefore excluded from the analysis 21(MLT 2016, IN38B) Q: I’m going to read out some things that other people have said about being online. Please use this card to tell me the extent to which you agree or disagree with each statement I read out: As long as the internet provides good websites it doesn’t really matter who owns the websites or how they’re funded. ** = Sub-group base size lower than 100 and therefore excluded from the analysis
Internet use and attitudes bulletin 2017
13
% Age Gender Socio-economic/ income Location/ nation
% of all with a social media profile/ account
Media Literacy Tracker, 2016
All
UK
16
+
16
-24
25
-34
35
-44
45
-54
55
-64
65
-74
55
+
65
+
75
+
Mal
e
Fem
ale
AB
C1
C2
DE
DE
Un
emp
loye
d
Low
inco
me
Low
inco
me/
ch
ildre
n in
ho
me
Urb
an
Ru
ral
Engl
and
Sco
tlan
d
Wal
es
N Ir
elan
d
BA
ME
Dis
abili
ty
Ba
se
11
36
22
1
23
6
23
4
19
3
13
0
69
25
2
12
2
53
51
5
62
1
65
7
47
9
26
6
32
13
1
49
95
6
18
0
73
2
13
5
13
3
13
6
87
10
2
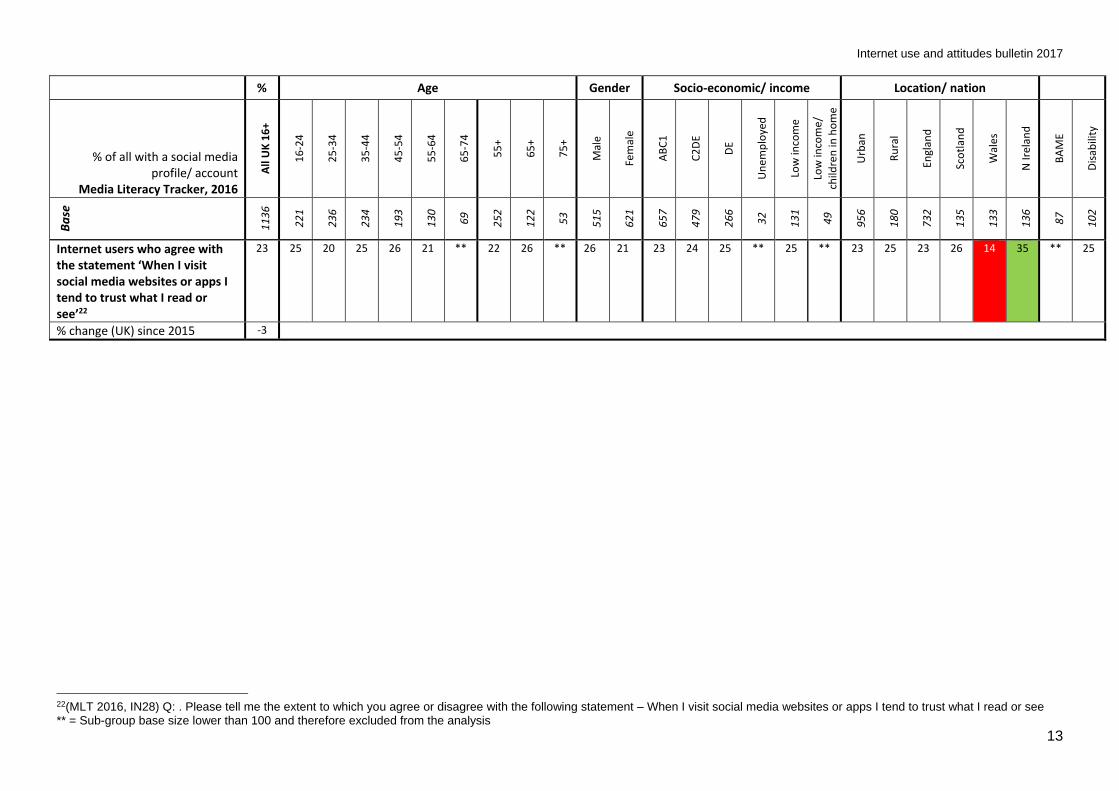
Internet users who agree with the statement ‘When I visit social media websites or apps I tend to trust what I read or see’22
23 25 20 25 26 21 ** 22 26 ** 26 21 23 24 25 ** 25 ** 23 25 23 26 14 35 ** 25
% change (UK) since 2015 -3
22(MLT 2016, IN28) Q: . Please tell me the extent to which you agree or disagree with the following statement – When I visit social media websites or apps I tend to trust what I read or see ** = Sub-group base size lower than 100 and therefore excluded from the analysis

Internet use and attitudes bulletin 2017
14
% Age Gender Socio-economic/ income Location/ nation
% of all internet users Media Literacy Tracker, 2016
All
UK
16
+
16
-24
25
-34
35
-44
45
-54
55
-64
65
-74
55
+
65
+
75
+
Mal
e
Fem
ale
AB
C1
C2
DE
DE
Un
emp
loye
d
Low
inco
me
Low
inco
me/
ch
ildre
n in
ho
me
Urb
an
Ru
ral
Engl
and
Sco
tlan
d
Wal
es
N Ir
elan
d
BA
ME
Dis
abili
ty
Ba
se
15
53
23
1
26
5
29
3
26
5
22
0
14
1
49
9
27
9
13
8
74
5
80
8
91
5
63
8
33
8
38
17
2
54
13
02
25
1
99
9
17
6
18
9
18
9
11
4
15
8
Internet users who say they are confident ‘Knowing how to manage who has access to their personal data online’23
72 88 80 77 67 60 56 58 55 53 75 69 75 68 71 ** 66 ** 72 72 71 80 76 73 77 66
% change (UK) since 2015 n/a
Internet users who agree with the statement ‘I give out inaccurate or false details on some websites to protect my personal identity online’24
27 35 32 27 30 18 17 16 14 8 28 25 28 24 24 ** 23 ** 26 29 27 24 21 12 32 23
% change (UK) since 2015 +2
Internet users who agree with the statement ‘I am happy to provide personal information online as long as I get what I want’25
35 38 42 33 35 32 32 30 28 21 39 32 35 35 33 ** 35 ** 35 34 34 56 23 35 34 20
% change (UK) since 2015 n/a
23(MLT 2016, IN11C) Q: I’m going to read out some questions about confidence using the internet. For each one please say which of the options on the card applies to you: How confident are you in knowing how to manage who has access to your personal data online? By this I mean knowing how to stop some companies from getting access to information like your personal details (like your address, phone number, date of birth etc) or information on things like where you shop or your interests? 24(MLT 2016, IN42A) Q: Please take a look at the two statements shown on this card and tell me which number on this scale from1 to 5 best describes the extent to which you agree or disagree with each statement: I give out inaccurate or false details on some websites to protect my personal identity online. 25(MLT 2016, IN42B) Q: Please take a look at the two statements shown on this card and tell me which number on this scale from1 to 5 best describes the extent to which you agree or disagree with each statement: I am happy to provide personal information online as long as I get what I want. ** = Sub-group base size lower than 100 and therefore excluded from the analysis
Internet use and attitudes bulletin 2017
15
% Age Gender Socio-economic/ income Location/ nation
% of all internet users who say they register personal details
online Media Literacy Tracker, 2016
All
UK
16
+
16
-24
25
-34
35
-44
45
-54
55
-64
65
-74
55
+
65
+
75
+
Mal
e
Fem
ale
AB
C1
C2
DE
DE
Un
emp
loye
d
Low
inco
me
Low
inco
me/
ch
ildre
n in
ho
me
Urb
an
Ru
ral
Engl
and
Sco
tlan
d
Wal
es
N Ir
elan
d
BA
ME
Dis
abili
ty
Ba
se
15
16
22
9
26
2
28
8
26
0
21
5
13
7
47
7
26
2
12
5
72
8
78
8
89
7
61
9
32
6
37
16
2
51
12
70
24
6
97
3
17
5
18
1
18
7
11
3
14
9
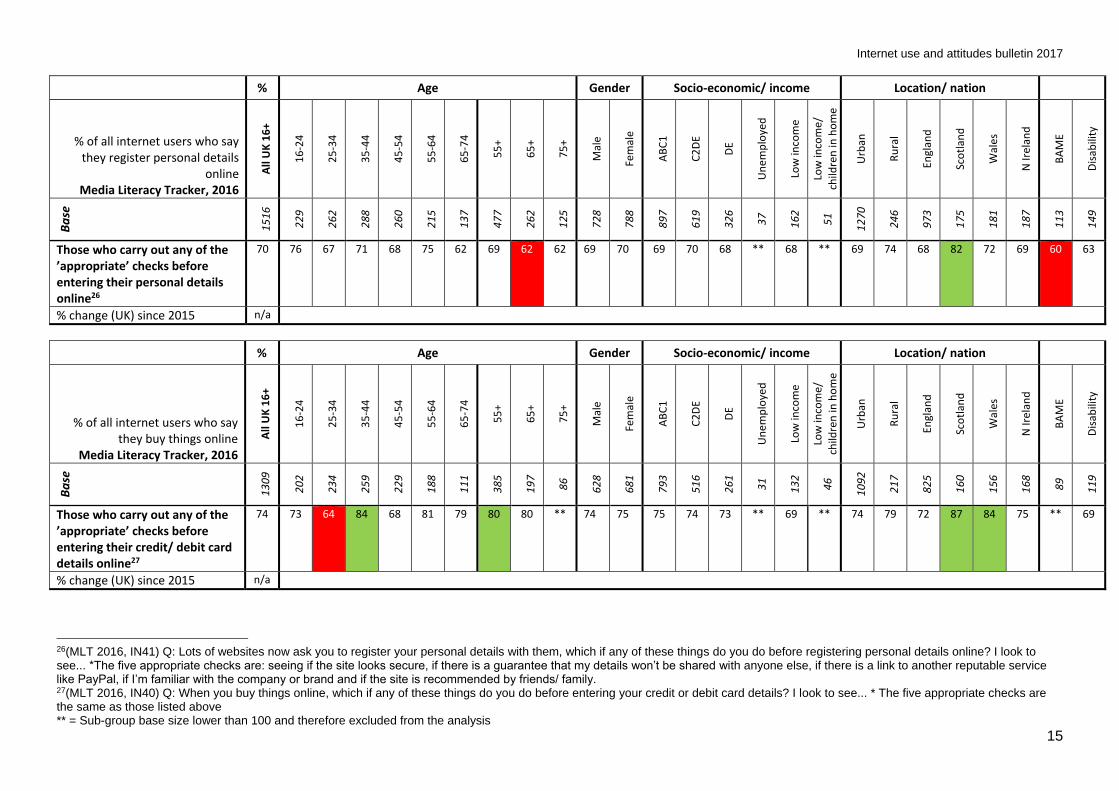
Those who carry out any of the ’appropriate’ checks before entering their personal details online26
70 76 67 71 68 75 62 69 62 62 69 70 69 70 68 ** 68 ** 69 74 68 82 72 69 60 63
% change (UK) since 2015 n/a
% Age Gender Socio-economic/ income Location/ nation
% of all internet users who say they buy things online
Media Literacy Tracker, 2016
All
UK
16
+
16
-24
25
-34
35
-44
45
-54
55
-64
65
-74
55
+
65
+
75
+
Mal
e
Fem
ale
AB
C1
C2
DE
DE
Un
emp
loye
d
Low
inco
me
Low
inco
me/
ch
ildre
n in
ho
me
Urb
an
Ru
ral
Engl
and
Sco
tlan
d
Wal
es
N Ir
elan
d
BA
ME
Dis
abili
ty
Ba
se
13
09
20
2
23
4
25
9
22
9
18
8
11
1
38
5
19
7
86
62
8
68
1
79
3
51
6
26
1
31
13
2
46
10
92
21
7
82
5
16
0
15
6
16
8
89
11
9
Those who carry out any of the ’appropriate’ checks before entering their credit/ debit card details online27
74 73 64 84 68 81 79 80 80 ** 74 75 75 74 73 ** 69 ** 74 79 72 87 84 75 ** 69
% change (UK) since 2015 n/a
26(MLT 2016, IN41) Q: Lots of websites now ask you to register your personal details with them, which if any of these things do you do before registering personal details online? I look to see... *The five appropriate checks are: seeing if the site looks secure, if there is a guarantee that my details won’t be shared with anyone else, if there is a link to another reputable service like PayPal, if I’m familiar with the company or brand and if the site is recommended by friends/ family. 27(MLT 2016, IN40) Q: When you buy things online, which if any of these things do you do before entering your credit or debit card details? I look to see... * The five appropriate checks are the same as those listed above ** = Sub-group base size lower than 100 and therefore excluded from the analysis
Internet use and attitudes bulletin 2017
16
Section 5
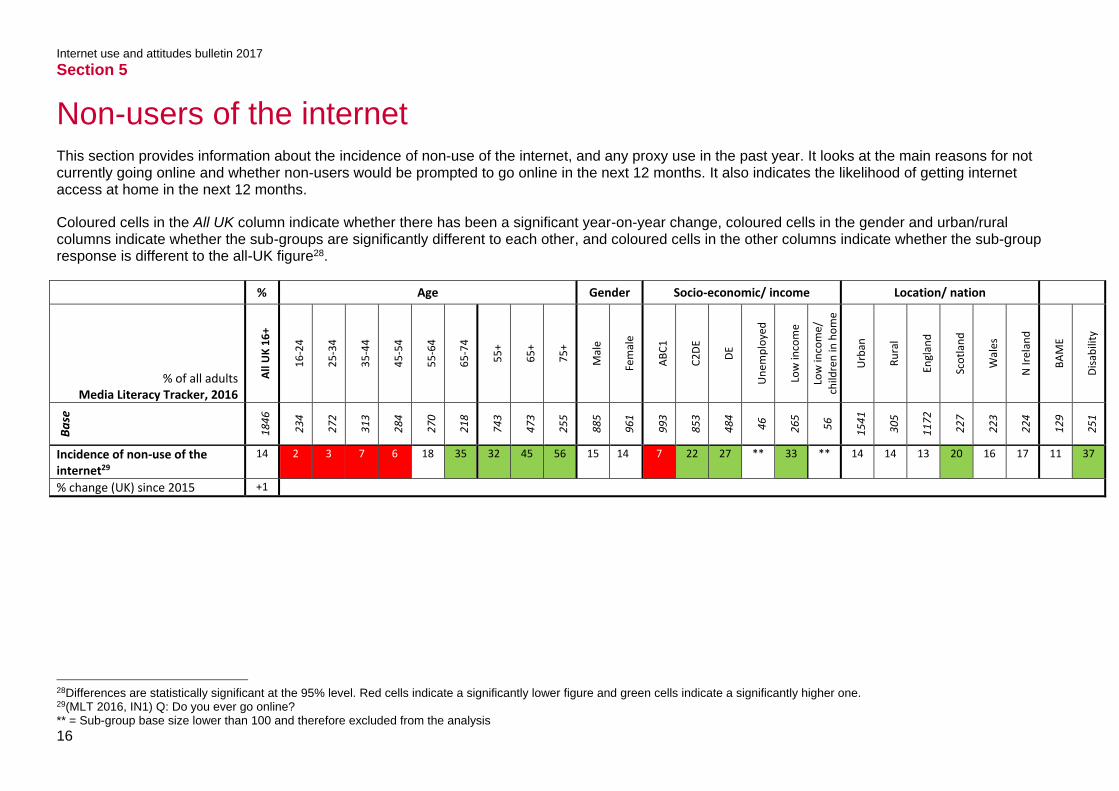
5 Non-users of the internet This section provides information about the incidence of non-use of the internet, and any proxy use in the past year. It looks at the main reasons for not currently going online and whether non-users would be prompted to go online in the next 12 months. It also indicates the likelihood of getting internet access at home in the next 12 months.
Coloured cells in the All UK column indicate whether there has been a significant year-on-year change, coloured cells in the gender and urban/rural columns indicate whether the sub-groups are significantly different to each other, and coloured cells in the other columns indicate whether the sub-group response is different to the all-UK figure28.
% Age Gender Socio-economic/ income Location/ nation
% of all adults Media Literacy Tracker, 2016
All
UK
16
+
16
-24
25
-34
35
-44
45
-54
55
-64
65
-74
55
+
65
+
75
+
Mal
e
Fem
ale
AB
C1
C2
DE
DE
Un
emp
loye
d
Low
inco
me
Low
inco
me/
ch
ildre
n in
ho
me
Urb
an
Ru
ral
Engl
and
Sco
tlan
d
Wal
es
N Ir
elan
d
BA
ME
Dis
abili
ty
Ba
se
18
46
23
4
27
2
31
3
28
4
27
0
21
8
74
3
47
3
25
5
88
5
96
1
99
3
85
3
48
4
46
26
5
56
15
41
30
5
11
72
22
7
22
3
22
4
12
9
25
1
Incidence of non-use of the internet29
14 2 3 7 6 18 35 32 45 56 15 14 7 22 27 ** 33 ** 14 14 13 20 16 17 11 37
% change (UK) since 2015 +1
28Differences are statistically significant at the 95% level. Red cells indicate a significantly lower figure and green cells indicate a significantly higher one. 29(MLT 2016, IN1) Q: Do you ever go online? ** = Sub-group base size lower than 100 and therefore excluded from the analysis

Internet use and attitudes bulletin 2017
17
% Age Gender Socio-economic/ income Location/ nation
% of all non-internet users Media Literacy Tracker, 2016
All
UK
16
+
16
-24
25
-34
35
-44
45
-54
55
-64
65
-74
55
+
65
+
75
+
Mal
e
Fem
ale
AB
C1
C2
DE
DE
Un
emp
loye
d
Low
inco
me
Low
inco
me/
ch
ildre
n in
ho
me
Urb
an
Ru
ral
Engl
and
Sco
tlan
d
Wal
es
N Ir
elan
d
BA
ME
Dis
abili
ty
Ba
se
29
3
3
7
20
19
50
77
24
4
19
4
11
7
14
0
15
3
78
21
5
14
6
8
93
2
23
9
54
17
3
51
34
35
15
93
Main reason for not going online: It’s just not for people like me/ I don’t see the need30
43 ** ** ** ** ** ** 47 47 45 42 45 ** 42 44 ** ** ** 45 ** 43 ** ** ** ** **
% change (UK) since 2015 n/a
Main reason for not going online: It’s too complicated29
19 ** ** ** ** ** ** 20 21 19 18 19 ** 18 18 ** ** ** 19 ** 19 ** ** ** ** **
% change (UK) since 2015 n/a
Main reason for not going online: It’s not worth the money/ It’s too expensive29
11 ** ** ** ** ** ** 7 7 8 9 12 ** 13 17 ** ** ** 11 ** 10 ** ** ** ** **
% change (UK) since 2015 n/a
Proxy use of the internet in the past year31
38 ** ** ** ** ** ** 40 34 31 38 39 ** 40 39 ** ** ** 39 ** 40 ** ** ** ** **
% change (UK) since 2015 n/a
Proportion of non-users stating that they would be prompted to go online in the next 12 months32
22 ** ** ** ** ** ** 18 15 9 21 22 ** 24 26 ** ** ** 23 ** 22 ** ** ** ** **
% change (UK) since 2015 n/a
30(MLT 2016, IN8) Q: Which one of the following best describes the main reason why you don’t go online? ** = Sub-group base size lower than 100 and therefore excluded from the analysis 31(MLT 2016, IN9) Q: In the past year, have you asked someone else to do something for you on the internet? 32(MLT 2016, IN10) Q: And would any of these reasons prompt you to go online in the next 12 months? Incidence shown reflects those nominating at least one of the seven reasons they were prompted with

Internet use and attitudes bulletin 2017
18
% Age Gender Socio-economic/ income Location/ nation
% of all those without internet at home
Technology Tracker, 2017
All
UK
16
+
16
-24
25
-34
35
-44
45
-54
55
-64
65
-74
55
+
65
+
75
+
Mal
e
Fem
ale
AB
C1
C2
DE
DE
Un
emp
loye
d
Low
inco
me
Low
inco
me/
ch
ildre
n in
ho
me
Urb
an
Ru
ral
Engl
and
Sco
tlan
d
Wal
es
N Ir
elan
d
BA
ME
Dis
abili
ty
Ba
se
59
7
38
33
48
40
10
9
13
5
43
8
32
9
19
4
28
0
31
7
14
7
44
9
30
8
61
14
3
11
42
8
16
9
29
4
12
2
84
97
18
25
0
Likelihood of getting internet access at home in the next 12 months33
11 ** ** ** ** 9 5 4 2 0 9 13 16 9 8 ** 6 ** 11 11 9 17 ** ** ** 7
% change since 2016 -1
33(TT H1 2017, QE24) Q: How likely are you to get internet access at home in the next 12 months? ** = Sub-group base size lower than 100 and therefore excluded from the analysis

Internet use and attitudes bulletin 2017
19
Annex 1
1 Technical note
1.1 Background
The metrics set out in this report come from two main sources: Ofcom’s twice-yearly survey of take-up and trends (the Technology Tracker), and Ofcom’s media literacy survey.
Ofcom commissioned Saville Rossiter-Base to carry out both of these surveys. Interviewing for both surveys was conducted by RED/ Quadrangle Operations, a specialist fieldwork agency, face-to-face, in the home, using Computer Assisted Personal Interviewing (CAPI). Findings from the Technology Tracker are reported in Ofcom’s Communications Market Report34 and Access and Inclusion Report35. Findings from the Media Literacy Tracker are reported in Ofcom’s UK Adults’ Media Use and Attitudes Report36.
1.2 Sampling
Interviewers are provided with specific addresses, with quotas of interviews to be achieved for each sampling point issued for the survey. The data are then weighted to the national UK profile for age, gender, socio-economic group and region. Matrix weighting has been used to achieve consistent profiles across the surveys. Special weights have been applied to respondents in each of the 65+, BAME and disability categories.
A total of 3,743 adults aged 16+ were interviewed for the Technology Tracker at 315 different sampling points in the UK. All interviews were conducted between 3rd January and 28th February 2017.
For the Media Literacy Tracker, a total of 1,846 adults aged 16+ were interviewed at 227 different sampling points in the UK. All interviews were conducted between 1st November and 9th December 2016.
The grids within each section of this report indicate the number of interviews conducted with the different sub-groups of UK adults detailed in this report.
34 https://www.ofcom.org.uk/research-and-data/multi-sector-research/cmr 35 https://www.ofcom.org.uk/research-and-data/multi-sector-research/accessibility-research/access-and-inclusion 36 https://www.ofcom.org.uk/research-and-data/media-literacy-research
Internet use and attitudes bulletin 2017
20
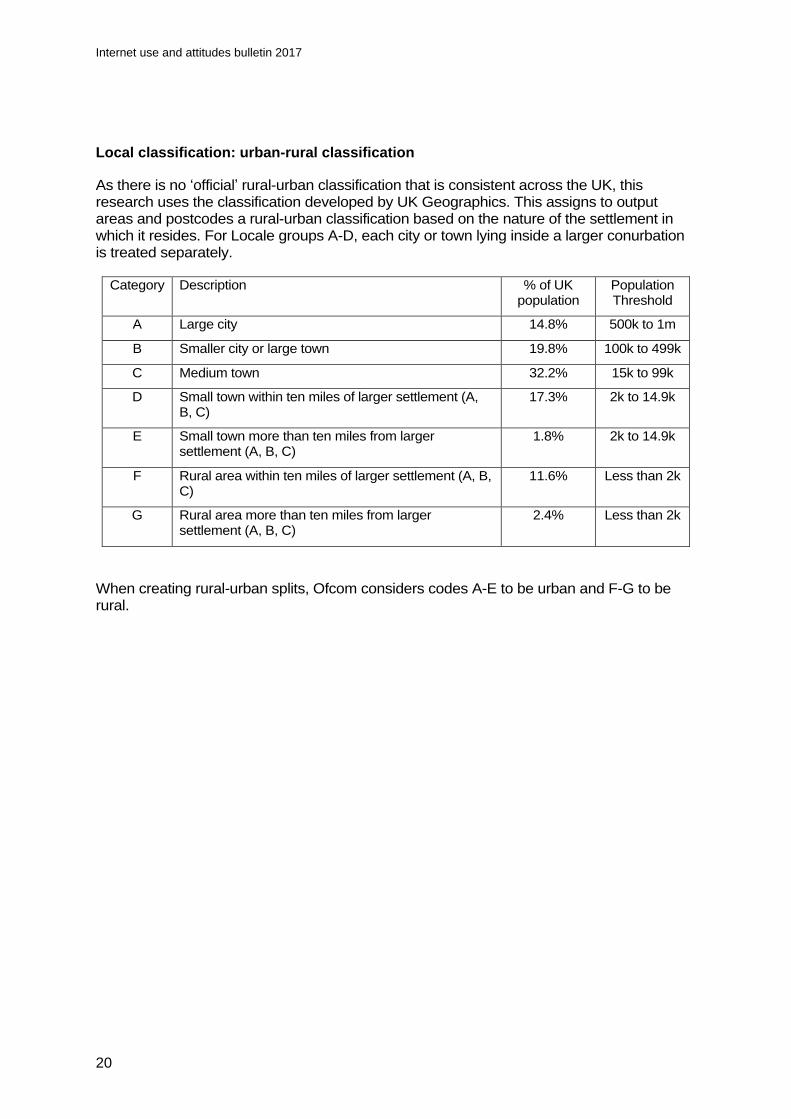
Local classification: urban-rural classification
As there is no ‘official’ rural-urban classification that is consistent across the UK, this research uses the classification developed by UK Geographics. This assigns to output areas and postcodes a rural-urban classification based on the nature of the settlement in which it resides. For Locale groups A-D, each city or town lying inside a larger conurbation is treated separately.
Category Description % of UK population
Population Threshold
A Large city 14.8% 500k to 1m
B Smaller city or large town 19.8% 100k to 499k
C Medium town 32.2% 15k to 99k
D Small town within ten miles of larger settlement (A, B, C)
17.3% 2k to 14.9k
E Small town more than ten miles from larger settlement (A, B, C)
1.8% 2k to 14.9k
F Rural area within ten miles of larger settlement (A, B, C)
11.6% Less than 2k
G Rural area more than ten miles from larger settlement (A, B, C)
2.4% Less than 2k
When creating rural-urban splits, Ofcom considers codes A-E to be urban and F-G to be rural.