Embed Size (px)
Citation preview

www.dbsvickers.com
ed-JS / sa- AS
Think it, Get it: Services to Eclipse Products
Internet of things (IoT) will revolutionise businesses, like the Internet in the 1990s. Smart city programs will accelerate IoT adoption in Asia
Service (not hardware) companies will grab over 80% of IoT spending.
Lion’s share of IoT spending will come from businesses with consumers paying < 25%
IoT will help product companies to transform into service companies. The first wave of Information Technology (IT) in the 1960s and 70s automated the value chain of enterprises. The second wave which was the Internet in the 1990s led to global supply chains. The third wave of IoT is creating smart, connected products. For the very first time, vendors are able to track their products and maintain relationships with customers even after the sale. With IoT, product companies are in a position to launch new services and generate recurring revenue streams.
Smart cities to accelerate IoT adoption in Asia. We expect South Korea and Singapore to be among the global leaders in adopting IoT. Singapore is leveraging on its Smart Nation program to resolve challenges in the utilities, transport and healthcare space. China plans to build 202 smart cities to cope with rapid urbanisation. In fact, Asian enterprises are ahead of their US peers in IoT adoption. Consumer electronics players like Samsung and LG target for 90% of their products to be IoT-capable by 2017.
Where to focus in the IoT value chain? IoT services – akin to brain of IoT - will comprise over 80% of revenue. We expect businesses to account for over 75% of spending on IoT services in pursuit of launching new services and reaping savings. Telcos may see marginal benefits as most IoT data will traverse over Wi-Fi or Bluetooth. Bigger opportunities lie in providing industry specific solutions, cloud Infrastructure and security capabilities.
Stock picks. We like ST Engineering for its potential to secure contracts from Smart Nation project. Keppel DC REIT will benefit from demand for data centers. ZTE will benefit from smart cities in China. Kingdee will ride on adoption of cloud based ERP solutions while Wasion will benefit from growth of Smart Grid in China.
HSI: 22,640.04 STI : 2,998.35 Analysts Sachin Mittal +65 6682 3699 [email protected]
Regional Research Team Business models to shift with Internet of Things
Advanced
Tran
sactional
Product
Premium Product
Service
Platform
Basic
Relational
IoT Capability
Customer Relationship
Source: DBS Bank Key companies with exposure to IoT
Source: DBS Bank; DBS Vickers
DBS Group Research. Equity 2 Nov 2015
Regional Industry Focus
Internet of Things & Smart Cities
Refer to important disclosures at the end of this report
Price Mkt Cap Target Price Performance (%)
30 Oct 15 US$m 3 mth 12 mth Rating
S$ ST Engineering 3.31 7,330 3.60 0.91 -10.78 BUY Keppel DC REIT 1.05 658 1.14 -3.69 nm BUY 800 Super 0.49 62 NR 1.03 2.08 NR Vicom 6.04 388 NR -1.61 3.03 NR HK$ Wasion 8.64 1,145 12.50 (18.80) 7.20 BUY Kingdee 3.37 1,266 3.80 (7.76) 26.88 BUY ZTE 18.96 11,926 24.00 6.48 22.62 BUY

Regional Industry Focus
Internet of Things & Smart Cities
Page 2
Analyst Sachin Mittal +65 6682 3699 [email protected] Tsz Wang TAM CFA +852 2971 1772 [email protected] Suvro SARKAR +65 6682 3720 [email protected] Patricia YEUNG +852 2863 8908 [email protected] Paul YONG CFA +65 6682 3712 [email protected] Ling Lee Keng +65 6682 3703 [email protected] Chris KO +852-2971 1707 [email protected]
Table of contents What is IoT 3 Monetization Model for IoT 4 Size of IoT Opportunity 6 Value Chain of IoT 8 IoT Adoption in Asia 10 IT Spending Breakdown 13 Singapore Smart Nation Project 14 China – Smart Cities 19 Companies Exposed to IoT 20 Appendix
Potential impact on various sectors 23
STOCK PROFILE 28
ST Engineering 29
Keppel DC Reit 32
800 Super Holdings 37
Vicom 39
Wasion Group Holdings 41
Kingdee 44
ZTE 47

Regional Industry Focus
Internet of Things & Smart Cities
Page 3
What is IoT? IoT is a network of things that are connected to each other and refers to an ecosystem comprising of things, connectivity and services including data analysis. 1) The thing (a sensor embedded in the product) has
some intelligence to sense changes around it.
2) Connectivity is also referred to as Machine-to-Machine (M2M) connectivity via cellular, Wi-Fi or Bluetooth etc.
3) The service is usually hosted in a remote location away from the thing. This can be a cloud infrastructure along with specific applications and data analytics. The service portion is likely to be the largest portion of the IoT pie on our estimate.
3 parts- Things, connectivity and Service
Source: Gartner (December 2014), DBS Bank Why IoT now? The growth in IoT-enabled devices has been fueled by the declining cost of sensors, connectivity and data processing power. Smart phone revolution has resulted in a big scale of production for these components, bring down the cost of components required for IoT. The software needed to analyze this data has improved gradually and companies are using it to boost operations and seek out new business models.
High smart phone volumes have driven down costs, paving the way for cheap IoT sensors
Source: DBS Bank According to an article published in Harvard Business Review (HBR) in Jan 2015, there have been 3 waves of IT so far. Wave 1 in 1960s and 70s – IT automated value chains such as order processing and billing Wave 2 in 1990s – Internet enabled connectivity made supply chains global and efficient Wave 3 Now – Embedded sensors resulting in smart, connected products for the very first time. Unlike the previous waves of IT transformation that boosted productivity, this wave will change the structure of industries. Smart, connected products will blur the boundaries within an industry and change the basic principles of product design. IoT will force vendors to standardise their products. For example, a patient’s home health monitor needs to talk to the hospital’s health informatics system which will require coordination on technological and product levels. Similarly, in the farming sector, when a tractor manufacturing company goes into smart, connected tractors, its product should be able to talk to irrigation systems, weather data systems and seed optimisation databases. This can be achieved through deep co-operation during product development. This is precisely the reason that Governments and big enterprise customers have an important role to play in standardising IoT protocols across the entire range of products in a sector.

Regional Industry Focus
Internet of Things & Smart Cities
Page 4
Monetization Model for IoT Business Models to shift under IoT
Source: DBS Bank Premium Product In this model, a vendor charges a premium price for the connected features of the product. An example is LIFX which produces remotely programmable LED light bulbs that can be controlled through a smart-phone app. These bulbs are sold at a premium due to this differentiation. Service Provider In this much desired model, a vendor converts what has been a traditional product into a service, builds a relationship with the customer even after the sale of the product and generates recurring revenue stream. For example, Volkswagen’s “Car-Net” service offers security features, maintenance assistance, and navigation tools to its customers for a subscription fee of US$17.99/month. With this, automatic crash notifications can be sent to chosen contacts when airbags come into use in the vehicle. A classic example of new service revenue for enterprises is Rolls-Royce who instead of selling aero engines, now contracts with many of its customers for "power-by-the-hour". Rolls-Royce is able to deliver this service due to remote monitoring and use of big data analytics on parameters such as pressure and temperate etc.
Another example of service revenue is smart thermostat manufacturer Nest (acquired by Google in 2014 for US$3.2 billion) who uses its Learning Thermostat — a home automation and energy management product — as a platform to offer energy management services to utility companies Nest charges utility companies US$30 to US$50 per thermostat annually for its service. Nest automatically reschedules usage of equipment with high electricity consumption such as air conditioners to avoid outages during the peak hours. By doing so, it has been able to reduce overall electricity requirement by as much as 50% in peak times. Platform provider In an ecosystem, the focus is not on selling a product or a service, but on providing a shared platform to other players in the ecosystem – hardware manufacturers, software developers, service providers. The platform provider ideally makes money from both end customers as well as other platform users. Platform users pay for listing and the platform provider also gets a share whenever a product is sold to the end customer on the platform. SmartThings sells its own products and services while creating a platform for other IoT companies to sell their services. SmartThings has a smartphone app that is used to control its hub and all of its connected devices. Various products that the company sells as part of the platform include locks, switches, environment sensors, alarms etc. SmartThings offers design guidelines to developers who want to make products for its platforms. SmartThings works with partners such as Belkin and Phillips, and on operating systems such as Android and iOS. According to popular technology review website - CNET, Over 1,000 devices and 8,000 applications have been made till August 2014 when the company was acquired by Samsung Electronics for approximately $200 million.
Advanced
Tran
sactional
Product
Premium Product
Service
Platform
Basic
Relational
IoT Capability
Customer Relationship

Regional Industry Focus
Internet of Things & Smart Cities
Page 5
Examples of new service launch by product companies with the help of IoT
Source: Companies, DBS Bank
Service Benefits to Customers and Vendors
Video analytics service by a telecom service provider
Businesses can gain insights into customer’s in-store behaviour without having to pay any upfront cost to buy the product. Singtel offers the cloud based Video-Analytics solution for the retail industry on a monthly subscription basis. The service leverages analytics to extract information such as age, gender and emotions from video images.
Instant Ink service by a printer manufacturer
Customers benefit from higher usage of the printer. HP Instant Ink program allows customers to subscribe to a monthly service that enables the customer to print a fixed number of pages through their printer. A sensor is installed in the printer to detect when the printer will run out of ink and HP will mail the customer with an ink cartridge before the printer runs out of Ink. The monthly charge is inclusive of the ink cartridge, shipping and recycling of ink cartridges.
Pay by flight hours service by a jet engine supplier
Customers benefit from lower downtime and don’t have to pay any upfront cost to buy the equipment. Rolls Royce introduced “TotalCare”, a suite of predictive maintenance and repair services for its jet engines. Customer pays Rolls Royce based on the number of flight hours the engine is used for and Rolls Royce takes the responsibility to maintain and improve the durability of its engines.
Remote monitoring service by a turbine manufacturer
Customers enjoy greater flexibility with access to services provided by experts while saving downtime and maintenance costs. General Electric (GE) has opened facilities around the world to provide real-time monitoring and diagnostic services for its global base of gas turbines and compressors. A combination of sensors and control devices capture data about the performance of the equipment which is transmitted to these facilities where maintenance and repair needs are monitored and scheduled.
Mobility as a Service by an auto maker
Addresses customer’s logistics problems and provides them with easier access to the vendor’s offering. Daimler AG, the German multinational car manufacturer launched Car2Go, a car sharing program which allows customers to locate and use vehicles provided by Daimler for their journeys. The customer is charged per minute for the use of the vehicle while all fuel and maintenance charges are borne by the vendor.

Regional Industry Focus
Internet of Things & Smart Cities
Page 6
IoT Market Opportunity
Gartner forecasts installed base of 25 billion connected things in 2020 compared to 4.9 billion in 2015, representing 33% CAGR. This excludes smartphones and PCs, but includes dedicated objects, such as vending machines, jet engines, connected soap dispensers etc. In terms of annual shipments, Gartner forecasts 1.6 billion connected things in 2015, rising to 8.3 billion in just five years in 2020. The highest volume shipments are expected to come from connected LED interior light bulbs followed by smart TVs and automotive infotainment systems. By 2020, over 80% of IoT supplier revenue will be from services The incremental cost of hardware and software is relatively small while the services opportunity (including data analytics) is much larger. Gartner forecasts IoT will support total services spending of US$69.5 billion in 2015 rising to US$263 billion by 2020 at 23% CAGR.
IoT connectivity opportunity (part of service revenue) will be relatively small At US$32 billion in 2020, the opportunity for IoT connectivity services is just 12.3% of total IoT service opportunity. As the revenue base of telecom service providers’ fixed and mobile revenue is large, it will translate to <3% of their total revenue according to Gartner. Very few IoT connections may go through the SIM-based cellular networks and most of the devices will be connected over free networks such as Wi-Fi and Bluetooth, ZigBee etc provided by IT companies and engineering teams of customer organizations. Telcos are expected to charge only US$1-3 for each cellular connection, which is much lower than smart phone connections. Connected cars, smart electric meters, remote patient monitoring and outdoor security cameras will be top applications for telcos.
Gartner IoT related service revenue forecast
Source: Gartner (Dec 2014)

Regional Industry Focus
Internet of Things & Smart Cities
Page 7
IoT solutions opportunity (part of service revenue) will be significant At a size of US$231 billion in 2020, the IoT solutions opportunity will be much bigger than connectivity. However, this will require IoT players to provide (i) industry specific solutions to enterprises helping them either launch a new service or reduce cost. (ii) Services such as security, health monitoring services etc to consumers and charge a monthly fee. Enterprises to account for over 75% of spending on IoT services Gartner forecasts consumer services to account for 24.7% of IoT service revenue in 2020 with enterprises accounting for the bulk. Enterprises will be big adopters of IoT so that they (1) sell new services to their customers (both enterprises and consumers) (2) lower their costs by reducing downtime of their equipments and supply chain costs. IoT adopters to reap 6-7x more benefits than IoT suppliers. Gartner forecasts that IoT will produce close to US$1.9 trillion of economic value-add in 2020. Economic value-add for a sector is essentially the sales in that sector minus inputs and supplies from other industries.
For example, manufacturing sales minus the cost of raw materials and energy will be the economic value- add for the manufacturing sector. IoT will also facilitate new business models, such as usage-based insurance calculated based on real-time driving data. The banking and securities industry will continue to innovate around mobile and micro-payment technology. IoT will also support a large range of health and fitness devices and services, combined with medical advances, leading to significant benefit to the healthcare sector. Emerging connected sensor technology will lead to value creation in diverse areas such as utilities, transportation and agriculture. Most industries will also benefit from the generic technologies, in that their facilities will operate more efficiently through the use of smart building technology such as connected LEDs and heating, ventilation and air-conditioning (HVAC) systems. McKinsey Global Institute has even higher projections. McKinsey predicted in 2013 that IoT would improve global productivity by between US$2.7 trillion and US$6.2 trillion annually between 2013 and 2025. McKinsey believes 80% to 100% of all manufacturers will be using IoT applications in 10 years.
Economic Value-Add by Industry Sectors in 2020
Source: Gartner (Dec 2014)

Regional Industry Focus
Internet of Things & Smart Cities
Page 8
IoT Value Chain
Source: Arthur D Little Smart Module – Smart modules combine the radio, sensor and microcontroller, integrate it with storage, and make it “insertable” into a device. Radio/communications chips provide the underlying connectivity, sensors provide much of the data gathering, micro-controllers provide the processing of that data. Intel and Qualcomm are leading chip makers for microcontrollers and radios respectively. Leading sensor manufacturers are companies such as InvenSense, STMicroelectronics, Bosch, NXP, Freescale etc. Smart Object – The smart object is the product – a refrigerator, a vending machine, a car, etc. – that its manufacturer has designed to be able to connect to others via its smart module and a network. Network Operator - The network operator enables and manages fixed or wireless communication with a smart object using cellular or non-cellular technologies such as Wi-Fi, or smart objects can be connected with each other via Bluetooth, ZigBee etc without the operator. Service enabler or Platform provider – The platform provides the underlying management and billing capabilities to IoT (such as Android OS to mobile). It also manages the multitude of partners that offer third party applications that run on the platform (e.g. for vehicle tracking), in a way that is similar to how an app store is managed. Apple, Google, Intel, Qualcomm, IBM, Amazon, HP, SAP etc are vying to be platform providers as this part captures the maximum value in the value chain.
IoT platform at the centre of the value chain There are multiple players trying to promote their platforms to attract more developers to come out with new innovative solutions. 1) Smart Home - Apple’s HomeKit, Google’s Brillo,
GE Wink, Smarthings etc.
2) Smart Healthcare - Apple’s HomeKit, Google Fit, Samsung SAMI, Human API etc.
3) Smart Car - Apple’s Carplay, Google’s Android Auto, Microsoft’s Windows in the Car, Ford’s Applink etc.
Sectors like utilities (smart metering), industrial applications and smart cities present attractive business opportunities despite the lack of standardised IoT platforms. These applications focus mostly on solving well-understood needs for known customers. As such, a universal platform supporting innovative services is not essential to provide smart city services as long as various government agencies in a city/country use a single platform. System Integrator –The smart object has to be integrated with the platform and its relevant applications. In most cases today, this integration is cloud-based, meaning that a chosen application platform will support the integration through standardised application programming interfaces (APIs) as a consequence. All large system integrators, such as Ericsson and IBM, are entering this territory, which used to be dominated by smaller regional players.

Regional Industry Focus
Internet of Things & Smart Cities
Page 9
Service Providers – They brings together the hardware, the connectivity and the platform to provide end-to-end solutions to different verticals. Most importantly,
they take care of bundling the solutions, setting the tariffs, billing and customer care.
Some of the popular categories by Shipments in 2020
Source: Gartner (Dec 2014) Connected LED lights, smart TVs, auto infotainment, smart meters and thermostats will be top IoT products. Gartner forecasts that the highest volume will come from connected LED interior light bulbs for business applications in 2020 followed by smart TVs and automotive infotainment with increased availability of online on-demand content.
Smaller-volume consumer items such as networked thermostats, which enable analytics-based advice for energy-saving programs as well as remote controls would also be highly in demand.

Regional Industry Focus
Internet of Things & Smart Cities
Page 10
South Korea and Singapore are expected to be among Top 5 global markets to adopt IoT
*Bubble size represents 2020 GDP size Source: AT Kearney IoT Spending in Asia Pacific Frost & Sullivan estimates that total spending on IoT in the Asia Pacific was US$10 billion in 2014, which will grow at a CAGR of 34.1% to reach US$59 billion by 2020. Asia Pacific is characterised by a large presence of manufacturing economies which is expected to drive spending on IoT applications in telematics and supply chain visibility. IoT spending in the manufacturing industry is expected to be one of the fastest growing markets in Asia Pacific, growing at a rapid CAGR of 52.7% between 2014 and 2020. Adoption of IoT is not without its challenges, as there are several hurdles that could prevent it from achieving rapid growth. Security and information privacy are some of the largest hurdles to the adoption of IoT. With smart and connected devices embedded in business processes and tied to critical functions, the ability to negatively affect enterprises and individuals is increased significantly.
IoT Adoption in Asia Pacific Gartner’s survey found APAC companies more aggressive in IoT adoption. According to a Gartner Survey, APAC respondents generally expect IoT to have a greater long-term impact on their organisations than respondents in other regions. We believe this attitude is partly because some Asian organisations tend to conduct very long-term strategic planning and partly because some of the respondents may come from smaller and more agile organisations. North America lags in terms of IoT impact. This may partly be a consequence of some respondents coming from larger and less agile organisations. Forrester survey puts Asia Pacific ahead in IoT adoption. Below are the findings of a recent global study done by Forrester Consulting on IoT implementation in various enterprises. In Asia Pacific, 58% of enterprises are either implementing or planning to implement IoT over the next 24-months versus only 45% globally.

Regional Industry Focus
Internet of Things & Smart Cities
Page 11
Expected Long-Term Impact of IoT by Region
Source: Gartner (Feb 2015) IDC survey also puts Asia Pacific as a leader in IoT adoption. Market research firm IDC shared the results of its survey of 2350 IT and business decision makers in (mostly) large and medium-size enterprises worldwide in 2015. According to the survey results, enterprises in Asia Pacific are leaders in IoT adoption. B2B is considered by survey participants as the
area where IoT will grow, a reversal from last year where a majority of survey participants thought that consumer IoT is where the action will be.
Shift in the location of processing the data: More
survey participants this year will process the data generated by IoT sensors at the ”edge” rather
than in the data center, a reversal from last year’s survey.
Top drivers for creating an IoT strategy: Increased
productivity (14.2%), time to market (11.8%), and process automation (10.1%). Top challenges for the IoT: Security, upfront costs, ongoing costs.
IoT is anyone’s game in 2016: Hardware and
networking vendors have lost ground in their perception as “leaders,” while software vendors, analytics vendors, and device/component vendors have gained in terms of market awareness/ perception.
IDC survey on IoT
Source: IDC

Regional Industry Focus
Internet of Things & Smart Cities
Page 12
Short- and Long-Term Impact by Industry – Impact will be higher on Utilities, Transportation, Retail and Manufacturing sectors over the next 3 years
Source: Gartner (February 2015) According to Gartner’s survey, respondents expect the utility sector, followed by transportation, services, manufacturing and retail to be impacted the most by IoT in the short term (<3 years). In the long term (>5 years), they expect the highest impact to remain on utilities, followed by retail and manufacturing.
Surprisingly, respondents do not see much potential in transport and services in the long term despite good short term potential. This could be explained by the fact that these industries have already invested in tracing and telemetry services.

Regional Industry Focus
Internet of Things & Smart Cities
Page 13
IT Spending Breakdown IT spending by Sector, worldwide, 2013-2019
Spending (Billions of Dollars)
2013
2014
2015
2016
2017
2018
2019
CAGR (%) 2014-2019
Data Center Systems 164 168 169 172 174 176 177 1.1
Software 297 314 312 332 353 375 400 4.9
Devices 677 694 658 659 665 673 681 -0.4
IT Services 937 955 919 955 996 1,039 1,087 2.6
Communications Services 1,605 1,606 1,495 1,499 1,527 1,551 1,572 -0.4
Overall IT 3,680 3,736 3,555 3,616 3,714 3,815 3,917 1.0
Growth (%)
Data Center Systems - 2.6 0.9 1.5 1.2 1.2 0.8 -
Software - 5.7 -0.7 6.2 6.4 6.4 6.5 -
Devices - 2.5 -5.1 0.1 1.0 1.1 1.2 -
IT Services - 1.9 -3.7 3.9 4.2 4.4 4.6 -
Communications Services - 0.1 -6.9 0.2 1.9 1.6 1.3 -
Overall IT Growth - 1.5 -4.9 1.7 2.7 2.7 2.7 -
Source: Gartner (Oct 2015) Enterprise software is the fastest growing segment. Gartner expects key applications such as digital commence, marketing and sales software to be the key drivers. We believe that cloud services and data analytics are two key reasons for enterprises to spend more. Traditional on-premise application providers are being disrupted by cloud service providers. Meanwhile, increasing unstructured data and rising adoption of big data analytics is another key driver. IT services is the second fastest growing segment. Many of the developed markets are shifting toward next-gen social, mobility, analytics and cloud (SMAC) solutions. IT outsourcing demand especially in Europe is expected to increase over the next several years in order to cut costs. Moderate growth in data centre systems. The stagnating servers and storage market due to disruptive technologies, such as cloud computing and software defined storage, will lead to moderate growth in data center systems.
Network refreshes will fuel demand for network equipment. We believe that network equipment companies are better prepared to handle transition to cloud. Devices sales are likely to decline. PC and tablet market continues to weaken with spending declining by 9.6% in 2015. On the mobile phones, Apple’s high end phones continue to do well while Android growth is slowing due to lower replacement activity from higher life of smartphones. Communication services sales may decline as well. The abolition of roaming charges in the EU (due to regulation) and the elimination of roaming charges in parts of North America (due to competition) are key concerns. This could be partially offset by communication providers seeking additional revenue from IoT connectivity and value based pricing.

Regional Industry Focus
Internet of Things & Smart Cities
Page 14
Singapore’s Smart Nation Project Singapore’s Smart Nation Programme will harness IT, networks and data to raise standards of living, productivity and responsiveness to people’s needs and aspirations. Smart Nation will rely on IoT and big data. Singapore’s small size will help in standardisation. Many would consider Singapore’s small size a disadvantage in some areas but it gives Singapore an edge in the implementation of the Smart Nation. Most smart city projects around the world are led by their pro-active mayors or governors who may have little control over national policies. These projects may be constrained by certain laws that affect the whole nation. For example, Federal and State legislation may not allow for the smooth transition of some American cities into becoming smart cities. As such, many smart city projects are going for piecemeal solutions only such as street lighting or waste management. In Singapore, the fact that this program is led by the national government means that legislations can be amended and various public agencies are strongly motivated to make it a success. This enables Singapore to lead the standardisation efforts for Smart City. An Internet of Things (IoT) Standards Outline in support of Singapore's Smart Nation initiative has been laid out and announced in Aug 2015 The IoT Standards Outline focuses on three types of standards, namely sensor network standards, IoT foundational standards and domain-specific standards. Standards will play a critical role to create an environment where government agencies, planners, developers, manufacturers come together to develop new technologies and smart solutions efficiently. Smart Nation Infrastructure HetNet is a key component of Smart Nation. The government is keen to promote Heterogeneous Network (HetNet) technology for Smart Nation. HetNet network services will be maintained by switching between different types of networks such as Wi-Fi and 4G and 3G. It is meant to mitigate capacity crunch, optimise overall network capacity to improve quality of service, facilitate intra-operator roaming that would improve network resiliency.
Smart Nation Infrastructure
Source: DBS Bank
Singapore’s unique focus on HetNet. We see at least two key reasons for this. Firstly, Singapore often sees extremely high data usage in certain pockets of the city such as in MRT stations and popular shopping malls. HetNet deploying Wi-Fi for small cells and 4G for macro cells is a relatively more economical solution than only deploying 4G due to cheaper cost of Wi-Fi equipment. Also, Wi-Fi uses an unlicensed spectrum of around 2.4 GHz band, thus making it more spectrum efficient. HetNet will be able to provide better user experience. Secondly, HetNet could also be a better solution than public Wi-Fi networks alone in the monitoring of various services especially when people are mobile. For example, when one leaves home to catch public transport, everything can be monitored by operators using HetNet.
All Singapore telcos are trialling HetNet in Jurong. In fact, we do not think there is a business case for the fourth telco without deploying HetNet as the new entrant will only be able to secure 5-15% market share at best in the long term. A conventional mobile network may require up to S$1bn for a nationwide network while a HetNet may only need one-third of the capex based on our understanding. The new telco could quickly achieve nationwide 4G coverage using 900MHz spectrum on a small user base initially. As and when the number of users rise in a given macro cell, it may deploy more small cells of Wi-Fi or LTE in a cost efficient manner.

Regional Industry Focus
Internet of Things & Smart Cities
Page 15
Besides, there are other parts as shown below (i) New Fiber network called IP Core to add network resilience and secure public data during transmission; (ii) Above
the Ground (AG) boxes for powering and connecting to sensors in public spaces; and (iii) Data centre for the collection of public data.
Smart Nation Services
Source: DBS Bank
There are currently 5 main areas of focus. These are Smart Health-Assist, Smart Logistics/Mobility, Smart HDB Town Framework and Smart Tech Challenges. The government's annual projected healthcare spending is expected to reach S$12 billion by 2020, up from an estimated S$8bn in 2015. Smart Health-Assist The Challenge - Limited Healthcare Infrastructure. Hospitals are already operating at close to full capacity in Singapore. Along with medical tourists coming for
better treatment, Singapore is also facing a rapidly ageing population which will squeeze Singapore’s healthcare capacity. It is estimated that by 2030, there will be 900,000 elderly citizens in Singapore which represents a 1 in 5 ratio, increasing the emphasis of the importance of Singapore’s healthcare system. The Pioneer Generation Package is for 450,000 Singaporeans. In contrast, there are c.1m Singaporeans between the ages of 45 and 64, who will reach retirement age in 10 to 20 years.
The challenge of Ageing population in Singapore
Source: Smart Nation-Forbes

Regional Industry Focus
Internet of Things & Smart Cities
Page 16
Singapore would use telehealth to tackle its own healthcare challenges. National University Hospital is undertaking a trial to see if remote healthcare is viable. In this trial, patients are monitored at home with smart devices so that arlier intervention can be provided if need be in order to reduce the number of visits to hospital. From the perspective of the consumer/patient, they will be able to manage their medical conditions especially chronic diseases such as cardiovascular, diabetes, respiratory diseases whilst in the comfort of their own homes. Any deterioration of a patient’s health can be detected faster than if the patient was left to their own devices to visit a medical professional. Another use for the sensors would be the development of Smart Elderly Alert Systems for the monitoring of elderly relatives to keep them safe. Sensors placed in the flat can help to monitor the movements of the elderly, and caregivers will be alerted should irregular movements be detected. This in turn would reduce traffic in hospitals’ emergency departments or inpatient admissions by early intervention by the healthcare provider. This would also mean that healthcare staff can be more efficiently allocated. There are 3 key areas (not including infrastructure) that still require development, namely next generation sensors, decision support systems and big data analytics. Development of Next Generation Sensors. Currently, most commercially available healthcare sensors are often intrusive and cumbersome when a patient needs constant monitoring. Sensors are also not refined and may set off false alarms. This opens an opportunity to develop solutions to these problems, for example, heart rate and blood pressure monitors that come in stick-on patches, digital wrist watches or sensors embedded in items such as pillows. Decision Support Systems. Decision Support Systems (DSS) are meant to help healthcare professionals diagnose and recommend the right treatments and care plans for patients. This increases the consistency of treatments of evidence-cased care and the monitoring of key clinical and service outcomes. For example, if a medical professional comes across a rare case that he or she has not seen before, they are able to access a database of all the past medical cases to ensure that their diagnosis is correct.
Big Data Analytics. The data collected by the sensors will be stored in national health data bases which would allow medical professionals to gather new insights into disease patterns and contribute to further medical research. In Chicago, there is a group called the Health Data Liberation Meetup Group that is devoted to helping providers, insurers, and institutions to adopt open data practices in the field of healthcare. Smart Transport The Challenge is Limited Space for Roads. With a population of 5.4 million and approximately one million cars on the roads, the number of vehicles that Singapore can have is severely limited. At the same time, roads take up 12% of land space suggesting that we cannot increase its operating capacity. In response to this, the LTA has come up with ideas that make use of ICT solutions. Challenge in Transport Sector in Singapore
Source: Smart Nation-Forbes Smart Traffic Congestion Management. The government plans to replace the current ERP system with one that uses satellite position technology by 2020. This would get rid of those structures that are a negative externality to many people’s eyes and clear up space for other things. Using Global Positioning System (GPS), motorists may have to pay based on the distance travelled in a congested zone rather than paying a flat fee. It could also replace a whole range of things from replacing parking coupons to paying for tolls at checkpoints. It would also allow motorists to obtain real-time traffic information on an interactive computer installed in vehicles, in place of the existing in-vehicle unit. The system should ideally be able to

Regional Industry Focus
Internet of Things & Smart Cities
Page 17
learn a motorist’s regular route and calculate how much he could expect to pay that day. It should also be able to suggest alternative routes with different prices and journey times. There is a possibility that motorists could pay ERP charges at the end of a month, after the distance clocked has been compiled. A range of payment options will be available, from upfront payment through Contactless e-Purse Application (CEPAS)-compliant stored value cards to backend payment using credit and debit cards, a virtual payment account and GIRO. Monthly subscription fees for all transportation needs? Whether you travel by bus, train or cab, the Mobility-as-a-Service (MaaS) mobile app may allow you to pay a one-off, monthly subscription fee to get around Singapore. Adding the fact that you will be able to get the app to plan a trip for you — all you need to do is enter your starting point and destination — and MaaS could just be the next efficient, one-stop platform for our transportation needs. Details are scant, but according to IDA, this integrated model will allow commuters to get around at a lower cost. Another huge advantage is its efficiency; there is no risk that one’s ez-link card is running out of money, or having to rush to top up the card when one is running late for work. Autonomous Vehicles in Sentosa. In April 2015, IDA revealed that it will be working with the Sentosa Development Corporation. Driverless cars will ferry visitors around the island, drones will roam to check for litter, and self-driving lawnmowers will maintain the landscape. Ministry of Transport, Sentosa Development Corporation and ST Engineering have signed MOUs to conduct tests for a fleet of “on-demand self-driving shuttles”, which will complement the island’s existing bus, tram and monorail network. These driverless shuttles will allow guests to travel around the island by calling for them via smartphones or information kiosks. The public trials for this will take place after 2018, once an engineering study determining the technical requirements for seamless navigation is completed Smart Logistics Two key challenges today. Present day track and trace technologies are often used by large organisations for premium cargo but many of them lack near time information. Also verifications are also very disjointed
with the change of custody across different service providers with as many as 25 parties required to process one export shipment, with each using different standards. Smart logistics will be a centralised platform. This platform will allow different players - cargo owners, freight forwarders and ground handlers - to leverage upon sensory networks in airports and seaports to track and manage their cargo in near real time. The government will fund the building of the infrastructure and allow small players to access it at an affordable price. According to IDA, smaller players in particular, will benefit from this more affordable system that will enable timely response to unforeseen events, automate labor intensive processes and reduce inventory. TradeNet, the e-government platform for the local trade and logistics industry launched 25 years ago, will be undergoing a facelift. There is a plan to combine the backend systems of TradeNet, TradeXchange and Customs into one system, tentatively to be named National Trade Infrastructure, once the current contract expires in 2017. The government hopes that this keystone project will boost Singapore's productivity and competitiveness through a digitalised, integrated supply chain. A tender for this project had been called and bids are now being evaluated. Ningbo City in China, for example, has developed a Smart Logistics Center to streamline the port’s entire supply chain and allows 5,000 logistics companies in Ningbo to share data. Using this cloud platform, logistics companies and their clients can work together to respond to changing demands to better decide what to produce and when and where to ship it. Every shipping vehicle has a GPS tracker now and the idling of trucks has decreased significantly by up to 80% in some cases. Smart HDB Town Framework The Smart HDB Town Framework maps out the introduction of smart technologies in HDB towns and estates by focusing on four key areas: Smart Planning, Smart Environment, Smart Estate and Smart Living Smart Planning. It refers to the use of computer simulations and data analytics to enable HDB to effectively plan and design its estates. For example, when assessing the effectiveness of various initiatives (e.g. LED lighting, solar energy, vertical greenery, rainwater harvesting, recycling, pneumatic waste collection), and making a decision on the best

Regional Industry Focus
Internet of Things & Smart Cities
Page 18
combination to achieve sustainability goals in a cost effective way. Each car park will also have an intelligent parking demand monitoring system that will automatically increase the number of available lots during non-peak hours for visitors, as residents with season parking tickets are out, and reduce the number of available lots for short-term parking visitors in the evening, to ensure sufficient lots are reserved for residents with season parking tickets returning home. Smart Environment. Estates will be linked with a network of sensors to create a Smart Environment. These sensors will capture real-time information on environmental factors such as temperature and humidity. Innovative solutions can then be found to create a more pleasant environment for residents. For example, fans in common areas can be triggered when certain thresholds of temperature and humidity are reached. The fan speed can be regulated to improve the thermal comfort level for residents, while reducing energy consumption. Smart Estate. Data will be analysed by Smart technologies to optimise maintenance cycles and pre-empt problems. This will allow us to better understand the usage patterns of common amenities so as to easily check and identify problems to resolve them. For example, lighting fitted with sensors can help HDB to understand human traffic patterns and optimise the provision of lighting. The lighting in common areas with little or no human traffic detected could be reduced to 30%, hence reducing energy usage. Another example would be the installation of a Smart Pneumatic Waste Conveyance System. Waste disposal patterns and volumes can be monitored which will allow effective waste collection frequencies. This can help to optimise the deployment of resources needed for waste collection. Smart Living. The Smart Nation plans include using smart technology in housing estates. HDB estates are the first to try using these smart technologies to see if individuals can adapt these for day to day living. Residents will be able to tap on Smart home applications developed by commercial companies that can enhance energy savings, and enable them to access services like healthcare, in the comfort of their homes. Seventeen companies are participating in the trials, including the likes of Samsung, LG Electronics and StarHub. For example, HDB, together with the Energy Market Authority (EMA) and Panasonic, are exploring a suite of different energy choices and solutions for households. Residents can also monitor their energy consumption patterns, and manage their home appliances anywhere, in real time.
Smart Tech Challenges The Smart Nation Tech Challenge is meant to encourage individuals and businesses to join the government and use new technologies to solve problems that we face in an urban environment. The Smart Nation Tech Challenges are very much a government-led initiative. Other smart cities such as Amsterdam and New York have citizen-led initiatives that allow anyone to convert an idea into a feasible project. Although there is no clear direction, there is a lot of citizen engagement Video Analytics Smart Nation Tech challenge. Video analytics is the analysing of video streams and footages taken by surveillance systems and translating these into data that the government or another type of organisation could use. It could potentially boost public safety and improve resource utilisation when video analytics software senses that something is amiss, or improve services in areas such as transportation, healthcare, retail and security through relevant data gained. The challenge is thus to build up industry technical capabilities in video analytics (i.e. accuracy and availability of algorithms) and to create solutions to video analytic problems so as to generate greater value from cameras. The evaluation, validation and announcement of winners for the challenge is expected to be announced in January 2016. There are three main benefits to the advancement of video analytics technology, namely public safety, manpower utilisation and situational awareness.

Regional Industry Focus
Internet of Things & Smart Cities
Page 19
China – Smart Cities IoT is one of priority projects of China’s 12th Five-Year Development Plan (2011- 2015). In February 2012, China’s Ministry of Industry and Information Technology (MIIT) released the national 12th five year plan which put forward the objectives, investments and roadmap for China’s IoT market. According to China’s R&D Center for Internet of Things (CIT-China), the Chinese government is expected to invest c. RMB 3.8t (US$ 610b) in developing a M2M ecosystem within the decade ending 2020. China’s central government has selected over 200 cities to pilot smart city projects. These cities include Beijing, Shanghai, Guangzhou and Hangzhou beside others. Over 90% of China’s provinces and municipalities have listed IoT as a pillar industry in their development plans, For example In Zhenjiang, Jiangsu province, high-speed 4G networks have become standard in buses, trains and the city’s app broadcasts bus arrival times. Zhenjiang states that over 500,000 commuters now utilize these features daily saving 6,700 tons of carbon dioxide and US$ 2.7m in fuel costs annually by more closely tracking real-time bus routes. China Smart City Technology market to boom
Source: Navigant Research
Tai Lake in Wuxi City is using IoT technologies to monitor and predict the Cyanobacteria outbreak and protect the water supply to the city. China Smart City Industry Alliance, an association sponsored by MIIT predicts that smart city related industries will grow at a compound annual growth rate of 18% over the next 15 years from 2014 and IDC predicts that urban construction investments associated with smart cities in China will reach RMB 2t (over US$ 300b) over the decade ending 2025. In smart city initiatives rolling out smart grids, establishing smart traffic management systems, video analytics and surveillance and smart governments are key areas of focus. Big spending on smart meters and grids. China’s biggest power distributer, China State Grid Corp., has spent about RMB 400b (US$ 6b) last two years on its electricity networks and plans to invest over RMB 420b (US$ 6.8b) in 2015. Growing electricity demand due to urbanization, the nation’s pledge to generate 20% of its energy requirements by 2020 from renewable sources and increasing demand for electric vehicles is expected to drive demand for smart grids. McKinsey estimates that China’s urban population will grow to 840m by 2020 and over 5m electric vehicles to be on the roads by 2020. By 2013 China had deployed over 250m smart meters. A recent report by the WorldWatch institute states that the Chinese government is planning to have smart meters installed in 95% of China’s households by 2017. As such, over 435m smart meters are expected to be deployed by 2017.

Regional Industry Focus
Internet of Things & Smart Cities
Page 20
Companies Exposed to IoT 1. ST Engineering is likely to secure a couple of
billion dollars worth of Smart Nation projects over the next 3-5 years in our view.
The company has already secured 7 out of 15 pilot projects in Jurong Lake district for the Smart Nation project. 1) Smart Traffic management system 2) Location information in urban environment 3) Estate energy management system 4) Smart Outdoor lighting 5) Smoke Detection 6) Smart Walk 7) Smart Phone as sensor Smart Traffic management system could be worth S$1bn –S$2bn on our estimate. This system would get rid of those structures that are a negative externality in many people’s eyes, and clear up space for other things. Using Global Positioning system (GPS), which is ubiquitous, motorists could end up paying based on the distance travelled in a congested zone rather than paying a flat fee. The new system could also obtain real-time traffic information on an interactive computer installed in vehicles, in place of the existing in-vehicle unit. There are over 1 million vehicles in Singapore and about 100K of them are replaced each year. If the new in-vehicle were to cost S$100-200 per vehicle, we estimate this could translate to S$1bn-2bn worth of sales initially, followed by S$100m worth of sales each year. While Singapore government has not disclosed its budget for Smart Nation, we think these seven projects could be worth couple of billion dollars over the next 3-5 years. ST Electronics offers various enterprise solutions. ST Electronics offers solutions like waste management, Smart Grid, Automated Metering Infrastructure (AMI), Smart Building, Smart Lighting, elder care, emergency response system etc which demonstrates the software capabilities of ST Electronics.
2. Keppel DC REIT offers investors exposure into the highly specialised and resilient data centre market.
With close to 70% of NPI derived from co-location leases, the Trust is poised to ride on rising global usage of data and demand for data centres. Earnings are further supported by its master leased properties (30% of NPI) which have average annual escalations of 2-4%. Visible earnings growth profile underpinned by acquisition potential. With foreign sourced distributions fully hedged until 1H17, and 90% of borrowings hedged into fixed rate debt, Keppel DC REIT stands out for its stable and highly visible earnings profile. Earnings catalyst will come from the acquisition of T27, which we believe could occur in 1H16. While an acquisition of >S$250m is expected to trigger an equity fund raising exercise, we believe the acquisition will be accretive to earnings given that the stock is trading at a low implied cap rate of 6.3%. Imputed S$250m of acquisitions into FY16 numbers. We have assumed S$250m of acquisitions in FY16 to account for the purchase of T27; we have assumed the equity fundraising will bring gearing down to 30%, which is the Manager’s long-term target level 3. ZTE will benefit from Chinese telco’s 4G capex in
2015, capacity expansion in 2016 and growth in enterprise and government solutions in the long term.
Rising participation from government and enterprise businesses is supportive of margins. ZTE’s service/software revenue increased 36.1% y-o-y in 1H15 (16% of sales) on smart city project wins. ZTE is well positioned with its total solution capabilities (hardware, software, wireless transmission, integration operation, etc). ZTE has signed contracts with government agencies and enterprises in more than 140 cities in 40 countries (~100 in China), which should help support growth in 2H15 and beyond. The company is already working with Tencent on a number of smart city projects whereby ZTE focuses on systems and infrastructure, and Tencent on terminal services to customers. ZTE estimates that the Smart City market is worth c.RMB100 billion (~US$16 billion).
Regional Industry Focus
Internet of Things & Smart Cities
Page 21
Networking equipment business is near term driver. Networking equipment sales grew 30.6% y-o-y in 1H15 (62% of sales) on strong growth in 4G base stations. With tower sharing in the process, we see a shift in spending by telcos from infrastructure (tower construction) to base stations and optical broadband networks. While 4G capex is likely to see some decline in China in FY16F, we expect ZTE to register stable networking equipment business < in FY16F from growth in overseas business (~40% of networking equipment business). Handset business is undergoing restructuring. Handset revenues decreased 4.3% y-o-y (22% of sales) on weaker end-demand, especially in China. ZTE is shifting its focus to the high-end market and the overseas market, while restructuring its domestic business. While domestic handset business is declining, the overseas market delivered strong growth in 1H15, as ZTE is now the fourth largest smartphone brand in the US and the second largest in the US prepaid market. Almost half of total sales are ex-China. International operating revenue rose 16.8% y-o-y to RMB21.5bn in 1H15 (47% of sales). This was on the back of its strategy of focusing on populous nations and mainstream global carriers. Higher R&D spending to enter higher-margin sectors. With R&D spending-to-total revenue increasing to 12% in FY15 from 9.5% previously, ZTE is able to enter several high margin industries including video conferencing solutions and high-end core routers in the enterprise sector. According to management, ZTE's self-developed chips and operating systems differentiates the company from its peers and it has provided network services to various local governments and enterprise in China. ZTE offers various enterprise solutions like Smart Grid, Smart Traffic management systems etc. For example, the Yinchuan smart government system by ZTE enables one-stop approval of 432 business processes of government departments. It shortens the approval period by 78% and reduces the enterprise registration period from five days to one day.
4. Wasion will benefit from State Grid’s plan to automate distribution and use automated meter reading and analytics
Wasion is a leading energy measurement system and service supplier in China. It has three main segments - Advanced Metering Infrastructure (AMI) for automated meter reading and analytics, Advanced Distribution Operations (ADO) for smart distribution and Smart Meters (SM) Higher margin businesses registering strong growth. AMI revenue grew 14.9% y-o-y in 1H15, (51.8% of sales), ADO revenue grew 70.6% (12.2% of sales) while Smart Meter (SM) revenue 9.0% (36.0% of sales). Wasion is in a transition phase, moving from the lower-margin SM business to higher-margin AMI and ADO businesses. Benefits from State Grid’s investment plan. State Grid will construct 50 new ADO substations. Distribution automation at cities will increase from 30% to 50%. Investments in the construction and upgrade of the smart grid will amount to >RMB80bn. As such, ADO sales are expected to more than double in FY15. Smart meter business remains solid. We estimate that the penetration rate of smart meters would reach 76% by 2015, compared with 80% as stated in the 12th Five Year Plan. Thus, installation will be accelerated. We expect State Grid’s tender size to remain stable at 80-90m units in 2015, compared with 91.7m units in 2014. Strong growth in international markets. Wasion has won a US$12.3m AMI contract in Tanzania, RMB68m and RMB10m AMI contracts in Mexico and Brazil respectively through its strategic partnership with Siemens. Overseas business comprised only 4% of sales in 2014, and is likely to rise to 9% of sales in 2015 on our estimate.

Regional Industry Focus
Internet of Things & Smart Cities
Page 22
5. Kingdee will benefit from double-digit growth of Enterprise Resource Planning (ERP) solutions in China
Continued upside for business software in China. Enterprise Resource Planning (ERP) market in China is projected to grow to USD1.6b in 2018 at a five-year CAGR of 11%, according to Gartner. As the SME market is extremely underpenetrated and as inflation and higher labor costs are pushing Chinese SMEs to enhance their operating efficiencies, SME software market in China will continue to see solid growth. This is also supported by more ERP applications for e-commerce activities in China. Kingdee is the second largest Chinese provider of ERP software in China with a focus on SMEs. JD.com invested HK$1.3bn for a 10% stake in Kingdee at a purchase price of HK$4.6 per share on 26 May 2015. JD.com aims to promote Kingdee’s ERP products to its suppliers, which are integrated with JD.com’s supply chain system for overall inventory and logistics management Accelerating cloud and mobile applications on top of its traditional ERP products. Cloud segment remains in an investment phase and did not reach break-even till 1H15. Kingdee has been building the cloud business scale and expects it to account for 20-30% of total revenue by FY17 versus 11% in 1H15. Expect ERP revenue to resume growth as sales channel restructuring was almost completed in 1H15. Going forward, revenue growth along with operating leverage to flow through, resulting in margin expansion over the next two to three years.
Regional Industry Focus
Internet of Things & Smart Cities
Page 23
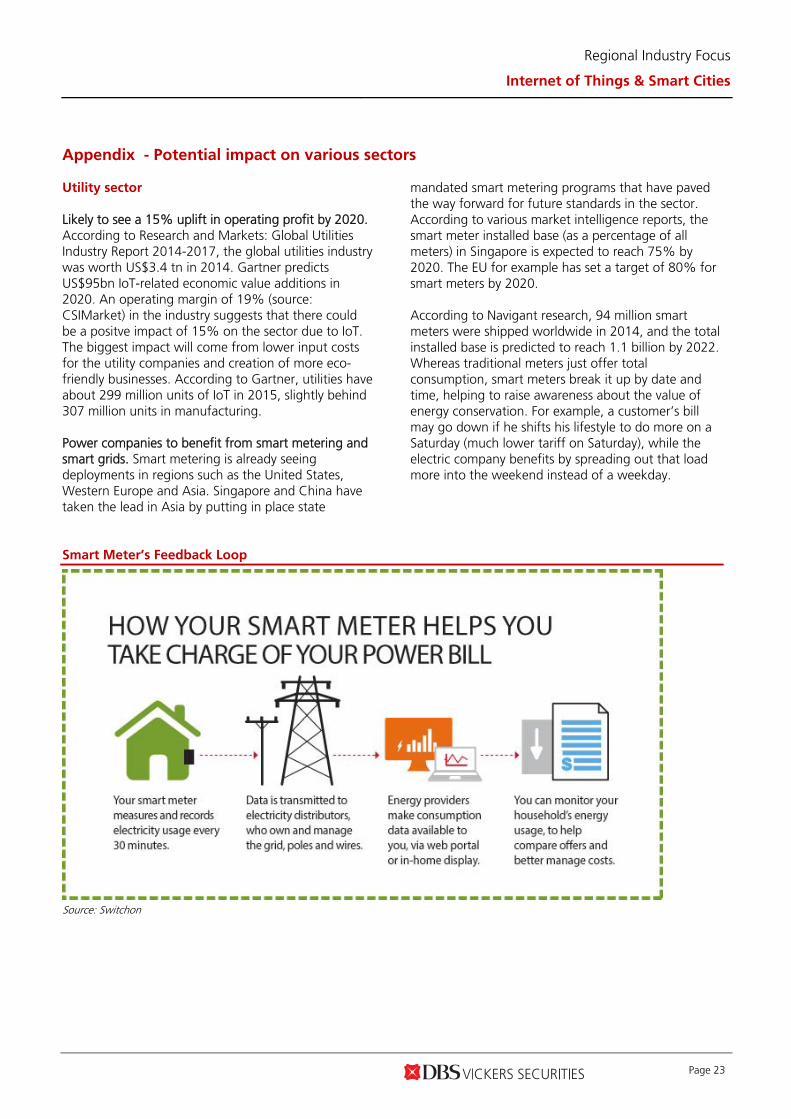
Appendix - Potential impact on various sectors Utility sector Likely to see a 15% uplift in operating profit by 2020. According to Research and Markets: Global Utilities Industry Report 2014-2017, the global utilities industry was worth US$3.4 tn in 2014. Gartner predicts US$95bn IoT-related economic value additions in 2020. An operating margin of 19% (source: CSIMarket) in the industry suggests that there could be a positve impact of 15% on the sector due to IoT. The biggest impact will come from lower input costs for the utility companies and creation of more eco-friendly businesses. According to Gartner, utilities have about 299 million units of IoT in 2015, slightly behind 307 million units in manufacturing. Power companies to benefit from smart metering and smart grids. Smart metering is already seeing deployments in regions such as the United States, Western Europe and Asia. Singapore and China have taken the lead in Asia by putting in place state
mandated smart metering programs that have paved the way forward for future standards in the sector. According to various market intelligence reports, the smart meter installed base (as a percentage of all meters) in Singapore is expected to reach 75% by 2020. The EU for example has set a target of 80% for smart meters by 2020. According to Navigant research, 94 million smart meters were shipped worldwide in 2014, and the total installed base is predicted to reach 1.1 billion by 2022. Whereas traditional meters just offer total consumption, smart meters break it up by date and time, helping to raise awareness about the value of energy conservation. For example, a customer’s bill may go down if he shifts his lifestyle to do more on a Saturday (much lower tariff on Saturday), while the electric company benefits by spreading out that load more into the weekend instead of a weekday.
Smart Meter’s Feedback Loop
Source: Switchon

Regional Industry Focus
Internet of Things & Smart Cities
Page 24
Most importantly, the data generated will used by utility companies for automated billing and optimisation of electricity generation and distribution. In addition, governments are promoting the use of renewable energy, whose generation capacity varies according to weather patterns. Utility companies can develop better predictive models using the newly available sensory data to manage loads as well as implement dynamic grid operations to support the changes in generation and usage. IoT technology is also useful in testing and implementing new technologies. For example, techniques such as distributed energy generation where households generate energy which is then distributed to their neighbours through a smart grid can be adopted. In 2013, SP PowerAssets, a subsidiary of Singapore Power which owns the electricity transmission and distribution networks of Singapore, started rolling out a smart grid platform in Singapore with the participation of Smart-meter specialist, Silver Spring Networks. Water is another area of interest. This includes areas such as smart metering (for water) to tele-managed irrigation networks and use of optimised routes for efficient garbage collections. Smart meters for water, similar to electricity, can be used to control and reduce water usage and wastage. Smart water meters are
also an integral part of smart water systems which uses real time data to better monitor water usage and detect any problems such as leakage. In Singapore, Sembcorp Industries has already joined hands with Singapore Economic Development Board, to carry out applied research and development in areas such as smart water systems and carbon capture. The venture will also be investing up to S$8m to support the commercialisation of the projects. If the projects are successful, these initiatives could be deployed in Sembcorp's global operations. The use of sensory data can optimise the use of water in irrigation activities. For example, Barcelona is already testing a tele-managed irrigation system to reduce water usage, where plants are watered depending on the moisture level of the soil. This is important for areas with limited water supply and can reduce costs relating to transporting and distributing water. The Barcelona city council estimates a savings of US$555,000, representing a 25% cut in water usage. Waste management companies to benefit from lower manpower needs. Singapore, for example, is implementing Pneumatic Waste Collection System (PWCS).
Waste management with IoT
Source: FarSite Communications

Regional Industry Focus
Internet of Things & Smart Cities
Page 25
When residents throw rubbish down their chutes, it goes to a refuse chamber on the ground floor. A sensor will be triggered when the container in the refuse chamber is full. The waste is then transported by exhaust air, through underground pipes. It travels at speeds of between 50 and 80 kilometres per hour to a centralised bin, where the rubbish is stored in sealed containers. When full, trucks will transport them to incineration plants. As for the exhaust air, it is passed through dust and odour filters. The clean air is then discharged into the atmosphere. With the process being automated, overall manpower needs are expected to be 70% lower. The Housing and Development Board (HDB) is test-bedding the system at Yuhua to determine its feasibility for existing buildings. It is also assessing residents' receptiveness, as major retrofitting works are required to install the system in existing estates. The system will be implemented in the upcoming housing estates of Tampines North (a tender was recently called in June 2015 for the design, building, operation, and maintenance of a district level PWCS here), Bidadari and Punggol Northshore. Transportation sector Likely to see 21% upside in operating profit from IoT. Gartner projects IoT to have c. US$114bn impact on the transportation segment. According to Research and Markets’s Global Transportation Services Industry 2012-2017 forecast, the size of the global transportation industry will be US$ 2.7tn by 2017. Based on operating margins of 20% in 2Q15 (source: CSIMarket), the overall impact of IoT will be around 21% at operating profit level. Cargo Owners and Freight forwarders to see lower inventory and insurance costs. These players will be able to intervene pro-actively to manage deliveries in the case of a delay or any exceptional event, using real time tracking. They will also be able to prevent loss of inventory from environmental damage by monitoring and managing temperature, humidity, exposure to light etc especially for the commodities. Routes can
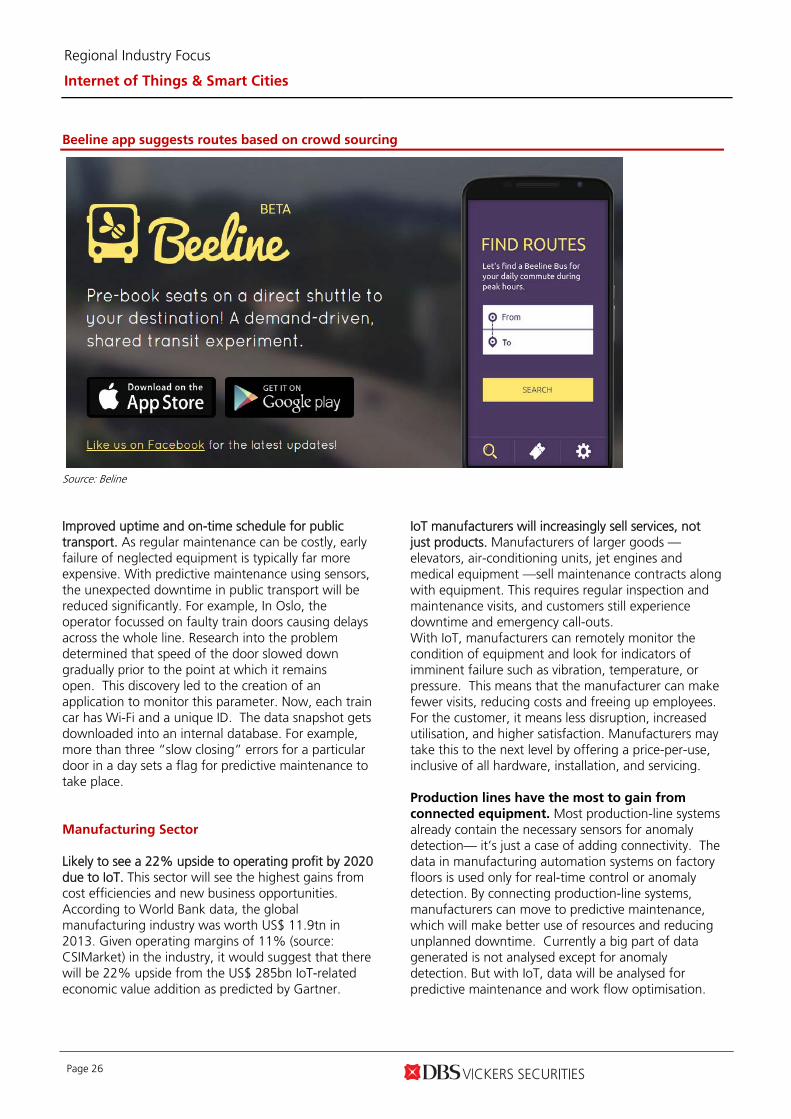
also be optimized. Through active monitoring, excess inventory along the supply chain can be minimised, which will add to profits. In addition, the data can be used to improve and optimise the logistics processes which can be lead to cost savings and reduce delays. As such, the cost of insurance for such shipments should reduce with a lower risk of shipment failure. Ground Handlers to benefit from optimisation of equipment use. By creating a tag association between cargo and ground handling equipment, ground handlers will be able to provide a full suite of real time track-and-trace capability to customers with such demands. Also, the tagging of equipment such as pallet dollies and tractors will reduce reliance on ground handlers to track equipments, translating to their optimal use. Companies such as Kerry Logistics have already stated to introduce higher levels of automation to its processes. The company introduced six fully automated and programmed robotic butlers at its PC3 flagship facility in Hong Kong to meet the ever-growing consumer demand in online shopping. Kerry Logistics is one of the first 3PLs in Asia to adopt robotic butlers in its operations to enhance fulfillment efficiency and accuracy. Usage of automation can have much bigger impact on e-commerce logistics than standard logistics services as e-commerce operations tend to be dominated by high volumes of small and irregular orders. The in-house system uses barcodes to track every item, enabling Kerry Logistics to increase service efficiency and accuracy. Increased flexibility of public transport. Another facet would be through understanding crowd behavior and patterns. The data collected by sensors in trains, busses, airplanes and transportation hubs can be used to predict the demand for transport services, which can be used to dynamically adjust availability of services. For example, Singapore launched Beeline app in April 2015, whereby bus routes are crowd sourced. People can input suggested routes at various times in the app which can be aggregated to start shuttle services.
Regional Industry Focus
Internet of Things & Smart Cities
Page 26
Beeline app suggests routes based on crowd sourcing
Source: Beline Improved uptime and on-time schedule for public transport. As regular maintenance can be costly, early failure of neglected equipment is typically far more expensive. With predictive maintenance using sensors, the unexpected downtime in public transport will be reduced significantly. For example, In Oslo, the operator focussed on faulty train doors causing delays across the whole line. Research into the problem determined that speed of the door slowed down gradually prior to the point at which it remains open. This discovery led to the creation of an application to monitor this parameter. Now, each train car has Wi-Fi and a unique ID. The data snapshot gets downloaded into an internal database. For example, more than three “slow closing” errors for a particular door in a day sets a flag for predictive maintenance to take place. Manufacturing Sector Likely to see a 22% upside to operating profit by 2020 due to IoT. This sector will see the highest gains from cost efficiencies and new business opportunities. According to World Bank data, the global manufacturing industry was worth US$ 11.9tn in 2013. Given operating margins of 11% (source: CSIMarket) in the industry, it would suggest that there will be 22% upside from the US$ 285bn IoT-related economic value addition as predicted by Gartner.
IoT manufacturers will increasingly sell services, not just products. Manufacturers of larger goods —elevators, air-conditioning units, jet engines and medical equipment —sell maintenance contracts along with equipment. This requires regular inspection and maintenance visits, and customers still experience downtime and emergency call-outs. With IoT, manufacturers can remotely monitor the condition of equipment and look for indicators of imminent failure such as vibration, temperature, or pressure. This means that the manufacturer can make fewer visits, reducing costs and freeing up employees. For the customer, it means less disruption, increased utilisation, and higher satisfaction. Manufacturers may take this to the next level by offering a price-per-use, inclusive of all hardware, installation, and servicing. Production lines have the most to gain from connected equipment. Most production-line systems already contain the necessary sensors for anomaly detection— it’s just a case of adding connectivity. The data in manufacturing automation systems on factory floors is used only for real-time control or anomaly detection. By connecting production-line systems, manufacturers can move to predictive maintenance, which will make better use of resources and reducing unplanned downtime. Currently a big part of data generated is not analysed except for anomaly detection. But with IoT, data will be analysed for predictive maintenance and work flow optimisation.

Regional Industry Focus
Internet of Things & Smart Cities
Page 27
Healthcare Sector Likely to see a 9% upside to operating profit by 2020 due to IoT. According to Gartner, the biggest impact on healthcare industry from IoT comes from new market opportunities and lower input costs. The overall benefit for the healthcare segment, in terms of economic value, by adopting IoT is expected to be about US$ 285bn, according to Gartner. The global healthcare industry is expected to see revenues of about US$ 13.7b by 2020 according to estimates by Bain & Company. Given industry operating margins of about 23% in 2Q15 (source: CSIMarket), the overall benefit to the operational profit of the industry is likely to be around 9%. Remote patient monitoring will reduce staff costs and help to divert resources towards serious ailments. More than 70% of healthcare spending goes towards treating chronic ailments, such as diabetes, hypertension, chronic pulmonary diseases and cardiac conditions. Costs can be optimised if we can keep patients out of hospitals, in their homes and still provide a comparable level of care by using mobile applications like telehealth (for example, sensor-led continuous monitoring, rather than a nurse checking on patients frequently). A Singapore based company, Silverline is already using IoT tech to provide remote monitoring to the elderly. It claims to have established the world’s first mobile and
smart home assisted living ecosystem, which helps the elderly to lead a more wholesome and healthy life by empowering them through technology. They have a range of devices and customised smart phone apps for elderly and caregivers to monitor and track activity. Growing popularity of wearables to provide relevant data to healthcare providers. The availability of data from various wearables means that this information can now be sent to hospitals and ambulatory health records, and combined to create "complete" patient data that includes data for both within and out of a hospital setting. The old-style, hospital- or physician-focused data, without the accompanying data from wearables provides only a snapshot of the patient's condition at that particular time Hospitals and healthcare providers to benefit from less downtime and more efficient allocation of resources. For example, IoT technology can monitor and predict when important equipment of the hospital will need maintenance, allowing the hospital to avoid rescheduling patient and doctor appointments and increase utilisation of the asset. Similarly, hospitals can manage their pharmaceutical and equipment inventories more efficiently, which are generally overstocked. Hospitals will be able to incorporate a higher level of automation to their electronic health records systems through the use of lower cost sensors, which will cut labour requirements as well.

Regional Industry Focus
Internet of Things & Smart Cities
Page 28
STOCK PROFILES

www.dbsvickers.com ed: TH / sa: AS
BUY Last Traded Price: S$3.31 (STI : 2,998.35) Price Target : S$3.60 (9% upside) (Prev S$3.40) Reason for Report : Smart Nation initiatives Potential Catalyst: Better earnings execution, strong order wins, M&A Where we differ: More conservative on FY16/17 earnings Analyst Suvro SARKAR +65 6682 3720 [email protected]
Price Relative
Forecasts and Valuation FY Dec (S$ m) 2014A 2015F 2016F 2017F Revenue 6,539 6,345 6,194 6,155 EBITDA 835 852 861 883 Pre-tax Profit 651 660 666 686 Net Profit 532 531 536 545 Net Pft (Pre Ex.) 532 531 536 545 EPS (S cts) 17.1 17.0 17.2 17.5 EPS Pre Ex. (S cts) 17.1 17.0 17.2 17.5 EPS Gth (%) (9) 0 1 2 EPS Gth Pre Ex (%) (9) 0 1 2 Diluted EPS (S cts) 17.1 17.0 17.2 17.5 Net DPS (S cts) 15.0 15.0 15.0 15.0 BV Per Share (S cts) 68.4 70.4 72.6 75.1 PE (X) 19.4 19.4 19.2 18.9 PE Pre Ex. (X) 19.4 19.4 19.2 18.9 P/Cash Flow (X) 16.5 15.1 14.9 14.8 EV/EBITDA (X) 11.8 11.6 11.4 11.1 Net Div Yield (%) 4.5 4.5 4.5 4.5 P/Book Value (X) 4.8 4.7 4.6 4.4 Net Debt/Equity (X) CASH CASH CASH CASH ROAE (%) 25.0 24.6 24.0 23.7 Earnings Rev (%): - - - Consensus EPS (S cts): 17.2 18.2 19.4 Other Broker Recs: B: 8 S: 1 H: 4 ICB Industry : Industrials ICB Sector: Aerospace & Defense Principal Business: An integrated engineering group providing solutions and services in aerospace, electronics, land systems and marine sectors.
Source of all data: Company, DBS Bank, Bloomberg Finance L.P
At A Glance Issued Capital (m shrs) 3,103 Mkt. Cap (S$m/US$m) 10,273 / 7,330 Major Shareholders Temasek Holdings Private Ltd (%) 51.3 Aberdeen (%) 6.9 Capital Group Companies Inc (%) 5.0 Free Float (%) 36.8 3m Avg. Daily Val (US$m) 7.4
DBS Group Research . Equity 2 Nov 2015
Singapore Industry Focus
ST Engineering Bloomberg: STE SP | Reuters: STEG.SI Refer to important disclosures at the end of this report
Towards a smarter future ST Electronics should be one of the key local beneficiaries
of Singapore’s Smart Nation initiative
Working on pilot projects already
Significant contract wins in this space likely over FY16/17
Maintain BUY, TP raised to S$3.60 as we roll over to FY16
On track to secure orders. Singapore is poised to be among the global leaders in adoption of Internet of Things and big data as it pushes its Smart Nation program to resolve challenges in the utilities, transport and healthcare space through technology. Given the government’s proactive approach, we believe ST Engineering’s electronics division is well positioned to secure Smart Nation projects worth more than S$1bn in the near future. ST Electronics has already secured 7 out of 15 pilot projects in Jurong Lake district for the Smart Nation project, including 1) Smart Traffic Management System, 2) Location Information in Urban Environment, 3) Estate Energy Management System, 4) Smart Outdoor Lighting, 5) Smoke Detection, 6) Smart Walk and 7) Smart Phone as Sensor.
Strong competence in Smart City building blocks. ST Electronics has long track record in providing both hardware as well as system integration solutions as part of its Smart City capability build up. It has deployed or piloted sensor networks and smart utilities in cities like Paris, California, Texas, Sao Paulo, Auckland, Eliat (Israel) and Singapore already. It has also implemented intelligent traffic solutions in various Chinese cities like Beijing, Chengdu and Wuhan. ST Electronics also offers solutions like Smart Waste Management, Smart Water Management, Security Management Systems, Smart Healthcare Systems among others.
Stocks holds its allure. We believe the strength in the Electronics division will help to offset weakness in Marine division over the next 2 years and allow STE to report steady earnings and dividends. Maintain BUY on the counter, underpinned by healthy orderbook of S$12.4bn, strong balance sheet and dividend yield of 4.5%. Stronger earnings in 2H15 should provide catalysts in the near term. TP raised to S$3.60 as we roll over to FY16 valuation metrics.
90
110
130
150
170
190
210
2.2
2.7
3.2
3.7
4.2
4.7
Oct-11 Oct-12 Oct-13 Oct-14 Oct-15
Relative IndexS$
ST Engineering (LHS) Relative STI INDEX (RHS)

Page 30
Industry Focus
ST Engineering
INVESTMENT THESIS
Profile Rationale
ST Engineering (STE) is an integrated engineering group in the aerospace, electronics, land systems and marine sectors. The company has over the years diversified its businesses and geographies.
Orderbook at decent levels. Orderbook inched up to S$12.4bn at end-2Q15 from S$12.2bn as of end-1Q15 and covers close to two years of revenue and secures visibility, going forward. New contract wins announced YTD in FY15 have been somewhat slower compared to previous years owing to lack of major shipbuilding orders. 2H15 should be better than 1H15. For Aerospace sector, both revenue and PBT for 2H15 are expected to be comparable to that in 1H15. For Electronics, both revenue and PBT for 2H15 are expected to be higher than that in 1H15. For Land Systems, revenue is expected to be higher, while PBT for 2H15 is expected to be comparable to that in 1H15. For Marine, both revenue and PBT for 2H15 are expected to be lower than that in 1H15. Expanding capabilities in aerospace but impact is longer term in nature. Enhancing passenger-to-freighter conversion solutions via partnerships with Airbus in Europe. Expanding suite of cabin interior service solutions including VIP completions and reconfiguration business in the US; recent order wins in widebody VIP completion projects have inspired more confidence in the long-term outlook for these businesses.
Smart city projects will be a boost for Electronics. ST Electronics has already built up track record around the world in providing both hardware as well as system integration solutions as part of its Smart City capability build up. With Singapore government’s plan to go ahead with Smart Nation initiative, ST Electronics should be in line to win contracts in the field of smart traffic management, estate management, lighting management etc.
Valuation Risks
Maintain BUY with a target price of S$3.80, based on a blended valuation framework (blend of price-earnings, dividend yield and discounted cash flows) to factor in both earnings growth and cash-generative nature of the business. Higher interim dividend of 5Scts (FY14: 4Scts) shows confidence in management’s ability to deliver steady performance. Dividend yield of 4.5% at current prices looks attractive.
Declining defense budgets in the West. Austerity programmes in Europe and planned US spending cuts create the risk of delays to some defense programmes that STE may be bidding for. Commercial vehicle businesses face headwinds. The growth of STE’s commercial vehicle operations in China have been affected by weak demand and high inventory levels. Its Brazil operations have also been affected by withdrawal of subsidies for purchases of construction equipment. Slowdown in shipbuilding. Traditional shipping sector has been plagued by overcapacity for some time now, and the recent fall in oil prices also affects demand for offshore vessels. Visibility on demand recovery is low at this point.
Source: DBS Bank

Page 31
Industry Focus
ST Engineering
Income Statement (S$ m) Balance Sheet (S$ m)
FY Dec 2014A 2015F 2016F 2017F FY Dec 2014A 2015F 2016F 2017F
Turnover 6,539 6,345 6,194 6,155 Net Fixed Assets 1,578 1,654 1,678 1,698 Cost of Goods Sold (5,221) (5,013) (4,863) (4,801) Invts in Associates & JVs 478 500 517 528 Gross Profit 1,318 1,333 1,332 1,354 Other LT Assets 937 937 937 937 Other Opng (Exp)/Inc (711) (706) (694) (692) Cash & ST Invts 1,590 1,586 1,642 1,702 Operating Profit 608 626 638 662 Inventory 1,802 1,749 1,707 1,696 Other Non Opg (Exp)/Inc 0 0 0 0 Debtors 1,319 1,280 1,249 1,241 Associates & JV Inc 57 52 47 41 Other Current Assets 615 615 615 615 Net Interest (Exp)/Inc (14) (18) (18) (18) Total Assets 8,319 8,322 8,345 8,418 Exceptional Gain/(Loss) 0 0 0 0 Pre-tax Profit 651 660 666 686 ST Debt 75 75 75 75 Tax (114) (119) (120) (130) Creditor 1,667 1,618 1,579 1,569 Minority Interest (5) (10) (10) (10) Other Current Liab 1,974 1,953 1,936 1,931 Preference Dividend 0 0 0 0 LT Debt 944 944 944 944 Net Profit 532 531 536 545 Other LT Liabilities 1,395 1,395 1,395 1,395 Net Profit before Except. 532 531 536 546 Shareholder’s Equity 2,132 2,196 2,264 2,342 EBITDA 835 852 861 883 Minority Interests 132 142 152 162 Total Cap. & Liab. 8,319 8,322 8,345 8,418 Sales Gth (%) (1.4) (3.0) (2.4) (0.6) EBITDA Gth (%) (6.4) 1.9 1.1 2.6 Non-Cash Wkg. Capital 95 73 56 52 Opg Profit Gth (%) (15.5) 3.0 1.9 3.7 Net Cash/(Debt) 571 568 623 683 Net Profit Gth (%) (8.4) (0.1) 0.9 1.6 Effective Tax Rate (%) 17.5 18.0 18.0 19.0 Cash Flow Statement (S$ m) Rates & Ratio
FY Dec 2014A 2015F 2016F 2017F FY Dec 2014A 2015F 2016F 2017F
Pre-Tax Profit 651 660 666 685 Gross Margins (%) 20.2 21.0 21.5 22.0 Dep. & Amort. 171 173 177 180 Opg Profit Margin (%) 9.3 9.9 10.3 10.8 Tax Paid (133) (119) (120) (130) Net Profit Margin (%) 8.1 8.4 8.7 8.9 Assoc. & JV Inc/(loss) (57) (52) (47) (41) ROAE (%) 25.0 24.6 24.0 23.7 Chg in Wkg.Cap. (72) 22 17 4 ROA (%) 6.2 6.4 6.4 6.5 Other Operating CF 65 0 0 0 ROCE (%) 10.3 10.9 10.9 11.0 Net Operating CF 624 684 693 698 Div Payout Ratio (%) 87.9 88.0 87.2 85.8 Capital Exp.(net) (224) (250) (200) (200) Net Interest Cover (x) 42.7 34.3 34.8 37.7 Other Invts.(net) 79 0 0 0 Asset Turnover (x) 0.8 0.8 0.7 0.7 Invts in Assoc. & JV 6 (5) (5) (5) Debtors Turn (avg days) 70.9 74.8 74.5 73.9 Div from Assoc & JV 35 35 35 35 Creditors Turn (avg days) 118.2 123.9 124.5 124.3 Other Investing CF (53) 0 0 0 Inventory Turn (avg days) 130.4 133.9 134.6 134.4 Net Investing CF (157) (220) (170) (170) Current Ratio (x) 1.4 1.4 1.5 1.5 Div Paid (499) (468) (468) (468) Quick Ratio (x) 0.8 0.8 0.8 0.8 Chg in Gross Debt (394) 0 0 0 Net Debt/Equity (X) CASH CASH CASH CASH Capital Issues 11 0 0 0 Net Debt/Equity ex MI (X) CASH CASH CASH CASH Other Financing CF (44) 0 0 0 Capex to Debt (%) 22.0 24.5 19.6 19.6 Net Financing CF (926) (468) (468) (468) Z-Score (X) 2.5 2.5 2.6 2.6 Currency Adjustments 0 0 0 0 N. Cash/(Debt)PS (S cts) 18.3 18.2 20.0 21.9 Chg in Cash (459) (4) 55 60 Opg CFPS (S cts) 22.3 21.2 21.7 22.2 Free CFPS (S cts) 12.8 13.9 15.8 16.0 Quarterly / Interim Income Statement (S$ m) Segmental Breakdown / Key Assumptions
FY Dec 3Q2014 4Q2014 1Q2015 2Q2015 FY Dec 2014A 2015F 2016F 2017F
Turnover 1,553 1,848 1,511 1,545 Revenues (S$ m) Cost of Goods Sold (1,220) (1,530) (1,219) (1,212) Aerospace 2,061 2,052 2,027 2,046 Gross Profit 333 318 292 333 Electronics 1,583 1,699 1,784 1,895 Other Oper. (Exp)/Inc (190) (163) (149) (185) Land Systems 1,397 1,366 1,338 1,299 Operating Profit 144 156 143 148 Marine 1,341 1,066 877 738 Other Non Opg (Exp)/Inc 0 0 0 0 Others 157 162 168 177 Associates & JV Inc 12 15 11 14 Total 6,539 6,345 6,194 6,155 Net Interest (Exp)/Inc (4) (4) (4) (4) PBT (S$ m) Exceptional Gain/(Loss) 0 0 0 0 Aerospace 283 279 282 286 Pre-tax Profit 152 167 151 159 Electronics 184 196 200 213 Tax (32) (22) (19) (34) Land Systems 56 76 81 83 Minority Interest 1 (5) (2) 0 Marine 123 100 93 91 Net Profit 121 140 130 125 Others 5 8 10 12 Net profit bef Except. 121 140 130 125 Total 651 660 666 685 EBITDA 196 203 199 208 PBT Margins (%) Aerospace 13.7 13.6 13.9 14.0 Sales Gth (%) (2.1) 19.0 (18.2) 2.2 Electronics 11.6 11.5 11.2 11.2 EBITDA Gth (%) (5.1) 3.5 (2.1) 4.5 Land Systems 4.0 5.6 6.0 6.4 Opg Profit Gth (%) (8.5) 8.5 (8.0) 3.3 Marine 9.2 9.4 10.7 12.4 Net Profit Gth (%) (8.9) 15.6 (7.3) (3.8) Others 3.0 5.0 6.0 7.0 Gross Margins (%) 21.5 17.2 19.4 21.5 Total 10.0 10.4 10.8 11.1 Opg Profit Margins (%) 9.2 8.4 9.5 9.6 Key Assumptions Net Profit Margins (%) 7.8 7.6 8.6 8.1 Aerospace sales growth (%) (0.9) (0.5) (1.2) 1.0 Electronics sales growth (%) (4.1) 7.4 5.0 6.2 Land Systems sales growth (5.3) (2.2) (2.1) (2.9) Marine sales growth (%) 8.3 (20.5) (17.7) (15.9) Source: Company; DBS Bank

www.dbsvickers.com ed: TH / sa: AS
BUY Last Traded Price: S$1.05 STI : 2,998.35 Price Target : S$1.14 (9% upside) Reason for Report : Sector report Potential Catalyst: Better occupancies at co-location properties Where we differ: We have imputed S$250m of acquisitions Analyst Derek Tan +65 6682 3716 [email protected] Rachael TAN +65 6682 3713 [email protected]
Price Relative
Forecasts and Valuation FY Dec (S$ m) 2014A 2015F 2016F 2017F Gross Revenue 80 97 124 129 Net Property Inc 67 80 105 109 Total Return 48 56 75 79 Distribution Inc 48 57 75 80 EPU (S cts) 5.4 6.4 7.5 7.1 EPU Gth (%) nm 18 18 (5) DPU (S cts) 5.4 6.4 6.8 7.2 DPU Gth (%) nm 18 6 6 NAV per shr (S cts) 87.5 87.5 89.8 89.8 PE (X) 19.3 16.4 13.9 14.6 Distribution Yield (%) 5.2 6.1 6.5 6.9 P/NAV (x) 1.2 1.2 1.2 1.2 Aggregate Leverage (%) 31.2 34.3 30.1 30.3 ROAE (%) 6.1 7.3 8.5 8.0 Distn. Inc Chng (%): 0 0 0 Consensus DPU (S cts): 6.8 7.0 7.2 Other Broker Recs: B: 2 S: 0 H: 1 ICB Industry : Financials ICB Sector: Real Estate Investment Trusts Principal Business: Keppel DC REIT is the first data center EIT to be listed in Asia and on the SGX. KDC REIT invests in a diversified portfolio of income-producing real estate assets which are primarily for data center purposes.
Source of all data: Company, DBS Bank, Bloomberg Finance L.P
At A Glance Issued Capital (m shrs) 883 Mkt. Cap (S$m/US$m) 923 / 658 Major Shareholders Keppel Telecom & Transport (%) 30.1 Wellington Management (%) 7.3 DBS Bank (%) 5.5 Free Float (%) 57.1 3m Avg. Daily Val (US$m) 1.3
DBS Group Research . Equity 2 Nov 2015
Singapore Company Focus
Keppel DC REIT Bloomberg: KDCREIT SP | Reuters: KEPE.SI Refer to important disclosures at the end of this report
First data centre REIT in Asia Leveraging on Sponsor’s excellent track record
Visible earnings profile with upside from acquisitions
Maintain BUY, TP S$1.14
Leveraging on Sponsor’s excellent track record. With two Tier-III data centres offering close to 150k sqft of carrier neutral DC space in, Keppel DC REIT is poised to ride on Singapore’s rising importance as the data centre hub of Southeast Asia. These data centres store mission critical computer servers and hardware, where there is a high need for operational reliability, and where tenants prefer to stick with reputable data centre operators. In that regard, Keppel DC REIT is able to leverage on the operational acumen of its Sponsor Keppel T&T, which has a long operational history and track record. Stable and visible earnings profile. The Trust offers investors a stable and visible earnings growth profile, with 30% of NPI derived from long-dated master leases and with embedded rental step-ups of 2-4% p.a. With 61% of leases by rental income due for renewal between 2015 and 2017, earnings will be further driven by positive rental reversions and higher occupancies at its co-location data centres in Singapore (T25, S25), Australia (part of Gore Hill), and Ireland (Citadel 100). As it stands, the Trust has a WALE of 2.6 years for co-location properties, 9.9 years for fully fitted properties, and 16 years for shell & core properties.
Upside from acquisitions. With foreign sourced distributions fully hedged until 1H17, and 90% of borrowings hedged into fixed rate debt, Keppel DC REIT stands out for its stable and highly visible earnings profile. Earnings catalyst will come from the acquisition of T27, which we believe could occur in 1H16. While an acquisition of >S$250m is expected to trigger an equity fund-raising exercise, we believe the acquisition will be accretive to earnings given that the stock is trading at a low implied cap rate of 6.3%
Maintain BUY, TP S$1.14. We currently have a BUY recommendation, with DCF-backed TP of S$1.14. The stock offers attractive yields 6.5% for FY16 and upside will hinge on better-than-expected returns from acquisitions, or higher occupancies at co-location properties.
89
109
129
149
169
189
209
0.8
0.9
0.9
1.0
1.0
1.1
1.1
1.2
1.2
Dec-14 Mar-15 Jun-15 Sep-15
Relative IndexS$
Keppel DC REIT (LHS) Relative STI INDEX (RHS)

Page 33
Company Focus
Keppel DC REIT
INVESTMENT THESIS
Profile Rationale
Keppel DC REIT is a Singapore-based real estate investment trust (REIT), established with the principal investment strategy of investing, directly or indirectly, in a portfolio of income producing real estate assets which are used primarily for data centre purposes, with an initial focus on Asia Pacific and Europe.
Riding on the global data boom. Keppel DC REIT offers investors unique exposure into the highly specialised and resilient data centre market. With close to 70% of NPI derived from co-location leases, the Trust is poised to ride on rising global usage of data and demand for data centres. Earnings are further supported by its master leased properties (30% of NPI) which have average annual escalations of 2-4%. Visible earnings growth profile underpinned by acquisition potential. With foreign sourced distributions fully hedged until 1H17, and 90% of borrowings hedged into fixed rate debt, Keppel DC REIT stands out for its stable and highly visible earnings profile. Earnings catalyst will come from the acquisition of T27, which we believe could occur in 1H16. While an acquisition of >S$250m is expected to trigger an equity fund raising exercise, we believe the acquisition will be accretive to earnings given that the stock is trading at a low implied cap rate of 6.3% Imputed S$250m of acquisitions into FY16 numbers. We have assumed S$250m of acquisitions in FY16 to account for the purchase of T27; we have assumed the equity fundraising will bring gearing down to 30%, which is the Manager’s long-term target level.
Valuation Risks
We currently have a BUY recommendation, with DCF-backed TP of S$1.14. The stock offers attractive yields 6.5% for FY16 and upside will hinge on better than expected returns from acquisitions, or higher occupancies at co-location properties.
Higher maintenance capex relative to other asset classes. Due to the shorter lifespan of a data centre’s infrastructure, it is possible that the REIT may have to rely on borrowings to fund maintenance capex at certain properties which could impact gearing. Competition from larger third party data centre players. The data centre market is dominated by several large international operators which have been aggressively expanding into markets where Keppel DC REIT has a presence. Keppel DC REIT may face higher barriers to entry and stiffer competition to attract and retain tenants.
Source: DBS Bank

Page 34
Company Focus
Keppel DC REIT
Income Statement (S$ m)
FY Dec 2014A 2015F 2016F 2017F Gross revenue 80 97 124 129 Property expenses (12) (18) (19) (20) Net Property Income 67 80 105 109 Other Operating expenses (9) (12) (14) (14) Other Non Opg (Exp)/Inc 0 0 0 0 Net Interest (Exp)/Inc (8) (9) (11) (11) Exceptional Gain/(Loss) 0 0 0 0 Net Income 50 59 80 84 Tax (3) (3) (4) (5) Minority Interest 0 0 0 0 Preference Dividend 0 0 0 0 Net Income After Tax 48 56 75 79 Total Return 48 56 75 79 Non-tax deductible Items 0 0 0 0 Net Inc available for Dist. 48 57 75 80 Growth & Ratio Revenue Gth (%) N/A 21.9 27.1 4.4 N Property Inc Gth (%) nm 18.4 31.0 4.6 Net Inc Gth (%) nm 17.7 33.5 5.6 Dist. Payout Ratio (%) 100.0 100.0 100.0 100.0 Net Prop Inc Margins (%) 84.4 82.0 84.5 84.6 Net Income Margins (%) 59.9 57.8 60.7 61.4 Dist to revenue (%) 59.9 58.1 60.9 61.6
Managers & Trustee’s fees to sales %) 11.3 11.9 11.2 10.9
ROAE (%) 6.1 7.3 8.5 8.0 ROA (%) 4.3 4.9 5.8 5.6 ROCE (%) 5.1 5.8 6.7 6.4 Int. Cover (x) 7.3 7.3 8.1 8.4
Source: Company, DBS Bank
Net Property Income and Margins
77.9%
79.9%
81.9%
83.9%
85.9%
87.9%
0
20
40
60
80
100
2014A 2015F 2016F 2017F
S$ m
Net Property Income Net Property Income Margin %

Page 35
Company Focus
Keppel DC REIT
Quarterly / Interim Income Statement (S$ m)
FY Dec 1Q2015 2Q2015 3Q2015 Gross revenue 31 26 25 Property expenses (5) (4) (4) Net Property Income 26 22 21 Other Operating expenses (3) (3) (1) Other Non Opg (Exp)/Inc 0 0 0 Net Interest (Exp)/Inc (4) (3) (3) Exceptional Gain/(Loss) (1) 0 0 Net Income 19 17 18 Tax (1) (1) (1) Minority Interest 0 0 0 Net Income after Tax 17 15 17 Total Return 17 15 17 Non-tax deductible Items 0 (1) (2) Net Inc available for Dist. 17 14 14 Growth & Ratio Revenue Gth (%) N/A (18) (1) N Property Inc Gth (%) nm (16) (3) Net Inc Gth (%) nm (10) 10 Net Prop Inc Margin (%) 84.0 85.9 84.7 Dist. Payout Ratio (%) 100.0 100.0 100.0 Balance Sheet (S$ m)
FY Dec 2014A 2015F 2016F 2017F Investment Properties 1,047 1,098 1,352 1,356 Other LT Assets 2 2 2 2 Cash & ST Invts 26 32 26 25 Inventory 0 0 0 0 Debtors 47 32 41 43 Other Current Assets 0 0 0 0 Total Assets 1,122 1,164 1,421 1,426 ST Debt 4 4 4 4 Creditor 18 6 8 9 Other Current Liab 0 3 4 5 LT Debt 323 373 402 407 Other LT Liabilities 4 4 4 4 Unit holders’ funds 773 773 998 998 Minority Interests 0 0 0 0 Total Funds & Liabilities 1,122 1,164 1,421 1,426 Non-Cash Wkg. Capital 29 23 29 30 Net Cash/(Debt) (301) (345) (380) (386) Ratio Current Ratio (x) 3.4 4.9 4.1 4.0 Quick Ratio (x) 3.4 4.9 4.1 4.0 Aggregate Leverage (%) 31.2 34.3 30.1 30.3 Source: Company, DBS Bank
Net Property Income and Margins
Aggregate Leverage
83%
83%
84%
84%
85%
85%
86%
86%
87%
20
21
22
23
24
25
26
27
2Q
20
13
3Q
20
13
4Q
20
13
1Q
20
14
2Q
20
14
3Q
20
14
4Q
20
14
1Q
20
15
2Q
20
15
3Q
20
15
Net Property Income Net Property Income Margin %
10.0%
15.0%
20.0%
25.0%
30.0%
35.0%
2014A 2015F 2016F 2017F
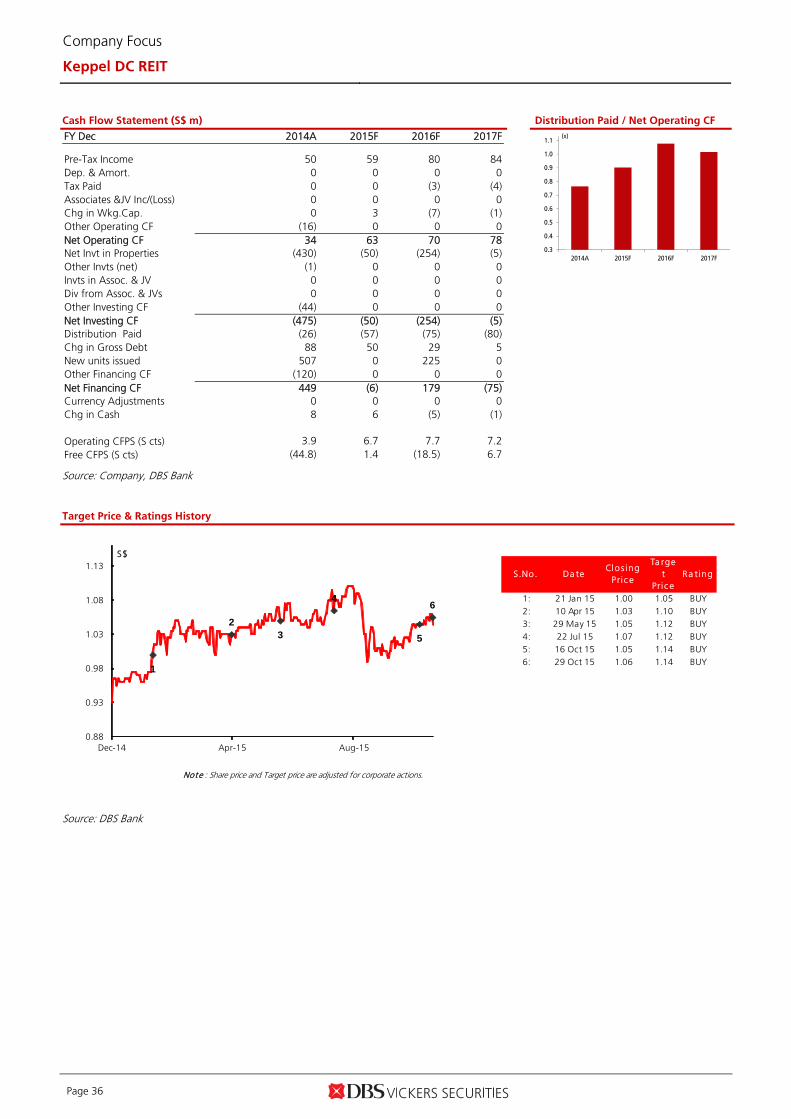
Page 36
Company Focus
Keppel DC REIT
Cash Flow Statement (S$ m)
FY Dec 2014A 2015F 2016F 2017F Pre-Tax Income 50 59 80 84 Dep. & Amort. 0 0 0 0 Tax Paid 0 0 (3) (4) Associates &JV Inc/(Loss) 0 0 0 0 Chg in Wkg.Cap. 0 3 (7) (1) Other Operating CF (16) 0 0 0 Net Operating CF 34 63 70 78 Net Invt in Properties (430) (50) (254) (5) Other Invts (net) (1) 0 0 0 Invts in Assoc. & JV 0 0 0 0 Div from Assoc. & JVs 0 0 0 0 Other Investing CF (44) 0 0 0 Net Investing CF (475) (50) (254) (5) Distribution Paid (26) (57) (75) (80) Chg in Gross Debt 88 50 29 5 New units issued 507 0 225 0 Other Financing CF (120) 0 0 0 Net Financing CF 449 (6) 179 (75) Currency Adjustments 0 0 0 0 Chg in Cash 8 6 (5) (1) Operating CFPS (S cts) 3.9 6.7 7.7 7.2 Free CFPS (S cts) (44.8) 1.4 (18.5) 6.7
Source: Company, DBS Bank
Distribution Paid / Net Operating CF
Target Price & Ratings History
Source: DBS Bank
0.3
0.4
0.5
0.6
0.7
0.8
0.9
1.0
1.1
2014A 2015F 2016F 2017F
(x)
S.No. Da teClos ing
Pric e
Ta rget
Pric eRa ting
1: 21 Jan 15 1.00 1.05 BUY2: 10 Apr 15 1.03 1.10 BUY3: 29 May 15 1.05 1.12 BUY4: 22 Jul 15 1.07 1.12 BUY5: 16 Oct 15 1.05 1.14 BUY6: 29 Oct 15 1.06 1.14 BUY
Note : Share price and Target price are adjusted for corporate actions.
1
23
4
5
6
0.88
0.93
0.98
1.03
1.08
1.13
Dec-14 Apr-15 Aug-15
S$

Industry Focus
800 Super Holdings
www.dbsvickers.com ed: TH /sa: AS
Explorations 800 Super Holdings (S$0.49, ESH SP) 800 Super Holdings (800 Super) is an integrated
environmental solution provider with a recession-proof business model. Range of services it provides include waste disposal, recycling, cleaning and conservancy, and horticultural services. Revenue grew at a CAGR of 12.5% from FY11 to FY15 while net profit surged by a 21.5% CAGR during the same period, outpacing the ~3% CAGR growth in waste generated in Singapore from 2011 to 2014. Going forward, we expect continued growth in revenue and profit, on the back of the Group’s ability to clinch more contracts while containing costs to increase profitability.
800 Super is an established environmental service provider for
the public and private sectors in Singapore. Environmental services 800 Super provides include waste management, cleaning and conservancy and horticultural services :
1) Waste management services: residential, commercial,
industrial, construction and hardcore waste collection and recycling services;
2) Cleaning and conservancy services: street cleaning services and contract cleaning services for residential, industrial, commercial and institutional customers; and
3) Horticultural services: grass cutting, tree planting and pruning, and landscape planning and maintenance services for residential, industrial, commercial and institutional customers.
With the broad range of services provided, 800 Super is able to provide comprehensive environmental solutions to its customers, as compared to its competitors who are mostly either in waste management services or cleaning services but not both.
The Group recorded revenue of S$140.3m in FY2015, +22% y-o-y. The increase in revenue was mainly contributed by projects that were re-awarded with revised pricing and new contracts awarded. Pre-tax profit surged 80.9% y-o-y to S$19.1m, boosted by a one-time gain of S$5.4m, resulting from the disposal of a property. Ex one-off gain, pre-tax profit jumped 30%. From FY11 to FY15, revenue grew at a CAGR of 12.5% while net profit surged by a 21.5% CAGR during the same period, outpacing the ~3% CAGR growth in waste generated in Singapore from 2011 to 2014.
Since its listing in 2011, 800 Super had paid dividends to its shareholders for four consecutive financial years. For
FY2015, the group has proposed a final dividend of S$0.02 per share.
…Smart Nation... An efficient system for waste collection and disposal is critical in Singapore, given our limited land area and dense population. Singapore’s output of solid waste has increased significantly over the years: from 1,260 tonnes per day in 1970, to a high of 8,338 tonnes per day in 2014. Being one of the biggest players in waste management services, 800 Super is poised to benefit from the government’s drive towards automation to reduce manpower needs and improve productivity.
Source: Bloomberg Finance L,P, DBS Bank Analyst Ling Lee Keng; +65 6682 3703 [email protected]
At A Glance Issued Capital (m shrs) 179 Market Cap (S$m/US$m) 88 / 62 Major Shareholders (%) Yong Seong Investment 66.0 Venstar Investments 4.9 Hock Seong Lee 2.8 Free Float (%) 21.1 Avg Daily Vol (m shrs) 0.2
Forecasts and Valuation FY Jun (S$ m) 2012 2013 2014 2015 Turnover 88.7 97.5 115.0 140.3 EBITDA 10.0 10.2 15.6 27.0 Pre-tax Profit 6.9 6.7 10.5 19.1 Net Profit 5.9 5.7 9.0 17.6 EPS (S cts) 3.32 3.21 5.01 9.82 EPS Gth (%) 28.6 (3.4) 56.3 95.9 Net DPS (S cts) 0.01 0.01 0.01 0.02 BV Per Share (S cts) 17.0 19.2 23.2 32.0 PE (X) 14.8 15.3 9.8 5.0 P/Cash Flow (X) 0.1 (0.0) 1.1 0.2 EV/EBITDA (X) 8.6 9.9 7.7 4.5 Net Div Yield (%) 2.0% 2.0% 2.0% 4.1% P/Book Value (X) 2.9 2.6 2.1 1.5 Net Debt/Equity (X) cash 0.3 0.7 0.6 ROA (%) 11.71 8.56 9.79 14.40 ROE (%) 19.54 16.66 21.58 30.66
50
100
150
200
250
300
0.00
0.10
0.20
0.30
0.40
0.50
0.60
Jan-13 Jul-13 Jan-14 Jul-14 Jan-15 Jul-15
800 Super Holdings Ltd (LHS) Relative STI Index (RHS)
Relative IndexS$ Relative IndexS$
Page 37

Industry Focus
800 Super Holdings
Page 38
800 Super is a beneficiary of the government’s drive towards automation to reduce manpower needs and improve productivity, as the Group is one of the four licensed public waste collectors appointed by The National Environment Agency (NEA). The government has implemented a pilot project as part of HDB’s Greenprint scheme in Yuhua, whereby the rubbish thrown by residents down their chutes will be transported by air, through underground pipes, to a centralised bin, which will then be transported to an incineration plant. If this project is implemented island-wide, 800 Super would be able to cut down on its manpower needs.
The Group has been re-awarded a public waste collection contract for a period of 7 years and 9 months commencing from 1 January 2014 to provide waste collection services for the Ang Mo Kio – Toa Payoh sector. There are six sectors in Singapore, split among four players. Both Veolia and SembWaste have two sectors each while 800 Super and Colex have one each.
For the cleaning and conservancy segment, among the bigger contracts were two integrated public cleaning (IPC) services contracts for the Northwest and Southwest region of Singapore for six years to seven years. Ongoing cleaning and conservancy projects include: NEA, Ministry of Education, Nanyang Technological University, National University of Singapore, Town Councils, Housing and Development Board, Changi International Airport and Ministry of Home Affairs.
800 Super has a staff strength of about 3,000; foreigners account for about 30%. The Group owns a range of equipment and vehicles that enhances efficiency of operations. It currently has >700 vehicles in its fleet.
The Group has a wide and diversified customer base, with contracts awarded by both public and private sectors. Types of industries covered include schools, factories, airport, hotels, commercial offices, shopping malls and private residential properties.
Both the waste management division, especially the private
segment, and cleaning businesses are fragmented with numerous smaller players. Being one of the bigger players, a consolidation of the industry is beneficiary to 800 Super as it has the capacity to acquire the smaller players.
800 Super also owns and operates two recycling sorting
facilities in Singapore, known as Materials Recovery Facility (MRF), with a daily total capacity of more than 50 tonnes. The Group has proceeded with the development of the biomass plant located at Tuas South. Upon completion of the plant, expected to be in 2H2017, 800 Super will be able to save on its refuse disposal fee, currently undertaken by a third party.
Revenue and net profit trend
77.7 88.7
97.5
115.0
141.0
4.6 5.9 5.8 9.117.6
0
20
40
60
80
100
120
140
160
2011 2012 2013 2014 2015
Turnover Net Profit
S$m
Source: DBS, company
Cost breakdown (FYE Jun’15)
Supplies and disposal charge
22% Sub-contractor 2%
Depreciation 6%
Others16%
Employee benefits
54%
Source: DBS, company
Key competitors
SembWaste Pte Ltd – owned by SembCorp Industries
Veolia ES Singapore Pte Ltd – owned by Veolia Environment S.A.
Colex Environmental Pte Ltd – owned by Colex Holdings which Bonvests Holdings has a ~79% stake
Source: DBS, company

Industry Focus
Vicom Ltd
Page 39
www.dbsvickers.com ed: TH /sa: AS
Explorations VICOM Ltd (S$6.04, VCM SP) Operating seven of nine authorised vehicle inspection centres island-wide, VICOM has managed to grow its market share of the domestic motor vehicle inspection business from c.71% in FY10 to c.74% in FY14. Given its strong island-wide presence, VICOM has benefitted from the surging demand for inspections from an ageing distribution of motor vehicles in Singapore. Incorporated in 1981 and publicly listed in 1995, VICOM
Ltd is a subsidiary of ComfortDelGro Corporation Limited (CD SP) and has established itself as Singapore’s leading provider in technical testing and inspection services. Although its expertise extends to other countries in Asia and the Middle East, the Group operates predominantly in Singapore through the following entities:
(1) VICOM Inspection Centre and JIC Inspection Services Both VICOM Inspection Centre (VIC) and JIC Inspection Services (JIC) are principally involved in the domestic provision of vehicle inspection and other related services. Although VIC is a wholly-owned subsidiary, VICOM only has a 78% interest in JIC. Together, they command c.74% market share through the operation of seven of nine vehicle inspection centres authorised by the Land Transport Authority (LTA), accounting for 520,000 of c.702,000 vehicle inspections conducted in 2014.
(2) Setsco Services Pte Ltd (SETSCO) Wholly-owned, SETSCO is VICOM’s non-vehicular inspection and testing arm and provides testing, calibration, inspection, consultancy and training services to the aerospace, marine and offshore, biotechnology, oil and petrochemical, building construction and electronics manufacturing industries.
The period of high Certificate of Entitlement (COE)
premiums and car prices observed over the last decade incentivised owners of motor vehicles to extend their vehicles’ useful lives, leading to a c.48% decline in new vehicles registered p.a. – from 131,222 in 2004 to 55,588 in 2014.
To ensure that the basic health of vehicles are maintained, inspections and tests are required for vehicles above three years of age. With c.85% of motor vehicles above three years of age as at Aug 2015, up from c.54% in 2004, VICOM has historically benefitted from the surge in demand for vehicle inspections. The average year-to-date prevailing quota premium of COE of c.S$63,817 suggests that registration of new vehicles is likely to remain low for the rest of the year, but expectations of an increase in de-
registered vehicles could erode the benefits to VICOM from an ageing vehicle population.
…Smart Nation... The current Electronic Road Pricing (ERP) system is slated to be replaced by a new Global Navigation Satellite System-based technology (ERP II) by 2020, which allows for more equitable distance-based pricing as opposed to the current gantry-based system. Operating seven of nine authorised IU service centres, VICOM could benefit from a one-off revenue of c.S$10.1 m from IU removal services alone, as the nation undergoes a mass replacement of IUs with a more sophisticated model, with further upside from installation fees of “ERP II”-compatible OBUs.
Source: Bloomberg Finance L,P, DBS Bank Paul YONG, CFA +65 6682 3712 [email protected]
Singapore Research Team
At A Glance Issued Capital (m shrs) 89 Market Cap (S$m/US$m) 543 / 388 Major Shareholders (%)
Comfortdelgro Corp 67.1 Fidelity Management 3.5 Wasatch Advisors Inc 0.4
Free Float (%) 28.4 Avg Daily Vol (m shrs) 0.0
Financials and Valuations FY Dec (S$ m) 2011 2012 2013 2014
Turnover 90.7 95.8 103.7 106.8 EBITDA 35.2 37.5 39.9 41.6 Pre-tax Profit 30.1 32.0 34.4 36.3 Net Profit 25.1 26.4 28.4 30.2 EPS (S cts) 28.32 29.80 32.10 34.02 EPS Gth (%) 13.2 5.2 7.7 6.0 Net DPS (S cts) 0.14 0.15 0.16 0.18 BV Per Share (S cts) 120.0 132.1 145.9 156.7 PE (X) 21.6 20.6 19.1 18.0 P/Cash Flow (X) 0.3 0.2 0.2 0.2 EV/EBITDA (X) 13.9 12.8 11.7 10.9 Net Div Yield (%) 2.3% 2.4% 2.5% 2.9% P/Book Value (X) 5.1 4.6 4.2 3.9 Net Debt/Equity (X) - - - - ROA (%) 18.74 18.22 17.96 17.81 ROE (%) 23.57 22.48 21.87 21.56
50
75
100
125
150
0.001.002.003.004.005.006.007.008.00
Jan-13 Jul-13 Jan-14 Jul-14 Jan-15 Jul-15
Vicom Ltd (LHS) Relative STI Index (RHS)
Relative IndexS$ Relative IndexS$

Industry Focus
Vicom Ltd
Page 40
The ERP II system, when implemented, will boast the ability to implement privacy-friendly, distance-based pricing on congested roads, which will be more equitable as motorists will be charged proportionate to the distance travelled on these roads. To support the requirements and functionality of the new ERP system, motor vehicles would have to be fitted with a new interactive and intelligent on-board unit (OBU) in their vehicle capable of transmitting “live” data to the system at all times. This sophisticated model will also support a range of value-added services such as real-time traffic information customised to the motorists’ locations and electronic payments for parking fees without paper coupons. IU service centres typically charge S$155.80 and S$15 for the installation and removal of IUs respectively. Operating seven of nine approved IU service centres, we believe that VICOM could be the prime beneficiary of a mass IU replacement exercise due to its wider geographical presence.
As the progress towards the implementation of the ERP II system is still in its infancy, the size of the potential contract for IU replacements has yet to be disclosed. However, based on the motor vehicle population as at Aug 2015 and VICOM’s leading market share of c.74%, we estimate that one-off service revenue from the removal of IUs alone could be c.S$10.1m, with further upside from installation fees of the “ERP II”-compatible OBUs.
Key risks: (1) Substantial declines in COE prices could
stimulate the market for new motor vehicles, which reduces demand for vehicle inspections, (2) Lack of project wins from SETSCO on the back of slowdowns in the construction sector and weaker demand in the offshore oil and gas space could further weigh on VICOM’s earnings potential.
Net earnings have grown steadily at a CAGR of c.8%
between FY10 and FY14, while net margins improved modestly from c.26% to c.28% over the same period. Looking ahead, we believe that VICOM could be a potential beneficiary of Smart Nation initiatives in 2020, but expect more moderate growth in the near term as more vehicles are likely to be de-registered during the year. Due to slowing growth in some industries (i.e. offshore oil and gas), the demand for non-vehicle testing services is also likely to fall.
At 1H15, earnings attributable to owners grew 5% y-o-y to
c.S$16.0m, down from the c.6.5% pace in 1H14. The current trailing 12-month PE at c.17.3x represents a c.15% discount from the historical high of c.20.5x PE in Aug 2014, suggesting that the more conservative growth outlook has already been priced in.
Intelligent On-board Unit: What it Could Look Like
Source: Mitsubishi Heavy Industries, Ltd
Annual Average Quota Premium of COE for Cat A & B
(SGD) (SGD)
0
20,000
40,000
60,000
80,000
100,000
120,000
140,000
160,000
0
10,000
20,000
30,000
40,000
50,000
60,000
70,000
80,000
90,000
20042005200620072008200920102011201220132014
Cat A (Cars <1600cc & Taxis) Cat B (Cars > 1600 cc)
New Vehicles Registered
Source: Land Transport Authority, DBS
10-yr Age Distribution of Motor Vehicles in Singapore
37.0% 34.5% 35.1% 38.9% 44.0%52.1%
59.8%68.2% 72.5% 73.1% 71.4% 68.1%
0.0%
10.0%
20.0%
30.0%
40.0%
50.0%
60.0%
70.0%
80.0%
90.0%
100.0%
2004 2005 2006 2007 2008 2009 2010 2011 2012 2013 2014 Aug‐15
Below 3 Years 3 to 10 Years > 10 Years
Source: Land Transport Authority, DBS

www.dbsvickers.com
sa- CW
BUY Last Traded Price: HK$8.64 (HSI : 22,640) Price Target: HK$12.50 (45% upside) Potential Catalyst: M&A, strong tender results Where we differ: We are more conservative than the market Analyst Patricia YEUNG +852 2863 8908 [email protected] Price Relative
72
122
172
222
272
322
2.0
4.0
6.0
8.0
10.0
12.0
14.0
Oct-11 Oct-12 Oct-13 Oct-14 Oct-15
Relative IndexHK$
Wasion Group Holdings (LHS) Relative HSI INDEX (RHS)
Forecasts and Valuation FY Dec (RMB m) 2014A 2015F 2016F 2017F Turnover 2,812 3,654 4,360 5,212 EBITDA 649 818 981 1,154 Pre-tax Profit 542 696 852 1,010 Net Profit 482 624 764 905 Net Pft (Pre Ex) 482 624 764 905 EPS (RMB) 0.51 0.63 0.75 0.89 EPS (HK$) 0.63 0.78 0.93 1.10 EPS Gth (%) 18.5 23.7 19.3 18.5 Diluted EPS (HK$) 0.63 0.77 0.92 1.09 DPS (HK$) 0.20 0.29 0.34 0.41 BV Per Share (HK$) 4.18 5.28 5.78 6.37 PE (X) 13.8 11.1 9.3 7.9 P/Cash Flow (X) 20.8 10.4 18.7 10.5 P/Free CF (X) 55.4 14.9 223.1 12.4 EV/EBITDA (X) 11.0 8.0 7.2 6.0 Net Div Yield (%) 2.3 3.3 4.0 4.7 P/Book Value (X) 2.1 1.6 1.5 1.4 Net Debt/Equity (X) 0.1 CASH CASH CASH ROAE (%) 15.8 16.4 16.7 18.0 Earnings Rev (%): Nil Nil Nil Consensus EPS (RMB) 0.63 0.77 0.94 Other Broker Recs: B: 12 S: 0 H: 0
ICB Industry: Industrials ICB Sector: Electronic & Electrical Equipment Principal Business: China's leading energy metering and energy efficiency management expert Source of all data: Company, DBSV, Thomson Reuters, HKEX
Riding on smart grid development Increasing sales in the prosperous ADO market
Installation of a new generation of smart meters to drive sales
Co-operation with Siemens to boost overseas sales
Maintain BUY with TP at HK$12.50 ADO sales to double. To capture the strong demand in ADO (advanced distribution operation) market, Wasion offers customised solutions to clients through the launch of various new products and solutions, such as power distribution automation, metering automation, smart circuit breaker, etc. In addition, the establishment of Wasion Electric Industry Park, the most professional technology park in the ADO industry in China, will provide a centralised and comprehensive platform for development. As Wasion is expanding its ADO business into various sectors, including oil & gas, automobile, and transportation, management is confident of doubling ADO sales in FY15.
Replacement of first-generation smart meters. We estimate that the penetration rate of smart meters to be <80% by 2015. While State Grid’s tender size is expected to remain stable at 80-90m units in 2016, we expect more trial orders for the next generation of smart meters. The replacement of the first generation of smart meters should start soon as the implementation of smart meters started >5 years ago. Wasion has also been involved in the setting of standards for the next generation of smart meters.
Strong potential in international market. Management is optimistic about the growth potential of the overseas market, given its co-operation with Siemens and its leading market position in various countries, including Tanzania, Egypt, Bangladesh and Indonesia. In addition, the depreciation of Renminbi will further accelerate its expansion in more markets such as Africa and Latin America.
Maintain BUY. We like Wasion for its leading market position, strong technical know-how, lucrative margin and bright outlook of the energy metering and energy efficiency management market. Our TP of HK$12.50 is based on a 13x 12-month rolling PE. Maintain BUY.
At A Glance Issued Capital (m shrs) 1,027 Mkt. Cap (HK$m/US$m) 8,872 / 1,145
Major Shareholders Ji Wei (%) 50.7
Free Float (%) 49.3 3m Avg. Daily Val. (US$m) 3.3
DBS Group Research . Equity 2 Nov 2015
China / Hong Kong Industry Focus
Wasion Group Holdings Bloomberg: 3393 HK Equity | Reuters: 3393.HK
Refer to important disclosures at the end of this report

Industry Focus
Wasion Group Holdings
Page 42
INVESTMENT THESIS
Profile Rationale
Wasion is a leading energy metering and energy efficiency management expert, focusing on providing integrated solutions in efficient and effective energy management and energy saving, particularly for Advanced Metering Infrastructure and Advanced Distribution Operations. Apart from the State Grid and the Southern Grid, it also provides system solutions to various industries and local governments. Its major markets are China and emerging markets such as Egypt, Indonesia, Thailand, Chile, Vietnam, Brazil, etc.
Leader in a prosperous market We like Wasion for its leading market position, strong technical know-how, lucrative margin and bright outlook of the energy metering and energy efficiency management market. With AMI (advanced metering infrastructure) solution, grid operators can collect and analyse power usage data for more efficient energy management. While Wasion has always maintained the top three position in the State Grid’s tender for standardised products, the company's strong technical know-how also allows it to provide customised AMI products and solutions. Good potential in ADO market Following the implementation of AMI solution, demand for advanced distribution operation (ADO) is increasing because ADO allows fully controllable and flexible distribution of power, enabling grid operators to optimise the grid network, and minimise efficiency loss and power disruption. It is estimated that the market size for ADO is at least 10x of that of smart meters. We estimate Wasion’s ADO sales to increase from c.10% of total sales to >20% in the coming few years. M&A as a catalyst To expand its product offering in the ADO market, Wasion is actively looking for M&A targets. We believe a successful acquisition will be a good share price catalyst.
Valuation Risks
Our TP of HK$12.50 is based on a 13x 12-month rolling PE. Maintain BUY.
High reliance on the State Grid >50% of turnover comes from the State Grid. Volatility in margins A change in product mix could lead to volatility in margins. Uneven order flow from the State Grid will negatively affect utilisation of its production facilities, leading to a lower gross margin. Slower penetration rate of smart meters This will slow sales growth.
Source: DBS Vickers

Industry Focus
Wasion Group Holdings
Page 43
Income Statement (RMB m) Balance Sheet (RMB m)
FY Dec 2014A 2015F 2016F 2017F FY Dec 2014A 2015F 2016F 2017F Turnover 2,812 3,654 4,360 5,212 Net Fixed Assets 1,324 1,469 1,753 1,775 Cost of Goods Sold (1,849) (2,453) (2,912) (3,477) Invts in Assocs & JVs 3 2 4 7 Gross Profit 963 1,201 1,448 1,735 Other LT Assets 777 734 691 648 Other Opng (Exp)/Inc (397) (480) (577) (705) Cash & ST Invts 327 1,109 698 834 Operating Profit 566 721 871 1,030 Inventory 335 475 523 573 Other Non Opg (Exp)/Inc 0 0 0 0 Debtors 1,904 1,827 2,093 2,476 Associates & JV Inc (4) (1) 2 3 Other Current Assets 949 1,315 1,788 2,137 Net Interest (Exp)/Inc (20) (24) (20) (24) Total Assets 5,618 6,930 7,549 8,450 Dividend Income 0 0 0 0 Exceptional Gain/(Loss) 0 0 0 0 ST Debt 503 353 233 208 Pre-tax Profit 542 696 852 1,010 Creditors 1,486 1,827 2,093 2,491 Tax (55) (63) (77) (91) Other Current Liab 56 56 56 56 Minority Interest (4) (10) (12) (14) LT Debt 248 248 294 319 Preference Dividend 0 0 0 0 Other LT Liabilities 20 20 20 20 Net Profit 482 624 764 905 Shareholder’s Equity 3,246 4,356 4,771 5,258 Net Profit before Except. 482 624 764 905 Minority Interests 61 71 83 97 EBITDA 649 818 981 1,154 Total Cap. & Liab. 5,618 6,930 7,549 8,450 Sales Gth (%) 16.6 29.9 19.3 19.5 EBITDA Gth (%) 14.4 26.1 19.9 17.7 Non-Cash Wkg. Cap 1,646 1,734 2,255 2,639 Opg Profit Gth (%) 19.3 27.5 20.7 18.3 Net Cash/(Debt) (423) 508 170 307 Net Profit Gth (%) 20.3 29.3 22.4 18.5 Effective Tax Rate (%) 10.2 9.0 9.0 9.0 Cash Flow Statement (RMB m) Rates & Ratio
FY Dec 2014A 2015F 2016F 2017F FY Dec 2014A 2015F 2016F 2017F Pre-Tax Profit 542 696 852 1,010 Gross Margins (%) 34.2 32.9 33.2 33.3 Dep. & Amort. 87 98 108 121 Opg Profit Margin (%) 20.1 19.7 20.0 19.8 Tax Paid (35) (63) (77) (91) Net Profit Margin (%) 17.2 17.1 17.5 17.4 Assoc. & JV Inc/(loss) 0 1 (2) (3) ROAE (%) 15.8 16.4 16.7 18.0 (Pft)/ Loss on disposal of FAs (24) 0 0 0 ROA (%) 9.3 9.9 10.5 11.3 Chg in Wkg.Cap. (197) 278 (48) (35) ROCE (%) 13.4 14.4 15.2 16.6 Other Operating CF (52) (343) (452) (326) Div Payout Ratio (%) 31.6 38.1 37.1 37.1 Net Operating CF 320 668 382 677 Net Interest Cover (x) 27.9 30.1 42.5 43.8 Capital Exp.(net) (200) (200) (350) (100) Asset Turnover (x) 0.5 0.6 0.6 0.7 Other Invts.(net) 0 0 0 0 Debtors Turn (avg days) 206.1 186.4 164.1 160.0 Invts in Assoc. & JV 0 0 0 0 Creditors Turn (avg days) 276.3 256.7 255.2 249.3 Div from Assoc & JV 0 0 0 0 Inventory Turn (avg days) 66.5 62.7 65.0 59.6 Other Investing CF (50) 0 0 0 Current Ratio (x) 1.7 2.1 2.1 2.2 Net Investing CF (250) (200) (350) (100) Quick Ratio (x) 1.1 1.3 1.2 1.2 Div Paid (155) (158) (349) (417) Net Debt/Equity (X) 0.1 CASH CASH CASH Chg in Gross Debt 124 (150) (73) 0 Capex to Debt (%) 26.6 33.3 66.4 19.0 Capital Issues 0 645 0 0 Z-Score (X) 3.6 3.7 3.7 3.7 Other Financing CF (264) (24) (20) (24) N.Cash/(Debt)PS (RMB) (0.55) 0.62 0.21 0.37 Net Financing CF (294) 313 (443) (440) Opg CFPS (RMB) 0.55 0.39 0.42 0.70 Currency Adjustments (1) 0 0 0 Free CFPS (RMB) 0.13 0.47 0.03 0.57 Chg in Cash (226) 781 (411) 136
Interim Income Statement (RMB m) Segmental Breakdown (RMB m) / Key Assumptions
FY Dec 2H2013 1H2014 2H2014 1H2015 FY Dec 2014A 2015F 2016F 2017F Turnover 1,265 1,367 1,445 1,603 Revenues (RMB m) Cost of Goods Sold (798) (911) (938) (1,106) Smart meter 825 989 1,138 1,308 Gross Profit 467 456 506 497 Advanced metering infrastructure 1,677 2,012 2,375 2,802 Other Oper. (Exp)/Inc (194) (215) (177) (194) Advanced distribution operations 310 652 847 1,102 Operating Profit 273 241 330 304 Total 2,812 3,654 4,360 5,212 Other Non Opg (Exp)/Inc 0 0 0 0 Associates & JV Inc (6) (1) (3) (2) Net Interest (Exp)/Inc (17) (9) (16) (11) Segmental results (RMB m) Exceptional Gain/(Loss) 0 0 0 0 Smart meter 71 88 102 119 Pre-tax Profit 250 231 311 291 Advanced metering infrastructure 419 453 537 636 Tax (16) (25) (31) (38) Advanced distribution operations 50 114 161 212 Minority Interest 0 (3) (1) 2 Total 541 655 800 967 Net Profit 234 203 280 254 Net profit bef Except. 234 203 280 254 Segmental results Margins (%) Smart meter 8.7 8.9 9.0 9.1 Advanced metering infrastructure 25.0 22.5 22.6 22.7 Sales Gth (%) (6.6) 19.1 14.2 17.3 Advanced distribution operations 16.0 17.5 19.0 19.2 Opg Profit Gth (%) 15.4 19.6 20.9 25.7 Total 19.2 17.9 18.4 18.5 Net Profit Gth (%) 19.4 21.0 19.7 25.1 Key Assumptions Gross Margins (%) 36.9 33.4 35.0 31.0 State Grid sales percentage (%) 65.0 59.0 55.9 51.4 Opg Profit Margins (%) 21.6 17.7 22.8 18.9 Southern Grid sales percentage (%) 10.0 9.1 8.6 7.9 Net Profit Margins (%) 18.5 14.8 19.4 15.8 Non power grid sales percentage (%) 20.0 19.2 19.3 19.1 Overseas sales percentage (%) 5.0 12.6 16.2 21.6 Source: Company, DBS Vickers

www.dbsvickers.com
ed-TH/ sa- PY
BUY
Last Traded Price: HK$3.21 (HSI : 22,640) Price Target: HK$3.80 (18% upside) Potential Catalyst: Stronger growth in cloud revenue & profitability Where we differ: We expect narrowing valuation discount to its A-share major peer Yonyou Analyst Tsz Wang TAM CFA, +852 2971 1772 [email protected] Chris KO [email protected] Price Relative
23
43
63
83
103
123
143
163
183
203
0.8
1.8
2.8
3.8
4.8
5.8
6.8
Oct-11 Oct-12 Oct-13 Oct-14 Oct-15
Relative IndexHK$
Kingdee (LHS) Relative HSI INDEX (RHS)
Forecasts and Valuation FY Dec (RMB m) 2014A 2015F 2016F 2017F Turnover 1,547 1,620 1,799 2,015 EBITDA 575 589 669 755 Pre-tax Profit 226 274 361 431 Net Profit 197 234 308 367 Net Pft (Pre Ex) 197 234 308 367 EPS (RMB) 0.08 0.08 0.11 0.13 EPS (HK$) 0.09 0.10 0.13 0.15 EPS Gth (%) 53.7 5.6 30.5 18.1 Diluted EPS (HK$) 0.09 0.10 0.12 0.15 DPS (HK$) 0.01 0.01 0.02 0.02 BV Per Share (HK$) 0.95 1.49 1.59 1.71 PE (X) 34.0 32.2 24.7 20.9 P/Cash Flow (X) 13.2 15.9 13.6 12.1 P/Free CF (X) 15.3 16.6 14.1 12.5 EV/EBITDA (X) 12.2 10.6 9.0 7.7 Net Div Yield (%) 0.4 0.5 0.6 0.7 P/Book Value (X) 3.4 2.1 2.0 1.9 Net Debt/Equity (X) 0.1 CASH CASH CASH ROAE (%) 10.5 8.5 8.4 9.3 Earnings Rev (%): - - - Consensus EPS (RMB) 0.09 0.12 0.15 Other Broker Recs: B: 8 S: 0 H: 1
ICB Industry: Technology ICB Sector: Software & Computer Services Principal Business: Kingdee is the second largest Chinese provider of ERP software in China with a focus on small and medium enterprises Source of all data: Company, DBSV, Thomson Reuters, HKEX
Internet of things supporting ERP and cloud business growth
ERP and cloud solutions are part of the IoT value chain
Starting co-operations with JD.com and SF Express
Expect cloud business to grow at 70% CAGR from FY15-17F and account for 30% of the total revenue in FY17F
Maintain BUY with TP of HK$3.8 Co-operations with e-commerce and logistics giants. JD.com invested HK$1.3bn for a 10% stake in Kingdee at HK$4.6 per share on 26 May 2015. The companies also reached a strategic partnership agreement; the co-operations encourage JD.com’s suppliers to adopt Kingdee’s ERP products and cloud solutions. Meanwhile, Kingdee and SF Express also jointly launched “SF-Express E-commerce Solution” which integrates Kingdee’s newly launched KIS flagship product and SF Express’s warehousing and smart logistics business. This allows Kingdee to reach more potential customers and create more value-added services to the e-commerce merchandisers who are also using SF Express.
Cloud business as the growth engine. Cloud business currently accounts for 7% of the total revenue in FY14. Having a growth rate of 86% for cloud business in FY14, we forecast it to grow at a CAGR of 70% from FY15-17F. Management expects this segment to account for 30% of the revenue by FY17F. We believe that the company has the first-mover advantage in China, being one of the earliest companies to develop cloud-based ERP products including mobile office cloud, finance cloud, ERP cloud and Express data cloud.
Maintain BUY, with TP of HK$3.8. We are positive on Kingdee’s outlook, supported by the increasing need for ERP deployment with more e-commerce activities and the fast-growing cloud business. We forecast the earnings to grow at a CAGR of 23% from FY15-17F mainly driven by cloud business. We maintain our BUY call with a TP of HK$3.8, based on a 30x FY16F PE ratio which is pegged to historical average PE of its A-share major peer Yonyou (600588 SS).
At A Glance Issued Capital (m shrs) 2,913 Mkt. Cap (HK$m/US$m) 9,351 / 1,206
Major Shareholders Xu Shao Chun (%) 26.9 JD.com (%) 10.0 Credit Suisse Group AG (%) 8.4 FMR LLC (%) 8.1 FIL Limited (%) 5.1
Free Float (%) 73.1 3m Avg. Daily Val. (US$m) 13.0
DBS Group Research . Equity 2 Nov 2015
China / Hong Kong Industry Focus
Kingdee Bloomberg: 268 HK Equity | Reuters: 0268.HK
Refer to important disclosures at the end of this report

Industry Focus
Kingdee
Page 45
INVESTMENT THESIS
Profile Rationale
Kingdee is the second largest Chinese provider of ERP software in China with a focus on small and medium enterprises.
Continuous upside for ERP software and cloud business in China. The enterprise resource planning (ERP) industry is expected to grow by double digits each year, driven by the increasing penetration or adoption in China. This is also supported by more ERP applications for e-commerce activities in China.
Kingdee will accelerate cloud and mobile application developments on top of its traditional ERP products.
We expect benefits from operating leverage to flow through, resulting in margin expansion over the next two to three years.
Valuation Risks
We have a BUY recommendation on the stock based on 30x FY16F price-to-earnings ratio.
Cyclical uncertainties. Product demand slows down due to poor economic growth.
Source: DBS Vickers
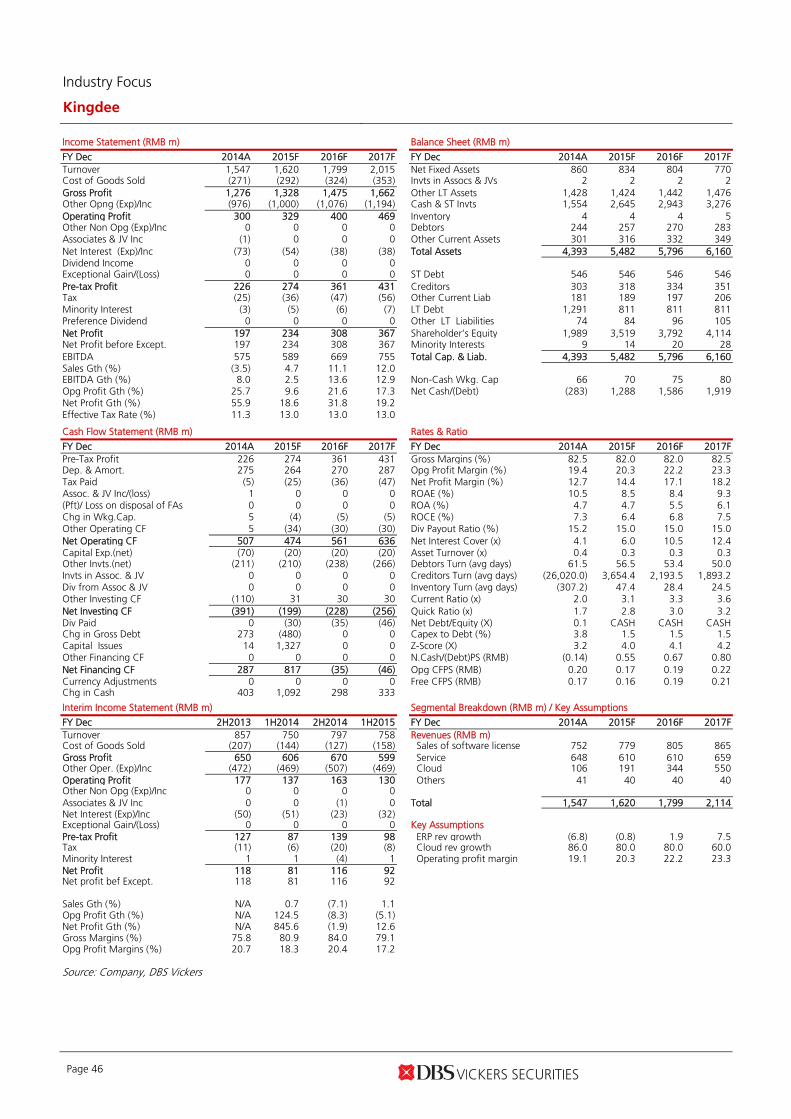
Industry Focus
Kingdee
Page 46
Income Statement (RMB m) Balance Sheet (RMB m)
FY Dec 2014A 2015F 2016F 2017F FY Dec 2014A 2015F 2016F 2017F Turnover 1,547 1,620 1,799 2,015 Net Fixed Assets 860 834 804 770 Cost of Goods Sold (271) (292) (324) (353) Invts in Assocs & JVs 2 2 2 2 Gross Profit 1,276 1,328 1,475 1,662 Other LT Assets 1,428 1,424 1,442 1,476 Other Opng (Exp)/Inc (976) (1,000) (1,076) (1,194) Cash & ST Invts 1,554 2,645 2,943 3,276 Operating Profit 300 329 400 469 Inventory 4 4 4 5 Other Non Opg (Exp)/Inc 0 0 0 0 Debtors 244 257 270 283 Associates & JV Inc (1) 0 0 0 Other Current Assets 301 316 332 349 Net Interest (Exp)/Inc (73) (54) (38) (38) Total Assets 4,393 5,482 5,796 6,160 Dividend Income 0 0 0 0 Exceptional Gain/(Loss) 0 0 0 0 ST Debt 546 546 546 546 Pre-tax Profit 226 274 361 431 Creditors 303 318 334 351 Tax (25) (36) (47) (56) Other Current Liab 181 189 197 206 Minority Interest (3) (5) (6) (7) LT Debt 1,291 811 811 811 Preference Dividend 0 0 0 0 Other LT Liabilities 74 84 96 105 Net Profit 197 234 308 367 Shareholder’s Equity 1,989 3,519 3,792 4,114 Net Profit before Except. 197 234 308 367 Minority Interests 9 14 20 28 EBITDA 575 589 669 755 Total Cap. & Liab. 4,393 5,482 5,796 6,160 Sales Gth (%) (3.5) 4.7 11.1 12.0 EBITDA Gth (%) 8.0 2.5 13.6 12.9 Non-Cash Wkg. Cap 66 70 75 80 Opg Profit Gth (%) 25.7 9.6 21.6 17.3 Net Cash/(Debt) (283) 1,288 1,586 1,919 Net Profit Gth (%) 55.9 18.6 31.8 19.2 Effective Tax Rate (%) 11.3 13.0 13.0 13.0 Cash Flow Statement (RMB m) Rates & Ratio
FY Dec 2014A 2015F 2016F 2017F FY Dec 2014A 2015F 2016F 2017F Pre-Tax Profit 226 274 361 431 Gross Margins (%) 82.5 82.0 82.0 82.5 Dep. & Amort. 275 264 270 287 Opg Profit Margin (%) 19.4 20.3 22.2 23.3 Tax Paid (5) (25) (36) (47) Net Profit Margin (%) 12.7 14.4 17.1 18.2 Assoc. & JV Inc/(loss) 1 0 0 0 ROAE (%) 10.5 8.5 8.4 9.3 (Pft)/ Loss on disposal of FAs 0 0 0 0 ROA (%) 4.7 4.7 5.5 6.1 Chg in Wkg.Cap. 5 (4) (5) (5) ROCE (%) 7.3 6.4 6.8 7.5 Other Operating CF 5 (34) (30) (30) Div Payout Ratio (%) 15.2 15.0 15.0 15.0 Net Operating CF 507 474 561 636 Net Interest Cover (x) 4.1 6.0 10.5 12.4 Capital Exp.(net) (70) (20) (20) (20) Asset Turnover (x) 0.4 0.3 0.3 0.3 Other Invts.(net) (211) (210) (238) (266) Debtors Turn (avg days) 61.5 56.5 53.4 50.0 Invts in Assoc. & JV 0 0 0 0 Creditors Turn (avg days) (26,020.0) 3,654.4 2,193.5 1,893.2 Div from Assoc & JV 0 0 0 0 Inventory Turn (avg days) (307.2) 47.4 28.4 24.5 Other Investing CF (110) 31 30 30 Current Ratio (x) 2.0 3.1 3.3 3.6 Net Investing CF (391) (199) (228) (256) Quick Ratio (x) 1.7 2.8 3.0 3.2 Div Paid 0 (30) (35) (46) Net Debt/Equity (X) 0.1 CASH CASH CASH Chg in Gross Debt 273 (480) 0 0 Capex to Debt (%) 3.8 1.5 1.5 1.5 Capital Issues 14 1,327 0 0 Z-Score (X) 3.2 4.0 4.1 4.2 Other Financing CF 0 0 0 0 N.Cash/(Debt)PS (RMB) (0.14) 0.55 0.67 0.80 Net Financing CF 287 817 (35) (46) Opg CFPS (RMB) 0.20 0.17 0.19 0.22 Currency Adjustments 0 0 0 0 Free CFPS (RMB) 0.17 0.16 0.19 0.21 Chg in Cash 403 1,092 298 333
Interim Income Statement (RMB m) Segmental Breakdown (RMB m) / Key Assumptions
FY Dec 2H2013 1H2014 2H2014 1H2015 FY Dec 2014A 2015F 2016F 2017F Turnover 857 750 797 758 Revenues (RMB m) Cost of Goods Sold (207) (144) (127) (158) Sales of software license 752 779 805 865 Gross Profit 650 606 670 599 Service 648 610 610 659 Other Oper. (Exp)/Inc (472) (469) (507) (469) Cloud 106 191 344 550 Operating Profit 177 137 163 130 Others 41 40 40 40 Other Non Opg (Exp)/Inc 0 0 0 0 Associates & JV Inc 0 0 (1) 0 Total 1,547 1,620 1,799 2,114 Net Interest (Exp)/Inc (50) (51) (23) (32) Exceptional Gain/(Loss) 0 0 0 0 Key Assumptions Pre-tax Profit 127 87 139 98 ERP rev growth (6.8) (0.8) 1.9 7.5 Tax (11) (6) (20) (8) Cloud rev growth 86.0 80.0 80.0 60.0 Minority Interest 1 1 (4) 1 Operating profit margin 19.1 20.3 22.2 23.3 Net Profit 118 81 116 92 Net profit bef Except. 118 81 116 92 Sales Gth (%) N/A 0.7 (7.1) 1.1 Opg Profit Gth (%) N/A 124.5 (8.3) (5.1) Net Profit Gth (%) N/A 845.6 (1.9) 12.6 Gross Margins (%) 75.8 80.9 84.0 79.1 Opg Profit Margins (%) 20.7 18.3 20.4 17.2 Source: Company, DBS Vickers

www.dbsvickers.com
ed-TH/ sa-PY
H: BUY
Last Traded Price (H): HK$18.74 (HSI : 22,640) Price Target (H): HK$24.00 (28% upside)
A: HOLD (under review) Last Traded Price (A): RMB17.85 (CSI300 Index : 3,534) Price Target (A): RMB24.00 (34% upside) Potential Catalyst: Capex hike and margin expansion Where we differ: Our FY15 earnings are slighly higher than concensus Analyst Tsz Wang TAM CFA, +852 2971 1772 [email protected]
Price Relative
39
59
79
99
119
139
159
179
199
219
7.0
12.0
17.0
22.0
27.0
Oct-11 Oct-12 Oct-13 Oct-14 Oct-15
Relative IndexHK$
ZTE (LHS) Relative HSI INDEX (RHS)
49
69
89
109
129
149
169
189
209
6.9
8.9
10.9
12.9
14.9
16.9
18.9
20.9
22.9
24.9
Oct-11 Oct-12 Oct-13 Oct-14 Oct-15
Relative IndexRMB
ZTE-A (LHS) Relative SHSZ300 Index (RHS)
Forecasts and Valuation (H Shares) FY Dec (RMB m) 2013A 2014A 2015F 2016F Turnover 75,234 81,471 92,511 101,216 EBITDA 4,846 6,469 7,629 8,642 Pre-tax Profit 1,828 3,538 4,568 5,188 Net Profit 1,358 2,634 3,435 3,901 Net Pft (Pre Ex) 1,358 2,634 3,435 3,901 EPS (RMB) 0.33 0.64 0.83 0.95 EPS (HK$) 0.40 0.78 1.02 1.16 EPS Gth (%) N/A 94.0 30.4 13.6 Diluted EPS (HK$) 0.40 0.78 1.02 1.16 DPS (HK$) 0.03 0.20 0.26 0.29 BV Per Share (HK$) 6.70 7.40 8.22 9.12 PE (X) 46.4 23.9 18.3 16.1 P/Cash Flow (X) 141.0 57.2 34.9 31.2 P/Free CF (X) nm 1196.3 248.0 133.7 EV/EBITDA (X) 15.6 12.1 10.5 9.5 Net Div Yield (%) 0.2 1.1 1.4 1.5 P/Book Value (X) 2.8 2.5 2.3 2.1 Net Debt/Equity (X) 0.5 0.5 0.5 0.5 ROAE (%) 6.2 11.1 13.1 13.4
Earnings Rev (%): -l - Consensus EPS (RMB) 0.84 0.97 Other Broker Recs: B: 18 S: 1 H: 3
ICB Industry: Technology ICB Sector: Technology Hardware & Equipment Principal Business: ZTE is a leading telecom equipment vendor in China.
Source of all data: Company, DBSV, Thomson Reuters, HKEX
Government and enterprise solution an additional long-term growth driver Expanding into government and enterprise segments
Carriers’ network equipment a near-term driver supported by domestic 4G capex
Expecting 30% and 14% earnings growth for the coming two years
Maintain BUY on ZTE (H-share) Expanding into government and enterprise business. ZTE is expanding its customer base and business scope from telecom operators to government and enterprise segments (with an estimated revenue of Rmb8bn in FY14). This involves smart city projects and IT system projects, such as security and surveillance systems, etc. The business is riding on IoT development in China. The sales is categorised under telecom software systems, services and other products, which registered a 36% y-o-y growth and accounted for 16% of revenue in 1H15.
Carriers’ network equipment a near-term driver. Carriers’ network equipment remains a key growth driver for ZTE in the near term, thanks to operators’ investments in FD-LTE and TD-LTE 4G networks. ZTE is a key beneficiary of the 4G capex cycle. Segmental revenue grew by 31% y-o-y in 1H15, contributing 62% to total revenue. Tower sharing actually saves down capex from tower construction, but shifts the network spending to active networking equipment procurement, which is favourable to ZTE.
Maintain BUY on ZTE (H) with TP of HK$24.0. We forecast 30% and 14% net profit growth for FY15 and FY16 respectively. Medium-term outlook remains positive. Maintain BUY on ZTE (H-share) at HK$24.0, or 20x FY16 PE, representing 1SD above its historical average, justified by its strong earnings recovery in the next two years. Our HOLD rating on ZTE (A-share) is under review.
At A Glance Issued Capital - H shares (m shs) 756 - Non H shrs (m shs) 3,370 H shs as a % of Total 18 Total Mkt. Cap (HK$m/US$m) 77,303 / 9,972 Major Shareholders
Zhongxingxin (%) 30.8 Major H Shareholders (%)
BlackRock, Inc. (%) 6.2 JPMorgan Chase & Co. (%) 6.0
H Shares-Free Float (%) 100.0 3m Avg. Daily Val. (US$m) 11.5
DBS Group Research . Equity 2 Nov 2015
China / Hong Kong Industry Focus
ZTE
Bloomberg: 763 HK EQUITY | 000063 CH Equity | Reuters: 0763.HK | 000063.SZ
Refer to important disclosures at the end of this report

Industry Focus
ZTE
Page 48
INVESTMENT THESIS
Profile Rationale
ZTE is a Chinese manufacturer of core telecom network equipment as well as mobile phones.
Benefitting from 4G network spending cycle
ZTE can benefit from the 4G network spending cycle. The relevant revenue accounts for 50%+ of its total revenue.
Current valuation below historical average
Current valuation has not reflected the earnings recovery in the next 2-3 years.
Valuation Risks
We rate ZTE as a BUY based on the growth potential from operators' 4G network spending. Our target price is based on 20x price-earnings ratio.
Cut in 2G/3G spending
Downside risk: telecom operators scaling down 2G/3G spending.
Weak handset demand
Weak handset demand and accordingly margin pressure in the absence of flagship products.
Source: DBS Vickers
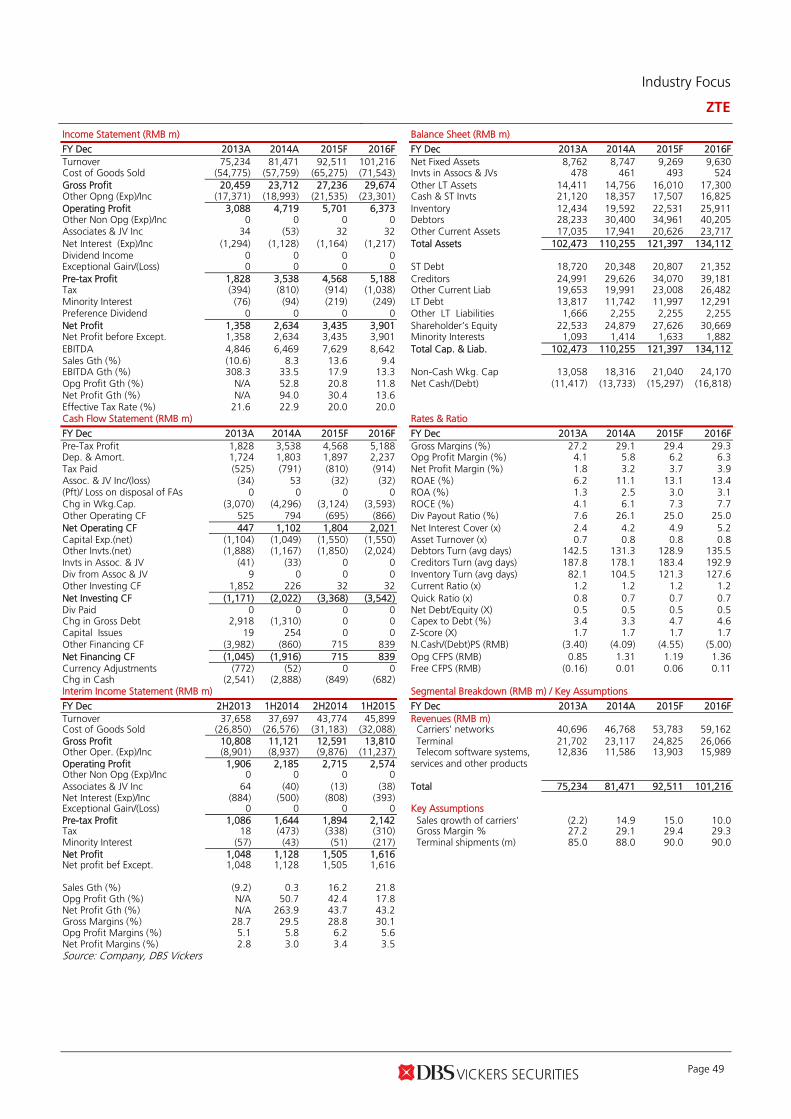
Industry Focus
ZTE
Page 49
Income Statement (RMB m) Balance Sheet (RMB m)
FY Dec 2013A 2014A 2015F 2016F FY Dec 2013A 2014A 2015F 2016F Turnover 75,234 81,471 92,511 101,216 Net Fixed Assets 8,762 8,747 9,269 9,630 Cost of Goods Sold (54,775) (57,759) (65,275) (71,543) Invts in Assocs & JVs 478 461 493 524 Gross Profit 20,459 23,712 27,236 29,674 Other LT Assets 14,411 14,756 16,010 17,300 Other Opng (Exp)/Inc (17,371) (18,993) (21,535) (23,301) Cash & ST Invts 21,120 18,357 17,507 16,825 Operating Profit 3,088 4,719 5,701 6,373 Inventory 12,434 19,592 22,531 25,911 Other Non Opg (Exp)/Inc 0 0 0 0 Debtors 28,233 30,400 34,961 40,205 Associates & JV Inc 34 (53) 32 32 Other Current Assets 17,035 17,941 20,626 23,717 Net Interest (Exp)/Inc (1,294) (1,128) (1,164) (1,217) Total Assets 102,473 110,255 121,397 134,112 Dividend Income 0 0 0 0 Exceptional Gain/(Loss) 0 0 0 0 ST Debt 18,720 20,348 20,807 21,352 Pre-tax Profit 1,828 3,538 4,568 5,188 Creditors 24,991 29,626 34,070 39,181 Tax (394) (810) (914) (1,038) Other Current Liab 19,653 19,991 23,008 26,482 Minority Interest (76) (94) (219) (249) LT Debt 13,817 11,742 11,997 12,291 Preference Dividend 0 0 0 0 Other LT Liabilities 1,666 2,255 2,255 2,255 Net Profit 1,358 2,634 3,435 3,901 Shareholder’s Equity 22,533 24,879 27,626 30,669 Net Profit before Except. 1,358 2,634 3,435 3,901 Minority Interests 1,093 1,414 1,633 1,882 EBITDA 4,846 6,469 7,629 8,642 Total Cap. & Liab. 102,473 110,255 121,397 134,112 Sales Gth (%) (10.6) 8.3 13.6 9.4 EBITDA Gth (%) 308.3 33.5 17.9 13.3 Non-Cash Wkg. Cap 13,058 18,316 21,040 24,170 Opg Profit Gth (%) N/A 52.8 20.8 11.8 Net Cash/(Debt) (11,417) (13,733) (15,297) (16,818) Net Profit Gth (%) N/A 94.0 30.4 13.6 Effective Tax Rate (%) 21.6 22.9 20.0 20.0 Cash Flow Statement (RMB m) Rates & Ratio
FY Dec 2013A 2014A 2015F 2016F FY Dec 2013A 2014A 2015F 2016F Pre-Tax Profit 1,828 3,538 4,568 5,188 Gross Margins (%) 27.2 29.1 29.4 29.3 Dep. & Amort. 1,724 1,803 1,897 2,237 Opg Profit Margin (%) 4.1 5.8 6.2 6.3 Tax Paid (525) (791) (810) (914) Net Profit Margin (%) 1.8 3.2 3.7 3.9 Assoc. & JV Inc/(loss) (34) 53 (32) (32) ROAE (%) 6.2 11.1 13.1 13.4 (Pft)/ Loss on disposal of FAs 0 0 0 0 ROA (%) 1.3 2.5 3.0 3.1 Chg in Wkg.Cap. (3,070) (4,296) (3,124) (3,593) ROCE (%) 4.1 6.1 7.3 7.7 Other Operating CF 525 794 (695) (866) Div Payout Ratio (%) 7.6 26.1 25.0 25.0 Net Operating CF 447 1,102 1,804 2,021 Net Interest Cover (x) 2.4 4.2 4.9 5.2 Capital Exp.(net) (1,104) (1,049) (1,550) (1,550) Asset Turnover (x) 0.7 0.8 0.8 0.8 Other Invts.(net) (1,888) (1,167) (1,850) (2,024) Debtors Turn (avg days) 142.5 131.3 128.9 135.5 Invts in Assoc. & JV (41) (33) 0 0 Creditors Turn (avg days) 187.8 178.1 183.4 192.9 Div from Assoc & JV 9 0 0 0 Inventory Turn (avg days) 82.1 104.5 121.3 127.6 Other Investing CF 1,852 226 32 32 Current Ratio (x) 1.2 1.2 1.2 1.2 Net Investing CF (1,171) (2,022) (3,368) (3,542) Quick Ratio (x) 0.8 0.7 0.7 0.7 Div Paid 0 0 0 0 Net Debt/Equity (X) 0.5 0.5 0.5 0.5 Chg in Gross Debt 2,918 (1,310) 0 0 Capex to Debt (%) 3.4 3.3 4.7 4.6 Capital Issues 19 254 0 0 Z-Score (X) 1.7 1.7 1.7 1.7 Other Financing CF (3,982) (860) 715 839 N.Cash/(Debt)PS (RMB) (3.40) (4.09) (4.55) (5.00) Net Financing CF (1,045) (1,916) 715 839 Opg CFPS (RMB) 0.85 1.31 1.19 1.36 Currency Adjustments (772) (52) 0 0 Free CFPS (RMB) (0.16) 0.01 0.06 0.11 Chg in Cash (2,541) (2,888) (849) (682) Interim Income Statement (RMB m) Segmental Breakdown (RMB m) / Key Assumptions
FY Dec 2H2013 1H2014 2H2014 1H2015 FY Dec 2013A 2014A 2015F 2016F Turnover 37,658 37,697 43,774 45,899 Revenues (RMB m) Cost of Goods Sold (26,850) (26,576) (31,183) (32,088) Carriers' networks 40,696 46,768 53,783 59,162 Gross Profit 10,808 11,121 12,591 13,810 Terminal 21,702 23,117 24,825 26,066 Other Oper. (Exp)/Inc (8,901) (8,937) (9,876) (11,237) Telecom software systems,
services and other products 12,836 11,586 13,903 15,989
Operating Profit 1,906 2,185 2,715 2,574 Other Non Opg (Exp)/Inc 0 0 0 0 Associates & JV Inc 64 (40) (13) (38) Total 75,234 81,471 92,511 101,216 Net Interest (Exp)/Inc (884) (500) (808) (393) Exceptional Gain/(Loss) 0 0 0 0 Key Assumptions Pre-tax Profit 1,086 1,644 1,894 2,142 Sales growth of carriers' (2.2) 14.9 15.0 10.0 Tax 18 (473) (338) (310) Gross Margin % 27.2 29.1 29.4 29.3 Minority Interest (57) (43) (51) (217) Terminal shipments (m) 85.0 88.0 90.0 90.0 Net Profit 1,048 1,128 1,505 1,616 Net profit bef Except. 1,048 1,128 1,505 1,616 Sales Gth (%) (9.2) 0.3 16.2 21.8 Opg Profit Gth (%) N/A 50.7 42.4 17.8 Net Profit Gth (%) N/A 263.9 43.7 43.2 Gross Margins (%) 28.7 29.5 28.8 30.1 Opg Profit Margins (%) 5.1 5.8 6.2 5.6 Net Profit Margins (%) 2.8 3.0 3.4 3.5 Source: Company, DBS Vickers

Regional Industry Focus
Internet of Things & Smart Cities
Page 50
DBS Bank recommendations are based an Absolute Total Return* Rating system, defined as follows:
STRONG BUY (>20% total return over the next 3 months, with identifiable share price catalysts within this time frame)
BUY (>15% total return over the next 12 months for small caps, >10% for large caps)
HOLD (-10% to +15% total return over the next 12 months for small caps, -10% to +10% for large caps)
FULLY VALUED (negative total return i.e. > -10% over the next 12 months)
SELL (negative total return of > -20% over the next 3 months, with identifiable catalysts within this time frame)
Share price appreciation + dividends GENERAL DISCLOSURE/DISCLAIMER This report is prepared by DBS Bank Ltd. This report is solely intended for the clients of DBS Bank Ltd and DBS Vickers Securities (Singapore) Pte Ltd, its respective connected and associated corporations and affiliates (collectively, the “DBS Vickers Group”) only and no part of this document may be (i) copied, photocopied or duplicated in any form or by any means or (ii) redistributed without the prior written consent of DBS Bank Ltd. The research set out in this report is based on information obtained from sources believed to be reliable, but we (which collectively refers to DBS Bank Ltd., its respective connected and associated corporations, affiliates and their respective directors, officers, employees and agents (collectively, the “DBS Group”)) do not make any representation or warranty as to its accuracy, completeness or correctness. Opinions expressed are subject to change without notice. This document is prepared for general circulation. Any recommendation contained in this document does not have regard to the specific investment objectives, financial situation and the particular needs of any specific addressee. This document is for the information of addressees only and is not to be taken in substitution for the exercise of judgement by addressees, who should obtain separate independent legal or financial advice. The DBS Group accepts no liability whatsoever for any direct, indirect and/or consequential loss (including any claims for loss of profit) arising from any use of and/or reliance upon this document and/or further communication given in relation to this document. This document is not to be construed as an offer or a solicitation of an offer to buy or sell any securities. The DBS Group, along with its affiliates and/or persons associated with any of them may from time to time have interests in the securities mentioned in this document. The DBS Group may have positions in, and may effect transactions in securities mentioned herein and may also perform or seek to perform broking, investment banking and other banking services for these companies. Any valuations, opinions, estimates, forecasts, ratings or risk assessments herein constitutes a judgment as of the date of this report, and there can be no assurance that future results or events will be consistent with any such valuations, opinions, estimates, forecasts, ratings or risk assessments. The information in this document is subject to change without notice, its accuracy is not guaranteed, it may be incomplete or condensed and it may not contain all material information concerning the company (or companies) referred to in this report. The valuations, opinions, estimates, forecasts, ratings or risk assessments described in this report were based upon a number of estimates and assumptions and are inherently subject to significant uncertainties and contingencies. It can be expected that one or more of the estimates on which the valuations, opinions, estimates, forecasts, ratings or risk assessments were based will not materialize or will vary significantly from actual results. Therefore, the inclusion of the valuations, opinions, estimates, forecasts, ratings or risk assessments described herein IS NOT TO BE RELIED UPON as a representation and/or warranty by the DBS Group (and/or any persons associated with the aforesaid entities), that: (a) such valuations, opinions, estimates, forecasts, ratings or risk assessments or their underlying assumptions will be achieved, and (b) there is any assurance that future results or events will be consistent with any such valuations, opinions, estimates, forecasts, ratings or risk
assessments stated therein. Any assumptions made in this report that refers to commodities, are for the purposes of making forecasts for the company (or companies) mentioned herein. They are not to be construed as recommendations to trade in the physical commodity or in the futures contract relating to the commodity referred to in this report. DBS Vickers Securities (USA) Inc ("DBSVUSA")"), a U.S.-registered broker-dealer, does not have its own investment banking or research department, nor has it participated in any investment banking transaction as a manager or co-manager in the past twelve months. ANALYST CERTIFICATION The research analyst primarily responsible for the content of this research report, in part or in whole, certifies that the views about the companies and their securities expressed in this report accurately reflect his/her personal views. The analyst also certifies that no part of his/her compensation was, is, or will be, directly, or indirectly, related to specific recommendations or views expressed in this report. As of the date the report is published, the analyst and his/her spouse and/or relatives who are financially dependent on the analyst, do not hold interests in the securities recommended in this report (“interest” includes direct or indirect ownership of securities). COMPANY-SPECIFIC / REGULATORY DISCLOSURES
1. DBS Bank Ltd., DBS Vickers Securities (Singapore) Pte Ltd (“DBSVS”), their subsidiaries and/or other affiliates do not have a proprietary position in the securities recommended in this report as of 30 Sep 2015 except ST Engineering, Keppel DC REIT, ZTE
2. DBS Bank Ltd., DBSVS, DBSVUSA, their subsidiaries and/or other affiliates beneficially own a total of 1% of any class of common equity securities of Keppel DC REIT as of 30 Sep 2015.
3.
Compensation for investment banking services: DBS Bank Ltd., DBSVS, DBSVUSA, their subsidiaries and/or other affiliates have received compensation, within the past 12 months, and within the next 3 months may receive or intends to seek compensation for investment banking services from Keppel DC REIT.

Regional Industry Focus
Internet of Things & Smart Cities
Page 51
DBSVUSA does not have its own investment banking or research department, nor has it participated in any investment banking transaction as a manager or co-manager in the past twelve months. Any US persons wishing to obtain further information, including any clarification on disclosures in this disclaimer, or to effect a transaction in any security discussed in this document should contact DBSVUSA exclusively.
RESTRICTIONS ON DISTRIBUTION General This report is not directed to, or intended for distribution to or use by, any person or entity who is a citizen or resident of or
located in any locality, state, country or other jurisdiction where such distribution, publication, availability or use would be contrary to law or regulation.
Australia This report is being distributed in Australia by DBS Bank Ltd. (“DBS”) or DBS Vickers Securities (Singapore) Pte Ltd (“DBSVS”), both of which are exempted from the requirement to hold an Australian Financial Services Licence under the Corporation Act 2001 (“CA”) in respect of financial services provided to the recipients. Both DBS and DBSVS are regulated by the Monetary Authority of Singapore under the laws of Singapore, which differ from Australian laws. Distribution of this report is intended only for “wholesale investors” within the meaning of the CA.
Hong Kong This report is being distributed in Hong Kong by DBS Vickers (Hong Kong) Limited which is licensed and regulated by the Hong Kong Securities and Futures Commission.
Indonesia This report is being distributed in Indonesia by PT DBS Vickers Securities Indonesia.
Malaysia This report is distributed in Malaysia by AllianceDBS Research Sdn Bhd ("ADBSR"). Recipients of this report, received from ADBSR are to contact the undersigned at 603-2604 3333 in respect of any matters arising from or in connection with this report. In addition to the General Disclosure/Disclaimer found at the preceding page, recipients of this report are advised that ADBSR (the preparer of this report), its holding company Alliance Investment Bank Berhad, their respective connected and associated corporations, affiliates, their directors, officers, employees, agents and parties related or associated with any of them may have positions in, and may effect transactions in the securities mentioned herein and may also perform or seek to perform broking, investment banking/corporate advisory and other services for the subject companies. They may also have received compensation and/or seek to obtain compensation for broking, investment banking/corporate advisory and other services from the subject companies.
Wong Ming Tek, Executive Director, ADBSR
Singapore This report is distributed in Singapore by DBS Bank Ltd (Company Regn. No. 196800306E) or DBSVS (Company Regn No. 198600294G), both of which are Exempt Financial Advisers as defined in the Financial Advisers Act and regulated by the Monetary Authority of Singapore. DBS Bank Ltd and/or DBSVS, may distribute reports produced by its respective foreign entities, affiliates or other foreign research houses pursuant to an arrangement under Regulation 32C of the Financial Advisers Regulations. Where the report is distributed in Singapore to a person who is not an Accredited Investor, Expert Investor or an Institutional Investor, DBS Bank Ltd accepts legal responsibility for the contents of the report to such persons only to the extent required by law. Singapore recipients should contact DBS Bank Ltd at 6327 2288 for matters arising from, or in connection with the report.
Thailand This report is being distributed in Thailand by DBS Vickers Securities (Thailand) Co Ltd. Research reports distributed are only intended for institutional clients only and no other person may act upon it.
United Kingdom
This report is being distributed in the UK by DBS Vickers Securities (UK) Ltd, who is an authorised person in the meaning of the Financial Services and Markets Act and is regulated by The Financial Conduct Authority. Research distributed in the UK is intended only for institutional clients.
Dubai
This research report is being distributed in The Dubai International Financial Centre (“DIFC”) by DBS Bank Ltd., (DIFC Branch) having its office at PO Box 506538, 3rd Floor, Building 3, East Wing, Gate Precinct, Dubai International Financial Centre (DIFC), Dubai, United Arab Emirates. DBS Bank Ltd., (DIFC Branch) is regulated by The Dubai Financial Services Authority. This research report is intended only for professional clients (as defined in the DFSA rulebook) and no other person may act upon it.
United States
Neither this report nor any copy hereof may be taken or distributed into the United States or to any U.S. person except in compliance with any applicable U.S. laws and regulations. It is being distributed in the United States by DBSVUSA, which accepts responsibility for its contents. Any U.S. person receiving this report who wishes to effect transactions in any securities referred to herein should contact DBSVUSA directly and not its affiliate.
Other jurisdictions
In any other jurisdictions, except if otherwise restricted by laws or regulations, this report is intended only for qualified, professional, institutional or sophisticated investors as defined in the laws and regulations of such jurisdictions.
DBS Bank Ltd.
12 Marina Boulevard, Marina Bay Financial Centre Tower 3 Singapore 018982 Tel. 65-6878 8888
Company Regn. No. 196800306E