Embed Size (px)
Citation preview

INTERNET & DIGITAL MEDIA SECTOR REPORT
Q2 2020
Online Marketplaces’ Greatest Moment

EXECUTIVE SUMMARY
Q2 2020 Internet & Digital Media Wrap-Up
2
Select Q2 Active Buyers Select Q2 Active Investors
» Internet & Digital Media continues to be a highly active category both in public and private markets
— The sector witnessed successful IPOs of Warner Music Group ($1.9 billion raised on June 3rd), Vroom ($465 million raised on June 9th) and Agora ($350 million raised on June 26th)
— In the private markets, a total of $14.3 billion in M&A volume and $14.2 billion in financing volume was announced or closed in Q2 2020
— M&A activity was up from the same period on 2019 with 13 transactions announced in the quarter
— Financings in 2Q 2020 were down 8% from Q2 2019, while the aggregate dollar amount was down 6%
» Q2 M&A activity saw several multi-billion dollar deals as well as numerous transactions close in the $100 – 250 million value range; private equity
accounted for ~31% of the buyers
— Zynga’s acquisition of Peak and General Atlantic, Warburg Pincus and Ocean Link’s acquisition of 58.com (NYSE:WUBA) represent approximately $10.5 billion of deal value in Q2 2020
— Other notable deals include: Amazon / Zoox (Automated Driving Technology), The Stagwell Group / MDC Partners (Advertising Technology) and Forge Capital / SharesPost (Mobile)
» Several large financing rounds took place in Q2 with an aggregate of 721 financings across all stages
— Larger financings include: Airbnb ($1 billion), Stripe ($850 million), DoorDash ($400 million) and Robinhood ($280 million)
» From a trading perspective three sectors have lead the public trading pack: E-Commerce, Marketplaces and Social Media with year-over-year growth
of 33.9%, 29.5% and 18.0%, respectively, and all trading at high 19x – low 20x EBITDA multiples

GCA OVERVIEW
Leading Global Investment Bank Providing Strategic M&A and Capital Markets Advisory Services
3
ZURICH
MILAN
FRANKFURT
MUNICH
TEL AVIV
LONDON
BIRMINGHAM
MUMBAI
SHANGHAI
SINGAPORE
TOKYO
NEW DELHI
NAGOYA
HO CHI MINH CITY
TAIPEI
PARISLEEDS
FUKUOKA
NEW YORK
SAN FRANCISCO
Sector expertise:
Expansive coverage
and deep specialization
Exceptional cross-border capabilities:
Half of all transactions
Global platform:25 offices in key markets across
America, Asia and Europe
Broad spectrum of clients:
Leading
conglomerates, top
private equity firms
and emerging high-
growth companies
Experienced team: Over 500 employees
across the globe
Strong reputation and track record: High number of
repeat clients and referrals
Diversified business model:
Geographically balanced, synergistic
and complementary focus areas
KYOTO
OSAKA
MANCHESTER
LAUSANNE
STOCKHOLM
San Francisco | New York | Birmingham | Frankfurt | Fukuoka | Ho Chi Minh City | Kyoto | Lausanne | Leeds | London | Manchester | Milan | Mumbai | Munich | Nagoya | New Delhi | Osaka | Paris | Shanghai | Singapore | Stockhom | Taipei | Tel Aviv | Tokyo | Zurich

GCA OVERVIEW
Strong Sector Expertise Across Internet & Digital Media Team
Notes:The above transactions represent a compilation of past and current deals that GCA entities, including GCA Advisors, LLC, GCA Advisors Corporation and GCA Altium, have advised on. 4
MEDIA / ENTERTAINMENT
SEARCH & ONLINE ADVERTISING
INTERNET CONTENT
INTERNET COMMERCE
MARKETPLACE / NEW TECHNOLOGY
SELECTED RECENT TRANSACTIONS
REPRESENTATIVE FOCUS AREAS GCA SECTOR TEAM
JOHN LAMBROSManaging DirectorNew [email protected]+1 (212) 999-7083
JOSHUA WEPMANManaging DirectorNew [email protected]+1 (212) 999-7092
KEVIN WALSHManaging DirectorSan [email protected]+1 (415) 318-3629
THOMAS EGLIManaging [email protected]+41 43 499 4341
PUBLISHING
GAMING
SOCIAL MEDIA
HR TECHNOLOGY
DIVERSIFIED MARKETING TECHNOLOGY

GCA OVERVIEW
Selected Recent Internet & Digital Media Transactions
5

GCA OVERVIEW
Experience in Consumer, E-Commerce and Marketplaces
6
Consumer E-Commerce Marketplaces
Online mobile & fashion
retailer
Kitchen & home hub
Online travel agency
Online fashion retail
Sensual wellness toys
Sports equipment
Experience gifts
Online specialty sports
Online grocery
Online bike retail
Online board sports retail
Online bikeretail
Online sportfashion retail
Event Streaming
Digital sports content & retail
Multi-channel streetwear
Insurance marketplace
Online real estate
classifieds
Online education
portal
Insurance marketplace
Online B2B classifieds
Online classifieds
Online marketplace
Audio systems for children
Children diapers retailer
Online perfumery
Online optical retail chain
Online HQ pictures
Luxury watch manufacturer
Online fashion retail
Online job classifieds
Online career portal
Online golf retail
Online auction marketplace technology
Online pet retailer
Stock photo marketplace

GCA OVERVIEW
7Notes:Sources: Pitchbook, LinkedIn, Press Releases, Company Website.
Transaction Overview The SpringHill Company Overview
Case Study: SISTER’s Investment in The SpringHill Company
Television
» On April 3, SISTER announced its $100 million investment in The SpringHill Company
» SISTER invested alongside the financial services companies Guggenheim Investments and UC Investments, as well as Jason Stein’s SC Holdings
» The company’s new board will include SISTER’s founder Elisabeth Murdoch, Serena Williams, Apollo Global Management’s co-founder Marc Rowan, investment banker Paul Wachter, Live Nation CEO Michael Rapino and Boston Red Sox chairman Tom Werner
Headquarters: Los Angeles, CA
Founded: 2015
Description: Provider of media content intended to create compelling storiesfor television, features and digital. The company offers differentfeature films, webseries, television series and short films,enabling users to get an altogether different experience whileenjoying their favorite shows. The SpringHill Company was co-founded by NBA star LeBron James and his business consortiumin 2015.
I’ve always wanted to use the platform of basketball to empower those around me. Now I’m incredibly excited about the opportunity to build a company that empowers creators, consumers and everything it touches.
Together with our new partners and incredible team, we are building a consumer and entertainment business that’s committed to diversity, that’s unafraid to stand up for what we believe in and that’s resonating with our community.
“
“
“
“
Production Partners
Selected Transaction Commentary
Content Offering Overview
LeBron James,
Co-Founder, SpringHill
Maverick Carter,
Co-Founder, SpringHill
Feature Films
What’s My Name
The story of Muhammad Ali
Million Dollar Mile
Everyday athletes compete in the
mile for $1 million
The WallTeams compete in
trivia for cash prizes
Warriors of Liberty City
Series covering a Miami youth
football program
Student AthleteExplores the
business of college sports
Shut Up & Dribble
History of the NBA and its impact on
pop culture
More Than A GameCovers LeBron James’ high school basketball team in Akron Ohio, detailing the story of five friends chasing victory and
James’ path to superstardom
I Am GiantChronicles Victor Cruz’s improbable rise to football stardom,
the life-shattering injury that derailed his career and his dramatic attempt at a comeback

GCA OVERVIEW
8Notes:Sources: Pitchbook, LinkedIn, Press Releases, Company Website.
Transaction Overview Storyblocks Company Overview
Case Study: Great Hill’s Acquisition of Storyblocks
» On June 25, Great Hill Partners announced its acquisition of Storyblocks, the first and largest subscription-based stock media company
» GCA served as exclusive financial advisor to Great Hill Partners
» The partnership will allow Storyblocks to accelerate its mission of modernizing the creative process to better support affordable, efficient video creation and to extend its current capabilities and product offerings
Headquarters: Arlington, VA
Founded: 2009
Description: Operator of an online marketplace intended to provide high-quality stock media at a fraction of the cost. The company’splatform provides creators with royalty-free HD videos,templates, images, music and sound effects through a flat-ratemodel. Users can subscribe individually to the company’s video,audio or image libraries or subscribe to a bundle of the three.
We have seen dramatic changes to workflows for customers ranging from freelancers to major production studios... We are excited to partner with the Great Hill team because we share the belief that creatives are hungry for a new model to meet these new needs.
Flexible, affordable, high-quality content has become a prerequisite for individuals and creative teams looking to leverage social media and video platforms. Storyblocks is uniquely positioned as a dynamic category leader to serve creatives as the industry continues to evolve.
“
“
“
“
Premium Enterprise Customers
Selected Transaction Commentary
Platform Overview
TJ Leonard,
CEO, Storyblocks
Michael Kumin,
Partner, Great Hill
Video» Royalty-free library of millions of HD and 4K videos, all hand
selected from industry-leading videographers
Audio» Constantly expanding library of music, sound effects and loops,
which creators can download and use royalty-free
Images» Library containing millions of stock vectors, illustrations and
photos
Enterprise» Enterprise Unlimited plans enable creative groups to license as
much media as they require for a flat cost with access to account
representatives and service teams

9
SECTION IGCA INTERNET & DIGITAL MEDIA: E-COMMERCE’S COVID BOOST

The coronavirus will provide a long-term boost for online retailers …”
GCA anticipates a strong increase in E-Commerce M&A activity when
the crisis eases, as investors / buyers are realizing the attractiveness of the sector
and want to invest / buy. The overall M&A market will lack attractive assets,
as most companies will have suffered from the crisis and will need months to recover
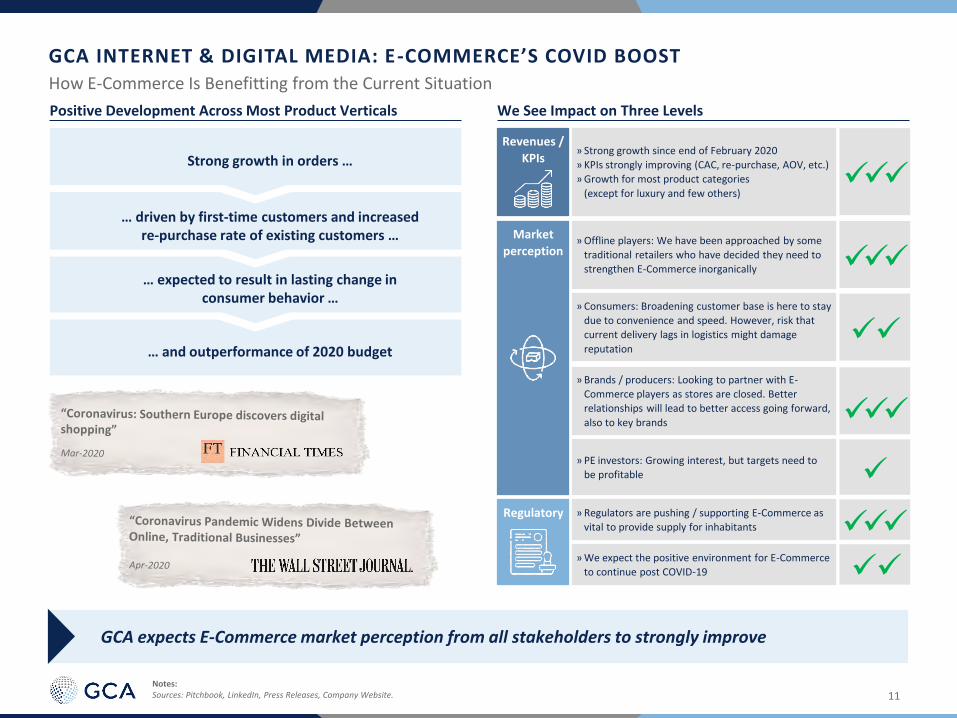
GCA INTERNET & DIGITAL MEDIA: E-COMMERCE’S COVID BOOST
How E-Commerce Is Benefitting from the Current Situation
11
GCA expects E-Commerce market perception from all stakeholders to strongly improve
✓✓✓
✓✓✓
✓✓
✓✓✓
✓
» Strong growth since end of February 2020
» KPIs strongly improving (CAC, re-purchase, AOV, etc.)
» Growth for most product categories
(except for luxury and few others)
» Offline players: We have been approached by some
traditional retailers who have decided they need to
strengthen E-Commerce inorganically
» Consumers: Broadening customer base is here to stay
due to convenience and speed. However, risk that
current delivery lags in logistics might damage
reputation
» Brands / producers: Looking to partner with E-
Commerce players as stores are closed. Better
relationships will lead to better access going forward,
also to key brands
» PE investors: Growing interest, but targets need to
be profitable
» Regulators are pushing / supporting E-Commerce as
vital to provide supply for inhabitants
» We expect the positive environment for E-Commerce
to continue post COVID-19
✓✓✓
✓✓
Market
perception
Revenues /
KPIs
Regulatory
… and outperformance of 2020 budget
… expected to result in lasting change in consumer behavior …
… driven by first-time customers and increased re-purchase rate of existing customers …
Strong growth in orders …
Positive Development Across Most Product Verticals We See Impact on Three Levels
Notes:Sources: Pitchbook, LinkedIn, Press Releases, Company Website.

GCA INTERNET & DIGITAL MEDIA: E-COMMERCE’S COVID BOOST
E-Commerce Is Outperforming Stock Market Indices
12
1H S&P 500 Performance vs. Selected E-Commerce and Marketplace Players
Notes:Sources: Capital IQ.
E-Commerce
-40%
-20%
0%
20%
40%
60%
80%
E-Commerce Marketplaces S&P 500
60%
28%
(4%)
60% 28%1H Share Price Performance
Marketplaces

10.0x
15.0x
20.0x
25.0x
10.0x
15.0x
20.0x
25.0x
1/2/2020 2/1/2020 3/2/2020 4/1/2020 5/1/2020 5/31/2020 6/30/2020
0.0x
1.0x
2.0x
3.0x
4.0x
5.0x
6.0x
7.0x
0.0x
0.5x
1.0x
1.5x
2.0x
2.5x
1/2/2020 2/1/2020 3/2/2020 4/1/2020 5/1/2020 5/31/2020 6/30/2020
GCA INTERNET & DIGITAL MEDIA: E-COMMERCE’S COVID BOOST
YTD Development of Valuation Levels
13
E-C
om
me
rce
Marke
tplace
s
EV / Revenue and EV / EBITDA – Multiples Have Fully Recovered
EV / ’20 Revenue
EV / ’20 EBITDA
Jun 30
21.6%22.3x18.3x
DeltaJan 2
Marketplaces
E-Commerce
5.0%20.3x19.4x
Jun 30
44.6%1.9x1.3x
DeltaJan 2
Marketplaces
E-Commerce
19.5%6.5x5.4x
20.3x
22.3x
6.5x
1.9x
Notes:Sources: Capital IQ.

GCA INTERNET & DIGITAL MEDIA: E-COMMERCE’S COVID BOOST
Valuation Overview – E-Commerce and Marketplaces
14
Multiples have remained broadly constant despite COVID-19 and will benefit mid-term
E-Commerce
1
Revenue CAGR '19-'21 15.5%
EV / ’20 Revenue 1.9x
EV / ’20 EBITDA 22.3x
EBITDA margin 5.5%
Marketplaces
2
Revenue CAGR '19-'21 25.2%
EV / ’20 Revenue 6.5x
EV / ’20 EBITDA 20.3x
EBITDA margin 20.6%

GCA INTERNET & DIGITAL MEDIA: E-COMMERCE’S COVID BOOST
Media and Analysts Expect a Boost of E-Commerce Businesses
15

GCA INTERNET & DIGITAL MEDIA: E-COMMERCE’S COVID BOOST
What Buyers Are Looking For
16
Our Experience from Recent Deals Key Criteria for E-Commerce Buyers
What Excites PEs
✓ Credibility with customers✓ Superior customer
economics✓ High top-line growth AND
strong profitability✓ USP against Amazon and
Zalando✓ Strong management team
What Excites Strategics
✓ Access to loyal customer base
✓ Additional distribution channel
✓ Market leading position✓ Strong digital capabilities
✓ Truly international footprint
Sustainabledouble-digit growth
GrowthP Double-digit (cash)
EBITDA margins
ProfitabilityP
Attractive cohorts (low churn, high purchase frequency, low CAC)
CustomersP Gross margin
development / share of private label
SourcingP
Credibility within its customer group key for
investors
CredibilityP

GCA INTERNET & DIGITAL MEDIA: E-COMMERCE’S COVID BOOST
Key Metrics for E-Commerce Models
17
KPIs to Be Prepared and Presented to Potential Buyers / Investors
Traffic
Focus of analysis:
» What are the sources
of your traffic (paid, TV
and related marketing
vs. unpaid)?
» What are the CPCs for
the paid channels?
» How does the high
brand credibility
drive direct traffic?
» What is your net
promoter score (NPS)?
» How is traffic
developing and what is
the split of the
sources there?
» Mobile share in traffic?
» How high is the CPO?
Market Trend
Focus of analysis:
» What are you
expecting in terms of
overall market
growth?
» How is your market
segment benefiting
from the ongoing
online growth?
» What is your
market share?
» Who are your key
competitors?
» How do you
differentiate from
competitors?
Shop / Front-End
Focus of analysis:
» Benchmarking of
load times for
specific searches
vs. key competitors
» What is the exclusive
(if any) and total #
of products?
» Technology of
front- / back-end
and how scalable and
state-of-the-art is it?
» How good is the
filtering function?
» How mobile-ready
is the website?
Focus of analysis:
» How are conversion
rates developing
across traffic sources?
» How is cancellation
rate developing?
» How high is the
drop out rate?
» Do you have
retargeting measures
in place for customers
having dropped out
before completing
their order?
» Do you track (in-house)
customer service KPIs
(response-time etc.)?
Conversion Customers
Focus of analysis:
» How high is the
repurchase rate of
existing customers?
» How high is the
churn rate?
» New customers
acquired on average
per month?
» Main traffic source for
new customers?
» How high is the AOV /
CAC (split by new vs.
existing customers)?
» Are long-term
customers spending
more?
» Are there differences
on a country by
country basis?
» How high are customer
satisfaction scores?
After Sales
Focus of analysis:
» Handling time, picking
& shipping costs,
expandability?
» What is share of orders
delivered the
next day?
» Share of drop
shipping?
» How is number of
SKUs developing?
» Level of working capital
requirements in order
to ensure high
availability?
» How high is the share
of units in stock?
» How high is the share
of returned goods?
» What customer
support KPIs are you
tracking?

18
SECTION IIQ2 ‘20 MARKET UPDATE

Select Q2 '20 Financing Transactions Quarterly Financing Volume ($Bn) (1)(2) Quarterly M&A Volume ($Bn) (4) Select Q2 '20 M&A Transactions
Company Amount ($MM) Acquirer Target EV ($MM)
$1,000 $8,700
$850 $1,800
$400 $1,300
$280 $900
$250 Perfect Peony $405
$241 $260
$170 $259
$100 $112
Last 12 Months Digital Media & Internet Price Performance (5)
721
Q2 2020 Financing Transactions (1)(2)(3)
$14.2 Billion
Q2 2020 Financing Volume (1)(2)(3)
$14.3 Billion
Q2 2020 M&A Volume (3)(4)
13
Q2 2020 M&A Transactions (3)(4)
783
671 690 710
787
688 706656
721
550
650
750
850
$12$15
$13 $13$15
$13 $13 $12$14
$0
$5
$10
$15
$20
$14
$28 $30
$17$20
$35
$24
$15 $14
$0
$10
$20
$30
$40
16
2532
1611
1520
1713
0
10
20
30
40
(50.0%)
(30.0%)
(10.0%)
10.0%
30.0%
50.0%
6/30/2019 7/31/2019 8/31/2019 9/30/2019 10/31/2019 11/30/2019 12/31/2019 1/31/2020 2/29/2020 3/31/2020 4/30/2020 5/31/2020 6/30/2020
19
DEAL DASHBOARD
Notes:Sources: Capital IQ, PitchBook, PriceWaterhouseCoopers / NVCA MoneyTree Report.1) Criteria based on U.S. internet/mobile/telecommunications Series A and subsequent rounds of financings. 2) Financings include Venture and Private Equity Growth/Expansion activity for U.S. internet/mobile/telecommunications sectors. 3) Figures reflect total transactions and volume through end of most recent quarter. 4) Criteria based on U.S. target internet/digital media M&A deals with transaction enterprise values greater than $50MM. 5) Details on companies included can be found on the following page.
29.5%18.0%
41.1%
(6.5%)
42.6%
(14.5%)
33.9%
(12.1%)
7.8%
Internet Content Gaming PublishersDiversified Marketing
Marketplaces Social Media E-CommerceSearch / Online
AdvertisingMedia /
Entertainment

25.2x 24.2x
19.5x17.3x 16.1x 15.6x 15.1x
13.4x 12.6x
Marketplace / NewEconomy
Internet Commerce Social Media Gaming Search / Online Adv. Internet Content Publishers Media /Entertainment
DiversifiedMarketing
7.3x6.7x
5.9x
4.4x 4.4x4.1x
2.8x 2.5x 2.3x
Social Media Search / Online Adv. Marketplace / NewEconomy
Gaming DiversifiedMarketing
Internet Content Internet Commerce Publishers Media /Entertainment
Notes:Source: Capital IQ. Multiples <0x and >50x considered NM. Multiples represent mean value of sector group. 20
Q2 2020 M&A DEAL DASHBOARD
INTERNET & DIGITAL MEDIA ECOSYSTEM
2020E Revenue / 2020E EBITDA Multiple
SocialMedia
7.3x / 19.5x 2.3 / 13.4x
Media / Entertainment
2.5x / 15.1x
Publishers
4.4x / 12.6x
Diversified Marketing
4.4x / 17.3x
Gaming
4.1x / 15.6x
Internet Content
6.7x / 16.1x
Search / Online Advertisement
5.9x / 25.2x
Marketplaces
2.8x / 24.2x
E-Commerce
ENTERPRISE VALUE / 2020E REVENUE ENTERPRISE VALUE / 2020E EBITDA
Diversified Marketing
E-Commerce Media / Entertainment
Gaming Internet Content
Market-places
Social Media
Search / Online Adv.
Publishers Search / Online Adv.
Diversified Marketing
Media / Entertainment
E-Commerce Internet Content
GamingSocial Media
Market-places
Publishers

$15.6
$27.5
$29.8
$20.4 $20.3
$34.5
$24.3
$15.3 $14.3
Q2'18 Q3'18 Q4'18 Q1'19 Q2'19 Q3'19 Q4'19 Q1'20 Q2'20
21
($BN) Number of Deals M&A Volume
QUARTERLY M&A ACTIVITY (1)(2) SELECT Q2 2020 M&A TRANSACTIONS
Ann. Date Acquirer Target Enterprise Value
6/26 $1,300
6/25 $259
6/22 $112
6/19 $128
6/14 Perfect Peony $405
6/4 $100
6/1 $1,800
5/12 $160
5/4 $900
4/3 $260
4/2 $8,700
16
25
31
11
15
20
($MM)
17 17
13
Notes:Sources: Capital IQ, PitchBook, Wall Street Estimates. 1) Criteria based on U.S. target internet/digital media M&A deals with transaction enterprise values greater than $50MM. 2) Details on companies included can be found in the appendix.
Q2 2020 M&A DEAL DASHBOARD

22
Q2 2020 FINANCING DEAL DASHBOARD
($BN) Number of Deals Financing Volume
QUARTERLY FINANCING ACTIVITY (1)(2)(3) SELECT Q2 2020 FINANCING TRANSACTIONS
($MM)
$12.3
$14.8
$12.6
$13.4
$15.1
$12.9 $12.7
$11.7
$14.2
Q2'18 Q3'18 Q4'18 Q1'19 Q2'19 Q3'19 Q4'19 Q1'20 Q2'20
690
783
671
710
787
688
706
656
721
Ann. Date Investor Target Amount Raised
6/29 $48
6/18 $400
6/16 $50
6/3 $241
5/28 $127
5/21 $100
5/7 $170
5/4 $280
4/21 $250
4/16 $850
4/6 $1,000
Notes:Sources: Capital IQ, PitchBook, PriceWaterhouseCoopers / NVCA MoneyTree Report. 1) Criteria based on U.S. internet/mobile/telecommunications Series A and subsequent rounds of financings. 2) Financings include Venture and Private Equity Growth/Expansion activity for U.S. internet/mobile/telecommunications sectors. 3) Figures reflect total transactions and volume through end of most recent quarter.

23
APPENDIX

APPENDIX – PUBLIC COMPANY VALUATIONS
24Notes:Sources: Capital IQ, Wall Street Estimates. Multiples <0x and >50x considered NM.
($MM), Except Per Share DataStock Trading Statistics Operating Metrics
Price LTM Price Range Equity Cash & Net Enterprise EV / Revenue EV / EBITDA Revenue Growth EBITDA Margin
Company 6/30/20 Low High Value Equiv. Debt Value CY 19A CY 20E CY 21E CY 19A CY 20E CY 21E 19A/18A 20E/19A 21E/20E CY 19A CY 20E CY 21E
Marketplaces
Shopify Inc. $949.20 $282.08 $958.76 $113,303 $2,361 ($2,219) $111,083 NM NM 37.8x NM NM NM 47.0% 37.5% 35.4% 4.2% 3.1% 4.1%
Uber Technologies, Inc. $31.08 $13.71 $45.63 $53,892 $8,996 $503 $54,395 3.8x 4.1x 3.0x NM NM NM 25.5% (7.0%) 39.4% (20.0%) (18.0%) (0.4%)
MercadoLibre, Inc. $985.77 $422.22 $998.11 $49,003 $2,276 ($1,151) $47,851 20.8x 15.8x 11.3x NM NM NM 59.5% 31.9% 39.3% (3.1%) (1.2%) 2.3%
eBay Inc. $52.45 $26.02 $52.75 $36,855 $4,430 $4,765 $41,620 3.9x 4.0x 3.8x NM 10.7x 10.3x 2382.2% (4.1%) 4.9% (1.7%) 37.4% 37.3%
Delivery Hero SE $102.36 $43.27 $108.28 $20,375 $785 ($651) $19,724 14.2x 7.8x 4.9x NM NM NM 219.2% 83.1% 58.0% (13.6%) (24.5%) (4.9%)
Copart, Inc. $83.27 $55.69 $104.88 $19,550 $306 $210 $19,760 8.9x 9.4x 8.4x 21.8x 24.2x 20.2x 18.8% (5.9%) 12.7% 40.8% 39.1% 41.4%
Just Eat Takeaway.com N.V. $104.39 $66.17 $115.12 $15,524 $56 $247 $15,772 33.8x 7.2x 5.7x NM NM 38.4x 75.5% 369.5% 26.4% 7.6% 11.5% 14.8%
Etsy, Inc. $106.23 $29.95 $107.32 $12,607 $804 $50 $12,657 15.5x 10.8x 9.1x NM 46.9x 38.4x 35.6% 43.4% 18.0% 22.5% 23.0% 23.8%
Lyft, Inc. $33.01 $14.56 $68.33 $10,128 $2,670 ($2,137) $7,991 2.2x 2.8x 1.8x NM NM NM 67.7% (22.0%) 55.0% (19.8%) (25.6%) (5.5%)
Grubhub Inc. $70.30 $29.35 $80.25 $6,484 $597 $196 $6,680 5.1x 4.3x 3.8x 37.1x NM 45.8x 30.3% 18.1% 14.4% 13.7% 4.3% 8.2%
Farfetch Limited $17.27 $5.99 $22.11 $5,865 $422 ($129) $5,736 5.6x 4.2x 3.1x NM NM NM 69.5% 34.7% 33.2% (12.5%) (7.7%) 0.0%
LendingTree, Inc. $289.53 $135.72 $434.94 $3,782 $51 $378 $4,160 3.8x 4.7x 3.9x 20.6x 32.6x 22.9x 44.7% (20.3%) 21.3% 18.3% 14.5% 16.9%
CarGurus, Inc. $25.35 $14.25 $40.91 $2,856 $156 ($78) $2,778 4.7x 5.4x 4.3x 38.1x 39.8x 26.6x 29.7% (12.8%) 26.0% 12.4% 13.6% 16.1%
TripAdvisor, Inc. $19.01 $13.73 $47.60 $2,551 $798 ($73) $2,478 1.6x 3.8x 2.3x 5.7x NM 9.9x (3.4%) (57.7%) 65.8% 27.9% (10.3%) 22.8%
Moneysupermarket.com Group PLC $4.01 $2.60 $5.19 $2,150 $32 $14 $2,164 4.2x 4.7x 4.3x 11.7x 13.8x 12.1x 13.5% (10.7%) 8.9% 36.0% 34.1% 35.7%
The RealReal, Inc. $12.79 $5.00 $26.81 $1,111 $303 ($169) $943 3.0x 3.2x 2.2x NM NM NM 48.8% (7.9%) 43.7% (23.1%) (31.3%) (11.2%)
Cars.com Inc. $5.76 $3.25 $22.25 $387 $187 $657 $1,044 1.7x 2.0x 1.8x 6.1x 8.7x 6.4x (8.4%) (14.5%) 13.3% 28.1% 23.2% 27.7%
Mean 8.3x 5.9x 6.6x 20.1x 25.2x 23.1x 185.6% 26.8% 30.3% 6.9% 5.0% 13.5%Median 4.5x 4.5x 3.9x 20.6x 24.2x 21.6x 44.7% (5.9%) 26.4% 7.6% 4.3% 14.8%
Social Media & New Platform
Facebook, Inc. $227.07 $137.10 $245.19 $647,453 $60,289 ($49,475) $597,978 8.5x 7.8x 6.2x 15.1x 16.0x 12.4x 26.6% 9.1% 25.1% 56.0% 48.5% 50.1%
Snap Inc. $23.49 $7.89 $24.90 $33,953 $2,830 ($883) $33,070 19.3x 15.7x 11.4x NM NM NM 45.3% 22.9% 37.8% (12.9%) (9.3%) 8.2%
Twitter, Inc. $29.79 $20.00 $45.86 $23,329 $7,766 ($3,633) $19,696 5.7x 6.0x 4.9x 16.0x 24.4x 17.0x 13.7% (4.9%) 21.9% 35.5% 24.5% 28.9%
LINE Corporation $50.28 $27.46 $50.46 $12,065 $1,739 $418 $12,483 6.0x 5.2x 4.5x NM NM 37.4x 10.8% 14.3% 15.9% (6.5%) 3.5% 12.0%
Yelp Inc. $23.13 $12.89 $39.37 $1,663 $487 ($250) $1,413 1.4x 1.7x 1.5x 6.5x 18.1x 8.3x 7.6% (19.2%) 13.3% 21.5% 9.5% 18.3%
Mean 8.2x 7.3x 5.7x 12.5x 19.5x 18.8x 20.8% 4.4% 22.8% 18.7% 15.3% 23.5%Median 6.0x 6.0x 4.9x 15.1x 18.1x 14.7x 13.7% 9.1% 21.9% 21.5% 9.5% 18.3%
Search / Online Advertising
Microsoft Corporation $203.51 $130.78 $204.40 $1,543,306 $136,527 ($54,897) $1,488,409 11.1x 10.0x 9.0x 25.0x 22.1x 19.6x 13.3% 10.3% 11.8% 44.3% 45.4% 45.8%
Alphabet Inc. $1,418.05 $1,008.87 $1,530.74 $967,990 $117,229 ($100,425) $867,565 5.4x 5.1x 4.3x 14.7x 15.2x 12.2x 18.3% 4.6% 20.2% 36.5% 33.8% 35.1%
The Trade Desk, Inc. $406.50 $136.00 $421.06 $18,723 $446 ($76) $18,647 28.2x 27.1x 19.8x NM NM NM 38.5% 4.1% 36.8% 31.7% 25.5% 29.1%
Yandex N.V. $50.02 $27.93 $50.75 $17,556 $2,528 ($1,239) $16,317 5.8x 5.9x 4.3x 19.1x 24.7x 15.8x 53.7% (1.5%) 35.5% 30.2% 23.7% 27.4%
Magnite, Inc. $6.67 $4.09 $13.11 $716 $71 ($51) $666 4.3x 3.6x 2.8x 26.7x NM 16.5x 25.4% 18.7% 29.7% 16.0% (1.1%) 16.8%
Criteo S.A. $11.39 $5.89 $20.77 $703 $437 ($272) $431 0.2x 0.6x 0.6x 1.5x 2.7x 2.3x (1.7%) (67.6%) 2.4% 12.8% 21.8% 24.8%
QuinStreet, Inc. $10.46 $5.76 $17.13 $543 $97 ($83) $460 1.0x 1.0x 0.9x 13.6x 15.6x 9.5x 8.2% (5.2%) 9.4% 7.0% 6.4% 9.7%
Marchex, Inc. $1.58 $1.10 $4.98 $69 $40 ($33) $35 0.3x 0.4x 0.4x 8.2x NM 14.1x 24.5% (18.0%) 7.0% 4.0% (9.6%) 2.7%
Mean 7.0x 6.7x 5.3x 15.5x 16.1x 12.9x 26.0% 9.4% 19.1% 22.8% 26.1% 23.9%Median 4.8x 4.4x 3.5x 14.7x 15.6x 14.1x 21.4% 1.3% 16.0% 23.1% 22.8% 26.1%

APPENDIX – PUBLIC COMPANY VALUATIONS
25Notes:Sources: Capital IQ, Wall Street Estimates. Multiples <0x and >50x considered NM.
($MM), Except Per Share DataStock Trading Statistics Operating Metrics
Price LTM Price Range Equity Cash & Net Enterprise EV / Revenue EV / EBITDA Revenue Growth EBITDA Margin
Company 6/30/20 Low High Value Equiv. Debt Value CY 19A CY 20E CY 21E CY 19A CY 20E CY 21E 19A/18A 20E/19A 21E/20E CY 19A CY 20E CY 21E
Internet Content
Zillow Group, Inc. $57.48 $18.65 $66.96 $12,699 $2,561 ($282) $12,416 4.5x 3.7x 2.4x NM NM NM 105.7% 23.9% 53.1% 0.3% (2.8%) (0.4%)
GoDaddy Inc. $73.33 $40.25 $84.49 $12,119 $851 $1,825 $13,944 4.7x 4.3x 3.9x 21.2x 17.2x 14.4x 12.3% 8.5% 10.6% 22.0% 25.1% 26.9%
eHealth, Inc. $98.24 $52.71 $152.19 $2,516 $200 ($149) $2,367 5.1x 3.7x 3.0x 26.9x 17.1x 13.1x 105.4% 37.0% 24.6% 18.9% 21.6% 22.7%
TEGNA Inc. $11.14 $9.61 $18.31 $2,434 $35 $4,143 $6,578 2.9x 2.4x 2.4x 9.3x 7.9x 8.2x 4.2% 18.6% 0.6% 30.7% 30.5% 29.1%
TechTarget, Inc. $30.03 $16.82 $31.25 $827 $45 $8 $835 6.2x 6.2x 5.6x 20.1x 20.2x 16.9x 10.4% 0.4% 10.3% 31.0% 30.7% 33.2%
Mean 4.7x 4.1x 3.5x 19.4x 15.6x 13.2x 40.8% 21.7% 14.2% 17.2% 19.0% 20.0%Median 4.7x 3.7x 3.0x 20.6x 17.1x 13.8x 11.4% 21.3% 10.5% 20.4% 23.3% 24.8%
E-Commerce
Amazon.com, Inc. $2,758.82 $1,626.03 $2,796.00 $1,376,033 $49,292 $28,859 $1,404,892 5.0x 4.1x 3.4x 33.7x 31.4x 22.5x 20.5% 23.7% 17.6% 14.9% 12.9% 15.3%
Alibaba Group Holding Limited $215.70 $151.85 $231.14 $578,885 $51,287 ($30,490) $548,396 7.8x 6.3x 5.0x 24.6x 21.1x 15.3x 39.9% 24.6% 24.4% 31.8% 29.7% 32.9%
Netflix, Inc. $455.04 $252.28 $474.01 $200,128 $7,153 $10,555 $210,683 10.5x 8.5x 7.2x NM 45.9x 34.9x 27.6% 22.8% 18.1% 15.7% 18.5% 20.7%
JD.com, Inc. $60.18 $25.77 $62.42 $92,725 $10,293 ($5,426) $87,299 1.1x 0.9x 0.7x 43.2x 30.5x 20.7x 23.3% 22.0% 19.1% 2.4% 2.8% 3.5%
Booking Holdings Inc. $1,592.34 $1,107.29 $2,094.00 $65,176 $7,189 $2,025 $67,201 4.5x 9.8x 5.8x 11.5x NM 17.6x 3.7% (54.5%) 69.9% 38.8% 15.3% 32.9%
Spotify Technology S.A. $258.19 $109.18 $271.71 $48,012 $1,649 ($949) $47,062 6.2x 5.3x 4.3x NM NM NM 26.1% 18.1% 21.1% 0.8% (0.8%) 0.9%
Wayfair Inc. $197.61 $21.70 $221.54 $18,701 $891 $1,620 $20,321 2.2x 1.6x 1.4x NM NM NM 34.6% 37.6% 14.6% (5.4%) 0.2% 0.7%
Chewy, Inc. $44.69 $20.62 $52.77 $17,946 $193 $52 $17,998 5.1x 2.7x 2.2x NM NM NM (0.0%) 87.8% 21.5% (2.7%) 0.1% 1.6%
Zalando SE $70.65 $30.76 $74.30 $17,658 $1,238 ($634) $17,025 2.3x 2.0x 1.7x 37.1x 34.8x 26.0x 17.9% 16.2% 17.8% 6.3% 5.8% 6.6%
Expedia Group, Inc. $82.20 $40.76 $144.00 $11,589 $4,099 $3,278 $14,867 1.2x 2.5x 1.6x 7.0x NM 9.8x 7.5% (50.6%) 53.1% 17.6% 0.1% 16.6%
ASOS Plc $42.38 $12.07 $46.72 $4,217 $11 $621 $4,838 1.4x 1.4x 1.1x 32.7x 38.3x 17.7x 13.1% 5.0% 20.2% 4.3% 3.5% 6.4%
Qurate Retail, Inc. $9.50 $3.01 $14.63 $3,959 $555 $6,490 $10,449 0.8x 0.8x 0.8x 5.2x 5.7x 5.6x (4.3%) (2.0%) 1.7% 14.8% 13.9% 13.9%
Stamps.com Inc. $183.69 $44.03 $221.73 $3,138 $216 ($134) $3,005 5.3x 5.0x 4.6x 20.7x 19.6x 17.7x (2.6%) 5.4% 7.3% 25.4% 25.4% 26.2%
Stitch Fix, Inc. $24.94 $10.90 $31.65 $2,559 $242 ($76) $2,483 1.4x 1.4x 1.1x NM NM NM 26.7% 2.9% 21.1% 1.4% (3.0%) (0.1%)
Cimpress plc $76.34 $40.80 $145.09 $1,976 $228 $1,642 $3,618 1.3x 1.7x 1.4x 8.2x 11.6x 9.5x 4.1% (21.8%) 16.9% 15.8% 14.3% 15.0%
1-800-FLOWERS.COM, Inc. $20.02 $11.15 $26.81 $1,287 $232 ($65) $1,222 0.9x 0.8x 0.9x 13.8x 9.8x 12.0x 7.6% 18.6% (8.1%) 6.8% 8.1% 7.2%
Shutterstock, Inc. $34.97 $28.76 $45.98 $1,246 $296 ($250) $996 1.5x 1.6x 1.5x 9.8x 11.1x 10.0x 4.4% (3.6%) 5.9% 15.5% 14.3% 15.0%
Overstock.com, Inc. $28.43 $2.53 $29.75 $1,148 $145 ($72) $1,076 0.7x 0.6x 0.6x NM NM NM (20.3%) 21.6% 6.7% (5.6%) (2.1%) (1.1%)
Revolve Group, Inc. $14.86 $7.17 $41.22 $1,031 $104 ($74) $957 1.6x 1.7x 1.4x 17.6x 37.0x 16.3x 20.5% (7.1%) 23.4% 9.0% 4.6% 8.5%
trivago N.V. $1.97 $1.30 $5.38 $695 $231 ($122) $573 0.6x 1.5x 0.9x 7.6x NM 22.7x (10.2%) (59.3%) 60.3% 8.0% (12.0%) 4.1%
Quotient Technology Inc. $7.32 $4.55 $11.99 $658 $197 ($19) $639 1.5x 1.4x 1.2x 14.6x 14.5x 9.4x 12.7% 1.9% 16.2% 10.0% 9.9% 13.1%
Blue Apron Holdings, Inc. $11.09 $2.01 $28.84 $148 $30 $60 $209 0.5x 0.5x 0.4x NM 27.8x 9.6x (31.9%) (0.9%) 5.5% (1.7%) 1.7% 4.6%
Travelzoo $5.64 $3.04 $15.73 $64 $12 $15 $79 0.7x 1.6x 1.0x 5.8x NM 11.7x 0.1% (56.0%) 65.3% 12.2% (12.2%) 8.4%
Mean 2.8x 2.8x 2.2x 18.3x 24.2x 16.1x 9.6% 2.3% 22.6% 10.3% 6.6% 11.0%Median 1.5x 1.6x 1.4x 14.2x 24.4x 15.8x 7.6% 5.0% 18.1% 9.0% 4.6% 8.4%

APPENDIX – PUBLIC COMPANY VALUATIONS
26Notes:Sources: Capital IQ, Wall Street Estimates. Multiples <0x and >50x considered NM.
($MM), Except Per Share DataStock Trading Statistics Operating Metrics
Price LTM Price Range Equity Cash & Net Enterprise EV / Revenue EV / EBITDA Revenue Growth EBITDA Margin
Company 6/30/20 Low High Value Equiv. Debt Value CY 19A CY 20E CY 21E CY 19A CY 20E CY 21E 19A/18A 20E/19A 21E/20E CY 19A CY 20E CY 21E
Gaming
Tencent Holdings Limited $64.33 $40.28 $65.16 $609,684 $28,214 $5,387 $615,071 11.6x 9.1x 7.5x 30.4x 25.3x 21.0x 18.6% 27.0% 21.5% 38.1% 36.1% 35.7%
NetEase, Inc. $429.38 $209.01 $441.87 $59,342 $10,664 ($7,819) $51,523 6.1x 5.2x 4.6x 20.1x 19.1x 16.5x 14.3% 16.4% 13.2% 30.1% 27.3% 27.9%
Activision Blizzard, Inc. $75.90 $44.81 $77.63 $58,480 $5,980 ($3,305) $55,175 8.5x 7.7x 7.3x 25.1x 18.8x 17.2x (13.5%) 10.3% 6.1% 33.9% 40.9% 42.3%
Electronic Arts Inc. $132.05 $85.69 $133.60 $38,125 $5,735 ($4,515) $33,610 6.2x 6.1x 5.7x 17.8x 17.5x 16.3x 1.8% 3.0% 5.4% 35.1% 34.6% 35.2%
NAVER Corporation $222.60 $93.38 $240.94 $32,358 $3,971 ($2,021) $30,337 5.3x 4.9x 4.2x 33.6x 25.0x 19.0x 13.8% 9.2% 16.3% 15.8% 19.5% 22.0%
Ncsoft Corporation $742.84 $380.17 $797.87 $15,308 $1,667 ($1,375) $13,933 9.5x 6.0x 5.0x 28.6x 15.0x 11.5x (4.4%) 57.3% 19.8% 33.1% 40.1% 43.7%
Ubisoft Entertainment SA $82.60 $44.89 $90.34 $10,080 $1,186 $378 $10,458 5.7x 4.4x 3.5x 12.9x 8.9x 7.2x (16.9%) 30.0% 23.6% 44.0% 49.2% 48.9%
Zynga Inc. $9.54 $5.51 $9.92 $9,125 $1,261 ($542) $8,582 6.5x 4.9x 4.3x 28.1x 21.7x 18.3x 45.7% 33.8% 11.9% 23.1% 22.3% 23.7%
Glu Mobile Inc. $9.27 $3.98 $10.72 $1,544 $115 ($75) $1,470 3.6x 2.8x 2.6x 36.6x 26.1x 18.8x 12.2% 28.2% 7.4% 9.8% 10.7% 13.8%
DeNA Co., Ltd. $12.47 $9.68 $21.57 $1,540 $683 ($564) $975 0.9x 0.9x 0.7x NM 24.1x 4.7x (4.8%) (4.8%) 24.0% (15.8%) 3.8% 15.7%
GungHo Online Entertainment, Inc. $17.83 $12.61 $29.03 $1,210 $743 ($740) $470 0.5x 0.7x 0.7x 1.6x 2.5x 3.1x 11.1% (25.7%) (7.9%) 32.0% 26.8% 23.8%
GREE, Inc. $4.29 $3.16 $5.17 $979 $800 ($800) $179 0.3x 0.3x 0.3x 3.9x 4.2x 3.5x (6.6%) (7.5%) (7.3%) 7.5% 7.4% 9.7%
Mean 5.4x 4.4x 3.9x 21.7x 17.3x 13.1x 6.0% 14.8% 11.2% 23.9% 26.6% 28.5%Median 5.9x 4.9x 4.3x 25.1x 18.9x 16.4x 6.5% 13.4% 12.5% 31.0% 27.1% 25.9%
Media Conglomerates / Selected Entertainment
The Walt Disney Company $111.51 $79.07 $153.41 $201,417 $14,339 $45,216 $246,633 3.3x 3.8x 3.1x 13.3x 29.4x 14.3x 26.5% (13.2%) 22.9% 24.6% 12.8% 21.5%
Comcast Corporation $38.98 $31.71 $47.74 $177,911 $8,516 $100,227 $278,138 2.6x 2.7x 2.5x 8.1x 9.4x 8.3x 15.3% (6.1%) 8.4% 31.5% 28.9% 30.1%
Sony Corporation $68.50 $49.14 $75.26 $83,575 $8,944 $8,495 $92,070 1.4x 1.3x 1.1x 8.0x 12.2x 7.8x (3.2%) 12.8% 10.7% 17.8% 10.4% 14.6%
Vivendi SA $25.70 $18.68 $29.73 $29,757 $2,667 $6,755 $36,511 2.0x 2.0x 1.9x 15.5x 14.9x 12.8x 10.9% 0.8% 7.0% 13.2% 13.6% 14.9%
ViacomCBS Inc. $23.32 $10.10 $53.71 $14,351 $589 $19,789 $34,140 1.2x 1.3x 1.2x 5.8x 7.2x 6.6x 2.1% (5.0%) 6.7% 21.2% 18.0% 18.3%
Discovery, Inc. $21.10 $17.12 $33.66 $14,139 $1,465 $14,643 $28,782 2.6x 2.8x 2.6x 6.1x 7.4x 7.0x 8.2% (4.9%) 7.4% 43.2% 37.7% 37.0%
Mean 2.2x 2.3x 2.1x 9.5x 13.4x 9.5x 10.0% (2.6%) 10.5% 25.3% 20.2% 22.7%Median 2.3x 2.4x 2.2x 8.1x 10.8x 8.1x 9.6% (4.9%) 7.9% 22.9% 15.8% 19.9%

APPENDIX – PUBLIC COMPANY VALUATIONS
27Notes:Sources: Capital IQ, Wall Street Estimates. Multiples <0x and >50x considered NM.
($MM), Except Per Share DataStock Trading Statistics Operating Metrics
Price LTM Price Range Equity Cash & Net Enterprise EV / Revenue EV / EBITDA Revenue Growth EBITDA Margin
Company 6/30/20 Low High Value Equiv. Debt Value CY 19A CY 20E CY 21E CY 19A CY 20E CY 21E 19A/18A 20E/19A 21E/20E CY 19A CY 20E CY 21E
Publishers
Thomson Reuters Corporation $67.81 $55.81 $80.86 $33,618 $1,264 $2,854 $36,472 6.2x 6.1x 5.9x 24.3x 19.5x 18.2x 7.4% 1.1% 4.1% 25.4% 31.3% 32.2%
Informa plc $5.82 $4.05 $11.15 $8,749 $258 $3,545 $12,294 3.2x 4.8x 3.9x 9.2x 17.0x 11.4x 26.8% (33.6%) 24.8% 34.8% 28.4% 34.0%
The New York Times Company $42.03 $26.13 $43.32 $7,005 $435 ($435) $6,570 4.1x 3.7x 3.4x 27.9x 36.9x 24.6x 0.9% 8.6% 9.0% 14.6% 10.2% 14.0%
News Corporation $11.86 $7.90 $15.07 $6,982 $1,388 $1,164 $8,146 0.9x 1.0x 0.9x 7.6x 10.7x 7.3x (0.8%) (10.7%) 5.9% 11.6% 9.3% 12.9%
Pearson plc $7.13 $5.10 $11.78 $5,341 $851 $1,538 $6,879 1.3x 1.6x 1.5x 7.0x 10.2x 8.6x (2.6%) (16.1%) 6.3% 19.1% 15.7% 17.5%
Lagardère SCA $14.26 $9.16 $26.06 $1,837 $1,025 $5,115 $6,952 0.9x 1.3x 1.0x 8.9x NM 12.8x 2.9% (31.5%) 25.0% 9.6% 1.6% 7.8%
Meredith Corporation $14.55 $10.01 $56.86 $660 $103 $2,750 $3,411 1.2x 1.2x 1.2x 5.5x 7.0x 5.8x (1.3%) (6.6%) 5.7% 21.2% 17.7% 20.1%
Gannett Co., Inc. $1.38 $0.63 $11.35 $181 $200 $1,776 $1,956 1.0x 0.6x 0.6x 10.7x 4.5x 4.2x 22.4% 89.9% (1.8%) 9.8% 12.2% 13.3%
Mean 2.3x 2.5x 2.3x 12.7x 15.1x 11.6x 6.9% 0.2% 9.9% 18.3% 15.8% 19.0%Median 1.3x 1.4x 1.3x 9.1x 10.7x 10.0x 1.9% (8.6%) 6.1% 16.8% 14.0% 15.8%
Diversified Marketing
Experian plc $34.90 $22.58 $36.32 $31,674 $277 $4,245 $35,919 7.4x 7.2x 6.7x 21.2x 20.9x 19.5x 0.0x 0.0x 0.1x 0.3x 0.3x 0.3x
Equifax Inc. $171.88 $103.01 $180.07 $20,864 $1,347 $3,028 $23,892 6.8x 6.5x 6.3x 20.3x 20.1x 18.4x 0.0x 0.0x 0.0x 0.3x 0.3x 0.3x
HubSpot, Inc. $224.35 $90.84 $231.17 $9,788 $969 ($358) $9,430 14.0x 11.7x 9.7x NM NM NM 0.3x 0.2x 0.2x 0.1x 0.1x 0.1x
WPP plc $7.81 $5.57 $13.44 $9,498 $3,932 $5,019 $14,517 0.8x 1.2x 1.2x 4.8x 8.2x 6.7x 0.1x -0.3x 0.1x 0.2x 0.2x 0.2x
The Interpublic Group of Companies, Inc.$17.16 $11.63 $25.20 $6,686 $1,554 $4,314 $10,999 1.3x 1.4x 1.3x 7.6x 9.5x 8.3x 0.1x -0.1x 0.1x 0.2x 0.1x 0.2x
Nielsen Holdings plc $14.86 $11.62 $24.69 $5,297 $359 $8,590 $13,887 2.1x 2.2x 2.2x 7.5x 7.8x 7.6x 0.0x 0.0x 0.0x 0.3x 0.3x 0.3x
Alliance Data Systems Corporation $45.12 $20.51 $159.41 $2,149 $4,960 $14,772 $16,921 19.8x 3.5x 3.5x 13.0x 16.6x 14.1x -0.1x 4.7x 0.0x 1.5x 0.2x 0.2x
Yext, Inc. $16.61 $8.56 $22.65 $1,955 $249 ($117) $1,838 6.2x 5.2x 4.3x NM NM NM 0.3x 0.2x 0.2x -0.2x -0.1x -0.1x
MDC Partners Inc. $2.08 $1.01 $3.43 $150 $131 $824 $973 0.7x 0.6x 0.6x 5.6x 4.9x 4.5x 0.0x 0.0x 0.1x 0.1x 0.1x 0.1x
Mean 6.6x 4.4x 4.0x 11.4x 12.6x 11.3x 7.3% 52.7% 8.2% 32.5% 17.3% 19.5%Median 6.2x 3.5x 3.5x 7.6x 9.5x 8.3x 2.8% 4.1% 5.5% 17.2% 15.1% 17.4%

APPENDIX – RECENT ACQUISITIONS
28Notes:Sources: Capital IQ, Wall Street Estimates. Multiples <0x and >50x considered NM.
($MM)
Announced Date Acquirer Target Enterprise Value EV / LTM Rev. EV / LTM EBITDA EV / NTM Rev. EV / NTM EBITDA
6/26/2020 $1,300 NA NA NA NA
6/25/2020 $259 1.1x 7.5x NA NA
6/22/2020 $112 NA NA NA NA
6/19/2020 $128 5.4x NM 3.9x 12.0x
6/14/2020 Perfect Peony Holding Company $405 6.6x 43.0x 5.5x 19.3x
6/4/2020 $100 7.7x NA NA NA
6/1/2020 $1,800 NA NA NA NA
5/26/2020 $65 NA NA NA NA
5/12/2020 $160 NA NA NA NA
5/4/2020 $900 NA NA NA NA
4/23/2020 $75 7.3x 12.7x NA NA
4/3/2020 $260 1.6x 29.7x 1.3x 13.6x
4/2/2020 $8,700 3.6x 17.0x NA NA
(1)

APPENDIX – RECENT ACQUISITIONS
29Notes:Sources: Capital IQ, Wall Street Estimates. Multiples <0x and >50x considered NM.
($MM)
Announced Date Acquirer Target Enterprise Value EV / LTM Rev. EV / LTM EBITDA EV / NTM Rev. EV / NTM EBITDA
3/31/2020 $235 NA NA NA NA
3/25/2020 $879 NA NA NA NA
3/17/2020 $440 2.4x NA NA NA
3/17/2020 $8,714 3.8x 11.9x NA NA
3/6/2020 $615 NA NA NA NA
3/5/2020 $513 2.5x 25.7x NA NA
2/24/2020 $1,395 5.4x 14.0x NA NA
2/21/2020 $52 NA NA NA NA
2/19/2020 $569 5.4x 9.2x NA NA
2/11/2020 $588 2.6x 12.5x NA NA
2/10/2020 $66 1.1x 5.2x NA NA
2/5/2020 $200 NA NA NA NA
2/4/2020 $140 NA NA NA NA
San Vicente SPV
(1)
(1)
(1)
(2)
(2)
(2)

APPENDIX – RECENT ACQUISITIONS
30Notes:Sources: Capital IQ, Wall Street Estimates. Multiples <0x and >50x considered NM.
($MM)
Announced Date Acquirer Target Enterprise Value EV / LTM Rev. EV / LTM EBITDA EV / NTM Rev. EV / NTM EBITDA
1/29/2020 $450 NA NA NA NA
1/22/2020 $65 NA NA NA NA
1/21/2020 $300 2.7x NA NA NA
1/14/2020 $73 1.9x 12.2x 1.5x 11.2x
12/20/2019 $150 NA NA NA NA
12/20/2019 $691 2.7x NM 2.6x 27.6x
12/19/2019 $441 5.5x NM 4.8x NM
12/18/2019 $675 0.7x NM NA NA
12/18/2019 $145 5.5x NA NA NA
12/18/2019 $75 NA NA NA NA
12/17/2019 $4,677 3.7x 14.3x 3.5x 11.3x
12/16/2019 $3,197 2.5x 15.5x 2.4x 9.4x
12/5/2019 $51 NA NA NA NA
(1)
(1)
(1)
(1)
(1)
(1)
(1)

APPENDIX – RECENT ACQUISITIONS
31Notes:Sources: Capital IQ, Wall Street Estimates. Multiples <0x and >50x considered NM.
($MM)
Announced Date Acquirer Target Enterprise Value EV / LTM Rev. EV / LTM EBITDA EV / NTM Rev. EV / NTM EBITDA
12/4/2019 $2,010 7.7x NM NM NM
11/25/2019 $4,050 3.6x NA NA NA
11/20/2019 $4,000 20.0x NA 11.4x NA
11/19/2019 $140 NA NA NA NA
11/19/2019 $118 0.6x 6.4x 0.6x 5.7x
11/18/2019 $380 NA NA NA NA
10/22/2019 $2,878 3.7x 12.5x 3.5x 10.0x
10/22/2019 $215 5.4x NA NA NA
10/21/2019 $150 3.3x NA NA NA
10/16/2019 $110 NA NA NA NA
10/8/2019 $150 2.6x 14.6x NA NA
9/26/2019 $118 NA NA NA NA
9/24/2019 $100 NA NA NA NA
(1)
(1)
(1)
(1)
(2)

APPENDIX – RECENT ACQUISITIONS
32Notes:Sources: Capital IQ, Wall Street Estimates. Multiples <0x and >50x considered NM.
($MM)
Announced Date Acquirer Target Enterprise Value EV / LTM Rev. EV / LTM EBITDA EV / NTM Rev. EV / NTM EBITDA
9/24/2019 $1,000 NA NA NA NA
9/5/2019 $3,500 NA NA NA NA
9/2/2019 $152 1.9x NA NA NA
8/23/2019 $615 NA NA NA NA
8/22/2019 $4,535 3.8x 37.0x 3.2x 15.2x
8/13/2019 $20,947 1.6x 6.7x 1.5x 6.9x
8/8/2019 $92 NA NA NA NA
8/5/2019 $68 NA NA NA NA
8/5/2019 $2,296 0.8x 7.9x 0.8x 7.9x
7/29/2019 $66 1.9x NA NA NA
7/26/2019 $906 3.5x 15.7x 3.4x 11.1x
7/24/2019 $53 1.6x 17.7x NA NA
7/1/2019 $79 NA NA NA NA
(1)
(1)
(1)
(1)
(1)
(1)
MJR Theatres(1)

APPENDIX – IPOS IN PUBLIC REGISTRATION
33Notes:Sources: Capital IQ, Wall Street Estimates. Multiples <0x and >50x considered NM.
($MM)
Offering Amounts $10MM or Greater
Primary Initial Initial Offering LTM
Issuer Industry Filing Date Amount Description Revenue EBIT % Adj. EBITDA
Music 06/03/20 $1,925
Oerating segments include Recorded Music
and Music Publishing; Recorded Music
business consists of the discovery and
development of recording artists; Music
Publishing is an intellectual property business
$4,509 5% $477
E-Commerce 06/09/20 $465 Operates an E-Commerce platform for buying,
selling and trading new and used cars in the
United States
$1,332 (11%) ($143)
Entertainment 06/26/20 $350 Develops communication solutions that enable
real-time video, audio and live interactive
broadcasting
NA NA NA
DISCLAIMER
34
GCA Advisors, LLC is the US entity of GCA, a global investment bank that provides strategic M&A and capital markets advisory services to growth companies and market leaders. The firm offers worldwide coverage with over 500 professionals in 25 locations across America, Asia and Europe. Built by the people that run the business, GCA is a firm of experts who focus on deals that require commitment, original perspective, skill and exceptional networks.
www.gcaglobal.com
This report was prepared by GCA Advisors, LLC, a registered broker-dealer and member of FINRA and SIPC. Sources of data include Capital IQ and other news organizations. Information obtained from third-party sources is considered reliable, but we do not guarantee that the information herein is accurate and complete. The report shall not constitute an offer to sell or the solicitation of an offer to buy any of the securities mentioned herein; past performance does not guarantee future results. Recipients of this report should not interpret the information herein as sufficient grounds for an investment decision or any other decision.
DISCLAIMER: This report includes logos or other words or devices that may be registered trademarks of their respective owners. Such use is solely for purposes of convenience in referring to the trademark owners and their products/services. This report and its contents are not endorsed by, sponsored by, or affiliated with any trademark owners. GCA Advisors, LLC and its affiliates are not affiliated with any trademark owner but may provide financial services to one or more trademark owners or their affiliates. For more information regarding any transactions, please contact us.