Embed Size (px)
Citation preview
1
International Joint Master’s degree Programme – Second Cycle (D.M. 270/2004) in Environmental Sciences (Sustainable Development) Final thesis Performance testing of a combined solar and thermal-‐drying system for biological sludge Supervisor Ch. Prof. Francesco Gonella Assistant supervisors Ch. Prof. Ernst Worrell (Utrecht University) Dr. Paolo Franceschetti (Solwa srl) Graduand Stefano Grosso Matriculation Number 830497 Academic Year 2013 / 2014

2
3
TABLE OF CONTENTS
ABSTRACT 5
CHAPTER 1 – INTRODUCTION 6 1.1 WASTEWATER TREATMENT 7 1.1.1 A WASTEWATER TREATMENT PLANT AND SEWAGE SLUDGE 7 1.1.2 SLUDGE TREATMENT PHASES 9 1.1.3 EXISTING SLUDGE–DEWATERING METHODS 11 1.2 WASTEWATER TREATMENT PLANT AT TREVISO (ITALY) 13 1.3 SEWAGE SLUDGE MANAGEMENT AND REGULATION IN EUROPE 14 1.3.1 SEWAGE SLUDGE MANAGEMENT AND REGULATION IN ITALY 16 1.3.2 DIFFERENT SITUATIONS IN EUROPEAN COUNTRIES 17 1.4 BIOLOGICAL SLUDGE–DRYING 19 1.5 BIOLOGICAL SLUDGE INCINERATION 21 1.5.1 ADVANTAGES OF SLUDGE-‐DRYING AND INCINERATION 24 1.5.2 EMISSIONS FROM SLUDGE COMBUSTION 25
CHAPTER 2 – DESCRIPTION OF THE SYSTEMS 28 2.1 SOLAR STILL FOR WATER DEPURATION 28 2.2 FOOD–DRYING SYSTEM 30 2.3 SLUDGE–DRYING SYSTEM 31 2.3.1 COMBUSTION OF THE DRIED SLUDGE 32 2.3.2 TECHNICAL DESCRIPTION 33 2.3.3 COMPETITORS OF THE SLUDGE-‐DRYING SYSTEM 35
CHAPTER 3 – MATERIALS AND METHODS 38 3.1 ANALYSIS OF THE SOLAR-‐DRYING PROCESS 38 3.1.1 CALCULATION OF THE TOTAL SOLAR INCOMING RADIATION 38 3.1.2 DRYING VELOCITY AND DRYING RATE 39 3.1.3 ENTHALPY OF INCOMING AND OUTGOING AIR IN THE SOLAR COLLECTORS 40 3.2 ANALYSIS OF THE THERMAL-‐DRYING PROCESS 43 3.3 DETERMINATION OF SOLID AND ASHES CONTENT IN THE SEWAGE SLUDGE 44 3.4 COD DETERMINATION WITH TITRATION 45 3.4.1. COD DETERMINATION WITH DIGESTION IN MICROWAVES OVEN (MILESTONE) 46 3.5 MATERIALS 47 3.5.1 COLLECTION OF THE SAMPLES 48
CHAPTER 4 – RESULTS 49 4.1 SOLAR DRYING 49 4.1.1 FIRST WEEK OF TESTING 50 4.1.2 SECOND WEEK OF TESTING 52 4.1.3 THIRD WEEK OF TESTING 57 4.1.4 COMMENTS ON THE RESULTS OF THE SOLAR-‐DRYING EXPERIMENTATION 61 4.2 ENTHALPY AND EXCHANGED THERMAL POWER IN THE SOLAR COLLECTORS 62 4.3 THERMAL DRYING 65 4.3.1 FIRST TEST 65 4.3.2 SECOND TEST 67 4.3.3 VOLUME LOSS 72 4.4 TOTAL SOLIDS (TS) AND TOTAL VOLATILE SOLIDS (TVS) DETERMINATION 72 4.5 HEATING VALUE OF BIOLOGICAL SLUDGE AND DIGESTATE AFTER COMBUSTION 73
4
4.6 COD ANALYSIS (ORGANIC CONTENT) 74 4.7 INPUT AND OUTPUT DATA OF THE SLUDGE DRYING SYSTEM 75
CHAPTER 5 – CONCLUSIONS 82
BIBLIOGRAPHY 87
TABLE OF FIGURES 90
5
Abstract The present work has the principal objective of testing and improving the per-‐
formance of an innovative system for biological sludge drying, which combines
an inner high-‐performance sludge burner with solar-‐air heaters. The research
question is: how to implement the design and structure of the drying system, de-‐
fining its best working conditions (best temperature, materials and dimensions
of its components, etc.).
Current practices of wastewater treatment, in particular the treatment of biolog-‐
ical sludge from urban sewage, are introduced first, with insight into current
management issues in Europe and Italy. Solar-‐drying technology is then de-‐
scribed, along with a presentation of the system developed for this project. In
addition, its technical advantages and the possible environmental benefits that
the technology could bring, especially in comparison to other solar-‐drying plants
available on the market, are demonstrated.
Testing was done separately on two solar-‐drying systems and in a laboratory ov-‐
en, in order to assess the response of the biological sludge to solar and thermal
heating.
Moreover, the measure of the heating value during the combustion phase is pre-‐
sented, followed by a brief literature review regarding possible emissions into
the atmosphere: this data is necessary for the development of the project, be-‐
cause the heat produced by combustion will be put back into the system to dry
the new wet sludge, obtaining a final product with about 85% dry matter.
This system is expected to have a strong economic appeal, since it can produce
large cost savings: this product is completely new on the market in terms of ex-‐
pected performance, design, technology and dimensions.
6
Chapter 1 – Introduction The present work is embedded in a field of research started at Ca’ Foscari Uni-‐
versity of Venice and further developed by Solwa srl, a start-‐up company found-‐
ed by Dr. Paolo Franceschetti. He was a former Ph.D. student at Ca’ Foscari Uni-‐
versity studying “Renewable energy and distributed microgeneration”. With the
creation of an innovative solar still for water depuration called Solwa, he was
awarded with many national and international prizes1 (the system will be de-‐
scribed in Paragraph 2.1). Starting from the knowledge acquired in the develop-‐
ment of the Solwa prototype, other innovative systems were proposed, such as
the one for food drying (see Paragraph 2.2).
The prototypes developed are innovative in terms of size, design and technologi-‐
cal features and aim to enter the market as sustainable and environmentally
friendly systems, with, at the same time, better performances in terms of costs
and efficiency, compared to their competitors. It is from this line of research that
the system for sludge drying and burning has been designed.
The structure of the thesis will be organized as follows: there will be a descrip-‐
tion of wastewater and sewage sludge treatment and management, and the exist-‐
ing technologies for its disposal; the regulatory framework will be described and
the current emissions from sludge incineration, as described in literature, will be
analysed. Then, the two prototypes (solar still and food drying) will be intro-‐
duced, and the sludge drying and burning project will be fully described. Finally,
the experimental part will be presented, including materials and method applied,
presentation and discussion of the results, and conclusions derived from the
whole project.
1 2010: Solwa solar still has been included in the IDEASS UN Program for the “Innovation for Development of Humanity”. 2011: MIT – Massachusetts Institute Of Technology (Boston – USA): Solwa project is awarded as “Italian innovation of the year” by the Journal “Technology review”. 2012: Solwa srl. is awarded first place by Huffington Post (World) in an evaluation of the 10 technological successes of the year worldwide. 2012: Gaetano Marzotto award (Vicenza – Italy): winner of the award “Impresa del futuro” (Firm of the fu-‐ture). [http://www.solwa.it]
7
1.1 Wastewater treatment Wastewater Treatment (WWT) is a process that makes water suitable for partic-‐
ular uses, such as drinking, industry or medicine. Depending on the end use, the
process is very different. In general, wastewater treatment can be divided into
three categories:
1) Purification for domestic use
2) Treatment for industrial application
3) Treatment of the wastewater before discharge or reuse
The different types of treatment also depend on the quality of the original water.
Urban wastewater generally contains a mix of various substances: oxygen con-‐
suming material, sediments, fats, oils, foam, salts, nutrients, pathogens and a lot
of other objects that ends up in the discharge.
In WWT, the removed substances are:
-‐ the sifted material;
-‐ the material after coarse screening;
-‐ foam and sludge.
Sludge is generally the substance produced most abundantly and can be in liquid
or semi-‐solid form, with a typical solid content between 0.25 and 12%
(Stoddard, et al., 2003). Sludge, then, is the side-‐product of wastewater treat-‐
ment that interests more the purpose of this thesis project because, as it will be
presented in the following sections, its disposal is a great issue of modern socie-‐
ty.
1.1.1 A Wastewater Treatment Plant and Sewage Sludge
The wastewater treatment takes normally place in one assigned area: a conven-‐
tional wastewater treatment plant (WWTP), which comprises different pro-‐
cesses. The result is generally purified water on one side and biological sludge on
the other; this is a general scheme:
8
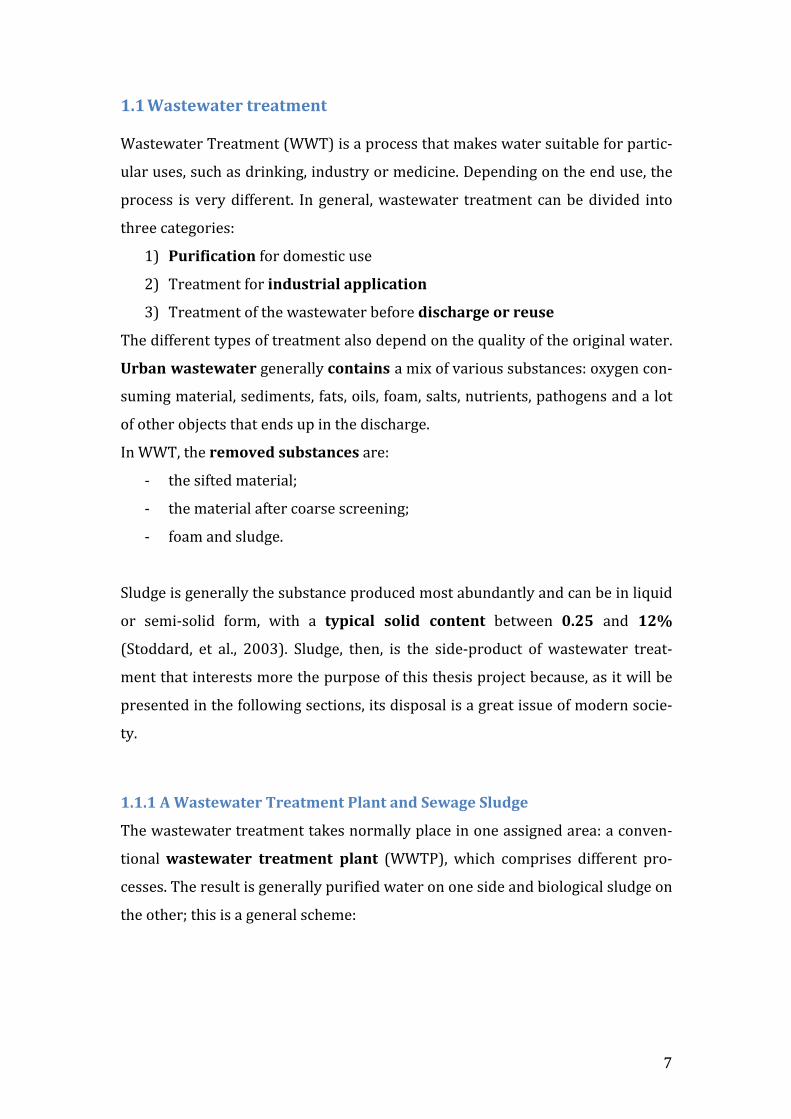
Figure 1 – Basic flow diagram for conventional wastewater treatment plant
It is then important to distinguish the different types of sludge and from which
phase of the process they are taken, in order to better understand which might
be their composition and physic-‐chemical characteristics. A WWTP in general
produces three types of sludge (Reverdy, et al., 2013):
-‐ Primary biological sludge comes from the settling of the effluents, pre-‐
viously suspended in water.
-‐ Secondary biological sludge is produced from the settling of the organic
matter (including bacteria). Part of the sludge is regularly removed from
the tanks in order to avoid an excess of biomass.
-‐ Tertiary biological sludge or physical-‐chemical sludge (derived from
primary sludge): with the addition of a coagulant, the organic matter com-‐
ing from wastewaters is agglomerated; 90% of the suspended matter can
be captured and settled, forming tertiary sludge, that contains a major
part of water mineral salts and coagulant agent.
The characteristics of sewage sludge are also very different depending on the
origin of the wastewater. In particular, different hazardous compounds can
be present in the sewage from industrial process, depending on the production
chain. For example, tannery sludge generally has a high Cr6+ content or sludge
from paper industry contains various bleaching compounds. Another type of
sludge is the so-‐called “Red mud” which is a waste product of the production of
aluminium in the mining industry through the Bayer process (refining bauxite
en route to alumina).
One interesting possibility that has to be tested in future research is the incin-‐
eration in the proposed system (see paragraph 1.5 and 2.3.1) not only of sludge
! N!
D'*3! G'>($! FFR2! >=%! (+.*! -(05,+#-'1* ,150."* )%(+'-(-(.* 2'^'#0%5,* )%&3
7%5(0,!.=6B!(.!B&(<8!3&%(+.!*'!B&e(<(+&$%!6B'*3)=3C!RB).!>&6(=.&!%B&!B(h('0\
*=.!6*3@*=$0.!('&!1&$&'(++8!3(0&!*D!2"'84*7'#+-)1",!HB)6B!('&!$*%!.=@@*.&0!
%*!&$0!(.!&3)..)*$.! )$%*! %B&!(%3*.@B&'&!>=%!.B*=+0!#"&'-(* -(* +2"* ',2",! %B(%!
('&!0).@*.&0!*D!)$!+($0D)++.C!A='%B&'!'&.&('6B!H)++!%B&$!B(<&!%*!D*6=.!*$!%B&!($(+8\
.).!*D!%B&!&3)..)*$.!*D!)$0=.%')(+!.+=01&C!
!
>R>R<*6150."*+#"'+&"(+*72',",*
#$! %B).! .&6%)*$a! %B&! 3()$! @'*6&..&.! D*'! .+=01&! %'&(%3&$%! ('&! >')&D+8! 0&.6')>&0c!
.+=01&! H)%B! 0)DD&'&$%! 6B('(6%&').%)6.! 9.=6B! (.! .*+)0! 6*$%&$%:! 6*3&.! *=%! D'*3!
%B*.&! @B(.&.! ($0! (+.*! %B&! .+=01&! =.&0! )$! %B&! &e@&')3&$%(+! @('%! H(.! .(3@+&0!
D'*3!.)3)+('!(@@('(%=.C!
!
Q!FFR!@'*6&..a!)$!D(6%a!(66=3=+(%&.!B)1B!(3*=$%.!*D!.+=01&!%B(%!3=.%!>&!%'&(%\
&0!($0!0).@*.&0!*D!)$!(!.(D&!($0!&DD&6%)<&!3($$&'C!RB&!3()$!@B(.&.!1&$&'(++8!('&c!
!
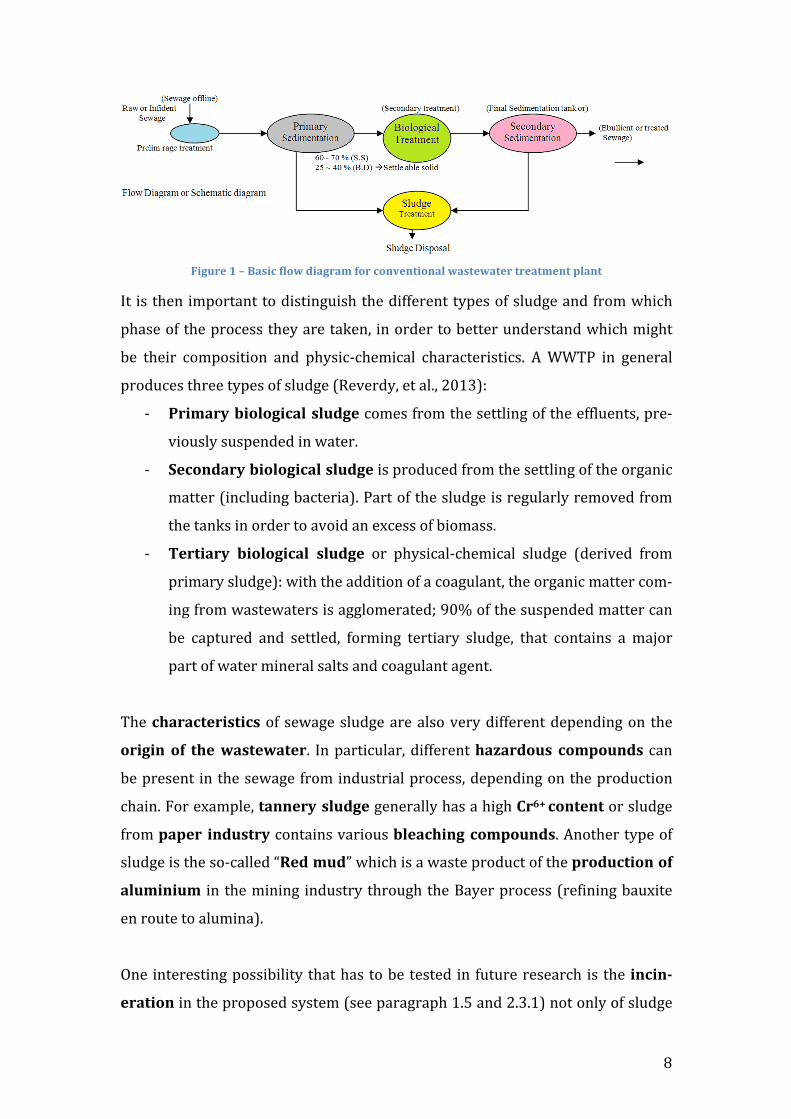
>X*!#"3+2-)`"(-(.*72',"c!%B&!'*+&!*D!(!%B)6_&$&'!).!%*!'&0=6&!%B&!H(%&'!6*$%&$%!
*D!%B&!.+=01&C!RB).!)3@'*<&.!%B&!@&'D*'3($6&!*D!($8!0*H$.%'&(3!0&@('%3&$%!D*'!
3&6B($)6(+!0&B80'(%)*$C!
!
RB&!%B)6_&$)$1!@B(.&!6($!*66='!>8c!
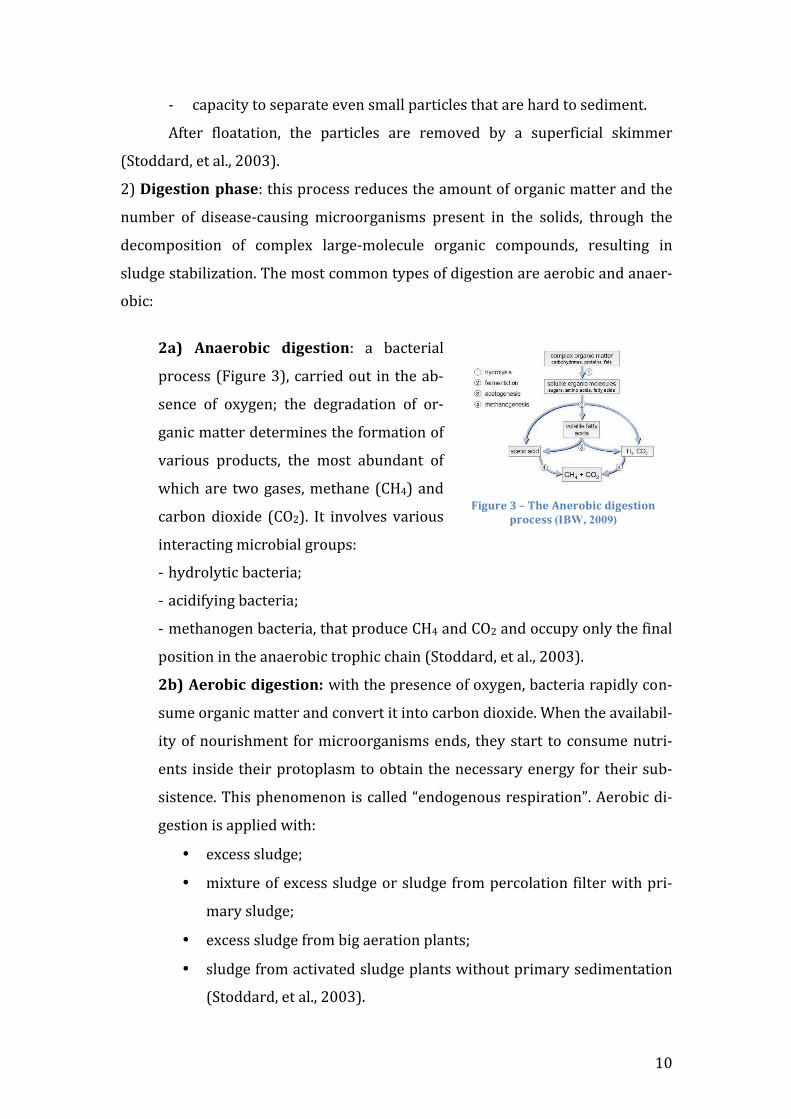
3*:#'8-+4a*.&0)3&$%(%)*$!*D!%B&!B&(<)\
&'!@('%)6+&.!9.&&!A)1='&!P:C*
3*G1%'+'+-%(a*%B&!@')$6)@+&!).!%B&!(0B&\
.)*$!*D!+)%%+&!1(.!>=>>+&.a!1&$&'(++8!()'a!
%*! %B&! .*+)0! @('%)6+&.a! )$! *'0&'! %*! '&\
0=6&! %B&! %*%(+! .@&6)D)6! H&)1B%! *D! %B&!
D*'3&0! (11+*3&'(%)*$a! %B=.! @&'3)%\
%)$1!)%.!D'&&!D+*(%(%)*$!%*!%B&!.='D(6&!*D!
%B&!H(%&'C!
RB&!(0<($%(1&.!*D!%B).!.8.%&3!6*3@('&0!%*!.&0)3&$%(%)*$!('&c!
\ D(.%&'!.*+)0\+)b=)0!.&@('(%)*$!
*
G-.5#"*<*M*:#'8-+'+-%('1*+2-)`"("#*%$*B#"8-,%*SSB!*
! "L!
\ 6(@(6)%8!%*!.&@('(%&!&<&$!.3(++!@('%)6+&.!%B(%!('&!B('0!%*!.&0)3&$%C!
QD%&'! D+*(%(%)*$a! %B&! @('%)6+&.! ('&! '&3*<&0! >8! (! .=@&'D)6)(+! ._)33&'!
95%*00('0a!&%!(+Ca!PLLK:C!
P:!O-.",+-%(*72',"c!%B).!@'*6&..!'&0=6&.!%B&!(3*=$%!*D!*'1($)6!3(%%&'!($0!%B&!
$=3>&'! *D! 0).&(.&\6(=.)$1! 3)6'**'1($).3.! @'&.&$%! )$! %B&! .*+)0.a! %B'*=1B! %B&!
0&6*3@*.)%)*$! *D! 6*3@+&e! +('1&\3*+&6=+&! *'1($)6! 6*3@*=$0.a! '&.=+%)$1! )$!
.+=01&!.%(>)+)h(%)*$C!RB&!3*.%!6*33*$!%8@&.!*D!0)1&.%)*$!('&!(&'*>)6!($0!($(&'\
*>)6c!
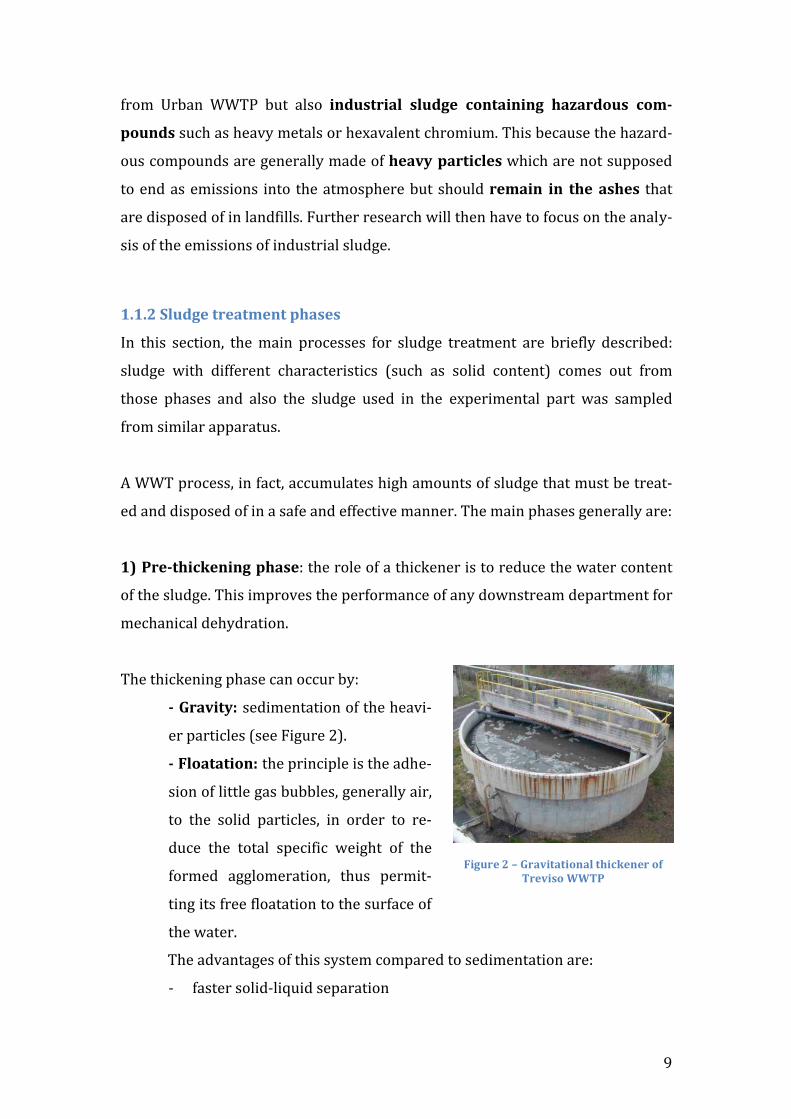
!!<'X* 9('"#%/-)* 0-.",+-%(c! (! >(6%&')(+!
@'*6&..!9A)1='&!K:a!6('')&0!*=%! )$!%B&!(>\
.&$6&! *D! *e81&$i! %B&! 0&1'(0(%)*$! *D! *'\
1($)6!3(%%&'!0&%&'3)$&.!%B&!D*'3(%)*$!*D!
<(')*=.! @'*0=6%.a! %B&! 3*.%! (>=$0($%! *D!
HB)6B!('&! %H*!1(.&.a!3&%B($&! 97UM:!($0!
6('>*$!0)*e)0&! 97WP:C! #%! )$<*+<&.! <(')*=.!
)$%&'(6%)$1!3)6'*>)(+!1'*[email protected]!
\ B80'*+8%)6!>(6%&')(i!
\ (6)0)D8)$1!>(6%&')(i!
\ 3&%B($*1&$!>(6%&')(a!%B(%!@'*0=6&!7UM!($0!7WP!($0!*66=@8!*$+8!%B&!D)$(+!
@*.)%)*$!)$!%B&!($(&'*>)6!%'*@B)6!6B()$!95%*00('0a!&%!(+Ca!PLLK:C!
</X*9"#%/-)*0-.",+-%(a*H)%B!%B&!@'&.&$6&!*D!*e81&$a!>(6%&')(!'(@)0+8!6*$\
.=3&!*'1($)6!3(%%&'!($0!6*$<&'%!)%!)$%*!6('>*$!0)*e)0&C!FB&$!%B&!(<()+(>)+\
)%8!*D!$*=').B3&$%! D*'!3)6'**'1($).3.!&$0.a! %B&8!.%('%! %*!6*$.=3&!$=%')\
&$%.! )$.)0&!%B&)'!@'*%*@+(.3!%*!*>%()$!%B&!$&6&..('8!&$&'18!D*'!%B&)'!.=>\
.).%&$6&C!RB).!@B&$*3&$*$!).!6(++&0!f&$0*1&$*=.!'&.@)'(%)*$gC!Q&'*>)6!0)\
1&.%)*$!).*(@@+)&0!H)%Bc!
• &e6&..!.+=01&i!
• 3)e%='&!*D!&e6&..!.+=01&!*'!.+=01&!D'*3!@&'6*+(%)*$!D)+%&'!H)%B!@')\
3('8!.+=01&i!
• &e6&..!.+=01&!D'*3!>)1!(&'(%)*$!@+($%.i!
• .+=01&!D'*3!(6%)<(%&0!.+=01&!@+($%.!H)%B*=%!@')3('8!.&0)3&$%(%)*$!
95%*00('0a!&%!(+Ca!PLLK:C!
G-.5#"*?*M*B2"*9("#%/-)*0-.",+-%(*7#%)",,*(IBW, 2009)*
11
It can be observed that every phase has a different result in the sludge composi-‐
tion: the thickener increases the solid content while the digestion reduces the
organic content and the amount of bacteria.
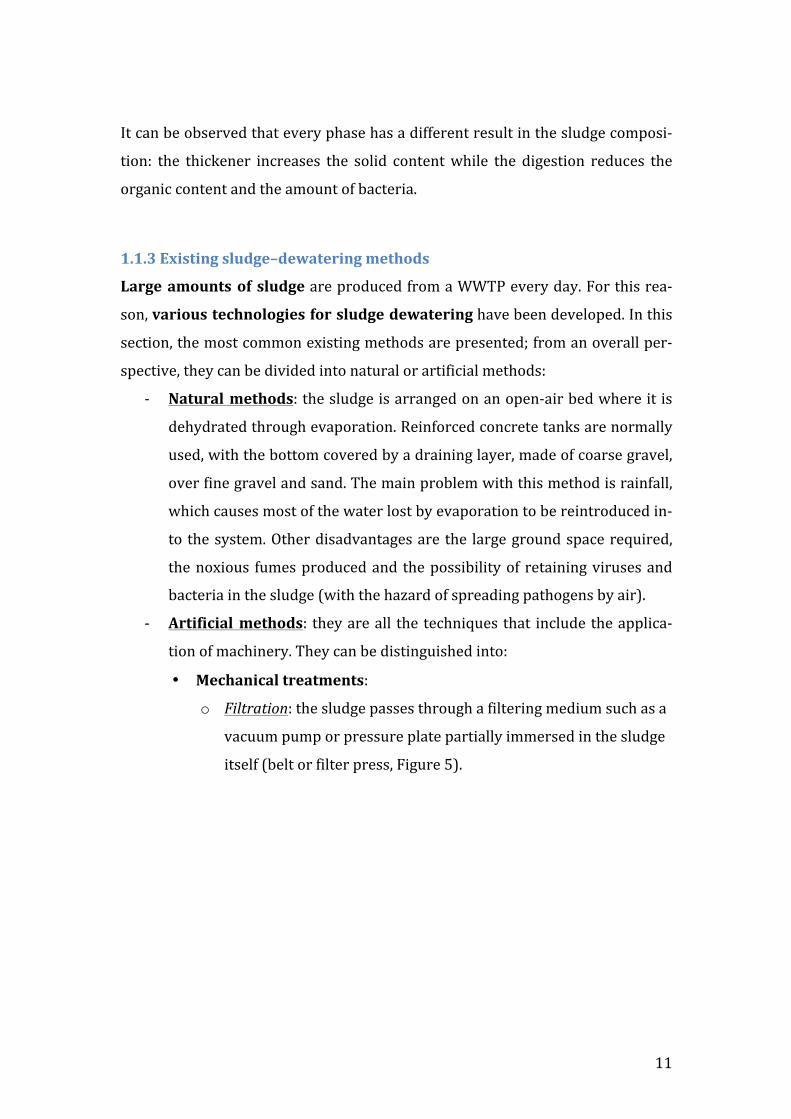
1.1.3 Existing sludge–dewatering methods
Large amounts of sludge are produced from a WWTP every day. For this rea-‐
son, various technologies for sludge dewatering have been developed. In this
section, the most common existing methods are presented; from an overall per-‐
spective, they can be divided into natural or artificial methods:
-‐ Natural methods: the sludge is arranged on an open-‐air bed where it is
dehydrated through evaporation. Reinforced concrete tanks are normally
used, with the bottom covered by a draining layer, made of coarse gravel,
over fine gravel and sand. The main problem with this method is rainfall,
which causes most of the water lost by evaporation to be reintroduced in-‐
to the system. Other disadvantages are the large ground space required,
the noxious fumes produced and the possibility of retaining viruses and
bacteria in the sludge (with the hazard of spreading pathogens by air).
-‐ Artificial methods: they are all the techniques that include the applica-‐
tion of machinery. They can be distinguished into:
• Mechanical treatments:
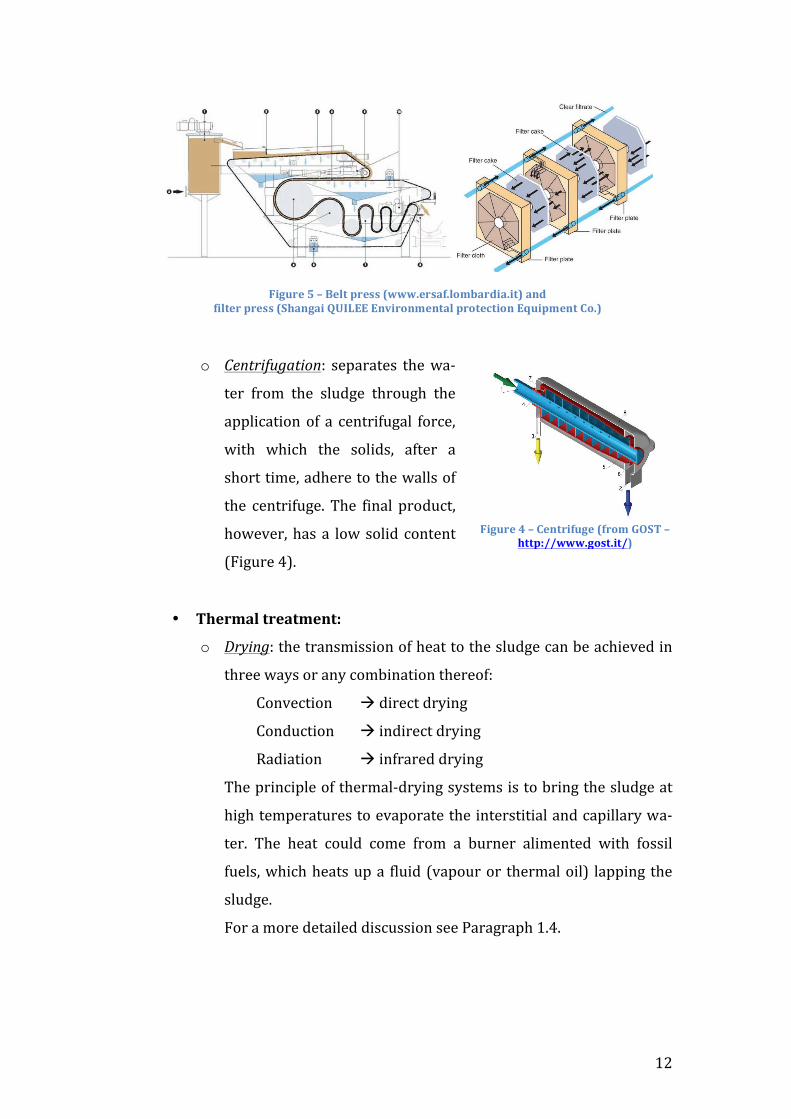
o Filtration: the sludge passes through a filtering medium such as a
vacuum pump or pressure plate partially immersed in the sludge
itself (belt or filter press, Figure 5).
! "P!
!
o :.95-834;05869c! .&@('(%&.! %B&!H(\
%&'! D'*3! %B&! .+=01&! %B'*=1B! %B&!
(@@+)6(%)*$!*D! (! 6&$%')D=1(+! D*'6&a!
H)%B! HB)6B! %B&! .*+)0.a! (D%&'! (!
.B*'%!%)3&a!(0B&'&!%*!%B&!H(++.!*D!
%B&! 6&$%')D=1&C! RB&! D)$(+! @'*0=6%a!
B*H&<&'a!B(.!(! +*H!.*+)0! 6*$%&$%!
9A)1='&!M:C!
!
• B2"#&'1*+#"'+&"(+a*
o "-<89;c!%B&!%'($.3)..)*$!*D!B&(%!%*!%B&!.+=01&!6($!>&!(6B)&<&0!)$!
%B'&&!H(8.!*'!($8!6*3>)$(%)*$!%B&'&*Dc!!
7*$<&6%)*$! !!0)'&6%!0'8)$1!
7*$0=6%)*$! !!)$0)'&6%!0'8)$1!
S(0)(%)*$! !!)$D'('&0!0'8)$1!
RB&!@')$6)@+&!*D!%B&'3(+\0'8)$1!.8.%&3.!).!%*!>')$1!%B&!.+=01&!(%!
B)1B!%&3@&'(%='&.!%*!&<(@*'(%&!%B&!)$%&'.%)%)(+!($0!6(@)++('8!H(\
%&'C! RB&! B&(%! 6*=+0! 6*3&! D'*3! (! >='$&'! (+)3&$%&0! H)%B! D*..)+!
D=&+.a!HB)6B!B&(%.!=@!(! D+=)0!9<(@*='!*'! %B&'3(+!*)+:! +(@@)$1! %B&!
.+=01&C!
A*'!(!3*'&!0&%()+&0!0).6=..)*$!.&&!2('(1'(@B!"CMC!
!
* *
G-.5#"*K*M*C"1+*7#",,*W\\\R"#,'$R1%&/'#0-'R-+X*'(0*$-1+"#*7#",,*W62'(.'-*cPNDEE*E(8-#%(&"(+'1*7#%+")+-%(*Ed5-7&"(+*H%RX!
!G-.5#"*A*M*H"(+#-$5."*W$#%&*:F6B*M*
2++7a@@\\\R.%,+R-+@X!
13
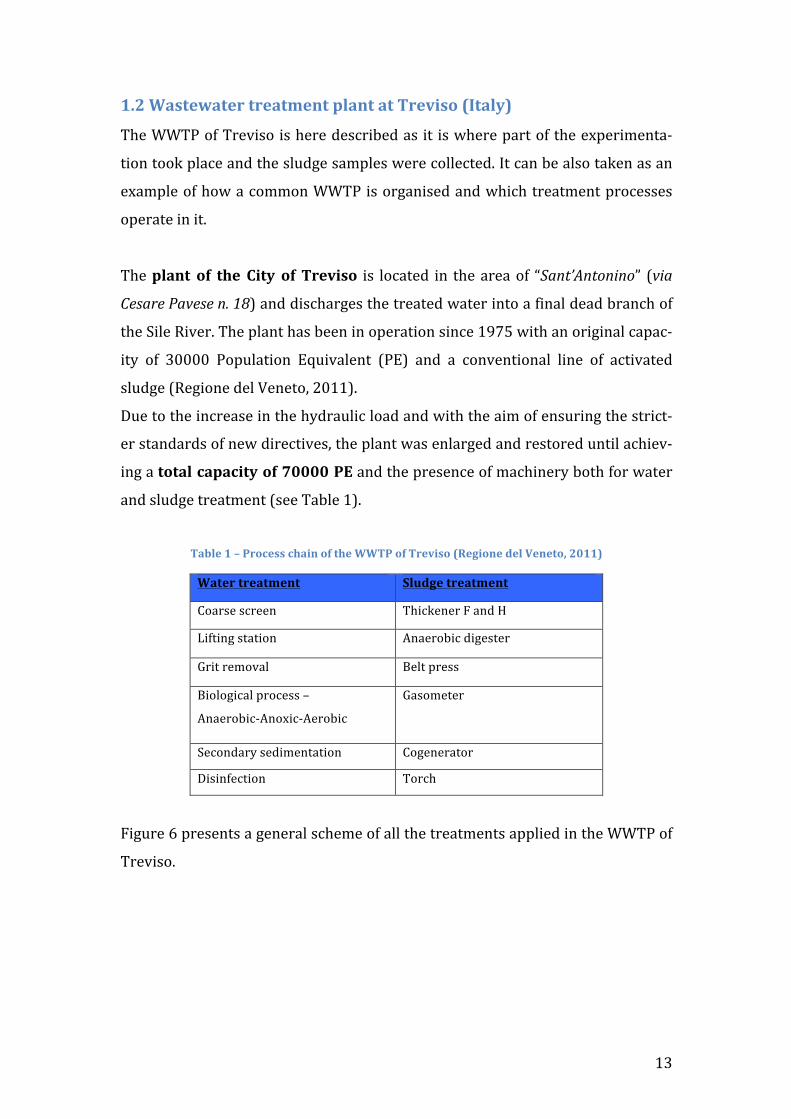
1.2 Wastewater treatment plant at Treviso (Italy)
The WWTP of Treviso is here described as it is where part of the experimenta-‐
tion took place and the sludge samples were collected. It can be also taken as an
example of how a common WWTP is organised and which treatment processes
operate in it.
The plant of the City of Treviso is located in the area of “Sant’Antonino” (via
Cesare Pavese n. 18) and discharges the treated water into a final dead branch of
the Sile River. The plant has been in operation since 1975 with an original capac-‐
ity of 30000 Population Equivalent (PE) and a conventional line of activated
sludge (Regione del Veneto, 2011).
Due to the increase in the hydraulic load and with the aim of ensuring the strict-‐
er standards of new directives, the plant was enlarged and restored until achiev-‐
ing a total capacity of 70000 PE and the presence of machinery both for water
and sludge treatment (see Table 1).
Table 1 – Process chain of the WWTP of Treviso (Regione del Veneto, 2011)
Water treatment Sludge treatment
Coarse screen Thickener F and H
Lifting station Anaerobic digester
Grit removal Belt press
Biological process –
Anaerobic-‐Anoxic-‐Aerobic
Gasometer
Secondary sedimentation Cogenerator
Disinfection Torch
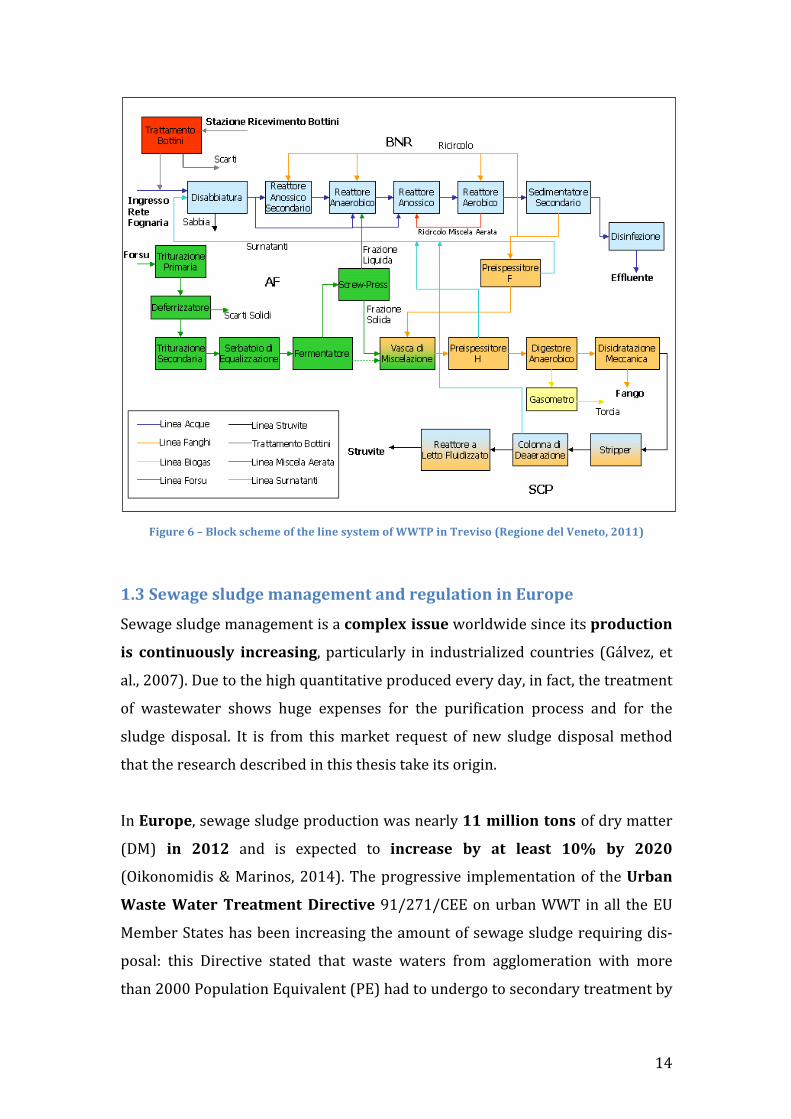
Figure 6 presents a general scheme of all the treatments applied in the WWTP of
Treviso.
14
Figure 6 – Block scheme of the line system of WWTP in Treviso (Regione del Veneto, 2011)
1.3 Sewage sludge management and regulation in Europe
Sewage sludge management is a complex issue worldwide since its production
is continuously increasing, particularly in industrialized countries (Gálvez, et
al., 2007). Due to the high quantitative produced every day, in fact, the treatment
of wastewater shows huge expenses for the purification process and for the
sludge disposal. It is from this market request of new sludge disposal method
that the research described in this thesis take its origin.
In Europe, sewage sludge production was nearly 11 million tons of dry matter
(DM) in 2012 and is expected to increase by at least 10% by 2020
(Oikonomidis & Marinos, 2014). The progressive implementation of the Urban
Waste Water Treatment Directive 91/271/CEE on urban WWT in all the EU
Member States has been increasing the amount of sewage sludge requiring dis-‐
posal: this Directive stated that waste waters from agglomeration with more
than 2000 Population Equivalent (PE) had to undergo to secondary treatment by
15
the end of 2005: this increased the number of houses connected to the sewage
system (EC, 2014a).
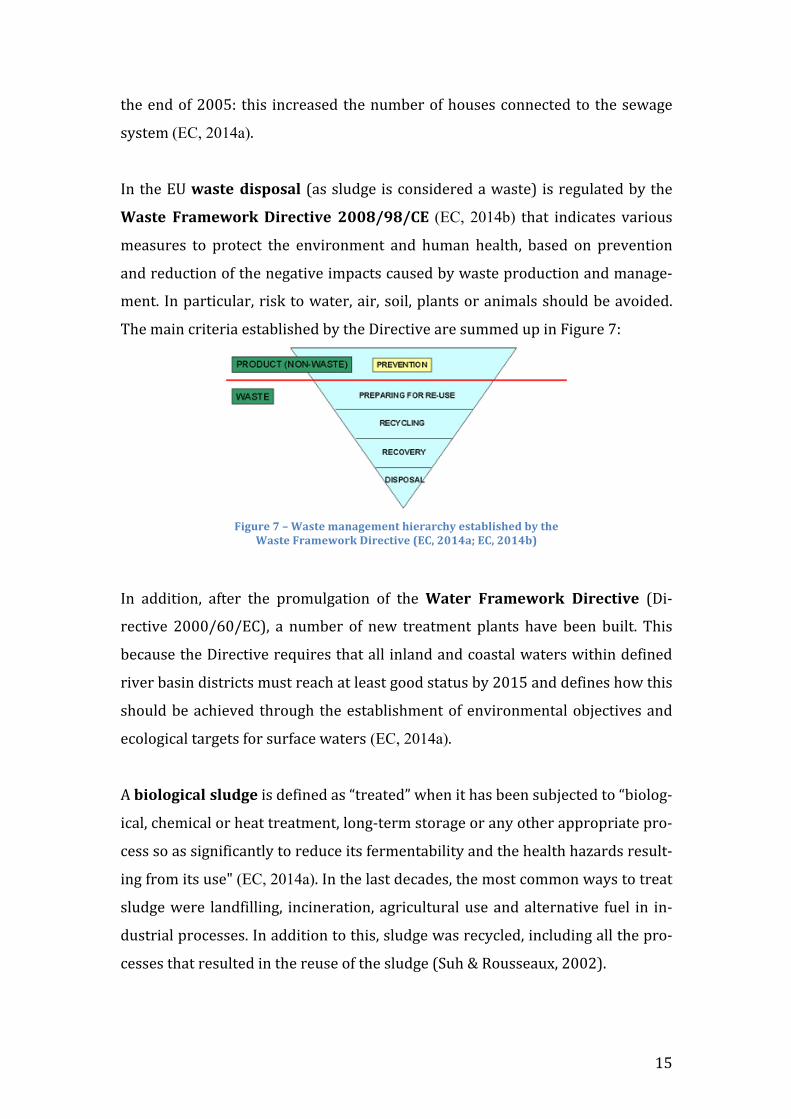
In the EU waste disposal (as sludge is considered a waste) is regulated by the
Waste Framework Directive 2008/98/CE (EC, 2014b) that indicates various
measures to protect the environment and human health, based on prevention
and reduction of the negative impacts caused by waste production and manage-‐
ment. In particular, risk to water, air, soil, plants or animals should be avoided.
The main criteria established by the Directive are summed up in Figure 7:
Figure 7 – Waste management hierarchy established by the
Waste Framework Directive (EC, 2014a; EC, 2014b)
In addition, after the promulgation of the Water Framework Directive (Di-‐
rective 2000/60/EC), a number of new treatment plants have been built. This
because the Directive requires that all inland and coastal waters within defined
river basin districts must reach at least good status by 2015 and defines how this
should be achieved through the establishment of environmental objectives and
ecological targets for surface waters (EC, 2014a).
A biological sludge is defined as “treated” when it has been subjected to “biolog-‐
ical, chemical or heat treatment, long-‐term storage or any other appropriate pro-‐
cess so as significantly to reduce its fermentability and the health hazards result-‐
ing from its use" (EC, 2014a). In the last decades, the most common ways to treat
sludge were landfilling, incineration, agricultural use and alternative fuel in in-‐
dustrial processes. In addition to this, sludge was recycled, including all the pro-‐
cesses that resulted in the reuse of the sludge (Suh & Rousseaux, 2002).
16
The most attractive option for sludge disposal so far has been use in agricul-‐
ture, since the sewage sludge, due to the physical-‐chemical processes involved in
its treatment, is rich in nutrients (mainly nitrogen and phosphorous) and valu-‐
able organic matter, useful when soils are depleted or subject to erosion. This
solution has been, however, recently criticised because the sludge also tends to
concentrate heavy metals and poorly-‐biodegradable trace organic compounds
and pathogens (viruses, bacteria etc.) present in wastewaters (EC, 2014a). These
substances (in particular heavy metals) can cause soil contamination, even
though European regulations limit the amount of metallic materials in the
sludge.
More recently, another issue has emerged, concerning the organic pollutants
sludge can contain, such as pharmaceuticals, pesticides and personal care prod-‐
ucts, which might have an impact on the food chain (Lederer & Rechberger,
2010). European legislation also restricts the final disposal of sludge in landfills,
requiring a decrease to 35% biodegradable content in it by 2020 (Stehlik, 2009).
Sludge disposal is then an issue that is going to worsen in the next future: Euro-‐
pean regulations, posing stricter limits regarding landfilling and agriculture, is
trying to direct the producer to find new solutions for a safe disposal even
though it seems that insufficient effort is brought for a regulation that should fa-‐
vour this alternatives.
1.3.1 Sewage sludge management and regulation in Italy
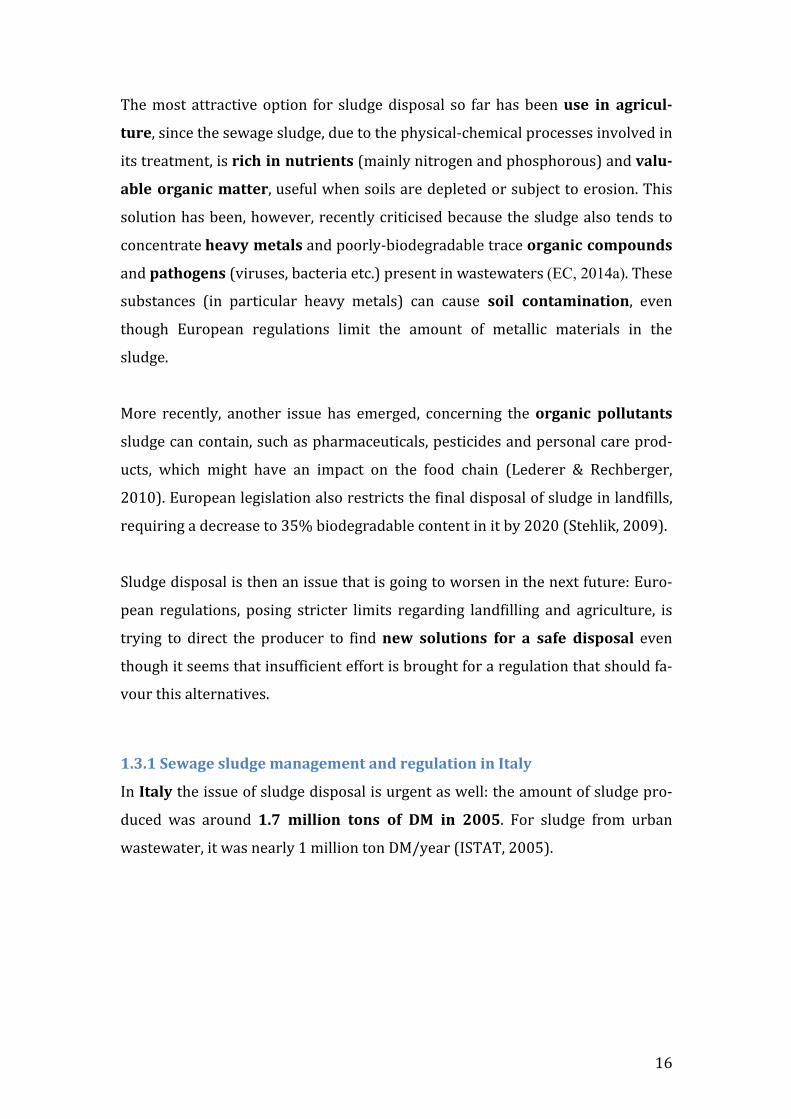
In Italy the issue of sludge disposal is urgent as well: the amount of sludge pro-‐
duced was around 1.7 million tons of DM in 2005. For sludge from urban
wastewater, it was nearly 1 million ton DM/year (ISTAT, 2005).
17
Table 2 – ISTAT (2005) data for sludge amount in Italy
Primary [Mtons/year]
Secondary [Mtons/year]
Tertiary [Mtons/year]
Total [Mtons/year]
Italy 9002 6049 1850 16901 Northwest 3773 1744 429 5946 Northeast 2752 1109 514 4375 Centre 1452 1482 330 3264 South 907 1165 359 2431 Islands 118 549 218 885
In the Italian regulation, sludge is defined in the Testo Unico Ambientale (D. Lgs.
152/2006) as “treated or untreated residue coming from urban wastewater
treatment plant” (art. 74). It is then considered special waste and its manage-‐
ment is governed by part IV of D. Lgs. 152/2006; article 127, however, states
that the sludge must be reused whenever it is appropriate. Sludge disposal
should then be done by:
-‐ Incineration, aimed at energy recovery of the sludge itself or together
with the organic fraction of the urban wastes.
-‐ Disposal in controlled landfills for special waste (resumed from D. Lgs.
36/03 and D.M. 03/08/2005).
In addition, D. Lgs. 99/1992 (embodied in the D. Lgs. 152/2006), which was the
implementation of the European Directive 86/278/CEE, regulates the use of
sewage sludge in agriculture. This Directive enhances the use of sludge for agri-‐
cultural purposes by spreading onto the soil, trying at the same time to prevent
eventual harmful effects on agricultural land, vegetation, animals and man. Com-‐
posting of the sludge is suggested for a subsequent use in agriculture, together
with reuse in the production of bricks, asphalt and concrete. The spread onto the
soil of untreated sludge, however, is forbidden, unless it is injected or incorpo-‐
rated into the soil, and whenever its heavy metals content does not meet the re-‐
quirements of the legislation.
1.3.2 Different Situations in European countries
The situation of sludge production and disposal varies widely by country: this
section will briefly present the actual situation in European Union Member
States (EU-‐27) and the future predictions by 2020 provided by Kelessidis &
Stasinakis (2012).
18
In the European Union countries, specific sludge production ranges from 0.1
kg per PE and year (Malta) to 30.8 kg per PE and year (Austria) (Kelessidis &
Stasinakis, 2012). As said before, the legislation on this sector is outlined by the
European Directive 86/278/EC but many countries have adopted more strin-‐
gent regulations, with lower limit values for heavy metals, organic micropollu-‐
tants and pathogens (Kelessidis & Stasinakis, 2012).
The type of treatments adopted, as well, varies between countries: the most
popular stabilisation methods are aerobic (in 24 countries) and anaerobic di-‐
gestion (in 20 countries); mechanical sludge dewatering is generally preferred
comparing to the use of drying beds in all Member states (EU-‐27), while thermal
drying is the most common practice in old Member States (EU-‐15 countries), in
particular in Germany, Italy, France and United Kingdom.
Regarding the final disposal of sludge, reuse is the most applied in EU-‐15 coun-‐
tries (53% of produced sludge), followed by incineration (21% of produced
sludge), while in the new Member States that joined EU after 2004 (EU-‐12), the
most common disposal method is still landfilling (Kelessidis & Stasinakis,
2012).
Based on current trends, Kelessidis & Stasinakis (2012) have also produced fore-‐
casts for sludge management by 2020, dividing the countries into five groups:
• Group 1 – Increasing agriculture use only: France, Malta.
• Group 2 – Status quo: Germany, Estonia, Netherlands, Cyprus.
• Group 3 – Increasing incineration only: Austria Portugal Slovakia,
Hungary, Belgium (mainly) and Latvia, Denmark, Ireland, Luxembourg
(less).
• Group 4 – Increasing (mainly) agriculture and incineration: Sweden
(major shift to composting and co-‐incineration), Czech Republic (com-‐
posting), Lithuania, Poland (composting), Romania, Slovenia, United
Kingdom.
19
• Group 5 – Increasing agriculture and (mainly) incineration: Spain, It-‐
aly (composting), Bulgaria, Finland, Greece (Kelessidis & Stasinakis,
2012).
It is then interesting to observe that the situation is very faceted: EU-‐12 coun-‐
tries will temporary enhance landfilling since they will have to face at first a ur-‐
gent situation but then up to 2020 an increase in agricultural reuse can be ex-‐
pected. Regarding EU-‐15 countries, agricultural recycling and incineration
seems to be the practices most favourable to be adopted by 2020.
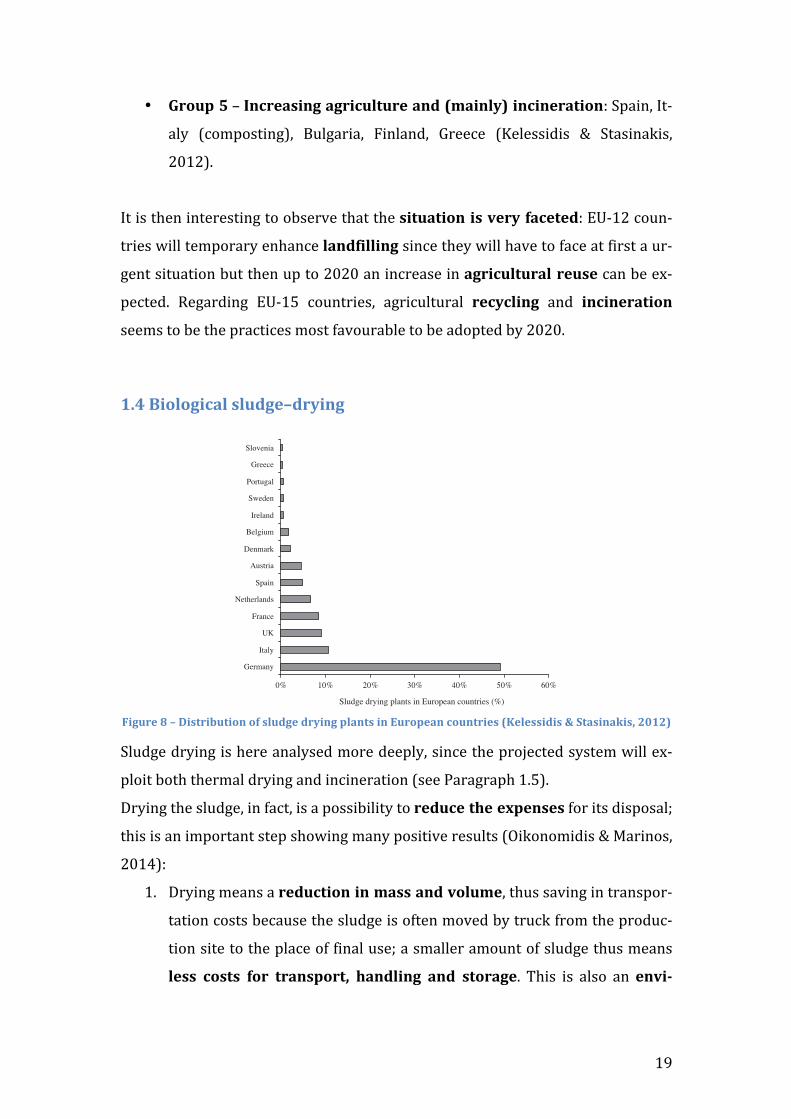
1.4 Biological sludge–drying
Figure 8 – Distribution of sludge drying plants in European countries (Kelessidis & Stasinakis, 2012)
Sludge drying is here analysed more deeply, since the projected system will ex-‐
ploit both thermal drying and incineration (see Paragraph 1.5).
Drying the sludge, in fact, is a possibility to reduce the expenses for its disposal;
this is an important step showing many positive results (Oikonomidis & Marinos,
2014):
1. Drying means a reduction in mass and volume, thus saving in transpor-‐
tation costs because the sludge is often moved by truck from the produc-‐
tion site to the place of final use; a smaller amount of sludge thus means
less costs for transport, handling and storage. This is also an envi-‐
As far as concerning the new EU countries, Czech Republic is theregion’s leader in sludge management innovation (Le Blanc et al.,2008). This can be illustrated by the full-scale use of mechanicalsludge disintegration and the use of sludge lysate being producedduring the disintegration or by rich experience on thermophilicanaerobic digestion (Zabranska et al., 2009). Such innovative tech-niques of disintegration by mechanical (ultrasound, mills, homog-enizers), thermal, chemical (acids, lyes) and biological (enzymes)means have also been studied and applied mainly in Germanyand less in Sweden and Italy with encouraging results (WPCF,1989; Kunz et al., 1996; Lee and Welander, 1996; Sakai et al.,1997; Krogmann et al., 1997; Muller, 2000; Le Blanc et al., 2008).
On the other hand, sludge dewatering seems to be an importantstep in sludge management of most EU-27 countries. According toTable 3, the majority of European WWTSs use mechanicaldewatering instead of drying beds that are preferred mainly insmall WWTSs and are reported in 6 out of 27 European countries.From financial point of view, the prevailing sludge dewateringtechnologies in descending order are centrifuges (41%), belt filterpresses (28%) and filter presses (23%) (www.frost.com).
Regarding other sludge treatment methods applied in Europeancountries, thermal drying has prevailing position in sludge man-agement of EU-15 (Table 3). It should be mentioned that 110 ther-mal drying plants were operated in EU in 1995 (Hall, 1995), thedrying lines were increased to about 370 in 1999 (EC, 1999), whiletoday they exceed 450. Most of these plants constitute the firststage of incineration units. Fig. 1 represents distribution of sludgedrying plants in European countries. Except of Luxembourg andFinland, all EU-15 countries apply this technology (Drace medio-ambiente, 2010; Milieu Ltd., WRc and RPA, 2010). As Fig. 1 reveals,the big majority of thermal drying plants (almost half of them) areoperated in Germany, following by Italy, UK and France. RotaryDrum Dryers (RDD) is the most commonly used system, followingby other types as Fluidized Bed Dryers (FBD) or Belt Dryers (BD)(http://www.web4water.com/library/print.asp?id=3539; Arlabos-se et al., 2012). An innovative method called Direct MicrowaveDrying has also been used in Ireland (Turovskiy and Mathai,2006). On the other hand, excepting Slovenia, there are no thermaldrying units in the new EU-12 countries (Fig. 1).
Long term storage is also applied in several old or new MemberStates (9 out of 27) as it is an easy and cheap method for sludge
management but it requires proper climates and great areas. Othermethods such as cold fermentation, solar drying or pasteurizationare scarcely referred in a limited number of countries (Table 3).
5. Sewage sludge disposal in EU-27
The change of sewage sludge disposal methods in EU-15 afterimplementation of 91/271 Directive (CEC, 1991) can be seen inFig. 2. It should be mentioned that the most recent available datafor all European countries are these of 2005. According to the re-sults, landfilling presents a significant and continuing decrease be-tween 1992 and 2005, from 33% to 15%. On the other hand, sludgeincineration has been almost doubled (from 11% to 21%), followingthe estimate-target (EC, 1999). Biosolids reuse, which mainly in-cludes agricultural utilization and composting, has been slightlyincreased, while an important part of total sludge production (9%in 2005) has been managed using several practices. This part ofsludge is reported in several reports as ‘‘others’’ and include meth-ods such as pyrolysis, temporary storage (e.g. Greece, Italy), longstorage (e.g. Poland, Estonia, Lithuania), reuse in green areas andforestry (e.g. Ireland, Latvia, Slovakia), landfill cover (e.g. Sweden,Flanders), exportation of sludge amounts to other countries (e.g.granulated sludge from Netherlands to Germany for incineration,sludge for composting or incineration from Luxembourg to Ger-many) as well as possible differences between total sludge produc-tion and disposal amounts. Besides the banning of sludge dumpingto the sea after 1998, it is possible that high values of ‘‘others’’ ob-served in 2000 could also be due to the continued apply of thispractice in some European countries (EC, 2004).
Sludge disposal methods for year 2005 in EU-15 and EU-12 arepresented in Fig. 3a and b, respectively. As it can be seen, the phi-losophy of sludge management is quite different between old andnew Member States. The prevailing technology in EU-15 is recy-cling in agriculture (44%). In contrary, the status in new countriesis quite unclear, as for 35% of sludge no specific disposal manneris declared. This uncertainty mainly originates from Poland which,as it was mentioned in Section 2, is the greatest sludge producer inEU-12 countries. Almost half of produced sludge in Poland (48%)has no specific outlet, while according to data reported in BIOPROSproject (2006), it seems that this percentage include stockpilingand lagooning. Taking into account this notice, landfilling (28%)
0% 10% 20% 30% 40% 50% 60%
GermanyItalyUK
FranceNetherlands
SpainAustria
DenmarkBelgium
IrelandSwedenPortugal
GreeceSlovenia
Sludge drying plants in European countries (%)
Fig. 1. Distribution of sludge drying plants in European countries (EC, 1999; LeBlanc et al., 2008; HMEPPPW, 2009; Drace medioambiente, 2010; http://www.wat-erworld.com; http://andritz.com; http://www.environ.ie/en/; http://www.web4-water.com; http://www.waterworld.com; http://www.hse.gov.uk).
48 4757 50 54
11 13
1518
21
33 2918
1815
6 5 42 6 6 14 9
01020
3040506070
8090
100
1992 1995 1998 2000 2005Year
Sludg
e disp
osal
metho
ds us
ed in
EU-15
(%)
Reuse Incineration Landfill Surface waters Others
Fig. 2. Sludge disposal methods applied in EU-15 between 1992 and 2005 (year1992 does not include Italy, Sweden, while year 1998 does not take into accountItaly due to lack of data) (http://epp.eurostat.ec.europa.eu; Hall, 1995; EC, 1999,2004, 2006; EEA, 2002; BIOPROS, 2006; HMEPPPW, 2007; Milieu Ltd., WRc and RPA,2010).
A. Kelessidis, A.S. Stasinakis / Waste Management 32 (2012) 1186–1195 1191
! PL!
#%(&"(+'1*.'-(!.)$6&!+&..!<*+=3&!%*!%'($.@*'%!3&($.!(!'&0=6%)*$!)$!%B&!
6*$.=3@%)*$!*D!D*..)+!D=&+.a!.*!+&..!7WP!&3)..)*$.C!
PC RB&!B)1B!%&3@&'(%='&.!=.&0!)$!%B&!0'8)$1!@'*6&..!6($!`-11* ,%&"*7'+2%3
."(,a!%B=.!6*$%')>=%)$1!%*!%B&!.%(>)+).(%)*$!*D!%B&!.+=01&C!!
KC ?')&0!($0!0)1&.%&0! .+=01&! 9NLd!0)..*+<&0! .*+)0.! 9?5:!($0!ZLd!3)$&'(+!
D'(6%)*$!)$!?5:!B(.!(!2-.2"#*2"'+-(.*8'15"!9>=M>K*Tk*`.3>*O6:a!3(_)$1!)%!
(!.=)%(>+&!6*3>=.%)>+&!.*='6&!9(!6(@(6)%8!&b=)<(+&$%!%*!>'*H$!6*(+:!97B()a!
PLLO:!9A+(1(a!PLLN:C!
MC ?')&0! .+=01&! 6($!>&!&%#"* "',-14* ,+%#"0! 0=')$1! %B*.&!3*$%B.! )$!HB)6B!
.@'&(0)$1!.+=01&!).!@'*B)>)%&0!.)$6&!%B&!$&('!6*3@+&%&!(>.&$6&!*D!H(%&'!
@'&<&$%.!%B&!*$.&%!*D!@=%'&D(6%)*$!@B&$*3&$(C!
ZC ?'8)$1!0*&.*(%+*'1+"#*+2"*%#.'(-)*)%(+"(+!)$!%B&!.+=01&a!.)$6&!)%!).!$*%!(!
6*3>=.%)*$!@'*6&..C!
!
RB&!0'8)$1!*D!.+=01&!6($!>&!(6B)&<&0!H)%B!,%1'#*%#*+2"#&'1*"("#.4c!%B&!0)DD&'\
&$6&!).!%B(%!.*+('!0'8)$1!=.&.!&<(@*'(%)*$a!HB)+&!)$!%B&!%B&'3(+!.8.%&3.!%B&!&e\
6B($1&!*D!B&(%!>&%H&&$!()'!($0!.+=01&!).!(6B)&<&0!%B'*=1B!6*$<&6%)*$a!6*$0=6\
%)*$!($0!'(0)(%)*$!9A+(1(a!PLLN:C!
!
A*'! %B&! .(_&! *D! %B).! %B&.).a! %B).! .&6\
%)*$! H)++! D*6=.! 3*'&! *$! %B&! .*+('!
0'8)$1!.8.%&3.C!Q!6%1'#*6150."*O#43
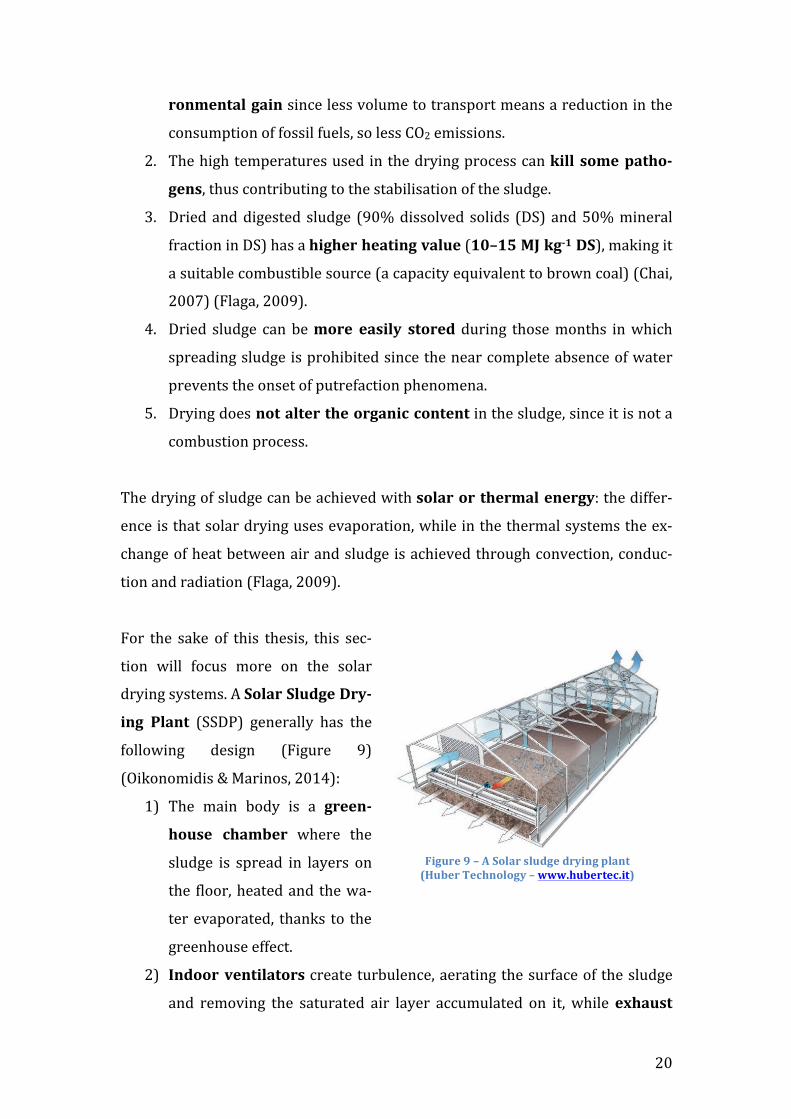
-(.* !1'(+! 955?2:! 1&$&'(++8! B(.! %B&!
D*++*H)$1! 0&.)1$! 9A)1='&! N:!
9W)_*$*3)0).!n!-(')$*.a!PL"M:c!
": RB&! 3()$! >*08! ).! (! .#""(3
2%5,"* )2'&/"#! HB&'&! %B&!
.+=01&! ).! .@'&(0! )$! +(8&'.! *$!
%B&! D+**'a!B&(%&0!($0! %B&!H(\
%&'!&<(@*'(%&0a! %B($_.! %*! %B&!
1'&&$B*=.&!&DD&6%C!
P: N(0%%#*8"(+-1'+%#,!6'&(%&!%='>=+&$6&a!(&'(%)$1!%B&!.='D(6&!*D!%B&!.+=01&!
($0! '&3*<)$1! %B&! .(%='(%&0! ()'! +(8&'! (66=3=+(%&0! *$! )%a! HB)+&!"b2'5,+*
!G-.5#"*Y*M*9*6%1'#*,150."*0#4-(.*71'(+*
WL5/"#*B")2(%1%.4*M*\\\R25/"#+")R-+X*
21
fans discharge the saturated air stored in the plant and provide air re-‐
newal.
3) Robots or drums with rotating scrapers (or similar devices) renew the
sludge by mixing it.
A SSDP can be pure when the only source of energy is the solar one, or hybrid
when there is a second source, e.g. waste heat from combined heat and power
(CHP) unit (Oikonomidis & Marinos, 2014).
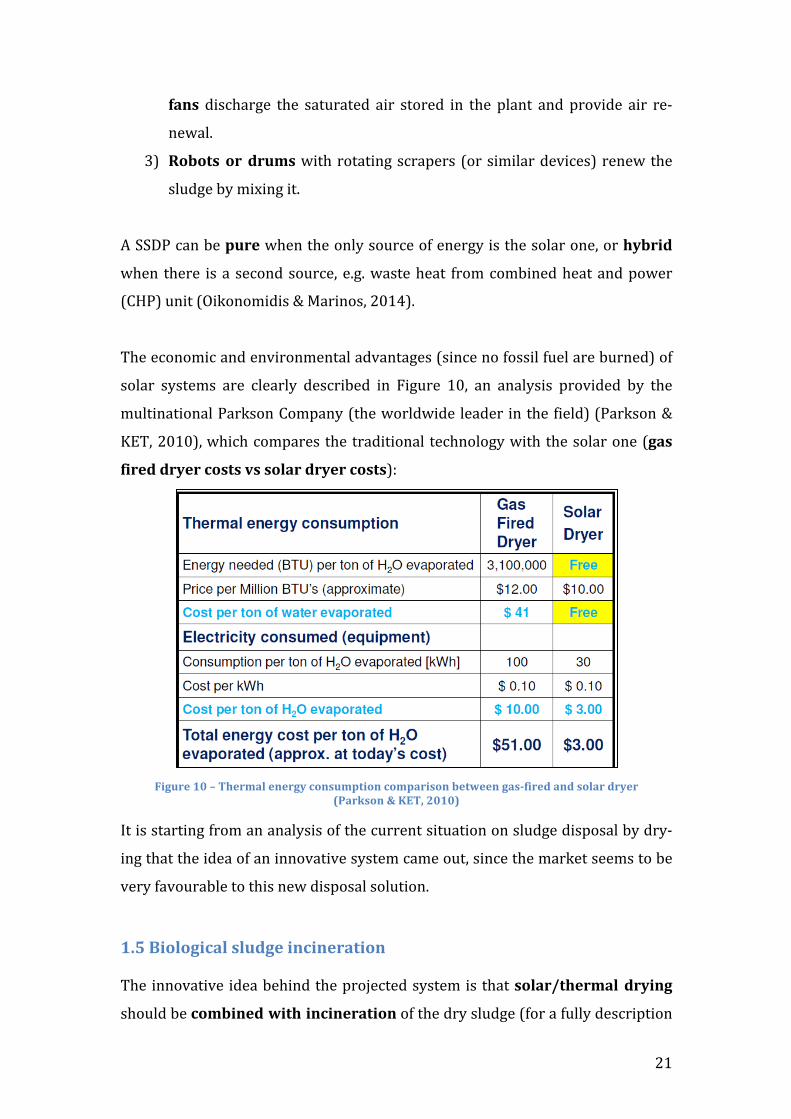
The economic and environmental advantages (since no fossil fuel are burned) of
solar systems are clearly described in Figure 10, an analysis provided by the
multinational Parkson Company (the worldwide leader in the field) (Parkson &
KET, 2010), which compares the traditional technology with the solar one (gas
fired dryer costs vs solar dryer costs):
Figure 10 – Thermal energy consumption comparison between gas-‐fired and solar dryer
(Parkson & KET, 2010)
It is starting from an analysis of the current situation on sludge disposal by dry-‐
ing that the idea of an innovative system came out, since the market seems to be
very favourable to this new disposal solution.
1.5 Biological sludge incineration The innovative idea behind the projected system is that solar/thermal drying
should be combined with incineration of the dry sludge (for a fully description
22
see Paragraph 2.3). The incineration is here described for a better comprehen-‐
sion of the mechanism involved in the system.
Incineration can be defined as the complete combustion with a rapid exo-‐
thermic oxidation of the fuel elements contained in the sludge: it requires
temperatures of 420°-‐500° C and the presence of oxygen. Complete combustion
of all organic solids requires temperatures over 760°-‐820°C. (Turovskiy &
Mathai, 2006). During the incineration process, the organic components of
sludge are converted into oxidised end products, such as carbon dioxide (CO2),
water vapour and ash; particulates and other gases could also be present in the
final product, which is why these gases are brought into a post-‐combustion
chamber before being released into the atmosphere.
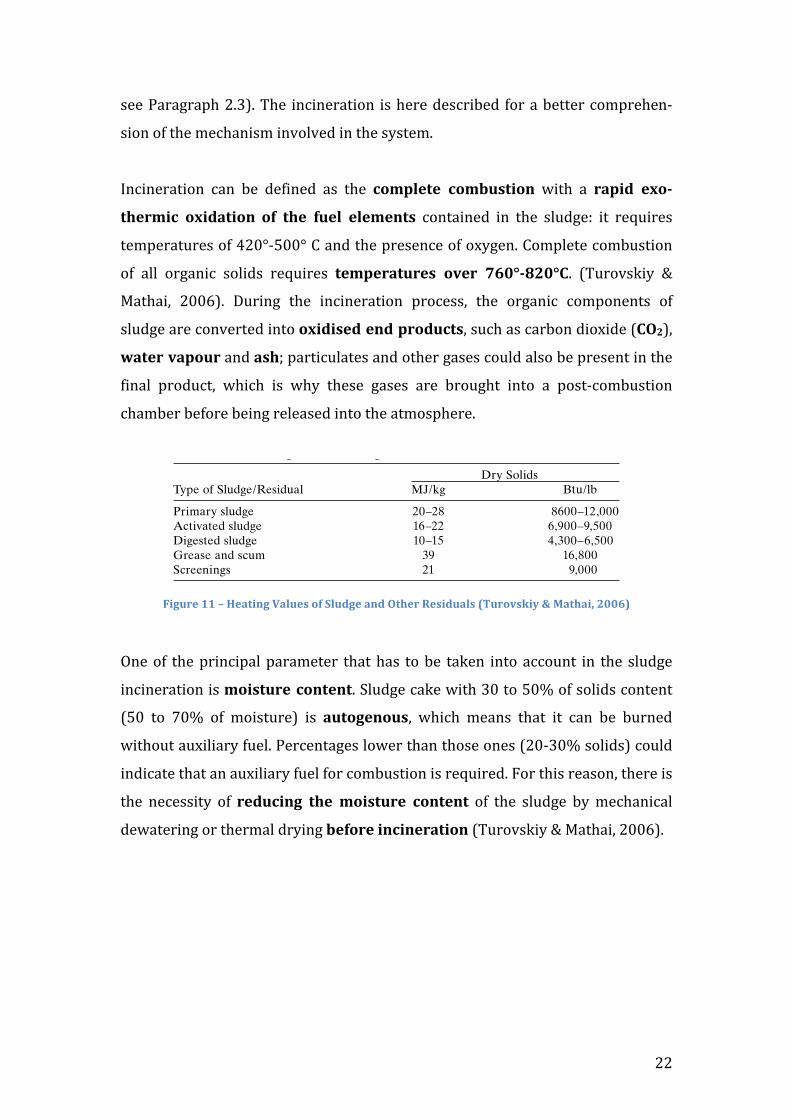
Figure 11 – Heating Values of Sludge and Other Residuals (Turovskiy & Mathai, 2006)
One of the principal parameter that has to be taken into account in the sludge
incineration is moisture content. Sludge cake with 30 to 50% of solids content
(50 to 70% of moisture) is autogenous, which means that it can be burned
without auxiliary fuel. Percentages lower than those ones (20-‐30% solids) could
indicate that an auxiliary fuel for combustion is required. For this reason, there is
the necessity of reducing the moisture content of the sludge by mechanical
dewatering or thermal drying before incineration (Turovskiy & Mathai, 2006).
Another important parameter of sludge incineration is the heating value of sludge. It represents the quantity of heat released per unit mass of solids. The amount of heat released from sludge is a function of the types and com-bustible elements present in sludge. The primary combustible elements in sludge (and in most available auxiliary fuels) are carbon, hydrogen, and sulfur. Carbon burned to carbon dioxide has a heating value of 34 MJ/kg (14.6 × 10³ Btu/lb), hydrogen has a heating value of 144 MJ/kg (62 × 103 Btu/lb), and sulfur has a heating value of 10 MJ/kg (4.5 × 10³ Btu/lb). Conse-quently, any changes in the carbon, hydrogen, or sulfur content of sludge will raise or lower its heating value. Table 8.4 shows the heating values of various types of sludge, grease and scum, and screenings.
8.3.1 Methods of Incineration
The process of sludge incineration in furnaces can be divided into the follow-ing stages: heating, drying, distillation of volatile matter, combustion of the organic fuel matter, and calcination to burn the residual carbon. Heating the sludge to 100°C (212°F) and then drying it at about 200°C (392°F) consume the principal quantity of heat and are generally required for the incineration process. These parameters also affect the selection of the size of the main and auxiliary equipment and consequently, determine the cost in general. In the course of moisture evaporation in the drying zone, volatile substances are liberated together with the moisture, which sometimes results in objection-able odors.
The combustion of the sludge takes place at temperatures between 200 and 500°C (392 and 932°F), due to the thermal radiation of the fl ame and the incandescent walls of the combustion chamber, as well as the convection heat transfer from the exhaust gases. The calcination of the ash fraction of the sludge is completed by its cooling to a temperature at which it can be removed from the site.
The design temperature in the furnace should not exceed the melting point of ash [usually, about 1050°C (1922°F)] and should not be below 700°C (1292°F), thus providing reliable deodorizing of the gases. Systems for sludge incineration should provide complete combustion of the organic fraction of the sludge and utilization of the heat of the exhaust gases.
INCINERATION 291
TABLE 8.4 Heating Values of Sludge and Other Residuals
Dry SolidsType of Sludge/Residual MJ/kg Btu/lb
Primary sludge 20–28 8600–12,000Activated sludge 16–22 6,900–9,500Digested sludge 10–15 4,300–6,500Grease and scum 39 16,800Screenings 21 9,000
23
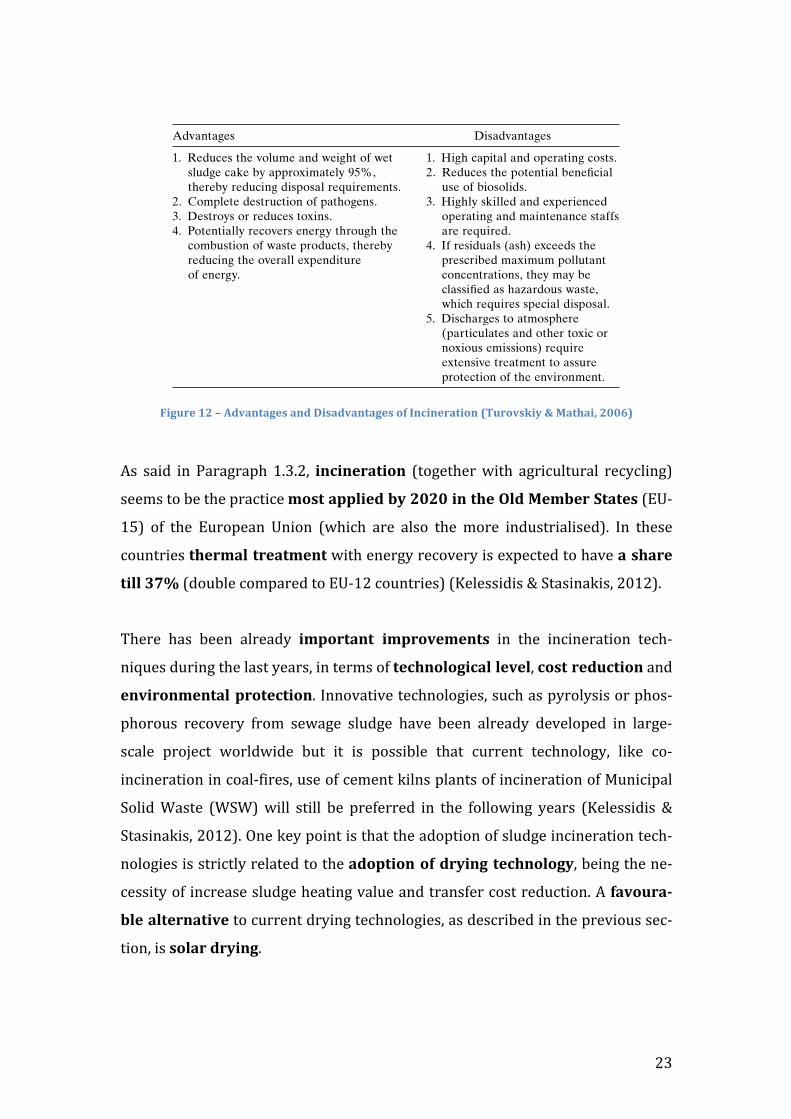
Figure 12 – Advantages and Disadvantages of Incineration (Turovskiy & Mathai, 2006)
As said in Paragraph 1.3.2, incineration (together with agricultural recycling)
seems to be the practice most applied by 2020 in the Old Member States (EU-‐
15) of the European Union (which are also the more industrialised). In these
countries thermal treatment with energy recovery is expected to have a share
till 37% (double compared to EU-‐12 countries) (Kelessidis & Stasinakis, 2012).
There has been already important improvements in the incineration tech-‐
niques during the last years, in terms of technological level, cost reduction and
environmental protection. Innovative technologies, such as pyrolysis or phos-‐
phorous recovery from sewage sludge have been already developed in large-‐
scale project worldwide but it is possible that current technology, like co-‐
incineration in coal-‐fires, use of cement kilns plants of incineration of Municipal
Solid Waste (WSW) will still be preferred in the following years (Kelessidis &
Stasinakis, 2012). One key point is that the adoption of sludge incineration tech-‐
nologies is strictly related to the adoption of drying technology, being the ne-‐
cessity of increase sludge heating value and transfer cost reduction. A favoura-‐
ble alternative to current drying technologies, as described in the previous sec-‐
tion, is solar drying.
290 THERMAL DRYING AND INCINERATION
or supplement plant heating requirements. The dried sludge itself has a fuel value and may be used as a heat source for the drying medium.
8.3 INCINERATION
Incineration is complete combustion, which is the rapid exothermic oxidiza-tion of combustible elements in sludge. Dewatered sludge will ignite at temperatures of 420 to 500°C (788 to 932°F) in the presence of oxygen. Tem-peratures of 760 to 820°C (1400 to 1508°F) are required for complete combus-tion of organic solids. In the incineration of sludge, the organic solids are converted to the oxidized end products, primarily carbon dioxide, water vapor, and ash. Particulates and other gases will also be present in the exhaust, which determines the selection of the treatment scheme for the exhaust gases before venting them to the atmosphere.
The principal advantages and disadvantages of incineration over other methods of sludge stabilization are listed in Table 8.3. Sludge is incinerated if its utilization is impossible or economically infeasible, if storage area is limited or unavailable, and in cases where it is required for hygienic reasons.
One of the principal parameters of sludge incineration is the sludge mois-ture. Sludge cake with 30 to 50% solids (50 to 70% moisture) is autogenous; that is, it can be burned without auxiliary fuel. Sludge cake with 20 to 30% solids (70 to 80% moisture) may require an auxiliary fuel for combustion. Therefore, before incineration, the moisture content of the sludge should be reduced by mechanical dewatering or thermal drying.
TABLE 8.3 Advantages and Disadvantages of Incineration
Advantages Disadvantages
1. Reduces the volume and weight of wet 1. High capital and operating costs. sludge cake by approximately 95%, 2. Reduces the potential benefi cial thereby reducing disposal requirements. use of biosolids.2. Complete destruction of pathogens. 3. Highly skilled and experienced3. Destroys or reduces toxins. operating and maintenance staffs4. Potentially recovers energy through the are required. combustion of waste products, thereby 4. If residuals (ash) exceeds the reducing the overall expenditure prescribed maximum pollutant of energy. concentrations, they may be classifi ed as hazardous waste, which requires special disposal. 5. Discharges to atmosphere (particulates and other toxic or noxious emissions) require extensive treatment to assure protection of the environment.
24
Despite the many improvements of the last years, incineration presents some
important issues: in the emissions, dioxins and furans are often detected,
which are very hazardous compounds, and heavy metals are generally released;
flue gases and ashes (side-‐products of the process) lead to high cost of treat-‐
ment, while solid residues present the problem of their handling (Fytili &
Zabaniotou, 2008).
1.5.1 Advantages of sludge-‐drying and incineration
Drying combined with incineration is a sludge disposal method that clearly
opens to wide economic chances: many sludge-‐producing plants, in fact, have
to transport the sludge by truck from the site of production to a treatment plant,
which could be many kilometres far from it. The cost of transport, together with
the price required for the treatment, are generally huge expenses for the
plant’s owner. Suffice to say that 50-‐60% of the management costs of a depura-‐
tion plant are made by sludge treatment and disposal.
In Italy, the cost of sludge (20% DM) disposal can be indicatively estimated as
100-‐300 euro/ton, depending on the distance between the place of disposal and
the depuration plant, on the type of disposal (landfilling, composting, spreading
etc.) and on the region in which the plant is located. This expense regards a
product that is 80% water: it clearly emerges that, removing the water content of
the sludge, dramatically reduces the cost of disposal. Incinerating the sludge
gives, in fact, an amount of ashes, which is approximately 10% in volume com-‐
pared to the starting product (20% DM sludge). This would mean that the pro-‐
ducer should have to dispose of an amount of special waste significantly low-‐
er. Future research, however, will have to focus on the emissions that the pro-‐
cess produces into the atmosphere, in order to see if there could be a hazard for
the human heath (see following section).
! PZ!
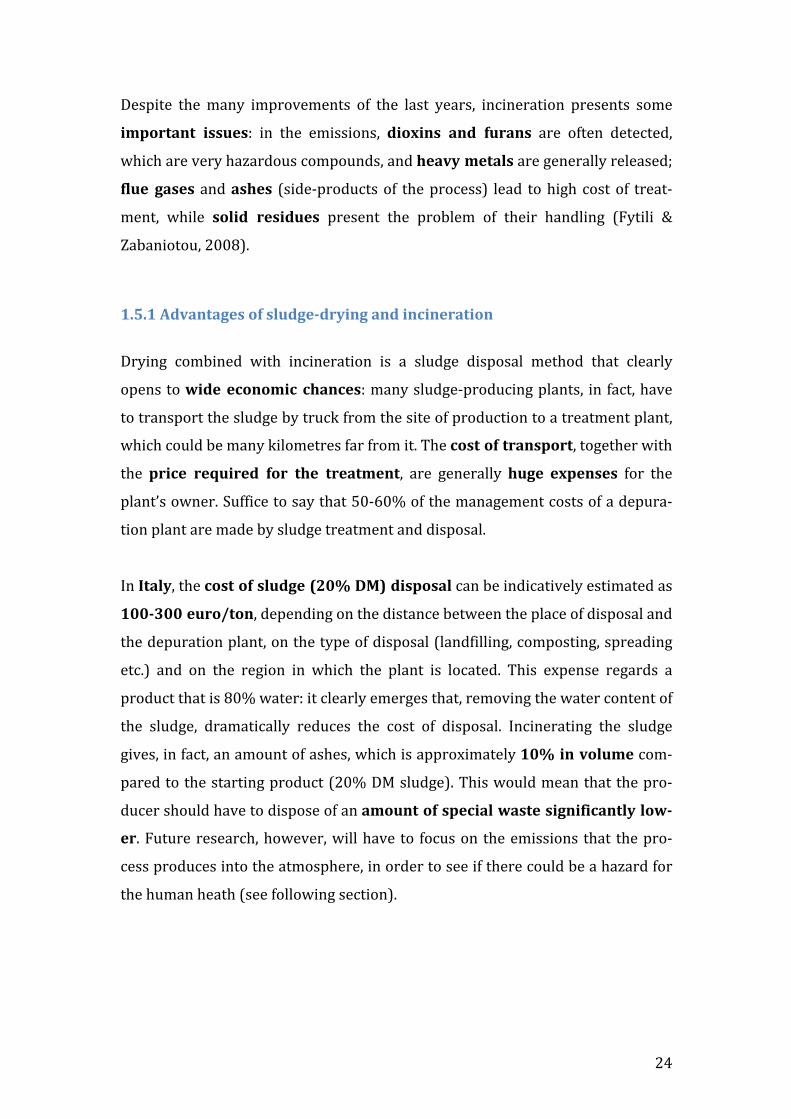
>RKR<*E&-,,-%(,*$#%&*,150."*)%&/5,+-%(*
6150."*0#4-(.*'(0*/5#(-(.*"&-,,-%(,!'#"* +%7-),!5(0"##"7#","(+"0* -(*)5#3
#"(+* 1-+"#'+5#"a! .)$6&! H*'+0H)0&! %B&.&! @'*6&..&.! ('&! $*%! H)0&+8! =.&0C! #$! %B).!
.&6%)*$!.*3&!'&.=+%.!@'&.&$%&0!)$!'&6&$%!.6)&$%)D)6!('%)6+&!'&+(%&0!%*!.+=01&!)$6)$\
&'(%)*$!&3)..)*$.!('&!>')&D+8!0&.6')>&0C!
!
R*! @'*<)0&! ($! &.%)3(%)*$! *D! %B&! &3)..)*$.! D'*3! .+=01&! 0'8)$1a! S(1(hh)! &%! (+C!
9PLLY:!@'*@*.&0!(!)%&7'#-,%(*\-+2*"&-,,-%(,*$#%&*,150."*0#4-(.!($0!D'*3!(!
@+($%!H)%B!(!,150."* -()-("#'+-%(* 7#%)",,C! A*'!0(%(!*$!0'8)$1a!&3)..)*$.!B(<&!
>&&$!($(+8.&0!D'*3!D)<&!@+($%.!%B(%!=.&!(!6*$<&6%)<&!0')&'!H)%B!(!%')@+&!@(..!'*%(\
'8!0'=3i!D*'!)$6)$&'(%)*$a!0(%(!H(.!%(_&$!D'*3!(!@+($%!=.)$1!D+=)0!>&0!%&6B$*+*18C!
RB&!'&.=+%.!*D!%B).!($(+8.).!('&!.=33(').&0!)$!R(>+&!Kc!
!B'/1"*?*M*H%&7'#-,%(*/"+\""(*"&-,,-%(,*$#%&*0#4-(.*'(0*-()-("#'+-%(*WJ'.'^^-e*"+*'1Re*<==QX*
B47"*%$*"&-,,-%(* O#4-(.*
W&.@`.*OTX*
N()-("#'+-%(*
W&.@`.*OTX*
IF<*_*6F<* PPM! YLOCJON!
ILA* OLCM! P"CZ"Z!
O5,+,* MNCY! KCYKY!
L"'84*&"+'1,* "CP"P! LCLPMJ!
!
Q.!6($!>&!.&&$!D'*3!%B&!%(>+&a!b=($%)%(%)<&+8a!%B&!+('1&'!&3)..)*$.!0&%&6%&0!H&'&!
IF<*_*6F<!>*%B!0=')$1!0'8)$1!($0!)$6)$&'(%)*$a!HB)+&!%B&!+*H&'!*$&.!H&'&!B&(<8!
3&%(+.C!#%!6($!(+.*!>&!$*%)6&0!%B(%!%B&!&3)..)*$.!*D!IWP!r!5WP!H&'&!B)1B&'!(D%&'!
)$6)$&'(%)*$! 6*3@('&0! %*! %B&! 0'8)$1! @'*6&..a!HB)+&! %B&! *@@*.)%&! B(@@&$&0! D*'!
ILAe* 05,+,*($0* 2"'84*&"+'1,a!HB)6B!('&!.)1$)D)6($%+8! +&..!0&%&6%&0!0=')$1!%B&!
)$6)$&'(%)*$!@'*6&..C!
!
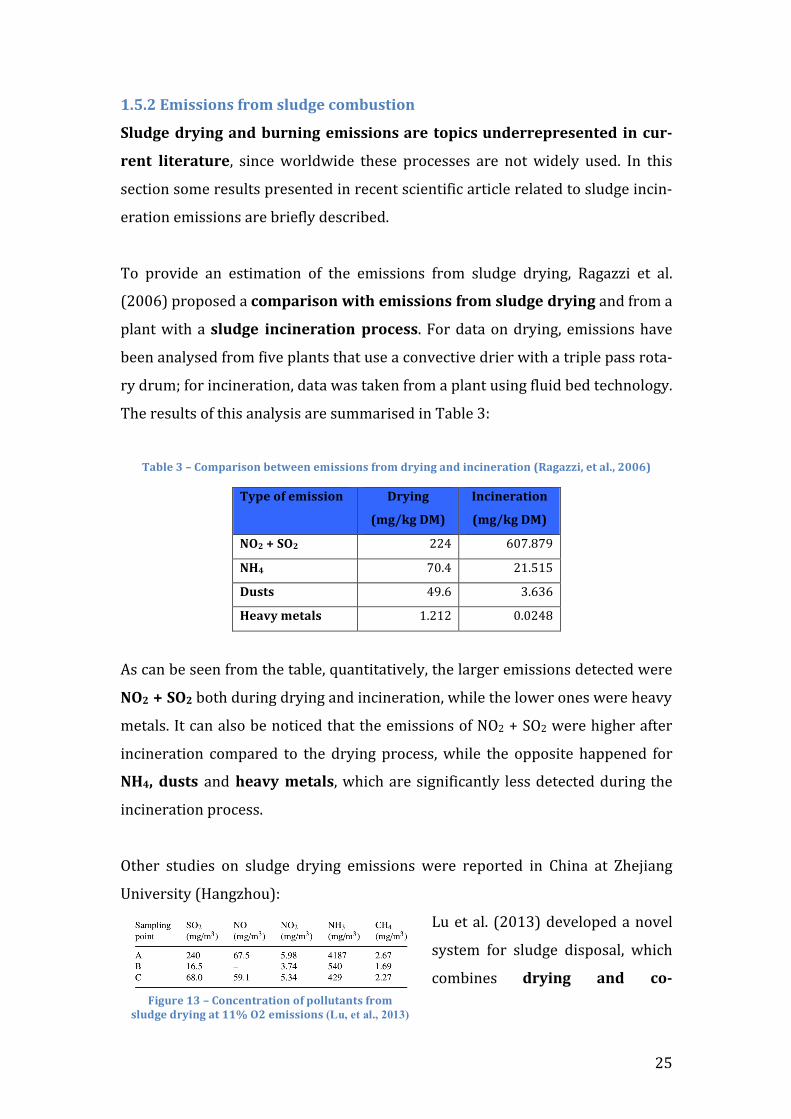
W%B&'! .%=0)&.! *$! .+=01&! 0'8)$1! &3)..)*$.! H&'&! '&@*'%&0! )$! 7B)$(! (%! qB&`)($1!
G$)<&'.)%8!9U($1hB*=:c!!
T=!&%!(+C! 9PL"K:!0&<&+*@&0!(!$*<&+!
.8.%&3! D*'! .+=01&! 0).@*.(+a! HB)6B!
6*3>)$&.! 0#4-(.* '(0* )%3!G-.5#"*>?*M*H%()"(+#'+-%(*%$*7%115+'(+,*$#%&*
,150."*0#4-(.*'+*>>]*F<*"&-,,-%(,*(Lu, et al., 2013)*
! PY!
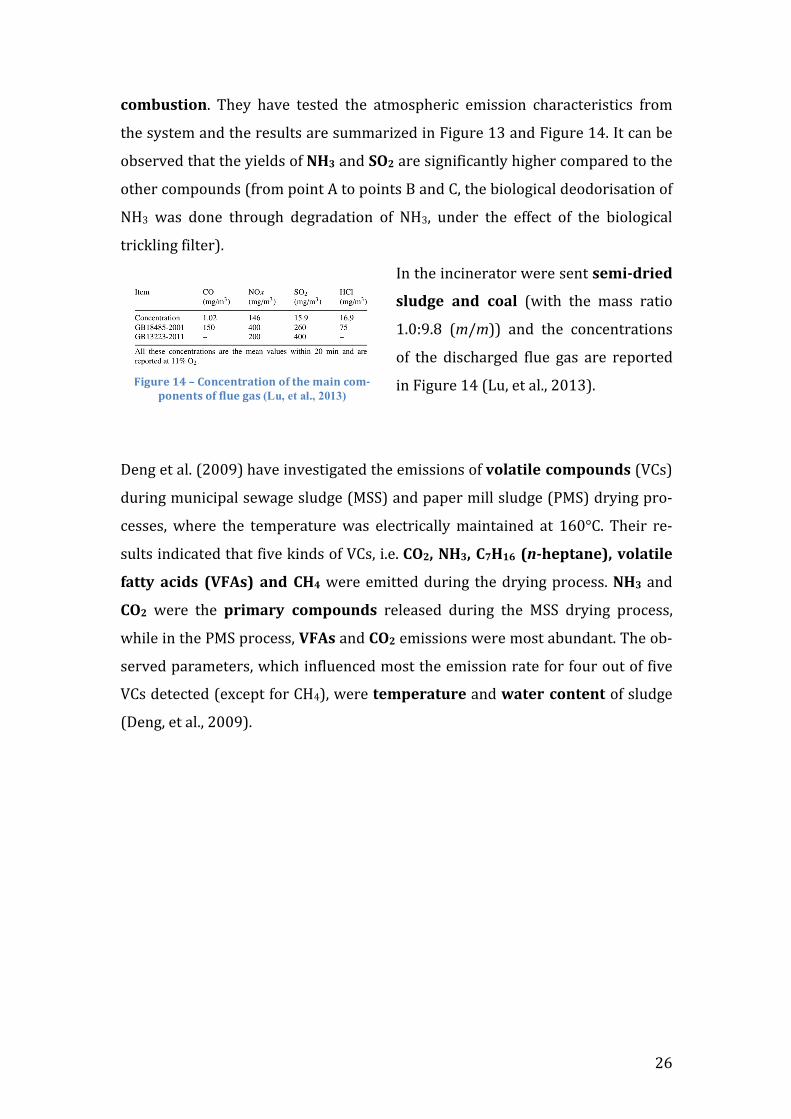
)%&/5,+-%(C! RB&8! B(<&! %&.%&0! %B&! (%3*.@B&')6! &3)..)*$! 6B('(6%&').%)6.! D'*3!
%B&!.8.%&3!($0!%B&!'&.=+%.!('&!.=33(')h&0!)$!A)1='&!"K!($0!A)1='&!"MC!#%!6($!>&!
*>.&'<&0!%B(%!%B&!8)&+0.!*D!IL?!($0!6F<!('&!.)1$)D)6($%+8!B)1B&'!6*3@('&0!%*!%B&!
*%B&'!6*3@*=$0.!9D'*3!@*)$%!Q!%*!@*)$%.!]!($0!7a!%B&!>)*+*1)6(+!0&*0*').(%)*$!*D!
IUK! H(.! 0*$&! %B'*=1B! 0&1'(0(%)*$! *D! IUKa! =$0&'! %B&! &DD&6%! *D! %B&! >)*+*1)6(+!
%')6_+)$1!D)+%&':C!!
#$!%B&!)$6)$&'(%*'!H&'&!.&$%!,"&-30#-"0*
,150."* '(0* )%'1! 9H)%B! %B&! 3(..! '(%)*!
"CLcNCJ! 9+k+::! ($0! %B&! 6*$6&$%'(%)*$.!
*D! %B&! 0).6B('1&0! D+=&! 1(.! ('&! '&@*'%&0!
)$!A)1='&!"M!9T=a!&%!(+Ca!PL"K:C!
!
!
?&$1!&%!(+C!9PLLN:!B(<&!)$<&.%)1(%&0!%B&!&3)..)*$.!*D!8%1'+-1"*)%&7%5(0,!9[7.:!
0=')$1!3=$)6)@(+!.&H(1&!.+=01&!9-55:!($0!@(@&'!3)++!.+=01&!92-5:!0'8)$1!@'*\
6&..&.a! HB&'&! %B&! %&3@&'(%='&! H(.! &+&6%')6(++8! 3()$%()$&0! (%! "YLp7C! RB&)'! '&\
.=+%.!)$0)6(%&0!%B(%!D)<&!_)$0.!*D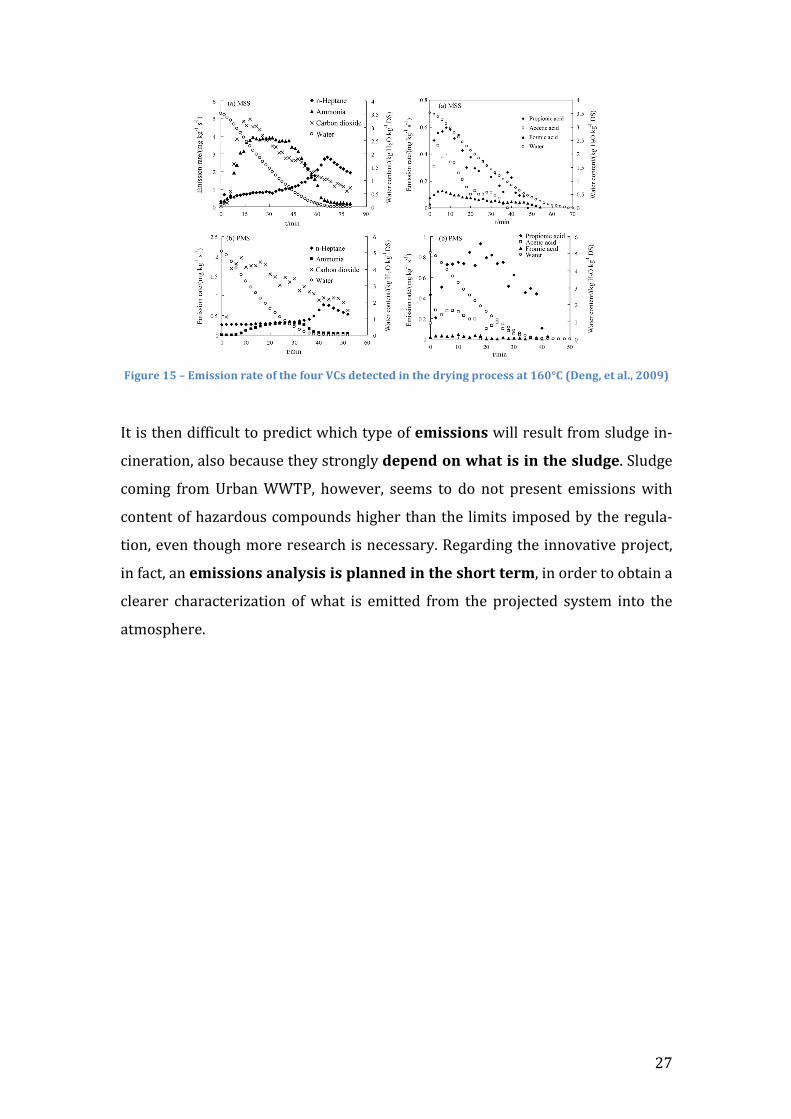
27
Figure 15 – Emission rate of the four VCs detected in the drying process at 160°C (Deng, et al., 2009)
It is then difficult to predict which type of emissions will result from sludge in-‐
cineration, also because they strongly depend on what is in the sludge. Sludge
coming from Urban WWTP, however, seems to do not present emissions with
content of hazardous compounds higher than the limits imposed by the regula-‐
tion, even though more research is necessary. Regarding the innovative project,
in fact, an emissions analysis is planned in the short term, in order to obtain a
clearer characterization of what is emitted from the projected system into the
atmosphere.
188 W.-Y. Deng et al. / Journal of Hazardous Materials 162 (2009) 186–192
Fig. 3. Drying rate curves of PMS and MSS (drying temperature T = 160 ◦C, air velocityVa = 0.108 m/s).
from ambient to experimental temperature. Then, the evaporationsurface shrank from sludge surface to the interior of the sludge,and the sludge volume was reduced with the loss of moisture andvolatile matters. The rate of water vapour evolution was measuredby measuring the air humidity discharged from the drying cham-ber by FTIR analyzer, and the rate of moisture loss (Fig. 3) wasback-calculated. As shown in Fig. 3, the drying rates of both sludgesmarkedly increased at the beginning of the drying process due tothe increase of the sludge temperature. The drying rate of the PMSwas higher than that of the MSS for the same water content, becauseof different physical properties.
As suggested by Vesilind and Ramsey [1], sludge sample wouldlose 10% of high heating value when the drying temperature wasaround 150 ◦C. This indicated that the drying and loss of volatilesubstances occurred in parallel in sludge drying process, and thatthe loss of volatile substances played an important role when thedrying temperature was higher than 150 ◦C [9]. In this test, the dry-ing temperature was electrically controlled at 160 ◦C. Duplicatedexperiment was conducted to confirm the reproducibility of theresult. The differences for the results of two parallel tests was exis-tent which was caused by inhomogeneity of the sludge samples,but the percentage error of the tests were below 5%, and the resultdiscussed below came from one of the two tests. As shown in Fig. 4,FTIR spectra of gaseous samples were measured, and four kindsof volatile compound, i.e. NH3, C7H16, CO2 and volatile fatty acids(VFAs), were clearly identified.
3.1.1. NH3 emissionAs shown in Fig. 5, the NH3 emission rates of the MSS
and PMS passed through three stages in the drying process,i.e. the rising rate stage which interrelated to the increaseof sludge temperature, then the constant rate stage whichwas between 0.75–2.33 kg H2O kg−1 DS for the MSS and 0.49–1.63 kg H2O kg−1 DS for the PMS, and finally the decreasing ratestage where the NH3 emission rate dropped rapidly from the highlevel. In this study, the NH4
+ concentrations of the MSS and PMSsolutions were measured by ion chromatography. The NH4
+ con-centration was 5.46 g kg−1 DS for the MSS and 0.28 g kg−1 DS for thePMS, respectively. The higher NH4
+ concentration of the MSS maycontribute to the higher NH3 emission during the sewage sludgedrying process. It has been reported that the NH3 emitted fromsludge drying was formed through hydrolysis of protein [10]. Whenthe protein in sludge dissolves, it hydrolyzes to form multipeptide,dipeptide and amino acid. The amino acid further hydrolyzes toform organic acid, NH3 and CO2 [11].
Fig. 4. Infra-red spectra of gaseous samples from the drying of (a) MSS (at0.11 kg H2O kg−1 DS) and (b) PMS (at 0.02 kg H2O kg−1 DS) (drying temperatureT = 160 ◦C, air velocity Va = 0.108 m/s).
3.1.2. C7H16 emissionThe emission rate curves of the C7H16 shown in Fig. 5 were
much different than that of the NH3. The distribution of thewater in sludge plays an important role in the emission of volatile
Fig. 5. Time-resolved C7H16 and NH3 emission rate curves and water content of(a) MSS and (b) PMS during drying experiments (drying temperature T = 160 ◦C, airvelocity Va = 0.108 m/s).
W.-Y. Deng et al. / Journal of Hazardous Materials 162 (2009) 186–192 189
organic compounds. Rudolfs and Baumgartner [12] assumed thatvolatile matters were not driven from a sludge sample until 80–90%by weight of the original moisture content of the sludge hadevaporated given that residual moisture was evenly distributedthroughout the sludge cake. However, the sludge surface temper-ature was higher than the interior of the sludge cake before thesludge was totally dried, and the exposed sludge surface areas tendto dry faster than those buried within the sludge cake. Therefore,the C7H16 was firstly driven from dry sludge surface. As shown inFig. 5, the C7H16 emission rate of the MSS moderately increasedbefore the water content reaching to about 0.43 kg H2O kg−1 DS,and then followed by a marked increase. The C7H16 emissionrate reached a peak value of 2.80 mg kg−1 s−1 DS when the MSSwas totally dried. After that, it decreased rapidly until reacheda constant value. In the case of the PMS, the C7H16 emissionrate started a marked increase until the water content decreasedto about 0.11 kg H2O kg−1 DS, and then reached a peak value of0.76 mg kg−1 s−1 DS which was much less than that of the MSS.It was obvious that the increase of the C7H16 emission rate wasfollowed by the decrease of sludge drying rate. Since C7H16 con-tributes to the calorific value of sludge, the loss of calorific valuewould become more and more significant in the drying process.
There are two possible ways for the C7H16 formation. It mightbe present as individual component or be formed from the thermaldegradation of more complex organics. C7H16 is a volatile com-pound, with the boiling point 98.5 ◦C. Thus, it should be expectedthat most of C7H16 would be evaporated with water at the begin-ning of the drying process, given that C7H16 was present in largequantities as individual component in sludge. However, Fig. 5shows that the C7H16 emission rate kept at relatively low level andincreased mildly between the time of 0–40 min, and it reached themaximum until the sludge was completely dried. So it was rea-sonable to conclude that the C7H16 was mainly formed from thethermal degradation of more complex organics.
3.1.3. VFAs emissionThree kinds of VFAs, i.e. propionic acid, acetic acid and formic
acid, were detected during the drying process (Fig. 6). Fig. 6a showsthe VFAs emission rates of the MSS. It was found that the VFAsemission rates markedly increased at the beginning of the dryingprocess. After that, their emission rates gradually decreased withthe loss of moisture content. As for the PMS, the emission rate offormic acid was negligible compared with the other two acids, andthe propionic acid had a constant emission rate between sludgemoisture contents of 0.8–3.8 kg H2O kg−1 DS.
It has been widely reported that the VFAs could be producedfrom hydrothermal treatment of organic matters [13–15]. In thesereports, the VFAs were formed from hydrolysis of MSS, PMS, andplastic waste, etc. However, only a few researches about the for-mation of VFAs from thermal drying of sludge have been reported[10]. It indicated that the VFAs released from thermal drying pro-cess were also formed through the hydrolysis of organic matters.Because of the substantially lower temperature and pressure underwhich the drying test was conducted, the VFAs emission rates were
Fig. 6. VFAs emission rates vs. water content during drying of (a) MSS and (b) PMS(drying temperature T = 160 ◦C, air velocity Va = 0.108 m/s).
much lower than those of hydrothermal treatment process. In addi-tion, when the water content of the sludge decreases, the hydrolyticaction will be weakened, as well as the VFAs emission rates. Asshown in Fig. 6, there were no VFAs emission when the MSS andPMS were totally dried.
3.1.4. CO2 emissionAs shown in Fig. 1, the dry air was used as carrier gas in the
batch drying test. Therefore, the total CO2 concentration measuredduring the drying process included the part emitted from sludgedrying and the part existed in the dry air. The CO2 emission ratesshown in Fig. 5 was calculated by subtracting the CO2 concentrationin dry air from the total CO2 concentration. It was obvious that theCO2 emission was significant compared with other VCs emissions.There was a sharp increase of the CO2 emission at the early state ofdrying processes for both kinds of sludge. After reaching the peakvalue, the CO2 emission rate dropped continuously with time. TheCO2 emission rate of the MSS was much higher than that of thePMS, and the peak value of the CO2 emission of the MSS was morethan twice over that of the PMS.
Table 2Data of continuous drying tests
Sludge type MSS PMS
Test no. 1 2 3 4 5 6 7 8Heating oil temperature (◦C) 140 150 160 170 140 150 160 170Feed rate (kg/h) 15 14.5 13.5 16.8 13.2 12.8 12.4 15.1Inlet moisture (kg H2O kg−1 DS) 3.69 3.69 3.69 3.69 4.85 4.85 4.85 4.85Discharge moisture (kg H2O kg−1 DS) 1.91 1.12 0.97 1.01 0.42 0.32 0.31 0.35Paddle rotation (rpm) 2.5 2.5 2.5 2.5 2.5 2.5 2.5 2.5Air flow rate (N m3/h) 17.7 15.8 16.4 15.6 18.4 18.2 17.8 17.2
! PJ!
H2'7+"#*<*M*O",)#-7+-%(*%$*+2"*,4,+"&,*5)$6&!%B&!6'&(%)*$!*D! %B&! D)'.%!@'*%*%8@&!*D! %B&!@'*@*.&0!0'8)$1!.8.%&3!D*'!>)*\
+*1)6(+!.+=01&!).!.%)++!)$!@'*1'&..a!%B&!%&.%)$1!H(.!0*$&!H)%B!%H*!.&@('(%&!.8.%&3.!
)$%&$0&0!%*!6'&(%&!6*$0)%)*$.!.)3)+('!%*!%B*.&!*D!%B&!@'*@*.&0!.8.%&3C!!
RB&! .*+('!0'8)$1!6*3@*$&$%!H(.! %&.%&0! )$!(!,%1'#* ,+-11* $%#*\'+"#* 0"75#'+-%(!
%B(%!H)++!>&!0&D)$&0!(.!!#%+%+47"*>!($0!(!,4,+"&* $%#*0#4-(.* $%%0! %B(%!H)++!>&!
'&D&''&0!%*!(.!!#%+%+47"*<a!>*%B!0&<&+*@&0!>8!5*+H(!.'+C!RB&!%B&'3(+!0'8)$1a!*$!
%B&!*%B&'!B($0a!H(.!%&.%&0!)$!(!+(>*'(%*'8!*<&$!.&%!(%!"ZLp7C!
!
RB&!%H*!@'*%*%8@&.!H)++!>&!0&.6')>&0! )$! %B&! D*++*H)$1!.&6%)*$.a!(D%&'!HB)6B!%B&!
@'*`&6%!D*'!.+=01&!0'8)$1!($0!>='$)$1!H)++!>&!@'&.&$%&0C!
!
<R>*6%1'#*,+-11*$%#*\'+"#*0"75#'+-%(*!
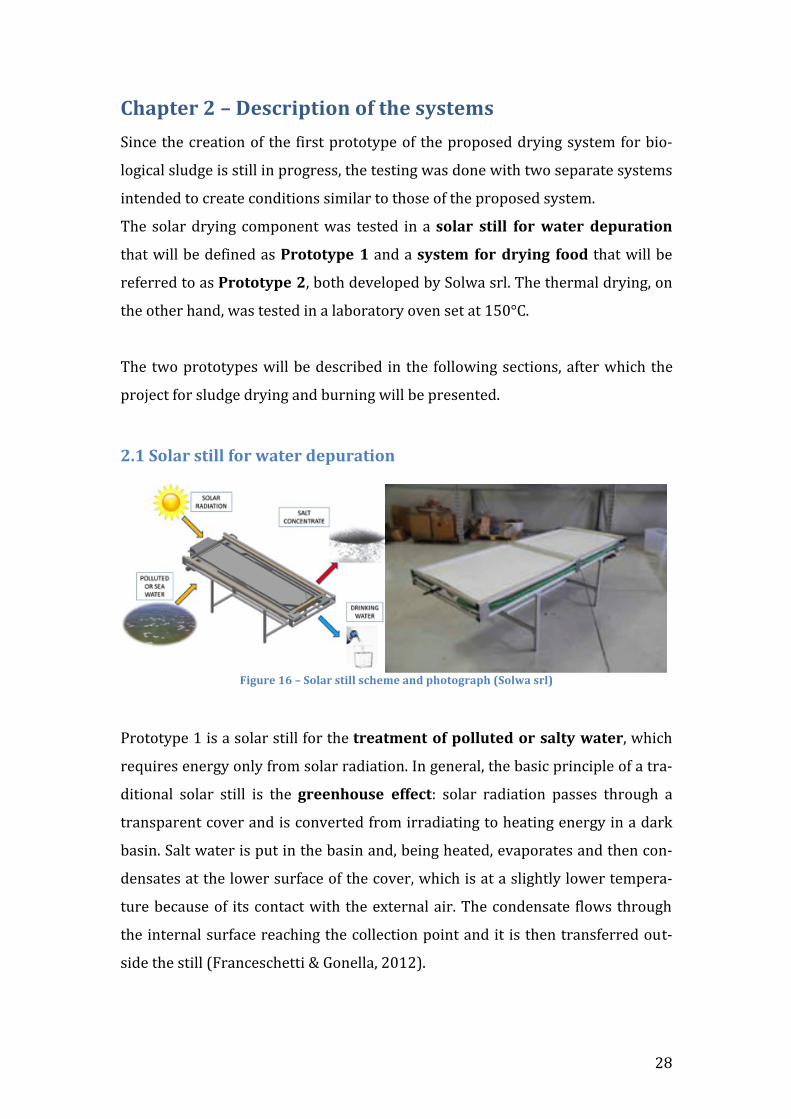
!G-.5#"*>Q*M*6%1'#*,+-11*,)2"&"*'(0*72%+%.#'72*W6%1\'*,#1X*
!
2'*%*%8@&!"!).!(!.*+('!.%)++!D*'!%B&!+#"'+&"(+*%$*7%115+"0*%#*,'1+4*\'+"#a!HB)6B!
'&b=)'&.!&$&'18!*$+8!D'*3!.*+('!'(0)(%)*$C!#$!1&$&'(+a!%B&!>(.)6!@')$6)@+&!*D!(!%'(\
0)%)*$(+! .*+('! .%)++! ).! %B&! .#""(2%5,"* "$$")+c! .*+('! '(0)(%)*$! @(..&.! %B'*=1B! (!
%'($.@('&$%!6*<&'!($0!).!6*$<&'%&0!D'*3!)''(0)(%)$1!%*!B&(%)$1!&$&'18!)$!(!0('_!
>(.)$C!5(+%!H(%&'!).!@=%!)$!%B&!>(.)$!($0a!>&)$1!B&(%&0a!&<(@*'(%&.!($0!%B&$!6*$\
0&$.(%&.!(%!%B&!+*H&'!.='D(6&!*D!%B&!6*<&'a!HB)6B!).!(%!(!.+)1B%+8!+*H&'!%&3@&'(\
%='&!>&6(=.&!*D! )%.!6*$%(6%!H)%B!%B&!&e%&'$(+!()'C!RB&!6*$0&$.(%&! D+*H.!%B'*=1B!
%B&!)$%&'$(+!.='D(6&!'&(6B)$1!%B&!6*++&6%)*$!@*)$%!($0!)%! ).!%B&$!%'($.D&''&0!*=%\
.)0&!%B&!.%)++!9A'($6&.6B&%%)!n!E*$&++(a!PL"P:C!!
!
29
The efficiency of the system depends on three factors:
• manifold structure;
• heat conservation;
• structure and design of the solar still.
Prototype 1 is a solar still with some unusual features: it combines a continu-‐
ous flow of water during the process with the suction of humid air in the still.
The former eliminates stagnate water and system scaling, whereas the latter re-‐
moves condensation on the internal surface of the cover. This combination, with
the addition of heat exchangers, minimizes the energy loss into the external en-‐
vironment. Evaporated water is channelled into copper pipes, drawn in by a cold
salty solution entering the system. Vapour in the pipes is then condensed, and
the energy from condensation is returned to the cold salty solution, increasing
the efficiency of the system (Franceschetti & Gonella, 2012).
In addition, this prototype of solar still is particularly suitable for areas of the
world, where there is water scarcity but at the same time a high amount of in-‐
coming solar radiation, which makes the depuration process faster; the lack of
depuration plant and purified water causes illness and diseases through the
population, that is forced to drink contaminated water. Being a completely free-‐
standing energy system, it is suitable for critical situations: the simple scalabil-‐
ity of the system, in fact, allows to suit the needs of small and medium isolated
communities.
! KL!
<R<*G%%0M0#4-(.*,4,+"&*!
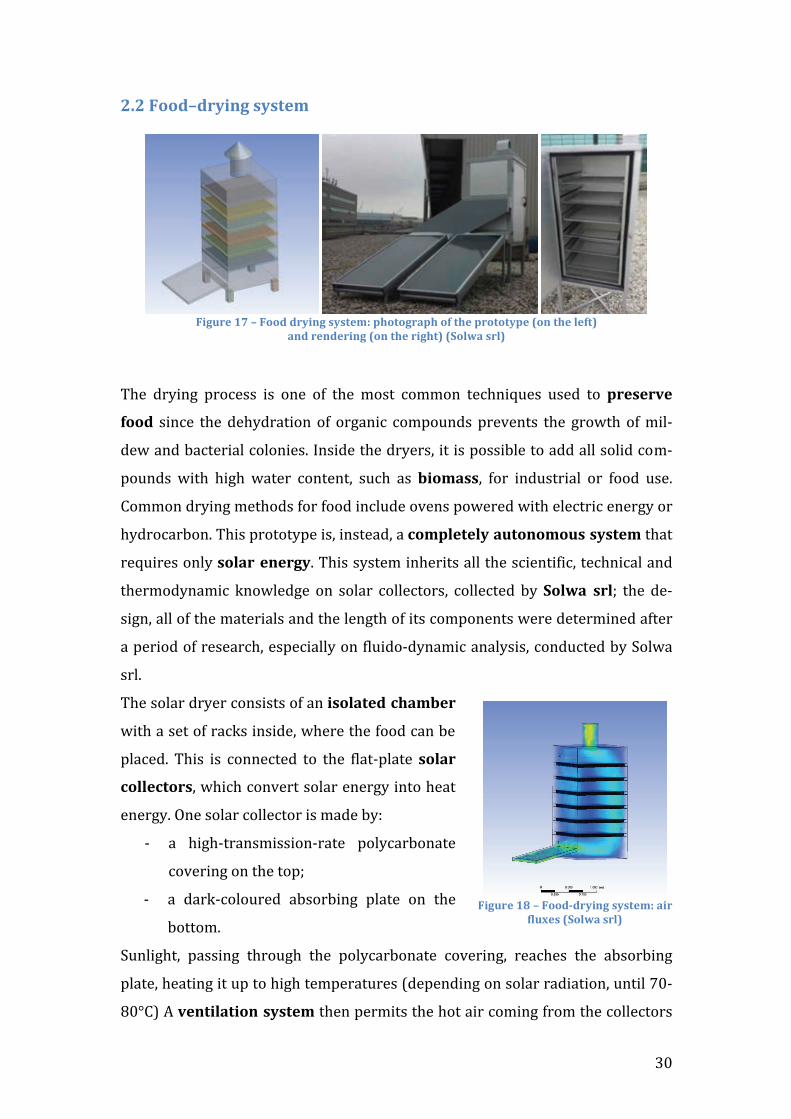
! ! !G-.5#"*>U*M*G%%0*0#4-(.*,4,+"&a*72%+%.#'72*%$*+2"*7#%+%+47"*W%(*+2"*1"$+X*
'(0*#"(0"#-(.*W%(*+2"*#-.2+X*W6%1\'*,#1X*
!
RB&! 0'8)$1! @'*6&..! ).! *$&! *D! %B&! 3*.%! 6*33*$! %&6B$)b=&.! =.&0! %*! 7#","#8"*
$%%0! .)$6&! %B&!0&B80'(%)*$!*D! *'1($)6! 6*3@*=$0.!@'&<&$%.! %B&! 1'*H%B!*D!3)+\
0&H!($0!>(6%&')(+!6*+*$)&.C!#$.)0&!%B&!0'8&'.a!)%!).!@*..)>+&!%*!(00!(++!.*+)0!6*3\
@*=$0.! H)%B! B)1B! H(%&'! 6*$%&$%a! .=6B! (.! /-%&',,a! D*'! )$0=.%')(+! *'! D**0! =.&C!
7*33*$!0'8)$1!3&%B*0.!D*'!D**0!)$6+=0&!*<&$.!@*H&'&0!H)%B!&+&6%')6!&$&'18!*'!
B80'*6('>*$C!RB).!@'*%*%8@&!).a!)$.%&(0a!(!)%&71"+"14*'5+%(%&%5,*,4,+"&!%B(%!
'&b=)'&.!*$+8!,%1'#*"("#.4C!RB).!.8.%&3!)$B&')%.!(++!%B&!.6)&$%)D)6a!%&6B$)6(+!($0!
%B&'3*08$(3)6! _$*H+&01&! *$! .*+('! 6*++&6%*'.a! 6*++&6%&0! >8!6%1\'* ,#1i! %B&! 0&\
.)1$a!(++!*D!%B&!3(%&')(+.!($0!%B&!+&$1%B!*D!)%.!6*3@*$&$%.!H&'&!0&%&'3)$&0!(D%&'!
(!@&')*0!*D!'&.&('6Ba!&.@&6)(++8!*$!D+=)0*\08$(3)6!($(+8.).a!6*$0=6%&0!>8!5*+H(!
.'+C!!
RB&!.*+('!0'8&'!6*$.).%.!*D!($!-,%1'+"0*)2'&/"#!
H)%B!(!.&%!*D!'(6_.!)$.)0&a!HB&'&!%B&!D**0!6($!>&!
@+(6&0C! RB).! ).! 6*$$&6%&0! %*! %B&! D+(%\@+(%&! ,%1'#*
)%11")+%#,a!HB)6B!6*$<&'%!.*+('!&$&'18!)$%*!B&(%!
&$&'18C!W$&!.*+('!6*++&6%*'!).!3(0&!>8c!!
\ (! B)1B\%'($.3)..)*$\'(%&! @*+86('>*$(%&!
6*<&')$1!*$!%B&!%*@i!
\ (! 0('_\6*+*='&0! (>.*'>)$1! @+(%&! *$! %B&!
>*%%*3C!
5=$+)1B%a! @(..)$1! %B'*=1B! %B&! @*+86('>*$(%&! 6*<&')$1a! '&(6B&.! %B&! (>.*'>)$1!
@+(%&a!B&(%)$1!)%!=@!%*!B)1B!%&3@&'(%='&.!90&@&$0)$1!*$!.*+('!'(0)(%)*$a!=$%)+!OL\
JLp7:!Q!8"(+-1'+-%(*,4,+"&!%B&$!@&'3)%.!%B&!B*%!()'!6*3)$1!D'*3!%B&!6*++&6%*'.!
!G-.5#"*>Z*M*G%%030#4-(.*,4,+"&a*'-#*
$15b",*W6%1\'*,#1X*
! K"!
%*!&$%&'! %B&!@*'*=.!'(6_.! )$.)0&! %B&!6B(3>&'a!&<(@*'(%)$1! %B&!H(%&'!6*$%()$&0!
)$.)0&! %B&! D**0a!>&D*'&!&e)%)$1! %B'*=1B!(! 6B)3$&8!(%! %B&! %*@!*D! %B&!0&<)6&C!W$&!
)$%&'&.%)$1! D&(%='&! ).! %B(%! %B&! D+=e!*D!()'!3*<&.! D'*3! +&D%! %*! ')1B%!*D! %B&!.8.%&3!
9+&D%!).!H&'&!%B&!B*%!()'!('')<&.!D'*3!%B&!.*+('!6*++&6%*'.:a!&$B($6)$1!)$!%B).!H(8!
%B&!0'8)$1!&DD)6)&$68!9.&&!A)1='&!"J!A)1='&!"O:C!
!
RB).! @'*%*%8@&!H(.! =.&0!0=')$1! %B&! &e@&')3&$%(+! @B(.&! *D! %B&! @'*`&6%! .)$6&! )%!
H(.!%B&!)$.%'=3&$%.!%B(%!H(.!(<()+(>+&!D*'!%B&!%&.%)$1!@B(.&!($0!%B(%!6*=+0!>&.%!
'&@'*0=6&!%B&!.*+('!0'8)$1!6*$0)%)*$.!%B(%!H)++!>&!@('%!*D!%B&!.+=01&\0'8)$1!.8.\
%&3c!>*%B!%B&!@'*%*%8@&!($0!%B&!0&.)1$&0!@'*`&6%!('&!6+*.&0!).*+(%&0!.8.%&3.!>=%!
D*'!0)DD&'&$%!'&(.*$.c!%B&!D**0\0'8)$1!.8.%&3!3=.%!.%*'&!D**0!)$!.(D&!6*$0)%)*$.a!
(H(8!D'*3!&e%&'$(+!6*$%(3)$($%.a!HB)+&!%B&!.+=01&\0'8)$1!.8.%&3!3=.%!_&&@!%B&!
B&(%!)$.)0&!%B&!6B(3>&'!9H)%B!(!0&.)1$!.)3)+('!%*!%B(%!*D!($!)$0=.%')(+!*<&$:C!
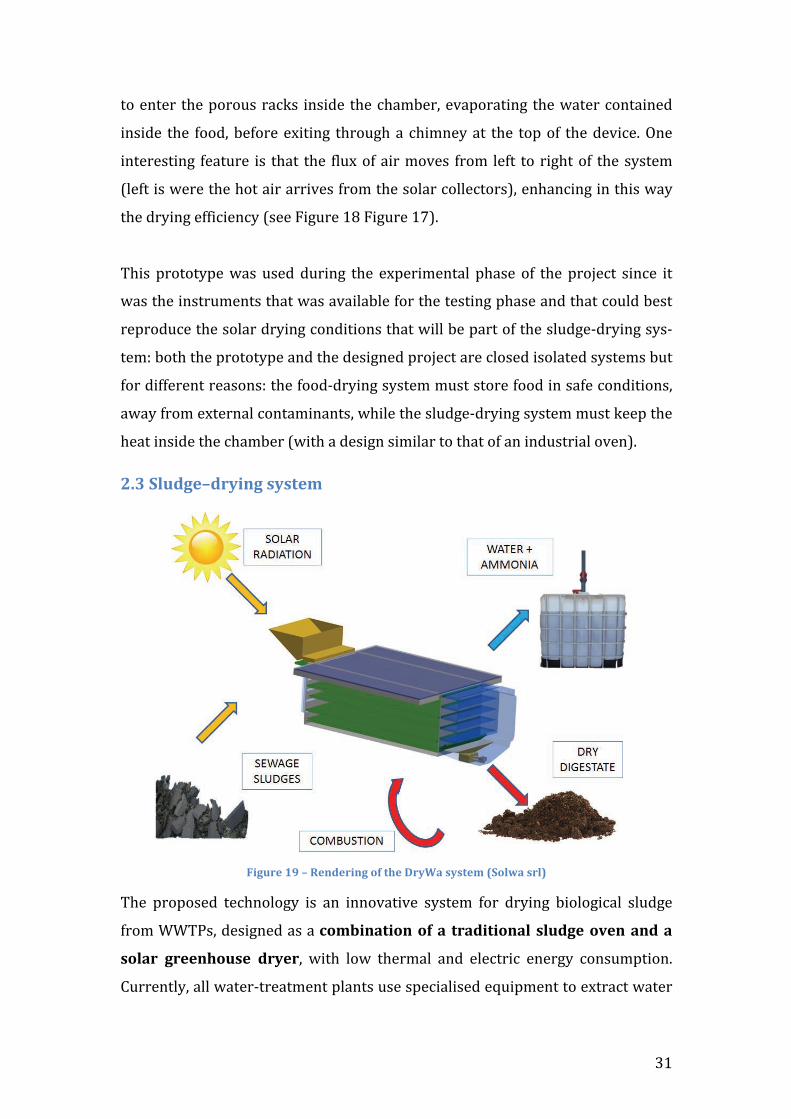
<R?*6150."M0#4-(.*,4,+"&*!
!G-.5#"*>Y*M*J"(0"#-(.*%$*+2"*O#4S'*,4,+"&*W6%1\'*,#1X*
RB&! @'*@*.&0! %&6B$*+*18! ).! ($! )$$*<(%)<&! .8.%&3! D*'! 0'8)$1! >)*+*1)6(+! .+=01&!
D'*3!FFR2.a!0&.)1$&0!(.!(!)%&/-('+-%(*%$*'* +#'0-+-%('1* ,150."*%8"(*'(0*'*
,%1'#* .#""(2%5,"* 0#4"#a! H)%B! +*H! %B&'3(+! ($0! &+&6%')6! &$&'18! 6*$.=3@%)*$C!
7=''&$%+8a!(++!H(%&'\%'&(%3&$%!@+($%.!=.&!.@&6)(+).&0!&b=)@3&$%!%*!&e%'(6%!H(%&'!
32
from the sludge, but only few of them have drying systems that can obtain a
dried sludge with 85-‐90% of DM (Frenceschetti, et al., 2014).
The proposed system is something different from what is currently available on
the market, in terms of performances, design, technology and dimensions. The
main feature that enhances its energy efficiency is the size: the module is pro-‐
jected to have the dimension of a common container (a box of approximately 6m
x 2.5m x 2.5m). This requires a lot less heat to dry the chamber compared to the
greenhouse one of the SSDP available in the market (see Paragraph 1.4).
Through the drying process, the moisture content of the sludge is significantly
reduced: for a sludge coming from urban wastewater, it is possible to achieve a
final water content of 10% (which means a DM content of 90%), as compared
to a final water content of 75-‐80% achieved by current mechanical methods (see
Paragraph 1.1.3)
2.3.1 Combustion of the dried sludge
The innovative idea behind the proposed system is that the sludge can be used as
a fuel for producing thermal heat through its combustion, and this heat can
be used for drying new sludge. The final phase of the process is, in fact, the incin-‐
eration of the sludge.
It is necessary to dry the sludge before combustion since sludge with a solid mat-‐
ter index between 30% and 50% is autogenous (it does not require additional
fuel for the combustion) (Turovskiy & Mathai, 2006). Anyway, it is important to
note that the thermal drying process has a negative energy balance, since the
energy required to dry the sludge is more than the energy coming from the com-‐
bustion: the energy produced by the combustion, in fact, supply for an expected
80% of the process while another 20% is needed (see calculations in Paragraph
4.7). For this reason an additional energy source is required to fill this gap:
the combination of solar air collectors to the high-‐performance sludge burner
allows to enhance the efficiency of the system and then cover the whole drying
! KK!
@'*6&..!9D*'!%B&!&e@&6%&0!.)h&!*D!%B&!6*++&6%*'.!.&&!2('(1'(@B!MCO:C!#$!%B).!H(8a!$*!
(00)%)*$(+!D=&+.!('&!'&b=)'&0C!
!
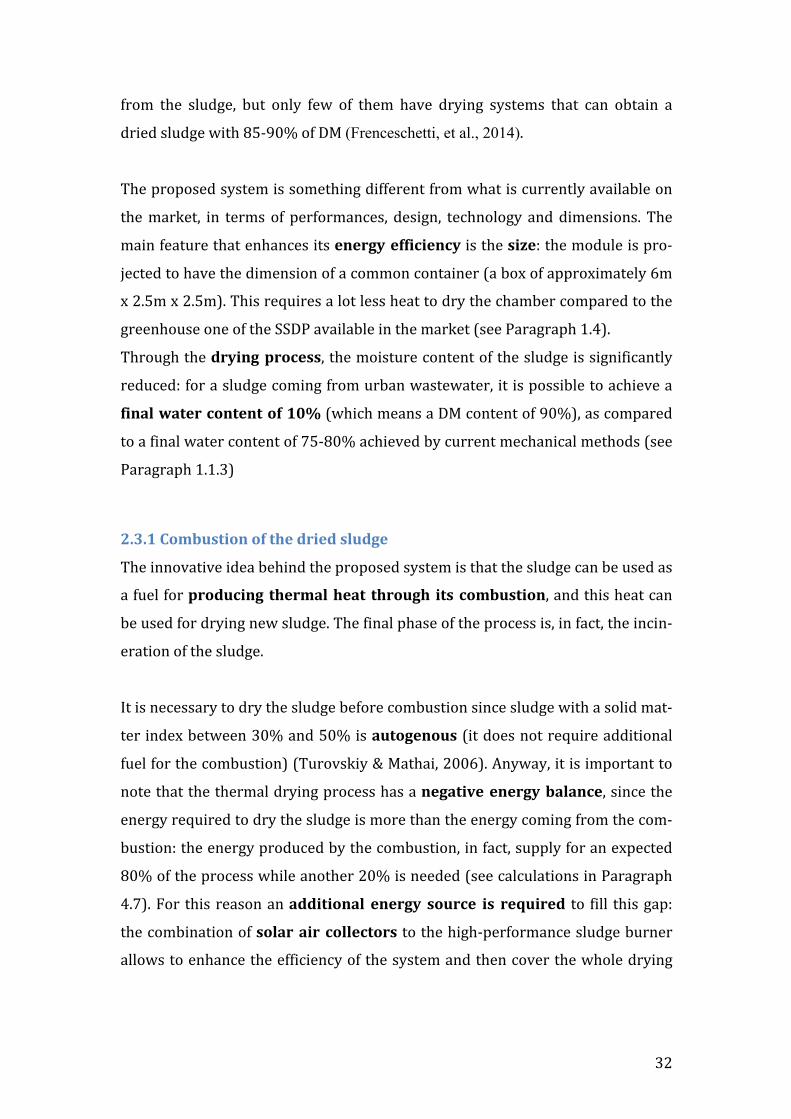
<R?R<*B")2(-)'1*0",)#-7+-%(**!
!G-.5#"*<=*M*6150."*0#4-(.*,4,+"&a*)%&7%("(+*,)2"&"*W6%1\'*,#1X*
!
RB&!0",-.(!*D!%B&!.8.%&3!).!<&'8!.)3)+('!%*!($!-(05,+#-'1*%8"(a!HB)6B!(++*H.!D*'!
(! +*H!%B&'3(+!0).@&'.)*$!'(%&C!W$&! )3@*'%($%! D&(%='&! ).! %B(%! %B&!.8.%&3!6($!>&!
>=)+%!)$!&%051",a!%B=.!'&0=6)$1!@'*0=6%)*$!6*.%.C!RB&!*$+8!<(')(>+&!6*3@*$&$%!
).a!)$!D(6%a!%B&!.*+('!6*++&6%*'a!HB)6B!.B*=+0!>&!0)3&$.)*$&0!(66*'0)$1!%*!%B&!1&*\
1'(@B)6(+!+*6(%)*$!HB&'&!%B&!.8.%&3!H)++!>&!=.&0!9.&&!2('(1'(@B!MCO:C!
RB&! 0'8)$1! @'*6&..! ).! &$&'1&%)6(++8! (..).%&0! >8!72%+%8%1+'-)* 7'("1,! ($0! >8! (!
2-.237"#$%#&'()"* -(("#*/5#("#a!(+)3&$%&0!>8!%B&!0')&0!.+=01&c!%B).!3(_&.! )%!
(+3*.%!($!&$&'18\'5+%(%&%5,*,4,+"&a!1'&&$!($0!.=.%()$(>+&C!
!
RB&!6*3@*$&$%.!*D!%B&!.8.%&3!('&!(.!D*++*H.c!
>X H#5,2-(.*,)#"\*
<X C"1+*)%(8"4"#*
?X 6%1'#*+2"#&'1*)%11")+%#*
AX C5#("#*
KX 9,2",*
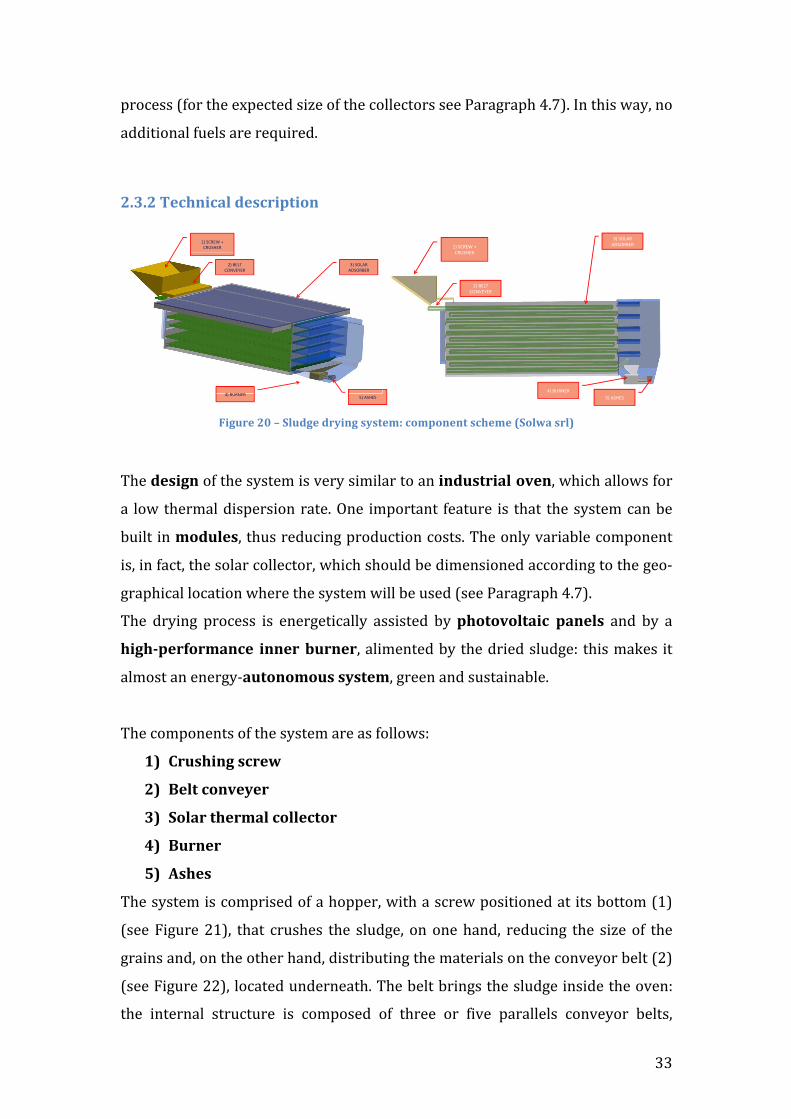
RB&!.8.%&3!).!6*3@').&0!*D!(!B*@@&'a!H)%B!(!.6'&H!@*.)%)*$&0!(%!)%.!>*%%*3!9":!
9.&&!A)1='&!P":a! %B(%! 6'=.B&.! %B&! .+=01&a! *$!*$&!B($0a! '&0=6)$1! %B&! .)h&! *D! %B&!
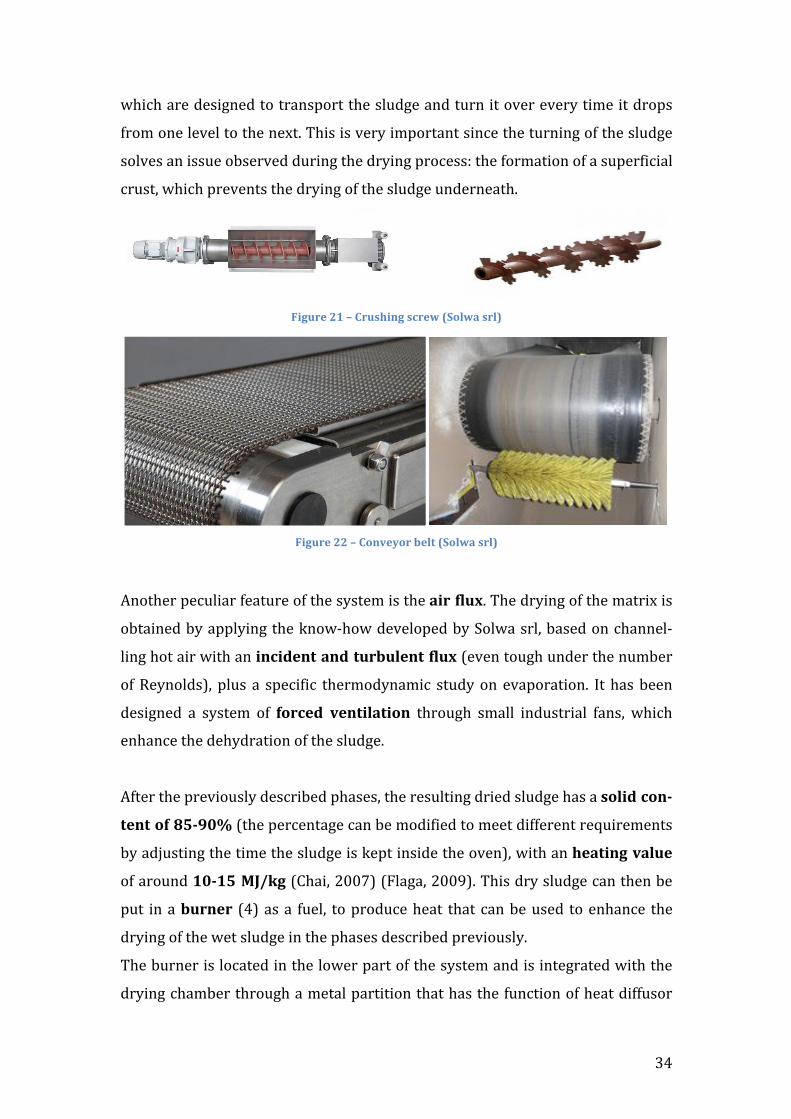
1'()$.!($0a!*$!%B&!*%B&'!B($0a!0).%')>=%)$1!%B&!3(%&')(+.!*$!%B&!6*$<&8*'!>&+%!9P:!
9.&&!A)1='&!PP:a!+*6(%&0!=$0&'$&(%BC!RB&!>&+%!>')$1.!%B&!.+=01&!)$.)0&!%B&!*<&$c!
%B&! )$%&'$(+! .%'=6%='&! ).! 6*3@*.&0! *D! %B'&&! *'! D)<&! @('(++&+.! 6*$<&8*'! >&+%.a!
!"#$%&'&()*(+,-&
!"#$%&'(#)#%&*$+'&##
,"#-'./#%012'3'&##
4"#$0.58$0&-'&##
7"#-*&1'&# 8"#5$+'$#
!"#$%&'&()*+&,-./0).1&
23&4("5$&6&("7485"&
93&:5;<&(=>?5#5"&
@3&4=;%"&%!4=":5"&
A3&:7">5"&B3&%4854&
! KM!
HB)6B!('&!0&.)1$&0!%*!%'($.@*'%!%B&!.+=01&!($0!%='$!)%!*<&'!&<&'8!%)3&!)%!0'*@.!
D'*3!*$&!+&<&+!%*!%B&!$&e%C!RB).!).!<&'8!)3@*'%($%!.)$6&!%B&!%='$)$1!*D!%B&!.+=01&!
.*+<&.!($!)..=&!*>.&'<&0!0=')$1!%B&!0'8)$1!@'*6&..c!%B&!D*'3(%)*$!*D!(!.=@&'D)6)(+!
6'=.%a!HB)6B!@'&<&$%.!%B&!0'8)$1!*D!%B&!.+=01&!=$0&'$&(%BC!
!G-.5#"*<>*M*H#5,2-(.*,)#"\*W6%1\'*,#1X*
! !G-.5#"*<<*M*H%(8"4%#*/"1+*W6%1\'*,#1X*
!
Q$*%B&'!@&6=+)('!D&(%='&!*D!%B&!.8.%&3!).!%B&!'-#*$15bC!RB&!0'8)$1!*D!%B&!3(%')e!).!
*>%()$&0!>8!(@@+8)$1!%B&!_$*H\B*H!0&<&+*@&0!>8!5*+H(!.'+a!>(.&0!*$!6B($$&+\
+)$1!B*%!()'!H)%B!($!-()-0"(+*'(0*+5#/51"(+*$15b!9&<&$!%*=1B!=$0&'!%B&!$=3>&'!
*D!S&8$*+0.:a! @+=.! (! .@&6)D)6! %B&'3*08$(3)6! .%=08!*$! &<(@*'(%)*$C! #%! B(.!>&&$!
0&.)1$&0! (! .8.%&3! *D! $%#)"0* 8"(+-1'+-%(! %B'*=1B! .3(++! )$0=.%')(+! D($.a! HB)6B!
&$B($6&!%B&!0&B80'(%)*$!*D!%B&!.+=01&C!
!
QD%&'!%B&!@'&<)*=.+8!0&.6')>&0!@B(.&.a!%B&!'&.=+%)$1!0')&0!.+=01&!B(.!(!,%1-0*)%(3
+"(+*%$*ZK3Y=]!9%B&!@&'6&$%(1&!6($!>&!3*0)D)&0!%*!3&&%!0)DD&'&$%!'&b=)'&3&$%.!
>8!(0`=.%)$1!%B&!%)3&!%B&!.+=01&!).!_&@%!)$.)0&!%B&!*<&$:a!H)%B!($!2"'+-(.*8'15"!
*D!('*=$0!>=3>K*Tk@`.!97B()a!PLLO:!9A+(1(a!PLLN:C!RB).!0'8!.+=01&!6($!%B&$!>&!
@=%! )$!(!/5#("#! 9M:!(.!(! D=&+a! %*!@'*0=6&!B&(%! %B(%! 6($!>&!=.&0! %*!&$B($6&! %B&!
0'8)$1!*D!%B&!H&%!.+=01&!)$!%B&!@B(.&.!0&.6')>&0!@'&<)*=.+8C!
RB&!>='$&'!).!+*6(%&0!)$!%B&!+*H&'!@('%!*D!%B&!.8.%&3!($0!).!)$%&1'(%&0!H)%B!%B&!
0'8)$1!6B(3>&'!%B'*=1B!(!3&%(+!@('%)%)*$!%B(%!B(.!%B&!D=$6%)*$!*D!B&(%!0)DD=.*'!
!!!!!!!!!!!!!!!!!!!!!!!!!!!!!!!!!!!!!!!!!!!!!!!!!!!!!!!!!!!!!!!!!!!!!!!!!!!!!!!!!!!!!!!! "
"
!!!!!!!!!!!!!!!!!!!!!!!!!!!!!!!!!!!!!!!!!!!!!!!!!!!!!!!!!!!!!!!!!!!!!!!!!!!!!!!!!!!!!!!!!!!!!!!!!!!!!!!!!!!"#$%&'"#(%!
"#$%&'()$!"**(+$#"$%&"'$()*+",-+".$()')/0"1"23)"%$44$"56%7*8/3$9":;"1"<=:>;".$6$?3)"@.AB"1"58)4C",$-(.'$%$/!"**(+$#"D3)??)"E3+2)6$4439":F"1"<;=G>"H+2$68)"')%+2)6)"@'IB"–"58)4J" 01234!5!6171#"=FK:>>L=GL;"8$9#"M<N"<F>"L>F==L;"""1""":;<#$#"*+4O)&*/P" " 2.+%(''&!&9!,121!/(!0&/=)&#"QAR"F=FKG=">$?:('$#"OOO&*+4O)&38"""1"""@AB&(9#"36S+T*+4O)&38"1"*+4O)TD$,&38" " 6&#('&9$!:=+(&9$: € 10.000,00 i.v."
54"D/+,$**+"%3"$**3,)?3+6$"U"$6$/($83,)V$68$",+)%372)8+"%)"76"3VD3)68+"S+8+2+48)3,+"$"%)"76"W/7,3)8+/$"368$/6+"
)%" )48+" /$6%3V$68+" )43V$68)8+" %)4" S)6(+" *8$**+&" I/CX)" Y736%3" U" 76" *3*8$V)" $6$/($83,)V$68$" )78+6+V+9"
8+8)4V$68$"(/$$6"$%"$,+*+*8$63W34$9",+6"?$/+"3VV3**3+63"6+,32$&"
"
Z7$*8$",)/)88$/3*83,[$" /$6%+6+"IQJXR" 34" *3*8$V)")"D3\")48)"$SS3,3$6?)"6$4" *$88+/$"%$3"*3*8$V3"%3"($*83+6$"%$3"
S)6([3&"
"
)*+,-../"0-1"23*+41""
R44+"*8)8+")887)4$"87883"(43"3VD3)683"%3"($*83+6$"%$3"/3S3783"*+6+"%+8)83"%3"*3*8$V3"36"(/)%+"%3"/3%7//$"34",+68$678+"%3"
acqua all’interno de3" S)6([39"Y7)43" S348/+D/$**$9"6)*8/+D/$**$"+",$68/3S7([$&" 54",+68$678+" 3%/3,+"(/)?3$")"Y7$*83"
*3*8$V3"D)**)"%)"G1<]"%3"^+*8)6?)"^$,,)")",3/,)"34"G=1G;]9"D)**)6%+"%)"76+"*8)8+"43Y73%+")%"76+"*+43%+"%$4"S)6(+"
*8$**+&"_7883" 3" *3*8$V3"$*3*8$683"%3"%3*3%/)8)?3+6$",+VD/3V+6+"$"*8/3??)6+" 3" S)6([3")4" S36$"%3"$*8/)//$" 34"V)((3+/"
,+68$678+"D+**3W34$"%3"),Y7)9"V)")44+"*8$**+"8$VD+",/$)6%+"%$(43")((4+V$/)83"%3"(/+**$"%3V$6*3+63"%3" S)6(+&"
H$4" NN]" %$(43" 3VD3)683" $*3*8$683" %+D+" Y7$*8)" +D$/)?3+6$" 3" S)6([3" 2$6(+6+" /),,+483" $" D+/8)83" )" 3VD3)683" %3"
*V)483V$68+"@%3*,)/3,[$9"*D)/(3V$68+")"8$//)9"$,,&B&"
"
54" *3*8$V)"IQJXR"*3" D+6$" 3VV$%3)8)V$68$"%+D+" 3" *3*8$V3"%3"%3*3%/)8)?3+6$9" )6%)6%+6$")" ,+4$88)/$" 3" S)6([3&"
I/CX)"U"%+8)8+"%3"76)"8/)V+((3)"*74",73"S+6%+"U"D/$*$68$"76)",+,4$)"S/)687V)8/3,$",[$"D$/V$88$"%)"76"4)8+"%3"
ridurre le dimensioni dei grani di fanghi e dall’altro distribuire e calibrare il materiale sul nastro trasportatore
D+/8+"*+88+"%3"$**)&"
"
""
"
"
!!!!!!!!!!!!!!!!!!!!!!!!!!!!!!!!!!!!!!!!!!!!!!!!!!!!!!!!!!!!!!!!!!!!!!!!!!!!!!!!!!!!!!!! "
"
!!!!!!!!!!!!!!!!!!!!!!!!!!!!!!!!!!!!!!!!!!!!!!!!!!!!!!!!!!!!!!!!!!!!!!!!!!!!!!!!!!!!!!!!!!!!!!!!!!!!!!!!!!!"#$%&'"#(%!
"#$%&'()$!"**(+$#"$%&"'$()*+",-+".$()')/0"1"23)"%$44$"56%7*8/3$9":;"1"<=:>;".$6$?3)"@.AB"1"58)4C",$-(.'$%$/!"**(+$#"D3)??)"E3+2)6$4439":F"1"<;=G>"H+2$68)"')%+2)6)"@'IB"–"58)4J" 01234!5!6171#"=FK:>>L=GL;"8$9#"M<N"<F>"L>F==L;"""1""":;<#$#"*+4O)&*/P" " 2.+%(''&!&9!,121!/(!0&/=)&#"QAR"F=FKG=">$?:('$#"OOO&*+4O)&38"""1"""@AB&(9#"36S+T*+4O)&38"1"*+4O)TD$,&38" " 6&#('&9$!:=+(&9$: € 10.000,00 i.v."
)*+,-./012,*/."3.,"41/56,"
5"S)6(U3"%3*3%/)8)839"76)"2+48)"8/38)83"$"%3*D+*83"*74"D3)6+9"2$6(+6+"8/)*D+/tati all’interno del forno DRYWA da un
6)*8/+" 8/)*D+/8)8+/$&" L’architettura" 368$/6)" %3" I/CV)9" ,+W$" *3" $236,$" )6,U$" %)44)" S3(7/)9" X" ,+*838738)" %)" D3Y"
D3)639"3WD34)83")"*Z)4?3"6$()8323&"[+6"\7$*8+"*3*8$W)"34"S)6(+9",)%$6%+"%3/$88)W$68$"*74"6)*8/+"*+88+*8)68$9"U)"4)"
possibilità di “autorivoltarsi”," /3*+42$6%+" 4)" D/+Z4$W)83,)" %$44)" S/)687W)?3+6$" %$44+" *8/)8+" *7D$/S3,3)4$"
3WD$/W$)Z34$"$%")/3$((3)W$68+"368$/6+&"]7$*8)",+6%3?3+6$"X"D/+8/)88)"D$/"87883"(43"*Z)4?3"D/+($88)83&"
"
54" S)6(+"2iene quindi trasportato lungo tutta l’intera lunghezza del
6)*8/+9" 4)" ,73"2$4+,38^"%3"W+23W$68)?3+6$"X" /$(+4)8)")88/)2$/*+"76"
*3*8$W)" $4$88/+63,+" @($*838+" %)" 76)" *$/3$" %3" *$6*+/3B" ,U$" /34$2)"
l’incidenza solare e" l’energia fornita dal bruciatore interno,
()/)68$6%+" \736%3" 76" 8$WD+" %3" D$/W)6$6?)" 3%+6$+" )4" S)6(+" D$/"
/)((376($/$"34"(/)%+"%3"$**3,,)?3+6$"*8)Z3438+&"
"
.3*8)"4)"%32$/*)"(/)674+W$8/3)"%$4"S)6(+")4"2)/3)/$"%$4",+68$678+"3%/3,+"36"$**+",+68$678+9"*3"3D+83??)"%3"78343??)/$"
%32$/*$"83D+4+(3$"%3"6)*8/3")44+"*,+D+"%3"()/)683/$"4)"W)((3+/$"S7+/37*,38)"%3"2)D+/$"%)4"4)8+"%3")DD+((3+"%$4"S)6(+"
*74"6)*8/+&"R"8)4"S36$"34"D/3W+"6)*8/+"8/)*D+/8)8+/$"*)/^",+*838738+"%)"76)"W)(43)"S36$"W$8)443,)9"D$/"D)**)/$"D+3"
nei nastri trasportatori inferiori all’impiego di una membrana idrofobica traspirante. Quest’ultima membrana è
/$)43??)8)" 36" 6)6+S/3Z/$" ,U$" ,+6*$68+6+" 34" D)**)((3+" %$4" 2)D+/$9" D7/" ()/)68$6%+" 4)" 8$678)" %$4" S)6(+" ,+6"
(/)674+W$8/3)"W+48+"S36$&""
"
L’essiccazione della matrice viene garantita sfruttando 34" _6+O" `+O" *2347DD)8+" %)" a+4O)" a/49" Z)*)8)" *744)"
,)6)43??)?3+6$"%3")/3)",)4%)"36",+6"S47**+"36,3%$68$"$"87/Z+4$68+"@6+6+*8)68$"*3"*3)"*+88+"34"67W$/+"%3"Q$C6+4%*B"
ed ad uno specifico studio termodinamico sull’evaporazione&"
'$/" ()/)683/$" 34"W)**3W+" /$6%3W$68+" 8$/W+" $" S473%+%36)W3,+" X" *8)8+" D/+($88)8+9" )88/)2$/*+" D3,,+4$" 2$68+4$"
36%7*8/3)439" 76" *3*8$W)" %3" )$/$)?3+6$" S+/?)8)" 36" (/)%+" %3" +88$6$/$"un aumento di estrazione dell’acqua dalla
W)8/3,$"S)6(+*)&"
"
35
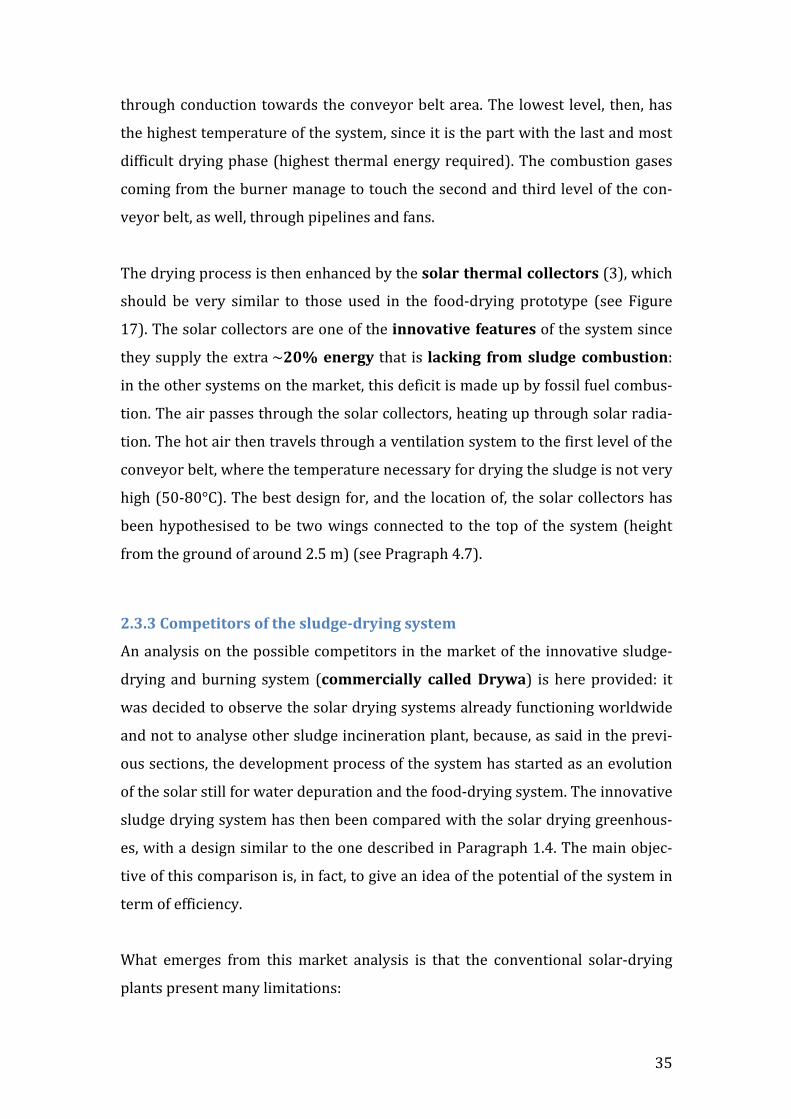
through conduction towards the conveyor belt area. The lowest level, then, has
the highest temperature of the system, since it is the part with the last and most
difficult drying phase (highest thermal energy required). The combustion gases
coming from the burner manage to touch the second and third level of the con-‐
veyor belt, as well, through pipelines and fans.
The drying process is then enhanced by the solar thermal collectors (3), which
should be very similar to those used in the food-‐drying prototype (see Figure
17). The solar collectors are one of the innovative features of the system since
they supply the extra ~20% energy that is lacking from sludge combustion:
in the other systems on the market, this deficit is made up by fossil fuel combus-‐
tion. The air passes through the solar collectors, heating up through solar radia-‐
tion. The hot air then travels through a ventilation system to the first level of the
conveyor belt, where the temperature necessary for drying the sludge is not very
high (50-‐80°C). The best design for, and the location of, the solar collectors has
been hypothesised to be two wings connected to the top of the system (height
from the ground of around 2.5 m) (see Pragraph 4.7).
2.3.3 Competitors of the sludge-‐drying system
An analysis on the possible competitors in the market of the innovative sludge-‐
drying and burning system (commercially called Drywa) is here provided: it
was decided to observe the solar drying systems already functioning worldwide
and not to analyse other sludge incineration plant, because, as said in the previ-‐
ous sections, the development process of the system has started as an evolution
of the solar still for water depuration and the food-‐drying system. The innovative
sludge drying system has then been compared with the solar drying greenhous-‐
es, with a design similar to the one described in Paragraph 1.4. The main objec-‐
tive of this comparison is, in fact, to give an idea of the potential of the system in
term of efficiency.
What emerges from this market analysis is that the conventional solar-‐drying
plants present many limitations:
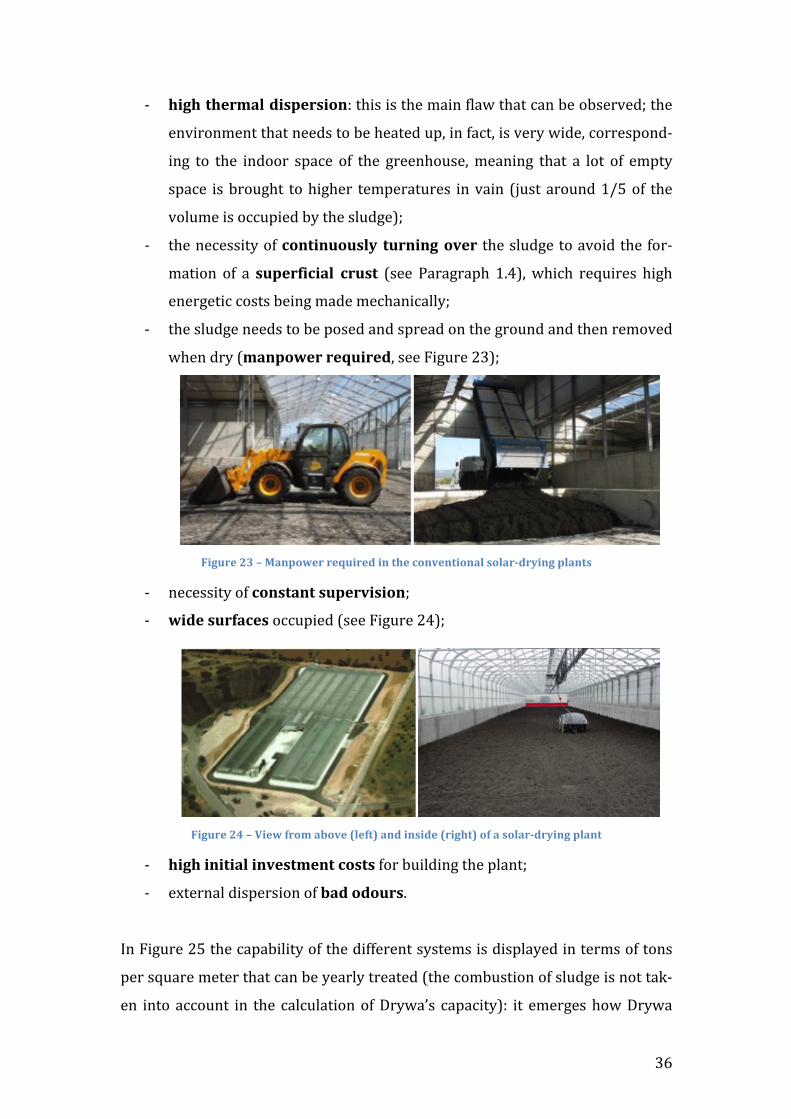
36
-‐ high thermal dispersion: this is the main flaw that can be observed; the
environment that needs to be heated up, in fact, is very wide, correspond-‐
ing to the indoor space of the greenhouse, meaning that a lot of empty
space is brought to higher temperatures in vain (just around 1/5 of the
volume is occupied by the sludge);
-‐ the necessity of continuously turning over the sludge to avoid the for-‐
mation of a superficial crust (see Paragraph 1.4), which requires high
energetic costs being made mechanically;
-‐ the sludge needs to be posed and spread on the ground and then removed
when dry (manpower required, see Figure 23);
Figure 23 – Manpower required in the conventional solar-‐drying plants
-‐ necessity of constant supervision;
-‐ wide surfaces occupied (see Figure 24);
Figure 24 – View from above (left) and inside (right) of a solar-‐drying plant
-‐ high initial investment costs for building the plant;
-‐ external dispersion of bad odours.
In Figure 25 the capability of the different systems is displayed in terms of tons
per square meter that can be yearly treated (the combustion of sludge is not tak-‐
en into account in the calculation of Drywa’s capacity): it emerges how Drywa
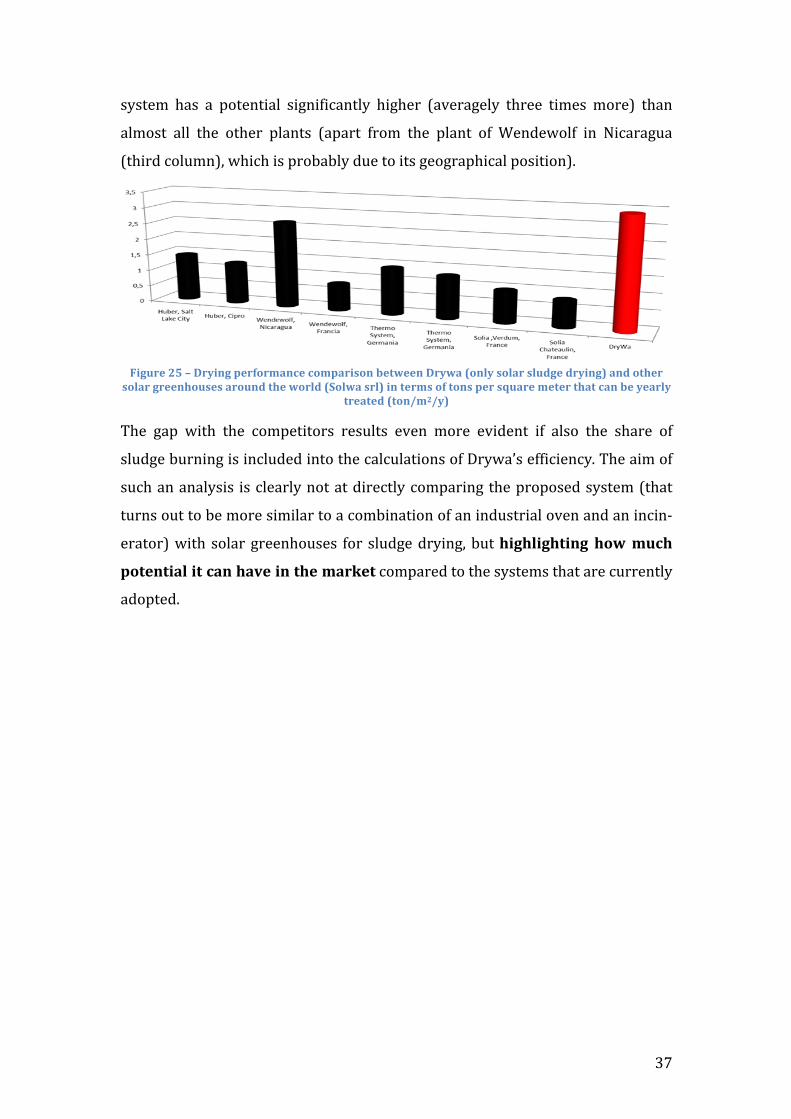
! KO!
.8.%&3! B(.! (! @*%&$%)(+! .)1$)D)6($%+8! B)1B&'! 9(<&'(1&+8! %B'&&! %)3&.! 3*'&:! %B($!
(+3*.%! (++! %B&! *%B&'! @+($%.! 9(@('%! D'*3! %B&! @+($%! *D! F&$0&H*+D! )$! I)6('(1=(!
9%B)'0!6*+=3$:a!HB)6B!).!@'*>(>+8!0=&!%*!)%.!1&*1'(@B)6(+!@*.)%)*$:C!
!G-.5#"*<K*M*O#4-(.*7"#$%#&'()"*)%&7'#-,%(*/"+\""(*O#4\'*W%(14*,%1'#*,150."*0#4-(.X*'(0*%+2"#*
,%1'#*.#""(2%5,",*'#%5(0*+2"*\%#10*W6%1\'*,#1X*-(*+"#&,*%$*+%(,*7"#*,d5'#"*&"+"#*+2'+*)'(*/"*4"'#14*+#"'+"0*W+%(@&<@4X*
RB&! 1(@! H)%B! %B&! 6*3@&%)%*'.! '&.=+%.! &<&$! 3*'&! &<)0&$%! )D! (+.*! %B&! .B('&! *D!
.+=01&!>='$)$1!).!)$6+=0&0!)$%*!%B&!6(+6=+(%)*$.!*D!?'8H(/.!&DD)6)&$68C!RB&!()3!*D!
.=6B!($!($(+8.).! ).!6+&('+8!$*%!(%!0)'&6%+8!6*3@(')$1!%B&!@'*@*.&0!.8.%&3!9%B(%!
%='$.!*=%!%*!>&!3*'&!.)3)+('!%*!(!6*3>)$(%)*$!*D!($!)$0=.%')(+!*<&$!($0!($!)$6)$\
&'(%*':!H)%B! .*+('!1'&&$B*=.&.! D*'! .+=01&!0'8)$1a!>=%!2-.21-.2+-(.* 2%\*&5)2*
7%+"(+-'1*-+*)'(*2'8"*-(*+2"*&'#`"+!6*3@('&0!%*!%B&!.8.%&3.!%B(%!('&!6=''&$%+8!
(0*@%&0C!
! !
38
Chapter 3 – Materials and methods The experimental part has the aim of testing different types of sludge that come
from a WWTP in Treviso (Italy) (see Paragraph 1.2), with Prototype 1 and 2 (see
Paragraph 2.1 and 2.2) and a laboratory oven.
The three types of sludge, sampled for the experimentation, are taken after three
different phases of the WWTP of Treviso: the Secondary sedimentation, the
Thickening phase and the Anaerobic digestion phase.
The main characteristic of these sludge samples (for the sake of this experimen-‐
tation) is solid content (the first two types are the same sludge only with differ-‐
ent % DM while the third one is digestate); it is, however, not possible to previ-‐
ously know the exact % DM in the sludge, since it depends on several variables of
the WWTP’s processes. The samples were:
-‐ sludge after the secondary sedimentation – around 0.5-‐1% DM;
-‐ sludge after the thickening phase – around 2.5-‐3% DM;
-‐ digestate after anaerobic digestion goes under mechanical de-‐
watering (belt press) resulting in a final product with around 20-‐
25% DM.
The goal is to observe their different behaviour during the drying process and
draw various drying curves in order to understand which are the best settings
for an optimal design of the projected system (see Chapter 4).
For a better comparison between the samples, it would have been better to have
the same biological sludge also at the higher solid content, but this was not pos-‐
sible since the belt press in the WWTP in Treviso is located only after the anaer-‐
obic digestion phase.
3.1 Analysis of the Solar-‐drying process
3.1.1 Calculation of the Total Solar Incoming Radiation The incoming solar radiation has been constantly detected with a sensor, lo-‐
cated on the top of the electrical box. For a better comprehension of the sludge
drying rate, the total amount of radiation that the sludge absorbed during the
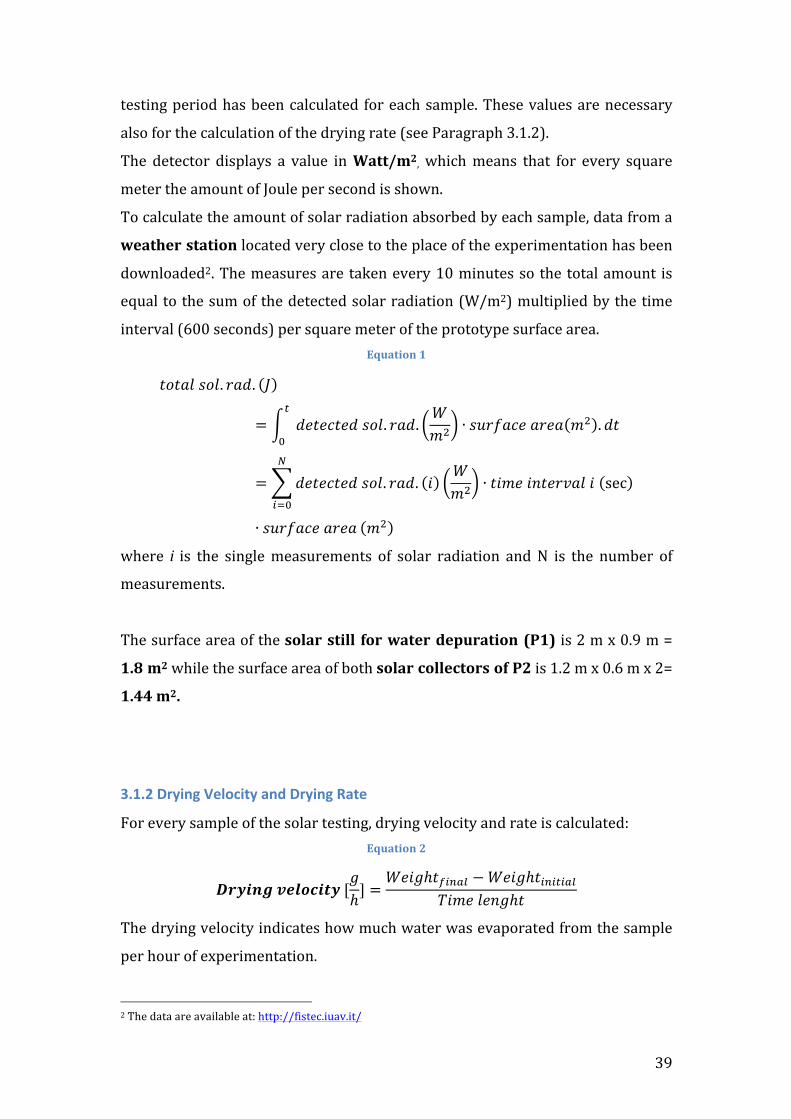
39
testing period has been calculated for each sample. These values are necessary
also for the calculation of the drying rate (see Paragraph 3.1.2).
The detector displays a value in Watt/m2, which means that for every square
meter the amount of Joule per second is shown.
To calculate the amount of solar radiation absorbed by each sample, data from a
weather station located very close to the place of the experimentation has been
downloaded2. The measures are taken every 10 minutes so the total amount is
equal to the sum of the detected solar radiation (W/m2) multiplied by the time
interval (600 seconds) per square meter of the prototype surface area. Equation 1
𝑡𝑜𝑡𝑎𝑙 𝑠𝑜𝑙. 𝑟𝑎𝑑. 𝐽
= 𝑑𝑒𝑡𝑒𝑐𝑡𝑒𝑑 𝑠𝑜𝑙. 𝑟𝑎𝑑.𝑊𝑚! ∙ 𝑠𝑢𝑟𝑓𝑎𝑐𝑒 𝑎𝑟𝑒𝑎 𝑚! .𝑑𝑡
!
!
= 𝑑𝑒𝑡𝑒𝑐𝑡𝑒𝑑 𝑠𝑜𝑙. 𝑟𝑎𝑑. 𝑖𝑊𝑚! ∙ 𝑡𝑖𝑚𝑒 𝑖𝑛𝑡𝑒𝑟𝑣𝑎𝑙 𝑖 sec
!
!!!
∙ 𝑠𝑢𝑟𝑓𝑎𝑐𝑒 𝑎𝑟𝑒𝑎 𝑚!
where i is the single measurements of solar radiation and N is the number of
measurements.
The surface area of the solar still for water depuration (P1) is 2 m x 0.9 m =
1.8 m2 while the surface area of both solar collectors of P2 is 1.2 m x 0.6 m x 2=
1.44 m2.
3.1.2 Drying Velocity and Drying Rate
For every sample of the solar testing, drying velocity and rate is calculated: Equation 2
𝑫𝒓𝒚𝒊𝒏𝒈 𝒗𝒆𝒍𝒐𝒄𝒊𝒕𝒚 [𝑔ℎ] =
𝑊𝑒𝑖𝑔ℎ𝑡!"#$% −𝑊𝑒𝑖𝑔ℎ𝑡!"!#!$%𝑇𝑖𝑚𝑒 𝑙𝑒𝑛𝑔ℎ𝑡
The drying velocity indicates how much water was evaporated from the sample
per hour of experimentation.
2 The data are available at: http://fistec.iuav.it/
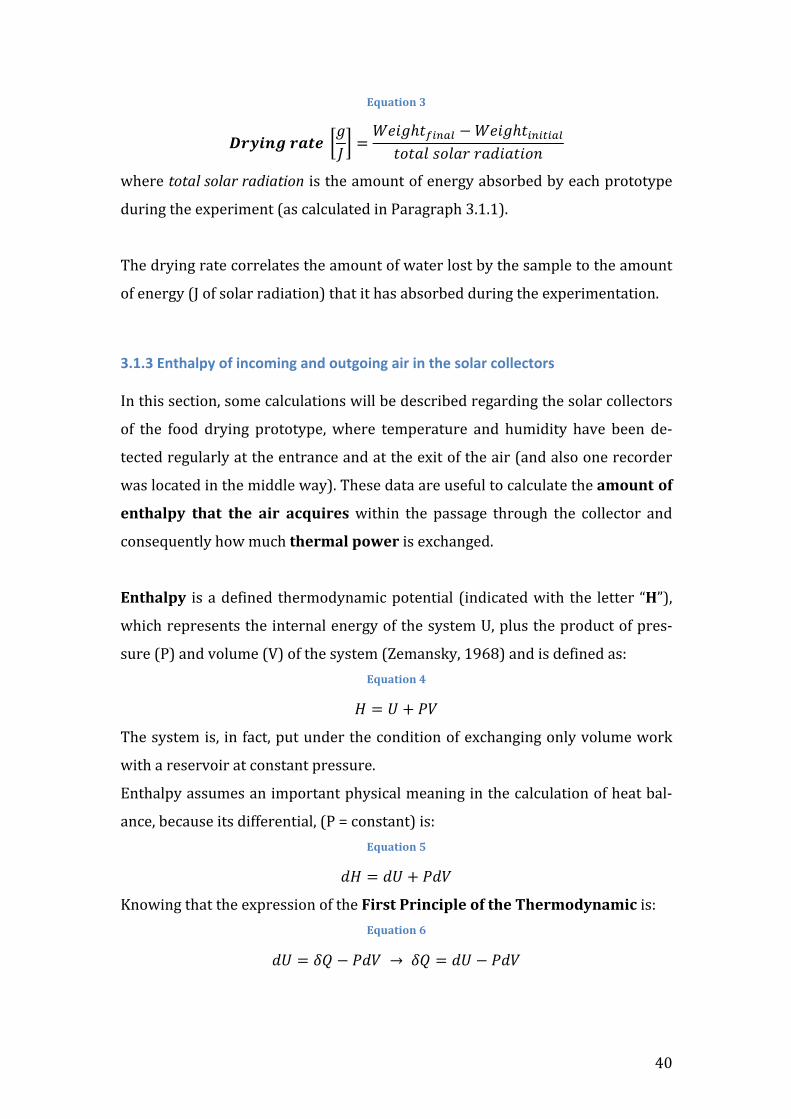
40
Equation 3
𝑫𝒓𝒚𝒊𝒏𝒈 𝒓𝒂𝒕𝒆 𝑔𝐽 =
𝑊𝑒𝑖𝑔ℎ𝑡!"#$% −𝑊𝑒𝑖𝑔ℎ𝑡!"!#!"#𝑡𝑜𝑡𝑎𝑙 𝑠𝑜𝑙𝑎𝑟 𝑟𝑎𝑑𝑖𝑎𝑡𝑖𝑜𝑛
where total solar radiation is the amount of energy absorbed by each prototype
during the experiment (as calculated in Paragraph 3.1.1).
The drying rate correlates the amount of water lost by the sample to the amount
of energy (J of solar radiation) that it has absorbed during the experimentation.
3.1.3 Enthalpy of incoming and outgoing air in the solar collectors In this section, some calculations will be described regarding the solar collectors
of the food drying prototype, where temperature and humidity have been de-‐
tected regularly at the entrance and at the exit of the air (and also one recorder
was located in the middle way). These data are useful to calculate the amount of
enthalpy that the air acquires within the passage through the collector and
consequently how much thermal power is exchanged.
Enthalpy is a defined thermodynamic potential (indicated with the letter “H”),
which represents the internal energy of the system U, plus the product of pres-‐
sure (P) and volume (V) of the system (Zemansky, 1968) and is defined as: Equation 4
𝐻 = 𝑈 + 𝑃𝑉
The system is, in fact, put under the condition of exchanging only volume work
with a reservoir at constant pressure.
Enthalpy assumes an important physical meaning in the calculation of heat bal-‐
ance, because its differential, (P = constant) is: Equation 5
𝑑𝐻 = 𝑑𝑈 + 𝑃𝑑𝑉
Knowing that the expression of the First Principle of the Thermodynamic is: Equation 6
𝑑𝑈 = 𝛿𝑄 − 𝑃𝑑𝑉 → 𝛿𝑄 = 𝑑𝑈 − 𝑃𝑑𝑉
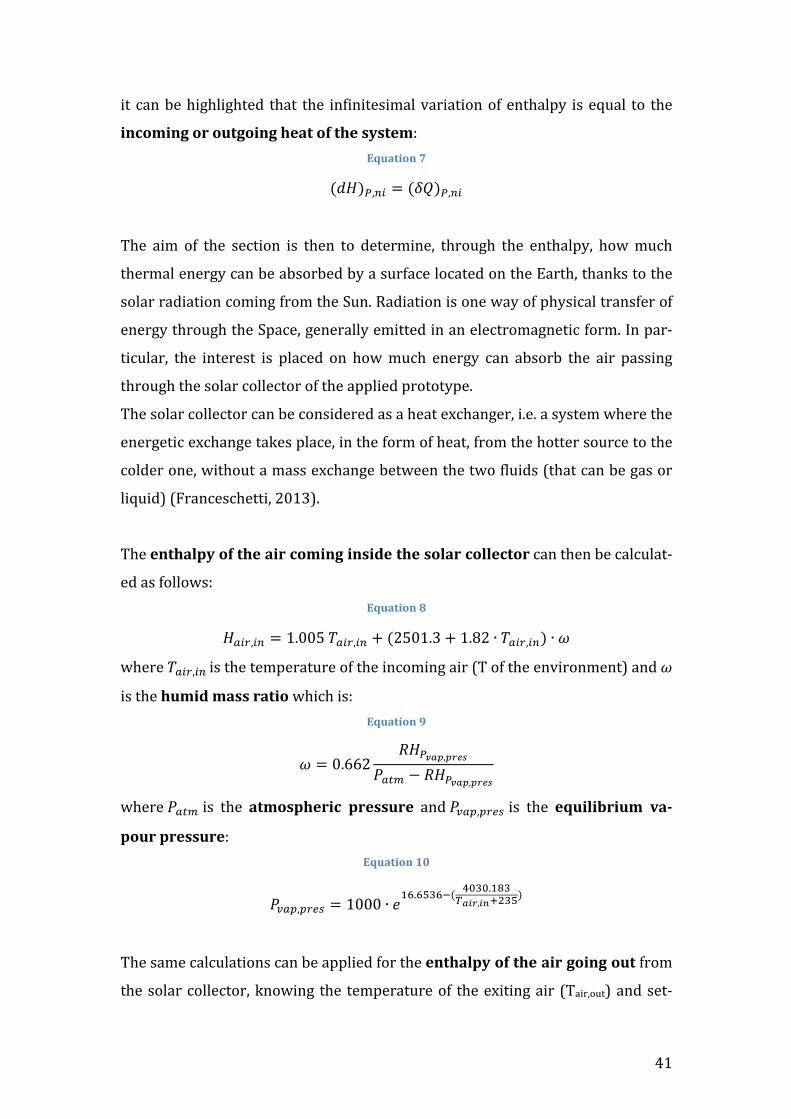
41
it can be highlighted that the infinitesimal variation of enthalpy is equal to the
incoming or outgoing heat of the system: Equation 7
(𝑑𝐻)!,!" = (𝛿𝑄)!,!"
The aim of the section is then to determine, through the enthalpy, how much
thermal energy can be absorbed by a surface located on the Earth, thanks to the
solar radiation coming from the Sun. Radiation is one way of physical transfer of
energy through the Space, generally emitted in an electromagnetic form. In par-‐
ticular, the interest is placed on how much energy can absorb the air passing
through the solar collector of the applied prototype.
The solar collector can be considered as a heat exchanger, i.e. a system where the
energetic exchange takes place, in the form of heat, from the hotter source to the
colder one, without a mass exchange between the two fluids (that can be gas or
liquid) (Franceschetti, 2013).
The enthalpy of the air coming inside the solar collector can then be calculat-‐
ed as follows: Equation 8
𝐻!"#,!" = 1.005 𝑇!"#,!" + (2501.3+ 1.82 ∙ 𝑇!"#,!") ∙ 𝜔
where 𝑇!"#,!" is the temperature of the incoming air (T of the environment) and 𝜔
is the humid mass ratio which is: Equation 9
𝜔 = 0.662𝑅𝐻!!"#,!"#$
𝑃!"# − 𝑅𝐻!!"#,!"#$
where 𝑃!"# is the atmospheric pressure and 𝑃!"#,!"#! is the equilibrium va-‐
pour pressure: Equation 10
𝑃!"#,!"#$ = 1000 ∙ 𝑒!".!"#!!( !"#".!"#
!!"#,!"!!"#)
The same calculations can be applied for the enthalpy of the air going out from
the solar collector, knowing the temperature of the exiting air (Tair,out) and set-‐
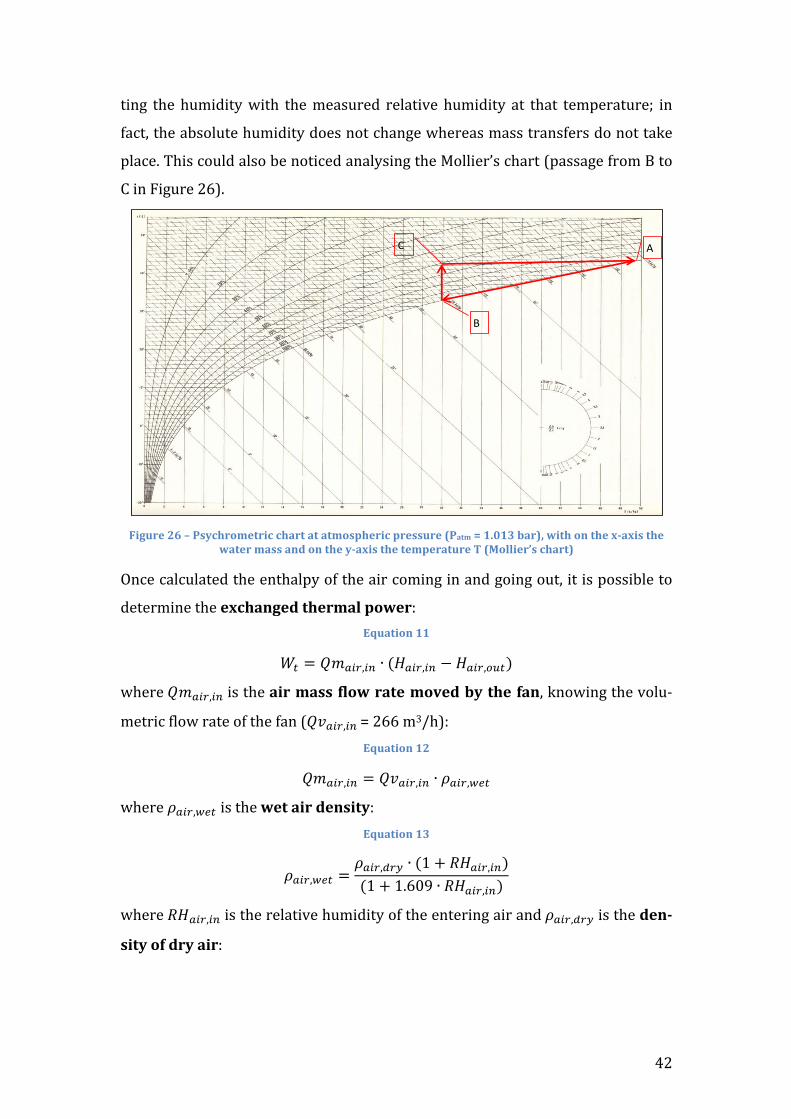
42
ting the humidity with the measured relative humidity at that temperature; in
fact, the absolute humidity does not change whereas mass transfers do not take
place. This could also be noticed analysing the Mollier’s chart (passage from B to
C in Figure 26).
Figure 26 – Psychrometric chart at atmospheric pressure (Patm = 1.013 bar), with on the x-‐axis the
water mass and on the y-‐axis the temperature T (Mollier’s chart)
Once calculated the enthalpy of the air coming in and going out, it is possible to
determine the exchanged thermal power: Equation 11
𝑊! = 𝑄𝑚!"#,!" ∙ (𝐻!"#,!" − 𝐻!"#,!"#)
where 𝑄𝑚!"#,!" is the air mass flow rate moved by the fan, knowing the volu-‐
metric flow rate of the fan (𝑄𝑣!"#,!" = 266 m3/h): Equation 12
𝑄𝑚!"#,!" = 𝑄𝑣!"#,!" ∙ 𝜌!"#,!"#
where 𝜌!"#,!"# is the wet air density: Equation 13
𝜌!"#,!"# =𝜌!"#,!"# ∙ (1+ 𝑅𝐻!"#,!")(1+ 1.609 ∙ 𝑅𝐻!"#,!")
where 𝑅𝐻!"#,!" is the relative humidity of the entering air and 𝜌!"#,!"# is the den-‐
sity of dry air:
- 62 -
Grafico 17 – Diagramma psicrometrico a pressione atmosferica (Patm=1.013 Bar), con nelle ascisse la massa di acqua e nelle ordinate la temperatura a cui ci si trova. Nello studio delle serre solari, ed in particolare dell’aria che in esse circola, ci si soffermerà ad analizzare i passaggi che avvengono dal punto di vista della condensazione nello scambiatore di calore (da punto A a punto B), nel surriscaldamento dell’aria (da punto B a punto C) e nella camera di evaporazione (da punto C a punto A), sotto la spinta della radiazione solare.
7.1.1. Radiazione solare
7.1.1.1. Introduzione La radiazione è una modalità di trasferimento fisico di energia attraverso lo spazio, emessa generalmente sotto forma di onde elettromagnetiche. La caratteristica comune della radiazione è la cessione di energia alla materia investita dal fascio elettromagnetico emesso. Nel caso della presente ricerca ci si soffermerà nella radiazione solare, che viene emessa da parte del Sole, conseguenza delle reazioni atomiche che avvengono all’interno del corpo celeste. In particolare l’interesse è comprendere e quantificare come una superficie collocata sulla superficie terreste sia in grado di assorbire energia, per via radiativa, e convertirla ad una lunghezza d’onda utilizzabile al fine dell’evaporazione della soluzione che si vuole trattare all’interno di una serra solare. Come appena affermato, l’intensità radiativa è funzione dell’intensità del corpo emittente, del mezzo attraverso cui l’onda elettromagnetica passa e della geometria del corpo ricevente. Per quanto riguarda il primo punto i ricercatori Stefan-Boltzmann [6] hanno sviluppato una formulazione in grado di calcolare la potenza irradiata nelle 3 dimensioni da parte di un corpo nero che si trova ad una determinata temperatura (vedi Equazione 46). Equazione 46
Con Ir la potenza irradiata, T la temperatura del corpo emittente (espressa in Kelvin) e σ denominata costante di Stefan-Boltzmann paria a 5.67*10-8 Wm-2K-4. Secondo questa legge, risulta che il Sole emette, essendo un corpo nero dalla temperatura superficiale di 6000 °K, in tutte le lunghezze d’onda ma in particolare nello spettro del visibile. La superficie terrestre d’altro canto
A
B
C
43
Equation 14
𝜌!"#,!"# =𝑃!"#
286.9 ∙ 𝑇!"#,!"
3.2 Analysis of the thermal-‐drying process
The data obtained from thermal drying are weight measures of the samples, tak-‐
en every 30 minutes. For a better comprehension of the behaviour of the differ-‐
ent types of sludge, many calculations can be performed; in particular it was cho-‐
sen to calculate: Equation 15
1) 𝑾𝒆𝒊𝒈𝒉𝒕 𝒍𝒐𝒔𝒔 𝒇𝒓𝒐𝒎 𝒕𝒉𝒆 𝒔𝒕𝒂𝒓𝒕 [%] = !"#$!!!"!#!$% !!"#$!! (!)!"#$!!!"!#!$%
∙ 100
where i is the single measurement
The drying differential is an indication on how much water has been lost
through every step of the process, until the complete drying, compared to the
initial weight (in %).
Equation 16
2) 𝑾𝒂𝒕𝒆𝒓 𝒆𝒗𝒂𝒑𝒐𝒓𝒂𝒕𝒊𝒐𝒏 𝒓𝒂𝒕𝒆 [%] = !"#$!!(!)!!"#$!!!"#$%!"#$!!!"!#!$%!!"#$!!!"#$%
∙ 100
The water evaporation rate is the ratio between the weight of water lost
through every step and the weight of the total amount of water present in the
sample (in %).
Equation 17
3) 𝑺𝒐𝒍𝒊𝒅 𝒄𝒐𝒏𝒕𝒆𝒏𝒕 [%] = !"#$!! (!)!"#$!!!"#$%
∙ 100
The solid content (or % Dry Matter) is the exact opposite of the Drying ratio
and its curve is specular to it. It indicates the decrease in % of the solid con-‐
tent inside the sludge sample per every step of the process.
Equation 18
4) 𝑫𝒓𝒚𝒊𝒏𝒈 𝒗𝒆𝒍𝒐𝒄𝒊𝒕𝒚 [!!] = !!
!!= !"#$!! ! !!"#$!! (!!!)
!(!)
44
The drying velocity describes the drying differential through time. It is than
an indication of the velocity of the drying process, in terms of tiered weight
loss (g/h).
For each one of the previous equations, a curve graph has been drawn and in
Chapter 4 (see Paragraph 4.2.2) each one is discussed (for the second test in the
oven).
3.3 Determination of solid and ashes content in the sewage sludge
The three types of sludge have also been characterised relative to their solid
content. The standard procedure is as follows:
• a small amount of each type of sludge is put in a melting pot (weight
known) and after weighing, it is heated up in an oven at around 105°C for
48 hours, in order to evaporate the non-‐solid portion and determine the
Total Solid (TS) content. After that, the melting pot with the solid portion
of the sludge is weighed and the solid ratio can be calculated: Equation 19
𝑇𝑆 % = 𝑊𝑒𝑖𝑔ℎ𝑡2− 𝑇𝑎𝑟𝑒2𝑊𝑒𝑖𝑔ℎ𝑡1− 𝑇𝑎𝑟𝑒1×100
where:
TS (%) = percentage of total solid
Weight1 = initial weight of the melting pot with the sludge [g]
Weight2 = weight of the melting pot with the sludge after 48 hours
[g]
Tare1 = weight of the empty melting pot [g]
Tare2 = weight of the empty melting pot [g]
• After this process it is also possible to determine the Total Volatile Sol-‐
ids (TVS), putting the melting pots in a mitten at 600°C for 24 hours. The
resulting ashes are weighed and the TVS ratio can be determined as fol-‐
lows:
45
Equation 20
𝑇𝑉𝑆 % = 𝑊𝑒𝑖𝑔ℎ𝑡2− 𝑇𝑎𝑟𝑒2 − 𝑊𝑒𝑖𝑔ℎ𝑡3− 𝑇𝑎𝑟𝑒3
(𝑊𝑒𝑖𝑔ℎ𝑡1− 𝑇𝑎𝑟𝑒1) × 100
where:
Weight3 = weight of the melting pot with the ashes after 24 hours
[g]
Tare3 = weight of the empty melting pot [g]
3.4 COD determination with titration The COD (Chemical Oxygen Demand) is the chemical demand to oxidise the
total organic matter present in the sample and so it indirectly measures the
amount of organic compounds present. The analysis has been done in order to
have a comparison of the COD value before and after the drying process, in order
to see if there is a change. It is generally expressed in milligrams per litre (mg/L),
which indicates the mass of oxygen consumed per litre of solution.
Different from BOD (Biological Oxygen Demand), the COD parameter considers
also recalcitrant compounds that cannot be oxidised by microorganisms.
The COD is determined through titration, which is a common analytical method
of quantitative chemical analysis: through this method the unknown concentra-‐
tion of a solution (called analyte) can be determined. In general, a reagent, called
the titrant or titrator, is prepared as a standard solution. The latter (known con-‐
centration and volume) then reacts with a solution of analyte, in order to deter-‐
mine the concentration. The volume of titrant that reacted is called titre.
The method for COD, in particular, consists in oxidising the organic matter using
a strong oxidiser, a Potassium Dichromate (K2Cr2O7) solution at high tempera-‐
tures in an acidic environment (which is created through the addition of Sulfuric
Acid (H2SO4)).
Since the dichromate reacts after a long time and at high temperatures, it cannot
be directly titrated: for this reason the dichromate is added in excess and then
heated up in a microwave oven; it is then necessary to perform a Back Titration,
46
where the remaining dichromate is titrated with a Ferrous Ammonium Sul-‐
phate (FeSO4(NH4)2SO4*6H2O – FAS or Mohr’s Salt) solution.
All the substances that can be oxidised with this method (reduced iron, urea,
chlorides) are considered an interference, because they are not organic com-‐
pounds; to avoid the interference of chlorides, a mercury salt is added, Mercury
Sulphate (HgSO4), which forms mercury chloride (HgCl2), which cannot be at-‐
tacked by dichromate (this process is called complexation). Moreover, dichro-‐
mate is not able to oxidise some organic compounds and so a catalyst, Silver
Sulphate (AgSO4), is added to achieve the complete oxidation of the organic mat-‐
ter
Reactions involved:
• Oxidation of organic matter: Cr2O7 + Org. Mat. + H+ à CO2 + Cr3+ + H2O
• Back titration: Cr2O72-‐ + 6Fe2+ + 14 H+ à 2Cr3+ + 6Fe3+ + H20
3.4.1. COD determination with digestion in microwaves oven (Milestone)
The procedure for the COD determination for solid sample is as follow:
in a glass bottle put 0.02 g of dry sludge samples (dried in a 105°C oven for 24-‐48
hours) and weigh it with the analytical balance (to four decimal places). Add 10
ml of distilled water, a small amount of AgSO4 and HgSO4 and then add 15 ml of
dichromate 0.25 N. Afterwards, add 15 ml of H2SO4 concentrated to 96%.
Besides the sample, a blank solution and a “titre” must be prepared. The blank
solution includes all the substances placed into the sample, besides the sample
itself. The “titre” is like the blank solution but without the catalysts, AgSO4 and
HgSO4. The blank solution is necessary to verify if there is contamination in the
catalysts and in the reagents and eventually consider it in the final calculation.
The sample and the blank solution are then put in the microwave oven for diges-‐
tion (56 minutes). After that, the titration can be made: some drops of indicator
must be added, Ferroin, which turn blue in an oxidising environment and dark
red in a reducing environment.
47
The titration with FAS has to be done for the sample, the blank solution and the
“titre”. The FAS must be at the same concentration as the dichromate solution.
The colour of the solution at the endpoint turns from green/light blue to red-‐
brown/orange, depending on the normality (N).
The COD of the sample is then equal to: Equation 21
𝐶𝑂𝐷 𝑚𝑔𝑂2𝑔𝑇𝑆 =
𝐵 − 𝑆 ∗ 𝑉 ∗ 𝑁𝑇 ∗ 8𝑤
where:
B = volume of FAS titrated in the blank solution [mL]
S = volume of FAS titrated in the sample [mL]
V = total volume of initial dichromate [mL]
N = normality of dichromate [N]
T = volume of FAS titrated in the “titre” [mL]
8 = factor that considers the milliequivalent weight of oxygen
w = weight of the sample (to four decimal places) [g]
3.5 Materials During the experimental phase, the following materials have been used:
1) Solar still prototype (Prototype 1) (see Paragraph 2.1).
2) Food-‐drying prototype (Prototype 2) (see Paragraph 2.2).
3) Solar panels 22.4 Volts (54.5 cm x 53 cm).
4) Laboratory oven
5) Balance KERN PCB-‐6000-‐1 with the precision d = 0.1 g and maximum
weight = 6000 g.
6) Various containers for the sludge, in polystyrene and in aluminium.
7) Use of the chemistry lab at the WWTP in Treviso (Italy) for TS/TVS and
COD determination.
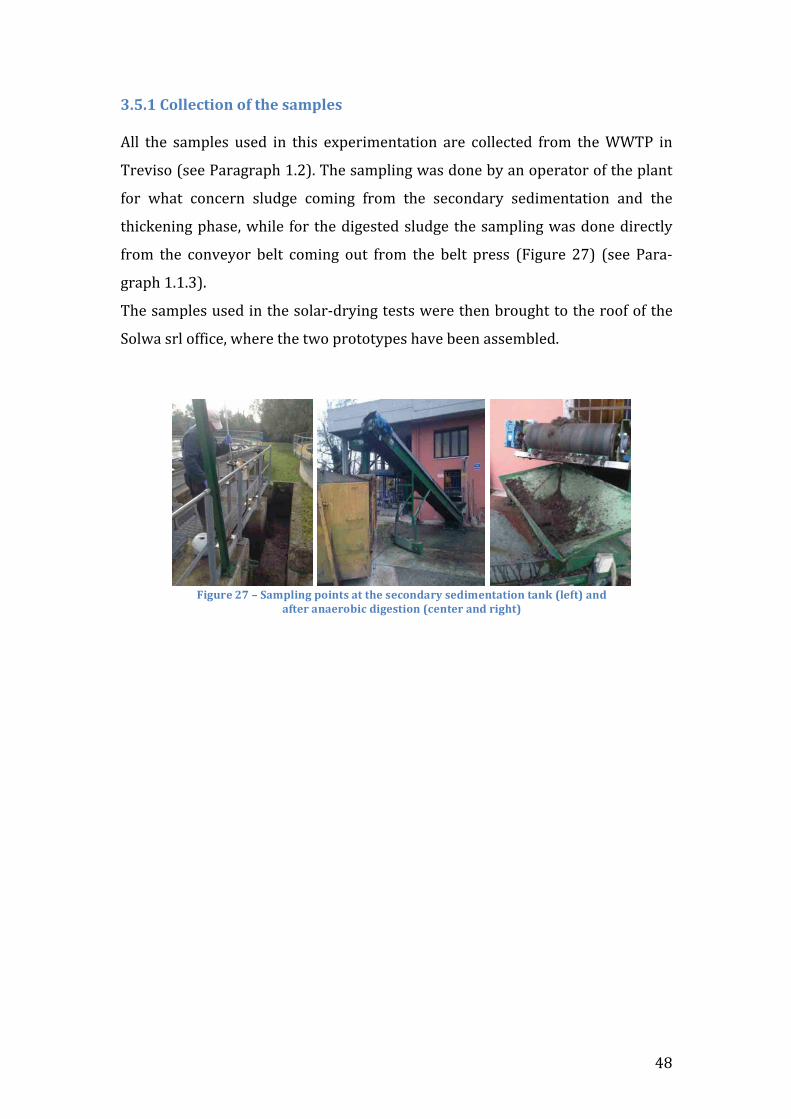
! MJ!
?RKR>*H%11")+-%(*%$*+2"*,'&71",*!Q++! %B&! .(3@+&.! =.&0! )$! %B).! &e@&')3&$%(%)*$! ('&! 6*++&6%&0! D'*3! %B&! FFR2! )$!
R'&<).*!9.&&!2('(1'(@B!"CP:C!RB&!.(3@+)$1!H(.!0*$&!>8!($!*@&'(%*'!*D!%B&!@+($%!
D*'! HB(%! 6*$6&'$! .+=01&! 6*3)$1! D'*3! %B&! .&6*$0('8! .&0)3&$%(%)*$! ($0! %B&!
%B)6_&$)$1!@B(.&a!HB)+&! D*'! %B&!0)1&.%&0!.+=01&!%B&!.(3@+)$1!H(.!0*$&!0)'&6%+8!
D'*3! %B&! 6*$<&8*'! >&+%! 6*3)$1! *=%! D'*3! %B&! >&+%! @'&..! 9A)1='&! PO:! 9.&&! 2('(\
1'(@B!"C"CK:C!
RB&!.(3@+&.!=.&0!)$!%B&!.*+('\0'8)$1!%&.%.!H&'&!%B&$!>'*=1B%!%*!%B&!'**D!*D!%B&!
5*+H(!.'+!*DD)6&a!HB&'&!%B&!%H*!@'*%*%8@&.!B(<&!>&&$!(..&3>+&0C!
! *
! ! !G-.5#"*<U*M*6'&71-(.*7%-(+,*'+*+2"*,")%(0'#4*,"0-&"(+'+-%(*+'(`*W1"$+X*'(0*
'$+"#*'('"#%/-)*0-.",+-%(*W)"(+"#*'(0*#-.2+X*
49
Chapter 4 – Results In the whole Results section, the three types of sludge will be referred to as “A”
for sludge after the secondary sedimentation, “B” for sludge after the thickening
phase and “C” for the digestate after anaerobic digestion and mechanical de-‐
watering (see Chapter 3). The two solar dryer will be referred as Prototype 1
(P1) for the solar still and Prototype 2 (P2) for the food drier.
4.1 Solar drying The drying tests with solar energy were done inside Prototype 1 and 2 during a
period of around 3 weeks from 14th October to 3rd November. During the weeks
before, the prototypes were assembled and prepared for the testing phase and
all the temperature and humidity sensors were connected to an electrical box,
associated in real time with a personal computer. All this instrumentation was
arranged on the roof of the Solwa srl office (Vega Scientific Park, Via delle Indus-‐
trie n.15, Marghera, Venice).
The detected parameter were:
-‐ Temperature (°C) inside and outside the prototypes
-‐ Relative Humidity (RH%) inside and outside the prototypes
-‐ Solar radiation (W/m2)
-‐ Weight (g) of the samples, measured hourly with a balance (precision
0.1 g – see Paragraph 3.5)
-‐ T and RH were also detected in three positions of one of the solar col-‐
lector of P2 (at the entrance of the air, in the middle of the panel and
at the exit of the heated air).
For every week of testing, various graphs were drawn:
-‐ Drying curves of the samples (through the weight measures);
-‐ Curves of the Temperature, detected inside and outside the two pro-‐
totypes, put also in relation with the Solar Radiation;
-‐ Curves of the Relative Humidity, detected inside and outside the
two prototypes.
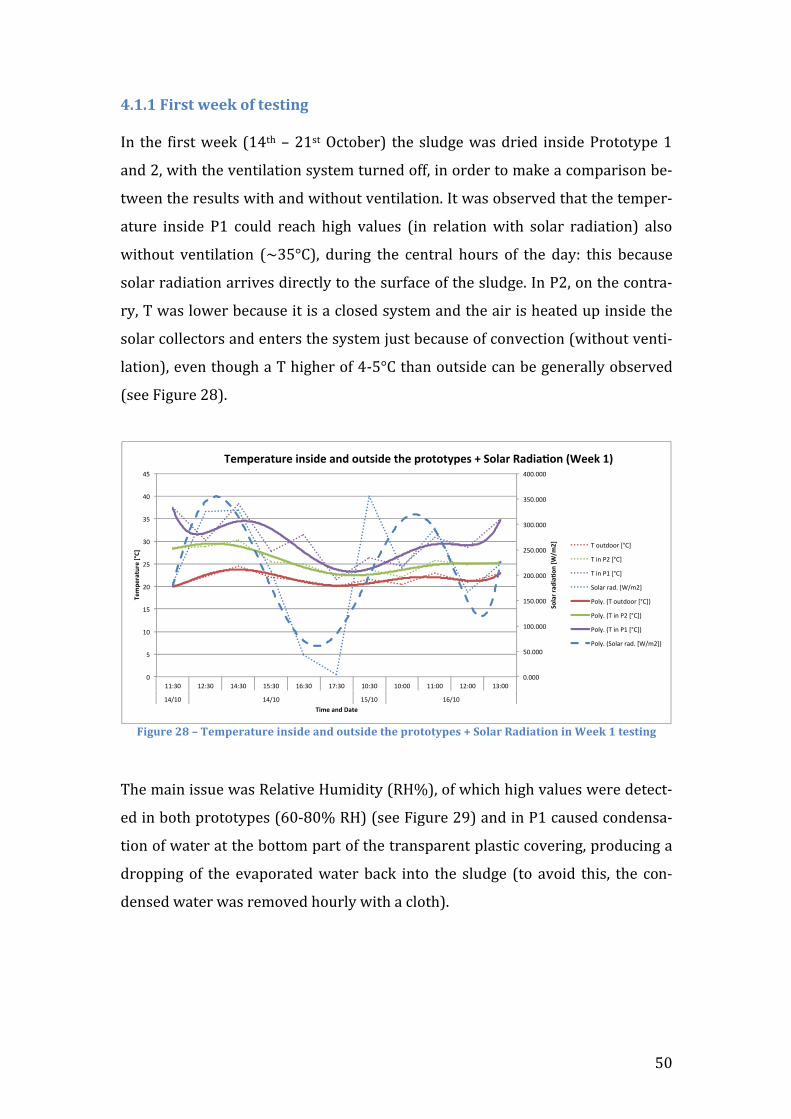
! ZL!
AR>R>*G-#,+*\""`*%$*+",+-(.*!#$! %B&! D)'.%!H&&_! 9"M%B!4!P".%!W6%*>&':! %B&! .+=01&!H(.!0')&0! )$.)0&!2'*%*%8@&!"!
($0!Pa!H)%B!%B&!<&$%)+(%)*$!.8.%&3!%='$&0!*DDa!)$!*'0&'!%*!3(_&!(!6*3@(').*$!>&\
%H&&$!%B&!'&.=+%.!H)%B!($0!H)%B*=%!<&$%)+(%)*$C!#%!H(.!*>.&'<&0!%B(%!%B&!%&3@&'\
(%='&! )$.)0&! 2"! 6*=+0! '&(6B! B)1B! <(+=&.! 9)$! '&+(%)*$! H)%B! .*+('! '(0)(%)*$:! (+.*!
H)%B*=%! <&$%)+(%)*$! 9!KZp7:a! 0=')$1! %B&! 6&$%'(+! B*='.! *D! %B&! 0(8c! %B).! >&6(=.&!
.*+('!'(0)(%)*$!('')<&.!0)'&6%+8!%*!%B&!.='D(6&!*D!%B&!.+=01&C!#$!2Pa!*$!%B&!6*$%'(\
'8a!R!H(.!+*H&'!>&6(=.&!)%!).!(!6+*.&0!.8.%&3!($0!%B&!()'!).!B&(%&0!=@!)$.)0&!%B&!
.*+('!6*++&6%*'.!($0!&$%&'.!%B&!.8.%&3!`=.%!>&6(=.&!*D!6*$<&6%)*$!9H)%B*=%!<&$%)\
+(%)*$:a!&<&$!%B*=1B!(!R!B)1B&'!*D!M\Zp7!%B($!*=%.)0&!6($!>&!1&$&'(++8!*>.&'<&0!
9.&&!A)1='&!PJ:C!!
!
!G-.5#"*<Z*M*B"&7"#'+5#"*-(,-0"*'(0*%5+,-0"*+2"*7#%+%+47",*_*6%1'#*J'0-'+-%(*-(*S""`*>*+",+-(.*
!
RB&!3()$!)..=&!H(.!S&+(%)<&!U=3)0)%8!9SUd:a!*D!HB)6B!B)1B!<(+=&.!H&'&!0&%&6%\
&0!)$!>*%B!@'*%*%8@&.!9YL\JLd!SU:!9.&&!A)1='&!PN:!($0!)$!2"!6(=.&0!6*$0&$.(\
%)*$!*D!H(%&'!(%!%B&!>*%%*3!@('%!*D!%B&!%'($.@('&$%!@+(.%)6!6*<&')$1a!@'*0=6)$1!(!
0'*@@)$1!*D! %B&! &<(@*'(%&0!H(%&'!>(6_! )$%*! %B&! .+=01&! 9%*! (<*)0! %B).a! %B&! 6*$\
0&$.&0!H(%&'!H(.!'&3*<&0!B*='+8!H)%B!(!6+*%B:C!
!"!!!#
$!"!!!#
%!!"!!!#
%$!"!!!#
&!!"!!!#
&$!"!!!#
'!!"!!!#
'$!"!!!#
(!!"!!!#
!#
$#
%!#
%$#
&!#
&$#
'!#
'$#
(!#
($#
%%)'!# %&)'!# %()'!# %$)'!# %*)'!# %+)'!# %!)'!# %!)!!# %%)!!# %&)!!# %')!!#
%(,%!# %(,%!# %$,%!# %*,%!#
!"#$
%&%$'
($)"
*&+,
-./0
&
12.
32%$
45%2
&+670
&
1(.2&$*'&8$42&
&12.32%$45%2&(*9('2&$*'&"549('2&4:2&3%"4"4;329&<&!"#$%&=$'($)"*&>,22?&@A&
-#./01..2#3456#
-#78#9඀#
-#78#9%#3456#
:.;<2#2<1"#3=,>&6#
9.;?"#@-#./01..2#3456A#
9.;?"#@-#78#9඀A#
9.;?"#@-#78#9%#3456A#
9.;?"#@:.;<2#2<1"#3=,>&6A#
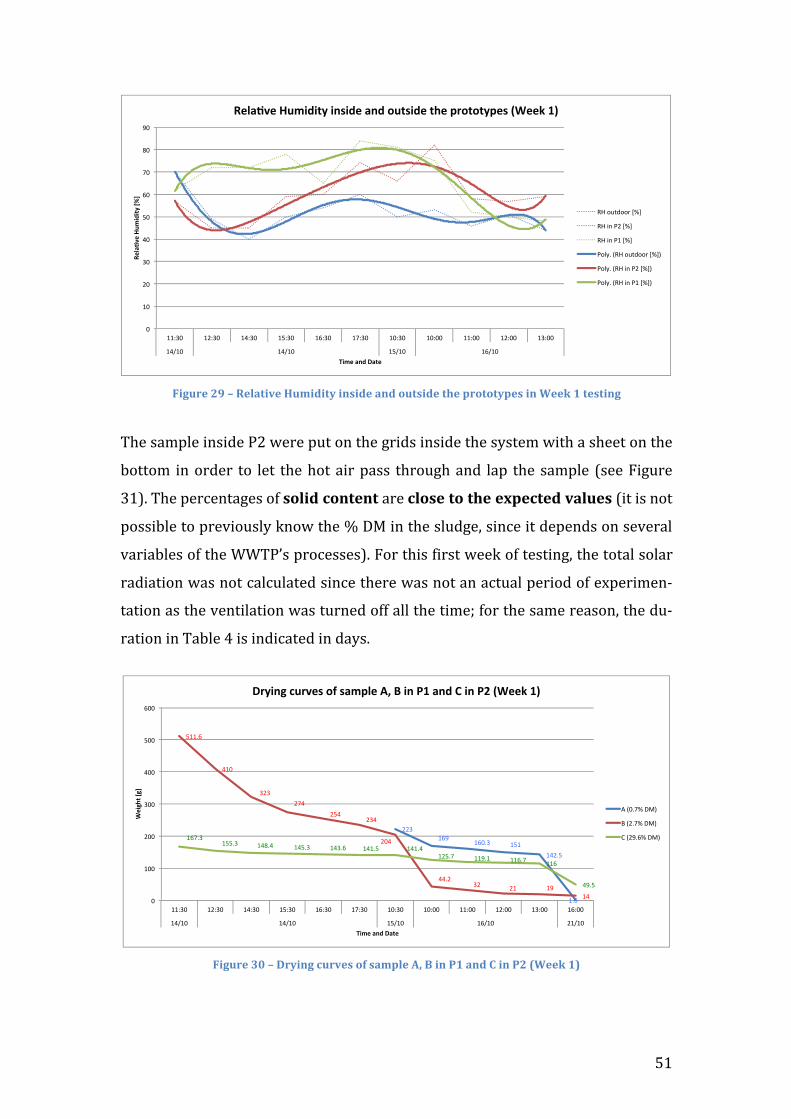
! Z"!
!G-.5#"*<Y*M*J"1'+-8"*L5&-0-+4*-(,-0"*'(0*%5+,-0"*+2"*7#%+%+47",*-(*S""`*>*+",+-(.*
!RB&!.(3@+&!)$.)0&!2P!H&'&!@=%!*$!%B&!1')0.!)$.)0&!%B&!.8.%&3!H)%B!(!.B&&%!*$!%B&!
>*%%*3! )$!*'0&'! %*! +&%! %B&!B*%!()'!@(..! %B'*=1B!($0! +(@! %B&!.(3@+&! 9.&&!A)1='&!
K":C!RB&!@&'6&$%(1&.!*D!,%1-0*)%(+"(+!('&!)1%,"*+%*+2"*"b7")+"0*8'15",!9)%!).!$*%!
@*..)>+&!%*!@'&<)*=.+8!_$*H!%B&!d!?-!)$!%B&!.+=01&a!.)$6&!)%!0&@&$0.!*$!.&<&'(+!
<(')(>+&.!*D!%B&!FFR2/.!@'*6&..&.:C!A*'!%B).!D)'.%!H&&_!*D!%&.%)$1a!%B&!%*%(+!.*+('!
'(0)(%)*$!H(.!$*%!6(+6=+(%&0!.)$6&!%B&'&!H(.!$*%!($!(6%=(+!@&')*0!*D!&e@&')3&$\
%(%)*$!(.!%B&!<&$%)+(%)*$!H(.!%='$&0!*DD!(++!%B&!%)3&i!D*'!%B&!.(3&!'&(.*$a!%B&!0=\
'(%)*$!)$!R(>+&!M!).!)$0)6(%&0!)$!0(8.C!
!
!G-.5#"*?=*M*O#4-(.*)5#8",*%$*,'&71"*9e*C*-(*!>*'(0*H*-(*!<*WS""`*>X*
!
!"
#!"
$!"
%!"
&!"
'!"
(!"
)!"
*!"
+!"
##,%!" #$,%!" #&,%!" #',%!" #(,%!" #),%!" #!,%!" #!,!!" ##,!!" #$,!!" #%,!!"
#&-#!" #&-#!" #'-#!" #(-#!"
!"#$
%&"'
()*
+,+-.
'/01'
2+*"'$3,'4$-"'
!"#$%&"'()*+,+-.'+35+,"'$3,'6)-5+,"'-7"'896-6-.8"5':;""<'=>'
./"0123004"567"
./"89":$"567"
./"89":#"567"
:0;<=">./"0123004"567?"
:0;<=">./"89":$"567?"
:0;<=">./"89":#"567?"
!!"#$%&#
$%'("# $)$#$*!()#
$(%#
)$$(%#
*$'#
"!"#!+*#
!)*#!"*#
!'*#
**(!#"!# !$# $&#
$*#
$%+("#$))("# $*,(*# $*)("# $*"(%# $*$()# $*$(*#
$!)(+# $$&($# $$%(+# $$%#
*&()#
'#
$''#
!''#
"''#
*''#
)''#
%''#
$$-"'# $!-"'# $*-"'# $)-"'# $%-"'# $+-"'# $'-"'# $'-''# $$-''# $!-''# $"-''# $%-''#
$*.$'# $*.$'# $).$'# $%.$'# !$.$'#
!"#
$%&'(
$)'
*#+"',-.'/,&"'
/01#-$'2304"5'67'5,+89"':;'<'#-'=>',-.'?'#-'=@'A!""B'>C'
/#0'(+1#234#
5#0!(+1#234#
6#0!&(%1#234#
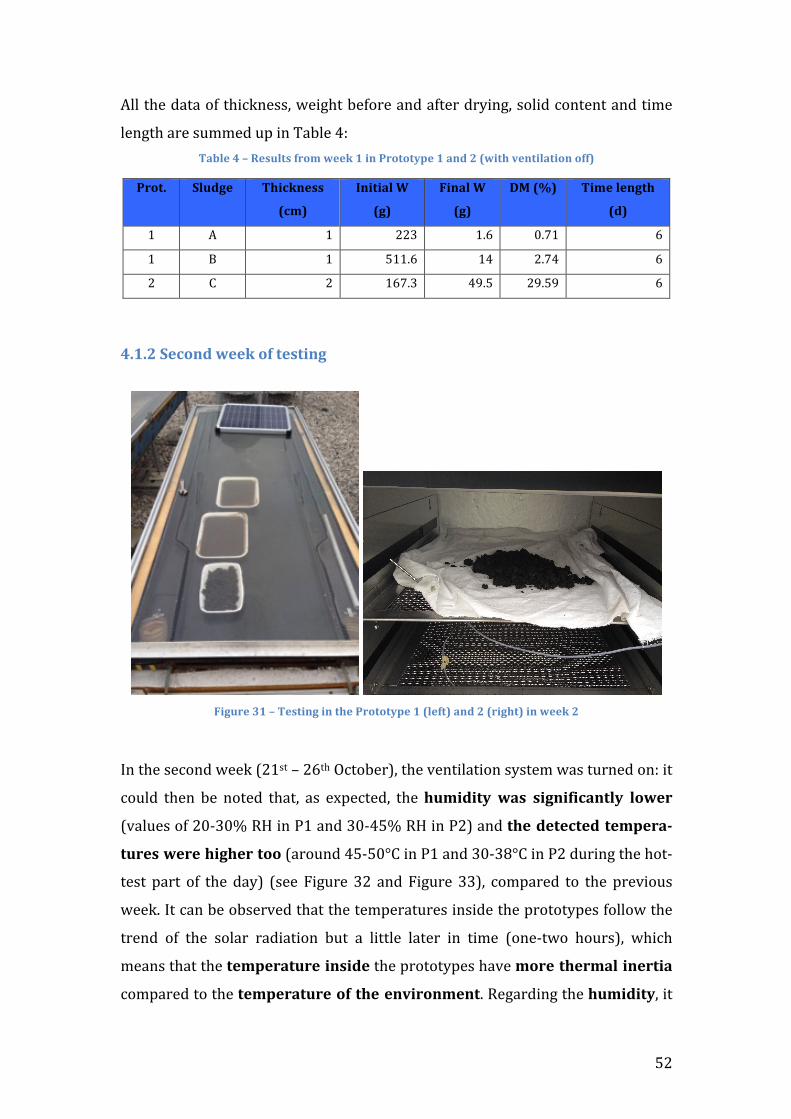
52
All the data of thickness, weight before and after drying, solid content and time
length are summed up in Table 4: Table 4 – Results from week 1 in Prototype 1 and 2 (with ventilation off)
Prot. Sludge Thickness
(cm)
Initial W
(g)
Final W
(g)
DM (%) Time length
(d)
1 A 1 223 1.6 0.71 6
1 B 1 511.6 14 2.74 6
2 C 2 167.3 49.5 29.59 6
4.1.2 Second week of testing
Figure 31 – Testing in the Prototype 1 (left) and 2 (right) in week 2
In the second week (21st – 26th October), the ventilation system was turned on: it
could then be noted that, as expected, the humidity was significantly lower
(values of 20-‐30% RH in P1 and 30-‐45% RH in P2) and the detected tempera-‐
tures were higher too (around 45-‐50°C in P1 and 30-‐38°C in P2 during the hot-‐
test part of the day) (see Figure 32 and Figure 33), compared to the previous
week. It can be observed that the temperatures inside the prototypes follow the
trend of the solar radiation but a little later in time (one-‐two hours), which
means that the temperature inside the prototypes have more thermal inertia
compared to the temperature of the environment. Regarding the humidity, it
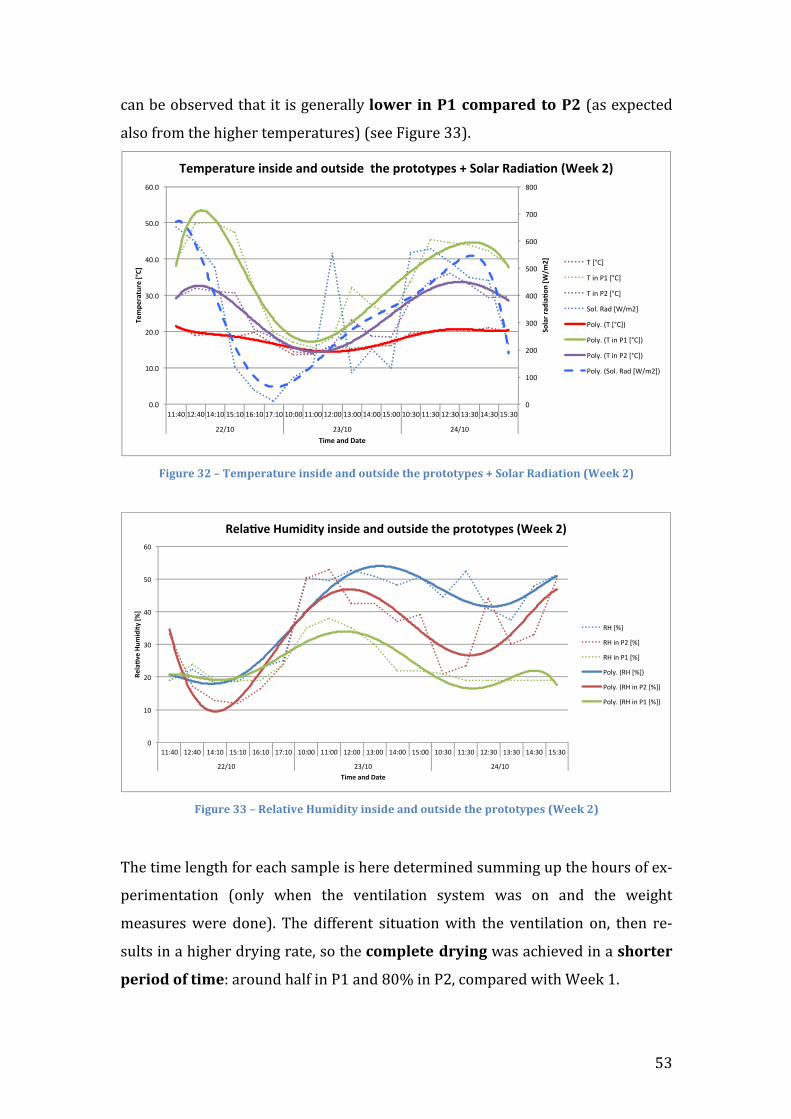
! ZK!
6($!>&!*>.&'<&0!%B(%!)%!).!1&$&'(++8!1%\"#* -(*!>*)%&7'#"0* +%*!<!9(.!&e@&6%&0!
(+.*!D'*3!%B&!B)1B&'!%&3@&'(%='&.:!9.&&!A)1='&!KK:C!
!G-.5#"*?<*M*B"&7"#'+5#"*-(,-0"*'(0*%5+,-0"*+2"*7#%+%+47",*_*6%1'#*J'0-'+-%(*WS""`*<X*
*
!G-.5#"*??*M*J"1'+-8"*L5&-0-+4*-(,-0"*'(0*%5+,-0"*+2"*7#%+%+47",*WS""`*<X*
!
RB&!%)3&!+&$1%B!D*'!&(6B!.(3@+&!).!B&'&!0&%&'3)$&0!.=33)$1!=@!%B&!B*='.!*D!&e\
@&')3&$%(%)*$! 9*$+8! HB&$! %B&! <&$%)+(%)*$! .8.%&3! H(.! *$! ($0! %B&! H&)1B%!
3&(.='&.!H&'&! 0*$&:C! RB&! 0)DD&'&$%! .)%=(%)*$!H)%B! %B&! <&$%)+(%)*$! *$a! %B&$! '&\
.=+%.!)$!(!B)1B&'!0'8)$1!'(%&a!.*!%B&!)%&71"+"*0#4-(.!H(.!(6B)&<&0!)$!(!,2%#+"#*
7"#-%0*%$*+-&"c!('*=$0!B(+D!)$!2"!($0!JLd!)$!2Pa!6*3@('&0!H)%B!F&&_!"C!!
!
!"
#!!"
$!!"
%!!"
&!!"
'!!"
(!!"
)!!"
*!!"
!+!"
#!+!"
$!+!"
%!+!"
&!+!"
'!+!"
(!+!"
##,&!"#$,&!"#&,#!"#',#!"#(,#!"#),#!"#!,!!"##,!!"#$,!!"#%,!!"#&,!!"#',!!"#!,%!"##,%!"#$,%!"#%,%!"#&,%!"#',%!"
$$-#!" $%-#!" $&-#!"
!"#$
%&%$'
($)"
*&+,
-./0
&
12.
32%$
45%2
&+670
&
1(.2&$*'&8$42&
12.32%$45%2&(*9('2&$*'&"549('2&&4:2&3%"4"4;329&<&!"#$%&=$'($)"*&>,22?&/@&
."/012"
."34"5#"/012"
."34"5$"/012"
678+"9:;"/<-=$2"
578>+"?."/012@"
578>+"?."34"5#"/012@"
578>+"?."34"5$"/012@"
578>+"?678+"9:;"/<-=$2@"
!"
#!"
$!"
%!"
&!"
'!"
(!"
##)&!" #$)&!" #&)#!" #')#!" #()#!" #*)#!" #!)!!" ##)!!" #$)!!" #%)!!" #&)!!" #')!!" #!)%!" ##)%!" #$)%!" #%)%!" #&)%!" #')%!"
$$+#!" $%+#!" $&+#!"
!"#$
%&"'
()*
+,+-.
'/01'
2+*"'$3,'4$-"'
!"#$%&"'()*+,+-.'+35+,"'$3,'6)-5+,"'-7"'896-6-.8"5':;""<'=>'
,-"./0"
,-"12"3$"./0"
,-"12"3#"./0"
34567"8,-"./09"
34567"8,-"12"3$"./09"
34567"8,-"12"3#"./09"
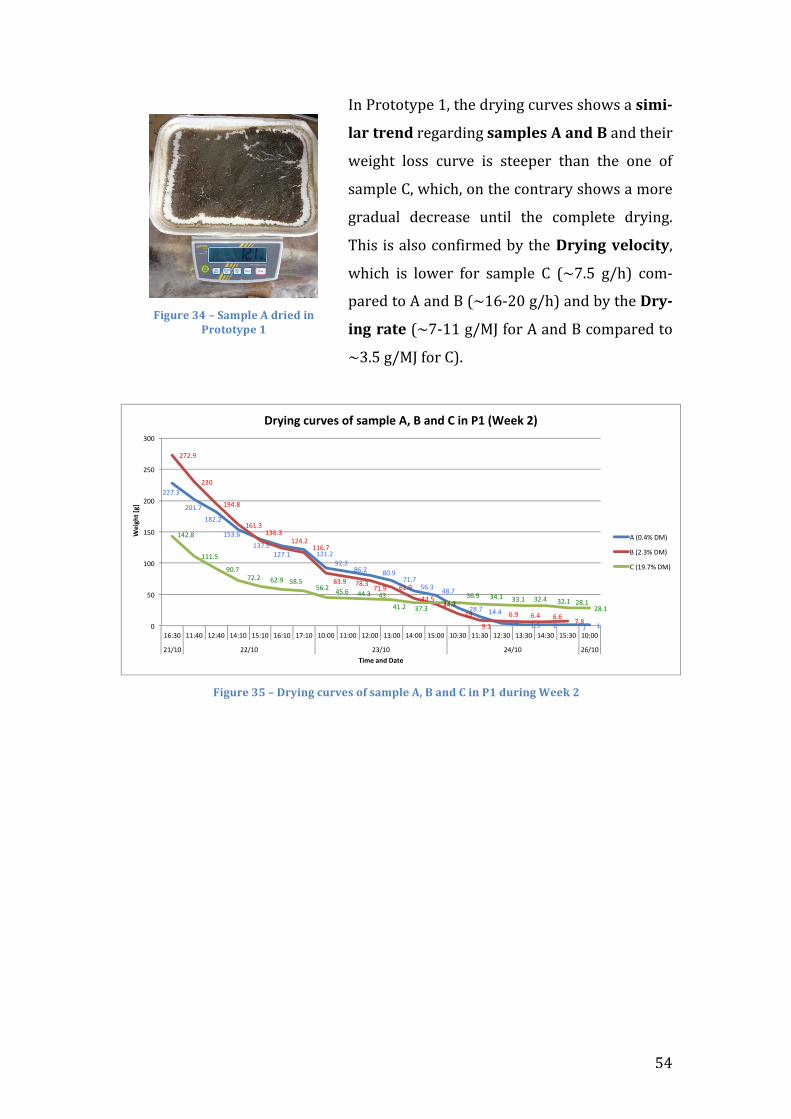
! ZM!
#$!2'*%*%8@&!"a!%B&!0'8)$1!6='<&.!.B*H.!(!,-&-3
1'#*+#"(0!'&1('0)$1!,'&71",*9*'(0*C!($0!%B&)'!
H&)1B%! +*..! 6='<&! ).! .%&&@&'! %B($! %B&! *$&! *D!
.(3@+&!7a!HB)6Ba!*$!%B&!6*$%'('8!.B*H.!(!3*'&!
1'(0=(+! 0&6'&(.&! =$%)+! %B&! 6*3@+&%&! 0'8)$1C!
RB).! ).!(+.*!6*$D)'3&0!>8!%B&*O#4-(.*8"1%)-+4a!
HB)6B! ).! +*H&'! D*'! .(3@+&! 7! 9!OCZ! 1kB:! 6*3\
@('&0!%*!Q!($0!]!9!"Y\PL!1kB:!($0!>8!%B&!O#43
-(.*#'+"!9!O\""!1k-,!D*'!Q!($0!]!6*3@('&0!%*!
!!!!!1k-,!D*'!7:C!
!
!G-.5#"*?K*M*O#4-(.*)5#8",*%$*,'&71"*9e*C*'(0*H*-(*!>*05#-(.*S""`*<*
! !
!!"#$%
!&'#"%'(!#!%
')$#*%'$"#+%
'!"#'% '!'#!%+!#!%
(*#!% (&#+%"'#"%
)*#$% ,(#"%
!(#"% ',#,%
,#,% '#$% '% '% '%
!"!#+%
!$&%
'+,#(%
'*'#$%'$*#$%
'!,#!%''*#"%
($#+% "(#$%"'#+% *'#+%
,$#)%$,#"%
'+%
+#'%
*#+% *#,% *#*%"#(%
',!#(%
'''#)%
+&#"%"!#!% *!#+% )(#)%
)*#!% ,)#*% ,,#$% ,$%,'#!% $"#$%
$"#'%$*#+% $,#'% $$#'% $!#,% $!#'% !(#'%
!(#'%
&%
)&%
'&&%
')&%
!&&%
!)&%
$&&%
'*-$&% ''-,&% '!-,&% ',-'&% ')-'&% '*-'&% '"-'&% '&-&&% ''-&&% '!-&&% '$-&&% ',-&&% ')-&&% '&-$&% ''-$&% '!-$&% '$-$&% ',-$&% ')-$&% '&-&&%
!'.'&% !!.'&% !$.'&% !,.'&% !*.'&%
!"#
$%&'(
$)'
*#+"',-.'/,&"'
/01#-$'2304"5'67'5,+89"':;'<',-.'='#-'>?'@!""A'BC'
/%0&#,1%234%
5%0!#$1%234%
6%0'+#"1%234%
!G-.5#"*?A*M*6'&71"*9*0#-"0*-(*
!#%+%+47"*>*
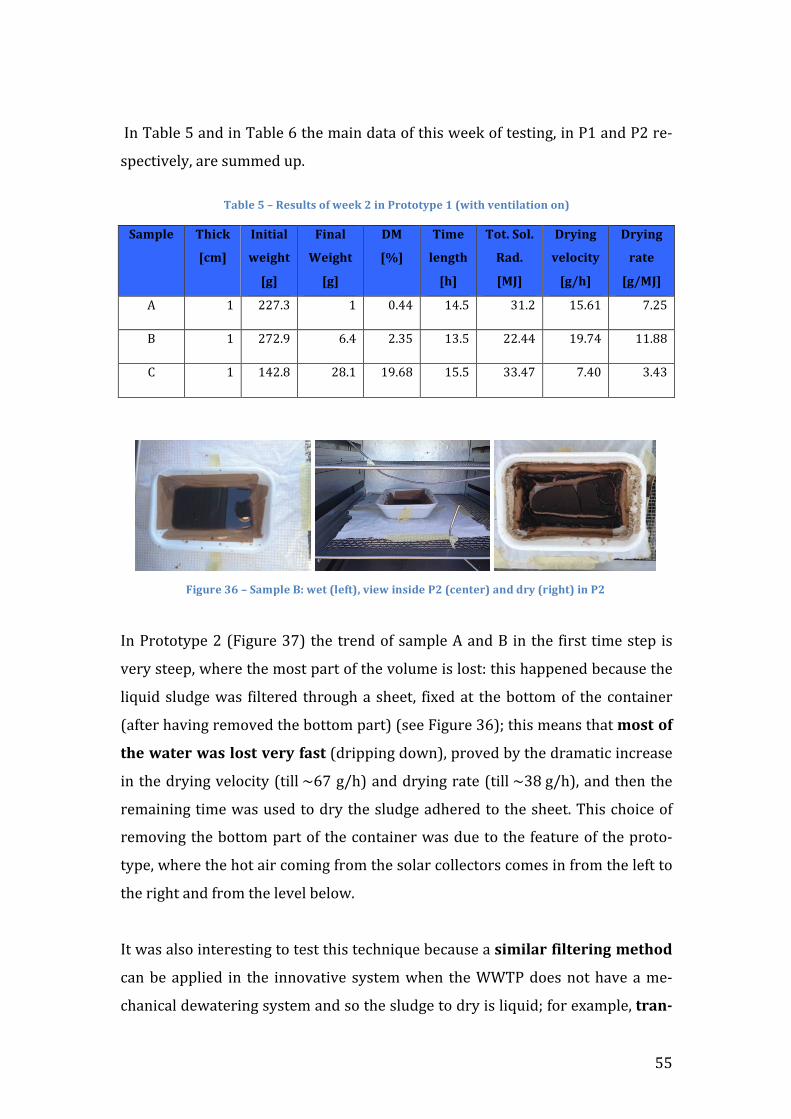
! ZZ!
!
!#$!R(>+&!Z!($0!)$!R(>+&!Y!%B&!3()$!0(%(!*D!%B).!H&&_!*D!%&.%)$1a!)$!2"!($0!2P!'&\
.@&6%)<&+8a!('&!.=33&0!=@C!
!B'/1"*K*M*J",51+,*%$*\""`*<*-(*!#%+%+47"*>*W\-+2*8"(+-1'+-%(*%(X*
6'&71"* B2-)`*
g)&h*
N(-+-'1*
\"-.2+*
g.h*
G-('1*
S"-.2+*
g.h*
OT*
g]h*
B-&"*
1"(.+2*
g2h*
B%+R*6%1R*
J'0R*
gTkh*
O#4-(.*
8"1%)-+4*
g.@2h*
O#4-(.*
#'+"*
g.@Tkh*
Q! "! PPOCK! "! LCMM! "MCZ! K"CP! "ZCY"! OCPZ!
]! "! POPCN! YCM! PCKZ! "KCZ! PPCMM! "NCOM! ""CJJ!
7! "! "MPCJ! PJC"! "NCYJ! "ZCZ! KKCMO! OCML! KCMK!
!
!
#$!2'*%*%8@&!P!9A)1='&!KO:!%B&!%'&$0!*D!.(3@+&!Q!($0!]!)$!%B&!D)'.%! %)3&!.%&@!).!
<&'8!.%&&@a!HB&'&!%B&!3*.%!@('%!*D!%B&!<*+=3&!).!+*.%c!%B).!B(@@&$&0!>&6(=.&!%B&!
+)b=)0!.+=01&!H(.! D)+%&'&0! %B'*=1B!(!.B&&%a! D)e&0!(%! %B&!>*%%*3!*D! %B&!6*$%()$&'!
9(D%&'!B(<)$1!'&3*<&0!%B&!>*%%*3!@('%:!9.&&!A)1='&!KY:i!%B).!3&($.!%B(%!&%,+*%$*
+2"*\'+"#*\',*1%,+*8"#4*$',+!90')@@)$1!0*H$:a!@'*<&0!>8!%B&!0'(3(%)6!)$6'&(.&!
)$!%B&!0'8)$1!<&+*6)%8!9%)++!!YO!1kB:!($0!0'8)$1!'(%&!9%)++!!!"!1kB:a!($0!%B&$!%B&!
'&3()$)$1!%)3&!H(.!=.&0!%*!0'8!%B&!.+=01&!(0B&'&0!%*!%B&!.B&&%C!RB).!6B*)6&!*D!
'&3*<)$1!%B&!>*%%*3!@('%!*D!%B&!6*$%()$&'!H(.!0=&!%*!%B&!D&(%='&!*D!%B&!@'*%*\
%8@&a!HB&'&!%B&!B*%!()'!6*3)$1!D'*3!%B&!.*+('!6*++&6%*'.!6*3&.!)$!D'*3!%B&!+&D%!%*!
%B&!')1B%!($0!D'*3!%B&!+&<&+!>&+*HC!
!
#%!H(.!(+.*!)$%&'&.%)$1!%*!%&.%!%B).!%&6B$)b=&!>&6(=.&!(!,-&-1'#*$-1+"#-(.*&"+2%0!
6($!>&!(@@+)&0! )$! %B&! )$$*<(%)<&! .8.%&3!HB&$! %B&!FFR2!0*&.!$*%!B(<&!(!3&\
6B($)6(+!0&H(%&')$1!.8.%&3!($0!.*!%B&!.+=01&!%*!0'8!).!+)b=)0i!D*'!&e(3@+&a!+#'(3
! ! !G-.5#"*?Q*M*6'&71"*Ca*\"+*W1"$+Xe*8-"\*-(,-0"*!<*W)"(+"#X*'(0*0#4*W#-.2+X*-(*!<*
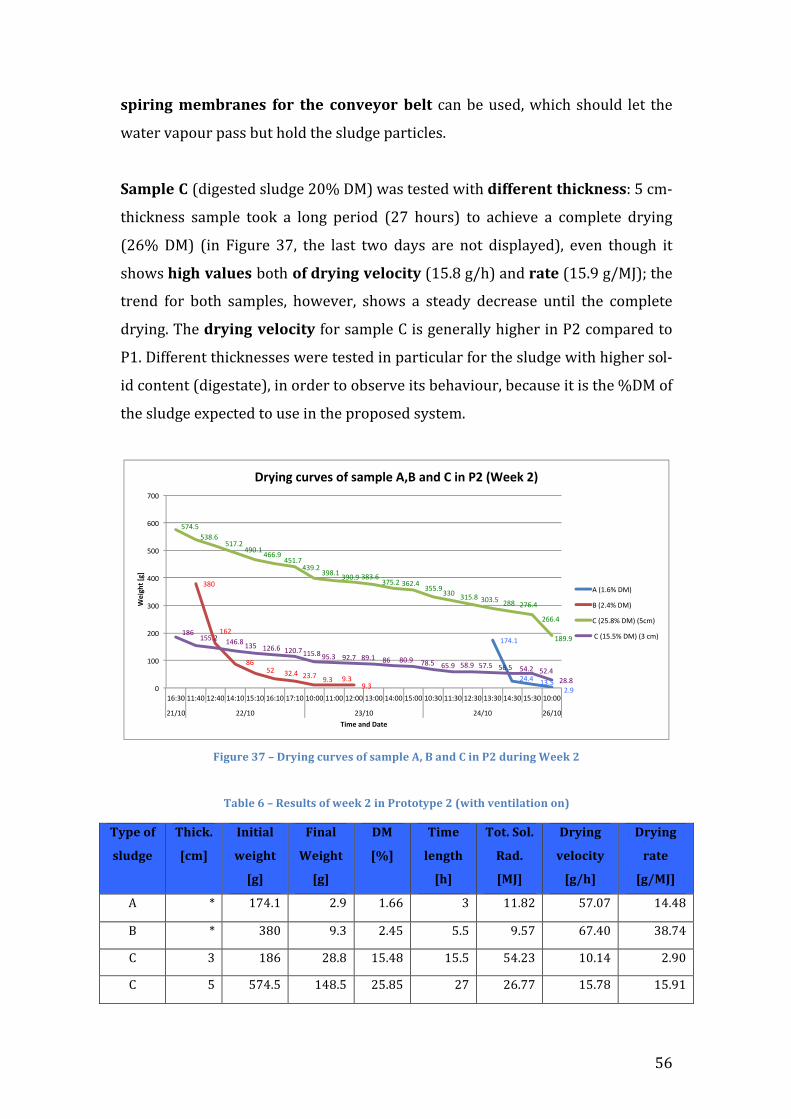
! ZY!
,7-#-(.*&"&/#'(",* $%#* +2"* )%(8"4%#* /"1+! 6($!>&!=.&0a!HB)6B!.B*=+0! +&%! %B&!
H(%&'!<(@*='!@(..!>=%!B*+0!%B&!.+=01&!@('%)6+&.C!
!
6'&71"*H*90)1&.%&0!.+=01&!PLd!?-:!H(.!%&.%&0!H)%B!0-$$"#"(+*+2-)`(",,c!Z!63\
%B)6_$&..! .(3@+&! %**_! (! +*$1! @&')*0! 9PO! B*='.:! %*! (6B)&<&! (! 6*3@+&%&! 0'8)$1!
9PYd! ?-:! 9)$! A)1='&! KOa! %B&! +(.%! %H*! 0(8.! ('&! $*%! 0).@+(8&0:a! &<&$! %B*=1B! )%!
.B*H.!2-.2*8'15",*>*%B*%$!0#4-(.*8"1%)-+4!9"ZCJ!1kB:!($0!#'+"!9"ZCN!1k-,:i!%B&!
%'&$0! D*'! >*%B! .(3@+&.a! B*H&<&'a! .B*H.! (! .%&(08! 0&6'&(.&! =$%)+! %B&! 6*3@+&%&!
0'8)$1C!RB&!0#4-(.*8"1%)-+4!D*'!.(3@+&!7!).!1&$&'(++8!B)1B&'!)$!2P!6*3@('&0!%*!
2"C!?)DD&'&$%!%B)6_$&..&.!H&'&!%&.%&0!)$!@('%)6=+('!D*'!%B&!.+=01&!H)%B!B)1B&'!.*+\
)0!6*$%&$%!90)1&.%(%&:a!)$!*'0&'!%*!*>.&'<&!)%.!>&B(<)*='a!>&6(=.&!)%!).!%B&!d?-!*D!
%B&!.+=01&!&e@&6%&0!%*!=.&!)$!%B&!@'*@*.&0!.8.%&3C!!
!
!G-.5#"*?U*M*O#4-(.*)5#8",*%$*,'&71"*9e*C*'(0*H*-(*!<*05#-(.*S""`*<*
!B'/1"*Q*M*J",51+,*%$*\""`*<*-(*!#%+%+47"*<*W\-+2*8"(+-1'+-%(*%(X*
B47"*%$*
,150."*
B2-)`R*
g)&h*
N(-+-'1*
\"-.2+*
g.h*
G-('1*
S"-.2+*
g.h*
OT*
g]h*
B-&"*
1"(.+2*
g2h*
B%+R*6%1R*
J'0R*
gTkh*
O#4-(.*
8"1%)-+4*
g.@2h*
O#4-(.*
#'+"*
g.@Tkh*
Q! t! "OMC"! PCN! "CYY! K! ""CJP! ZOCLO! "MCMJ!
]! t! KJL! NCK! PCMZ! ZCZ! NCZO! YOCML! KJCOM!
7! K! "JY! PJCJ! "ZCMJ! "ZCZ! ZMCPK! "LC"M! PCNL!
7! Z! ZOMCZ! "MJCZ! PZCJZ! PO! PYCOO! "ZCOJ! "ZCN"!
!"#$!%
&#$#% !'$(%&$)%
'*+%
!,&%
*,%(&% '&$#% &'$"% )$'% )$'%
)$'%
("#$(%('*$,%
(!"$&%#)+$!%#,,$)%
#(!$"%#')$&%
')*$!%')+$)%'*'$,%'"($&%',&$#% '(($)%''+% '!($*% '+'$(% &**% &",$#%
&,,$#%
!*)$)%!*,%
!(($&% !#,$*%!'(% !&,$,% !&+$"%!!($*%)($'% )&$"% *)$!% *,% *+$)% "*$(% ,($)% (*$)% ("$(% (,$(% (#$&% (&$#%&*$*%
+%
!++%
&++%
'++%
#++%
(++%
,++%
"++%
!,-'+%!!-#+%!&-#+%!#-!+%!(-!+%!,-!+%!"-!+%!+-++%!!-++%!&-++%!'-++%!#-++%!(-++%!+-'+%!!-'+%!&-'+%!'-'+%!#-'+%!(-'+%!+-++%
&!.!+% &&.!+% &'.!+% &#.!+% &,.!+%
!"#
$%&'(
$)'
*#+"',-.'/,&"'
/01#-$'2304"5'67'5,+89"':;<',-.'='#-'>?'@!""A'?B'
/%0!$,1%234%
5%0&$#1%234%
6%0&($*1%234%0(784%
%6%0!($(1%234%0'%784%
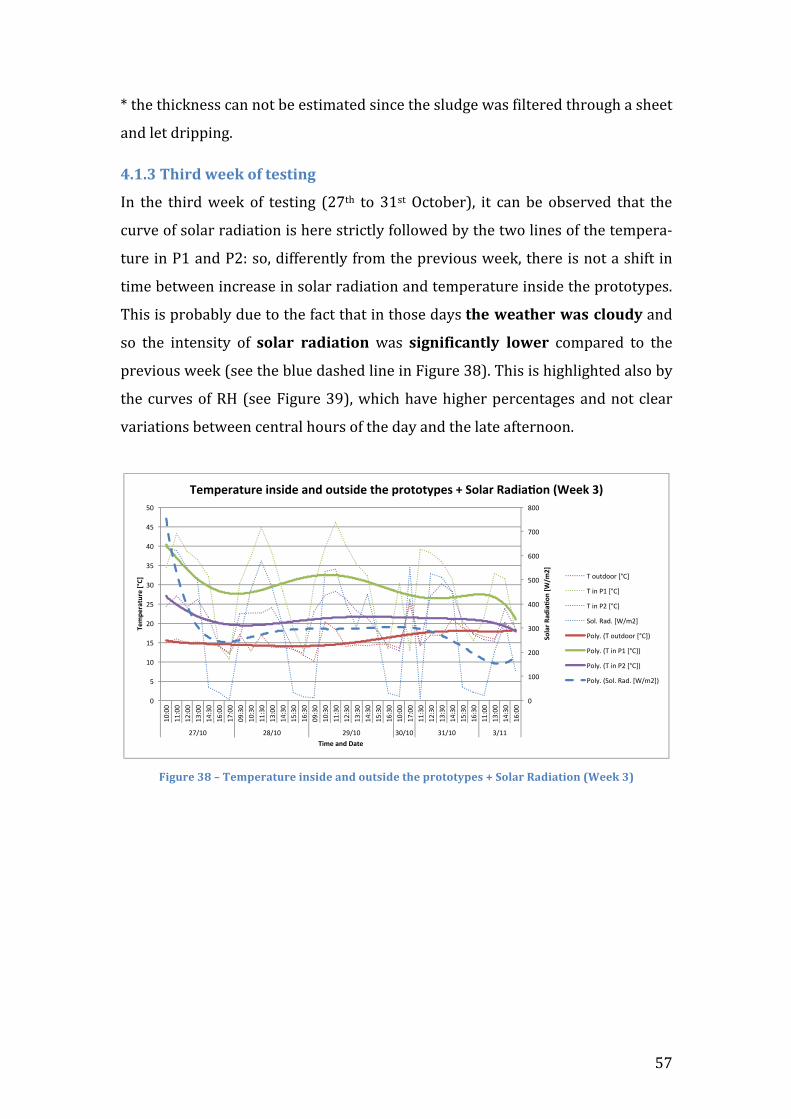
! ZO!
t!%B&!%B)6_$&..!6($!$*%!>&!&.%)3(%&0!.)$6&!%B&!.+=01&!H(.!D)+%&'&0!%B'*=1B!(!.B&&%!
($0!+&%!0')@@)$1C!
AR>R?*B2-#0*\""`*%$*+",+-(.*
#$! %B&! %B)'0!H&&_! *D! %&.%)$1! 9PO%B! %*! K".%! W6%*>&':a! )%! 6($! >&! *>.&'<&0! %B(%! %B&!
6='<&!*D!.*+('!'(0)(%)*$!).!B&'&!.%')6%+8!D*++*H&0!>8!%B&!%H*!+)$&.!*D!%B&!%&3@&'(\
%='&!)$!2"!($0!2Pc!.*a!0)DD&'&$%+8!D'*3!%B&!@'&<)*=.!H&&_a!%B&'&!).!$*%!(!.B)D%!)$!
%)3&!>&%H&&$!)$6'&(.&!)$!.*+('!'(0)(%)*$!($0!%&3@&'(%='&!)$.)0&!%B&!@'*%*%8@&.C!
RB).!).!@'*>(>+8!0=&!%*!%B&!D(6%!%B(%!)$!%B*.&!0(8.!+2"*\"'+2"#*\',*)1%504!($0!
.*! %B&! )$%&$.)%8! *D! ,%1'#* #'0-'+-%(! H(.! ,-.(-$-)'(+14* 1%\"#! 6*3@('&0! %*! %B&!
@'&<)*=.!H&&_!9.&&!%B&!>+=&!0(.B&0!+)$&!)$!A)1='&!KJ:C!RB).!).!B)1B+)1B%&0!(+.*!>8!
%B&!6='<&.!*D!SU!9.&&!A)1='&!KN:a!HB)6B!B(<&!B)1B&'!@&'6&$%(1&.!($0!$*%!6+&('!
<(')(%)*$.!>&%H&&$!6&$%'(+!B*='.!*D!%B&!0(8!($0!%B&!+(%&!(D%&'$**$C!
!
!G-.5#"*?Z*M*B"&7"#'+5#"*-(,-0"*'(0*%5+,-0"*+2"*7#%+%+47",*_*6%1'#*J'0-'+-%(*WS""`*?X*
!
!"
#!!"
$!!"
%!!"
&!!"
'!!"
(!!"
)!!"
*!!"
!"
'"
#!"
#'"
$!"
$'"
%!"
%'"
&!"
&'"
'!"
#!+!!"
##+!!"
#$+!!"
#%+!!"
#&+%!"
#(+!!"
#)+!!"
!,+%!"
#!+%!"
##+%!"
#%+!!"
#&+%!"
#'+%!"
#(+%!"
!,+%!"
#!+%!"
##+%!"
#$+%!"
#%+%!"
#&+%!"
#'+%!"
#(+%!"
#!+!!"
#)+!!"
##+%!"
#$+%!"
#%+%!"
#&+%!"
#'+%!"
#(+%!"
##+!!"
#%+!!"
#&+%!"
#(+!!"
$)-#!" $*-#!" $,-#!" %!-#!" %#-#!" %-##"
!"#$
%&'$(
)$*"
+&,-
./01
&
23/
43%$
56%3
&,781
&
2)/3&$+(&9$53&
23/43%$56%3&)+:)(3&$+(&"65:)(3&5;3&4%"5"5<43:&=&!"#$%&'$()$*"+&>-33?&@A&
."/012//3"4567"
."89":#"4567"
."89":$"4567"
;/<=">?2="4@-A$7"
:/<B="C."/012//3"4567D"
:/<B="C."89":#"4567D"
:/<B="C."89":$"4567D"
:/<B="C;/<=">?2="4@-A$7D"
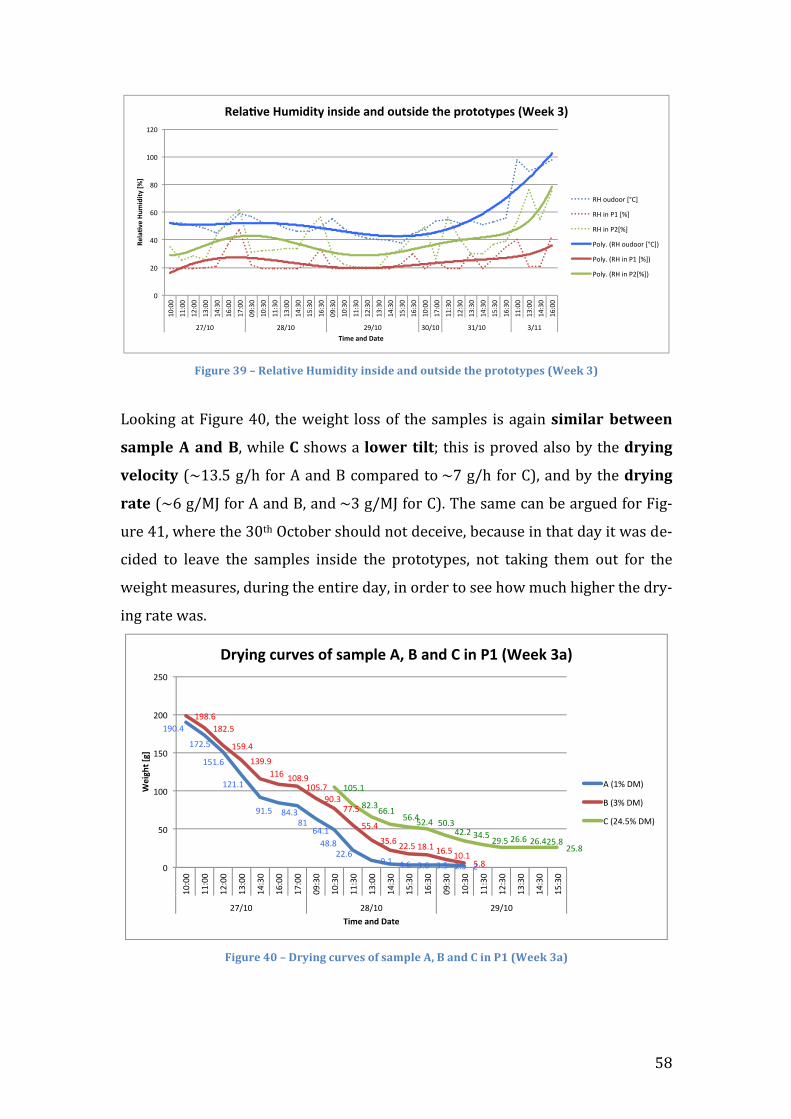
! ZJ!
!G-.5#"*?Y*M*J"1'+-8"*L5&-0-+4*-(,-0"*'(0*%5+,-0"*+2"*7#%+%+47",*WS""`*?X*
!T**_)$1!(%!A)1='&!MLa! %B&!H&)1B%! +*..!*D! %B&!.(3@+&.! ).!(1()$!,-&-1'#* /"+\""(*
,'&71"*9*'(0*Ca!HB)+&!H!.B*H.!(!1%\"#* +-1+i!%B).!).!@'*<&0!(+.*!>8!%B&!0#4-(.*
8"1%)-+4! 9!"KCZ!1kB!D*'!Q!($0!]!6*3@('&0!%*!!O!1kB!D*'!7:a!($0!>8!%B&!0#4-(.*
#'+"!9!Y!1k-,!D*'!Q!($0!]a!($0!!K!1k-,!D*'!7:C!RB&!.(3&!6($!>&!('1=&0!D*'!A)1\
='&!M"a!HB&'&!%B&!KL%B!W6%*>&'!.B*=+0!$*%!0&6&)<&a!>&6(=.&!)$!%B(%!0(8!)%!H(.!0&\
6)0&0! %*! +&(<&! %B&! .(3@+&.! )$.)0&! %B&! @'*%*%8@&.a! $*%! %(_)$1! %B&3! *=%! D*'! %B&!
H&)1B%!3&(.='&.a!0=')$1!%B&!&$%)'&!0(8a!)$!*'0&'!%*!.&&!B*H!3=6B!B)1B&'!%B&!0'8\
)$1!'(%&!H(.C!
!G-.5#"*A=*M*O#4-(.*)5#8",*%$*,'&71"*9e*C*'(0*H*-(*!>*WS""`*?'X*
!
!"
#!"
$!"
%!"
&!"
'!!"
'#!"
'!(!!"
''(!!"
'#(!!"
')(!!"
'$()!"
'%(!!"
'*(!!"
!+()!"
'!()!"
''()!"
')(!!"
'$()!"
',()!"
'%()!"
!+()!"
'!()!"
''()!"
'#()!"
')()!"
'$()!"
',()!"
'%()!"
'!(!!"
'*(!!"
''()!"
'#()!"
')()!"
'$()!"
',()!"
'%()!"
''(!!"
')(!!"
'$()!"
'%(!!"
#*-'!" #&-'!" #+-'!" )!-'!" )'-'!" )-''"
!"#$
%&"'
()*
+,+-.
'/01'
2+*"'$3,'4$-"'
!"#$%&"'()*+,+-.'+35+,"'$3,'6)-5+,"'-7"'896-6-.8"5':;""<'=>'
./"012003"4567"
./"89":'"4;7"
./"89":#4;7"
:0<=>"?./"012003"4567@"
:0<=>"?./"89":'"4;7@"
:0<=>"?./"89":#4;7@"
!"#$%&
!'($)&
!)!$*&
!(!$!&
"!$)& +%$,&+!&
*%$!&%+$+&
(($*&"$!& %$*& ,$*& ,$)& ($)& (&
!"+$*&!+($)&
!)"$%&
!,"$"&!!*& !#+$"&
!#)$'&"#$,&
''$)&
))$%&
,)$*&(($)&!+$!&!*$)&!#$!&)$+&
!#)$!&
+($,&**$!&)*$%&)($%& )#$,&
%($(&,%$)&("$)&(*$*&(*$%&()$+&()$+&
#&
)#&
!##&
!)#&
(##&
()#&
!#-##&
!!-##&
!(-##&
!,-##&
!%-,#&
!*-##&
!'-##&
#"-,#&
!#-,#&
!!-,#&
!,-##&
!%-,#&
!)-,#&
!*-,#&
#"-,#&
!#-,#&
!!-,#&
!(-,#&
!,-,#&
!%-,#&
!)-,#&
('.!#& (+.!#& (".!#&
!"#
$%&'(
$)'
*#+"',-.'/,&"'
/01#-$'2304"5'67'5,+89"':;'<',-.'='#-'>?'@!""A'B,C'
/&0!1&234&
5&0,1&234&
6&0(%$)1&234&
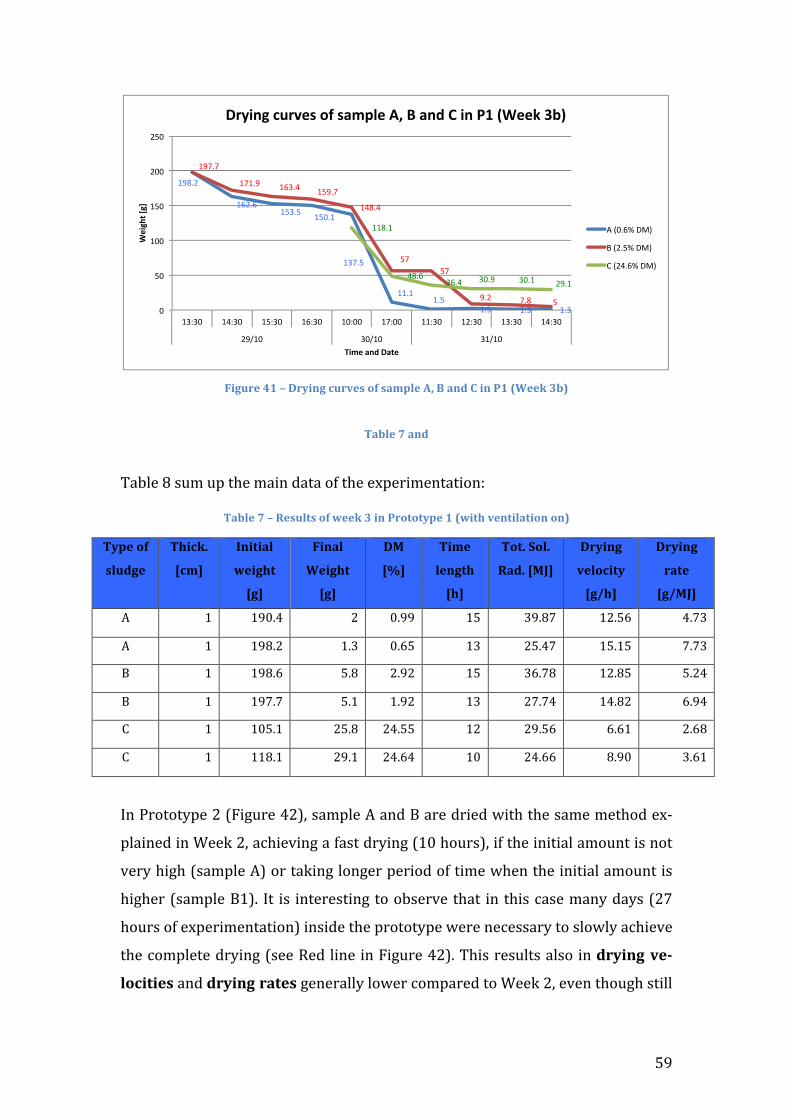
! ZN!
!G-.5#"*A>*M*O#4-(.*)5#8",*%$*,'&71"*9e*C*'(0*H*-(*!>*WS""`*?/X*
!B'/1"*U*'(0*
!R(>+&!J!.=3!=@!%B&!3()$!0(%(!*D!%B&!&e@&')3&$%(%)*$c!!
B'/1"*U*M*J",51+,*%$*\""`*?*-(*!#%+%+47"*>*W\-+2*8"(+-1'+-%(*%(X*
B47"*%$*
,150."*
B2-)`R*
g)&h*
N(-+-'1*
\"-.2+*
g.h*
G-('1*
S"-.2+*
g.h*
OT*
g]h*
B-&"*
1"(.+2*
g2h*
B%+R*6%1R*
J'0R*gTkh*
O#4-(.*
8"1%)-+4*
g.@2h*
O#4-(.*
#'+"*
g.@Tkh*
Q! "! "NLCM! P! LCNN! "Z! KNCJO! "PCZY! MCOK!
Q! "! "NJCP! "CK! LCYZ! "K! PZCMO! "ZC"Z! OCOK!
]! "! "NJCY! ZCJ! PCNP! "Z! KYCOJ! "PCJZ! ZCPM!
]! "! "NOCO! ZC"! "CNP! "K! POCOM! "MCJP! YCNM!
7! "! "LZC"! PZCJ! PMCZZ! "P! PNCZY! YCY"! PCYJ!
7! "! ""JC"! PNC"! PMCYM! "L! PMCYY! JCNL! KCY"!
!
#$!2'*%*%8@&!P!9A)1='&!MP:a!.(3@+&!Q!($0!]!('&!0')&0!H)%B!%B&!.(3&!3&%B*0!&e\
@+()$&0!)$!F&&_!Pa!(6B)&<)$1!(!D(.%!0'8)$1!9"L!B*='.:a!)D!%B&!)$)%)(+!(3*=$%!).!$*%!
<&'8!B)1B!9.(3@+&!Q:!*'!%(_)$1!+*$1&'!@&')*0!*D!%)3&!HB&$!%B&!)$)%)(+!(3*=$%!).!
B)1B&'!9.(3@+&!]":C! #%! ).! )$%&'&.%)$1!%*!*>.&'<&!%B(%! )$!%B).!6(.&!3($8!0(8.!9PO!
B*='.!*D!&e@&')3&$%(%)*$:!)$.)0&!%B&!@'*%*%8@&!H&'&!$&6&..('8!%*!.+*H+8!(6B)&<&!
%B&!6*3@+&%&!0'8)$1!9.&&!S&0!+)$&!)$!A)1='&!MP:C!RB).!'&.=+%.!(+.*!)$!0#4-(.*8"3
1%)-+-",!($0!0#4-(.*#'+",!1&$&'(++8!+*H&'!6*3@('&0!%*!F&&_!Pa!&<&$!%B*=1B!.%)++!
!"#$%&
!'%$'&!()$(& !(*$!&
!)+$(&
!!$!&!$(&
!$"& !$)& !$)&
!"+$+&
!+!$"& !')$,& !("$+&
!,#$,&
(+&(+&
"$%& +$#& (&
!!#$!&
,#$'&)'$,& )*$"& )*$!& %"$!&
*&
(*&
!**&
!(*&
%**&
%(*&
!)-)*& !,-)*& !(-)*& !'-)*& !*-**& !+-**& !!-)*& !%-)*& !)-)*& !,-)*&
%".!*& )*.!*& )!.!*&
!"#
$%&'(
$)'
*#+"',-.'/,&"'
/01#-$'2304"5'67'5,+89"':;'<',-.'='#-'>?'@!""A'BCD'
/&0*$'1&234&
5&0%$(1&234&
6&0%,$'1&234&
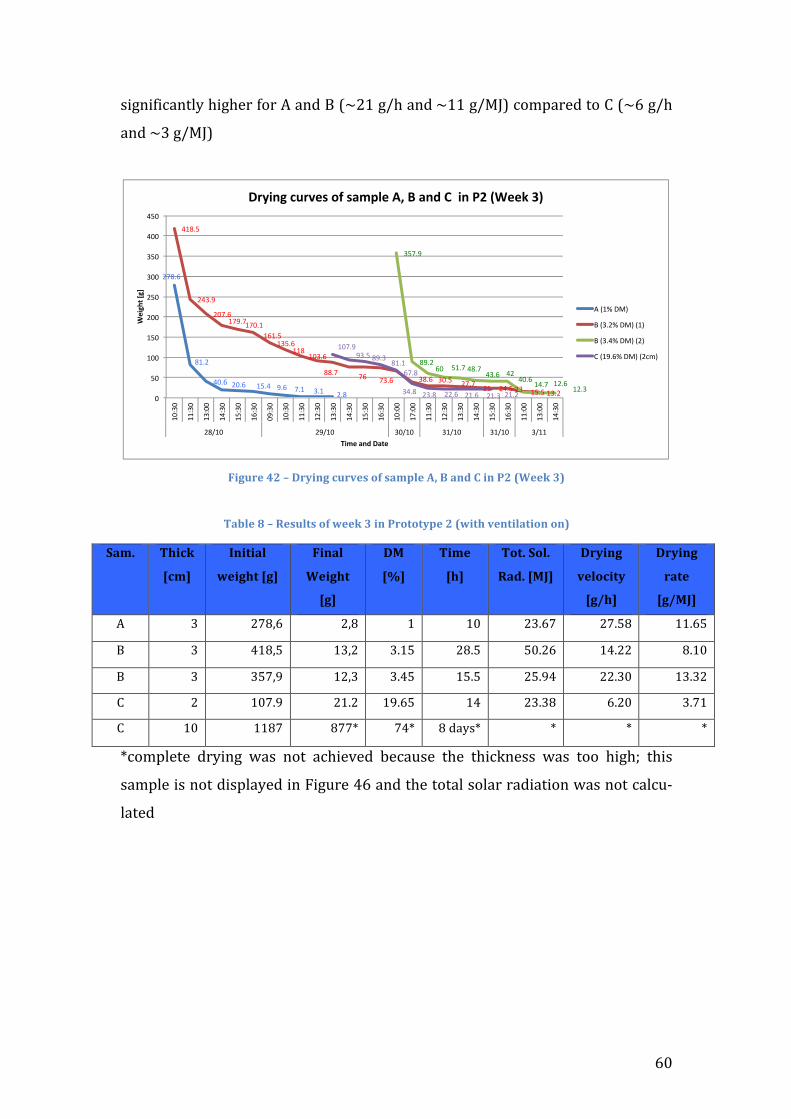
! YL!
.)1$)D)6($%+8!B)1B&'!D*'!Q!($0!]!9!P"!1kB!($0!!""!1k-,:!6*3@('&0!%*!7!9!Y!1kB!
($0!!K!1k-,:!
!
!G-.5#"*A<*M*O#4-(.*)5#8",*%$*,'&71"*9e*C*'(0*H*-(*!<*WS""`*?X*
!B'/1"*Z*M*J",51+,*%$*\""`*?*-(*!#%+%+47"*<*W\-+2*8"(+-1'+-%(*%(X*
6'&R* B2-)`*
g)&h*
N(-+-'1*
\"-.2+*g.h*
G-('1*
S"-.2+*
g.h*
OT*
g]h*
B-&"*
g2h*
B%+R*6%1R*
J'0R*gTkh*
O#4-(.*
8"1%)-+4*
g.@2h*
O#4-(.*
#'+"*
g.@Tkh*
Q! K! POJaY! PaJ! "! "L! PKCYO! POCZJ! ""CYZ!
]! K! M"JaZ! "KaP! KC"Z! PJCZ! ZLCPY! "MCPP! JC"L!
]! K! KZOaN! "PaK! KCMZ! "ZCZ! PZCNM! PPCKL! "KCKP!
7! P! "LOCN! P"CP! "NCYZ! "M! PKCKJ! YCPL! KCO"!
7! "L! ""JO! JOOt! OMt! J!0(8.t! t! t! t!
t6*3@+&%&! 0'8)$1! H(.! $*%! (6B)&<&0! >&6(=.&! %B&! %B)6_$&..! H(.! %**! B)1Bi! %B).!
.(3@+&!).!$*%!0).@+(8&0!)$!A)1='&!MY!($0!%B&!%*%(+!.*+('!'(0)(%)*$!H(.!$*%!6(+6=\
+(%&0!
! !
!"#$%&
#'$!&
()$%& !)$%& '*$(& +$%& "$'& ,$'& !$#&
('#$*&
!(,$+&
!)"$%&'"+$"&'")$'&
'%'$*&',*$%&
''#&'),$%&
##$"& "%& ",$%& ,#$%& ,)$*& !"$"& !*& !($*&!,& '*$*&',$!&
,*"$+&
#+$!&%)& *'$"&(#$"&
(,$%& (!&()$%&
'($"& '!$%& '!$,&
')"$+&+,$*&#+$,&
#'$'&%"$#&
,($#& !,$#& !!$%& !'$%& !'$,& !'$!&)&
*)&
'))&
'*)&
!))&
!*)&
,))&
,*)&
())&
(*)&
')-,)&
''-,)&
',-))&
'(-,)&
'*-,)&
'%-,)&
)+-,)&
')-,)&
''-,)&
'!-,)&
',-,)&
'(-,)&
'*-,)&
'%-,)&
')-))&
'"-))&
''-,)&
'!-,)&
',-,)&
'(-,)&
'*-,)&
'%-,)&
''-))&
',-))&
'(-,)&
!#.')& !+.')& ,).')& ,'.')& ,'.')& ,.''&
!"#
$%&'(
$)'
*#+"',-.'/,&"'
/01#-$'2304"5'67'5,+89"':;'<',-.'=''#-'>?'@!""A'BC'
/&0'1&234&
5&0,$!1&234&0'4&
5&0,$(1&234&0!4&
6&0'+$%1&234&0!784&
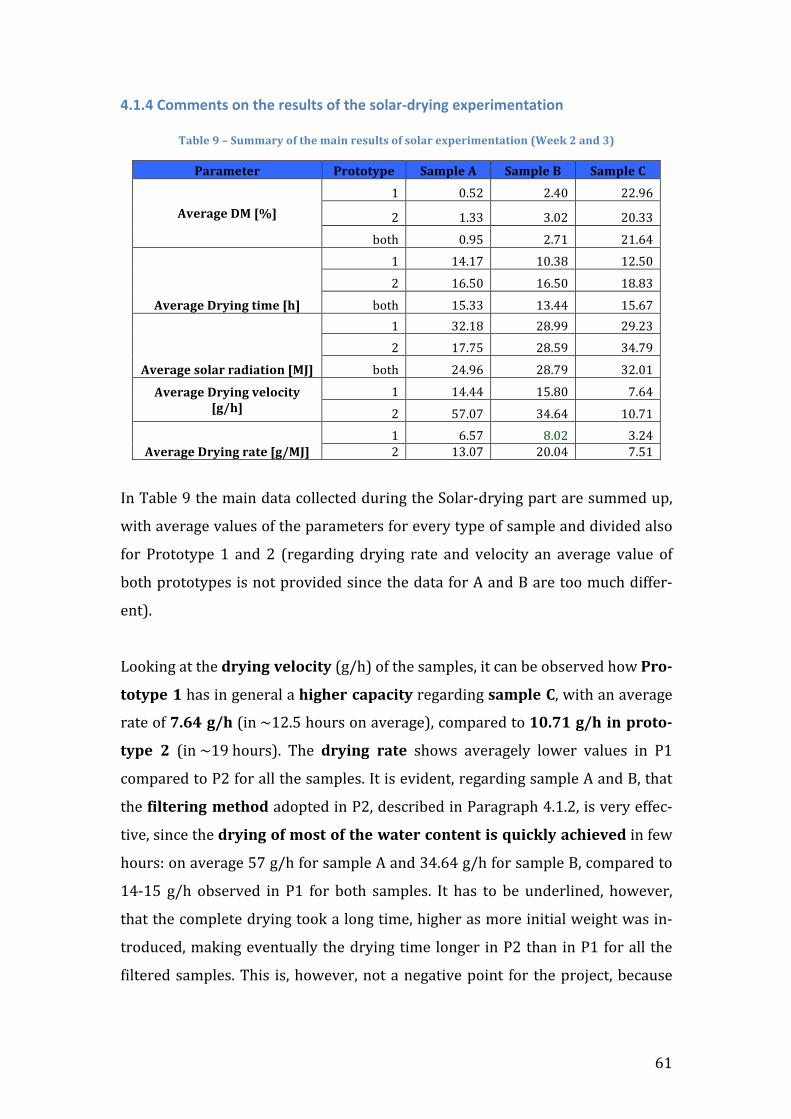
61
4.1.4 Comments on the results of the solar-‐drying experimentation
Table 9 – Summary of the main results of solar experimentation (Week 2 and 3)
Parameter Prototype Sample A Sample B Sample C
Average DM [%] 1 0.52 2.40 22.96
2 1.33 3.02 20.33
both 0.95 2.71 21.64
Average Drying time [h]
1 14.17 10.38 12.50
2 16.50 16.50 18.83
both 15.33 13.44 15.67
Average solar radiation [MJ]
1 32.18 28.99 29.23 2 17.75 28.59 34.79
both 24.96 28.79 32.01
Average Drying velocity [g/h]
1 14.44 15.80 7.64
2 57.07 34.64 10.71
Average Drying rate [g/MJ] 1 6.57 8.02 3.24 2 13.07 20.04 7.51
In Table 9 the main data collected during the Solar-‐drying part are summed up,
with average values of the parameters for every type of sample and divided also
for Prototype 1 and 2 (regarding drying rate and velocity an average value of
both prototypes is not provided since the data for A and B are too much differ-‐
ent).
Looking at the drying velocity (g/h) of the samples, it can be observed how Pro-‐
totype 1 has in general a higher capacity regarding sample C, with an average
rate of 7.64 g/h (in ~12.5 hours on average), compared to 10.71 g/h in proto-‐
type 2 (in ~19 hours). The drying rate shows averagely lower values in P1
compared to P2 for all the samples. It is evident, regarding sample A and B, that
the filtering method adopted in P2, described in Paragraph 4.1.2, is very effec-‐
tive, since the drying of most of the water content is quickly achieved in few
hours: on average 57 g/h for sample A and 34.64 g/h for sample B, compared to
14-‐15 g/h observed in P1 for both samples. It has to be underlined, however,
that the complete drying took a long time, higher as more initial weight was in-‐
troduced, making eventually the drying time longer in P2 than in P1 for all the
filtered samples. This is, however, not a negative point for the project, because
62
the incineration of the sludge requires around 85% DM, so the filtering method
results to be applicable.
Comparing the two prototypes, it can then be argued that the drying rate is
similar only when there is a high level of solar radiation (sunny weather). On the
other hand, when the amount of incoming solar radiation is low (cloudy weath-‐
er), the drying capacity of P2 is very weak, while in P1 evaporation still happens
(this is due to the already described characteristic of the systems: the samples
receive direct solar radiation inside P1).
Regarding the solid content (%DM), the average values are close to the ex-‐
pected percentages (also determined with the standard method at 105°C – see
Paragraph 4.5), on average for all the samples: 0.95% for sludge type A, 2.71%
for B and 21.64% for C. It can be observed from Table 9 that the values are
slightly higher in P2 for sample A and B compared with P1 but slightly lower for
sample C. This can be due to the lower temperature inside Prototype 2.
4.2 Enthalpy and Exchanged Thermal Power in the Solar Collectors The results of the calculations described in Paragraph 3.2, regarding enthalpy of
the air passing through the solar collectors of Prototype 2, are here presented
and discussed. Hin, which is the enthalpy of the air entering the collector, has
been calculated considering T (°C) and RH (%) of the environment, while for Hout,
which is the air heated up by the collectors, entering the box of P2, data were
taken by a sensor put at the end of the collector. Looking at the curves of enthal-‐
py and thermal power, the comments made in the previous section are here con-‐
firmed: during the second week (Figure 43 and Figure 44) there was more in-‐
coming solar radiation which results in a fluctuating trend, with peaks at the cen-‐
tral hours of the day (approximately 65-‐80 kJ/kg).
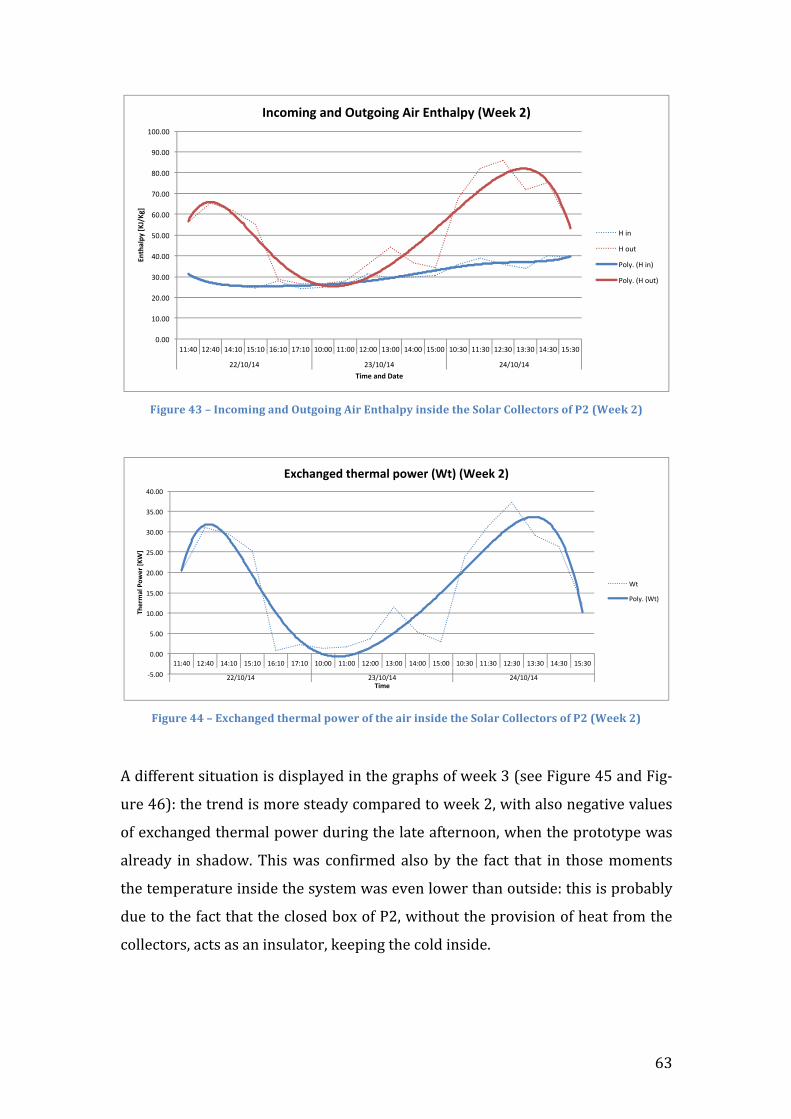
! YK!
!G-.5#"*A?*M*N()%&-(.*'(0*F5+.%-(.*9-#*E(+2'174*-(,-0"*+2"*6%1'#*H%11")+%#,*%$*!<*WS""`*<X*
*
!G-.5#"*AA*M*Eb)2'(."0*+2"#&'1*7%\"#*%$*+2"*'-#*-(,-0"*+2"*6%1'#*H%11")+%#,*%$*!<*WS""`*<X*
!
Q!0)DD&'&$%!.)%=(%)*$!).!0).@+(8&0!)$!%B&!1'(@B.!*D!H&&_!K!9.&&!A)1='&!MZ!($0!A)1\
='&!MY:c!%B&!%'&$0!).!3*'&!.%&(08!6*3@('&0!%*!H&&_!Pa!H)%B!(+.*!$&1(%)<&!<(+=&.!
*D!&e6B($1&0!%B&'3(+!@*H&'!0=')$1!%B&!+(%&!(D%&'$**$a!HB&$!%B&!@'*%*%8@&!H(.!
(+'&(08! )$! .B(0*HC!RB).!H(.! 6*$D)'3&0!(+.*!>8! %B&! D(6%! %B(%! )$! %B*.&!3*3&$%.!
%B&!%&3@&'(%='&!)$.)0&!%B&!.8.%&3!H(.!&<&$!+*H&'!%B($!*=%.)0&c!%B).!).!@'*>(>+8!
0=&!%*!%B&!D(6%!%B(%!%B&!6+*.&0!>*e!*D!2Pa!H)%B*=%!%B&!@'*<).)*$!*D!B&(%!D'*3!%B&!
6*++&6%*'.a!(6%.!(.!($!)$.=+(%*'a!_&&@)$1!%B&!6*+0!)$.)0&C!
!
!"!!#
$!"!!#
%!"!!#
&!"!!#
'!"!!#
(!"!!#
)!"!!#
*!"!!#
+!"!!#
,!"!!#
$!!"!!#
$$-'!# $%-'!# $'-$!# $(-$!# $)-$!# $*-$!# $!-!!# $$-!!# $%-!!# $&-!!# $'-!!# $(-!!# $!-&!# $$-&!# $%-&!# $&-&!# $'-&!# $(-&!#
%%.$!.$'# %&.$!.$'# %'.$!.$'#
!"#$
%&'(
)*+,-
+./)
0123)%"4)5%#3)
6"7821".)%"4)9:#.81".);1<)!"#$%&'()=>33?)@A)
/#01#
/#234#
5267"#8/#019#
5267"#8/#2349#
!"#$$%
$#$$%
"#$$%
&$#$$%
&"#$$%
'$#$$%
'"#$$%
($#$$%
("#$$%
)$#$$%
&&*)$% &'*)$% &)*&$% &"*&$% &+*&$% &,*&$% &$*$$% &&*$$% &'*$$% &(*$$% &)*$$% &"*$$% &$*($% &&*($% &'*($% &(*($% &)*($% &"*($%
''-&$-&)% '(-&$-&)% ')-&$-&)%
!"#$%&'()*+
#$(,-
./(
!0%#(
123"&45#6(7"#$%&'(8*+#$(9.7:(9.##;(<:(
./%
0123#%4./5%
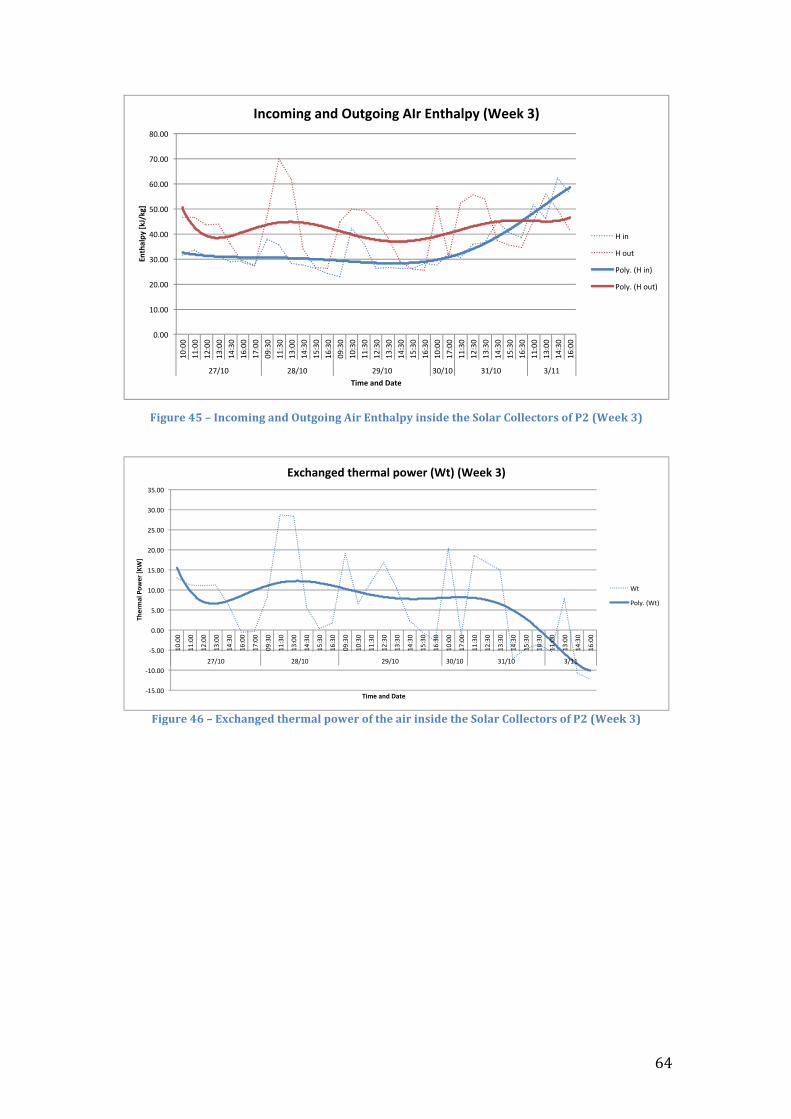
! YM!
!G-.5#"*AK*M*N()%&-(.*'(0*F5+.%-(.*9-#*E(+2'174*-(,-0"*+2"*6%1'#*H%11")+%#,*%$*!<*WS""`*?X*
!
!G-.5#"*AQ*M*Eb)2'(."0*+2"#&'1*7%\"#*%$*+2"*'-#*-(,-0"*+2"*6%1'#*H%11")+%#,*%$*!<*WS""`*?X*
! *
!"!!#
$!"!!#
%!"!!#
&!"!!#
'!"!!#
(!"!!#
)!"!!#
*!"!!#
+!"!!#
$!,!!#
$$,!!#
$%,!!#
$&,!!#
$',&!#
$),!!#
$*,!!#
!-,&!#
$$,&!#
$&,!!#
$',&!#
$(,&!#
$),&!#
!-,&!#
$!,&!#
$$,&!#
$%,&!#
$&,&!#
$',&!#
$(,&!#
$),&!#
$!,!!#
$*,!!#
$$,&!#
$%,&!#
$&,&!#
$',&!#
$(,&!#
$),&!#
$$,!!#
$&,!!#
$',&!#
$),!!#
%*.$!# %+.$!# %-.$!# &!.$!# &$.$!# &.$$#
!"#$%&'()*+
,-+./)
0123)%"4)5%#3)
6"7821".)%"4)9:#.81".);6<)!"#$%&'()=>33+)?@)
/#01#
/#234#
5267"#8/#019#
5267"#8/#2349#
!"#$%%&
!"%$%%&
!#$%%&
%$%%&
#$%%&
"%$%%&
"#$%%&
'%$%%&
'#$%%&
(%$%%&
(#$%%&
"%)%%&
"")%%&
"')%%&
"()%%&
"*)(%&
"+)%%&
",)%%&
%-)(%&
"")(%&
"()%%&
"*)(%&
"#)(%&
"+)(%&
%-)(%&
"%)(%&
"")(%&
"')(%&
"()(%&
"*)(%&
"#)(%&
"+)(%&
"%)%%&
",)%%&
"")(%&
"')(%&
"()(%&
"*)(%&
"#)(%&
"+)(%&
"")%%&
"()%%&
"*)(%&
"+)%%&
',."%& '/."%& '-."%& (%."%& ("."%& (.""&
!"#$%&'()*+
#$(,-
./(
!0%#(&12(3&4#(
567"&18#2(4"#$%&'(9*+#$(:.4;(:.##<(=;(
01&
2345$&6017&
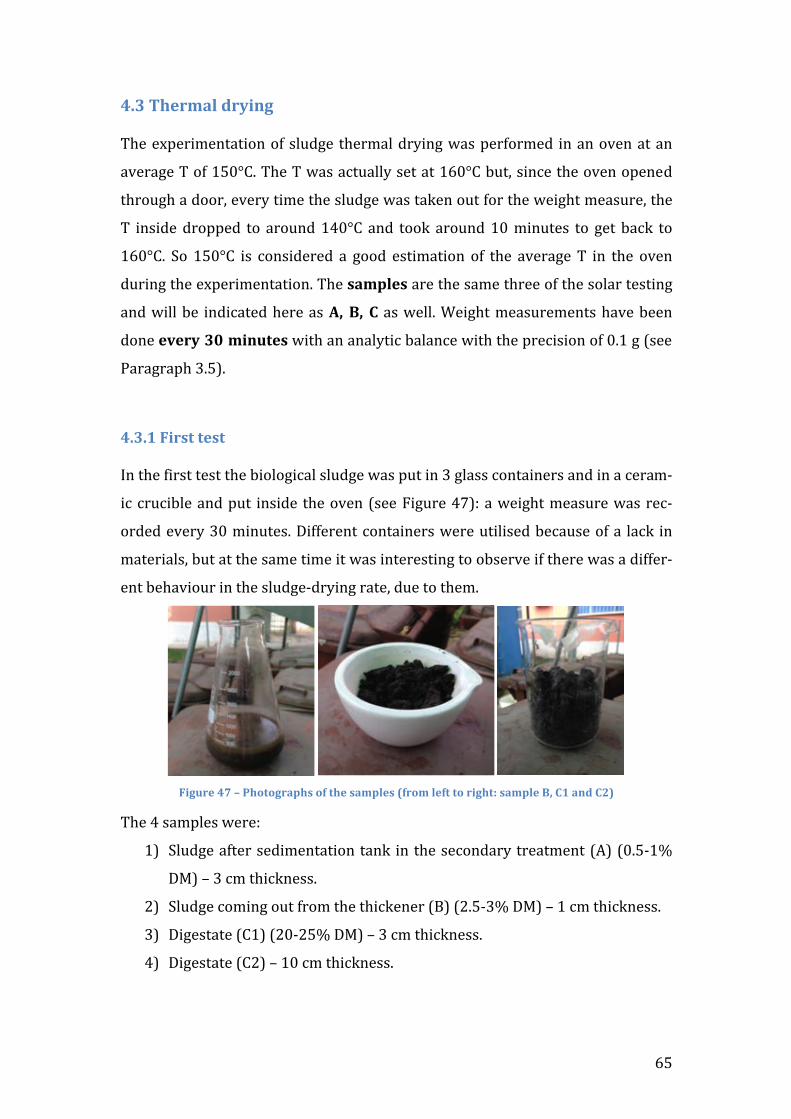
! YZ!
AR?*B2"#&'1*0#4-(.*!RB&!&e@&')3&$%(%)*$!*D!.+=01&! %B&'3(+!0'8)$1!H(.!@&'D*'3&0! )$!($!*<&$!(%!($!
(<&'(1&!R!*D!"ZLp7C!RB&!R!H(.!(6%=(++8!.&%!(%!"YLp7!>=%a!.)$6&!%B&!*<&$!*@&$&0!
%B'*=1B!(!0**'a!&<&'8!%)3&!%B&!.+=01&!H(.!%(_&$!*=%!D*'!%B&!H&)1B%!3&(.='&a!%B&!
R! )$.)0&!0'*@@&0! %*! ('*=$0!"MLp7! ($0! %**_! ('*=$0!"L!3)$=%&.! %*! 1&%! >(6_! %*!
"YLp7C! 5*! "ZLp7! ).! 6*$.)0&'&0! (! 1**0! &.%)3(%)*$! *D! %B&! (<&'(1&! R! )$! %B&! *<&$!
0=')$1!%B&!&e@&')3&$%(%)*$C!RB&!,'&71",!('&!%B&!.(3&!%B'&&!*D!%B&!.*+('!%&.%)$1!
($0!H)++!>&! )$0)6(%&0!B&'&!(.!9e* Ce* H! (.!H&++C!F&)1B%!3&(.='&3&$%.!B(<&!>&&$!
0*$&!"8"#4*?=*&-(5+",!H)%B!($!($(+8%)6!>(+($6&!H)%B!%B&!@'&6).)*$!*D!LC"!1!9.&&!
2('(1'(@B!KCZ:C!
!
AR?R>*G-#,+*+",+*!#$!%B&!D)'.%!%&.%!%B&!>)*+*1)6(+!.+=01&!H(.!@=%!)$!K!1+(..!6*$%()$&'.!($0!)$!(!6&'(3\
)6!6'=6)>+&!($0!@=%! )$.)0&! %B&!*<&$!9.&&!A)1='&!MO:c!(!H&)1B%!3&(.='&!H(.!'&6\
*'0&0!&<&'8!KL!3)$=%&.C!?)DD&'&$%!6*$%()$&'.!H&'&!=%)+).&0!>&6(=.&!*D!(! +(6_! )$!
3(%&')(+.a!>=%!(%!%B&!.(3&!%)3&!)%!H(.!)$%&'&.%)$1!%*!*>.&'<&!)D!%B&'&!H(.!(!0)DD&'\
&$%!>&B(<)*='!)$!%B&!.+=01&\0'8)$1!'(%&a!0=&!%*!%B&3C!
! ! !G-.5#"*AU*M*!2%+%.#'72,*%$*+2"*,'&71",*W$#%&*1"$+*+%*#-.2+a*,'&71"*Ce*H>*'(0*H<X*
RB&!M!.(3@+&.!H&'&c!
": 5+=01&!(D%&'!.&0)3&$%(%)*$!%($_! )$!%B&!.&6*$0('8!%'&(%3&$%!9Q:!9LCZ\"d!
?-:!4!K!63!%B)6_$&..C!
P: 5+=01&!6*3)$1!*=%!D'*3!%B&!%B)6_&$&'!9]:!9PCZ\Kd!?-:!4!"!63!%B)6_$&..C!
K: ?)1&.%(%&!97":!9PL\PZd!?-:!4!K!63!%B)6_$&..C!
M: ?)1&.%(%&!97P:!4!"L!63!%B)6_$&..C!
!
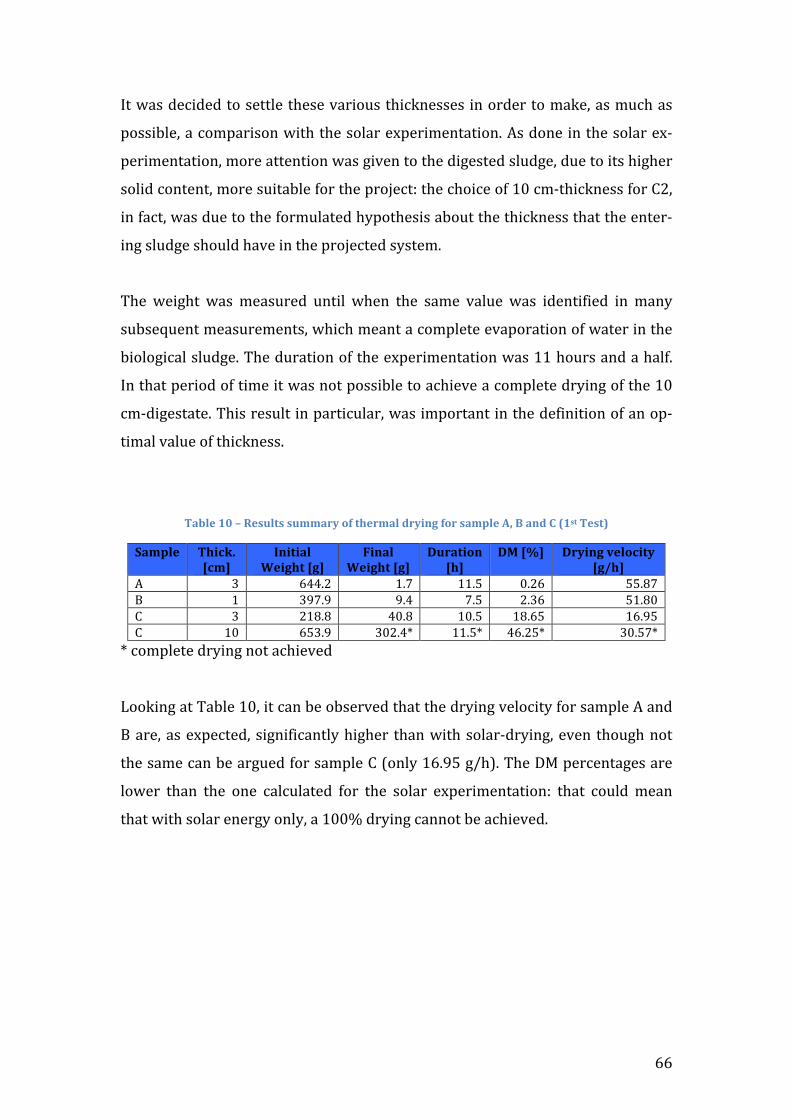
66
It was decided to settle these various thicknesses in order to make, as much as
possible, a comparison with the solar experimentation. As done in the solar ex-‐
perimentation, more attention was given to the digested sludge, due to its higher
solid content, more suitable for the project: the choice of 10 cm-‐thickness for C2,
in fact, was due to the formulated hypothesis about the thickness that the enter-‐
ing sludge should have in the projected system.
The weight was measured until when the same value was identified in many
subsequent measurements, which meant a complete evaporation of water in the
biological sludge. The duration of the experimentation was 11 hours and a half.
In that period of time it was not possible to achieve a complete drying of the 10
cm-‐digestate. This result in particular, was important in the definition of an op-‐
timal value of thickness.
Table 10 – Results summary of thermal drying for sample A, B and C (1st Test)
Sample Thick. [cm]
Initial Weight [g]
Final Weight [g]
Duration [h]
DM [%] Drying velocity [g/h]
A 3 644.2 1.7 11.5 0.26 55.87 B 1 397.9 9.4 7.5 2.36 51.80 C 3 218.8 40.8 10.5 18.65 16.95 C 10 653.9 302.4* 11.5* 46.25* 30.57*
* complete drying not achieved
Looking at Table 10, it can be observed that the drying velocity for sample A and
B are, as expected, significantly higher than with solar-‐drying, even though not
the same can be argued for sample C (only 16.95 g/h). The DM percentages are
lower than the one calculated for the solar experimentation: that could mean
that with solar energy only, a 100% drying cannot be achieved.
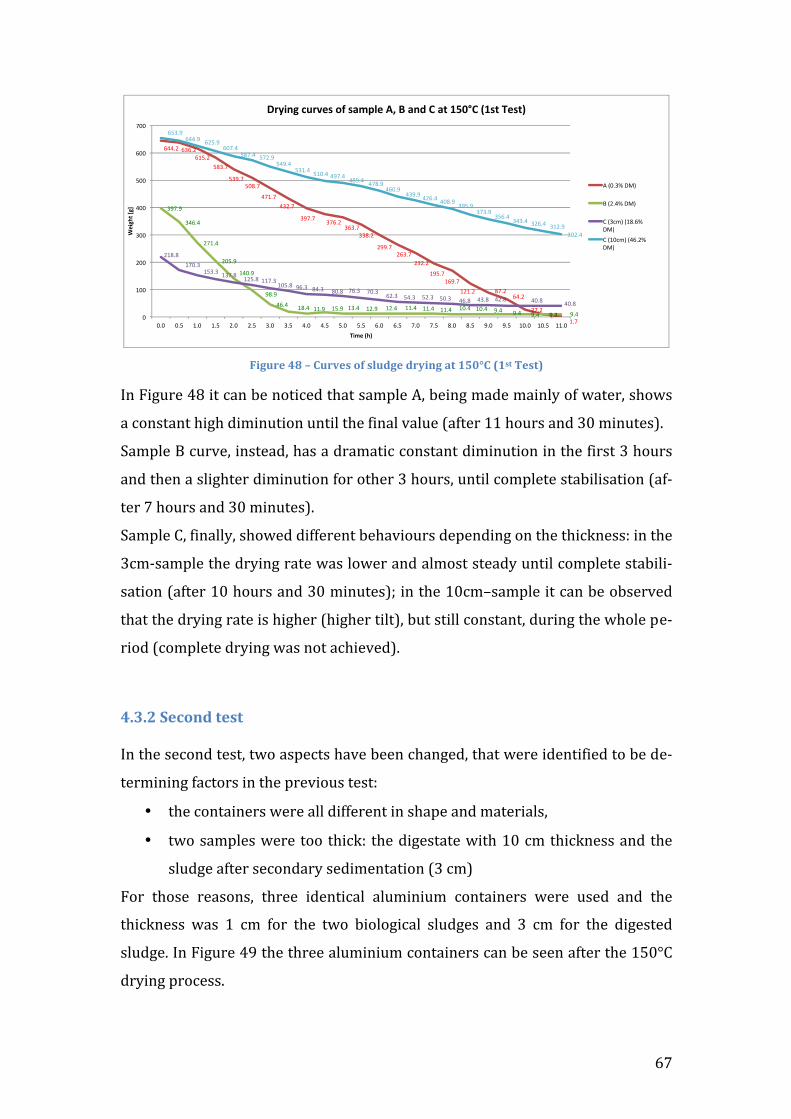
! YO!
!G-.5#"*AZ*M*H5#8",*%$*,150."*0#4-(.*'+*>K=lH*W>,+*B",+X*
#$!A)1='&!MJ!)%!6($!>&!$*%)6&0!%B(%!.(3@+&!Qa!>&)$1!3(0&!3()$+8!*D!H(%&'a!.B*H.!
(!6*$.%($%!B)1B!0)3)$=%)*$!=$%)+!%B&!D)$(+!<(+=&!9(D%&'!""!B*='.!($0!KL!3)$=%&.:C!!
5(3@+&!]!6='<&a!)$.%&(0a!B(.!(!0'(3(%)6!6*$.%($%!0)3)$=%)*$!)$!%B&!D)'.%!K!B*='.!
($0!%B&$!(!.+)1B%&'!0)3)$=%)*$!D*'!*%B&'!K!B*='.a!=$%)+!6*3@+&%&!.%(>)+).(%)*$!9(D\
%&'!O!B*='.!($0!KL!3)$=%&.:C!
5(3@+&!7a!D)$(++8a!.B*H&0!0)DD&'&$%!>&B(<)*='.!0&@&$0)$1!*$!%B&!%B)6_$&..c!)$!%B&!
K63\.(3@+&!%B&!0'8)$1!'(%&!H(.!+*H&'!($0!(+3*.%!.%&(08!=$%)+!6*3@+&%&!.%(>)+)\
.(%)*$!9(D%&'!"L!B*='.!($0!KL!3)$=%&.:i!)$!%B&!"L634.(3@+&!)%!6($!>&!*>.&'<&0!
%B(%!%B&!0'8)$1!'(%&!).!B)1B&'!9B)1B&'!%)+%:a!>=%!.%)++!6*$.%($%a!0=')$1!%B&!HB*+&!@&\
')*0!96*3@+&%&!0'8)$1!H(.!$*%!(6B)&<&0:C!
!
AR?R<*6")%(0*+",+*!#$!%B&!.&6*$0!%&.%a!%H*!(.@&6%.!B(<&!>&&$!6B($1&0a!%B(%!H&'&!)0&$%)D)&0!%*!>&!0&\
%&'3)$)$1!D(6%*'.!)$!%B&!@'&<)*=.!%&.%c!
• %B&!6*$%()$&'.!H&'&!(++!0)DD&'&$%!)$!.B(@&!($0!3(%&')(+.a!
• %H*!.(3@+&.!H&'&!%**!%B)6_c! %B&!0)1&.%(%&!H)%B!"L!63!%B)6_$&..!($0!%B&!
.+=01&!(D%&'!.&6*$0('8!.&0)3&$%(%)*$!9K!63:!
A*'! %B*.&! '&(.*$.a! %B'&&! )0&$%)6(+! (+=3)$)=3! 6*$%()$&'.! H&'&! =.&0! ($0! %B&!
%B)6_$&..! H(.! "! 63! D*'! %B&! %H*! >)*+*1)6(+! .+=01&.! ($0! K! 63! D*'! %B&! 0)1&.%&0!
.+=01&C!#$!A)1='&!MN!%B&!%B'&&!(+=3)$)=3!6*$%()$&'.!6($!>&!.&&$!(D%&'!%B&!"ZLp7!
0'8)$1!@'*6&..C!
!
!""#$% !&!#$%!'(#$%
()&#*%
(&+#*%(,)#*%
"*'#*%"&$#*%
&+*#*% &*!#$%&!&#*%
&&)#$%
$++#*%$!&#*%
$&$#$%
'+(#*%'!+#*%
'$'#$% )*#$%!"#$%
$*#$%+#$%
'#*%
&+*#+%
&"!#"%
$*'#"%
$,(#+%
'",#+%
+)#+%
"!#"% ')#"% ''#+% '(#+% '&#"% '$#+% '$#"% ''#"% ''#"% ''#"% ',#"% ',#"% +#"% +#"% +#"% +#"% +#"%
$')#)%'*,#&%
'(&#&% '&*#)% '$(#)% ''*#&%',(#)% +!#&% )"#&% ),#)% *!#&% *,#&%
!$#&% ("#&% ($#&% (,#&% "!#)% "&#)% "$#)% ",#)% ",#)%
!(&#+%!""#+% !$(#+%
!,*#"%()*#"% (*$#+%
("+#"%(&'#"% (',#"%"+*#"%
")+#"% "*)#+%"!,#+%
"&+#+%"$!#"% ",)#+%&+(#+%
&*&#+%&(!#"%
&"&#"% &$!#"% &'$#+%&,$#"%
,%
',,%
$,,%
&,,%
",,%
(,,%
!,,%
*,,%
,#,% ,#(% '#,% '#(% $#,% $#(% &#,% &#(% "#,% "#(% (#,% (#(% !#,% !#(% *#,% *#(% )#,% )#(% +#,% +#(% ',#,% ',#(% ''#,%
!"#
$%&'(
$)'
*#+"',%-'
./0#1$'23/4"5'67'58+9:"';<'='81>'?'8&'@ABC?',@5&'*"5&-'
-%.,#&/%012%
3%.$#"/%012%
4%.&562%.')#!/%012%4%.',562%."!#$/%012%
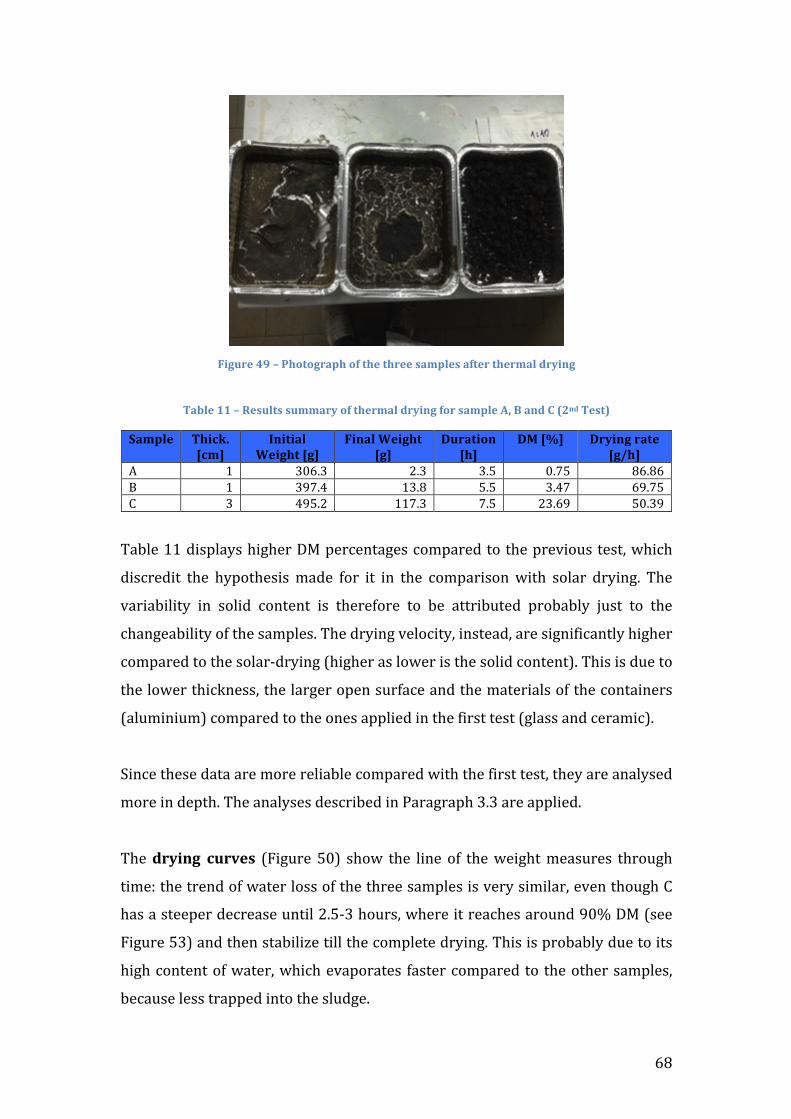
68
Figure 49 – Photograph of the three samples after thermal drying
Table 11 – Results summary of thermal drying for sample A, B and C (2nd Test)
Sample Thick. [cm]
Initial Weight [g]
Final Weight [g]
Duration [h]
DM [%] Drying rate [g/h]
A 1 306.3 2.3 3.5 0.75 86.86 B 1 397.4 13.8 5.5 3.47 69.75 C 3 495.2 117.3 7.5 23.69 50.39
Table 11 displays higher DM percentages compared to the previous test, which
discredit the hypothesis made for it in the comparison with solar drying. The
variability in solid content is therefore to be attributed probably just to the
changeability of the samples. The drying velocity, instead, are significantly higher
compared to the solar-‐drying (higher as lower is the solid content). This is due to
the lower thickness, the larger open surface and the materials of the containers
(aluminium) compared to the ones applied in the first test (glass and ceramic).
Since these data are more reliable compared with the first test, they are analysed
more in depth. The analyses described in Paragraph 3.3 are applied.
The drying curves (Figure 50) show the line of the weight measures through
time: the trend of water loss of the three samples is very similar, even though C
has a steeper decrease until 2.5-‐3 hours, where it reaches around 90% DM (see
Figure 53) and then stabilize till the complete drying. This is probably due to its
high content of water, which evaporates faster compared to the other samples,
because less trapped into the sludge.
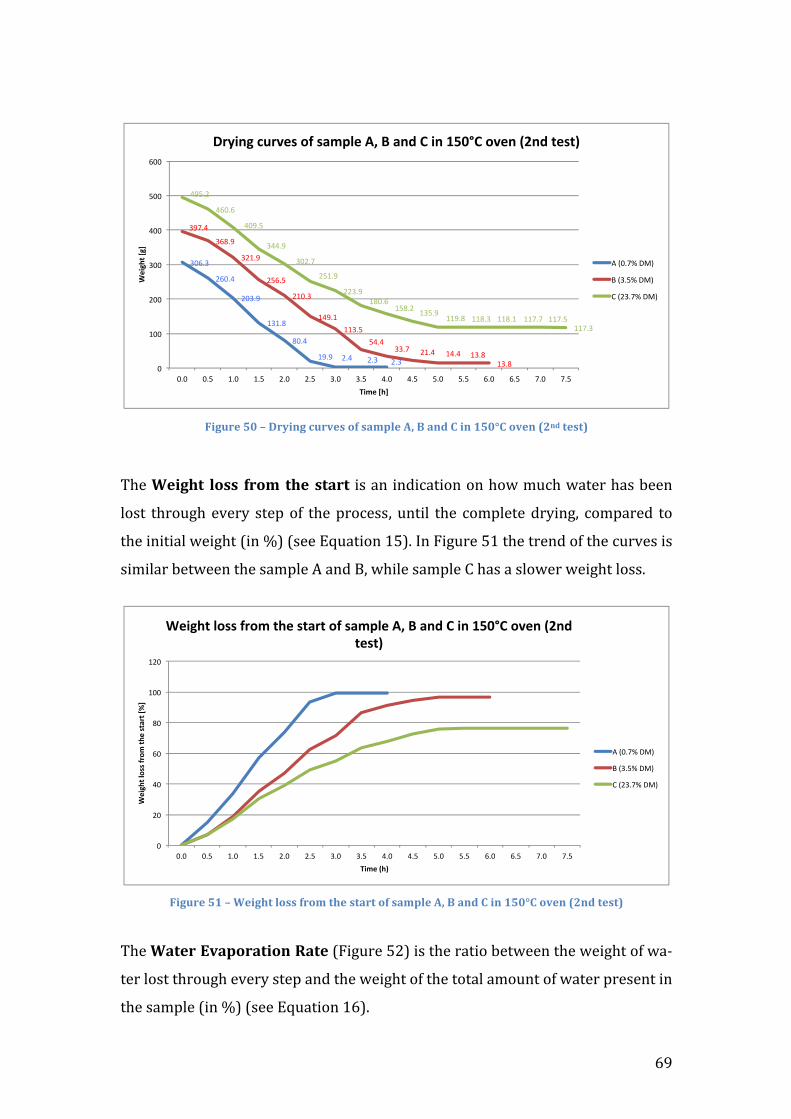
! YN!
!
!G-.5#"*K=*M*O#4-(.*)5#8",*%$*,'&71"*9e*C*'(0*H*-(*>K=lH*%8"(*W<(0*+",+X*
!
RB&!S"-.2+* 1%,,* $#%&* +2"* ,+'#+! ).!($!)$0)6(%)*$!*$!B*H!3=6B!H(%&'!B(.!>&&$!
+*.%! %B'*=1B!&<&'8! .%&@!*D! %B&!@'*6&..a! =$%)+! %B&! 6*3@+&%&!0'8)$1a! 6*3@('&0! %*!
%B&!)$)%)(+!H&)1B%!9)$!d:!9.&&!;b=(%)*$!"Z:C!#$!A)1='&!Z"!%B&!%'&$0!*D!%B&!6='<&.!).!
.)3)+('!>&%H&&$!%B&!.(3@+&!Q!($0!]a!HB)+&!.(3@+&!7!B(.!(!.+*H&'!H&)1B%!+*..C!
!
!G-.5#"*K>*M*S"-.2+*1%,,*$#%&*+2"*,+'#+*%$*,'&71"*9e*C*'(0*H*-(*>K=lH*%8"(*W<(0*+",+X*
!RB&!S'+"#*E8'7%#'+-%(*J'+"!9A)1='&!ZP:!).!%B&!'(%)*!>&%H&&$!%B&!H&)1B%!*D!H(\
%&'!+*.%!%B'*=1B!&<&'8!.%&@!($0!%B&!H&)1B%!*D!%B&!%*%(+!(3*=$%!*D!H(%&'!@'&.&$%!)$!
%B&!.(3@+&!9)$!d:!9.&&!;b=(%)*$!"Y:C#
!"#$!%
&#"$'%
&"!$(%
)!)$*%
*"$'%
)($(% &$'% &$!% &$!%
!(+$'%
!#*$(%
!&)$(%
&,#$,%
&)"$!%
)'($)%))!$,%
,'$'%!!$+% &)$'% )'$'% )!$*%
)!$*%
'(,$&%
'#"$#%
'"($,%
!''$(%
!"&$+%
&,)$(%
&&!$(%)*"$#%
),*$&% )!,$(%))($*% ))*$!% ))*$)% ))+$+% ))+$,%
))+$!%
"%
)""%
&""%
!""%
'""%
,""%
#""%
"$"% "$,% )$"% )$,% &$"% &$,% !$"% !$,% '$"% '$,% ,$"% ,$,% #$"% #$,% +$"% +$,%
!"#
$%&'(
$)'
*#+"'(%)'
,-.#/$'01-2"3'45'36+78"'9:';'6/<'='#/'>?@A='42"/'BC/<'&"3&D'
-%."$+/%012%
3%.!$,/%012%
4%.&!$+/%012%
!"
#!"
$!"
%!"
&!"
'!!"
'#!"
!(!" !()" '(!" '()" #(!" #()" *(!" *()" $(!" $()" )(!" )()" %(!" %()" +(!" +()"
!"#$%&'()**'+,)-'&%
"'*&.,&'/01'
2#-"'3%4'
!"#$%&'()**'+,)-'&%"'*&.,&')+'*.-5("'67'8'.9:';'#9'<=>?;')@"9'3A9:'&"*&4'
,"-!(+."/01"
2"-*()."/01"
3"-#*(+."/01"
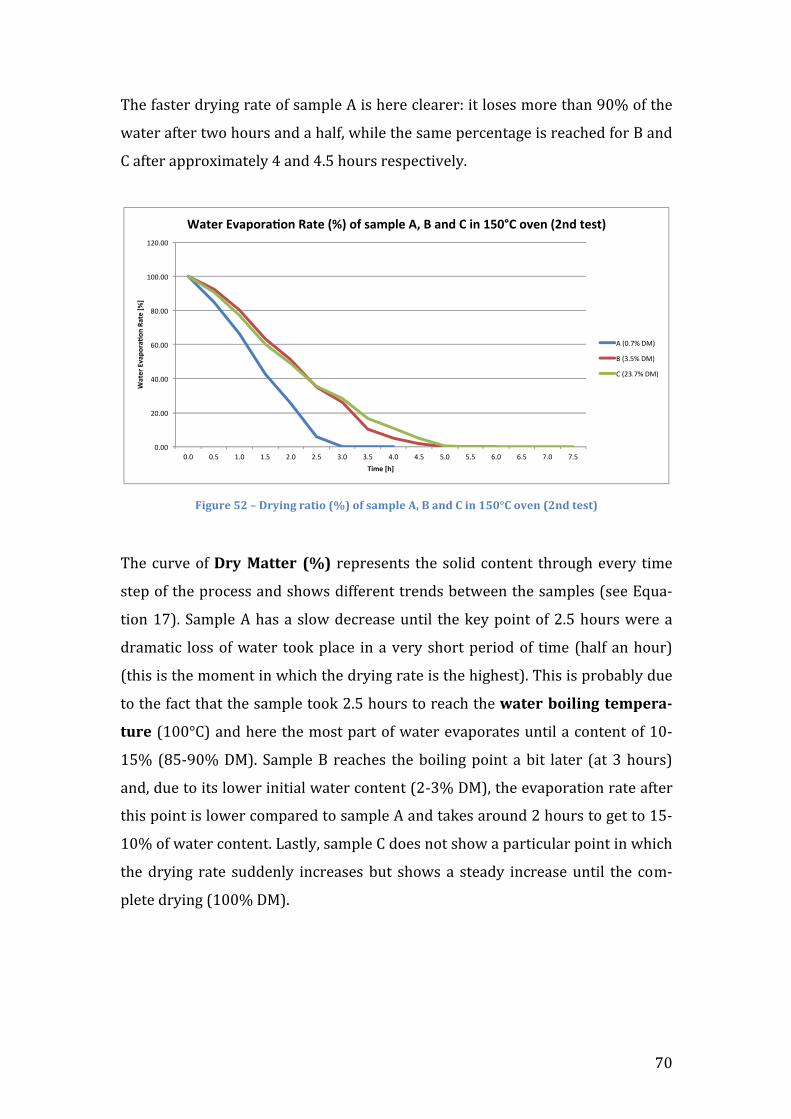
! OL!
RB&!D(.%&'!0'8)$1!'(%&!*D!.(3@+&!Q!).!B&'&!6+&('&'c!)%!+*.&.!3*'&!%B($!NLd!*D!%B&!
H(%&'!(D%&'!%H*!B*='.!($0!(!B(+Da!HB)+&!%B&!.(3&!@&'6&$%(1&!).!'&(6B&0!D*'!]!($0!
7!(D%&'!(@@'*e)3(%&+8!M!($0!MCZ!B*='.!'&.@&6%)<&+8C!
!
*
G-.5#"*K<*M*O#4-(.*#'+-%*W]X*%$*,'&71"*9e*C*'(0*H*-(*>K=lH*%8"(*W<(0*+",+X*
!
RB&!6='<&!*D!O#4*T'++"#* W]X! '&@'&.&$%.! %B&!.*+)0!6*$%&$%! %B'*=1B!&<&'8! %)3&!
.%&@!*D!%B&!@'*6&..!($0!.B*H.!0)DD&'&$%!%'&$0.!>&%H&&$!%B&!.(3@+&.!9.&&!;b=(\
%)*$!"O:C!5(3@+&!Q!B(.!(!.+*H!0&6'&(.&!=$%)+! %B&!_&8!@*)$%!*D!PCZ!B*='.!H&'&!(!
0'(3(%)6! +*..!*D!H(%&'! %**_!@+(6&! )$!(!<&'8!.B*'%!@&')*0!*D! %)3&! 9B(+D!($!B*=':!
9%B).!).!%B&!3*3&$%!)$!HB)6B!%B&!0'8)$1!'(%&!).!%B&!B)1B&.%:C!RB).!).!@'*>(>+8!0=&!
%*!%B&!D(6%!%B(%!%B&!.(3@+&!%**_!PCZ!B*='.!%*!'&(6B!%B&!\'+"#*/%-1-(.* +"&7"#'3
+5#"! 9"LLp7:!($0!B&'&!%B&!3*.%!@('%!*D!H(%&'!&<(@*'(%&.!=$%)+!(!6*$%&$%!*D!"L\
"Zd!9JZ\NLd!?-:C! 5(3@+&!]! '&(6B&.! %B&!>*)+)$1!@*)$%! (!>)%! +(%&'! 9(%!K!B*='.:!
($0a!0=&!%*!)%.!+*H&'!)$)%)(+!H(%&'!6*$%&$%!9P\Kd!?-:a!%B&!&<(@*'(%)*$!'(%&!(D%&'!
%B).!@*)$%!).!+*H&'!6*3@('&0!%*!.(3@+&!Q!($0!%(_&.!('*=$0!P!B*='.!%*!1&%!%*!"Z\
"Ld!*D!H(%&'!6*$%&$%C!T(.%+8a!.(3@+&!7!0*&.!$*%!.B*H!(!@('%)6=+('!@*)$%!)$!HB)6B!
%B&!0'8)$1! '(%&! .=00&$+8! )$6'&(.&.!>=%! .B*H.! (! .%&(08! )$6'&(.&!=$%)+! %B&! 6*3\
@+&%&!0'8)$1!9"LLd!?-:C!
!"!!#
$!"!!#
%!"!!#
&!"!!#
'!"!!#
(!!"!!#
($!"!!#
!"!# !")# ("!# (")# $"!# $")# *"!# *")# %"!# %")# )"!# )")# &"!# &")# +"!# +")#
!"#
$%&'
(")*
%"+*
,&-"
#$&./
0&
123$&.40&
!"#$%&'(")*%"+*,&-"#$&5/6&*7&8"3)9$&:;&<&",=&>&2,&?@AB>&*($,&5C,=&#$8#6&
,#-!"+.#/01#
2#-*").#/01#
3#-$*"+.#/01#
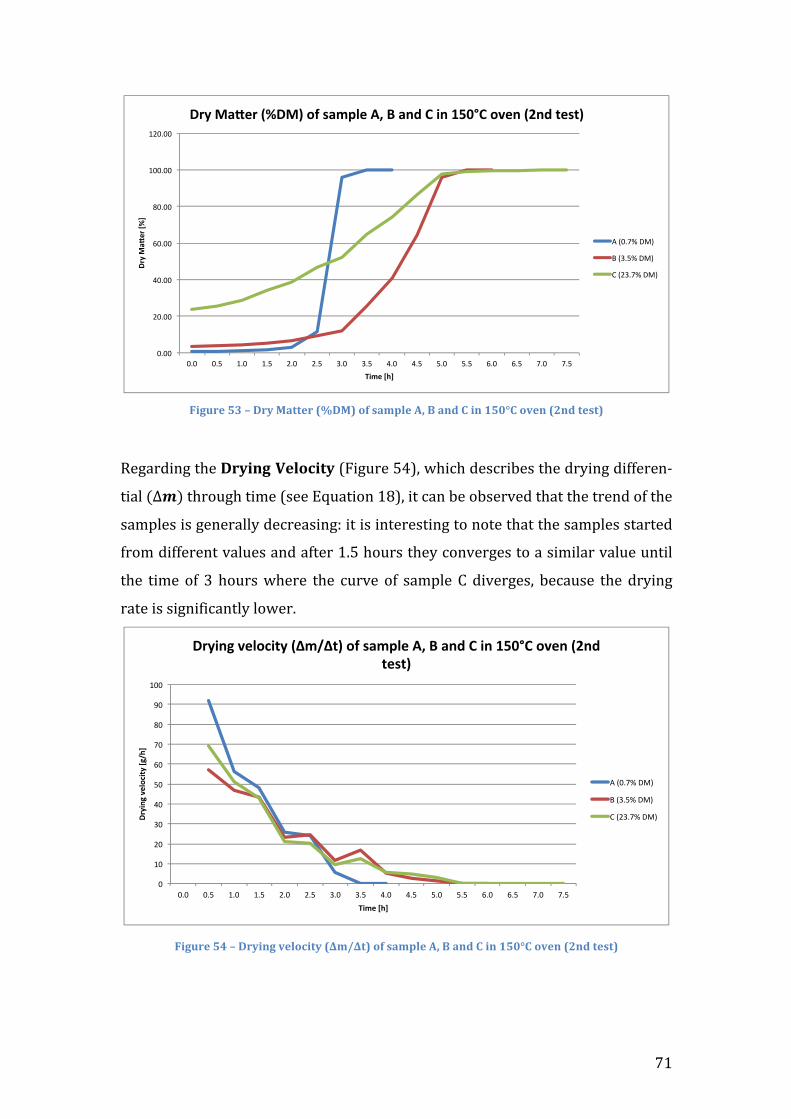
! O"!
!G-.5#"*K?*M*O#4*T'++"#*W]OTX*%$*,'&71"*9e*C*'(0*H*-(*>K=lH*%8"(*W<(0*+",+X*
!
S&1('0)$1!%B&!O#4-(.*V"1%)-+4!9A)1='&!ZM:a!HB)6B!0&.6')>&.!%B&!0'8)$1!0)DD&'&$\
%)(+!!!!!!%B'*=1B!%)3&!9.&&!;b=(%)*$!"J:a!)%!6($!>&!*>.&'<&0!%B(%!%B&!%'&$0!*D!%B&!
.(3@+&.!).!1&$&'(++8!0&6'&(.)$1c!)%!).!)$%&'&.%)$1!%*!$*%&!%B(%!%B&!.(3@+&.!.%('%&0!
D'*3!0)DD&'&$%!<(+=&.!($0!(D%&'!"CZ!B*='.!%B&8!6*$<&'1&.!%*!(!.)3)+('!<(+=&!=$%)+!
%B&! %)3&! *D! K! B*='.!HB&'&! %B&! 6='<&! *D! .(3@+&! 7! 0)<&'1&.a! >&6(=.&! %B&! 0'8)$1!
'(%&!).!.)1$)D)6($%+8!+*H&'C!
*
G-.5#"*KA*M*O#4-(.*8"1%)-+4*Wo&@o+X*%$*,'&71"*9e*C*'(0*H*-(*>K=lH*%8"(*W<(0*+",+X*
!
!"!!#
$!"!!#
%!"!!#
&!"!!#
'!"!!#
(!!"!!#
($!"!!#
!"!# !")# ("!# (")# $"!# $")# *"!# *")# %"!# %")# )"!# )")# &"!# &")# +"!# +")#
!"#$%&'
("$)*
+$
,-.($)/+$
!"#$%&'("$0*!%1$23$4&.56($78$9$&:;$<$-:$=>?@<$2A(:$0B:;$C(4C1$
,#-!"+.#/01#
2#-*").#/01#
3#-$*"+.#/01#
!"
#!"
$!"
%!"
&!"
'!"
(!"
)!"
*!"
+!"
#!!"
!,!" !,'" #,!" #,'" $,!" $,'" %,!" %,'" &,!" &,'" ',!" ','" (,!" (,'" ),!" ),'"
!"#$
%&'(
)*+,
$-#'.&
/01'
2$3)'.01'
!"#$%&'()*+,$-#'453/5-6'+7'893:*)';<'='9%>'?'$%'@ABC?'+()%'4D%>'-)8-6'
-".!,)/"012"
3".%,'/"012"
4".$%,)/"012"
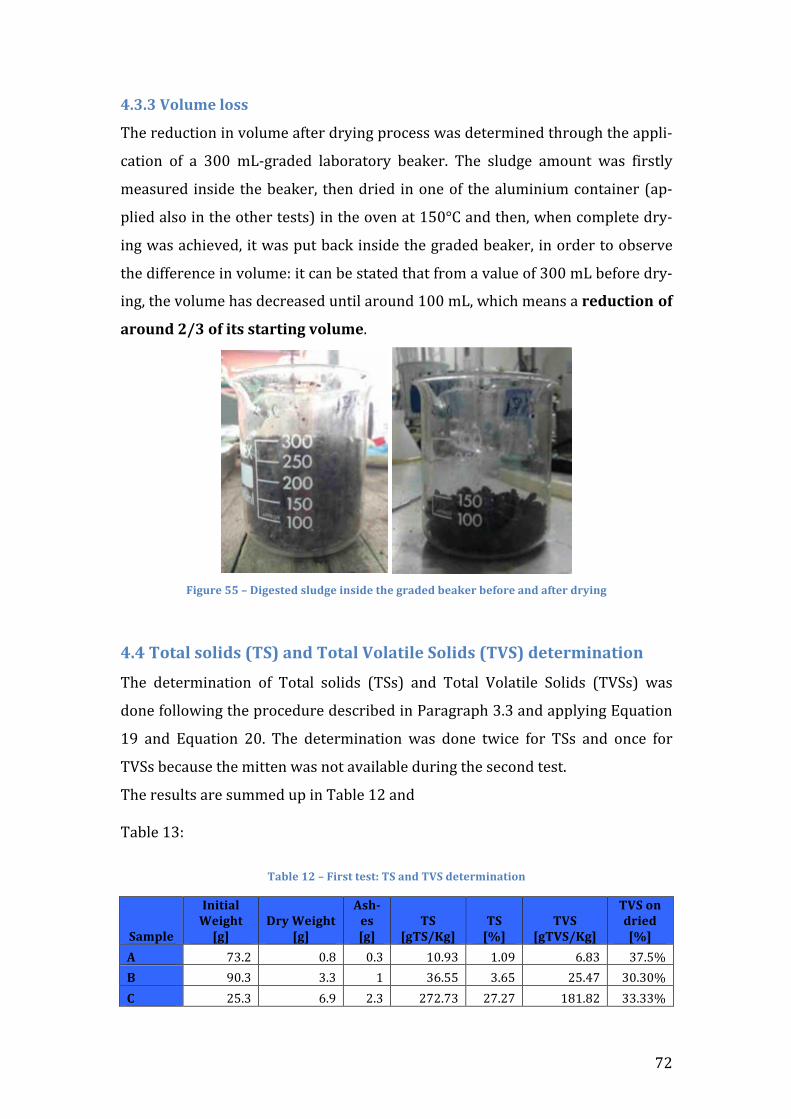
! OP!
AR?R?*V%15&"*1%,,*
RB&!'&0=6%)*$!)$!<*+=3&!(D%&'!0'8)$1!@'*6&..!H(.!0&%&'3)$&0!%B'*=1B!%B&!(@@+)\
6(%)*$! *D! (! KLL! 3T\1'(0&0! +(>*'(%*'8! >&(_&'C! RB&! .+=01&! (3*=$%! H(.! D)'.%+8!
3&(.='&0! )$.)0&! %B&!>&(_&'a! %B&$!0')&0! )$!*$&!*D! %B&!(+=3)$)=3!6*$%()$&'!9(@\
@+)&0!(+.*!)$!%B&!*%B&'!%&.%.:!)$!%B&!*<&$!(%!"ZLp7!($0!%B&$a!HB&$!6*3@+&%&!0'8\
)$1!H(.!(6B)&<&0a!)%!H(.!@=%!>(6_!)$.)0&!%B&!1'(0&0!>&(_&'a!)$!*'0&'!%*!*>.&'<&!
%B&!0)DD&'&$6&!)$!<*+=3&c!)%!6($!>&!.%(%&0!%B(%!D'*3!(!<(+=&!*D!KLL!3T!>&D*'&!0'8\
)$1a!%B&!<*+=3&!B(.!0&6'&(.&0!=$%)+!('*=$0!"LL!3Ta!HB)6B!3&($.!(!#"05)+-%(*%$*
'#%5(0*<@?*%$*-+,*,+'#+-(.*8%15&"C!
! !G-.5#"*KK*M*O-.",+"0*,150."*-(,-0"*+2"*.#'0"0*/"'`"#*/"$%#"*'(0*'$+"#*0#4-(.*
!
ARA*B%+'1*,%1-0,*WB6X*'(0*B%+'1*V%1'+-1"*6%1-0,*WBV6X*0"+"#&-('+-%(*
RB&! 0&%&'3)$(%)*$! *D! R*%(+! .*+)0.! 9R5.:! ($0! R*%(+! [*+(%)+&! 5*+)0.! 9R[5.:! H(.!
0*$&!D*++*H)$1!%B&!@'*6&0='&!0&.6')>&0!)$!2('(1'(@B!KCK!($0!(@@+8)$1!;b=(%)*$!
"N! ($0! ;b=(%)*$! PLC! RB&! 0&%&'3)$(%)*$! H(.! 0*$&! %H)6&! D*'! R5.! ($0! *$6&! D*'!
R[5.!>&6(=.&!%B&!3)%%&$!H(.!$*%!(<()+(>+&!0=')$1!%B&!.&6*$0!%&.%C!
RB&!'&.=+%.!('&!.=33&0!=@!)$!R(>+&!"P!($0!!!R(>+&!"Kc!!
B'/1"*><*M*G-#,+*+",+a*B6*'(0*BV6*0"+"#&-('+-%(*
6'&71"*
N(-+-'1*S"-.2+*
g.h*O#4*S"-.2+*
g.h*
9,23",*g.h*
B6*g]h*
BV6*[email protected]*
BV6*%(*0#-"0*g]h*
9* OKCP! LCJ! LCK! "LCNK! "CLN! YCJK! KOCZd!C* NLCK! KCK! "! KYCZZ! KCYZ! PZCMO! KLCKLd!H* PZCK! YCN! PCK! POPCOK! POCPO! "J"CJP! KKCKKd!
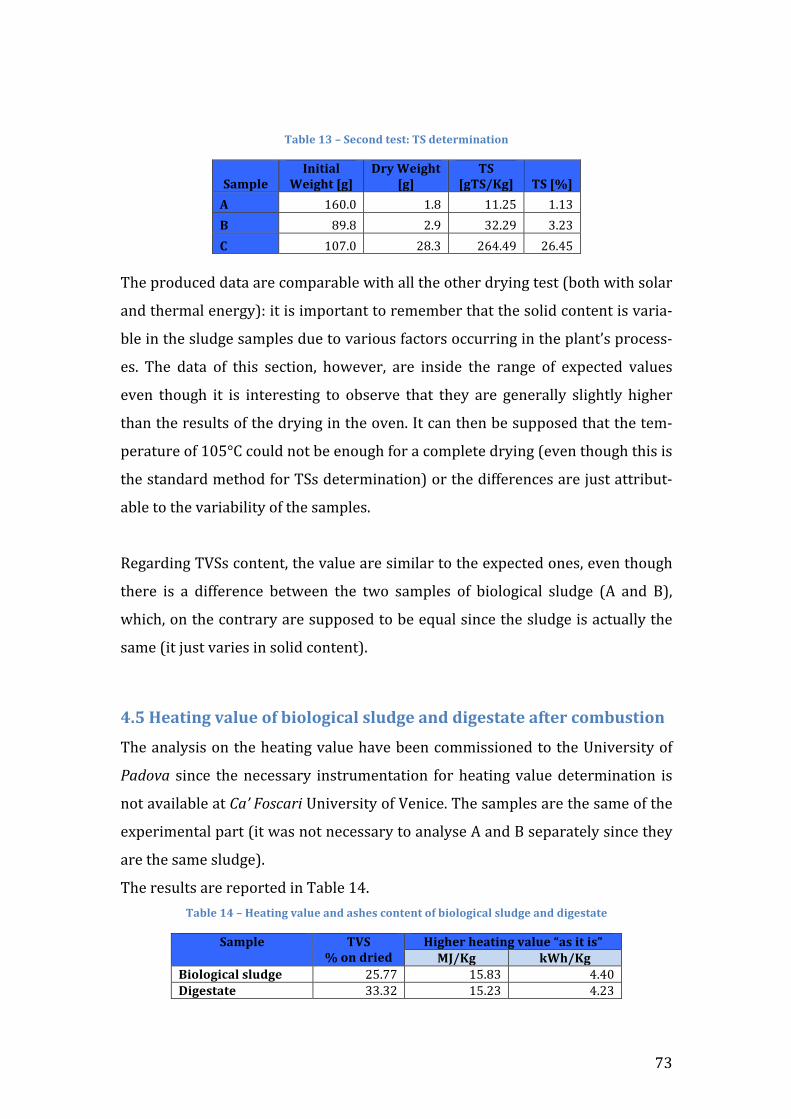
73
Table 13 – Second test: TS determination
Sample Initial
Weight [g] Dry Weight
[g] TS
[gTS/Kg] TS [%] A 160.0 1.8 11.25 1.13 B 89.8 2.9 32.29 3.23 C 107.0 28.3 264.49 26.45
The produced data are comparable with all the other drying test (both with solar
and thermal energy): it is important to remember that the solid content is varia-‐
ble in the sludge samples due to various factors occurring in the plant’s process-‐
es. The data of this section, however, are inside the range of expected values
even though it is interesting to observe that they are generally slightly higher
than the results of the drying in the oven. It can then be supposed that the tem-‐
perature of 105°C could not be enough for a complete drying (even though this is
the standard method for TSs determination) or the differences are just attribut-‐
able to the variability of the samples.
Regarding TVSs content, the value are similar to the expected ones, even though
there is a difference between the two samples of biological sludge (A and B),
which, on the contrary are supposed to be equal since the sludge is actually the
same (it just varies in solid content).
4.5 Heating value of biological sludge and digestate after combustion
The analysis on the heating value have been commissioned to the University of
Padova since the necessary instrumentation for heating value determination is
not available at Ca’ Foscari University of Venice. The samples are the same of the
experimental part (it was not necessary to analyse A and B separately since they
are the same sludge).
The results are reported in Table 14. Table 14 – Heating value and ashes content of biological sludge and digestate
Sample TVS % on dried
Higher heating value “as it is” MJ/Kg kWh/Kg
Biological sludge 25.77 15.83 4.40 Digestate 33.32 15.23 4.23
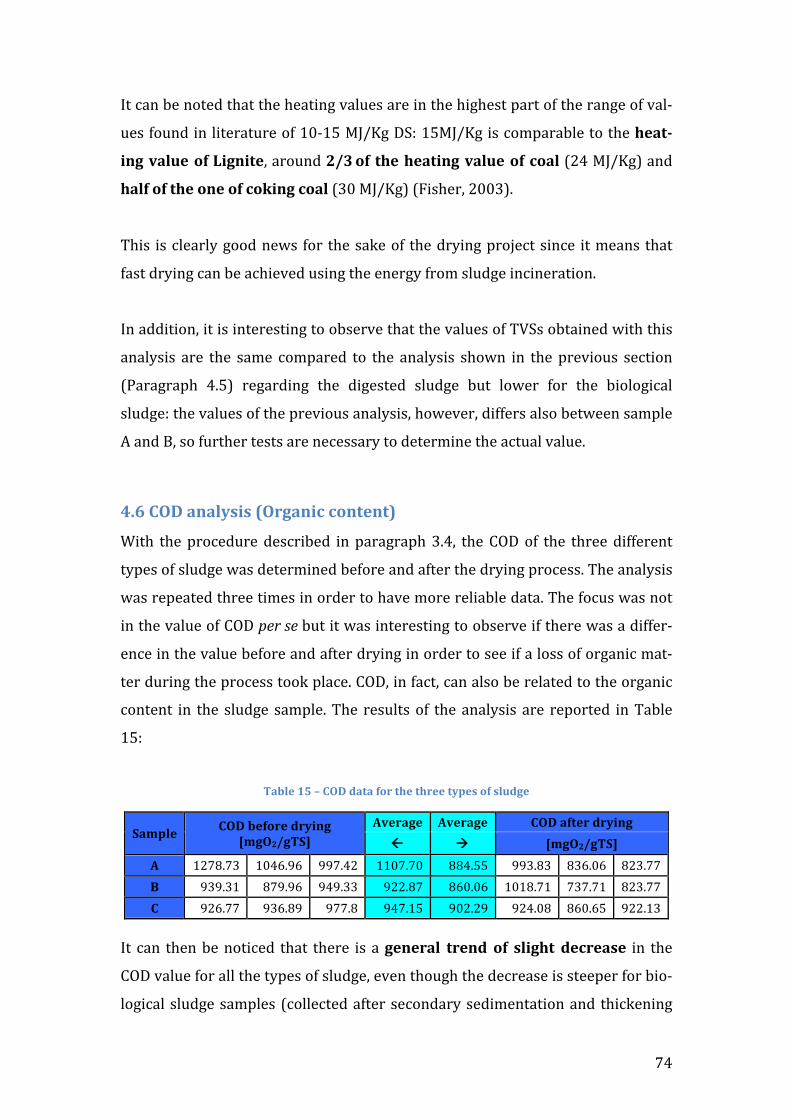
74
It can be noted that the heating values are in the highest part of the range of val-‐
ues found in literature of 10-‐15 MJ/Kg DS: 15MJ/Kg is comparable to the heat-‐
ing value of Lignite, around 2/3 of the heating value of coal (24 MJ/Kg) and
half of the one of coking coal (30 MJ/Kg) (Fisher, 2003).
This is clearly good news for the sake of the drying project since it means that
fast drying can be achieved using the energy from sludge incineration.
In addition, it is interesting to observe that the values of TVSs obtained with this
analysis are the same compared to the analysis shown in the previous section
(Paragraph 4.5) regarding the digested sludge but lower for the biological
sludge: the values of the previous analysis, however, differs also between sample
A and B, so further tests are necessary to determine the actual value.
4.6 COD analysis (Organic content)
With the procedure described in paragraph 3.4, the COD of the three different
types of sludge was determined before and after the drying process. The analysis
was repeated three times in order to have more reliable data. The focus was not
in the value of COD per se but it was interesting to observe if there was a differ-‐
ence in the value before and after drying in order to see if a loss of organic mat-‐
ter during the process took place. COD, in fact, can also be related to the organic
content in the sludge sample. The results of the analysis are reported in Table
15:
Table 15 – COD data for the three types of sludge
Sample COD before drying [mgO2/gTS]
Average Average COD after drying ß à [mgO2/gTS]
A 1278.73 1046.96 997.42 1107.70 884.55 993.83 836.06 823.77 B 939.31 879.96 949.33 922.87 860.06 1018.71 737.71 823.77 C 926.77 936.89 977.8 947.15 902.29 924.08 860.65 922.13
It can then be noticed that there is a general trend of slight decrease in the
COD value for all the types of sludge, even though the decrease is steeper for bio-‐
logical sludge samples (collected after secondary sedimentation and thickening
75
phase) than for the digestate. This is acceptable because, during anaerobic diges-‐
tion, the organic matter is partially consumed by the involved microorganisms.
It is, however, important to underline that there is a high variability of the meth-‐
od and a high uncertainty due to many possible errors (variable %DM of the
samples, different composition of the substances used in the titration, error of
the operator etc.) and the available data came from only three repetitions. Those
COD values have then to be taken as an indication about the difference before
and after drying of the sludge and not as a clear indication of the organic matter
quantity present in the sample.
4.7 Input and Output data of the Sludge drying system In this section, the expected input and output of the projected system for
sludge drying and burning will be calculated, in terms of matter and energy re-‐
quired. In addition, the efficiency of both the drying and burning portion of
the system will be determined. The calculations are based on the data coming
from the experimentation described in the previous sections, regarding the di-‐
gested sludge, since it was the one with the highest %DM (20-‐25%). The objec-‐
tive of this section is to give an idea of the effective capacity of the system for a
future marketing.
First of all, a 1000 tons/year is the amount of sludge that the entire system is
expected to treat, assumed to be a reasonable quantitative. The solid content of
the incoming sludge should be around 20% DM since this is the content general-‐
ly obtained after mechanical dewatering (belt or filter press). Future experimen-‐
tation should test also lower %DM of the entering sludge. The dimension of the
system are settled as the one of a standard container (about 6m x 2.5m x
2.5m), since the basic idea is to have a prototype the most modular possible for
a higher appeal in the market.
The solid content of the sludge exiting the drier and entering the burner is
settled to be 85% DM, within a time of around 3 hours, derived from the data
76
described previously (see Paragraph 4.2). The loss of volume was also observed
to be of around 2/3 of the initial volume (see Paragraph 4.2.1). Also in this case,
future experimentation should test lower %DM of the sludge exiting the drier: it
has to be determined which is the optimum value, since lowering the solid con-‐
tent of the sludge entering the burner would diminish its heating value but at the
same time that would mean a shorter period of time for the drying process. Low
% DM, anyway, can cause issues regarding the maintenance of the burner and for
the hazardous emissions into the atmosphere. It is important also to be aware
that the operating efficiency both of the drier and the burner can not be 100%
(Second Law of Thermodynamics – Carnot’s principle) so, an operating effi-‐
ciency of 75% for the drier and 85% for the burner is a good estimate (after a
research in the market and in the literature).
Finally, some other parameters have been settled:
-‐ a 15-‐day yearly inactivity, necessary for the system maintenance
-‐ A flow of the recirculating air of 6000 m3/h
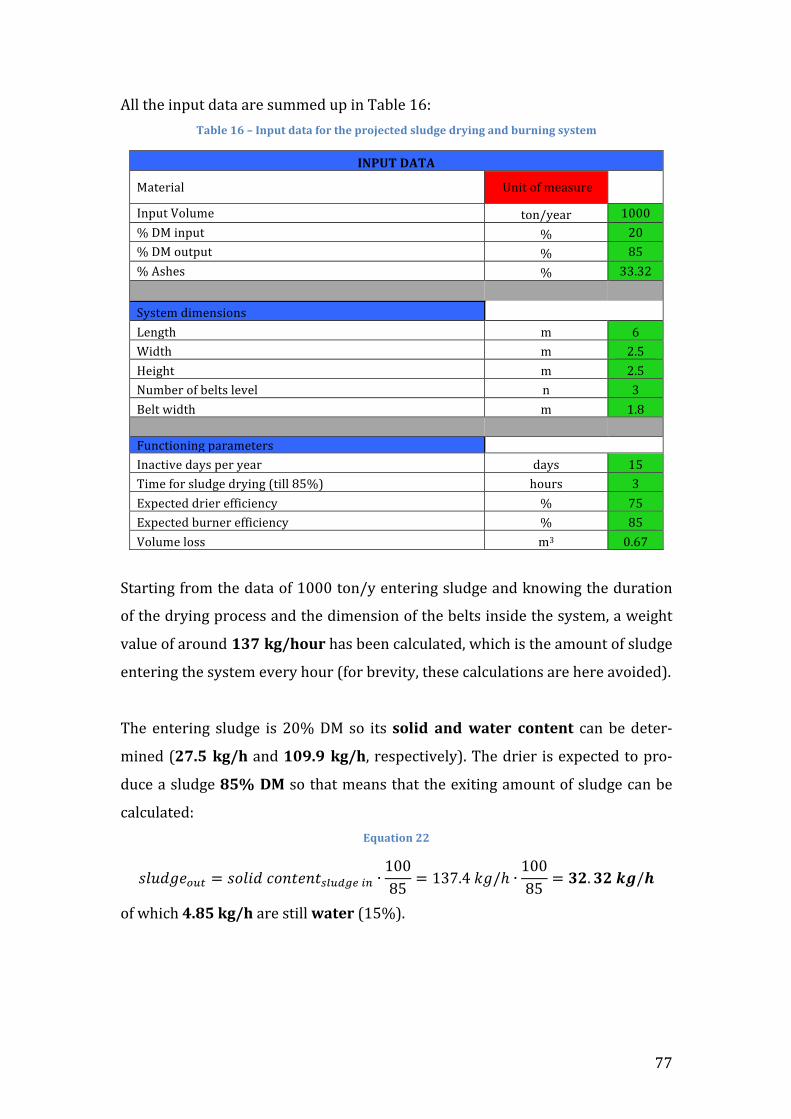
77
All the input data are summed up in Table 16: Table 16 – Input data for the projected sludge drying and burning system
INPUT DATA
Material Unit of measure
Input Volume ton/year 1000 % DM input % 20 % DM output % 85 % Ashes % 33.32
System dimensions
Length m 6 Width m 2.5 Height m 2.5 Number of belts level n 3 Belt width m 1.8
Functioning parameters
Inactive days per year days 15 Time for sludge drying (till 85%) hours 3 Expected drier efficiency % 75 Expected burner efficiency % 85 Volume loss m3 0.67
Starting from the data of 1000 ton/y entering sludge and knowing the duration
of the drying process and the dimension of the belts inside the system, a weight
value of around 137 kg/hour has been calculated, which is the amount of sludge
entering the system every hour (for brevity, these calculations are here avoided).
The entering sludge is 20% DM so its solid and water content can be deter-‐
mined (27.5 kg/h and 109.9 kg/h, respectively). The drier is expected to pro-‐
duce a sludge 85% DM so that means that the exiting amount of sludge can be
calculated: Equation 22
𝑠𝑙𝑢𝑑𝑔𝑒!"# = 𝑠𝑜𝑙𝑖𝑑 𝑐𝑜𝑛𝑡𝑒𝑛𝑡!"#$%& !" ∙10085 = 137.4 𝑘𝑔/ℎ ∙
10085 = 𝟑𝟐.𝟑𝟐 𝒌𝒈/𝒉
of which 4.85 kg/h are still water (15%).
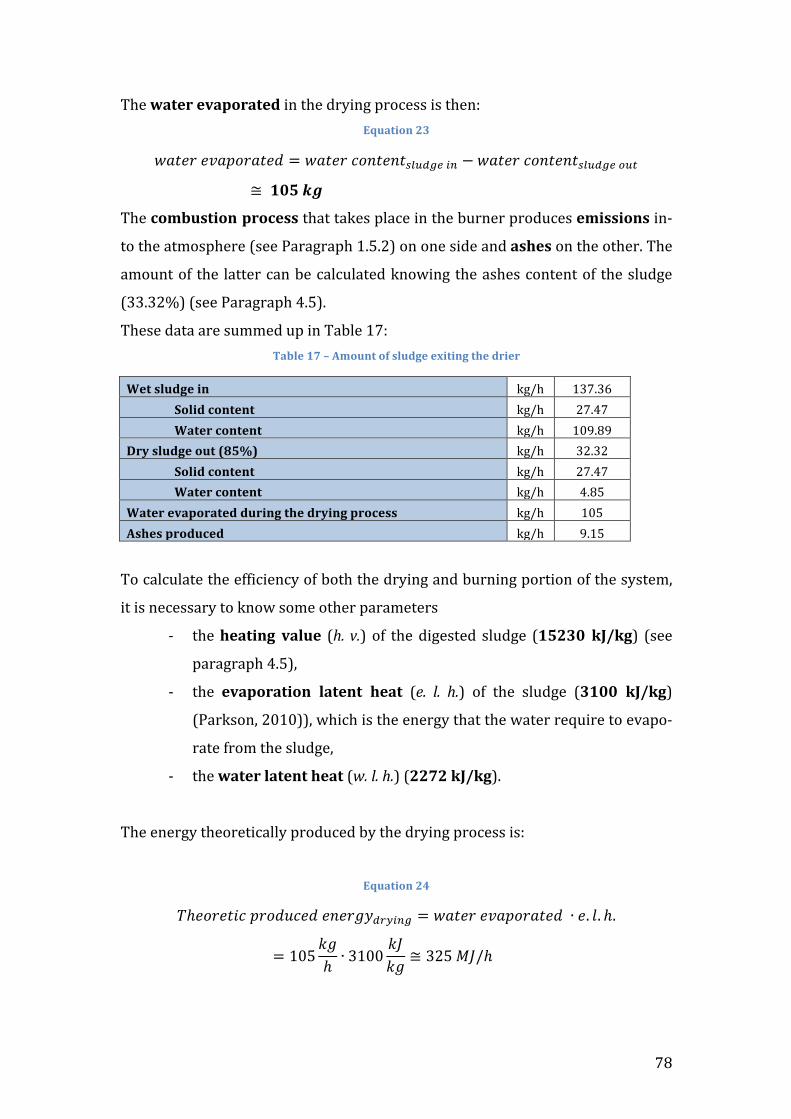
78
The water evaporated in the drying process is then: Equation 23
𝑤𝑎𝑡𝑒𝑟 𝑒𝑣𝑎𝑝𝑜𝑟𝑎𝑡𝑒𝑑 = 𝑤𝑎𝑡𝑒𝑟 𝑐𝑜𝑛𝑡𝑒𝑛𝑡!"#$%& !" − 𝑤𝑎𝑡𝑒𝑟 𝑐𝑜𝑛𝑡𝑒𝑛𝑡!"#$%& !"#
≅ 𝟏𝟎𝟓 𝒌𝒈
The combustion process that takes place in the burner produces emissions in-‐
to the atmosphere (see Paragraph 1.5.2) on one side and ashes on the other. The
amount of the latter can be calculated knowing the ashes content of the sludge
(33.32%) (see Paragraph 4.5).
These data are summed up in Table 17: Table 17 – Amount of sludge exiting the drier
Wet sludge in kg/h 137.36 Solid content kg/h 27.47 Water content kg/h 109.89
Dry sludge out (85%) kg/h 32.32 Solid content kg/h 27.47 Water content kg/h 4.85
Water evaporated during the drying process kg/h 105 Ashes produced kg/h 9.15
To calculate the efficiency of both the drying and burning portion of the system,
it is necessary to know some other parameters
-‐ the heating value (h. v.) of the digested sludge (15230 kJ/kg) (see
paragraph 4.5),
-‐ the evaporation latent heat (e. l. h.) of the sludge (3100 kJ/kg)
(Parkson, 2010)), which is the energy that the water require to evapo-‐
rate from the sludge,
-‐ the water latent heat (w. l. h.) (2272 kJ/kg).
The energy theoretically produced by the drying process is:
Equation 24
𝑇ℎ𝑒𝑜𝑟𝑒𝑡𝑖𝑐 𝑝𝑟𝑜𝑑𝑢𝑐𝑒𝑑 𝑒𝑛𝑒𝑟𝑔𝑦!"#$%& = 𝑤𝑎𝑡𝑒𝑟 𝑒𝑣𝑎𝑝𝑜𝑟𝑎𝑡𝑒𝑑 ∙ 𝑒. 𝑙. ℎ.
= 105𝑘𝑔ℎ ∙ 3100
𝑘𝐽𝑘𝑔 ≅ 325 𝑀𝐽/ℎ
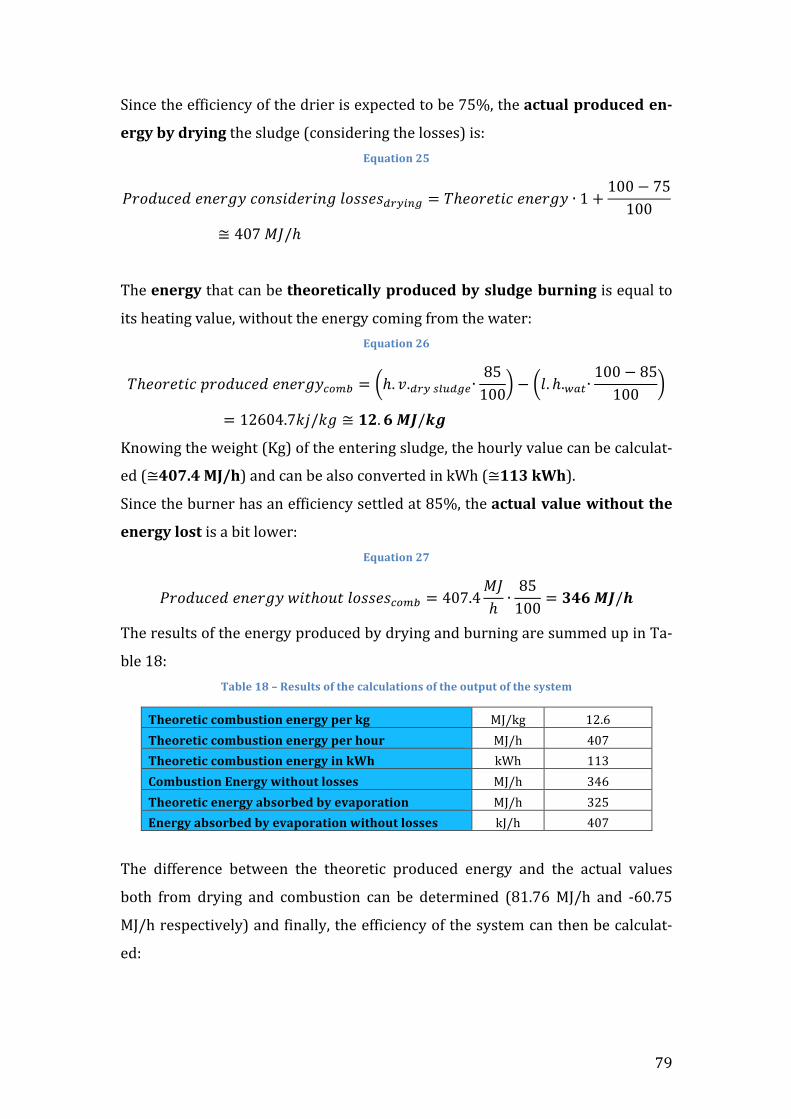
79
Since the efficiency of the drier is expected to be 75%, the actual produced en-‐
ergy by drying the sludge (considering the losses) is: Equation 25
𝑃𝑟𝑜𝑑𝑢𝑐𝑒𝑑 𝑒𝑛𝑒𝑟𝑔𝑦 𝑐𝑜𝑛𝑠𝑖𝑑𝑒𝑟𝑖𝑛𝑔 𝑙𝑜𝑠𝑠𝑒𝑠!"#$%& = 𝑇ℎ𝑒𝑜𝑟𝑒𝑡𝑖𝑐 𝑒𝑛𝑒𝑟𝑔𝑦 ∙ 1+100− 75100
≅ 407 𝑀𝐽/ℎ
The energy that can be theoretically produced by sludge burning is equal to
its heating value, without the energy coming from the water: Equation 26
𝑇ℎ𝑒𝑜𝑟𝑒𝑡𝑖𝑐 𝑝𝑟𝑜𝑑𝑢𝑐𝑒𝑑 𝑒𝑛𝑒𝑟𝑔𝑦!"#$ = ℎ. 𝑣.!"# !"#$%&∙85100 − 𝑙. ℎ.!"#∙
100− 85100
= 12604.7𝑘𝑗/𝑘𝑔 ≅ 𝟏𝟐.𝟔 𝑴𝑱/𝒌𝒈
Knowing the weight (Kg) of the entering sludge, the hourly value can be calculat-‐
ed (≅407.4 MJ/h) and can be also converted in kWh (≅113 kWh).
Since the burner has an efficiency settled at 85%, the actual value without the
energy lost is a bit lower: Equation 27
𝑃𝑟𝑜𝑑𝑢𝑐𝑒𝑑 𝑒𝑛𝑒𝑟𝑔𝑦 𝑤𝑖𝑡ℎ𝑜𝑢𝑡 𝑙𝑜𝑠𝑠𝑒𝑠!"#$ = 407.4𝑀𝐽ℎ ∙
85100 = 𝟑𝟒𝟔 𝑴𝑱/𝒉
The results of the energy produced by drying and burning are summed up in Ta-‐
ble 18: Table 18 – Results of the calculations of the output of the system
Theoretic combustion energy per kg MJ/kg 12.6 Theoretic combustion energy per hour MJ/h 407 Theoretic combustion energy in kWh kWh 113 Combustion Energy without losses MJ/h 346 Theoretic energy absorbed by evaporation MJ/h 325 Energy absorbed by evaporation without losses kJ/h 407
The difference between the theoretic produced energy and the actual values
both from drying and combustion can be determined (81.76 MJ/h and -‐60.75
MJ/h respectively) and finally, the efficiency of the system can then be calculat-‐
ed:
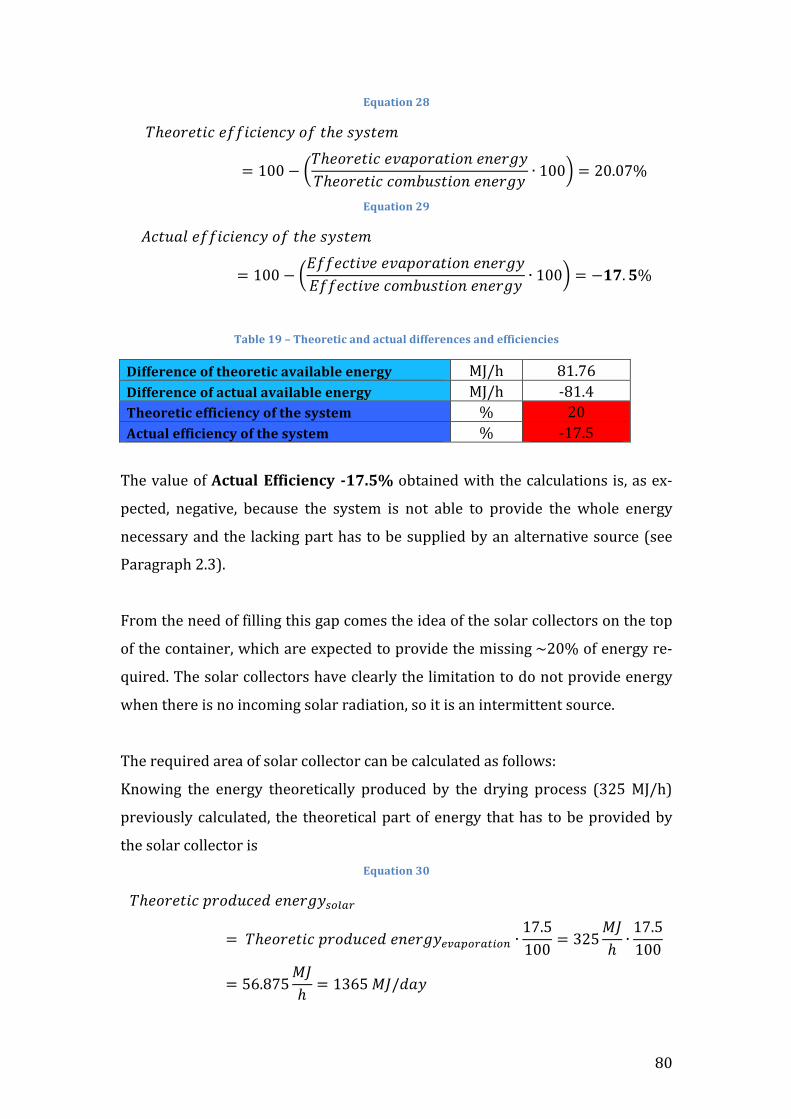
80
Equation 28
𝑇ℎ𝑒𝑜𝑟𝑒𝑡𝑖𝑐 𝑒𝑓𝑓𝑖𝑐𝑖𝑒𝑛𝑐𝑦 𝑜𝑓 𝑡ℎ𝑒 𝑠𝑦𝑠𝑡𝑒𝑚
= 100−𝑇ℎ𝑒𝑜𝑟𝑒𝑡𝑖𝑐 𝑒𝑣𝑎𝑝𝑜𝑟𝑎𝑡𝑖𝑜𝑛 𝑒𝑛𝑒𝑟𝑔𝑦𝑇ℎ𝑒𝑜𝑟𝑒𝑡𝑖𝑐 𝑐𝑜𝑚𝑏𝑢𝑠𝑡𝑖𝑜𝑛 𝑒𝑛𝑒𝑟𝑔𝑦 ∙ 100 = 20.07%
Equation 29
𝐴𝑐𝑡𝑢𝑎𝑙 𝑒𝑓𝑓𝑖𝑐𝑖𝑒𝑛𝑐𝑦 𝑜𝑓 𝑡ℎ𝑒 𝑠𝑦𝑠𝑡𝑒𝑚
= 100−𝐸𝑓𝑓𝑒𝑐𝑡𝑖𝑣𝑒 𝑒𝑣𝑎𝑝𝑜𝑟𝑎𝑡𝑖𝑜𝑛 𝑒𝑛𝑒𝑟𝑔𝑦𝐸𝑓𝑓𝑒𝑐𝑡𝑖𝑣𝑒 𝑐𝑜𝑚𝑏𝑢𝑠𝑡𝑖𝑜𝑛 𝑒𝑛𝑒𝑟𝑔𝑦 ∙ 100 = −𝟏𝟕.𝟓%
Table 19 – Theoretic and actual differences and efficiencies
Difference of theoretic available energy MJ/h 81.76 Difference of actual available energy MJ/h -‐81.4 Theoretic efficiency of the system % 20 Actual efficiency of the system % -‐17.5
The value of Actual Efficiency -‐17.5% obtained with the calculations is, as ex-‐
pected, negative, because the system is not able to provide the whole energy
necessary and the lacking part has to be supplied by an alternative source (see
Paragraph 2.3).
From the need of filling this gap comes the idea of the solar collectors on the top
of the container, which are expected to provide the missing ~20% of energy re-‐
quired. The solar collectors have clearly the limitation to do not provide energy
when there is no incoming solar radiation, so it is an intermittent source.
The required area of solar collector can be calculated as follows:
Knowing the energy theoretically produced by the drying process (325 MJ/h)
previously calculated, the theoretical part of energy that has to be provided by
the solar collector is Equation 30
𝑇ℎ𝑒𝑜𝑟𝑒𝑡𝑖𝑐 𝑝𝑟𝑜𝑑𝑢𝑐𝑒𝑑 𝑒𝑛𝑒𝑟𝑔𝑦!"#$%
= 𝑇ℎ𝑒𝑜𝑟𝑒𝑡𝑖𝑐 𝑝𝑟𝑜𝑑𝑢𝑐𝑒𝑑 𝑒𝑛𝑒𝑟𝑔𝑦!"#$%&#'(%) ∙17.5100 = 325
𝑀𝐽ℎ ∙
17.5100
= 56.875𝑀𝐽ℎ = 1365 𝑀𝐽/𝑑𝑎𝑦
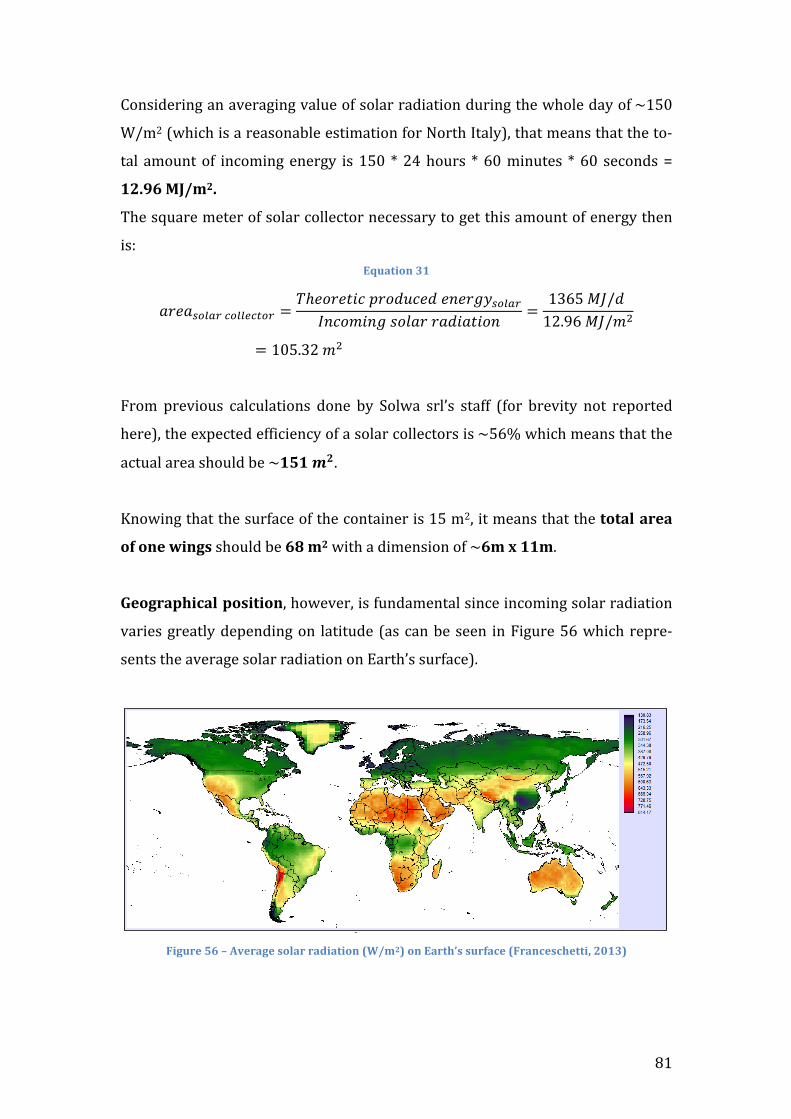
81
Considering an averaging value of solar radiation during the whole day of ~150
W/m2 (which is a reasonable estimation for North Italy), that means that the to-‐
tal amount of incoming energy is 150 * 24 hours * 60 minutes * 60 seconds =
12.96 MJ/m2.
The square meter of solar collector necessary to get this amount of energy then
is: Equation 31
𝑎𝑟𝑒𝑎!"#$% !"##$!%"& =𝑇ℎ𝑒𝑜𝑟𝑒𝑡𝑖𝑐 𝑝𝑟𝑜𝑑𝑢𝑐𝑒𝑑 𝑒𝑛𝑒𝑟𝑔𝑦!"#$%
𝐼𝑛𝑐𝑜𝑚𝑖𝑛𝑔 𝑠𝑜𝑙𝑎𝑟 𝑟𝑎𝑑𝑖𝑎𝑡𝑖𝑜𝑛 =1365 𝑀𝐽/𝑑 12.96 𝑀𝐽/𝑚!
= 105.32 𝑚!
From previous calculations done by Solwa srl’s staff (for brevity not reported
here), the expected efficiency of a solar collectors is ~56% which means that the
actual area should be ~𝟏𝟓𝟏 𝒎𝟐.
Knowing that the surface of the container is 15 m2, it means that the total area
of one wings should be 68 m2 with a dimension of ~6m x 11m.
Geographical position, however, is fundamental since incoming solar radiation
varies greatly depending on latitude (as can be seen in Figure 56 which repre-‐
sents the average solar radiation on Earth’s surface).
Figure 56 – Average solar radiation (W/m2) on Earth’s surface (Franceschetti, 2013)
- 93 -
Figura 27 – Radiazione solare media (W/km2) sulla superficie terrestre. Elaborazione raster (1 grado). APPLICAZIONE DEL MODELLO Secondo i dati sperimentali sin ora analizzati della serra solare, descritte nei paragrafi precedenti, si può affermare che la correlazione fra produzione di acqua depurata e la radiazione solare si esprime secondo la seguente equazione: Equazione 102 Qw,Ir= 2.5669*10-7*Irsun*3600*12 Con Qw corrispondente al quantitativo di acqua depurata (l/m2/giorno), mentre Irsun è la radiazione solare incidente (W/km2). RISULTATI Applicando l’Equazione 102, ne deriva che i valori di depurazione delle acque variano da 1.45 a 9.3 litri/m2/giorno (si veda Figura 28).
Figura 28 – Produzione giornaliera, calcolata a 12 ore, della serra solare in funzione della radiazione solare Dall’elaborazione dei dati della radiazione solare, con la produzione delle serre solari, si evince come vi sia una correlazione perfetta fra radiazione e portata dell’acqua depurata. Le aree con maggiore capacità depurativa risultano essere le zone ad elevata aridità (zone desertiche), lungo i due tropici in particolare, e sui crinali delle maggiori catene montuose del Pianeta. Quest’ultimo
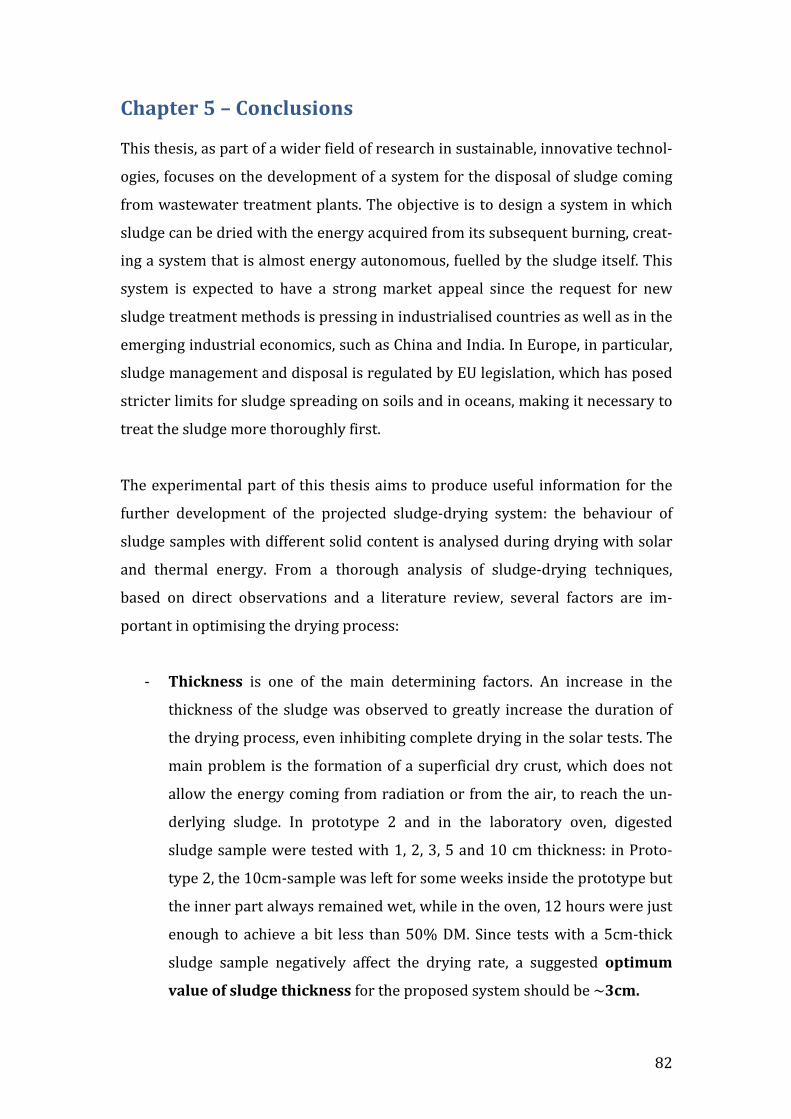
82
Chapter 5 – Conclusions This thesis, as part of a wider field of research in sustainable, innovative technol-‐
ogies, focuses on the development of a system for the disposal of sludge coming
from wastewater treatment plants. The objective is to design a system in which
sludge can be dried with the energy acquired from its subsequent burning, creat-‐
ing a system that is almost energy autonomous, fuelled by the sludge itself. This
system is expected to have a strong market appeal since the request for new
sludge treatment methods is pressing in industrialised countries as well as in the
emerging industrial economics, such as China and India. In Europe, in particular,
sludge management and disposal is regulated by EU legislation, which has posed
stricter limits for sludge spreading on soils and in oceans, making it necessary to
treat the sludge more thoroughly first.
The experimental part of this thesis aims to produce useful information for the
further development of the projected sludge-‐drying system: the behaviour of
sludge samples with different solid content is analysed during drying with solar
and thermal energy. From a thorough analysis of sludge-‐drying techniques,
based on direct observations and a literature review, several factors are im-‐
portant in optimising the drying process:
-‐ Thickness is one of the main determining factors. An increase in the
thickness of the sludge was observed to greatly increase the duration of
the drying process, even inhibiting complete drying in the solar tests. The
main problem is the formation of a superficial dry crust, which does not
allow the energy coming from radiation or from the air, to reach the un-‐
derlying sludge. In prototype 2 and in the laboratory oven, digested
sludge sample were tested with 1, 2, 3, 5 and 10 cm thickness: in Proto-‐
type 2, the 10cm-‐sample was left for some weeks inside the prototype but
the inner part always remained wet, while in the oven, 12 hours were just
enough to achieve a bit less than 50% DM. Since tests with a 5cm-‐thick
sludge sample negatively affect the drying rate, a suggested optimum
value of sludge thickness for the proposed system should be ~3cm.
83
-‐ Surface area is directly related to the thickness. It is clear that, during the
solar-‐drying tests, a wider surface absorbed more direct solar radiation in
Prototype 1 and more heat from the hot air in Prototype 2. Inside the la-‐
boratory oven, a test was also made with a container with a narrow open-‐
ing (a flask): it was noted that the evaporation process was not expedited
by this factor. These observations can be useful in determining the opti-‐
mal number of levels of the conveyor belt, carrying the sludge, in the pro-‐
jected system: a number between 3 and 5 levels seems to be the best
possibility.
-‐ Container’s material: the material of the container (in the case of the
proposed system, the conveyor belt) is very important because it is in di-‐
rect contact with the sludge, which means that some heat can be trans-‐
ferred through conduction. It was observed that the aluminium contain-‐
ers enhanced the thermal drying process. The optimal material of the
conveyor belt is, in fact, projected to be a metallic grid.
-‐ Solid content: the tested samples with different %DM show various be-‐
haviours. In general, for the same amount of energy received, the samples
with 0.5-‐3% DM lost water a bit faster in the initial phase than the more
solid samples (20% DM) (excluding the samples that were filtered in Pro-‐
totype 2 which are not comparable). This is more evident in the thermal
drying process, where the drying rate is inversely proportional to the %
DM. Different values of %DM must be tested inside the projected system
during a future research phase: the current hypothesis is to use the sys-‐
tem for sludge coming out of a mechanical dewatering process (20-‐25%
DM) and to dry the sludge to 85% DM before using it in the incinerator.
Liquid sludge that is not dewatered (1-‐3% DM) could also be used if, for
example, transpiring membranes were applied to the conveyor belt, al-‐
lowing the water vapour to pass through but holding the sludge particles
in place.
84
What can be deduced from the experiments with solar energy (which, in the
proposed system, is supposed to cover approximately 1/5 of the drying pro-‐
cess), is that the drying capacity is generally good in terms of both velocity
and rate: for a 20% DM-‐sludge sample, on average 7.5-‐10.5 g/h of water can be
removed at a rate of 3-‐7 g/MJ (depending on the prototypes). For liquid sludge
samples (with 0.5-‐3% DM), ~14 g/h of water can be extracted in 11-‐14 hours
with a rate of 6-‐8 g/MJ, but a filtering system (applied in Prototype 2) should be
considered, as it dramatically decreases the dewatering time (achieving a drying
velocity of ~67 g/h with a rate of ~38 g/MJ).
The necessary solar radiation averages ~𝟐𝟎 MJ, absorbed in 10-‐15 hours, but
varies greatly depending on weather conditions. An important consideration for
the solar drying experiment part is that the period of testing was from October to
November, when the weather was not particularly favourable for this type of
system testing: solar radiation is not very intense and there are fewer hours of
light compared to summer. Clouds and mist are also important factors: they
drastically reduce the amount of incoming radiation, causing variable efficiency
throughout the day (with mist high values of humidity are observed, which re-‐
duce the evaporation rate). Despite the inclement weather, the data obtained
remains significant, because the drying rate can be related to the actual solar ra-‐
diation: the ratios can be projected for higher levels of radiation.
Thermal drying (at 150°C) shows, as expected, better performance in terms
of drying velocity (with values between ~87 g/h to ~50 g/h) and duration of
the drying process (complete drying was achieved in 3.5, 5.5 and 7.5 hours,
from the sample with the lowest % DM to the one with the highest). For the liq-‐
uid sample ~𝟗𝟎% drying is observed after just 2.5 hours, which makes the hy-‐
pothesis of applying it in the system more valid (in combination with a filtering
system). Higher temperatures (200-‐250°C), however, must be tested in a future
research phase.
An analysis of the expected input and output of the innovative system has also
been performed: an incoming amount of ~140 kg/h of 20% DM-‐sludge (calcu-‐
85
lated by Solwa’s staff starting from an estimated value of 1000 ton/y) is expected
to produce ~10 kg/h of ashes to dispose of, which means a reduction of mass
of approximately 14 times (~93% of the initial weight).
The theoretical and actual energy, required for evaporation and provided by
combustion, of 140 kg/h of sludge and consequently the theoretic and actual ef-‐
ficiency of the system have also been calculated: on one hand the theoretical ef-‐
ficiency is 20% and on the other hand, considering an operating efficiency of
~75% for the drier and ~85% for the burner, the actual efficiency of the
system is, as expected, negative (-‐17.5%), if only energy from sludge burning is
considered: this deficit of energy must be covered by another source, which in
this project, is solar collectors, but it is also possible to apply traditional
sources, such as burning fossil fuel.
The surface area of the solar collectors, optimised for a latitude comparable to
the one of North Italy (150 W/m2 on a yearly average during 24 hours), have
been calculated to be ~𝟏𝟓𝟏 m2: given the dimensions of the container (6m x
2.5m x 2.5m), the surface of which has to be covered, two wings of ~𝟔m x 11 m
each should be added. Their length should clearly be significantly lower if the
system is located in areas with higher incoming solar radiation. Geographic po-‐
sition is, in fact, a determining factor, since incoming solar radiation varies
greatly depending on latitude (see Figure 56).
Some other boundary analyses were done: TS and TVS values are useful to see
how the results of solar and thermal testing are comparable with the standard
methods of classification, normally done in the laboratory of a wastewater
treatment plant; COD values, before and after the drying process, have shown
that the loss of organic matter seems to be not very significant, considered also
that the dry sludge shows a high heating value (~15 MJ/kg).
To conclude, the project seems to be valid and with high potential, in particular
because it is a modular system that can be located very close to (if not inside)
the treatment plant; the main strengths are the high efficiency and the great
86
volume reduction of the sludge waste, which means high cost savings in
transport and disposal for the plant’s owner. Further research, however, is
required, in particular regarding the incineration phase: an analysis of the
emissions into the atmosphere is compulsory for the next research phase, in or-‐
der to see if they meet the requirements outlined by EU legislation. In addition,
the dimensions and typology of the burner, which is part of the project, should
be determined, in order to complete the design of the system.
87
Bibliography Chai, L. H. (2007). Statistical dynamic features of sludge drying systems. International Journal of Thermal Sciences , 46, pp. 802-‐811. Deng, W.-‐Y., Yan, J.-‐H., Li, X.-‐D., Wang, F., Zhu, X.-‐W., Lu, S.-‐Y. (2009). Emission characteristics of volatile compounds during sludges drying process. Journal of Hazardous Materials, 162, pp. 186-‐192. EC. (2014a). Sewage sludge. Retrieved February 22, 2015 from Official website of the European Commission: http://ec.europa.eu/environment/waste/framework/ EC. (2014b). Directive 2008/98/EC on waste (Waste Framework Directive). Retrieved December 13, 2014 from Official Website of the European Commission: http://ec.europa.eu/environment/waste/sludge/ Fisher, J. (2003). Energy Density of Coal. Retrieved January 7, 2015 from The Physics factbook: http://hypertextbook.com/facts/2003/JuliyaFisher.shtml Flaga, A. (2009, October 26-‐28). Sludge drying. Lviv, Ukraine: E. Plaza & E. Levlin. Franceschetti, P. (2013). Energie rinnovabili e microgenerazione distribuita -‐ Serra solare ad evaporazione (Tesi di dottorato). Ca' Foscari University of Venice, Dipartimento di Scienze Ambientali, Informatica e Statistica, Venice. Franceschetti, P., Gonella, F. (2012). New Solar Still with the Suction of Wet Air: A Solution in Isolated Areas. Journal of Fundamentals of Renewable Energy and Applications , 5. Franceschetti, P., Gonella, F., Pavan, P. (2014). Drywa – Sludge Dryer with hot air and dry sludge combustion. pp. 1-‐8. Fytili, D., Zabaniotou, A. (2008). Utilization of sewage sludge in EU application of old and new methods: a review. Renewable & Sustainable Energy Review , 12, pp. 116-‐140. Gálvez, A., Conesa, J., Martín-‐Gullón, I., & Font, R. (2007). Interaction between pollutants produced in sewage sludge combustion and cement raw material. Chemosphere , 69, pp. 387-‐394. IBW (2009). IBW -‐ Department of Industrial Biological Science. Retrieved January 11, 2015 from http://www.enbichem.ugent.be: http://www.enbichem.ugent.be/sites/default/files/images/Watertechnology.pdf
88
ISTAT. (2005). ISTAT -‐ Istituto Nazionale di Statistica. Retrieved February 19, 2015 from Statistiche Ambientali -‐ Ambiente e Territorio: http://www3.istat.it/dati/catalogo/20051114_00/ann0508statistiche_ambientali.pdf Kelessidis, A., Stasinakis, A. S. (2012). Comparative study of the methods used for treatment and final disposal of sewage sludge in European countries . Waste Management , 32, pp. 1186–1195. Lederer, J., Rechberger, H. (2010). Comparative goal-‐oriented assessment of conventional and alternative sewage sludge treatment options . Waste management , 30, pp. 1043-‐1056 . Lu, S., Yang, L., Zhou, F., Wang, F., Yan, J., Li, X. (2013). Atmospheric emission characterization of a novel sludge drying and co-‐combustion system . Journal of Environmental Sciences , 25, pp. 2088–2092 . Oikonomidis, I., Marinos, C. (2014). Solar sludge drying in Pafos wastewater treatment plant: operational experiences. Water Practice & Technology , 9, pp. 62-‐70. Parkson & KET (2010). Economical Conversion of Municipal Sludge (Biosolids) into a Renewable Energy Product using Solar Sludge Dryers. Ideas and Innovations. Mabiosoilid. Parkson. (2010). THERMO-‐SYSTEM® brochure. Retrieved February 3, 2015 from Parkson -‐ Treating Water Right: http://www.parkson.com/sites/default/files/documents/brochure_thermosystem_low_march_29_2011_0.pdf Ragazzi, M., Rada, E., Cocarta, D., Venturi, M., Mallocci, E., Bianchi, M. (2006). Combustione diretta e indiretta di fanghi. In R. M. Rada E.C., La valorizzazione energetica dei fanghi di depurazione (pp. 45-‐55). Trento: Università degli Studi di Trento. Regione del Veneto. (2011, September 6). Bollettino Ufficiale della Regione del Veneto (in versione telematica). Retrieved December 12, 2014 from http://bur.regione.veneto.it/: http://bur.regione.veneto.it/BurvServices/Pubblica/Download.aspx?name=1416_AllegatoA_234732.pdf&type=9&storico=False Reverdy, A. L., Dieudé-‐Fauvela, E., Ferstlerb, V., Baudeza, J. C. (2013). Anaerobic digestion of sewage sludge: overview of the French situation. Water Practice & Technology , 8 (2), pp. 180-‐189. Stehlik, P. (2009). Contribution to advances in waste-‐to-‐energy technologies . Journal of Cleaner Production , 17, pp. 919-‐931.
89
Stoddard, A., Harcum, J. B., Simpson, J. T., Pagenkopf, J. R., Bastian, R. K. (2003). Municipal Wastewater Treatment: Evaluating Improvements in National Water Quality. New York: John Wiley & Sons. Suh, Y., Rousseaux, P. (2002). An LCA of alternative wastewater sludge treatment scenarios. Resources, Conservation and Recycling , 35, pp. 191-‐200 . Turovskiy, I. S., Mathai, P. K. (2006). Wastewater Sludge Processing. Hoboken, USA: Wiley. Zemansky, M. W. (1968). Heat and Thermodynamics (Vol. 5th edition). New York: McGraw Hill.
90
Table of Figures Figure 1 – Basic flow diagram for conventional wastewater treatment plant ............................................... 8 Figure 2 – Gravitational thickener of Treviso WWTP ................................................................................................ 8 Figure 3 – The Anerobic digestion process (IBW, 2009) ........................................................................................... 9 Figure 4 – Centrifuge (from GOST – http://www.gost.it/) ................................................................................... 11 Figure 5 – Belt press (www.ersaf.lombardia.it) and filter press (Shangai QUILEE Environmental protection Equipment Co.) .................................................................................................................................................. 11 Figure 6 – Block scheme of the line system of WWTP in Treviso (Regione del Veneto, 2011) .............. 14 Figure 7 – Waste management hierarchy established by the Waste Framework Directive (EC, 2014a; EC, 2014b) ................................................................................................................................................................... 15 Figure 8 – Distribution of sludge drying plants in European countries (Kelessidis & Stasinakis, 2012) ......................................................................................................................................................................................................... 19 Figure 9 – A Solar sludge drying plant (Huber Technology – www.hubertec.it) ........................................ 19 Figure 10 – Thermal energy consumption comparison between gas-‐fired and solar dryer (Parkson & KET, 2010) .................................................................................................................................................................................. 21 Figure 11 – Heating Values of Sludge and Other Residuals (Turovskiy & Mathai, 2006) ....................... 22 Figure 12 – Advantages and Disadvantages of Incineration (Turovskiy & Mathai, 2006) ..................... 23 Figure 13 – Concentration of pollutants from sludge drying at 11% O2 emissions (Lu, et al., 2013) 24 Figure 14 – Concentration of the main components of flue gas (Lu, et al., 2013) ...................................... 25 Figure 15 – Emission rate of the four VCs detected in the drying process at 160°C (Deng, et al., 2009) ......................................................................................................................................................................................................... 27 Figure 16 – Solar still scheme and photograph (Solwa srl) .................................................................................. 28 Figure 17 – Food drying system: photograph of the prototype (on the left) and rendering (on the right) (Solwa srl) ..................................................................................................................................................................... 30 Figure 18 – Food-‐drying system: air fluxes (Solwa srl) .......................................................................................... 29 Figure 19 – Rendering of the DryWa system (Solwa srl) ....................................................................................... 31 Figure 20 – Sludge drying system: component scheme (Solwa srl) .................................................................. 33 Figure 21 – Crushing screw (Solwa srl) ......................................................................................................................... 34 Figure 22 – Conveyor belt (Solwa srl) ............................................................................................................................ 34 Figure 23 – Manpower required in the conventional solar-‐drying plants ..................................................... 36 Figure 24 – View from above (left) and inside (right) of a solar-‐drying plant ............................................ 36 Figure 25 – Drying performance comparison between Drywa (only solar sludge drying) and other solar greenhouses around the world (Solwa srl) in terms of tons per square meter that can be yearly treated (ton/m2/y) ................................................................................................................................................................. 37 Figure 26 – Psychrometric chart at atmospheric pressure (Patm = 1.013 bar), with on the x-‐axis the water mass and on the y-‐axis the temperature T (Mollier’s chart) ................................................................... 42 Figure 27– Sampling points at the secondary sedimentation tank (left) and after anaerobic digestion (center and right) ................................................................................................................................................ 47 Figure 28 – Temperature inside and outside the prototypes + Solar Radiation in Week 1 testing .... 50 Figure 29 – Relative Humidity inside and outside the prototypes in Week 1 testing ................................ 51 Figure 30 – Drying curves of sample A, B in P1 and C in P2 (Week 1) ............................................................. 51 Figure 31 – Testing in the Prototype 1 (left) and 2 (right) in week 2 .............................................................. 52 Figure 32 – Temperature inside and outside the prototypes + Solar Radiation (Week 2) ..................... 53 Figure 33 – Relative Humidity inside and outside the prototypes (Week 2) ................................................. 53 Figure 34 – Sample A dried in Prototype 1 .................................................................................................................. 53 Figure 35 – Drying curves of sample A, B and C in P1 during Week 2 ............................................................. 54 Figure 36– Sample B: wet (left), view inside P2 (center) and dry (right) in P2 ........................................... 54 Figure 37 – Drying curves of sample A, B and C in P2 during Week 2 ............................................................. 56 Figure 38 – Temperature inside and outside the prototypes + Solar Radiation (Week 3) ..................... 57 Figure 39 – Relative Humidity inside and outside the prototypes (Week 3) ................................................. 58 Figure 40 – Drying curves of sample A, B and C in P1 (Week 3a) ...................................................................... 58 Figure 41 – Drying curves of sample A, B and C in P1 (Week 3b) ...................................................................... 59 Figure 42 – Drying curves of sample A, B and C in P2 (Week 3) ......................................................................... 60 Figure 43 – Incoming and Outgoing Air Enthalpy inside the Solar Collectors of P2 (Week 2) ............. 63 Figure 44 – Exchanged thermal power of the air inside the Solar Collectors of P2 (Week 2) ............... 63 Figure 45 – Incoming and Outgoing Air Enthalpy inside the Solar Collectors of P2 (Week 3) ............. 64 Figure 46 – Exchanged thermal power of the air inside the Solar Collectors of P2 (Week 3) ............... 64
91
Figure 47 – Photographs of the samples (from left to right: sample B, C1 and C2) ................................... 65 Figure 48 – Curves of sludge drying at 150°C (1st Test) ......................................................................................... 67 Figure 49 – Photograph of the three samples after thermal drying ................................................................. 68 Figure 50 – Drying curves of sample A, B and C in 150°C oven (2nd test) ....................................................... 69 Figure 51 – Drying differential (Δm) of sample A, B and C in 150°C oven (2nd test) ................................ 69 Figure 52 – Drying ratio (%) of sample A, B and C in 150°C oven (2nd test) ............................................... 70 Figure 53 – Dry Matter (%DM) of sample A, B and C in 150°C oven (2nd test) ........................................... 71 Figure 54 – Drying velocity (Δm/Δt) of sample A, B and C in 150°C oven (2nd test) ................................ 71 Figure 55 – Digested sludge inside the graded beaker before and after drying .......................................... 72 Figure 56 – Average solar radiation (W/m2) on Earth’s surface (Franceschetti, 2013) ......................... 81 Table 1 – Process chain of the WWTP of Treviso (Regione del Veneto, 2011) ............................................. 13 Table 2 – ISTAT (2005) data for sludge amount in Italy ....................................................................................... 17 Table 3 – Comparison between emissions from drying and incineration (Ragazzi, et al., 2006) ........ 25 Table 4 – Results from week 1 in Prototype 1 and 2 (with ventilation off) ................................................... 52 Table 5 – Results of week 2 in Prototype 1 (with ventilation on) ...................................................................... 55 Table 6 – Results of week 2 in Prototype 2 (with ventilation on) ...................................................................... 56 Table 7 – Results of week 3 in Prototype 1 (with ventilation on) ...................................................................... 59 Table 8 – Results of week 3 in Prototype 2 (with ventilation on) ...................................................................... 60 Table 9 – Summary of the main results of solar experimentation (Week 2 and 3) .................................... 61 Table 10 – Results summary of thermal drying for sample A, B and C (1st Test) ........................................ 66 Table 11 – Results summary of thermal drying for sample A, B and C (2nd Test) ....................................... 68 Table 12 – First test: TS and TVS determination ....................................................................................................... 72 Table 13 – Second test: TS determination .................................................................................................................... 73 Table 14 – Heating value and ashes content of biological sludge and digestate ........................................ 73 Table 15 – COD data for the three types of sludge .................................................................................................... 74 Table 16 – Input data for the projected sludge drying and burning system ................................................. 77 Table 17 – Amount of sludge exiting the drier ........................................................................................................... 78 Table 18 – Results of the calculations of the output of the system .................................................................... 79 Table 19 – Theoretic and actual differences and efficiencies .............................................................................. 80