Embed Size (px)
Citation preview

Internationalization of U.S. Doctorate Education
John BoundUniversity of Michigan and NBER
Sarah TurnerUniversity of Virginia and NBER
Patrick WalshUniversity of Michigan
Research Question
• What explains the rise in the representation of foreign students among PhD recipients from U.S. universities?
• What determines the level and change in the distribution across countries in the number of U.S. doctorate recipients?
• What effect does the rise have on the U.S. and on foreign economies?
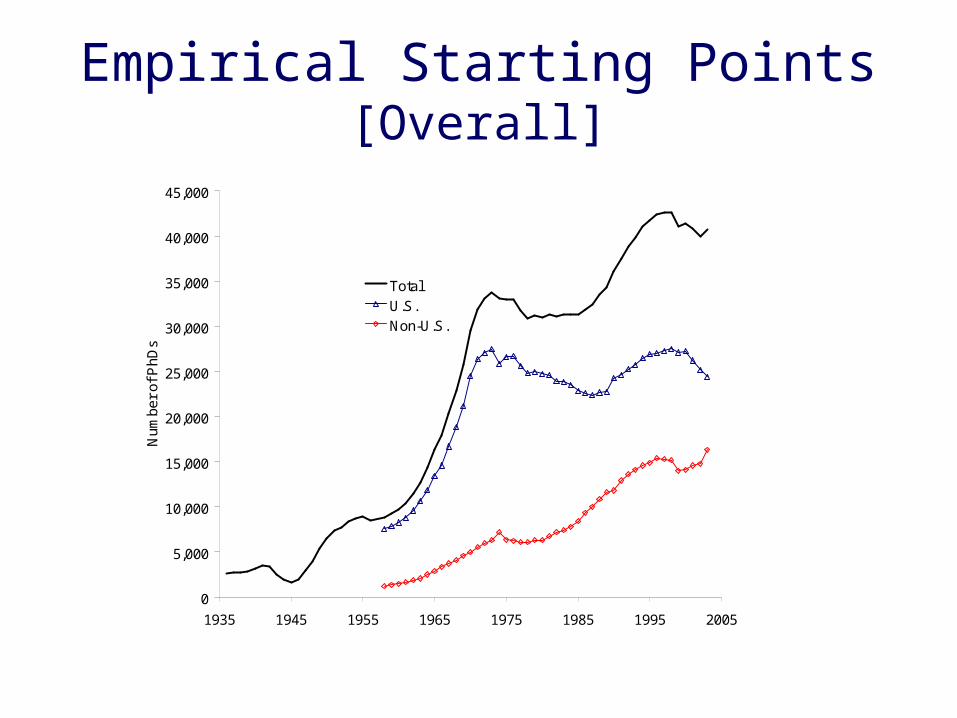
Empirical Starting Points[Overall]
0
5,000
10,000
15,000
20,000
25,000
30,000
35,000
40,000
45,000
1935 1945 1955 1965 1975 1985 1995 2005
Num
ber
of
PhD
s
Total
U.S.
Non-U.S.
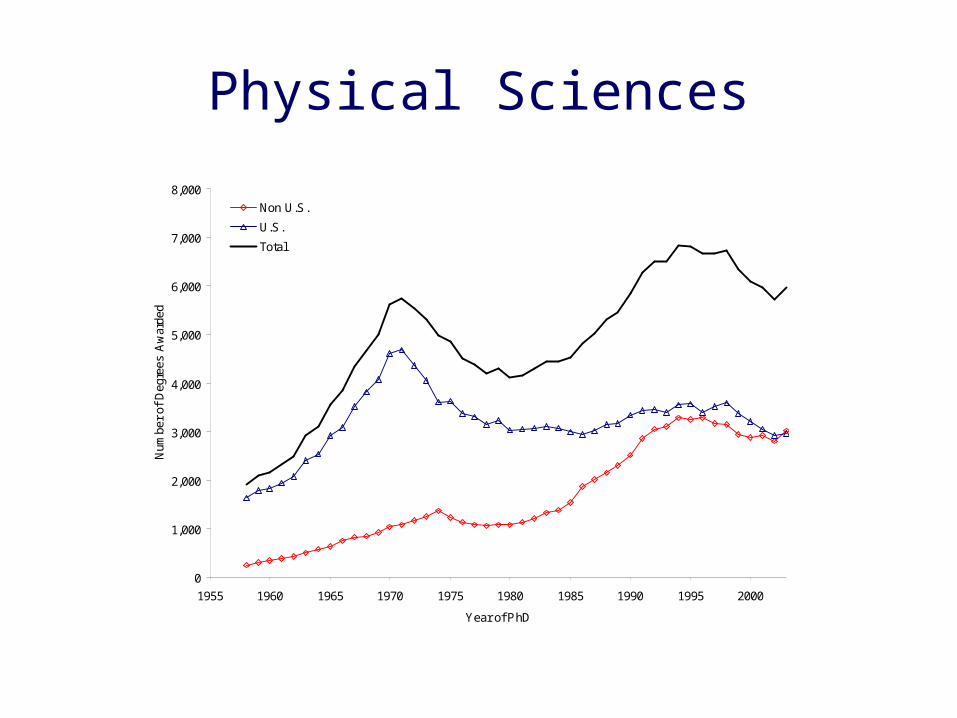
Physical Sciences
0
1,000
2,000
3,000
4,000
5,000
6,000
7,000
8,000
1955 1960 1965 1970 1975 1980 1985 1990 1995 2000
Year of PhD
Num
ber
of D
egre
es A
war
ded
Non U.S.
U.S.
Total
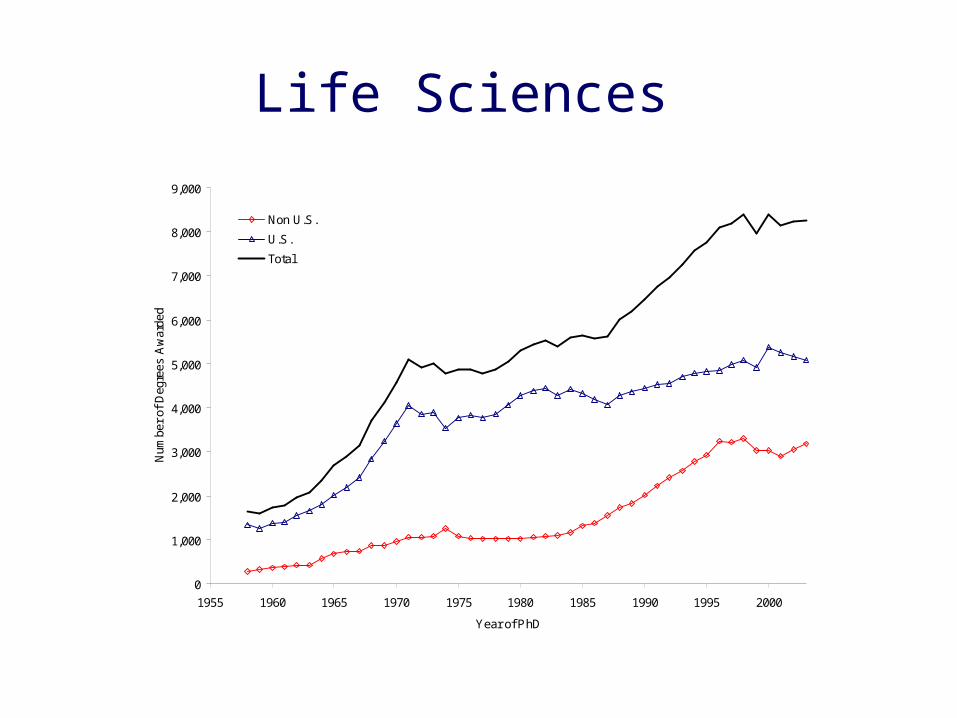
Life Sciences
0
1,000
2,000
3,000
4,000
5,000
6,000
7,000
8,000
9,000
1955 1960 1965 1970 1975 1980 1985 1990 1995 2000
Year of PhD
Num
ber
of D
egre
es A
war
ded
Non U.S.
U.S.
Total
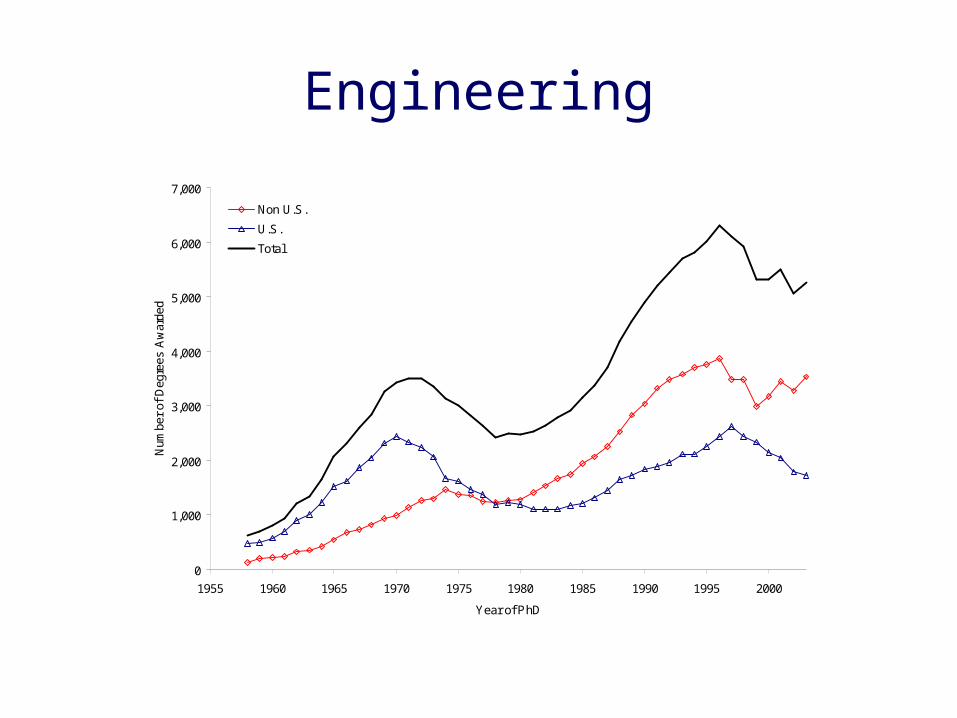
Engineering
0
1,000
2,000
3,000
4,000
5,000
6,000
7,000
1955 1960 1965 1970 1975 1980 1985 1990 1995 2000
Year of PhD
Num
ber
of D
egre
es A
war
ded
Non U.S.
U.S.
Total
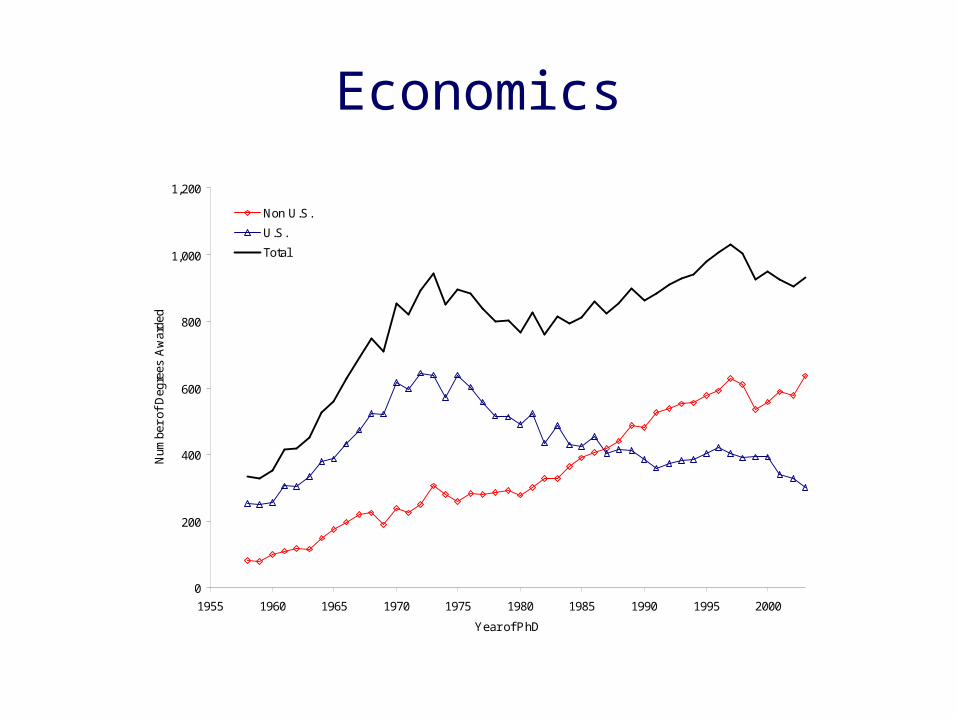
Economics
0
200
400
600
800
1,000
1,200
1955 1960 1965 1970 1975 1980 1985 1990 1995 2000
Year of PhD
Num
ber
of D
egre
es A
war
ded
Non U.S.
U.S.
Total
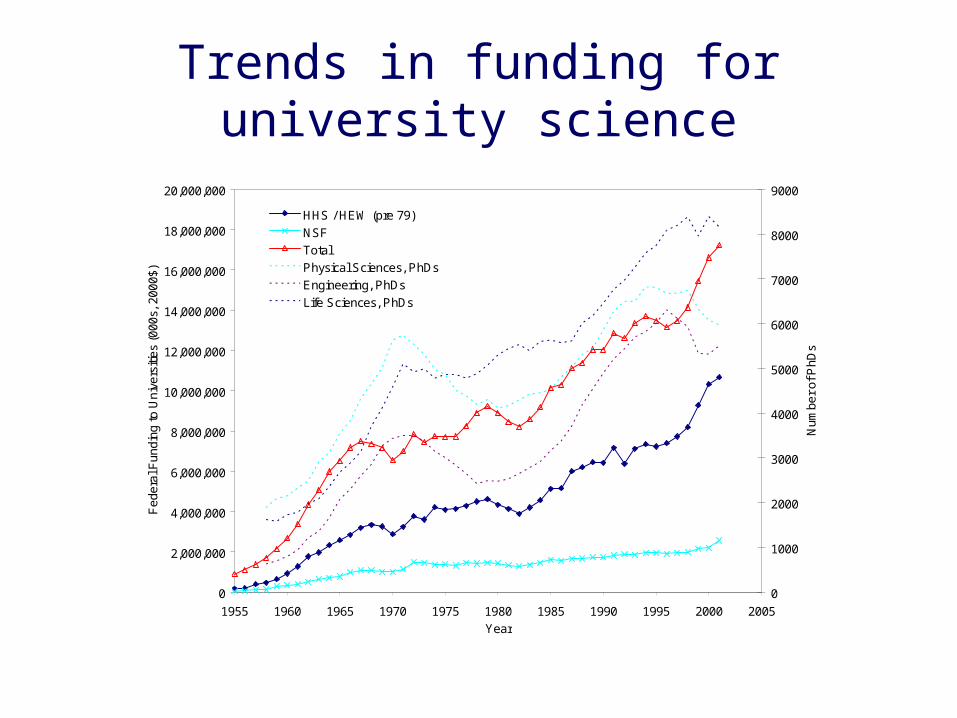
Trends in funding for university science
0
2,000,000
4,000,000
6,000,000
8,000,000
10,000,000
12,000,000
14,000,000
16,000,000
18,000,000
20,000,000
1955 1960 1965 1970 1975 1980 1985 1990 1995 2000 2005
Year
Fe
dera
l Fu
ndin
g to
Un
ive
rsiti
es (
000
s, 2
000
$)
0
1000
2000
3000
4000
5000
6000
7000
8000
9000
Num
ber
of P
hDs
HHS / HEW (pre 79)
NSF
Total
Physical Sciences, PhDs
Engineering, PhDs
Life Sciences, PhDs
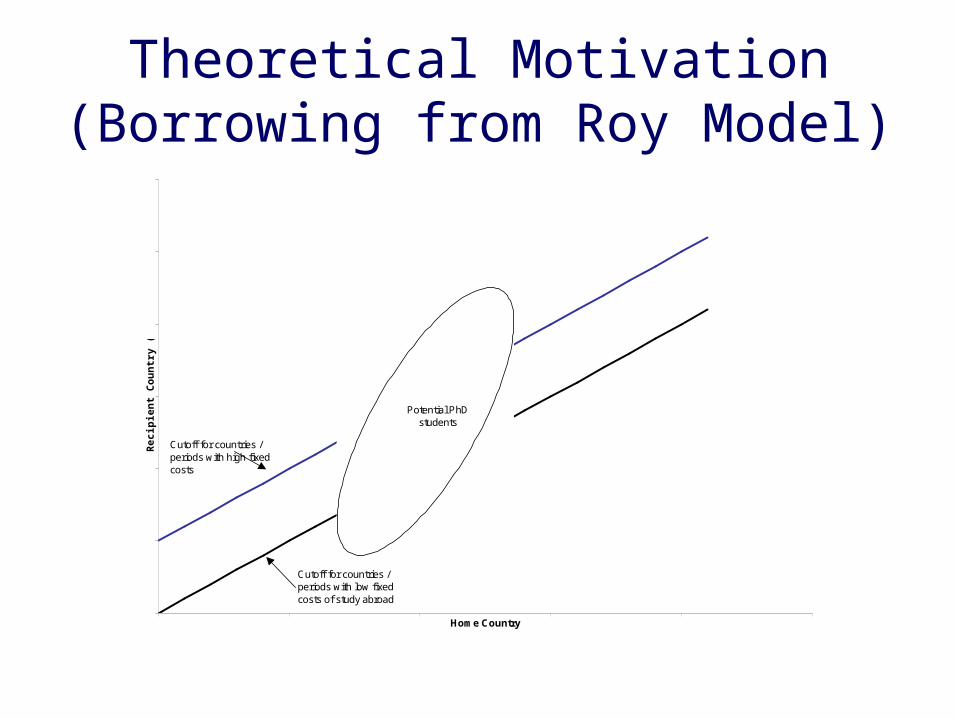
Theoretical Motivation(Borrowing from Roy Model)
Home Country
Rec
ipie
nt
Co
un
try
(US
)
Cutoff for countries / periods with high fixed costs
Cutoff for countries / periods with low fixed costs of study abroad
Potential PhD students
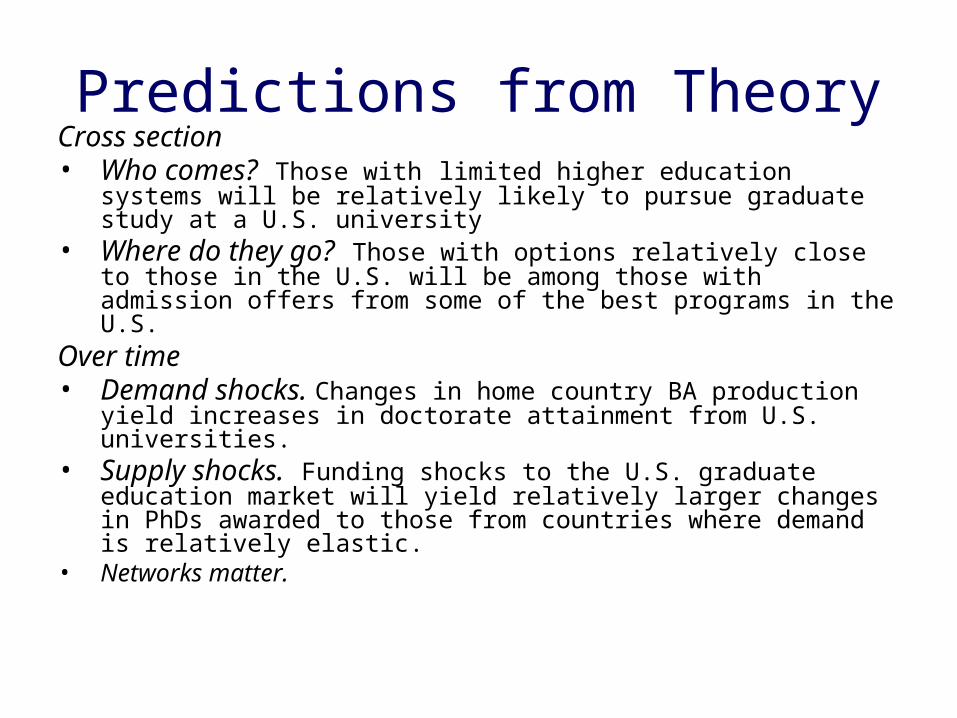
Predictions from TheoryCross section• Who comes? Those with limited higher education systems will
be relatively likely to pursue graduate study at a U.S. university• Where do they go? Those with options relatively close to
those in the U.S. will be among those with admission offers from some of the best programs in the U.S.
Over time• Demand shocks. Changes in home country BA production
yield increases in doctorate attainment from U.S. universities.• Supply shocks. Funding shocks to the U.S. graduate education
market will yield relatively larger changes in PhDs awarded to those from countries where demand is relatively elastic.
• Networks matter.
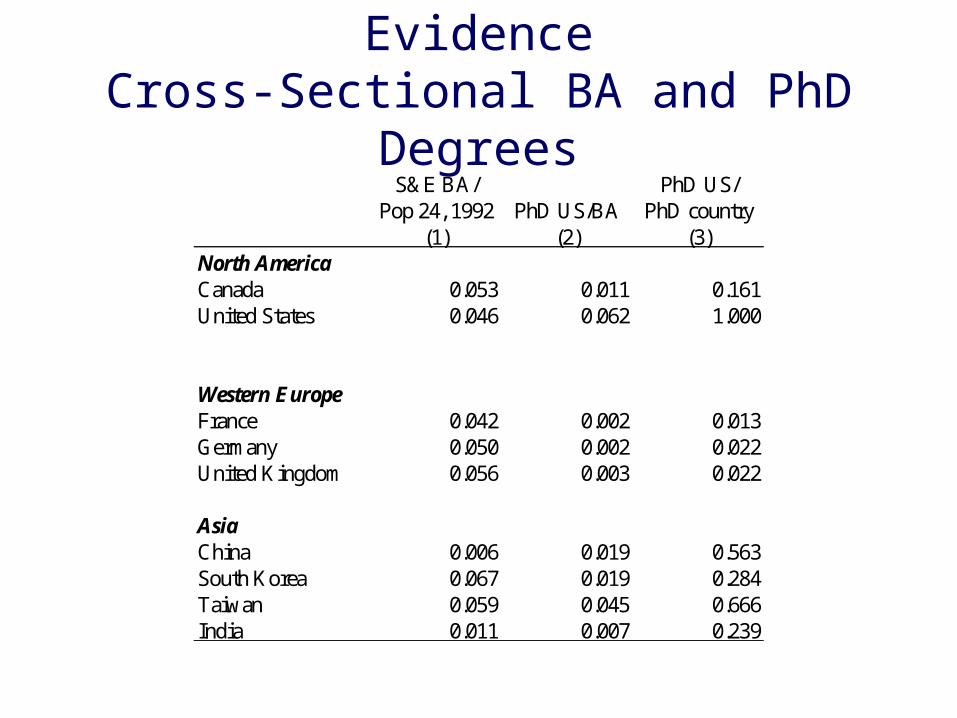
EvidenceCross-Sectional BA and PhD Degrees
S&E BA/ PhD US/Pop 24, 1992 PhD US/BA PhD country
(1) (2) (3)North AmericaCanada 0.053 0.011 0.161United States 0.046 0.062 1.000
Western EuropeFrance 0.042 0.002 0.013Germany 0.050 0.002 0.022United Kingdom 0.056 0.003 0.022
AsiaChina 0.006 0.019 0.563South Korea 0.067 0.019 0.284Taiwan 0.059 0.045 0.666India 0.011 0.007 0.239
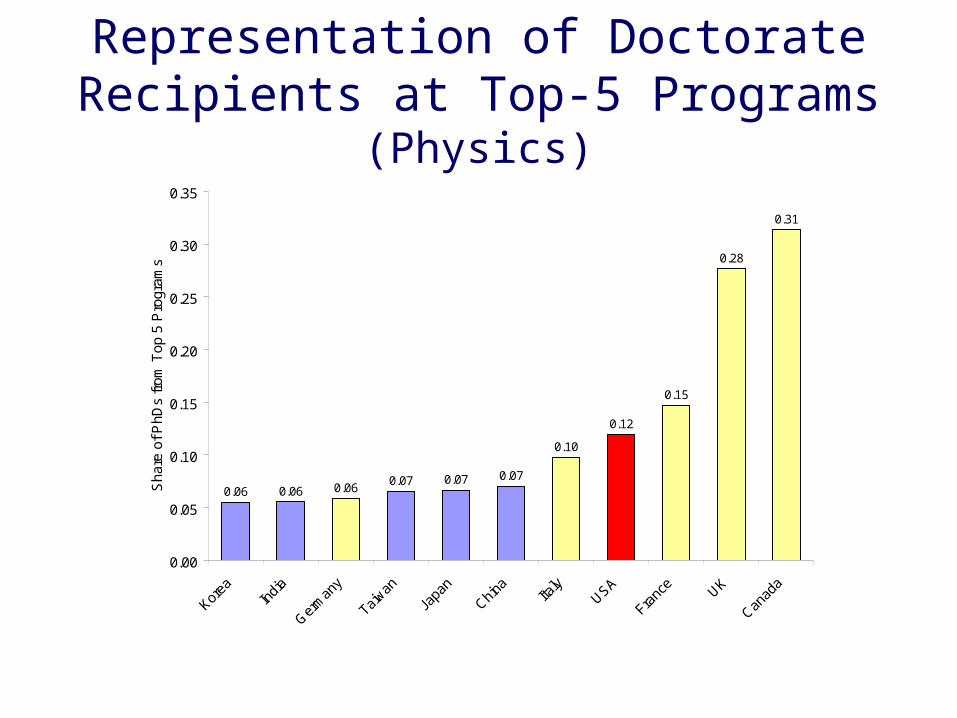
Representation of Doctorate Recipients at Top-5 Programs
(Physics)
0.06 0.060.07 0.07 0.07
0.06
0.10
0.15
0.28
0.31
0.12
0.00
0.05
0.10
0.15
0.20
0.25
0.30
0.35
Korea
India
Germ
any
Taiwan
Japa
n
China
Italy
USA
Franc
eUK
Canad
a
Sha
re o
f P
hDs
from
Top
5 P
rogr
ams
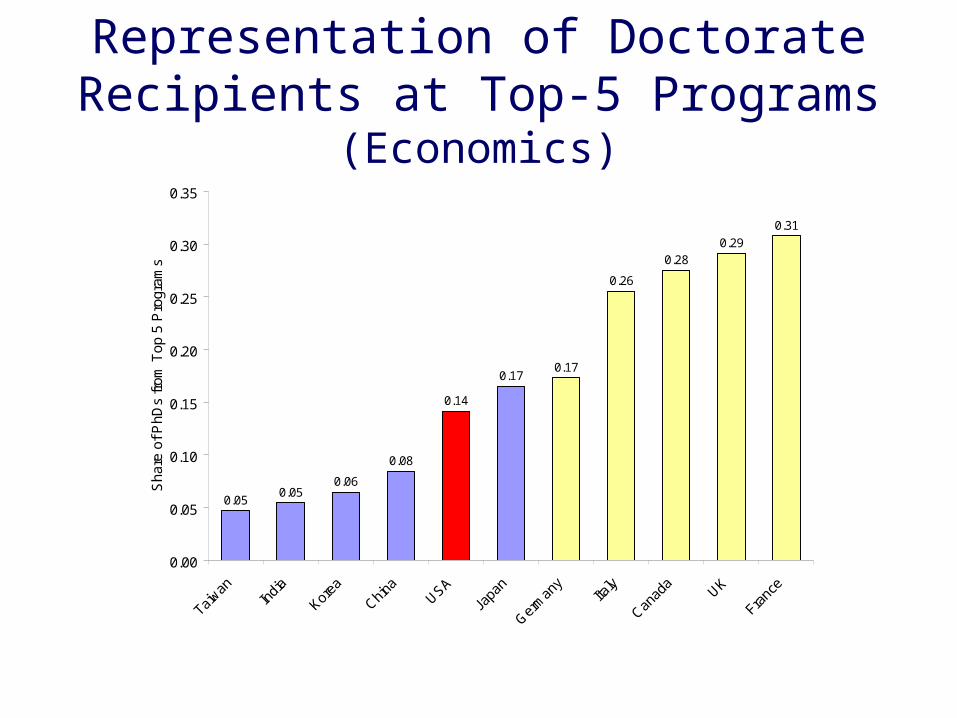
Representation of Doctorate Recipients at Top-5 Programs
(Economics)
0.050.05
0.06
0.08
0.170.17
0.26
0.280.29
0.31
0.14
0.00
0.05
0.10
0.15
0.20
0.25
0.30
0.35
Taiwan
India
Korea
China
USA
Japa
n
Germ
any
Italy
Canad
aUK
Franc
e
Sha
re o
f P
hDs
from
Top
5 P
rogr
ams
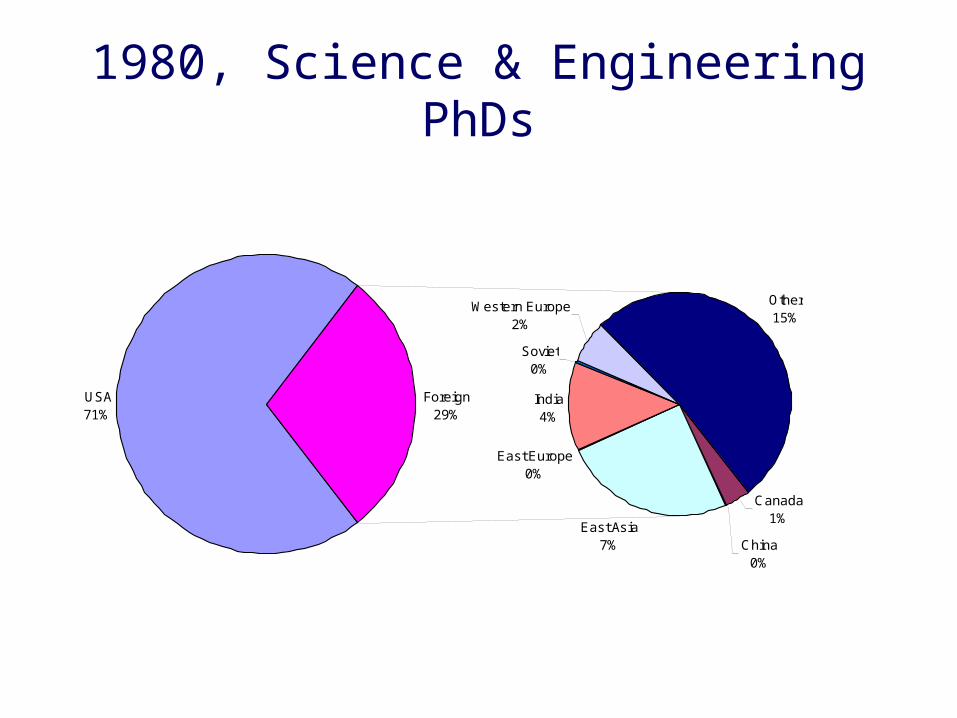
1980, Science & Engineering PhDs
USA71%
Canada1%
China0%
East Asia7%
East Europe0%
India4%
Soviet0%
Western Europe2%
Other15%
Foreign29%
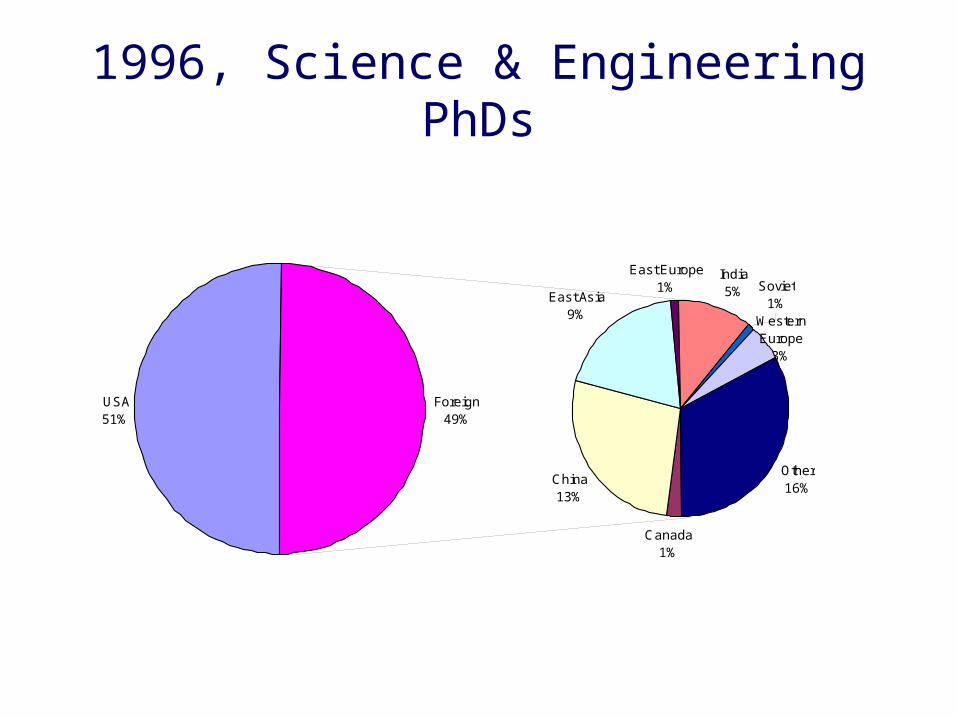
1996, Science & Engineering PhDs
USA51%
Canada1%
China13%
East Asia9%
East Europe1%
India5%
Other16%
Soviet1%
Western Europe
3%
Foreign49%
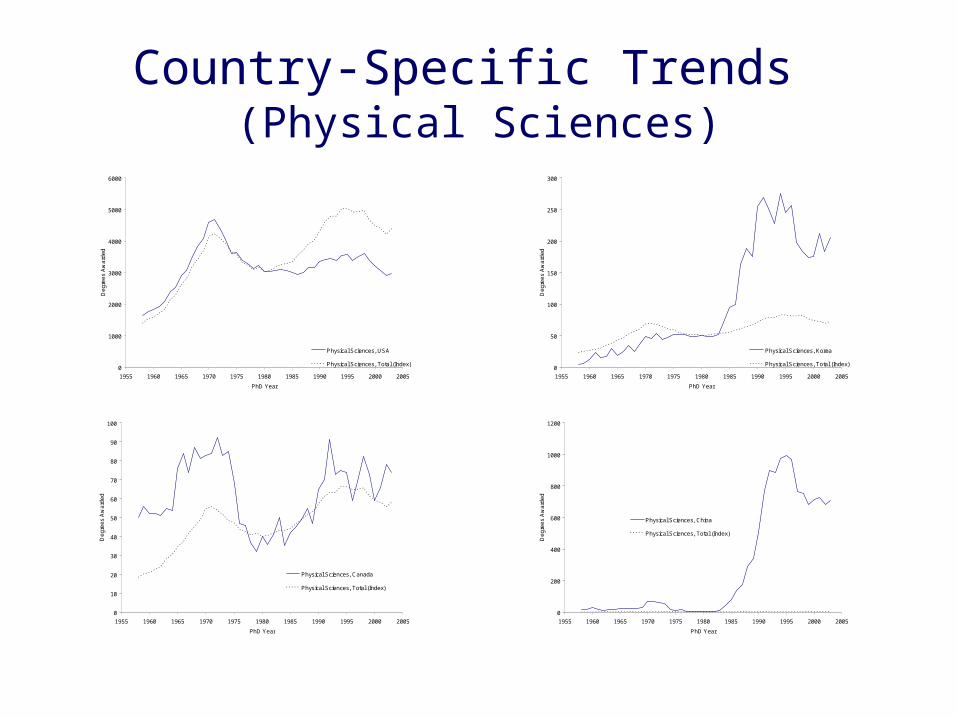
Country-Specific Trends (Physical Sciences)
0
1000
2000
3000
4000
5000
6000
1955 1960 1965 1970 1975 1980 1985 1990 1995 2000 2005
PhD Year
De
gre
es
Aw
ard
ed
Physical Sciences, USA
Physical Sciences, Total (Index)
0
10
20
30
40
50
60
70
80
90
100
1955 1960 1965 1970 1975 1980 1985 1990 1995 2000 2005
PhD Year
De
gre
es
Aw
ard
ed
Physical Sciences, Canada
Physical Sciences, Total (Index)
0
50
100
150
200
250
300
1955 1960 1965 1970 1975 1980 1985 1990 1995 2000 2005
PhD Year
De
gre
es
Aw
ard
ed
Physical Sciences, Korea
Physical Sciences, Total (Index)
0
200
400
600
800
1000
1200
1955 1960 1965 1970 1975 1980 1985 1990 1995 2000 2005
PhD Year
De
gre
es
Aw
ard
ed
Physical Sciences, China
Physical Sciences, Total (Index)
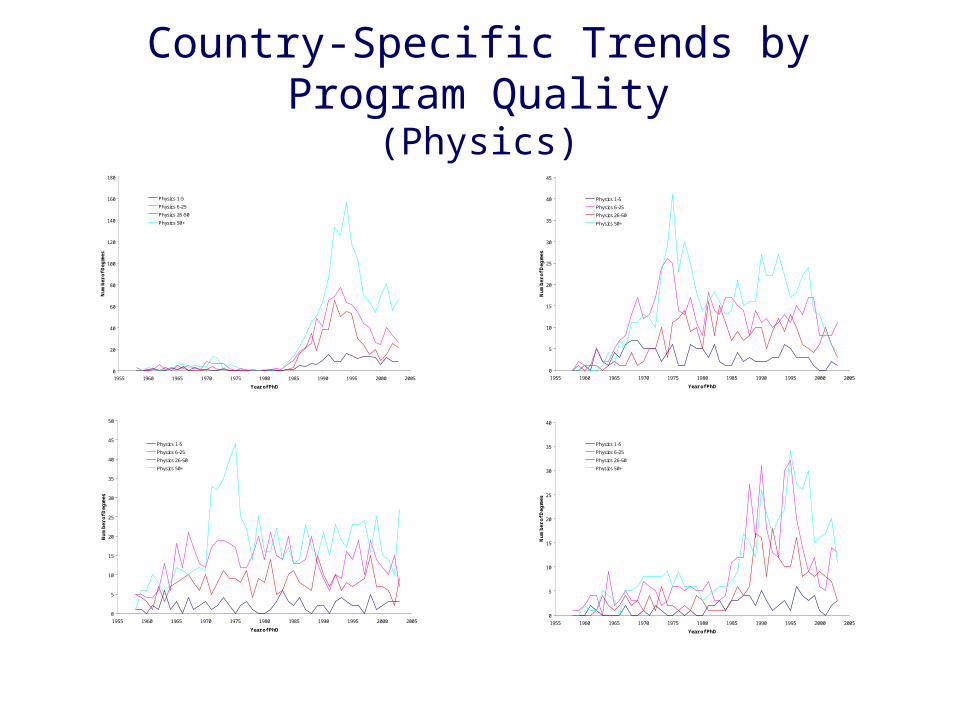
Country-Specific Trends by Program Quality(Physics)
0
20
40
60
80
100
120
140
160
180
1955 1960 1965 1970 1975 1980 1985 1990 1995 2000 2005
Year of PhD
Nu
mb
er o
f D
egre
es
Physics 1-5
Physics 6-25
Physics 26-50
Physics 50+
China
0
5
10
15
20
25
30
35
40
45
1955 1960 1965 1970 1975 1980 1985 1990 1995 2000 2005
Year of PhD
Nu
mb
er o
f D
egre
es
Physics 1-5
Physics 6-25
Physics 26-50
Physics 50+
Taiwan
0
5
10
15
20
25
30
35
40
45
50
1955 1960 1965 1970 1975 1980 1985 1990 1995 2000 2005
Year of PhD
Nu
mb
er o
f D
egre
es
Physics 1-5
Physics 6-25
Physics 26-50
Physics 50+
India
0
5
10
15
20
25
30
35
40
1955 1960 1965 1970 1975 1980 1985 1990 1995 2000 2005
Year of PhD
Nu
mb
er o
f D
egre
es
Physics 1-5
Physics 6-25
Physics 26-50
Physics 50+
Korea
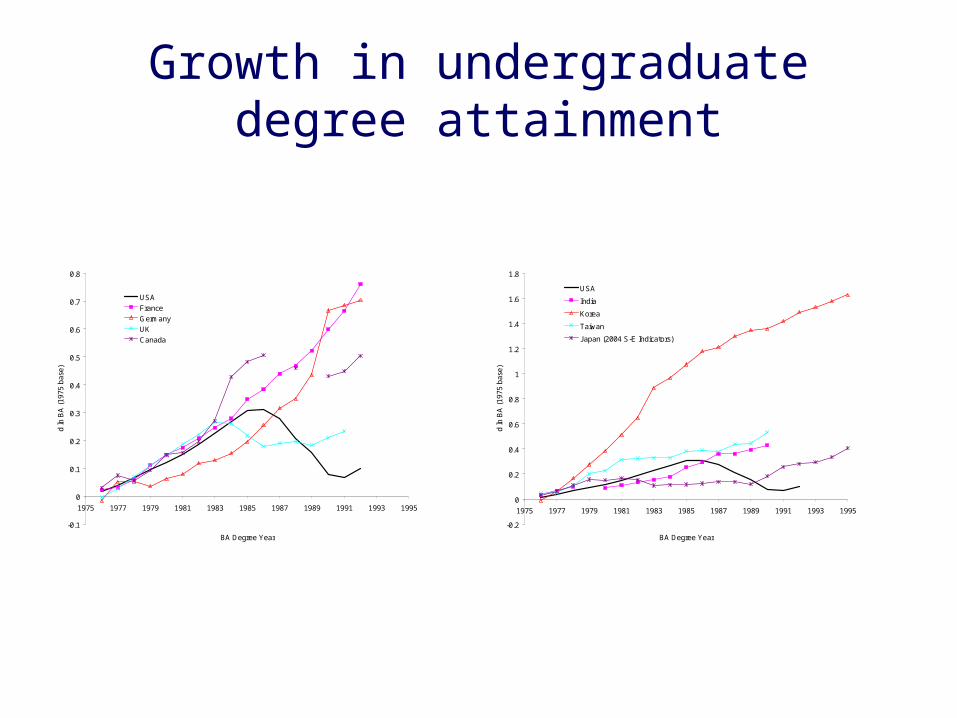
Growth in undergraduate degree attainment
-0.1
0
0.1
0.2
0.3
0.4
0.5
0.6
0.7
0.8
1975 1977 1979 1981 1983 1985 1987 1989 1991 1993 1995
BA Degree Year
d ln
BA
(1
975
ba
se)
USA
France
Germany
UK
Canada
-0.2
0
0.2
0.4
0.6
0.8
1
1.2
1.4
1.6
1.8
1975 1977 1979 1981 1983 1985 1987 1989 1991 1993 1995
BA Degree Year
d ln
BA
(1
975
ba
se)
USA
India
Korea
Taiwan
Japan (2004 S-E Indicators)
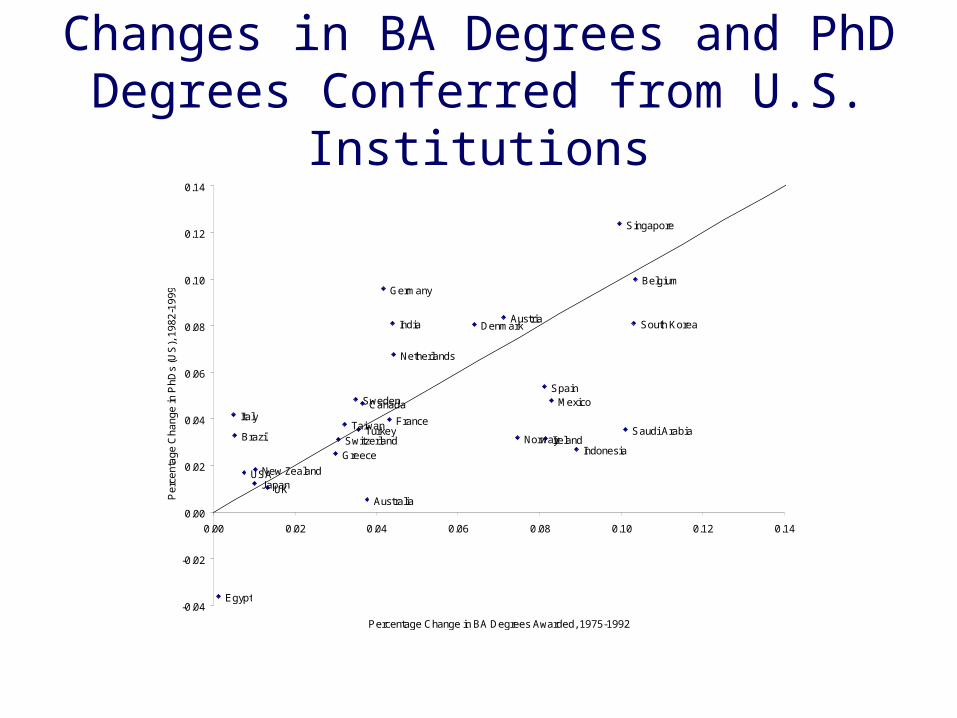
Changes in BA Degrees and PhD Degrees Conferred from U.S. Institutions
Australia
JapanUK
USA
BrazilTaiwan
IrelandNorway
Egypt
Saudi ArabiaSwitzerlandGreece
Canada
Germany
India
Netherlands
Denmark
France
Singapore
ItalyMexico
New Zealand
Sweden
South Korea
Spain
Turkey
Belgium
Austria
Indonesia
-0.04
-0.02
0.00
0.02
0.04
0.06
0.08
0.10
0.12
0.14
0.00 0.02 0.04 0.06 0.08 0.10 0.12 0.14
Percentage Change in BA Degrees Awarded, 1975-1992
Pe
rce
nta
ge
Ch
an
ge
in P
hD
s (U
S),
19
82
-19
99
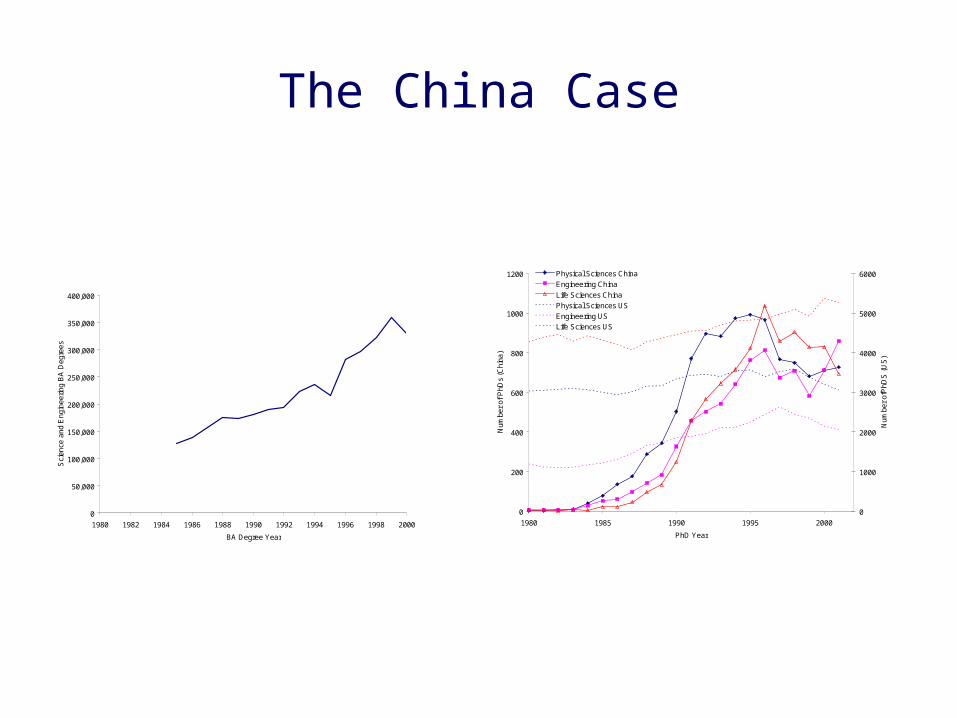
The China Case
0
50,000
100,000
150,000
200,000
250,000
300,000
350,000
400,000
1980 1982 1984 1986 1988 1990 1992 1994 1996 1998 2000
BA Degree Year
Sci
en
ce a
nd
En
gin
ee
ring
BA
Deg
ree
s
0
200
400
600
800
1000
1200
1980 1985 1990 1995 2000
PhD Year
Nu
mbe
r o
f P
hD
s (C
hin
a)
0
1000
2000
3000
4000
5000
6000
Nu
mbe
r o
fPh
DS
(U
S)
Physical Sciences China
Engineering China
Life Sciences China
Physical Sciences US
Engineering US
Life Sciences US
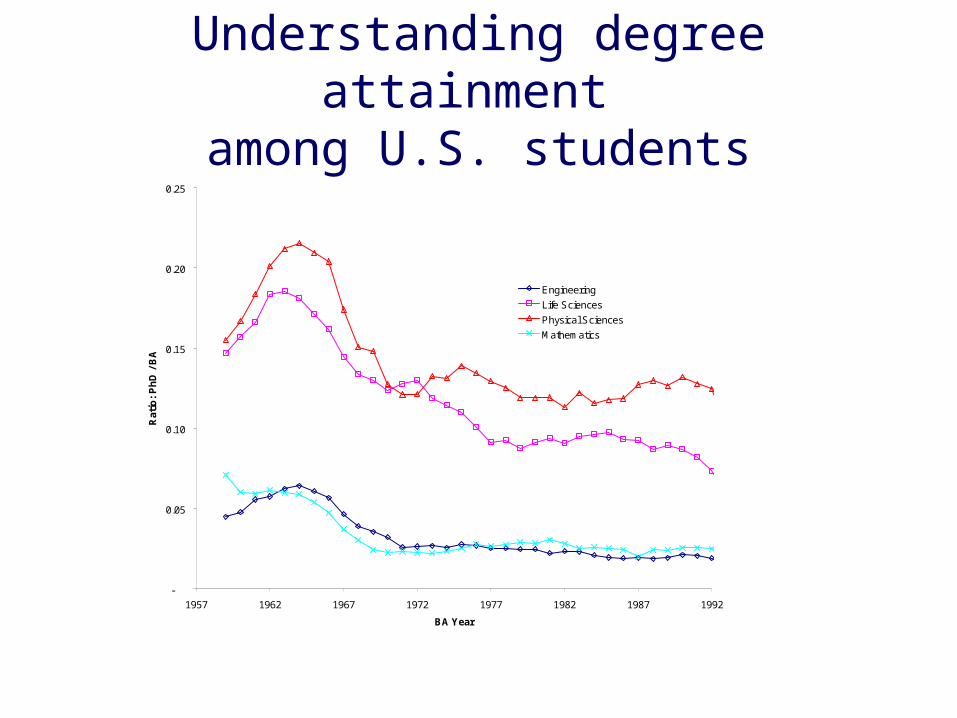
Understanding degree attainment among U.S. students
-
0.05
0.10
0.15
0.20
0.25
1957 1962 1967 1972 1977 1982 1987 1992
BA Year
Rat
io:
Ph
D /
BA
Engineering
Life Sciences
Physical Sciences
Mathematics
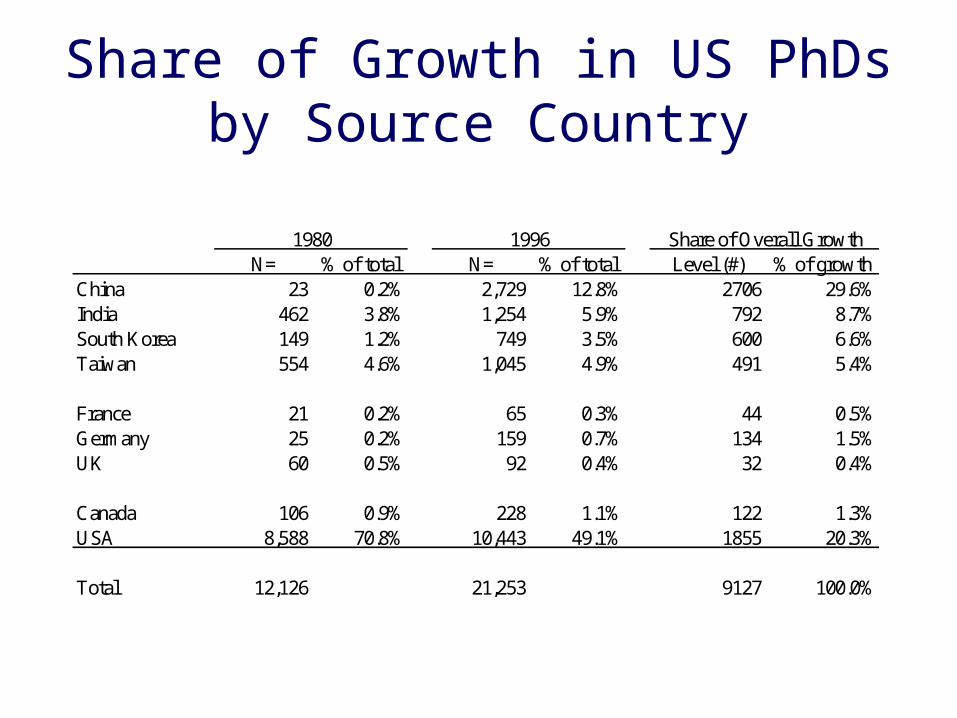
Share of Growth in US PhDs by Source Country
N= % of total N= % of total Level (#) % of growthChina 23 0.2% 2,729 12.8% 2706 29.6%India 462 3.8% 1,254 5.9% 792 8.7%South Korea 149 1.2% 749 3.5% 600 6.6%Taiwan 554 4.6% 1,045 4.9% 491 5.4%
France 21 0.2% 65 0.3% 44 0.5%Germany 25 0.2% 159 0.7% 134 1.5%UK 60 0.5% 92 0.4% 32 0.4%
Canada 106 0.9% 228 1.1% 122 1.3%USA 8,588 70.8% 10,443 49.1% 1855 20.3%
Total 12,126 21,253 9127 100.0%
Share of Overall Growth1980 1996
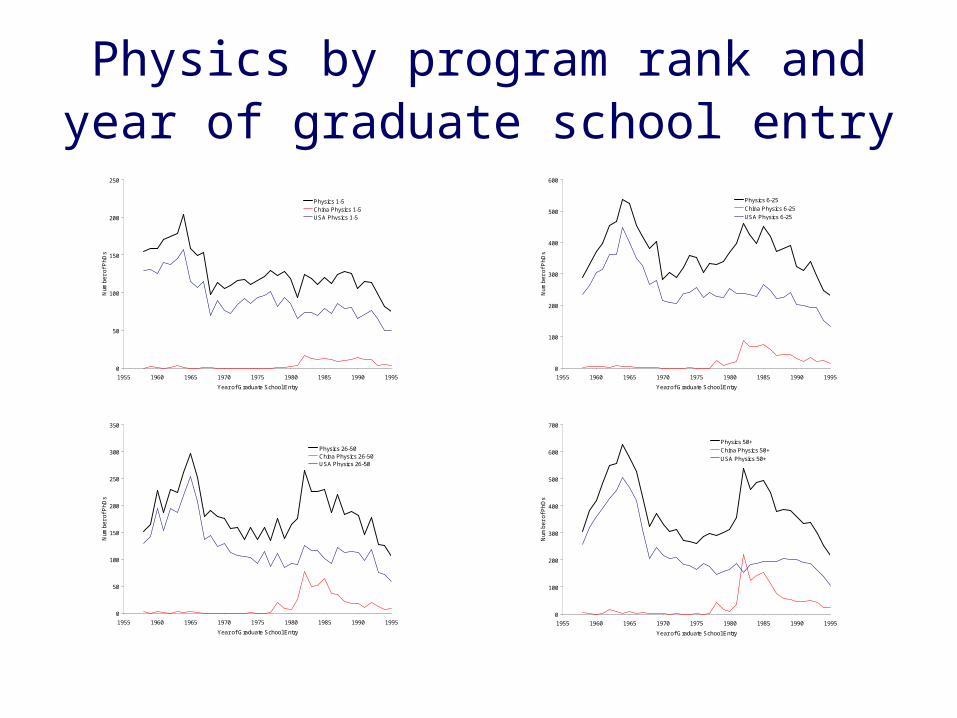
Physics by program rank and year of graduate school entry
0
50
100
150
200
250
1955 1960 1965 1970 1975 1980 1985 1990 1995
Year of Graduate School Entry
Nu
mb
er
of
Ph
Ds
Physics 1-5China Physics 1-5USA Physics 1-5
0
100
200
300
400
500
600
1955 1960 1965 1970 1975 1980 1985 1990 1995
Year of Graduate School Entry
Nu
mb
er
of
Ph
Ds
Physics 6-25
China Physics 6-25
USA Physics 6-25
0
50
100
150
200
250
300
350
1955 1960 1965 1970 1975 1980 1985 1990 1995
Year of Graduate School Entry
Nu
mb
er
of
Ph
Ds
Physics 26-50China Physics 26-50USA Physics 26-50
0
100
200
300
400
500
600
700
1955 1960 1965 1970 1975 1980 1985 1990 1995
Year of Graduate School Entry
Nu
mb
er
of
Ph
Ds
Physics 50+
China Physics 50+
USA Physics 50+
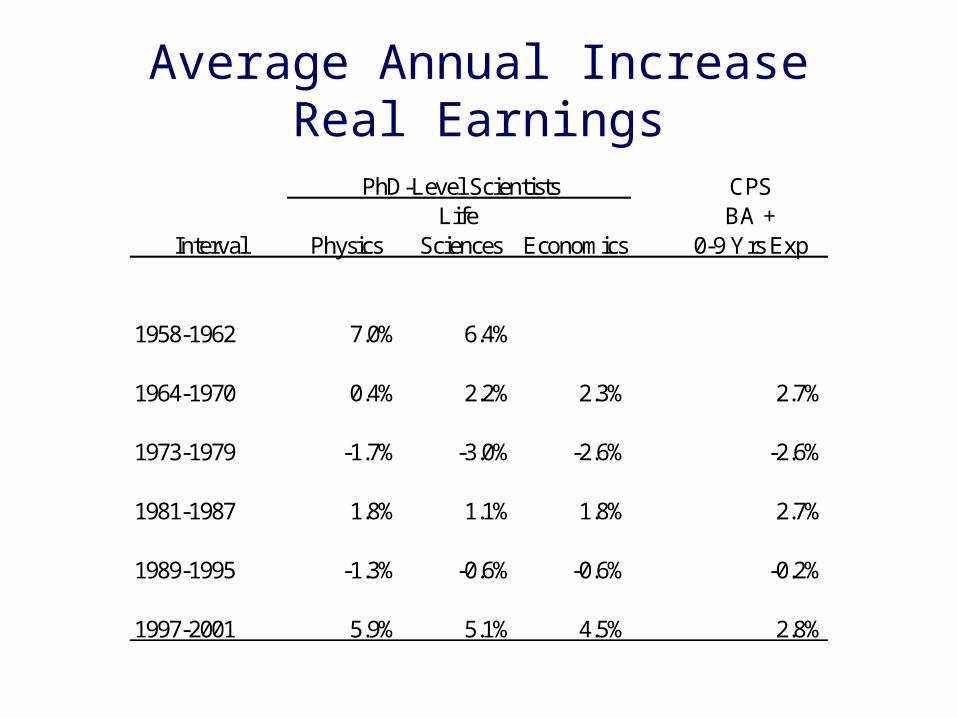
Average Annual IncreaseReal Earnings
CPSLife BA +
Interval Physics Sciences Economics 0-9 Yrs Exp
1958-1962 7.0% 6.4%
1964-1970 0.4% 2.2% 2.3% 2.7%
1973-1979 -1.7% -3.0% -2.6% -2.6%
1981-1987 1.8% 1.1% 1.8% 2.7%
1989-1995 -1.3% -0.6% -0.6% -0.2%
1997-2001 5.9% 5.1% 4.5% 2.8%
PhD-Level Scientists
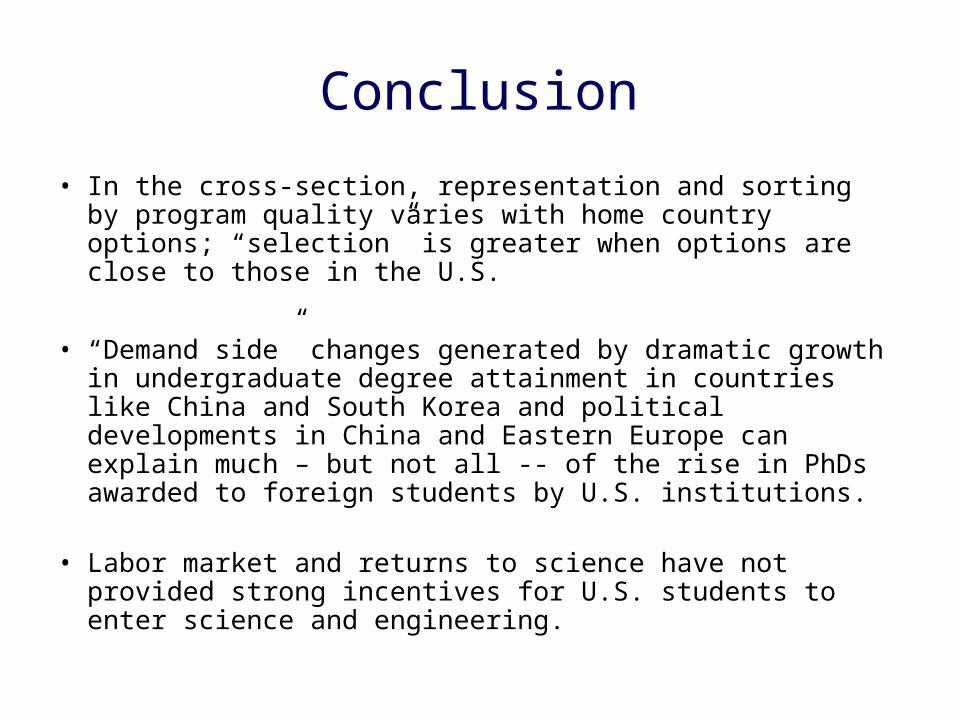
Conclusion
• In the cross-section, representation and sorting by program quality varies with home country options; “selection” is greater when options are close to those in the U.S.
• “Demand side” changes generated by dramatic growth in undergraduate degree attainment in countries like China and South Korea and political developments in China and Eastern Europe can explain much – but not all -- of the rise in PhDs awarded to foreign students by U.S. institutions.
• Labor market and returns to science have not provided strong incentives for U.S. students to enter science and engineering.

Further Thoughts
• Simple economic factors can explain increased internationalization of doctoral education and the Science and Engineering workforce. If there are significant agglomeration effects, increased internationalization will increase TFP.
• Is the increased presence of foreigners in U.S. PhD programs and in the U.S. scientific workforce a good thing for the U.S.? The simple answer has to be yes. More research at lower prices.
• What about sending countries? While there is a discussion of “brain drain” in various foreign countries, there is some circulation of scientists back to their countries of origin. Indeed, some countries have policies that explicitly capitalize on this (e.g. Israel). Also, the presence of the U.S. market provides incentives for foreign students and for foreign systems of higher education.
• Are there losers? Yes. (1) U.S. students who might want to become scientists. (2) Possibly U.S. undergraduates with foreign TAs, in the absence of monitoring of communication skills.
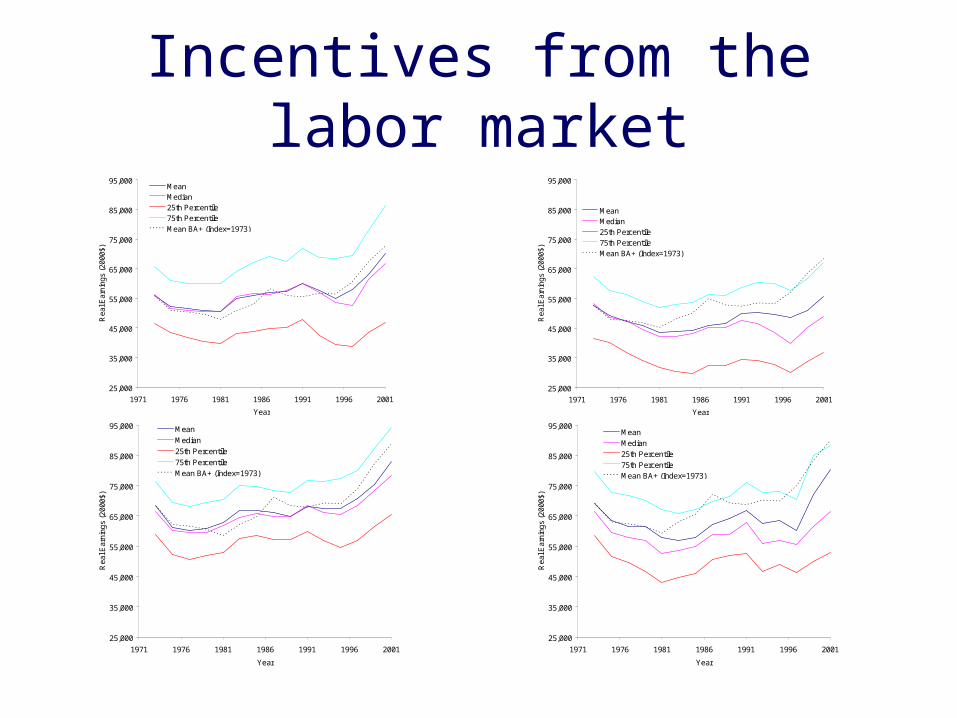
Incentives from the labor market
25,000
35,000
45,000
55,000
65,000
75,000
85,000
95,000
1971 1976 1981 1986 1991 1996 2001
Year
Re
al E
arn
ing
s (2
00
0$
)
Mean
Median
25th Percentile
75th Percentile
Mean BA+ (Index=1973)
Physical Sciences
25,000
35,000
45,000
55,000
65,000
75,000
85,000
95,000
1971 1976 1981 1986 1991 1996 2001
Year
Re
al E
arn
ing
s (2
00
0$
)
Mean
Median
25th Percentile
75th Percentile
Mean BA+ (Index=1973)
Life Sciences
25,000
35,000
45,000
55,000
65,000
75,000
85,000
95,000
1971 1976 1981 1986 1991 1996 2001
Year
Rea
l Ear
ning
s (2
000$
)
Mean
Median
25th Percentile
75th Percentile
Mean BA+ (Index=1973)
Engineering
25,000
35,000
45,000
55,000
65,000
75,000
85,000
95,000
1971 1976 1981 1986 1991 1996 2001
Year
Rea
l Ear
ning
s (2
000$
)
MeanMedian25th Percentile75th PercentileMean BA+ (Index=1973)
Economics