Embed Size (px)
Citation preview

Dis cus si on Paper No. 18-009
Internationalisation, Innovation and Productivity in Services:
Evidence from Germany, Ireland and the United Kingdom
Bettina Peters, Rebecca Riley, Iulia Siedschlag, Priit Vahter, and John McQuinn

Dis cus si on Paper No. 18-009
Internationalisation, Innovation and Productivity in Services:
Evidence from Germany, Ireland and the United Kingdom
Bettina Peters, Rebecca Riley, Iulia Siedschlag, Priit Vahter, and John McQuinn
Download this ZEW Discussion Paper from our ftp server:
http://ftp.zew.de/pub/zew-docs/dp/dp18009.pdf
Die Dis cus si on Pape rs die nen einer mög lichst schnel len Ver brei tung von neue ren For schungs arbei ten des ZEW. Die Bei trä ge lie gen in allei ni ger Ver ant wor tung
der Auto ren und stel len nicht not wen di ger wei se die Mei nung des ZEW dar.
Dis cus si on Papers are inten ded to make results of ZEW research prompt ly avai la ble to other eco no mists in order to encou ra ge dis cus si on and sug gesti ons for revi si ons. The aut hors are sole ly
respon si ble for the con tents which do not neces sa ri ly repre sent the opi ni on of the ZEW.

1
Internationalisation, Innovation and Productivity in Services:
Evidence from Germany, Ireland and the United Kingdom1
Bettina Peters,a,c,b Rebecca Riley,d,e Iulia Siedschlag,f,g Priit Vahter,h and John McQuinni
a Centre for European Economic Research (ZEW), Mannheim, Germany bMaCCI Mannheim Center for Competition and Innovation, Mannheim, Germany
cUniversity of Luxembourg, Luxembourg d National Institute for Economic and Social Research, London, United Kingdom
e Centre for Learning and Life Chances in Knowledge Economies and Societies, London, United Kingdom fEconomic and Social Research Institute (ESRI), Dublin, Ireland
gDepartment of Economics, Trinity College Dublin, Ireland h University of Tartu, Estonia
iCentral Bank of Ireland, Dublin, Ireland
January 2018
Abstract
This paper examines the links between internationalisation, innovation and productivity in service
enterprises. For this purpose, we use micro data from the Community Innovation Survey 2008 in
Germany, Ireland and the United Kingdom, and estimate an augmented structural model. Our
empirical evidence highlights the importance of internationalisation in the context of innovation
outputs in all three countries. Our results indicate that innovation in service enterprises is linked to
higher productivity. Among the innovation types that we consider, the largest productivity returns
were found for marketing innovations.
Key Words: Internationalisation of services; innovation; productivity.
JEL Classification: F61; L25; O31
Contact: Bettina Peters, email: [email protected]; Rebecca Riley, email: [email protected]; Iulia Siedschlag (corresponding author), email: [email protected]; Priit Vahter, email: [email protected]; John McQuinn, email: [email protected].
1 An earlier version of this paper was circulated under the title “Innovation and Productivity in Services: Evidence from
Germany, Ireland and the United Kingdom”.

2
1 Introduction
The theoretical literature on international trade and firm heterogeneity (the New‐New Trade Theory)
has established that firms with international activities are more productive than those serving only
the domestic markets. While in the early theoretical models firm productivity is treated as exogenous
(Melitz 2003; Helpman, Melitz, and Yeaple 2004), more recent contributions allow for the possibility
of productivity increases through innovation activities (Yeaple 2005; Lileeva and Trefler 2010; Bustos
2011). A small but growing literature strand models the complementarities between investing in
innovation and export participation (Aw, Roberts and Winston 2007; Baldwin and Robert‐Nicoud
2008; Van Long, Raff, and Stähler 2011; Aw, Roberts, and Xu 2011) and finds that export participation
is more likely when firms innovate and innovation is more likely when firms anticipate export
opportunities. A positive correlation between exporting and innovation activity has been found in
several studies (Wagner 1996; Love and Roper 2002; Liu and Buck 2007; Bratti and Felice, 2012;
Siedschlag and Zhang 2015). Furthermore, additional recent empirical evidence indicates that foreign‐
owned enterprises as well as exporters are more likely to innovate (Criscuolo et al. 2010; Siedschlag
and Zhang 2015). However, empirical evidence on the links between internationalisation, innovation
and productivity is scarce.
In the context of intensified global competition, innovation is of crucial importance for growth and
competitiveness. Services account for a growing share of economic activity, and innovation in services
is widely seen as a new source of economic growth (OECD 2005). Furthermore, technological
advances, particularly in information and communication technologies (ICT), have enabled a greater
tradability of services and thus greater exposure to competition. In this context, innovation in services
is increasingly important for a firm’s survival and also a pathway for sustainable economic growth.
Despite this growing importance of services in modern economies, existing empirical evidence on the
links between internationalisation, innovation and productivity in services is still limited.
Previous analyses of innovation in services have highlighted a number of specific characteristics of
services, such as their intangibility, simultaneity of production and consumption, and perishability
(Johne and Storey 1998; Hipp and Grupp 2005; Miles 2005; Gallouj and Savona 2009, 2010; Savona
and Steinmueller 2013). Following on from these specific characteristics, relative to manufacturing, it
has been pointed out that innovation in services is predominantly non‐technological, less related to
R&D, and it is closer to consumer demand (Licht and Moch 1999; Tether 2005; Tether and Tajar 2008).
Notwithstanding these specificities, the boundaries between manufacturing and services are less clear
as they are becoming increasingly integrated (Howells 2001). A growing number of researchers argue
that innovation in manufacturing and innovation in services are not clearly distinct (Evangelista 2000;

3
Hollenstein 2003; Cainelli et al. 2006). However, it has also been suggested that analysing innovation
in services using a similar approach to the one applied for manufacturing may not adequately capture
all the forms of innovation in services (Gallouj and Weinstein 1997; Sundbo 1997; Tether and Tajar
2008). A more recent approach has emerged that combines the insights gained from analysing both
innovation in manufacturing – mainly of a technological type – and innovation in services – mainly
non‐technological innovation (Drejer 2004; Hipp and Grupp 2005; De Vries 2006; Siedschlag et al.
2011; Leiponen 2012).
While the links between innovation and productivity in manufacturing enterprises have been analysed
for a large number of countries,2 only a few studies have examined innovation and productivity in
service enterprises (Lööf and Heshmati 2006 ‐ for Sweden; Mairesse and Robin 2009 ‐ for France;
Polder et al. 2010 ‐ for the Netherlands; Siedschlag, Zhang and Cahill 2010; and Siedschlag et al. 2011
‐ for Ireland; Masso and Vahter 2012 ‐ for Estonia; Crespi et al. 2014 for Chile, Colombia and Uruguay).
The evidence provided by these studies on innovation and productivity in service enterprises is
country and model‐specific. Furthermore, comparisons with innovation and productivity in
manufacturing enterprises are only limited.
To fill the evidence gap mentioned above, this paper examines the links between internationalisation,
innovation inputs, innovation outputs and productivity in service enterprises. More specifically, we
ask the following research questions: (i) What types of service enterprises are more likely to invest in
innovation? (ii) What types of service enterprises have higher innovation investment per employee?
(iii) Does higher investment in innovation lead to higher innovation output in service firms and is this
effect the same for different types of innovation? (iv) Is higher innovation output linked to higher
productivity in service enterprises? To what extent do productivity effects differ by type of innovation?
(v) Are there any cross‐country differences in the relationships between internationalisation,
innovation input, innovation output and productivity for service firms? For this purpose, we use micro
data from the Community Innovation Survey3 (CIS) 2008 covering Germany, Ireland and the United
Kingdom (UK). By using micro‐data for different service sectors across different countries, our analysis
accounts for heterogeneity at the firm‐, sector and country‐level.
2 Recent reviews of these studies are Hall (2011), Hall and Mohnen (2013), Ruane and Siedschlag (2013), and Siedschlag and
Zhang (2015). 3 The Community Innovation Survey is a harmonised survey on the innovation activities in enterprises. It is carried out on a
voluntary basis, currently every two years, by European Union countries and other countries which are members of the European Statistical System (ESS) such as countries members of the European Free Trade Area (EFTA) and EU candidate countries. The concepts and underlying methodology of the core survey questionnaire are based on the Oslo Manual (OECD and European Commission 1997, 2005), an internationally recognised set of guidelines on collecting and interpreting data on innovation published jointly by the OECD and the European Commission.

4
The novelty of our contribution consists in improving, on the basis of theoretical foundations, previous
conceptual frameworks and empirical methodologies in several ways. First, we account in the
empirical analysis for the role of internationalisation of service activities on the links between
innovation inputs, innovation outputs and productivity. Second, while most of previous analyses of
the link between innovation and productivity have focused on technological innovations (i.e., product
and process innovations), we consider in addition non‐technological innovations, namely,
organisational and marketing innovations. In particular, the link between marketing innovation and
productivity has been seldom analysed. 4 Marketing innovations may increase productivity via
increased demand for goods and services. This outcome could come about through significant changes
in product design or packaging, product placement, promoting or pricing. These improvements help
to better address customer needs, to open new markets or to re‐position products on existing
markets. Furthermore, in contrast to most previous studies, we model both technological and non‐
technological innovation outputs as being endogenous in the estimated production functions. Third,
we set up and use a unified econometric framework which allows us to identify both similarities and
differences in the innovation and productivity performance of enterprises in services. Fourth, in
contrast to most previous studies, we consider a broader definition of innovation expenditures,
beyond R&D expenditure which, as discussed above, is more appropriate for understanding
innovation in services. Finally, while most of previous contributions are country‐specific analyses, we
compare the innovation and productivity performance in three countries, namely Germany, Ireland
and the UK. The choice of these three countries is motivated by their different innovation and
productivity performance of service enterprises. According to data from the CIS 2008, among
European Union countries, Germany had the highest proportion of innovative service enterprises, 73.6
%, while the corresponding figures for Ireland and the UK were 54.1 % and 43.0 %, respectively.
However, with respect to their productivity performance,5 in 2008, productivity in services relative to
the EU average was higher in Ireland by 28%, while in Germany and the UK it was lower by 8% and 22
%, respectively.
The innovation and productivity performance of Germany, Ireland and the UK is to be understood in
the context of each country’s policy mix and institutional framework. For instance, Germany has a
science‐collaboration focused institutional framework, in Ireland a science‐competitive R&D focused
policy mix operates whereas in the UK innovation policy focuses on commercialisation‐driven
innovation (Izsák et al. 2013; OECD, 2014). As such, these three countries demonstrate commonalities
4 Masso and Vahter (2012) being an exception who analysed the role of marketing innovation on productivity in Estonia. 5 Gross value added per person employed in constant (2010) prices taken from the European Commission's Ameco data base
available at: http://ec.europa.eu/economy_finance/ameco/user/serie/SelectSerie.cfm.

5
and contrasts in their policy approaches to supporting and incentivising investment in innovation. The
science‐collaboration policy mix in Germany focuses on collaborative R&D funding especially between
public research organisations and industry and favours support for loan and venture capital funds and
no use of R&D tax incentives. In contrast, the science‐competitive framework in Ireland focuses on
competitive R&D programme funding rather than institutional funding of public organisations,
support measures for business innovation and the use of R&D tax incentives which are close to the
OECD median level. In the UK, commercialisation‐driven innovation policy focuses on technology
transfer mechanisms, strong support for entrepreneurship, support for loans and venture capital
similarly to Germany and with extensive use of R&D incentives similarly to the policy approach in
Ireland although far above the OECD median level.
Our empirical analysis highlights the importance of internationalisation in the context of innovation
and productivity in services in all three countries. Furthermore, our results indicate that innovation in
service enterprises is linked to higher productivity, over and above other enterprise and industry
characteristics. The largest productivity returns were found for marketing innovations. Successful
innovation in service enterprises appears to be associated with a number of factors, such as enterprise
size, innovation expenditure intensity (Germany and the UK), foreign ownership (Ireland), exporting,
and the engagement in cooperation for innovation activities.
The rest of this paper is organised as follows. Section 2 discusses the theoretical foundations of our
analysis. Section 3 describes the data, variables used in the empirical analysis and summary statistics.
Section 4 discusses the empirical methodology that we use. Section 5 presents the empirical results.
Finally, section 6 summarises the key findings and policy implications.
2 Theoretical Foundations
It is widely acknowledged that investment in R&D and other investments in innovation contribute
significantly to firm productivity. Research into the firm‐level R&D‐innovation‐productivity
relationship has a long‐standing and a highly important place in the field of the economics of
innovation. For example, Martin (2012) calls the issue of understanding returns to R&D “a central
building block” in innovation studies.
Key contributions to understanding the firm‐level R&D‐innovation‐productivity relationship include
works on the knowledge production function by Griliches (1979, 1990), Pakes and Griliches (1980,
1984) and the extensions of the knowledge production function framework in Crépon, Duguet and
Mairesse (CDM, 1998). Hall (2011), Mohnen and Hall (2013), Mairesse and Sassenou (1991) and
Griliches (1979, 1990) provide reviews of the relationships between knowledge capital and firm

6
productivity. A large number of empirical papers have by now estimated models of innovation, linking
firm level R&D and other innovation inputs to innovation outputs (e.g. innovative sales, measures of
product, process and other types of innovation) and proxies of firm productivity.6
The analysis of the R&D‐innovation‐productivity relationship has been based on the general traditions
of the neoclassical production economics and has been embedded in the analysis of the (augmented)
production function (Griliches 1979), where productivity measures (TFP, labour productivity) are
typically estimated as a function of past levels of investment in R&D (as a measure of innovation
effort), physical and human capital, industry level factors and the size of the firm. Pakes and Griliches
(1980, 1984) and Griliches (1979, 1990) add the key concept of the knowledge production function to
the analysis of this relationship, arguing that R&D and similar investments can increase the stock of
knowledge at the firm level that can lead to innovation and eventually to increase in output due to
increased productivity.7
R&D is of course not the only innovation input. Focus on R&D alone would miss a number of other
aspects and channels of innovation activities, and would lead to underestimation of the effects of
innovation on productivity, especially in services. Firstly, it is the innovation outputs (process, product
and other types of innovation), not innovation inputs that are directly affecting firm productivity. The
effects of innovation inputs on firm performance work through innovation outputs. Secondly, there
are difficulties of measurement of innovation inputs due to their latent and partly unobserved nature.
Finally, there are other relevant key innovation inputs than own R&D, such as the intensity and
breadth (variety) of knowledge sourcing from external partners, such as clients, suppliers and
universities (Laursen and Salter 2006, Cassiman and Veugelers 2006).
As a result, empirical and conceptual studies have moved from: i) linking innovation inputs (such as
R&D) directly to productivity to ii) the analysis of links of innovation outputs with productivity (see
Hall et al. 2009, Hall 2011). For example, these include questions on how are sales of new and
improved products or indicators of engaging in product, process, marketing or organisational
innovation8 related to firm productivity.
6 For example, Mairesse and Mohnen (2010) and Hall (2011) provide a concentrated review of the literature. 7 In particular, Pakes and Griliches (1980, 1984) introduce a general model and a ‘path analysis diagram’ linking ‘research
expenditures’ with increases in ‘knowledge capital’ (this stage being the ‘knowledge production function’), and increases in knowledge capital then with ‘other expected or realized benefits from invention’ (Pakes and Griliches 1984, p. 56). 8 The Oslo Manual (OECD and European Commission 2005) defines that “a product innovation is the introduction of a good
or service that is new or significantly improved with respect to its characteristics or intended uses. This includes significant improvements in technical specifications, components and materials, incorporated software, user friendliness and other functional characteristics.” Product innovations in services can include improvements how they are provided (e.g. speed, efficiency), the addition of new functions or characteristics to existing services, and of course, introduction of fully new services. “A process innovation is the implementation of a new or significantly improved production or delivery method. This includes significant changes in techniques, equipment and/or software.” An organisational innovation is “the

7
The seminal paper by Crépon, Duguet and Mairesse (1998) has refined the knowledge production
function approach of Pakes and Griliches (1984) and formulated a structural model (the CDM model)
for estimating the analysis of various stages in the innovation process. Their model was a clear step
forward in accounting for the complexity of the innovation process. They provided an intuitively
appealing theoretical and econometric model that enabled the researchers to go in more detail into
the analysis of the ‘black box’ (e.g. a term used by Rosenberg 1982) of the process of knowledge
development, and its effects on performance and relationship with innovation effort by the firm.
The CDM model is described in detail in Section 4 and applied in the empirical analysis after that. Here
we outline some of its key aspects. The model is based on three steps in the innovation process of
the firm. The first step is the firm’s decision whether to engage in R&D and innovation investments,
and given that decision, how much to invest. The second step is the knowledge production function
of the firm (similarly to Pakes and Griliches 1984) linking the innovation inputs and other factors with
innovation outputs. In the final step, an augmented (Cobb‐Douglas) production function is used to link
the innovation outputs to firm’s productivity. The model is tailored to be estimated based on the firm
level data from the Community Innovation Surveys (CIS).
The CDM model does not consider the role of internationalisation in the above three stages. However,
existing evidence indicate that firms operating in international markets are more likely to invest in
innovation and have a better innovation and productivity performance than firms operating in
domestic markets only (Criscuolo, Haskel and Slaughter 2010; Castellani and Zanfei 2007; Siedschlag
and Zhang 2015, OECD 2009). International trade can affect the speed and direction of innovation
(Grossman and Helpman (1990, 1995). A firm operating in international markets may be in a better
position to benefit from profit opportunities resulting from their own innovation which in turn
incentivises firms to invest in innovation. However, note that the commonly found correlation
between exporting and innovation may reflect the fact that innovation enables the firm to succeed
at export markets, not necessarily the effect of exporting itself on innovation, as shown for example
in Cassiman and Golovko (2011).
We add to understanding the role of internationalisation of services activities by investigating the role
of internationalisation in different stages of the CDM model. Internationalisation and exposure to the
international context can affect firm’s own investments in R&D by increasing incentives to engage in
implementation of a new organisational method in the firm’s business practices, workplace organisations or external relations (OECD 2005).” A further type of innovation that affects the benefits from product innovation is marketing innovation. According to the Oslo Manual (OECD 2005 and European Commission), “a marketing innovation is the implementation of a new marketing method involving significant changes in product design or packaging, product placement, product promotion or pricing.” The aim of marketing innovation is to increase sales of the firm by improved addressing of customer needs, opening up of new markets and positioning firm’s goods or services on the market

8
R&D, but it can affect innovation outputs and productivity also through potential knowledge transfer
from abroad (Castellani and Zanfei 2007, de Loecker 2007, Wagner 2011, Bratti and Felice 2012).
The CDM model attempts to correct for selectivity and simultaneity biases in linking R&D and firm
productivity. For example, it corrects for the selectivity into doing R&D by explicitly modelling the
choice of the firm of engaging or not engaging in innovation investments (including R&D). The model
handles some of the endogeneity in R&D and innovation. The CDM model has been widely used during
the last decades for investigating the drivers and impediments of the innovation process of firms both
in developed and also emerging economies,9 allowing the analysis of issues like the Schumpeterian
hypotheses about firm size and monopoly power, influences of public innovation support and FDI, and
a variety of effects of R&D and co‐operation on innovation outputs and performance. The majority of
these studies have focused on the analysis of data from the manufacturing sector, with a clear need
for more comparative country studies of these relationships in the services sector.
The results from empirical applications of the CDM model clearly confirm the importance of own R&D
in shaping innovation outputs (e.g. OECD 2009). A common finding from the 1st and 2nd stage in these
models (see e.g. Griffith et al. 2006) is that firm size is strongly associated with the firm’s propensity
to engage in innovation investments, but does not necessarily affect the innovation intensity and the
share of new or modified products in sales. Government support for innovation is usually found to
lead to an increase in firm’s own R&D (e.g. Czarnitzki et al. 2006). Co‐operation or knowledge flows
from external partners is a vital ingredient in the innovation success (Cassiman and Veugelers 2006),
in addition to own R&D and often complementary with own R&D. Co‐operation with suppliers matters
for process innovation, while co‐operation with clients for product innovation (e.g. Griffith et al. 2006,
among others).
Measuring productivity and the impact of innovation on productivity
The central relationship in the CDM model that we are interested in is between innovation and
productivity, and as the focus of our empirical analysis is on the services sector, especially between
non‐technological innovation and productivity. On average, there is a positive relationship found in
the empirical literature between innovation and productivity or productivity growth (Hall 2011, Hall
and Mairesse 2013, Mairesse and Mohnen 2010). However, studies using the standard available
revenue‐based productivity indicator find sometimes significant differences between the effects of
product and process innovation, reflecting the potentially different effects on real output and
revenue‐based measures of productivity.
9 This international evidence has been reviewed by Mairesse and Mohnen (2010) and Hall (2011).

9
Productivity is defined as a measure of the efficiency of production reflecting how much output is
obtained with a given set of inputs.10 The standard theoretical model to measuring productivity is
derived from a Cobb‐Douglas production function as follows:
LACY (1)
Y denotes output, A is technological level, C is tangible capital stock and L is labour input. α, β are
elasticities of output with respect to changes in tangible capital and labour inputs.
For the purposes of measurement and econometric estimation of the production function, the
logarithm of Equation (1) is:
itititit lcay , (2)
where i denotes the firm, t the time period, ita is the total factor productivity (TFP).
While productivity should be measured in quantities, what is typically observed in the micro data is
revenue‐based productivity. To the extent that product quality and market power are reflected in
prices, revenue‐based productivity could be influenced by prices. The assumption made in the
literature is that deflated revenue reflects accurately the producer’s output. In reality, in the world
with market power of firms and lack of idiosyncratic price indexes, this is of course not the case.
The simple model that we use to illustrate the effects of various types of innovation on revenue based
productivity follows in detail the outline in Hall (2011). We add to Hall’s econometric framework
organizational and marketing innovation.
We first take into account that our observed measure of output is not physical output but real revenue
r. If firms are able to exercise market power and have idiosyncratic prices, what we observe as an
outcome variable for our econometric analysis is real revenue r, where (all variables in
logs, p – idiosyncratic price).
In order to write down the revenue function, we first define an iso‐elastic demand equation for each
firm i as (in logs):
(3)
Here is the demand elasticity, 0. denotes here the log of demanded quantity.
Combining equations (2) and (3), yields (as in Hall 2011, p.179) an equation for the observed revenue
as a function of capital, labour and TFP.
10 See Syverson (2011) for a recent review of productivity measurement issues.

10
itititit lcar
1
(4)
In order to investigate how innovation affects the measured revenue and revenue‐based productivity,
we add to the analysis a measure of the knowledge stock K. We note that the knowledge stock can
affect the revenue‐based performance measure through its effects on the production function and
through the demand function. Firms engage in innovation both to improve production efficiency and
to gain monopolistic advantages in the market. In logs, is the knowledge stock that enters and
affects the production function, is the knowledge stock that enters and affects the demand
function. Both types of knowledge stocks result from previous investments in innovation.
An augmented production function with knowledge stock is (in logs):
Sititititit klcay , (5)
where 0.
The knowledge stock that is relevant for production efficiency is affected especially by past process
innovation and also organizational innovation. These both, separately or jointly, affect production
efficiency at the firm.
The augmented demand equation is the following.
, (6)
where 0.
is the knowledge capital stock that affects demand, i.e. creates monopolistic advantages for the
firm. Typically this knowledge stock would depend especially on product innovation, but also
marketing innovation. Both of these, separately or jointly, would shift the demand curve outwards
and make the firm’s products or services more attractive for its consumers at a given price level,
enabling to increase sales at a given price level.
Combining equations (5) and (6) into a revenue function yields:
Dit
Sititititit kklcar
11 (7)
The above equation shows how the knowledge stock at the firm level affects the real revenue and
therefore measured productivity. The effects that work through are unambiguously positive (note
that ⁄ is positive as is negative): i.e. product and marketing innovation have positive effects on
revenue and revenue‐based productivity. The effects of process and organizational improvements

11
on revenue ( 1 ⁄ are in fact ambiguous and depend on market power of the firm (Hall 2011).
These effects are positive, unless demand is very inelastic. These broad predictions have been
confirmed in empirical analyses. Hall (2011) provides a thorough review on this evidence. The effects
of product innovation on the revenue‐based productivity are usually found to be positive. The results
about process innovation are more varied, negative, statistically not significant and positive results
have been found (e.g. OECD 2009). This could reflect that product innovation (and marketing
innovation) create market power effects that increase revenues, and efficiency improvement due to
process (and organisational) innovation may not be visible in revenue‐based measures if they result
in lower prices and no corresponding growth in output (Mohnen and Hall 2013).
The general framework above does not address specifically the complementarities between different
investments in knowledge capital. However, these are likely to be important among the effects of
innovation on productivity. A typical characteristic of the innovation process is that many innovation
activities tend to be adopted together and this bundling of activities is often likely to lead to stronger
effects on innovation performance or productivity (e.g. Cassiman and Veugelers 2006, Polder et al.
2009, Battisti and Stoneman 2010, Love et al. 2014, Siedschlag and Zhang 2015). Milgrom and Roberts
(1990, 1995) and Brynjolfsson and Milgrom (2013) emphasize the role of complementarities in
organisational and technology‐oriented innovative activities. In general, we can say that two activities
are (Edgeworth) complementary if adding (more of) one activity increases the returns from the
other.11
It is by now well established that there may be complementarities between product innovation and
process innovation (e.g. Miravete and Pernias 2006, Martinez‐Los and Labeaga 2002, Polder et al.
2009) as production of a new product or service requires often changes in the production process to
realise its full effects. Also, there is abundant evidence that there are complementarities of
organizational innovation with both process and product innovation. For example, this has been
shown to be important in services sector of Netherlands and in Ireland (Polder et al. 2009; Siedschlag
and Zhang 2015).
Most relevant to the key contributions of this study is the conclusion that there may be
complementarities of marketing innovation and other types of innovation. This is discussed in a
seminal contribution to the analysis of complementarities between firm’s activities in Milgrom and
Roberts (1990). In a recent contribution, Junge et al. (2016) point to likely complementarities between
11 Complementarities exist between factors ( , ) when the mixed‐partial derivatives of a payoff function , , are
positive: , ,
0, i.e. if an increase in the level of adoption of one variable ( ) raises the marginal payoff of the
other variable(s) ( ) (Milgrom and Roberts 1990, 1995). Note: Z denotes other exogenous determinants of payoff.

12
product and marketing innovation, as marketing innovation strengthens the growth effect of product
innovation. That means that firms that introduce at the same time new products and also engage in
improvements of design and put in effort to develop new sales or distribution or packaging methods
for these products, would be expected to perform significantly better than firms that introduce these
innovations separately.
We can conclude that the four types of innovation outlined here can affect revenue‐based productivity
through their individual and complementary effects with other types of innovation, with their effects
functioning both through impacts on production efficiency and through effects on demand. Given the
large number of complementary innovations to be considered and compared in the context of the
three countries, in this paper we focus on the individual effects of the four technological and non‐
technological innovations on productivity in services.
3 Data, Variables and Summary Statistics
In order to compare the impact of innovation on productivity in the service sector, we use data from
the Community Innovation Survey (CIS) 2008 from Germany, Ireland and the UK. The CIS is a bi‐annual
European‐wide harmonized survey on innovation activities of firms administered by Eurostat and in
most countries carried out by the National Statistical Offices. It is a stratified random sample, stratified
by firm size and 2‐digit industries (as well as region in Germany). In each country, it is representative
for the target population of enterprises12 with more than 10 employees. For each enterprise we
observe basic firm characteristics in the data such as sales, employment, industry belonging, whether
it is part of a group and whether it is exporting. In addition, CIS provides detailed information about a
firm’s innovation process like innovation expenditure, different types of innovation outcomes,
cooperation partners etc. The data we use is a cross‐sectional data set in which most variables,
however, cover the three‐year period 2006–2008.13 Exceptions are e.g. sales and employment which
are annual data available for the first and last year of the period, i.e. 2006 and 2008. Our analysis
focuses on market services, including the following service sectors: wholesale trade; transport, storage
and communications; financial services; computer and related activities; and other business
activities.14 Unfortunately, data confidentiality requirements prevent us from merging the CIS data of
the three countries. Instead of analysing a pooled sample, we will investigate the relationship between
12 The term enterprise and firm are used interchangeably. 13 The specific characteristics of the data collected with CIS and related implications for econometric analysis are discussed
extensively by Mairesse and Mohnen (2010). Our econometric methodology discussed above deals, as satisfactorily as possible, with the qualitative and censored nature of the data. 14 A number of service sectors (e.g. retail) that are available in the CIS for Germany and the UK are excluded to facilitate
comparison with the CIS data for Ireland.

13
innovation input, output and productivity for each country separately. In total, the samples consist of
the following numbers of service enterprises in the three countries analysed: 1,333 in Germany; 1,286
in Ireland; and 4,344 in the UK.
Table 1 shows the weighted summary statistics15 for services enterprises for the main variables used
in the empirical analysis as well as the definition of the variables. The summary statistics reveal a lot
of heterogeneity in terms of size, innovation and productivity performance across the three countries.
[Table 1 about here]
Looking at the sample composition, we find the UK sample to consist of on average larger firms (86
employees) than in Germany (50.5 employees) and in Ireland (50.4 employees). Firm size is measured
by SIZE calculated as log number of employees. But note that the mean number of employees is
substantially higher in the UK than the median number of employees due to some very large
enterprises in the sample.16
Our key interest is in explaining productivity impacts of innovation in services. As explained in Section
2, we measure productivity as labour productivity (LP), i.e. sales per employees in year 2008. Table 1
reveals large variation across countries: average labour productivity of service firms in Ireland is 3.7
times higher than in Germany and 2.3 times higher than in the UK.
Interestingly, the descriptive statistics indicate that the better productivity performance in Ireland is
accompanied by a higher innovation input intensity. The latter is measured as the log innovation
expenditure per employee in year 2008 (INNOEXP). Innovation expenditure is a broader concept than
R&D expenditure (RDEXP). In addition to expenses for intramural and extramural R&D, it covers
expenses for the acquisition of machinery, external knowledge, training, product preparation and
marketing related to innovation activities. Since many service firms innovate without investing in
formal research and development (R&D) activities as is impressively shown in Table 1 as well, using
the broader concept of innovation expenditure seems to be more appropriate in order to measure
service firms’ innovation efforts. The average innovation expenditure per employee (across
enterprises) is in Ireland higher than in Germany (2.3 times higher) or the UK (9 per cent higher).
However, the proportion of service firms that decide to invest in innovation (INNO) in the first place,
is highest in the UK. 51 per cent of UK service firms report innovation expenditures, whereas the
15 For comparability purposes, these summary statistics are weighted to correct for the stratification of the CIS sample by size class, industry and region. Weighting factors are provided the statistical offices (IE and UK) and The Centre for European Economic Research (ZEW) which conducts the survey in Germany on behalf of the Federal Ministry of Education and Research. Discrepancies to published statistics may arise because our focus here is on the estimation sample. 16 The sampling unit in the UK is the establishment rather than the enterprise (though the vast majority of establishments are in fact single establishment enterprises). Exclusion of the top 0.5% of establishments by employee size brings the mean number of employees in the UK service sector establishments much closer to that in Germany and Ireland.

14
corresponding figures for Germany and Ireland are substantially lower (37 per cent and 26 per cent,
respectively).
Different and mixed results are found when considering innovation output indicators. The CIS data
allow us to differentiate between two types of technological innovation: new and significantly
improved products (PROD) and processes (PROC), respectively. Product innovation refers to the
introduction of new or significantly improved goods and services within a three‐year period (2006‐
2008). The highest proportion of product innovators can be found in the UK (30.3 per cent), closely
followed by Germany (28.6 per cent) and Ireland (24.7 per cent). In contrast, Ireland is leading when
it comes to process innovations. Within product innovation, we can further differentiate between
those new to the market (MARKET) and only new to the firm (FIRM). While UK and Ireland have a
much stronger focus on market novelties, Germany is by far leading in terms of service firms adopting
innovations. This pattern is different from manufacturing where Germany is the leading country for
both types of product innovation.
In addition to the two technological innovation output indicators, CIS also provides two non‐
technological innovation output measures: organisational innovation (ORGA) and marketing
innovation (MARK). Organisational innovation refer to the introduction of new or significantly changed
business practices, workplace organisations or changes in external relationships in the three‐year
reference period. Marketing innovation is a binary variable taking the value one when firms have
significantly changed product design or packaging, product placement, promoting or pricing. The
predominant type of innovation in service enterprises appears to be organisational innovation in
Ireland and the UK, and marketing innovations in Germany. However, in Germany the share of service
enterprises with organisational innovations is only slightly lower than the share with marketing
innovations. Furthermore, both marketing and organisational innovations are substantially higher in
Germany than in Ireland and the UK.
In addition to heterogeneity in innovation investments, differences in innovation outcome might also
be explained by differences in the innovation process itself leading to innovation efficiency
differences. For instance, Table 1 shows that firms differ in their engagement to cooperate in
innovation activities with other actors like customers (COOP_CUST), suppliers (COOP_SUP),
consultants (COOP_CON), universities (COOP_UNI) or public research institutes (COOP_PUB). The
patterns of engagement in cooperation for innovation activities differ in the three countries, with the
highest engagement rates reported in the UK. Amongst cooperation types, the highest engagement
rates in all three countries are reported for cooperation with suppliers and cooperation with clients
or customers.

15
In addition to productivity, innovation input and output measures, our empirical specification,
explained in more detail in the subsequent section, will use information on the degree of
internationalisation of firms. We distinguish between three types of firms: firms which are a subsidiary
of a foreign company (FOREIGN), domestic firms being active on the export market (DOM_EXP) and
domestic non‐exporters (DOM_NONEXP). While the proportion of domestic exporting service firms is
pretty similar across countries, Ireland has a substantially higher proportion of foreign‐owned firms.
4 Econometric Methodology
To analyse the relationships between innovation inputs, innovation outputs and productivity, we
estimate an augmented version of the widely used structural model proposed by Crépon, Duguet and
Mairesse (1998), known as the CDM model. The CDM model estimates three groups of relationships
linking innovation and productivity. The first group consist of two equations explaining the propensity
of enterprises to invest in innovation and the innovation expenditure intensity. The second relates the
various types of innovation outputs to innovation expenditure intensity and to other determinants of
innovation. The third links productivity to innovation outputs and other determinants of firm‐level
productivity.
We estimate an augmented version of the original CDM model underpinned by the theoretical and
empirical literature discussed in Section 2. More specifically, we add to the original CDM model non‐
technological innovation outputs and explanatory variables that measure internationalisation of
service enterprises and their engagement in cooperation for innovation activities within national
innovation systems.
Below, we describe in more detail the augmented version of the CDM model that we have estimated
in this paper.
The innovation investment equations
This stage of the model comprises two equations that explain the firms’ decision to invest or not to
invest in innovation and, if investing, the amount of innovation expenditure per employee. However,
we only observe the innovation expenditure reported by innovative firms. To the extent that this
group of firms is not random, this implies a possible selection bias. To account for this potential bias,
the propensity of firms to invest in innovation is modelled by the following selection equation:
(8)
iy 1
0i i i
i i i
if y x u
if y x u

16
where is an observed binary variable which equals one for firms engaged in innovation investment,
or zero for the rest of the firms. Firms engage in innovation and/or report innovation expenditure if
, an unobserved latent endogenous variable, measuring the propensity to innovate, is above a
certain threshold level . The latent variable can be interpreted as a decision criterion, such as the
expected present value of a firm's profit accruing to innovations. is the vector of the variables
explaining the innovation decision, is the vector of parameters and is the error term.
The vector of independent variables to explain the propensity of enterprises to invest in innovation
includes enterprise characteristics such as size, indicators of engagement in international activities
(international investment and exporting) and NACE three‐digit industry dummies. As highlighted by
the previous literature (for example, Crépon, Duguet and Mairesse 1998; Mairesse and Mohnen 2002;
Griffith et al. 2006), enterprise size captures the effect of access to finance, scale economies and
different organisation structures, while industry dummies proxy unobserved industry‐specific
technological opportunities, intensity of competition, demand growth and industry‐targeted
innovation policies.
Conditional on investing in innovation, the innovation intensity measured as the amount of innovation
expenditure per employee ( ) is given by the following equation:
(9)
where is the unobserved latent innovation intensity variable, is a vector of enterprise and
industry characteristics (engagement in international activities and NACE‐three digit industry‐specific
effects) explaining innovation intensity and is an error term.
We allow the error terms of both equations to be correlated and assume that they follow a bivariate
normal distribution with zero mean, variances and and correlation coefficient . Equations (8)
and (9) are thus simultaneously estimated using the Heckman two‐step estimator (Heckman 1976,
1979). For identification purposes, we follow Griffith et al. (2006) and exclude enterprise size in Eq. (9).
Excluding size corresponds to the stylised fact established by Cohen and Klepper (1996). Their survey
of empirical evidence led them to conclude that among R&D performers, R&D expenditure rises
monotonically with enterprise size. This implies that R&D intensity, measured as R&D expenditure per
employee, is independent of enterprise size.
The innovation output equation
iy
iy
ix
iu
iw
iw * , 1
0 0i i i i
i
w z if y
if y
*iw iz
i

17
This second stage of the model explains the innovation outcomes given by the following innovation
production function:
iiii ehwg
(10)
where is the innovation output proxied by the product, process, organisational or marketing
innovation indicators, and iw is the predicted innovation expenditure per employee estimated from
the selection model. These values are predicted for all the enterprises and not just for the sample
reporting innovation expenditure. By doing this, we follow the modified CDM approach suggested by
Griffith et al. (2006).17 By using the predicted, rather than the observed, values of the innovation effort
, we account for the possibility that the innovation expenditure per employee and the innovation
outputs could be simultaneously determined. Equations (8) and (9) correct for the endogeneity in this
instrumental variables approach. The three‐digit industry dummies used in estimating Equations (8)
and (9) are excluded in estimating Eq. (10); instead, we use two‐digit industry dummies when
estimating Eq. (10) (note, the statistical tests validate these exclusion restrictions). is the vector of
the other determinants of innovation output, namely enterprise size, indicators of engagement in
international activities, and indicators of engagement in co‐operation for innovation activities. and
are the parameter vectors, and is the error term.
The output production equation
The last stage of the model explains the output production as a function of production inputs including
innovation outcomes, as follows:
iiii gkp (11)
where is the labour productivity (log of sales per employee), is a vector that includes
employment and other enterprise and industry characteristics, ig denotes the innovation outcomes
(product, process, organisational and marketing innovations), and are the corresponding
parameters vectors, and is the error term. Due to data limitations, variation of capital intensity is
captured at industry‐level by industry‐specific fixed effects. To correct for the fact that innovation
output and productivity could be simultaneously determined, the predicted innovation output
estimated in the previous stage by Eq. (10) are used for .
17 In the original CDM model, this equation was only estimated for the sample of innovative enterprises.
ig
iw
ih
ie
ip ik
i
ig

18
5 Empirical Results
Tables 2 to 5 show the estimates of the augmented CDM model for innovation and productivity in
service enterprises in Germany, Ireland and the UK over the period 2006‐2008.
Table 2 presents the estimates of the Heckman two–stage model of innovation investment. The
propensity to invest in innovation (first stage) is estimated by a probit model as a function of
enterprise size (measured by the log number of employees in 2008), international activities (a dummy
variable which is equal to one for foreign‐owned enterprises, and zero otherwise), exporting (a
dummy variable which is equal to one for domestic exporters, and zero otherwise) and industry
specific effects (industry dummies at the three‐digit NACE Rev. 1 classification). The innovation
expenditure intensity is measured as the log innovation expenditure per employee in 2008 and is
estimated as a function of ownership, exporting and industry specific effects. Following Griffith et al.
(2006), we use the enterprise size as an exclusion restriction in the innovation investment equation.
The figures shown in Table 2 are marginal effects.
[Table 2 about here]
Our results indicate that service enterprises that invested in innovation are more likely to be large
enterprises and enterprises with export markets. Domestic exporters are more likely to invest in
innovation by 15.3 percentage points in Germany, by 16.5 percentage points in Ireland and by 9.3
percentage points in the UK. In Germany and the UK, innovation expenditure intensity is likewise
significantly higher for domestic service enterprises with export markets, than for domestic non‐
exporters and foreign‐owned enterprises, while in Ireland, foreign‐owned enterprises have a
significantly higher innovation expenditure intensity. Conditional on investing in innovation, the
innovation expenditure intensity in domestic exporters is significantly higher than in firms serving only
the domestic market: by 40% in Germany and by 69% in the UK. The intensity of innovation
expenditure in foreign‐owned firms is higher by 96% in Ireland, almost double than in Irish‐owned
non‐exporting firms. In the UK, both foreign‐owned enterprises and domestic exporters show
significantly higher innovation intensity than domestic non‐exporters by 38% and 69%, respectively.
Furthermore, industry‐specific characteristics matter for the decision to invest in innovation in
services as they are highly significant. The likelihood ratio test on whether 0 rejects the null
hypothesis, and hence, selection bias has to be corrected for.
Table 3 shows the estimates of the determinants of product innovation in the three countries
analysed. In addition to the indicator for product innovation, it distinguishes between product
innovations that are new to the market (market novelties) and those that are only new to the firm
enterprise but not new to the market (firm novelties). The dependent variable is a categorical variable

19
that takes the value of one if product innovation was reported in the period 2006‐2008, or zero
otherwise. The explanatory variables include the innovation expenditure intensity predicted on the
basis of the innovation investment equations,18 enterprise size, ownership, exporting, engagement in
cooperation for innovation activities (dummy variables are equal to one if cooperation was reported,
or zero otherwise) and industry specific effects (industry dummies at a two‐digit level NACE Rev. 1
classification19). Since the predicted innovation expenditure intensity has been estimated in the first
stage and is thus a generated regressor in the innovation outcome equation, standard errors will be
biased. We address this problem by estimating bootstrapped standard errors (using 300
replications).20
[Table 3 about here]
The results in Table 3 highlight that a higher innovation expenditure intensity significantly increases
the likelihood of successfully introducing product innovations in services (in Ireland these effects are
positive but not statistically significant). An increase by 1% in the innovation expenditure intensity is
associated with an increase in the probability to introduce product innovation by 8.3 percentage
points in Germany, and by 5.5 percentage points in the UK. The probability of implementing product
innovations is also higher for large enterprises (not in the UK’s case), and for enterprises with
exporting markets. In Ireland, foreign‐owned enterprises were more likely to successfully implement
product innovations by 42.1 percentage points, in particular as market novelties (an increase by 40.4
percentage points). In all three countries, service enterprises that are engaged in cooperation for
innovation activities with other enterprises within the same enterprise group are more likely to
successfully introduce a product innovation. The same result is found for cooperation with suppliers
(Ireland and the UK); cooperation with customers (Germany and the UK); with universities (Germany);
and with public research labs (the UK). Cooperation with the science base (universities in Germany or
public research labs in the UK) has an impact, particularly for introducing market novelties in services.
The strong association between co‐operation in innovation activities and enterprise innovation
performance reflects the similarities and differences in innovation policy in the three countries:
science‐collaboration in Germany; science‐competitive in Ireland; and commercialisation‐driven in the
UK.
18 OLS regressions indicate in all three countries large and highly significant correlations between the observed innovation
expenditure intensity and the predicted innovation expenditure intensity. These results are available from the authors upon request. 19 The industry dummies are at a two‐digit level NACE Rev. 1 classification to ensure the identification of the determinants of innovation outputs, as we used three‐digit industry dummies in the innovation expenditure intensity equation. Wald tests validate the exclusion of three‐digit industry dummies. 20 We thank an anonymous referee for making this point.

20
Table 4 shows the results of the probit model for other innovation outputs, namely, process,
organisational and marketing innovations in service enterprises in the three countries analysed. The
dependent variables in the probit models are binary variables, which take the value of one if the
respective innovation output was reported in the period 2006‐2008, and zero otherwise.
[Table 4 about here]
As shown in Table 4, process innovation in service enterprises is more likely in larger enterprises, in
enterprises with higher innovation expenditure intensity (Germany and the UK), and in foreign‐owned
and exporting enterprises (in Ireland). An increase of 1% in the number of employees is associated
with a higher probability to introduce process innovations in all three countries: by 7.6 percentage
points in Germany; by 7.9 percentage points in Ireland and by 1 percentage point in the UK. An
increase in the innovation expenditure intensity by 1% is associated with an increase in the probability
to introduce process innovations by 8.9 percentage points in Germany and by 2.7 percentage points
in the UK. In Ireland, relative to enterprises which serve only the domestic market, the propensity of
foreign‐owned firms to introduce process innovation is higher by 31 percentage points. Irish‐owned
exporters are more likely by 28.2 percentage points than non‐exporters to introduce process
innovations. Moreover, successful process innovation was positively linked to engagement in
cooperation for innovation activities with other enterprises (Germany and the UK), with suppliers
(Ireland and the UK), with customers (all three countries) and with consultants (Ireland and the UK)
and universities (Ireland). In contrast, in the sample analysed, in the UK, service enterprises
cooperating with competitors were less likely to introduce process innovations.
Furthermore, our results indicate that organisational innovation in service enterprises is more likely
in larger enterprises, in enterprises with higher innovation expenditure intensity (Germany and the
UK), in foreign‐owned enterprises (Ireland and the UK), and amongst domestic exporters (Ireland). A
1% increase in the number of employees is associated with a probability to introduce organisational
innovation higher by 6.1 percentage points in Germany, by 16.6 percentage points in Ireland and by
3.5 percentage points in the UK. Innovation expenditure intensity higher by 1% is associated with a
probability to introduce organisational innovations higher by 5 percentage points in Germany and by
2.9 percentage points in the UK. Foreign‐owned enterprises are more likely than domestic non‐
exporters to introduce organisational innovations by 30.1 percentage points in Ireland and by 5.9
percentage points in the UK. Organisational innovations are also more likely in Irish‐owned exporters
than in non‐exporters, by 44.9 percentage points. Moreover, the successful implementation of
organisational innovation in service enterprises was positively linked to cooperation in innovation
activities with other enterprises within the same enterprise group (Germany and the UK), and with
suppliers and customers (Ireland and the UK). In contrast, in Germany, service enterprises that

21
cooperated with public research institutes were less likely to successfully implement organisational
innovations.
Finally, Table 4 indicates that marketing innovations in service enterprises were more likely among
enterprises with higher innovation expenditure intensity, larger enterprises (Germany and Ireland),
and for domestic exporters (Ireland). A 1% increase in the number of employees is associated with a
probability to introduce marketing innovations higher by 3.8 percentage points in Germany, and by
7.5 percentage points in Ireland. Innovation expenditure per employee higher by 1% is associated with
a probability to introduce marketing innovations higher by 5.5 percentage points in Germany, by 14.9
percentage points in Ireland and by 2.3 percentage points in the UK. Irish‐owned exporters are more
likely by 26 percentage points than non‐exporters to introduce marketing innovations. Moreover, the
successful implementation of marketing innovations is positively linked to cooperation with other
enterprises within the same enterprise group (Germany), with suppliers (Ireland and the UK), with
customers (the UK), and with universities (Germany). Once again the patterns of the links between co‐
operations in innovation and innovation performance seem to reflect the specificities of the
innovation policy frameworks in the three countries.
Table 5 shows the estimates of the productivity equation for service enterprises in the three countries
analysed. The dependent variable is labour productivity measured as turnover per employee. The
explanatory variables include the predicted innovation outcomes for (product, process, organisational
or marketing innovations, enterprise size, ownership, and exporting. Unfortunately, the CIS data does
not contain data on the physical capital in all three countries. We control for differences in capital
endowment by including industry dummies at the three‐digit level (NACE Rev. 1 classification). The
productivity equation for Germany also includes a dummy variable which is equal to one for
enterprises located in East Germany, since even 20 years after reunification, there is a productivity
gap between firms in West and East Germany. Similar to the argument made for predicted innovation
expenditure in the innovation outcome equation, we have to address the fact that predicted
innovation outcome is a generated regressor in the productivity equation. To account for possible
errors in the estimated values of the predicted innovation outcome and the resulting bias in the
standard errors, we bootstrap standard errors in the productivity equation using 300 replications.
[Table 5 about here]
The results shown in Table 5 indicate that innovative service enterprises had higher productivity. This
positive link is evident for all types of innovation in Germany (except for market novelties) and the UK;
in Ireland innovation was also positively correlated with productivity, but it was statistically significant
22
only for process and marketing innovations.21 In all three countries, the largest productivity returns
were found for marketing innovations.
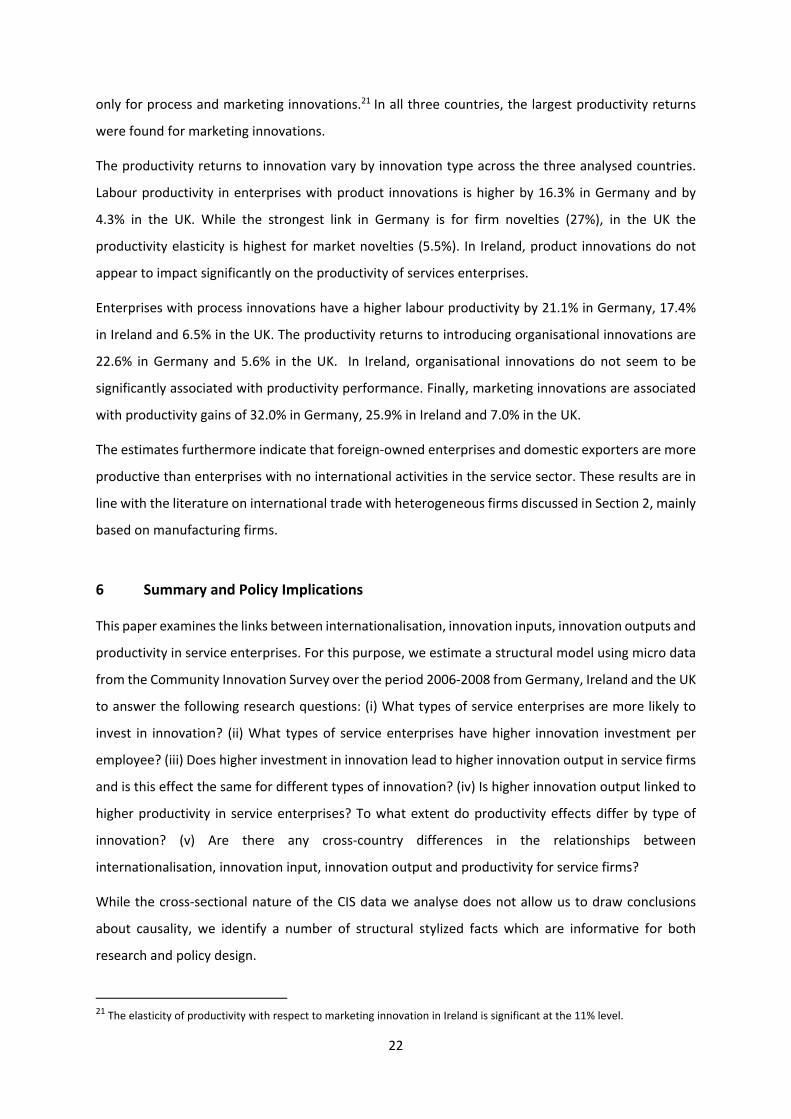
The productivity returns to innovation vary by innovation type across the three analysed countries.
Labour productivity in enterprises with product innovations is higher by 16.3% in Germany and by
4.3% in the UK. While the strongest link in Germany is for firm novelties (27%), in the UK the
productivity elasticity is highest for market novelties (5.5%). In Ireland, product innovations do not
appear to impact significantly on the productivity of services enterprises.
Enterprises with process innovations have a higher labour productivity by 21.1% in Germany, 17.4%
in Ireland and 6.5% in the UK. The productivity returns to introducing organisational innovations are
22.6% in Germany and 5.6% in the UK. In Ireland, organisational innovations do not seem to be
significantly associated with productivity performance. Finally, marketing innovations are associated
with productivity gains of 32.0% in Germany, 25.9% in Ireland and 7.0% in the UK.
The estimates furthermore indicate that foreign‐owned enterprises and domestic exporters are more
productive than enterprises with no international activities in the service sector. These results are in
line with the literature on international trade with heterogeneous firms discussed in Section 2, mainly
based on manufacturing firms.
6 Summary and Policy Implications
This paper examines the links between internationalisation, innovation inputs, innovation outputs and
productivity in service enterprises. For this purpose, we estimate a structural model using micro data
from the Community Innovation Survey over the period 2006‐2008 from Germany, Ireland and the UK
to answer the following research questions: (i) What types of service enterprises are more likely to
invest in innovation? (ii) What types of service enterprises have higher innovation investment per
employee? (iii) Does higher investment in innovation lead to higher innovation output in service firms
and is this effect the same for different types of innovation? (iv) Is higher innovation output linked to
higher productivity in service enterprises? To what extent do productivity effects differ by type of
innovation? (v) Are there any cross‐country differences in the relationships between
internationalisation, innovation input, innovation output and productivity for service firms?
While the cross‐sectional nature of the CIS data we analyse does not allow us to draw conclusions
about causality, we identify a number of structural stylized facts which are informative for both
research and policy design.
21 The elasticity of productivity with respect to marketing innovation in Ireland is significant at the 11% level.

23
The predominant innovation types in service enterprises over the period analysed in the three
countries are organisational and marketing innovations.
Our empirical evidence highlights the importance of internationalisation in the context of engagement
in innovation and innovation outputs in all three countries. For all types of innovations, innovation
rates are the highest in enterprises with international activities (foreign‐owned and domestic
exporters) in Ireland and the UK. In Germany, this is true only for domestic exporters with product
innovations.
Our econometric analysis reveals that investment in innovation in service enterprises is more likely in
larger enterprises and in enterprises with export markets. Conditional on investing in innovation, we
then find a link between the internationalisation activities of service enterprises and the degree to
which they invest in innovation. In comparison to enterprises that serve only domestic markets, in
Ireland and the UK, the innovation expenditure per employee is significantly higher in foreign‐owned
enterprises, while in Germany, this was the case for German‐owned enterprises with export markets.
Innovation expenditure intensity is positively and significantly linked to all innovation outputs in
Germany and the UK, while in Ireland this result holds true only in the case of marketing innovations.
Further, our results illustrate the importance of knowledge and technology transfer for successful
innovation in service firms. Over and above enterprise size, innovation expenditure intensity (in
Germany and the UK), foreign ownership (Ireland) and exporting, successful innovation in service
enterprises appears to be positively associated with engagement in cooperation for innovation
activities with other enterprises (suppliers and customers) and with knowledge providers (universities,
public and private research institutes, consultants). In contrast, cooperation for innovation activities
with competitors is associated with a lower probability to innovate.
Innovation in service enterprises appears positively and significantly linked to labour productivity for
all types of innovation in Germany and the UK. In Ireland, this positive link is statistically significant
only in the cases of process and marketing innovations. In all three analysed countries, the largest
productivity returns in service enterprises are found for marketing innovations. The productivity
elasticity with respect to marketing innovations is estimated to be 0.32 in Germany, 0.26 in Ireland
and 0.07 in the UK. Given the specificities of services, this result is noteworthy. It could be interpreted
as indicating a positive link between marketing innovations and demand for new or improved services.
It also highlights the importance of investment in intangible capital items such as organisational capital
for productivity growth in services.
The similarities and differences in the relationships between internationalisation, innovation and
productivity in the three analysed countries may reflect their institutional framework for innovation

24
policy as well as their structural characteristics such as economic size and engagement in
internationalisation.
Our findings suggest that innovation in service enterprises could benefit from many of the policies
designed to incentivise and foster innovation in manufacturing enterprises, such as policies which
enable firm growth, and which enhance innovation capability and cooperation in innovation activities
with other enterprises and knowledge providers. In addition, our results suggest that targeting
resources to foster marketing innovation in service enterprises would be beneficial in terms of
productivity.
Acknowledgements
This paper was partly funded by the European Commission under the RTD 7th Framework (Grant
Agreement No. 244522) and Horizon 2020 Programmes. The work was also partly funded under the
programme of the Centre for Learning and Life Chances in Knowledge Economies and Societies
(LLAKES), an ESRC‐funded Research Centre with grant reference ES/J019135/1. Priit Vahter also
acknowledges financial support from the Estonian Research Agency project No. IUT20‐49. This
research uses statistical data from the Central Statistics Office (CSO) of Ireland. The permission for
controlled access to confidential micro data was granted in line with the Statistics Act, 1993. The use
of these statistical data does not imply the endorsement of the CSO in relation to the analysis or
interpretation of the statistical data. Also, this work contains statistical data which is Crown Copyright
and which has been made available by the UK Office for National Statistics (ONS) through the Secure
Data Service (SDS) and has been used by permission. Neither the ONS nor the SDS bear any
responsibility for the analysis or interpretation of the data reported here. This work uses research
data‐sets which may not exactly reproduce the National Statistics aggregates. The views expressed in
this work are solely the responsibility of the authors and should not be interpreted as reflecting the
views of the Central Bank of Ireland or the European System of Central Banks. We thank Mattia Di
Ubaldo for his generous assistance with Stata coding. We gratefully acknowledge useful comments
and suggestions from Horst Raff, two anonymous referees, Alan Barrett, Francesco Venturini and
participants at research presentations at the Economic and Social Research Institute (ESRI) in Dublin,
the Irish Economic Association Conference in Dublin and the Centre for European Economic Research
(ZEW) in Mannheim for useful comments and suggestions.
25
References
Aghion, P. and Howitt, P. (1992). “A Model of Growth through Creative Destruction”, Econometrica,
60 (2), 323‐351.
Aw, B. Y., M. J. Roberts, and T. Winston (2007). “Export Market Participation, Investments in R&D and
Worker Training, and the Evolution of Firm Productivity”, The World Economy 30, 83‐104.
Aw, B. Y., M. J. Roberts, and Xu (2011). “R&D Investment, Exporting and Productivity Dynamics”,
American Economic Review, vol. 101(4), 1312‐1344.
Baldwin, R.E., and F. Robert‐Nicoud (2008). “Trade and Growth with Heterogeneous Firms”, Journal
of International Economics 74, 21‐34.
Battisti, G. and Stoneman, P. (2010). How Innovative are UK Firms? Evidence from the Fourth UK
Community Innovation Survey on Synergies between Technological and Organizational
Innovations. British Journal of Management, 21, 187–206.
Bratti, M., and G. Felice. 2012. "Are Exporters more Likely to Introduce Product Innovations?" The
World Economy 35 (11), 1559‐1598.
Brynjolfsson, E., Milgrom, P. (2013). "Complementarity in Organizations" in The Handbook for
Organization Economics, Robert Gibbons and John Roberts (eds.), Princeton University Press.
Bustos, P. (2011), "Trade Liberalization, Exports, and Technology Upgrading: Evidence on the Impact
of MERCOSUR on Argentinean Firms," American Economic Review, 101 (1), 304‐40.
Cainelli, G., R. Evangelista, and M. Savona (2006) "Innovation and Economic Performance in Services:
a Firm‐level Analysis", Cambridge Journal of Economics, 30, 435‐458.
Cassiman, B., Golovko, E. (2011). Innovation and internationalization through exports. Journal of
International Business Studies, 42(1), 56‐75.
Cassiman, B., Veugelers, R. (2006). In search of complementarity in innovation strategy: internal R&D
and external knowledge acquisition. Management Science, 52, 68‐82.
Chiva, R., Alegre, J. (2009). Investment in design and firm performance: the mediating role of design
management. Journal of Product Innovation Management, 26, 424–440.
Crépon, B., E. Duguet, and J. Mairesse (1998) “Research, Innovation, and Productivity: An Econometric
Analysis at the Firm Level”, Economics of Innovation and New Technology 7, 115‐156.
Crespi, G., E. Tacsir, and F. Vargas (2014) “Innovation and Productivity in Services: Empirical Evidence
from Latin America”, UNU‐MERIT Working Paper 2014‐068.
Cohen, W. M. (2010), “Fifty years of empirical studies of innovative activity and performance”, in Hall,
B. H. and N. Rosenberg (eds), Handbook of the Economics of Innovation, Vol. 1, 129‐213, Oxford:
Elsevier.
Criscuolo, C., J. Haskel, and M. J. Slaughter. 2010. “Global Engagement and the Innovation Activities
of Firms.” International Journal of Industrial Organization 28, 191‐202.
Czarnitzki, D., B. Ebersberger and A. Fier (2006). “The Relationship Between R&D Collaboration,
Subsidies and Patenting Activity: Empirical Evidence from Finland and Germany”, Journal of
Applied Econometrics, 22 (7), 1347‐1366.
Czarnitzki, D., Thorwarth, S. (2012). The contribution of in‐house and external design activities to
product market performance. Journal of Product Innovation Management, 29 (5), 878–895.
de Vries, E. J. (2006) "Innovation in services in networks of organizations and in the distribution of
services", Research Policy, 25, 1037‐1051.
Drejer, I. (2004) "Identifying Innovation in Surveys of Services: A Schumpeterian Perspective",
Research Policy, 33 (3), 551‐562.

26
Evangelista, R. (2000) "Sectoral Patterns of Technological Change in Services", Economics of Innovation
and New Technology', 9 (3), 183‐221.
Gallouj, F. and O. Weinstein (1997) "Innovation in Services", Research Policy, 26: 537‐556.
Gallouj, F. and M. Savona (2009) "Innovation in Services: A Review of the Debate and a Research
Agenda", Journal of Evolutionary Economics 19, 149‐172.
Gallouj, F. and M. Savona (2010) "Towards a Theory of Innovation in Services; A State of the Art", in
Gallouj, F. and F. Djellal (eds.), The Handbook of Innovation in Services. A Multi‐Disciplinary
Perspective. Edward Elgar, Chlethenham, 27‐48.
Griffith, R., E. Huergo, J. Mairesse, and B. Peters (2006) “Innovation and Productivity across Four
European Countries”, Oxford Review of Economic Policy, Vol. 22. No. 4, 483‐498.
Griliches, Z. (1979). “Issues in Assessing the Contribution of Research and Development to Productivity
Growth”. Bell Journal of Economics 10 (1), 92–116.
Griliches, Z. (1996), “The Discovery of the Residual: A Historical Note, Journal of Economic Literature
34 (3): 1324‐1330.
Grossman, G.M. and E. Helpman (1990), “Trade, Innovation and Growth”, American Economic Review,
80 (2): 86‐91.
Hall, B. H., F. Lotti and J. Mairesse (2009). “Innovation and Productivity in SMEs: Empirical Evidence
for Italy”, Small Business Economics, 33, 13‐33.
Hall, B. (2011), “Innovation and Productivity”, Nordic Economic Policy Review 2: 167‐204.
Hall, B. and Mohnen, P. (2013), “Innovation and Productivity: An Update”, Eurasian Business Review 3
(1), 47‐65.
Heckman, J. J. (1976), "The Common Structure of Statistical Models of Truncation, Sample Selection
and Limited Dependent Variables and a Simple Estimator for Such Models", Annals of Economic
and Social Measurement 5 (4), 475–492.
Heckman, J. J. (1979), Sample Selection Bias as a Specification Error, Econometrica 47 (1), 153–162.
Helpman, E., M. Melitz, and S. Yeaple (2004) “Export versus FDI with Heterogeneous Firms”, American
Economic Review, 94 (1), 300‐316.
Hipp, C., and H. Grupp (2005). "Innovation in the Service Sector: The Demand for Service‐Specific
Measurement Concepts and Typologies", Research Policy, 34 (4), 517‐535.
Hollenstein, H. (2003). "Innovation Modes in the Swiss Service Sector: A Cluster Analysis Based on
Firm‐Level Data", Research Policy 36 (5), 680‐695.
Howells, J. (2001). "The Nature of Innovation in Services", in Innovation and Productivity in Services,
Paris: OECD, 57‐82.
Izsák, K., P. Markianidou and S. Radošević (2013). Lessons from a Decade of Innovation Policy, Final
Report, European Commission, www.ec.europa.eu.
Johne, A. and C. Storey (1998) "New Service Development: A Review of the Literature and Annotated
Bibliography", European Journal of Marketing, vol. 32 (3/4), 184‐251.
Junge, M., Severgnini, B., Sorensen, A. (2016). Product‐Marketing Innovation, Skills, and Firm
Productivity Growth. Review of Income and Wealth, 62(4), 724‐757.
Laursen, K., Salter, A. (2006). Open for innovation: the role of openness in explaining innovation
performance among UK manufacturing firms. Strategic Management Journal, 27,131–150.
Leiponen, A. (2012) "The benefits of R&D and Breadth in Innovation Strategies: A Comparison of
Finnish Service and Manufacturing Firms", Industrial and Corporate Change 21 (5), 1255‐1281.
Licht, G. and D. Moch (1999) "Innovation and Information Technology in Services", Canadian Journal
of Economics 32 (2), 363‐383.

27
Lileeva, A., and D. Trefler (2010). “Improved Access to Foreign Markets Raises Plant‐level
Productivity…for some Plants”, Quarterly Journal of Economics 125, 1051‐1099.
Liu, X., and T. Buck (2007) “Innovation Performance and Channels for International Technology
Spillovers: Evidence from Chinese High‐Tech Industries, Research Policy 36(3), 355‐366.
Love, J. and S. Roper (2002), “Innovation and Export Performance: Evidence from UK and German
Manufacturing Plants.” Research Policy, 31 (7), 1087‐1102.
Love, J. H., Roper, S., Vahter, P. (2014). Dynamic Complementarities in Innovation Strategies. Research
Policy, 43(10), 1774‐1784.
Lööf, H., and A. Heshmati (2006) “On the relationship between innovation and performance: A
sensitivity analysis”, Economics of Innovation and New Technology 15, 317‐344.
Mairesse, J. and Sassenou, M. (1991). "R&D Productivity: A Survey of Econometric Studies at the Firm
Level," NBER Working Papers 3666, National Bureau of Economic Research, Inc.
Mairesse, J., and P. Mohnen (2002) "Accounting for Innovation and Measuring Innovativeness: An
Illustrative Framework and an Application", American Economic Review 92 (2), 226‐230.
Mairesse, J., and P. Mohnen (2010) "Using Innovation Surveys for Econometric Analysis", in B. H. Hall
and N. Rosenberg (eds.) Handbook of the Economics of Innovation, Vol. 2, 1129‐1155, Oxford:
Elsevier.
Mairesse, J., and S. Robin (2009) "Innovation and Productivity: A Firm‐level Analysis for French
Manufacturing and Services Using CIS3 and CIS4 data (1998‐2000 and 2002‐2004)", CREST‐
ENSAE, Paris, France.
Mairesse, J. and Mohnen, P. (2010). Using innovation surveys for econometric analysis. In: B.H. Hall
and N. Rosenberg (eds.) Handbook of the Economics of Innovation. Amsterdam: Elsevier, 1130‐
1155.
Martin, B. R. (2012). The evolution of science policy and innovation studies. Research Policy, 41 (7),
1219‐1239.
Martinez‐Ros, E. and Labeaga, J.M. 2009. Product and process innovation: Persistence and
complementarities. European Management Review, 6(1), 64‐75.
Masso, J. and P. Vather (2008). “Technological Innovation and Productivity in Late‐Transition Estonia:
Econometric Evidence from Innovation Surveys”, European Journal of Development Research,
20(2), 240‐261.
Masso, J. and P. Vahter (2012) "The Link Between Innovation and Productivity in Estonia's Services
Sector", The Service Industries Journal 32 (16), 2527‐2541.
Milgrom, P., Roberts, J. (1995). "Complementarities and Fit: Strategy, Structure, and Organizational
Change in Manufacturing." Journal of Accounting and Economics, 19(2‐3), 179‐208.
Milgrom, P., Roberts, J. (1990). "The Economics of Modern Manufacturing: Technology." American
Economic Review, 80(3), 511‐28.
Miravete, E. and Pernías, J. 2006. Innovation complementarity and scale of production. Journal of
Industrial Economics, 54(1), 1‐29.
Mohnen, P., Hall, B. H. (2013). “Innovation and Productivity: An Update”. Eurasian Business Review 3
(1), 47–65.
Miles, I. (2005) "Innovation in Services", in J. Fagerberg, D. Mowery, and R. Nelson (eds.), The Oxford
Handbook of Innovation, Oxford: Oxford University Press, 433‐458.
Melitz, M.J. (2003), “The Impact of Trade on Intra‐Industry Reallocations and Aggregate Industry
Productivity”, Econometrica, 71 (6), 1695‐1725.
OECD and European Commission (1997). Oslo Manual, 2nd edition, OECD, Paris.

28
OECD and European Commission (2005). Oslo Manual, 3rd edition, OECD, Paris.
OECD (2005). Growth in Services. Fostering Employment, Productivity and Innovation, OECD, Paris.
OECD (2009). Innovation in Frms. A Microeconomic Perspective, OECD, Paris.
OECD (2014) OECD Science, Technology and Industry Outlook 2014, OECD, Paris.
Pakes, A., Griliches, Z. (1984). “Patents and R&D at the Firm Level: A First Look.” In R&D, Patents, and
Productivity, 55–71. Chicago: University of Chicago Press.
Polder, M., van Leeuwen, G., Mohnen, P., and Raymond, W. (2009). Productivity effects of innovation
modes. Statistics Netherlands Discussion Paper, 09/033.
Polder, M., G. Van Leeuwen, P. Mohnen, and W. Raymond (2010), “Product, Process and
Organisational Innovation: Drivers, Complementarity and Productivity Effects”, CIRANO
Scientific Series No. 28, CIRANO, Montréal, Canada.
Romer, P. (1990) “Endogenous Technological Change”, Journal of Political Economy, 98(5), S71‐102.
Roper, S., Micheli, P., Love, J. H. and Vahter, P. (2016). "The roles and effectiveness of design in new
product development: A study of Irish manufacturers", Research Policy, 45(1), 319‐329.
Rosenberg, N. (1982). Inside the Black Box: Technology and Economics. University of Illinois at
Urbana‐Champaign's Academy for Entrepreneurial Leadership Historical Research Reference in
Entrepreneurship. Available at SSRN: https://ssrn.com/abstract=1496197.
Ruane, F. and I. Siedschlag (2013) “Boosting Innovation and Productivity in Enterprises: What Matters?
What Works?”, in Pete Lunn and Frances Ruane, Using Evidence to Inform Policy, Dublin: Gill &
MacMillan, 96‐117.
Savona, M. and W. E. Steinmueller (2013) "Service Output, Innovation and Productivity: A Time‐based
Conceptual Framework", Structural Change and Economic Dynamics 27, 118‐132.
Siedschlag, I., X. Zhang, and B. Cahill (2010) "The Effects of the Internationalisation of Firms on
Innovation and Productivity", ESRI Working Paper No. 363, Economic and Social Research
Institute, Dublin, Ireland.
Siedschlag, I., N. Killeen, D. Smith, and C. O' Brien (2011) "Internationalisation and the Innovation
Activities of Services Firms", ESRI Working Paper No. 406, Economic and Social Research
Institute, Dublin, Ireland.
Siedschlag, I., and X. Zhang (2015), “Internationalisation of Firms and their Innovation and
Productivity”, Economics of Innovation and New Technology, 24(3), 183‐203.
Soete, L., B. Verspagen, B. Ter Weel (2010), “Systems of Innovation", in Hall, B. H. and N. Rosenberg
(eds), Handbook of the Economics of Innovation, Vol. 2: 1156‐1180, Oxford: Elsevier.
Sundbo, J. (1997) "Management of Innovation in Services", The Service Industries Journal, 17(3), 432‐
455.
Syverson, C. (2011). “What Determines Productivity?”, Journal of Economic Literature, 49(2), 326‐365.
Tether, B. S. (2005) "Do Services Innovate (Differently)? Insights from the European Innobarometer
Survey", Industry and Innovation, 12 (2), 153‐184.
Tether, B. S., and A. Tajar (2008) "The Organisational‐Cooperation Mode of Innovation and its
Prominence amongst European Service Firms", Research Policy 37 (4), 720‐739.
Van Long, N., H. Raff, and F. Stähler (2011). “Innovation and Trade with Heterogeneous Firms”, Journal
of International Economics 84, 149‐159.
Yeaple, S. R. (2005), “A Simple Model of Firm Heterogeneity, International Trade, and Wages”, Journal
of International Economics, 65 (1), 1‐20.
Wagner, J. (1996), “Export Performance, Human Capital, and Product Innovation in Germany: A Micro
View”, Jahrbuch fur Wirtschaftswissenschaften, 47, 40‐45.

29
Table 1. Summary statistics of the services samples, CIS 2008
Services
GERMANY IRELAND UK
Productivity
Labour productivity (turnover per emp., euros) LP 242,600 897,863 389,850
Enterprise characteristics
Size (number of employees) SIZE 50.5 50.4 86.0
Foreign‐owned (%) FOREIGN 3.1 18.6 8.3
Domestic exporter (%) DOM_EXP 32.5 31.7 29.2
Domestic non‐exporter (%) DOM_NONEXP 64.5 49.7 62.5
Innovation inputs
Decision to invest in innovation (%) INNO 36.6 25.9 50.7
Innovation expenditure per employee (euros) INNOEXP 2 131 4 969 4 547
Decision to invest in R&D (%) RD 14.3 14.6 28.1
R&D expenditure per employee (euros) RDEXP 697 2 094 2 826
Innovation outputs
Product innovation (%) PROD 28.6 24.7 30.3
Market novelties (%) MARKET 9.0 15.1 14.6
Firm novelties (%) FIRM 25.2 18.1 22.7
Process innovation (%) PROC 27.5 29.9 18.8
Organisational innovation (%) ORGA 39.1 32.2 32.9
Marketing innovation (%) MARK 39.3 26.5 24.4
Cooperation for innovative activities with…
other enterprises within the same group (%) COOP_GRP 2.5 4.9 17.0
suppliers (%) COOP_SUP 2.5 5.7 20.9
clients or customers (%) COOP_CUST 2.0 5.4 25.4
competitors (%) COOP_COMP 1.2 2.8 11.4
consultants, commercial or private R&D labs (%) COOP_CON 2.1 2.9 9.3
universities or other higher education institutes (%) COOP_UNI 2.0 3.3 8.1
government or public research institutes (%) COOP_PUB 0.4 1.8 8.1
Observations 1333 1286 4344
Notes: Innovators are enterprises that report having at least one of the following types of innovation: product, process, organisational or marketing innovation. Enterprises reporting no innovation are considered non‐innovators. The samples are weighted by number of enterprises stratified by size class, industry and region. UK figures converted from £ to € using the exchange rate £1 = €1.2588 (2008 year average provided by the Bank of England). Labour productivity, size and innovation expenditure per employee are measured in non‐log values in Table 1. For the estimation, the log‐transformed values of these variables are used in order to account for the high skewness of these variables.
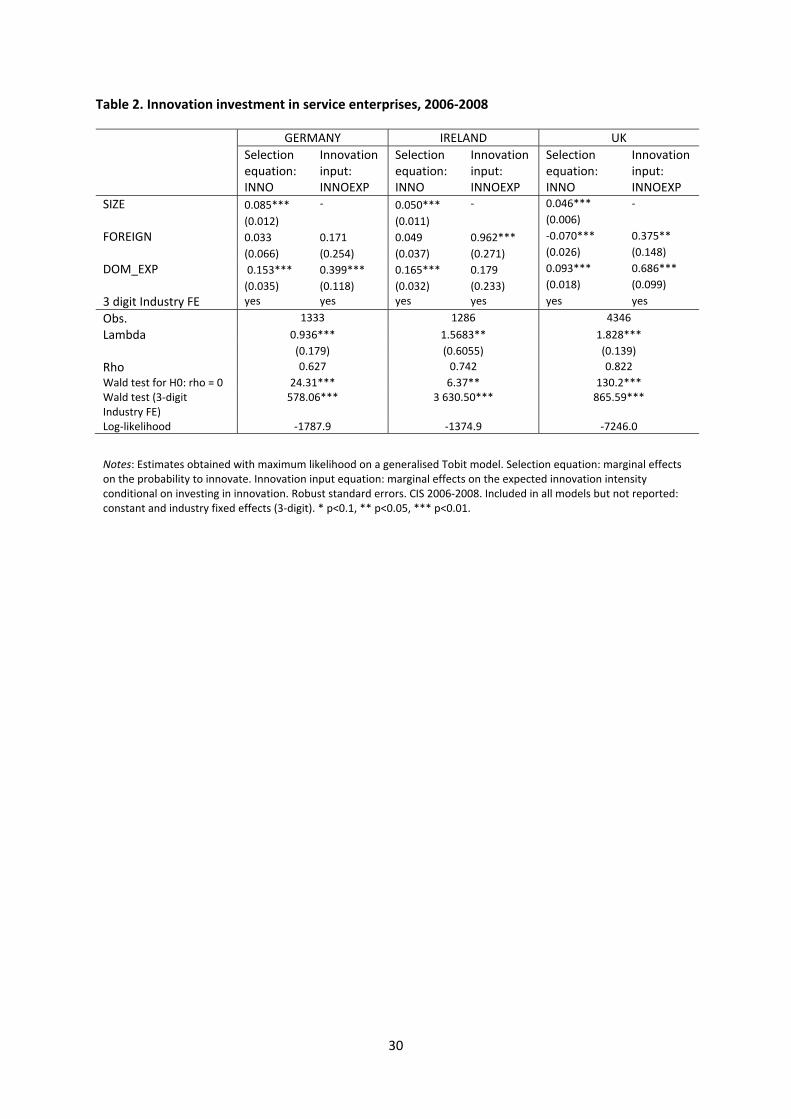
30
Table 2. Innovation investment in service enterprises, 2006‐2008
GERMANY IRELAND UK
Selection equation: INNO
Innovation input: INNOEXP
Selection equation: INNO
Innovation input: INNOEXP
Selection equation: INNO
Innovation input: INNOEXP
SIZE 0.085*** ‐ 0.050*** ‐ 0.046*** ‐
(0.012) (0.011) (0.006)
FOREIGN 0.033 0.171 0.049 0.962*** ‐0.070*** 0.375**
(0.066) (0.254) (0.037) (0.271) (0.026) (0.148)
DOM_EXP 0.153*** 0.399*** 0.165*** 0.179 0.093*** 0.686***
(0.035) (0.118) (0.032) (0.233) (0.018) (0.099)
3 digit Industry FE yes yes yes yes yes yes
Obs. 1333 1286 4346
Lambda 0.936*** 1.5683** 1.828***
(0.179) (0.6055) (0.139)
Rho 0.627 0.742 0.822
Wald test for H0: rho = 0 24.31*** 6.37** 130.2*** Wald test (3‐digit Industry FE)
578.06*** 3 630.50*** 865.59***
Log‐likelihood ‐1787.9 ‐1374.9 ‐7246.0
Notes: Estimates obtained with maximum likelihood on a generalised Tobit model. Selection equation: marginal effects on the probability to innovate. Innovation input equation: marginal effects on the expected innovation intensity conditional on investing in innovation. Robust standard errors. CIS 2006‐2008. Included in all models but not reported: constant and industry fixed effects (3‐digit). * p<0.1, ** p<0.05, *** p<0.01.

31
Table 3. Impact of innovation input on product innovation outcome in service enterprises, 2006‐2008
GERMANY IRELAND UK
PROD MARKET FIRM PROD MARKET FIRM PROD MARKET FIRM
Pred. INNOEXP 0.083*** 0.033*** 0.074*** 0.127 0.137 0.093 0.055*** 0.022*** 0.043*** (0.015) (0.010) (0.015) (0.096) (0.092) (0.097) (0.009) (0.005) (0.007) SIZE 0.022** 0.007 0.029*** 0.131*** 0.055 0.089** 0.005 0.001 0.002 (0.011) (0.006) (0.010) (0.045) (0.046) (0.041) (0.006) (0.003) (0.005) FOREIGN 0.012 0.041 ‐0.006 0.421*** 0.404** 0.238 ‐0.033 0.001 ‐0.025 (0.059) (0.034) (0.057) (0.162) (0.185) (0.170) (0.030) (0.016) (0.024) DOM_EXP 0.142*** 0.050*** 0.148*** 0.375*** 0.499*** 0.206 0.050** 0.040*** 0.030* (0.036) (0.019) (0.032) (0.122) (0.152) (0.141) (0.022) (0.012) (0.018) COOP_GROUP 0.221** 0.022 0.144** 0.824*** 0.717*** 0.427* 0.104*** 0.038*** 0.066*** (0.094) (0.041) (0.071) (0.270) (0.241) (0.233) (0.025) (0.014) (0.021) COOP_SUP 0.069 0.018 0.062 0.854*** 0.425* 0.721*** 0.125*** 0.035*** 0.082*** (0.111) (0.045) (0.090) (0.258) (0.247) (0.223) (0.022) (0.013) (0.019) COOP_CUST 0.372*** 0.091** 0.148* 0.279 0.275 0.382* 0.391*** 0.148*** 0.267*** (0.118) (0.042) (0.089) (0.283) (0.238) (0.226) (0.021) (0.012) (0.018) COOP_COMP ‐0.022 0.046 ‐0.035 0.325 0.258 0.144 0.009 ‐0.000 0.023 (0.109) (0.041) (0.086) (0.350) (0.406) (0.296) (0.034) (0.017) (0.024) COOP_CON 0.134 ‐0.019 0.051 0.177 0.241 0.305 0.022 0.023 0.011 (0.097) (0.049) (0.083) (0.347) (0.294) (0.311) (0.034) (0.017) (0.026) COOP_UNI 0.155 0.094** 0.105 0.599 0.107 0.470 ‐0.068* ‐0.027 ‐0.026 (0.102) (0.039) (0.089) (0.416) (0.334) (0.296) (0.040) (0.023) (0.033) COOP_PUB ‐0.041 0.046 ‐0.085 0.131 0.058 ‐0.342 0.006 0.051** ‐0.035 (0.175) (0.059) (0.128) (0.494) (0.419) (0.369) (0.045) (0.022) (0.032)
Obs. 1 333 1 327 1 333 1 256 1 247 1 256 4 346 4 333 4 346 Log‐likelihood ‐665.7 ‐385.8 ‐660.1 ‐530.4 ‐451.4 ‐530.4 ‐1956.0 ‐1360.0 ‐1 851 Pseudo R2 0.204 0.176 0.174 0.202 0.185 0.152 0.272 0.234 0.211 Wald test (Industry FE) 47.13*** 10.99 55.52*** 7.46 13.59* 9.37 37.44*** 49.61*** 10.54
Notes: Reported are marginal effects of probit model estimates; bootstrap standard errors after 300 replications; CIS 2006‐2008. Included in all models but not reported: constant and industry fixed effects (2‐digit). * p<0.1, ** p<0.05, *** p<0.01.

32
Table 4. Impact of innovation input on process, organisational and marketing innovations in service enterprises, 2006‐2008
GERMANY IRELAND UK
PROC ORGA MARK PROC ORGA MARK PROC ORGA MARK
Pred. INNOEXP 0.089*** 0.050*** 0.055*** 0.036 0.107 0.149* 0.027*** 0.029*** 0.023*** (0.016) (0.015) (0.015) (0.084) (0.078) (0.079) (0.006) (0.008) (0.007) SIZE 0.076*** 0.061*** 0.038*** 0.079** 0.166*** 0.075* 0.008* 0.035*** 0.003 (0.011) (0.012) (0.011) (0.039) (0.041) (0.041) (0.004) (0.006) (0.005) FOREIGN ‐0.050 ‐0.027 ‐0.010 0.310** 0.301** ‐0.030 ‐0.019 0.059** ‐0.017 (0.067) (0.070) (0.061) (0.142) (0.134) (0.155) (0.019) (0.026) (0.021) DOM_EXP 0.027 0.028 ‐0.022 0.282*** 0.449*** 0.260** 0.007 0.009 0.005 (0.036) (0.038) (0.040) (0.109) (0.111) (0.112) (0.016) (0.023) (0.018) COOP_GROUP 0.441*** 0.484*** 0.207** 0.132 ‐0.062 0.181 0.057*** 0.124*** 0.033 (0.105) (0.121) (0.094) (0.246) (0.223) (0.195) (0.018) (0.028) (0.023) COOP_SUP 0.154 0.021 ‐0.071 1.070*** 0.439* 0.789*** 0.128*** 0.113*** 0.109*** (0.111) (0.126) (0.107) (0.252) (0.238) (0.215) (0.021) (0.025) (0.020) COOP_CUST 0.201** ‐0.022 0.053 0.513* 0.643*** 0.043 0.195*** 0.326*** 0.201*** (0.100) (0.128) (0.106) (0.279) (0.236) (0.247) (0.017) (0.022) (0.019) COOP_COMP ‐0.016 0.004 0.115 ‐0.000 ‐0.009 0.192 ‐0.060*** ‐0.008 ‐0.019 (0.103) (0.115) (0.107) (0.377) (0.294) (0.302) (0.022) (0.037) (0.026) COOP_CON 0.085 0.147 0.016 0.660* 0.311 0.312 0.063*** 0.032 0.032 (0.103) (0.128) (0.095) (0.370) (0.297) (0.311) (0.024) (0.039) (0.026) COOP_UNI ‐0.065 0.061 0.172* 0.694* 0.410 0.126 ‐0.034 ‐0.030 ‐0.047 (0.099) (0.111) (0.104) (0.384) (0.296) (0.280) (0.028) (0.044) (0.032) COOP_PUB ‐0.100 ‐0.294* ‐0.135 ‐0.739 ‐0.272 ‐0.024 ‐0.022 0.018 0.030 (0.154) (0.166) (0.145) (0.551) (0.386) (0.388) (0.030) (0.045) (0.031)
Obs. 1 333 1 333 1 333 1 256 1 247 1 256 4 346 4 346 4 346 Log‐likelihood ‐737.580 ‐843.752 ‐855.947 ‐699.129 ‐729.851 ‐689.118 ‐1 686 ‐2 333 ‐2 016 Pseudo R2 0.1340 0.0864 0.0616 0.115 0.102 0.079 0.206 0.181 0.135 Wald test (Industry FE) 16.13* 28.83*** 24.44*** 4.46 18.10** 5.98 30.54*** 47.57*** 32.39***
Notes: Reported are marginal effects of probit model estimates; bootstrap standard errors after 300 replications; CIS 2006‐2008. Included in all models but not reported: constant and industry fixed effects (2‐digit). * p<0.1, ** p<0.05, *** p<0.01.

33
Table 5. Impact of innovation on productivity in service enterprises, 2006‐2008
Pred. INNOOUT SIZE FOREIGN DOM_EXP EAST GERMANY Obs R2 Wald test:
coeff s.d. coeff. s.d. coeff. s.d coeff. s.d coeff. s.d
3‐digit industry FE
GERMANY PROD 0.163*** (0.059) 0.009 (0.021) 0.454*** (0.144) 0.270*** (0.070) ‐0.221*** (0.047) 1333 0.504 1241.18***
MARKET 0.131 (0.083) 0.016 (0.021) 0.403*** (0.142) 0.296*** (0.073) ‐0.215*** (0.046) 1327 0.505 1110.93***
FIRM 0.270** (0.117) ‐0.005 (0.024) 0.457*** (0.142) 0.200** (0.101) ‐0.220*** (0.041) 1333 0.504 1375.86***
PROC 0.211*** (0.074) ‐0.027 (0.026) 0.474*** (0.145) 0.317*** (0.062) ‐0.223*** (0.043) 1333 0.506 1337.33***
ORGA 0.226*** (0.085) ‐0.017 (0.025) 0.467*** (0.137) 0.337*** (0.058) ‐0.222*** (0.039) 1333 0.505 1226.38***
MARK 0.320** (0.133) ‐0.013 (0.024) 0.468*** (0.126) 0.356*** (0.060) ‐0.221*** (0.043) 1333 0.504 1214.09***
IRELAND PROD 0.089 (0.088) 0.042 (0.044) 0.719*** (0.142) 0.284*** (0.095) ‐ 1256 0.201 357.15***
MARKET 0.161 (0.136) 0.040 (0.044) 0.675*** (0.157) 0.223* (0.104) ‐ 1247 0.202 351.87***
FIRM 0.178 (0.128) 0.036 (0.041) 0.705*** (0.150) 0.274*** (0.095) ‐ 1256 0.203 317.34***
PROC 0.174* (0.094) 0.038 (0.042) 0.707*** (0.153) 0.266** (0.108) ‐ 1256 0.203 318.78***
ORGA 0.194 (0.156) 0.019 (0.051) 0.691*** (0.142) 0.213 (0.131) ‐ 1247 0.202 337.15***
MARK 0.259a (0.162) 0.033 (0.044) 0.733*** (0.134) 0.226** (0.104) ‐ 1256 0.203 320.33***
UK PROD 0.043* (0.025) ‐0.092*** (0.013) 0.867*** 0.056 0.455*** (0.038) ‐ 4346 0.401 3903***
MARKET 0.055* (0.032) ‐0.092*** (0.014) 0.869*** 0.062 0.449*** (0.038) ‐ 4333 0.399 3655***
FIRM 0.051* (0.030) ‐0.092*** (0.013) 0.867*** 0.056 0.455*** (0.038) ‐ 4346 0.401 3883***
PROC 0.065** (0.031) ‐0.095*** (0.014) 0.867*** 0.056 0.458*** (0.038) ‐ 4346 0.401 3712***
ORGA 0.056* (0.032) ‐0.097*** (0.014) 0.854*** 0.057 0.462*** (0.037) ‐ 4346 0.401 3781***
MARK 0.070* (0.039) ‐0.093*** (0.013) 0.868*** 0.056 0.462*** (0.037) ‐ 4346 0.401 3700***
Notes: Dependent variable: log labour productivity measured as log(turnover/employees). IV estimates using predicted innovation outputs; bootstrap standard errors after 300 replications; CIS 2006‐2008. Included in all models but not reported: constant and industry fixed effects (3‐digit). * p<0.1, ** p<0.05, *** p<0.01. a p = 0.11.