Embed Size (px)
Citation preview
International workshop on Asian Greenhouse Gases
Budgets
Physical Research Laboratory, Ahmedabad, India 27-29 September 2011
Pep Canadell*, Prabir Patra *CSIRO Marine and Atmospheric Research
Canberra, Australia
1. To provide higher spatial resolution of the global carbon balance with the aim to improve attribution to processes and hot-spots regions essential to understand the future evolution of the carbon-climate feedback.
Why Regional Carbon Budgets?
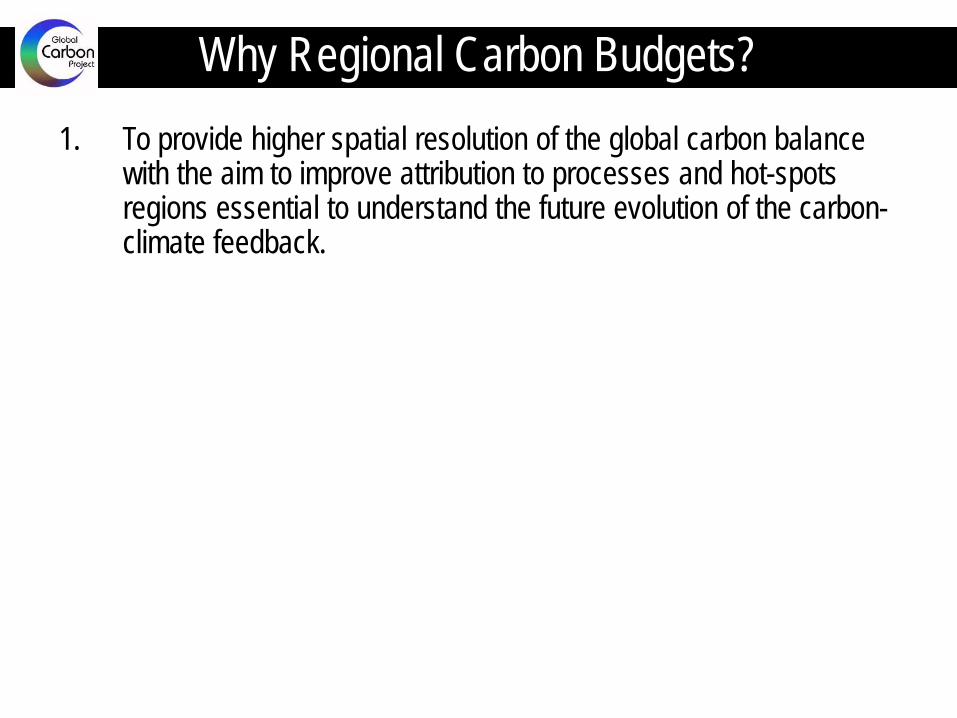
Fate of Anthropogenic CO2 Emissions 2010
0.9±0.6 PgC y-1 +
9.1±0.9 PgC y-1 5.0±0.1 PgC y-1
47%
26% 2.4±0.5 PgC y-1
Average of 5 models
2.6 PgC y-1
27% Calculated as the residual of
all other flux components
Global Carbon Project 2011; Updated from Le Quéré et al. 2009, Nature Geoscience; Canadell et al. 2007, PNAS
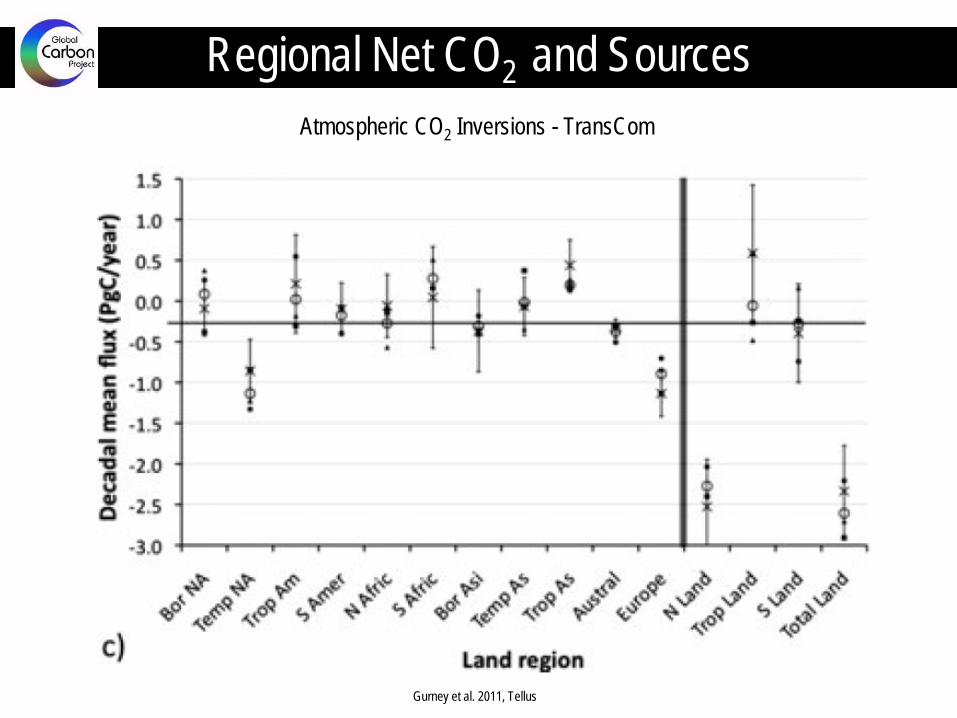
Gurney et al. 2011, Tellus
Regional Net CO2 and Sources Atmospheric CO2 Inversions - TransCom
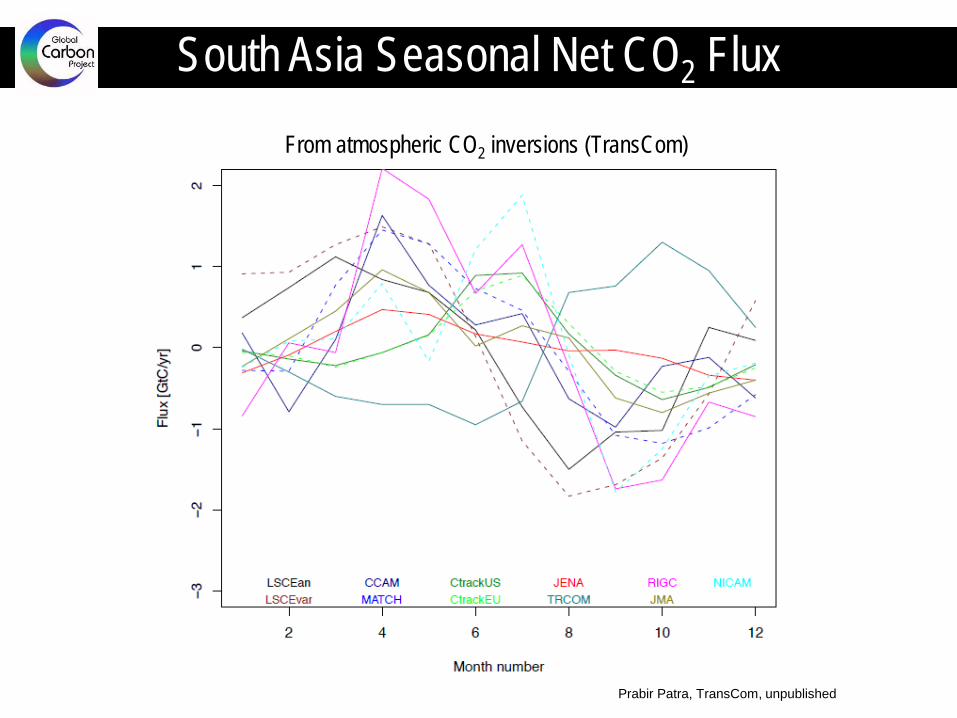
South Asia Seasonal Net CO2 Flux From atmospheric CO2 inversions (TransCom)
Prabir Patra, TransCom, unpublished
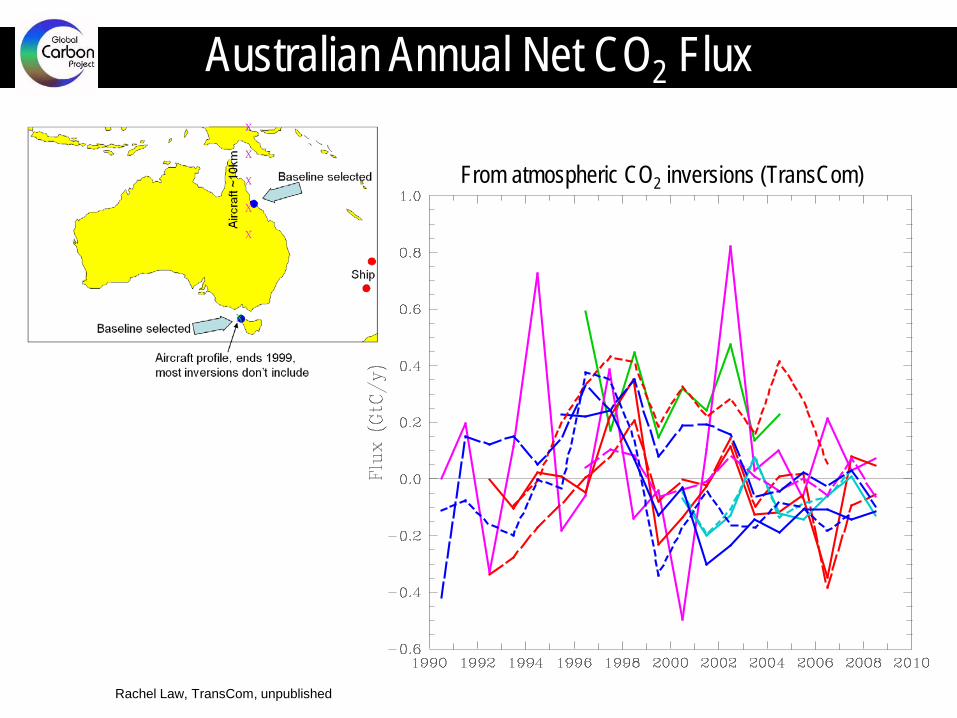
Australian Annual Net CO2 Flux
Rachel Law, TransCom, unpublished
From atmospheric CO2 inversions (TransCom)
1. To provide higher spatial resolution of the global carbon balance with the aim to improve attribution to processes and hot-spots regions essential to understand the future evolution of the carbon-climate feedback.
2. To address a growing demand for a capacity to Measure, Report, and Verify (MRV) the evolution of regional fluxes and the outcomes of climate mitigation policies.
Why Regional Carbon Budgets?
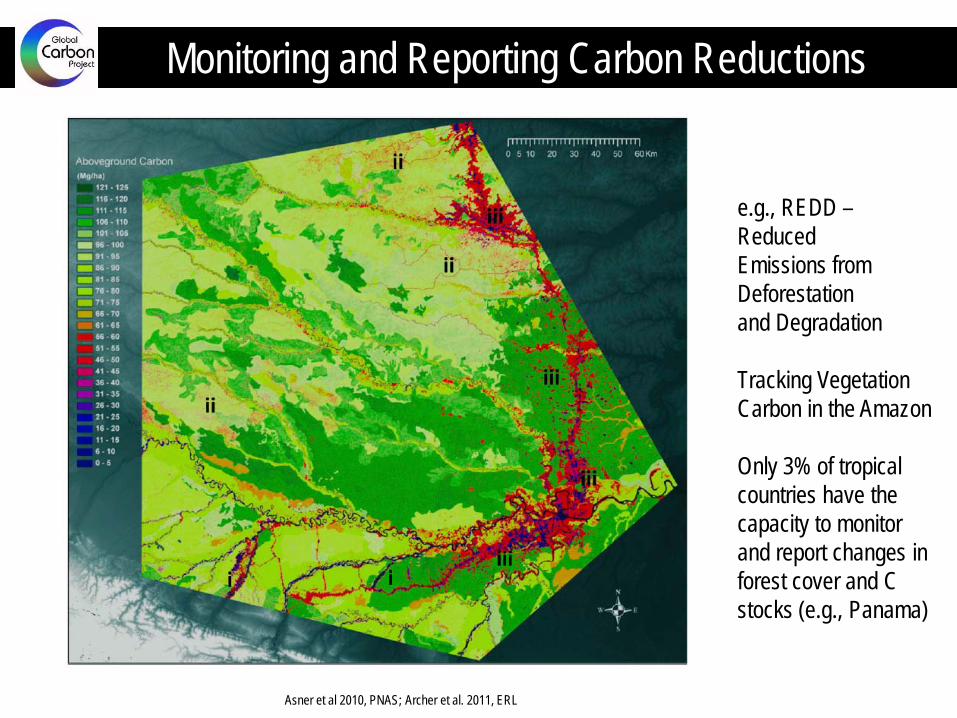
Asner et al 2010, PNAS; Archer et al. 2011, ERL
Monitoring and Reporting Carbon Reductions
e.g., REDD – Reduced Emissions from Deforestation and Degradation Tracking Vegetation Carbon in the Amazon Only 3% of tropical countries have the capacity to monitor and report changes in forest cover and C stocks (e.g., Panama)
1. To provide higher spatial resolution of the global carbon balance with the aim to improve attribution to processes and hot-spots regions essential to understand the future evolution of the carbon-climate feedback.
2. To address a growing demand for a capacity to Measure, Report, and Verify (MRV) the evolution of regional fluxes and the outcomes of climate mitigation policies.
3. To support regions to further develop the technical capacity to synthesize their carbon balances and enhance observations.
Why Regional Carbon Budgets?
1. To provide higher spatial resolution of the global carbon balance with the aim to improve attribution to processes and hot-spots regions essential to understand the future evolution of the carbon-climate feedback.
2. To address a growing demand for a capacity to Measure, Report, and Verify (MRV) the evolution of regional fluxes and the outcomes of climate mitigation policies.
3. To support regions to further develop the technical capacity to synthesize their carbon balances and enhance observations.
4. To respond to the Group on Earth Observations (EOS) in establishing a global carbon observatory to track the evolution of natural and anthropogenic carbon sources and sinks.
Why Regional Carbon Budgets?
• To establish the mean carbon balance of large regions of the globe at the scale of continents and large ocean basins, including their component fluxes.
• To do it by comparing and reconciling multiple bottom-up estimates with the results of regional top-down atmospheric inversions, with attribution to main flux components.
• To evaluate the regional ‘hot-spots’ of interannual variability and possibly the trends and underlying processes over the past two (or more) decades by combining available long-term observations and modeling.
REgional Carbon Cycle Assessment and Processes (RECCAP)
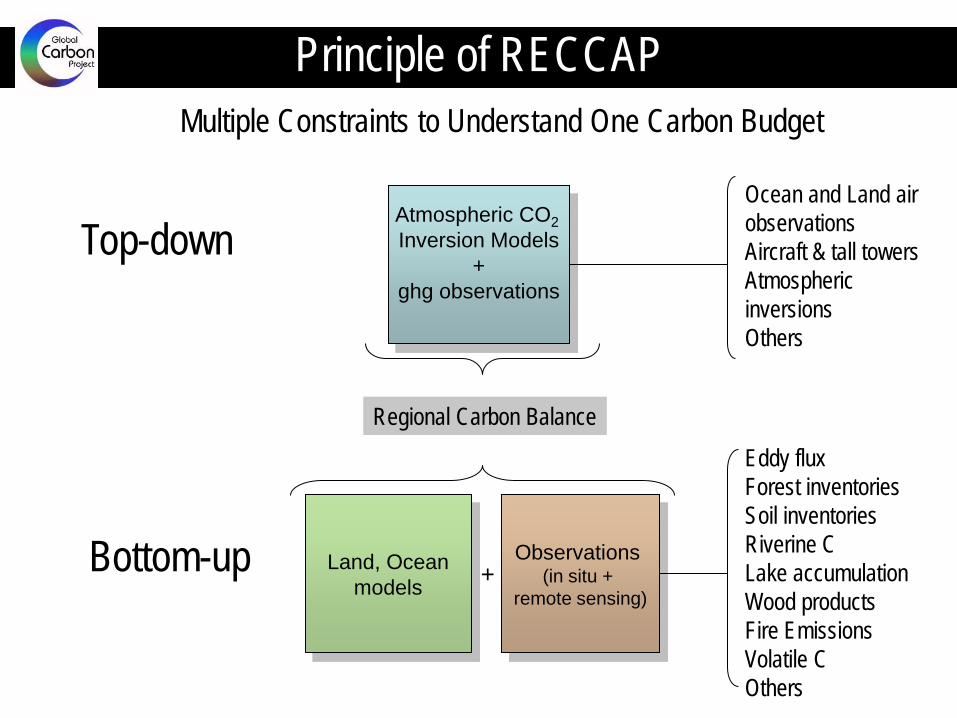
Multiple Constraints to Understand One Carbon Budget
Atmospheric CO2 Inversion Models
+ ghg observations
Observations (in situ +
remote sensing)
Land, Ocean models +
Regional Carbon Balance
Top-down
Bottom-up
Principle of RECCAP
Eddy flux Forest inventories Soil inventories Riverine C Lake accumulation Wood products Fire Emissions Volatile C Others
Ocean and Land air observations Aircraft & tall towers Atmospheric inversions Others
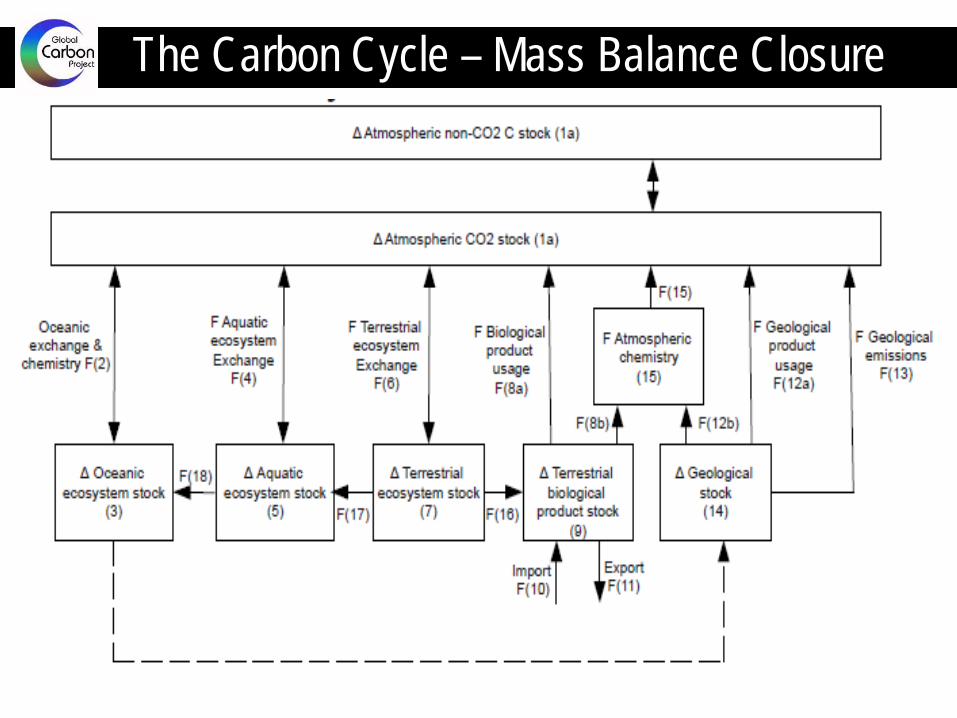
The Carbon Cycle – Mass Balance Closure
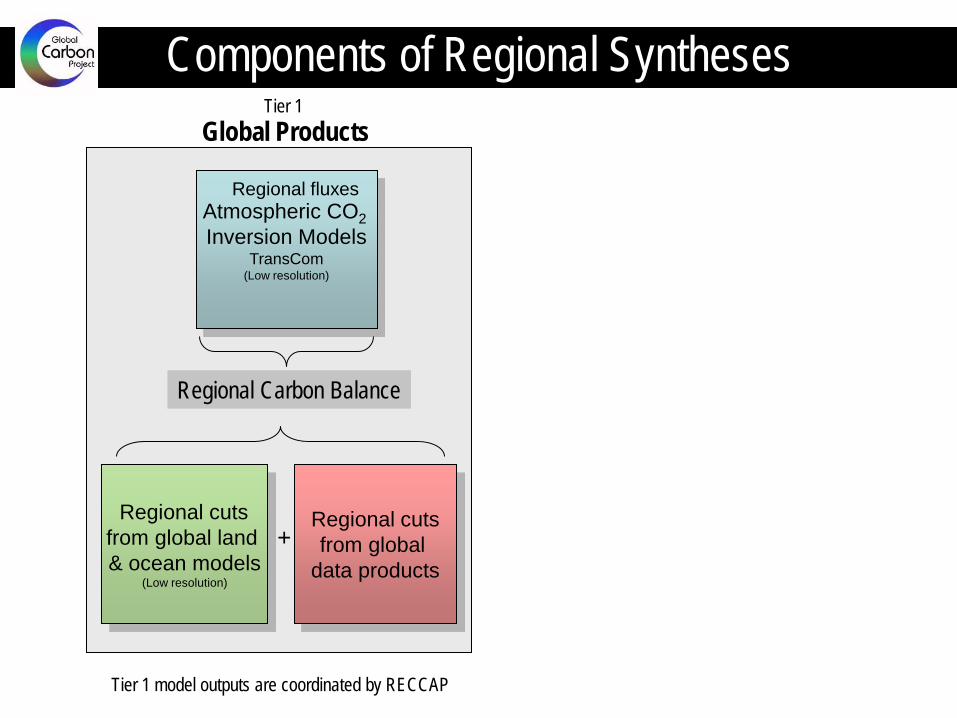
Atmospheric CO2 Inversion Models
TransCom (Low resolution)
Regional cuts from global land & ocean models
(Low resolution)
Regional cuts from global
data products +
Regional Carbon Balance
Global Products Tier 1
Regional fluxes
Tier 1 model outputs are coordinated by RECCAP
Components of Regional Syntheses
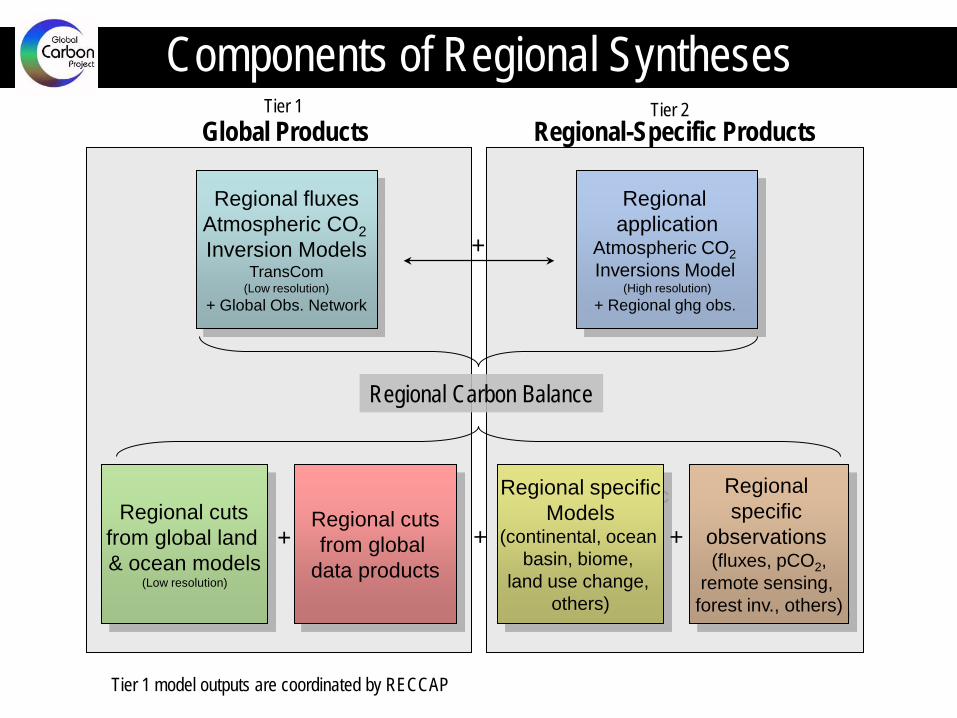
Regional fluxes Atmospheric CO2 Inversion Models
TransCom (Low resolution)
+ Global Obs. Network
Regional application
Atmospheric CO2 Inversions Model
(High resolution) + Regional ghg obs.
Regional specific
observations (fluxes, pCO2,
remote sensing, forest inv., others)
Regional specific Models
(continental, ocean basin, biome,
land use change, others)
Regional cuts from global land & ocean models
(Low resolution)
Regional cuts from global
data products + + +
Regional Carbon Balance
+
Global Products Regional-Specific Products Tier 1 Tier 2
Tier 1 model outputs are coordinated by RECCAP
Components of Regional Syntheses
• Reconciliation of flux estimates (independently assessed and often partially overlapping) as a means to build confidence in our understanding of the component fluxes, mean estimates, and inter-annual variability.
• Although we are ultimately interested in building a mathematically-formalized multiple constraint approach, model data fusion or data assimilation (eg, like in weather and hydrological forecast), we are not pursuing this approach in a first phase.
• Uncertainties need to be quantitatively estimated.
Synthesis Approach Top-down Bottom-up
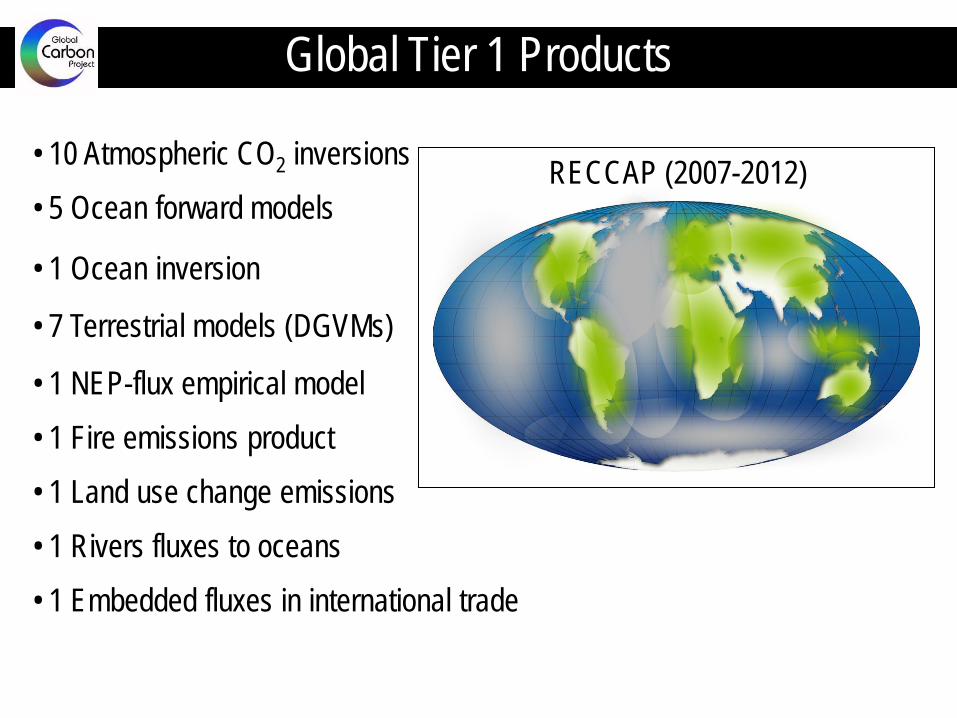
RECCAP (2007-2012) • 10 Atmospheric CO2 inversions
• 5 Ocean forward models
• 1 Ocean inversion
• 7 Terrestrial models (DGVMs)
• 1 NEP-flux empirical model
• 1 Fire emissions product
• 1 Land use change emissions
• 1 Rivers fluxes to oceans
• 1 Embedded fluxes in international trade
Global Tier 1 Products
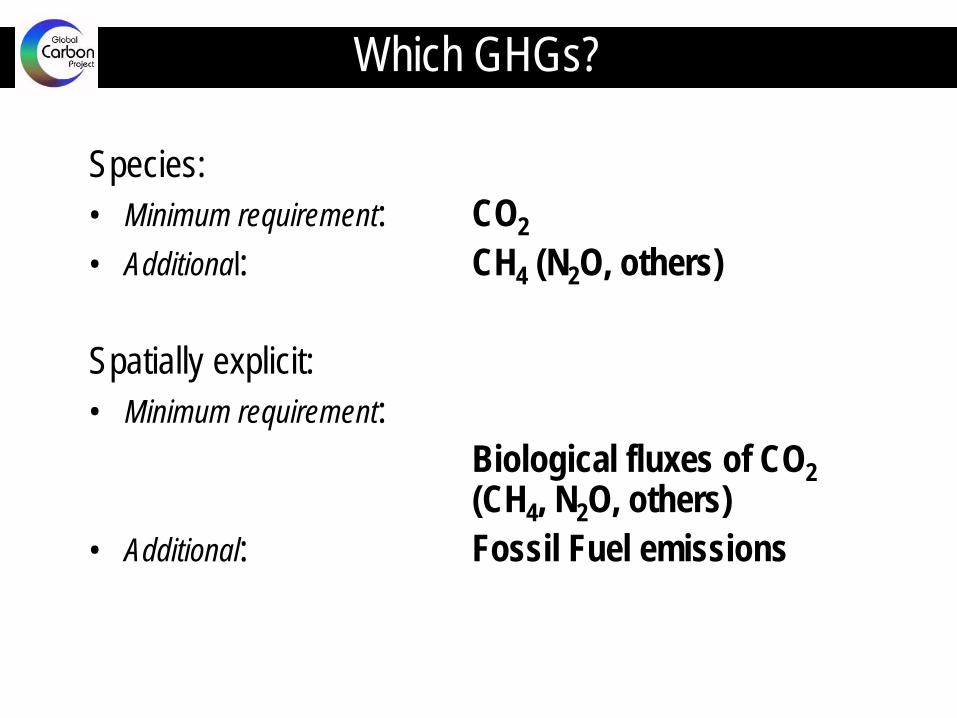
Species: • Minimum requirement: CO2 • Additional: CH4 (N2O, others) Spatially explicit: • Minimum requirement: Biological fluxes of CO2
(CH4, N2O, others) • Additional: Fossil Fuel emissions
Which GHGs?
Variable but centered around:
• Budget period: »1990-2009
• Trend analyses: »Land: 1958-2009 »Ocean: 1983-2009
RECCAP Period
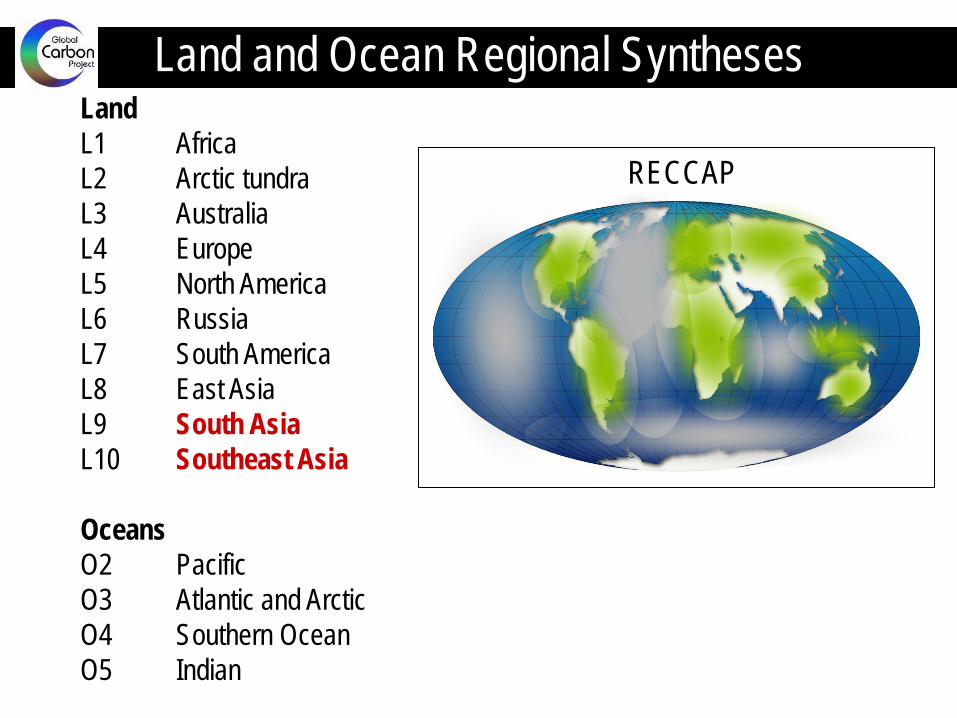
RECCAP
Land L1 Africa L2 Arctic tundra L3 Australia L4 Europe L5 North America L6 Russia L7 South America L8 East Asia L9 South Asia L10 Southeast Asia Oceans O2 Pacific O3 Atlantic and Arctic O4 Southern Ocean O5 Indian
Land and Ocean Regional Syntheses
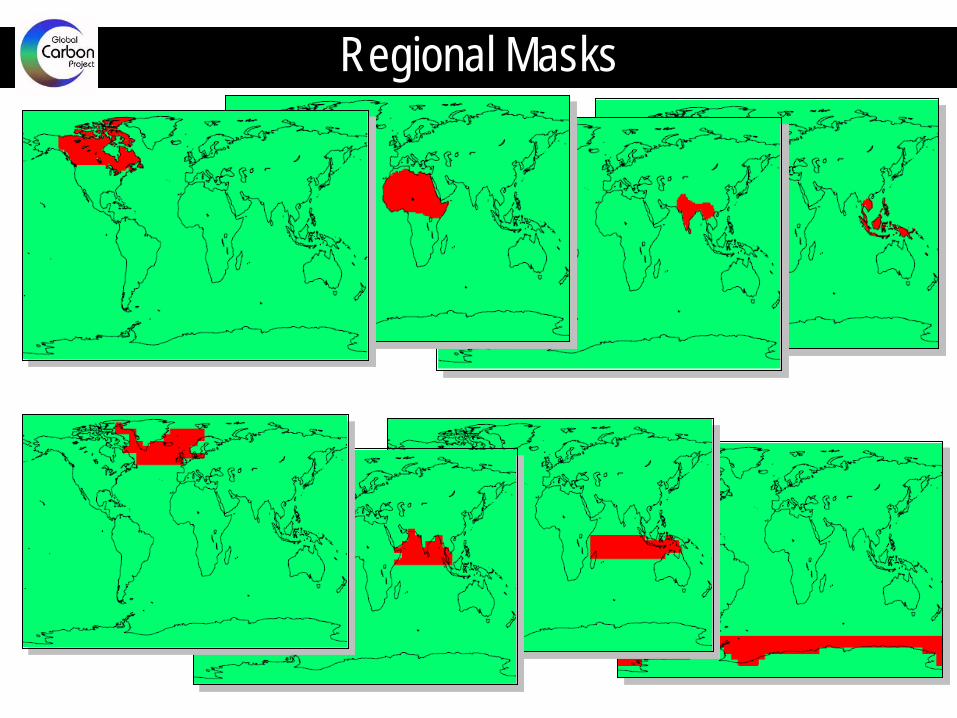
Regional Masks
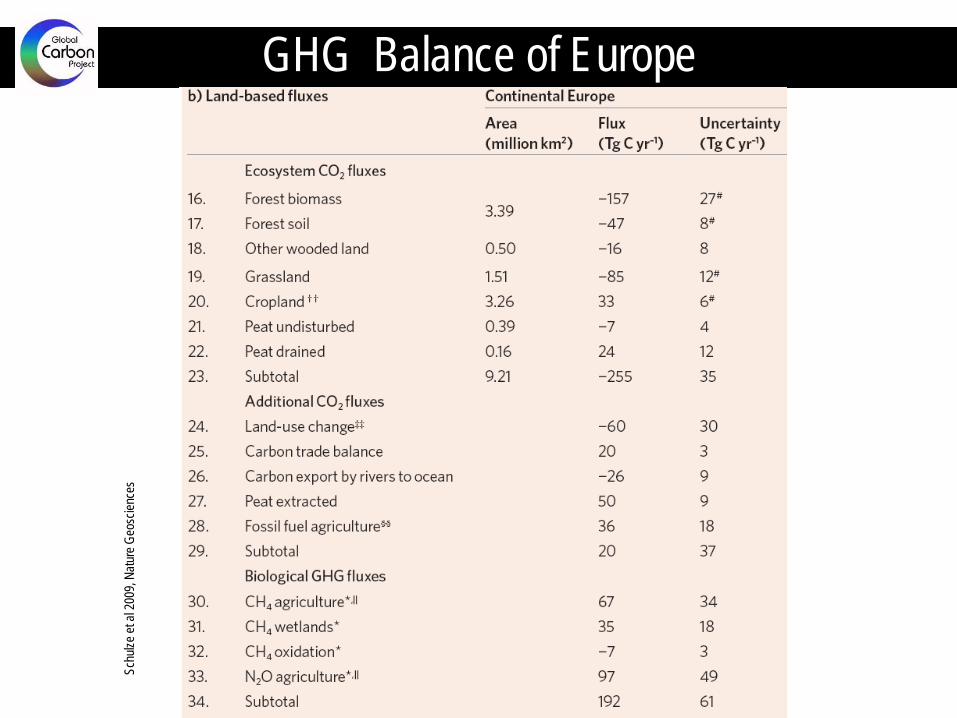
Schu
lze et
al 20
09, N
ature
Geo
scien
ces
GHG Balance of Europe
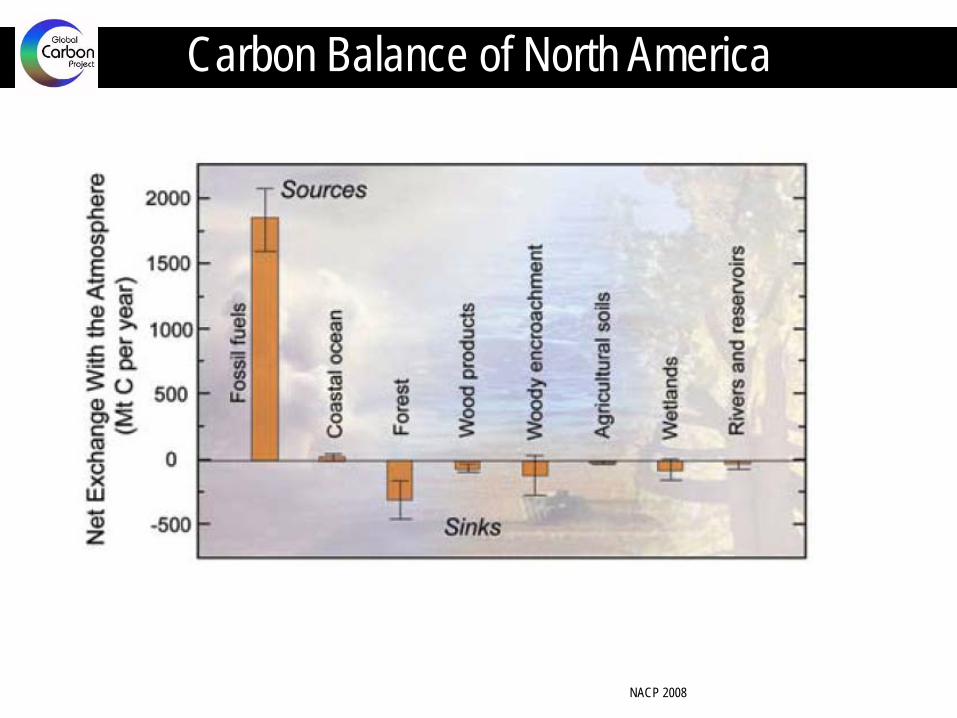
Carbon Balance of North America
NACP 2008
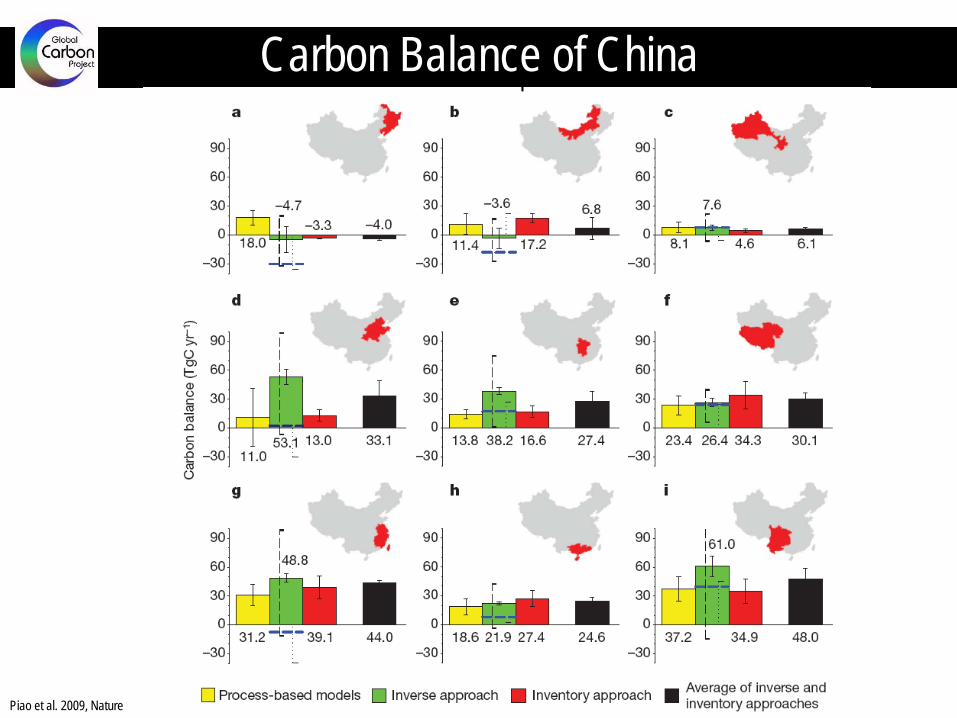
Piao et al. 2009, Nature
Land Example Carbon Balance of China
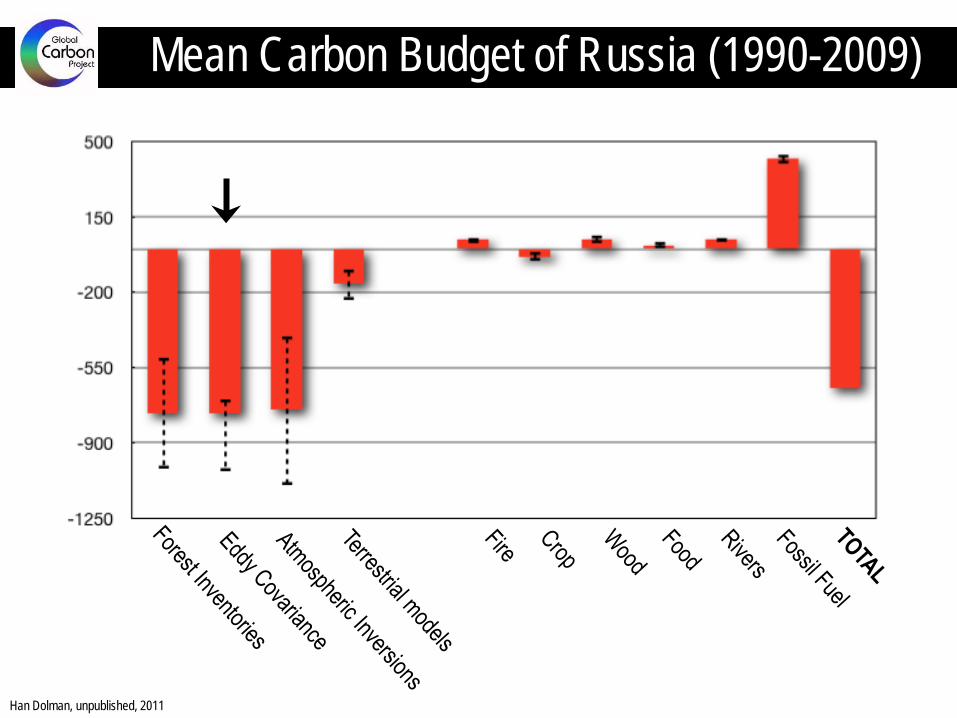
Mean Carbon Budget of Russia (1990-2009)
Han Dolman, unpublished, 2011
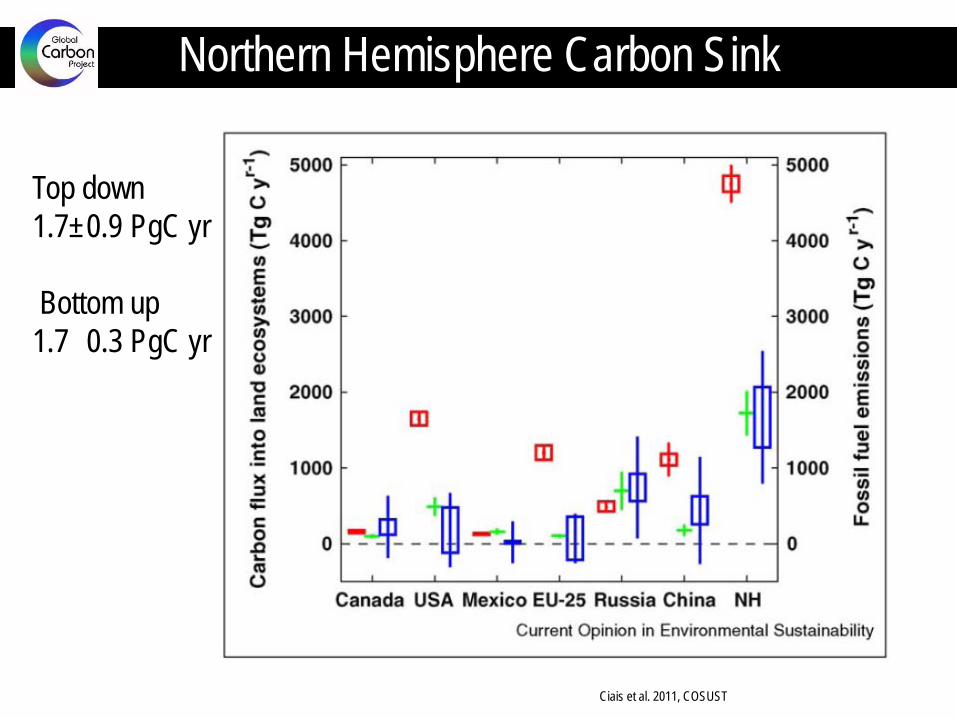
Northern Hemisphere Carbon Sink
Ciais et al. 2011, COSUST
Top down 1.7±0.9 PgC yr Bottom up 1.7 0.3 PgC yr
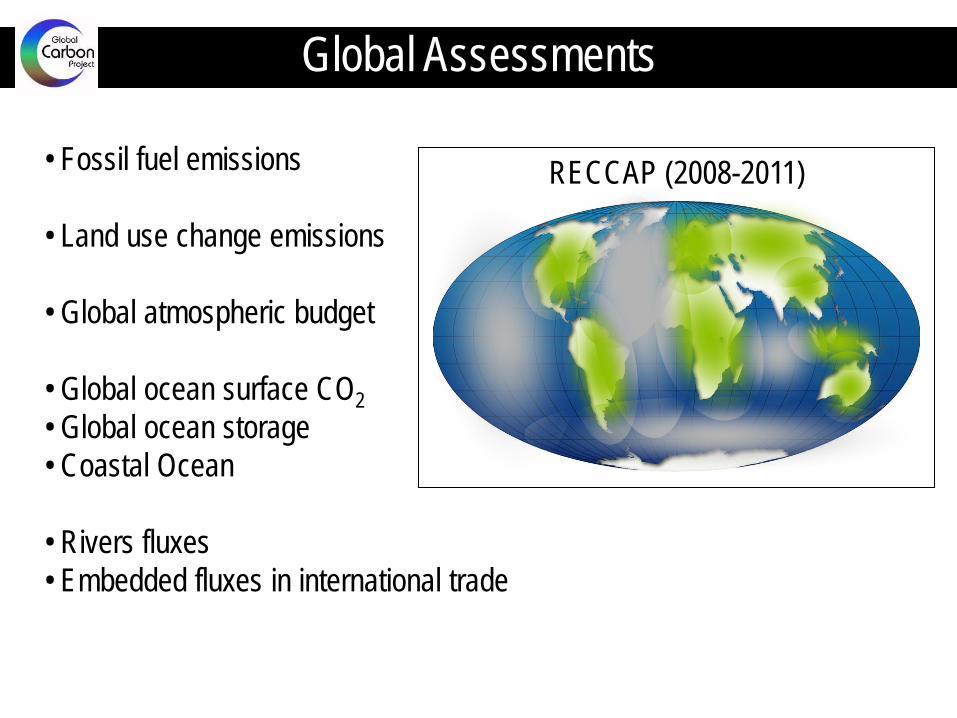
RECCAP (2008-2011) • Fossil fuel emissions
• Land use change emissions
• Global atmospheric budget
• Global ocean surface CO2 • Global ocean storage • Coastal Ocean
• Rivers fluxes • Embedded fluxes in international trade
Global Assessments
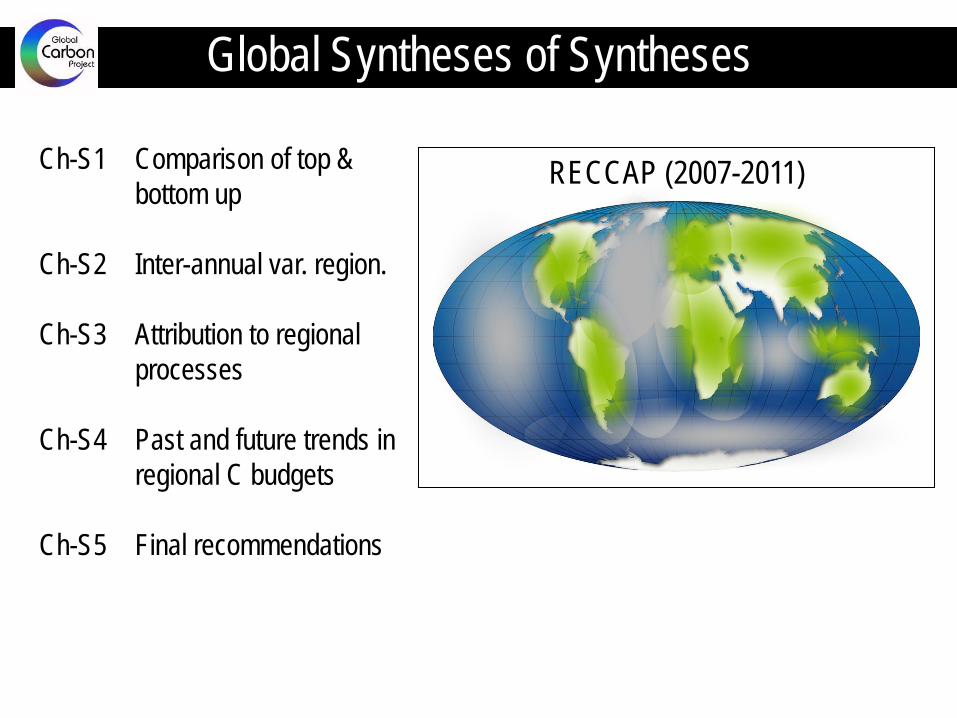
RECCAP (2007-2011) Ch-S1 Comparison of top & bottom up Ch-S2 Inter-annual var. region. Ch-S3 Attribution to regional processes Ch-S4 Past and future trends in regional C budgets Ch-S5 Final recommendations
Global Syntheses of Syntheses
www.globalcarbonproject.org/RECCAP