Embed Size (px)
Citation preview

International Variations in Health Care Expenditure
Todd Gilmer, PhDProfessor of Health Policy and Economics
Department of Family and Preventive Medicine
1
Increasing Health Care Expenditures
2

National Health Expenditures as a Percentage of GDP, 1960-2017
2009
17.3%
2009
$2.5 trillion
SOURCE: Centers for Medicare & Medicaid Services, Office of the Actuary, National Health Statistics Group. 9/2010
2019
19.3%
3

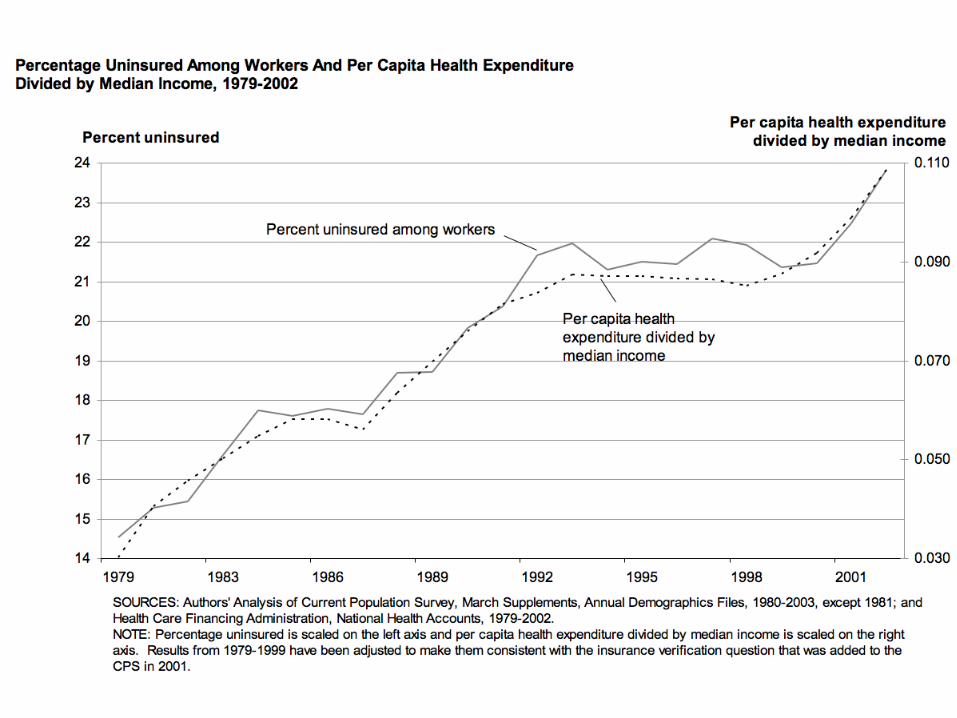
Why might this be a problem?
• Crowd out of public funds and opportunity costs facing federal and state governments
• Increasing rate of uninsured• Increasing burden on the poor• Some spending may be wasteful
– International variations
4

Distribution of National Health Expenditures, by Type of Service, 2008
Note: Other Personal Health Care includes, for example, dental and other professional health services, durable medical equipment, etc. Other Health Spending includes, for example, administration and net cost of private health insurance, public health activity, research, and structures and equipment, etc.
Source: Kaiser Family Foundation calculations using NHE data from Centers for Medicare and Medicaid Services, Office of the Actuary, National Health Statistics Group, at http://www.cms.hhs.gov/NationalHealthExpendData/ (see Historical; National Health Expenditures by type of service and source of funds, CY 1960-2008; file nhe2008.zip).
Physician/ Clinical Services 21.2%
Hospital Care 30.7%
Other Personal Health Care
12.9%
Nursing Home Care, 5.9%
Prescription Drugs10.0%
Home Health Care, 2.8%
Other Health Spending
16.5%
5


The Burden Of Public Spending, As Percentage Of Income, Nationally And By Income Quintile, 2004.
Ketsche P et al. Health Aff 2011;30:1637-1646
©2011 by Project HOPE - The People-to-People Health Foundation, Inc.
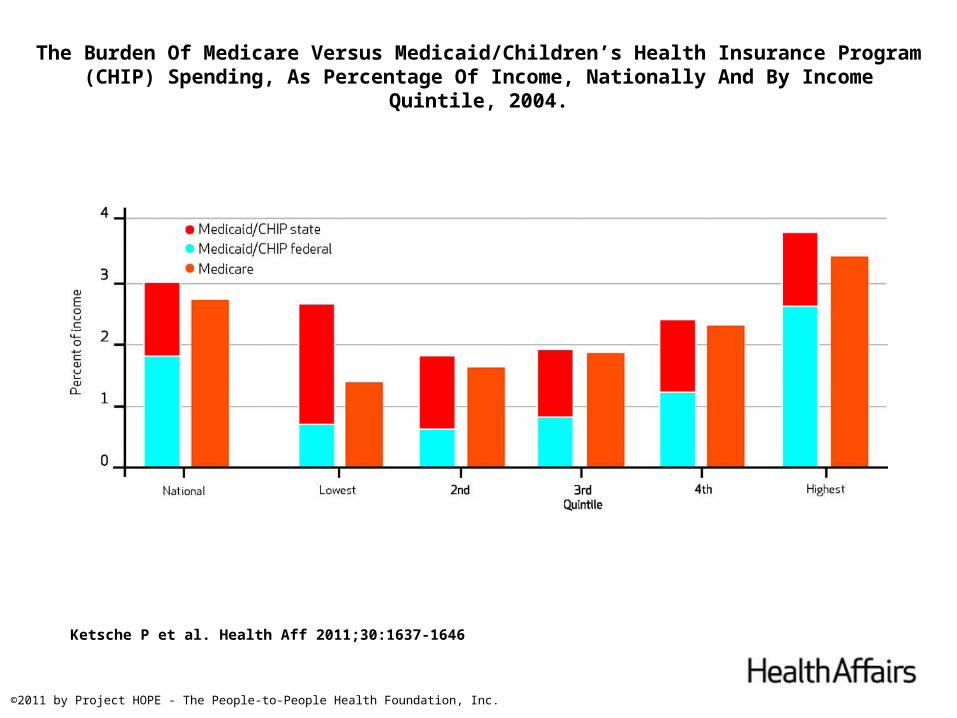
The Burden Of Medicare Versus Medicaid/Children’s Health Insurance Program (CHIP) Spending, As Percentage Of Income, Nationally And By Income Quintile, 2004.
Ketsche P et al. Health Aff 2011;30:1637-1646
©2011 by Project HOPE - The People-to-People Health Foundation, Inc.

The Burden Of Premiums, As Percentage Of Income, Nationally And By Income Quintile, 2004.
Ketsche P et al. Health Aff 2011;30:1637-1646
©2011 by Project HOPE - The People-to-People Health Foundation, Inc.

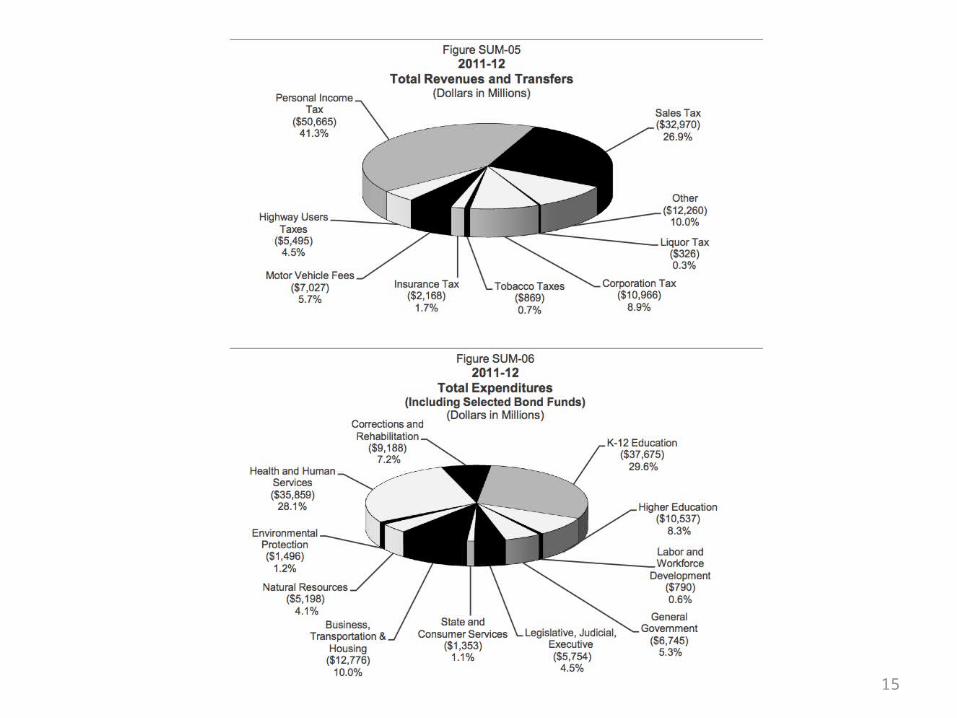
Federal and State Revenues and Expenditures
11

12

13

14
15

Cross Country Variation in Health Care Expenditures
16

THE COMMONWEALTH
FUND
THE COMMONWEALTH
FUND
Publication: R. E. Leu, F. F. H. Rutten, W. Brouwer et al., The Swiss and Dutch Health Insurance Systems: Universal Coverage and Regulated Competitive Insurance Markets, The Commonwealth Fund, January 2009
US
Switzerland
UK
OECD Mean
Organization of Economic Cooperation and Development 17

Health Care Costs in US vs. OECD
• Compare US and OECD countries on health care spending, workforce, treatment intensity, and outcomes
• Source: Anderson et al. “It’s the prices, stupid: Why the United States is so different from other countries.” Health Affairs. 22(3)

Total Spending in 2000 (US$ PPP)

Percent of GDP, 2000

% Private Spending

Population Age 65+

Workforce (per 1,000 in 2000)

Coronary Angioplasties (per 100,000, 1999)

Life Expectancy at Birth(2000-2005, UN)

Physician Fees, US vs. Other Countries
• Compare 6 countries on physician fees for primary care and orthopedic surgery
• Source: Laugesen and Glied. “Higher fees paid to US physicians drive higher spending for physician services compared to other countries.” Health Affairs. 30(9)

Public Payer Fee for Office Visit Private Payer Fee for Office Visit Office Visits per Capita Hip Replacements per 100k
0
0.2
0.4
0.6
0.8
1
1.2
1.4
1.6
1.8
2
Primary Care And Orthopedic Surgery And Fees In Six Countries, 2008, Relative to the US
Australia Canada France Germany UK US

Primary Care Physicians per 100k
Ortho Surgeons per 100k
Primary Care Earnings Ortho Surgeon Earnings Pmts to Primary Care Physicians
Pmts to Orthopedic Surgeons
0
0.2
0.4
0.6
0.8
1
1.2
1.4
1.6
1.8
2
Physician Capacity, Earnings, And Spending In Six Countries, 2008, Rela-tive to the US
Australia Canada France Germany UK US