Embed Size (px)
Citation preview
INTERNATIONAL TRAVEL AND TOURISM
Year 2018
1. INTRODUCTION
This issue of the Economic and Social Indicators presents data on International Travel and
Tourism for the year 2018. A brief on the compilation of these statistics is given at Annex I and a
glossary of terms at Annex II.
2. INTERNATIONAL TRAVEL
Passenger traffic, 2017 and 2018
2017 2018 1 % Change
Arrivals by
Air 1,727,316 1,790,292 + 3.6
Sea 53,705 71,997 + 34.1
of which Cruise travellers 49,355 67,515 + 36.8
Total
1,781,021 1,862,289 + 4.6
Departures by
Air 1,725,057 1,789,398 + 3.7
Sea 52,238 70,299 + 34.6
Total 1,777,295 1,859,697 + 4.6
1 Provisional
2.1 Arrivals in 2018
Compared to 2017:
total arrivals increased by 4.6% from 1,781,021 to 1,862,289, of which arrivals in Rodrigues
direct from Reunion Island amounted to 511;
tourist arrivals increased by 4.3% from 1,341,860 to 1,399,408, of which cruise tourists
amounted to 36,796 compared to 26,124 in 2017, representing a growth of 40.9%; and
the number of excursionists (arriving and leaving on the same day) increased by 7.1% from
29,615 to 31,709.
In 2018, 42 cruise ships arrived in the country compared to 30 cruise ships in 2017 and carried
some 67,515 cruise travellers which include 36,796 tourists, 9,294 excursionists, 722 Mauritian
residents and 20,703 crew members.
2.2 Departures in 2018
Compared to 2017:
total departures increased by 4.6% from 1,777,295 to 1,859,697, of which departures from
Rodrigues direct to Reunion Island amounted to 489; and
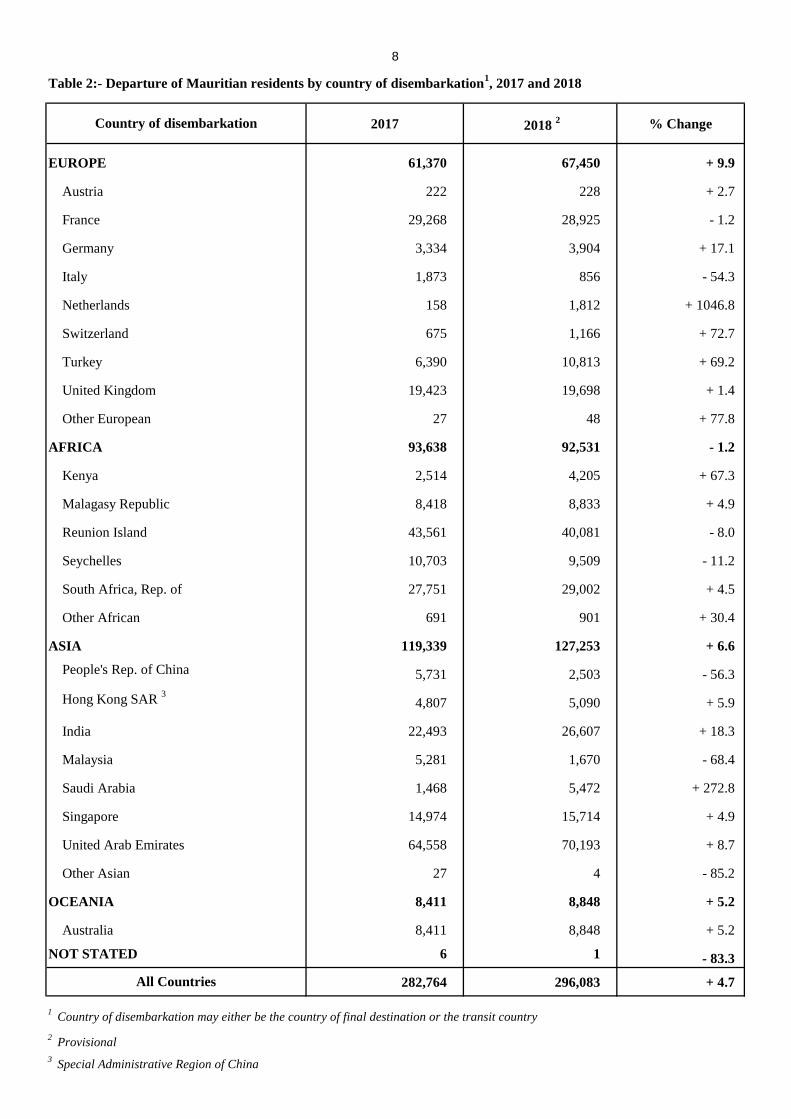
departures of Mauritian residents increased by 4.7% from 282,764 to 296,083.
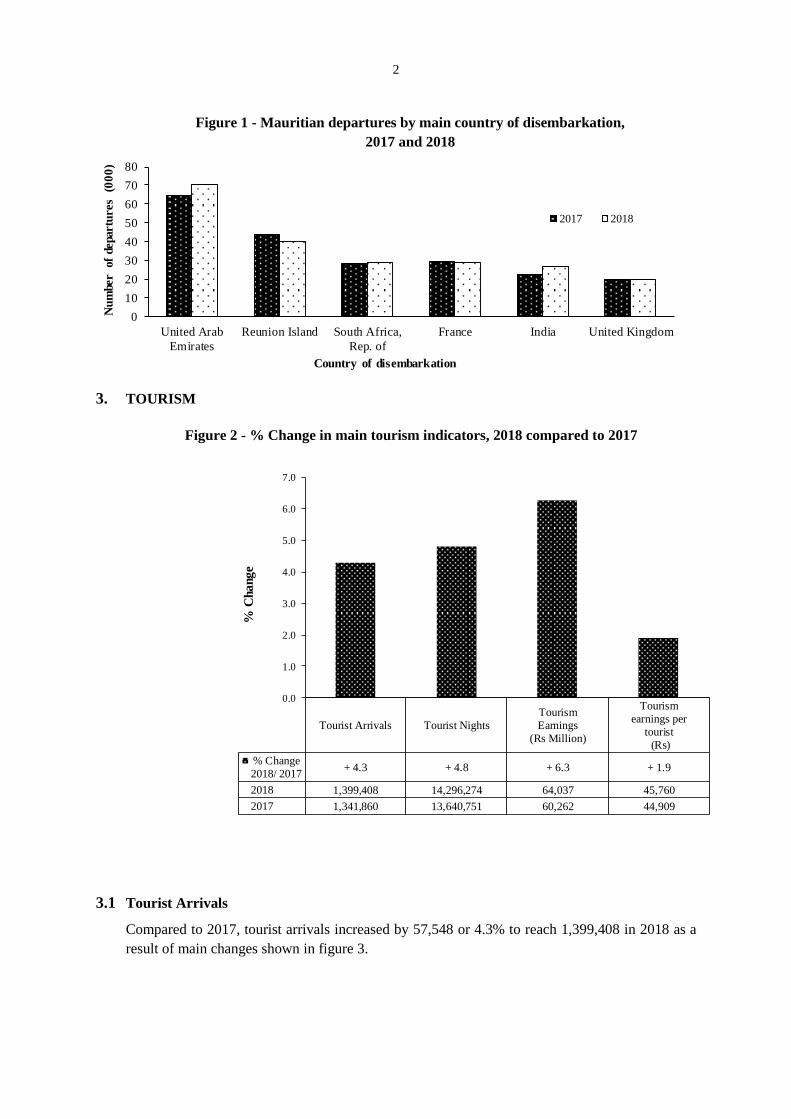
Comparative figures for 2017 and 2018 for Mauritian Departures by main country of
disembarkation are given in Figure 1 and Table 2. In 2018, the main countries of disembarkation
(country of final destination or transit country) for Mauritian residents were United Arab
Emirates (70,193 or 23.7%), Reunion Island (40,081 or 13.5%), Republic of S.Africa (29,002 or
9.8%), France (28,925 or 9.8%), India (26,607 or 9.0%) and United Kingdom (19,698 or 6.7%).
2
Figure 1 - Mauritian departures by main country of disembarkation,
2017 and 2018
0
10
20
30
40
50
60
70
80
United Arab
Emirates
Reunion Island South Africa,
Rep. of
France India United Kingdom
Nu
mber
of
departu
res
(00
0)
Country of disembarkation
2017 2018
3. TOURISM
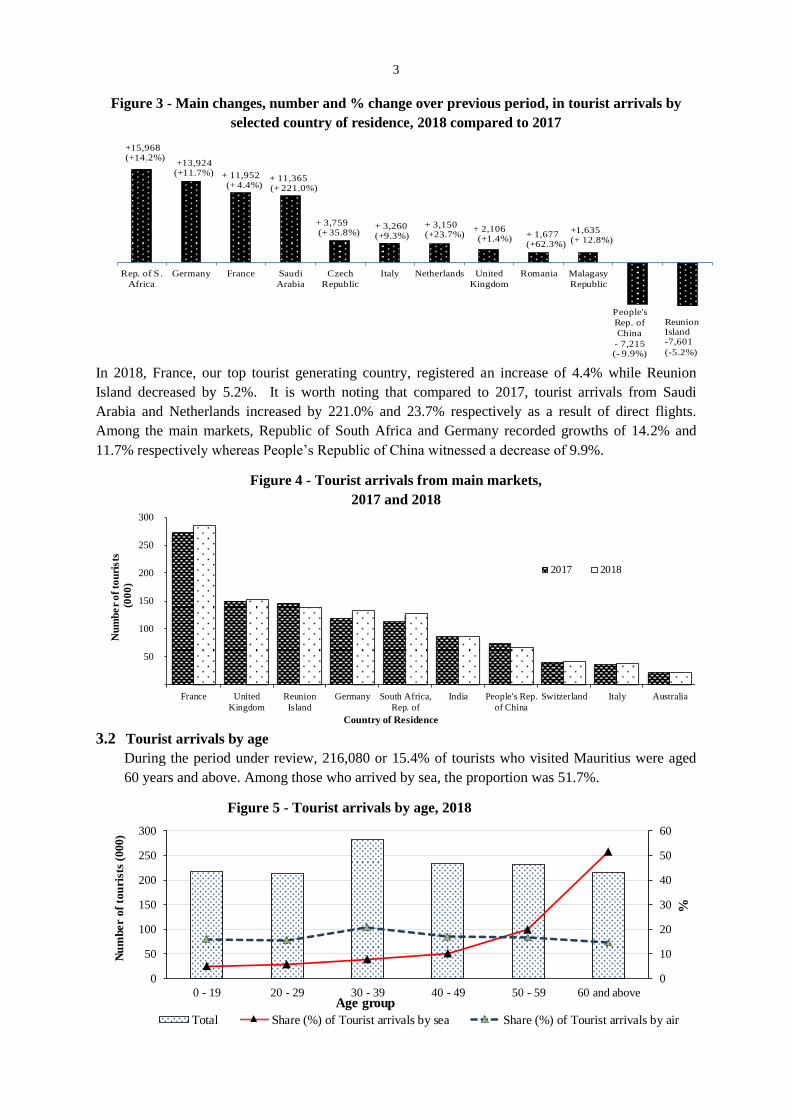
Figure 2 - % Change in main tourism indicators, 2018 compared to 2017
Tourist Arrivals Tourist Nights
Tourism
Earnings
(Rs Million)
Tourism
earnings per
tourist
(Rs)
% Change
2018/ 2017+ 4.3 + 4.8 + 6.3 + 1.9
2018 1,399,408 14,296,274 64,037 45,760
2017 1,341,860 13,640,751 60,262 44,909
0.0
1.0
2.0
3.0
4.0
5.0
6.0
7.0
% C
ha
ng
e
3.1 Tourist Arrivals
Compared to 2017, tourist arrivals increased by 57,548 or 4.3% to reach 1,399,408 in 2018 as a
result of main changes shown in figure 3.
3
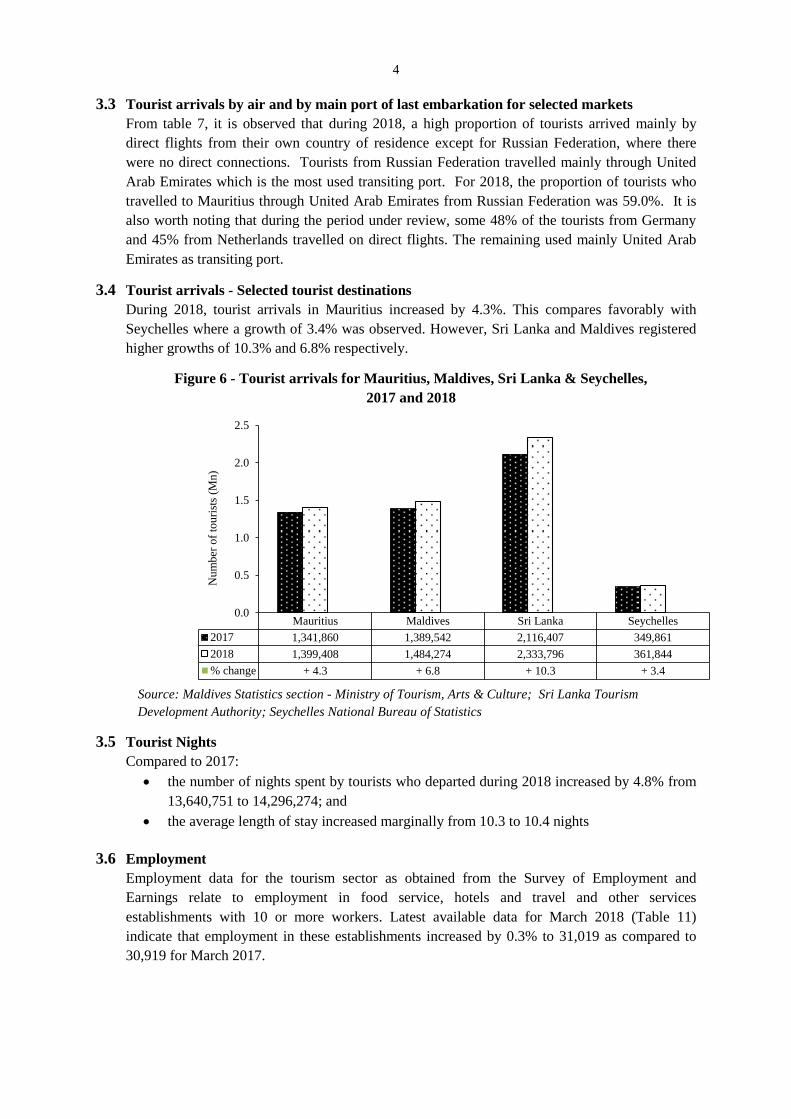
Figure 3 - Main changes, number and % change over previous period, in tourist arrivals by
selected country of residence, 2018 compared to 2017
+13,924(+11.7%) + 11,952
(+ 4.4%)+ 11,365(+ 221.0%)
+ 3,759(+ 35.8%)
+ 3,260(+9.3%)
+ 3,150(+23.7%)
+ 2,106(+1.4%)
+ 1,677(+62.3%)
+1,635(+ 12.8%)
People's
Rep. of
China
- 7,215(- 9.9%)
Rep. of S.
Africa
Germany France Saudi
Arabia
Czech
Republic
Italy Netherlands United
Kingdom
Romania Malagasy
Republic
+15,968(+14.2%)
ReunionIsland-7,601
(-5.2%) In 2018, France, our top tourist generating country, registered an increase of 4.4% while Reunion
Island decreased by 5.2%. It is worth noting that compared to 2017, tourist arrivals from Saudi
Arabia and Netherlands increased by 221.0% and 23.7% respectively as a result of direct flights.
Among the main markets, Republic of South Africa and Germany recorded growths of 14.2% and
11.7% respectively whereas People’s Republic of China witnessed a decrease of 9.9%.
Figure 4 - Tourist arrivals from main markets,
2017 and 2018
50
100
150
200
250
300
France United
Kingdom
Reunion
Island
Germany South Africa,
Rep. of
India People's Rep.
of China
Switzerland Italy Australia
Nu
mb
er
of
tou
rists
(00
0)
Country of Residence
2017 2018
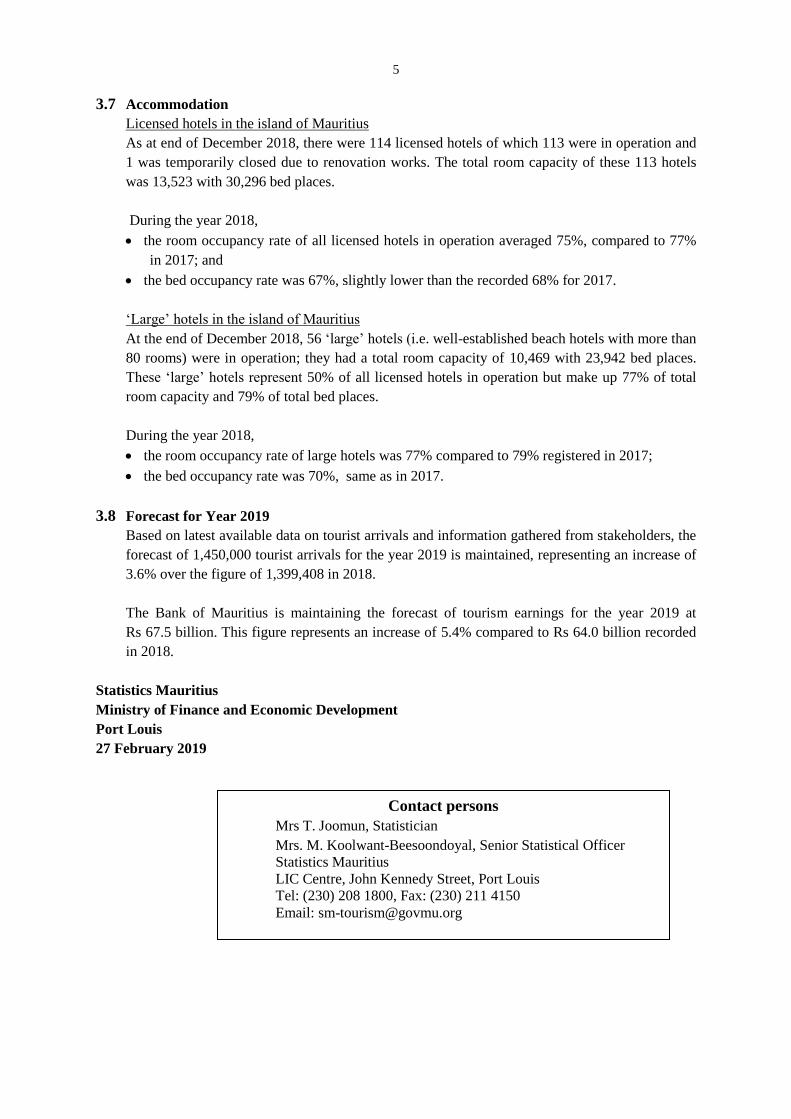
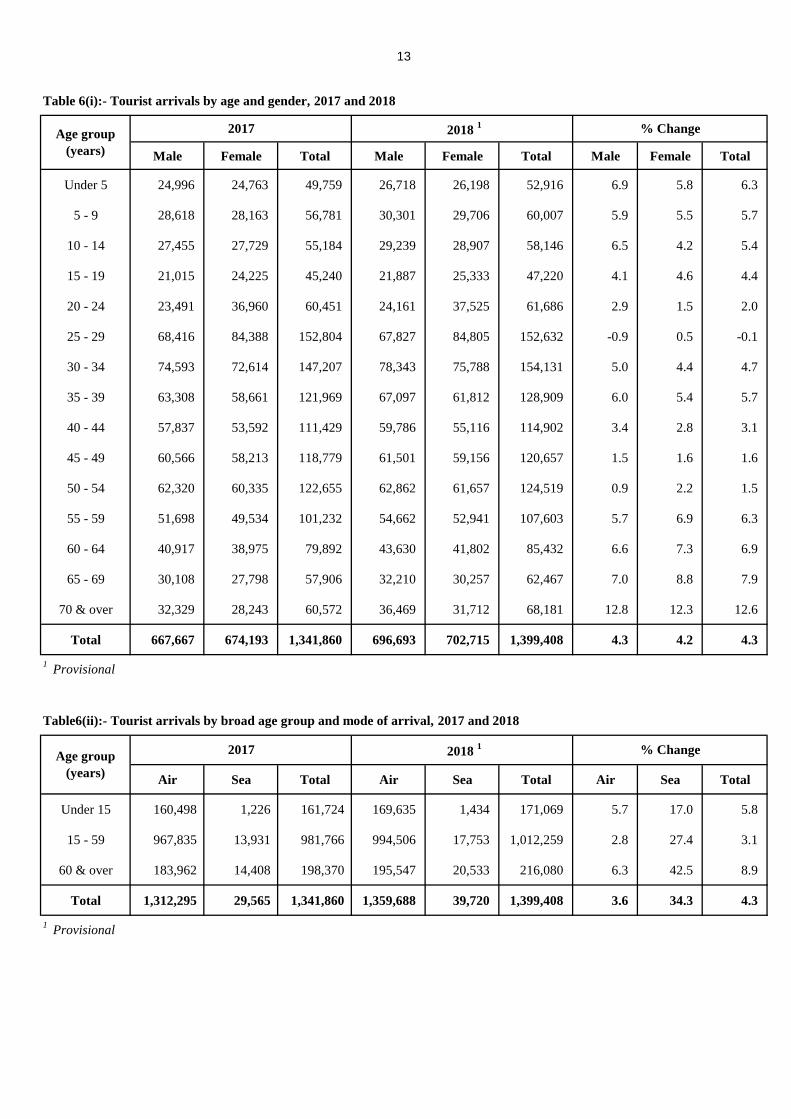
3.2 Tourist arrivals by age
During the period under review, 216,080 or 15.4% of tourists who visited Mauritius were aged
60 years and above. Among those who arrived by sea, the proportion was 51.7%.
Figure 5 - Tourist arrivals by age, 2018
0
10
20
30
40
50
60
0
50
100
150
200
250
300
0 - 19 20 - 29 30 - 39 40 - 49 50 - 59 60 and above
%
Nu
mber
of
tou
rist
s (0
00)
Age group
Total Share (%) of Tourist arrivals by sea Share (%) of Tourist arrivals by air
4
3.3 Tourist arrivals by air and by main port of last embarkation for selected markets
From table 7, it is observed that during 2018, a high proportion of tourists arrived mainly by
direct flights from their own country of residence except for Russian Federation, where there
were no direct connections. Tourists from Russian Federation travelled mainly through United
Arab Emirates which is the most used transiting port. For 2018, the proportion of tourists who
travelled to Mauritius through United Arab Emirates from Russian Federation was 59.0%. It is
also worth noting that during the period under review, some 48% of the tourists from Germany
and 45% from Netherlands travelled on direct flights. The remaining used mainly United Arab
Emirates as transiting port.
3.4 Tourist arrivals - Selected tourist destinations
During 2018, tourist arrivals in Mauritius increased by 4.3%. This compares favorably with
Seychelles where a growth of 3.4% was observed. However, Sri Lanka and Maldives registered
higher growths of 10.3% and 6.8% respectively.
Figure 6 - Tourist arrivals for Mauritius, Maldives, Sri Lanka & Seychelles,
2017 and 2018
Mauritius Maldives Sri Lanka Seychelles
2017 1,341,860 1,389,542 2,116,407 349,861
2018 1,399,408 1,484,274 2,333,796 361,844
% change + 4.3 + 6.8 + 10.3 + 3.4
0.0
0.5
1.0
1.5
2.0
2.5
Nu
mb
er o
f to
uri
sts
(Mn
)
Source: Maldives Statistics section - Ministry of Tourism, Arts & Culture; Sri Lanka Tourism
Development Authority; Seychelles National Bureau of Statistics
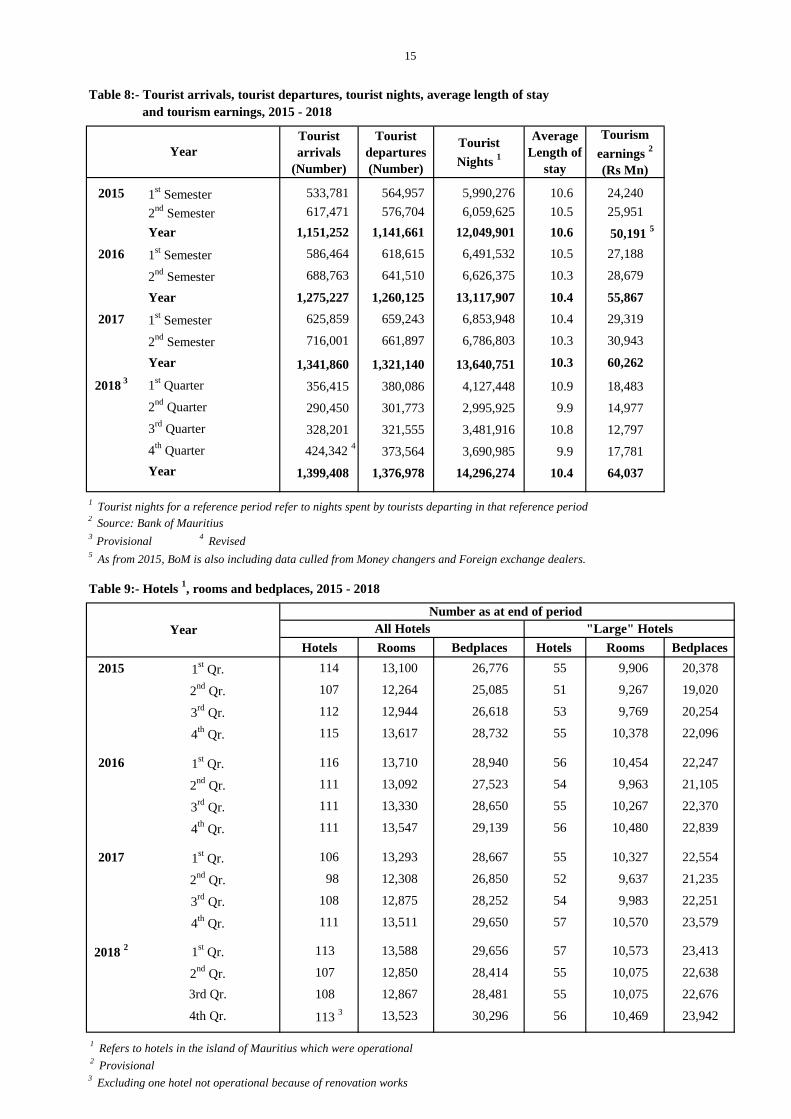
3.5 Tourist Nights
Compared to 2017:
the number of nights spent by tourists who departed during 2018 increased by 4.8% from
13,640,751 to 14,296,274; and
the average length of stay increased marginally from 10.3 to 10.4 nights
3.6 Employment
Employment data for the tourism sector as obtained from the Survey of Employment and
Earnings relate to employment in food service, hotels and travel and other services
establishments with 10 or more workers. Latest available data for March 2018 (Table 11)
indicate that employment in these establishments increased by 0.3% to 31,019 as compared to
30,919 for March 2017.
5
3.7 Accommodation
Licensed hotels in the island of Mauritius
As at end of December 2018, there were 114 licensed hotels of which 113 were in operation and
1 was temporarily closed due to renovation works. The total room capacity of these 113 hotels
was 13,523 with 30,296 bed places.
During the year 2018,
the room occupancy rate of all licensed hotels in operation averaged 75%, compared to 77%
in 2017; and
the bed occupancy rate was 67%, slightly lower than the recorded 68% for 2017.
‘Large’ hotels in the island of Mauritius
At the end of December 2018, 56 ‘large’ hotels (i.e. well-established beach hotels with more than
80 rooms) were in operation; they had a total room capacity of 10,469 with 23,942 bed places.
These ‘large’ hotels represent 50% of all licensed hotels in operation but make up 77% of total
room capacity and 79% of total bed places.
During the year 2018,
the room occupancy rate of large hotels was 77% compared to 79% registered in 2017;
the bed occupancy rate was 70%, same as in 2017.
3.8 Forecast for Year 2019
Based on latest available data on tourist arrivals and information gathered from stakeholders, the
forecast of 1,450,000 tourist arrivals for the year 2019 is maintained, representing an increase of
3.6% over the figure of 1,399,408 in 2018.
The Bank of Mauritius is maintaining the forecast of tourism earnings for the year 2019 at
Rs 67.5 billion. This figure represents an increase of 5.4% compared to Rs 64.0 billion recorded
in 2018.
Statistics Mauritius
Ministry of Finance and Economic Development
Port Louis
27 February 2019
Contact persons
Mrs T. Joomun, Statistician
Mrs. M. Koolwant-Beesoondoyal, Senior Statistical Officer
Statistics Mauritius
LIC Centre, John Kennedy Street, Port Louis
Tel: (230) 208 1800, Fax: (230) 211 4150
Email: [email protected]
6
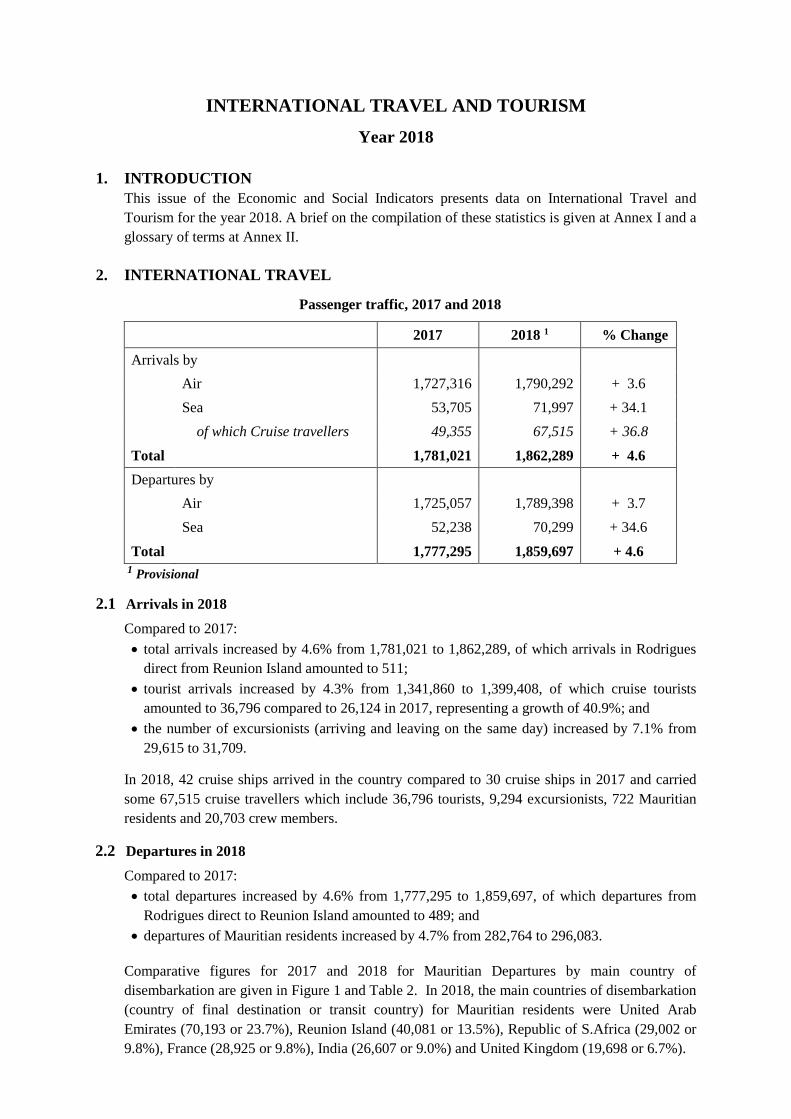
Table Description Page
1 Passenger Traffic by month, 2016 - 2018 7
2 Departure of Mauritian residents by country of disembarkation, 2017 and 2018 8
3 Tourist arrivals by month, 2016 - 2018 9
4 Tourist arrivals by main purpose of visit, 2017 and 2018 9
5 Tourist arrivals by country of residence, 2017 and 2018 10
6(i) Tourist arrivals by age and gender, 2017 and 2018 13
6(ii) Tourist arrivals by broad age group and mode of arrival, 2017 and 2018 13
7 Tourist arrivals by air and by main port of last embarkation for selected markets, 2018 14
8 Tourist arrivals, tourist departures, tourist nights, average length of stay and tourism earnings, 2015 - 2018 15
9 Hotels, rooms and bedplaces, 2015 - 2018 15
10 Monthly occupancy rates (%) for All hotels and "Large" hotels, 2016 - 2018 16
11 Employment in large establishments of the Tourism Industry as at end of March, 2014 - 2018 16
ANNEX
I Compilation of passenger traffic statistics
II Glossary of terms
LIST OF TABLES
7
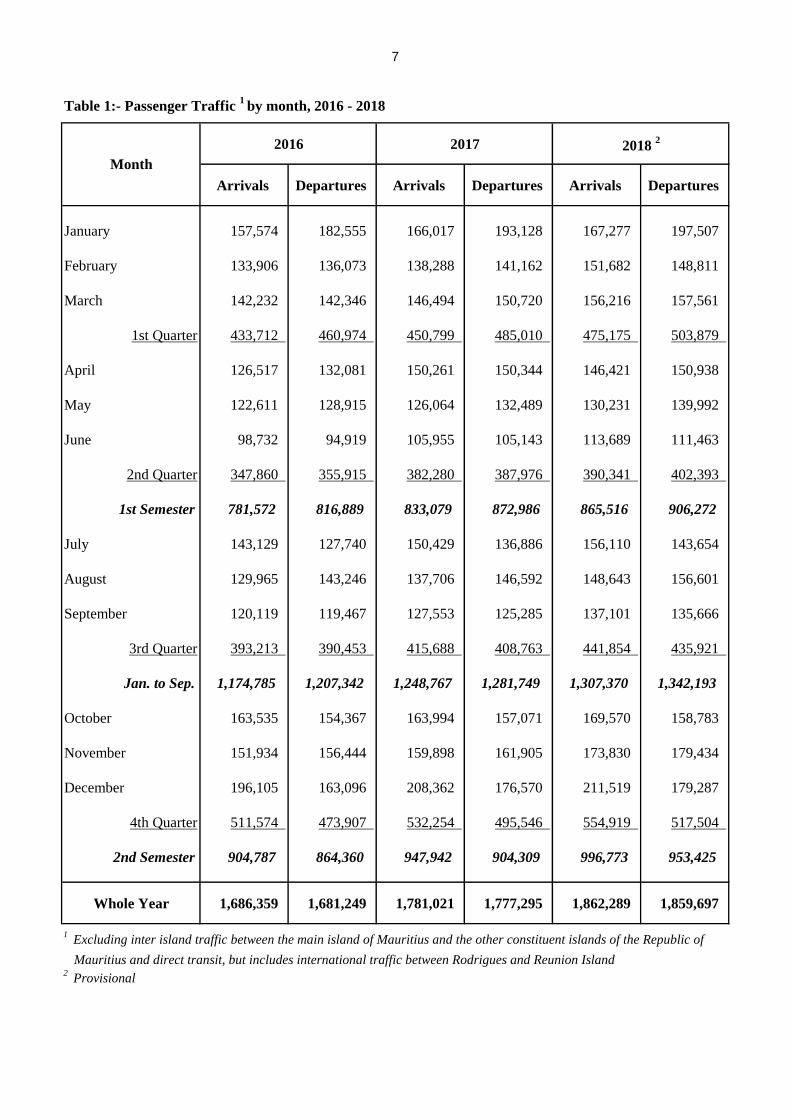
Table 1:- Passenger Traffic 1
by month, 2016 - 2018
2016 2017 2018 2
Arrivals Departures Arrivals Departures Arrivals Departures
January 157,574 182,555 166,017 193,128 167,277 197,507
February 133,906 136,073 138,288 141,162 151,682 148,811
March 142,232 142,346 146,494 150,720 156,216 157,561
1st Quarter 433,712 460,974 450,799 485,010 475,175 503,879
April 126,517 132,081 150,261 150,344 146,421 150,938
May 122,611 128,915 126,064 132,489 130,231 139,992
June 98,732 94,919 105,955 105,143 113,689 111,463
2nd Quarter 347,860 355,915 382,280 387,976 390,341 402,393
1st Semester 781,572 816,889 833,079 872,986 865,516 906,272
July 143,129 127,740 150,429 136,886 156,110 143,654
August 129,965 143,246 137,706 146,592 148,643 156,601
September 120,119 119,467 127,553 125,285 137,101 135,666
3rd Quarter 393,213 390,453 415,688 408,763 441,854 435,921
Jan. to Sep. 1,174,785 1,207,342 1,248,767 1,281,749 1,307,370 1,342,193
October 163,535 154,367 163,994 157,071 169,570 158,783
November 151,934 156,444 159,898 161,905 173,830 179,434
December 196,105 163,096 208,362 176,570 211,519 179,287
4th Quarter 511,574 473,907 532,254 495,546 554,919 517,504
2nd Semester 904,787 864,360 947,942 904,309 996,773 953,425
Whole Year 1,686,359 1,681,249 1,781,021 1,777,295 1,862,289 1,859,697
1
Excluding inter island traffic between the main island of Mauritius and the other constituent islands of the Republic of
Mauritius and direct transit, but includes international traffic between Rodrigues and Reunion Island2
Provisional
Month
8
Table 2:- Departure of Mauritian residents by country of disembarkation1, 2017 and 2018
2017 2018 2 % Change
EUROPE 61,370 67,450 + 9.9
Austria 222 228 + 2.7
France 29,268 28,925 - 1.2
Germany 3,334 3,904 + 17.1
Italy 1,873 856 - 54.3
Netherlands 158 1,812 + 1046.8
Switzerland 675 1,166 + 72.7
Turkey 6,390 10,813 + 69.2
United Kingdom 19,423 19,698 + 1.4
Other European 27 48 + 77.8
AFRICA 93,638 92,531 - 1.2
Kenya 2,514 4,205 + 67.3
Malagasy Republic 8,418 8,833 + 4.9
Reunion Island 43,561 40,081 - 8.0
Seychelles 10,703 9,509 - 11.2
South Africa, Rep. of 27,751 29,002 + 4.5
Other African 691 901 + 30.4
ASIA 119,339 127,253 + 6.6
People's Rep. of China 5,731 2,503 - 56.3
Hong Kong SAR 3
4,807 5,090 + 5.9
India 22,493 26,607 + 18.3
Malaysia 5,281 1,670 - 68.4
Saudi Arabia 1,468 5,472 + 272.8
Singapore 14,974 15,714 + 4.9
United Arab Emirates 64,558 70,193 + 8.7
Other Asian 27 4 - 85.2
OCEANIA 8,411 8,848 + 5.2
Australia 8,411 8,848 + 5.2
NOT STATED 6 1 - 83.3
282,764 296,083 + 4.7
1 Country of disembarkation may either be the country of final destination or the transit country
2 Provisional
3 Special Administrative Region of China
Country of disembarkation
All Countries
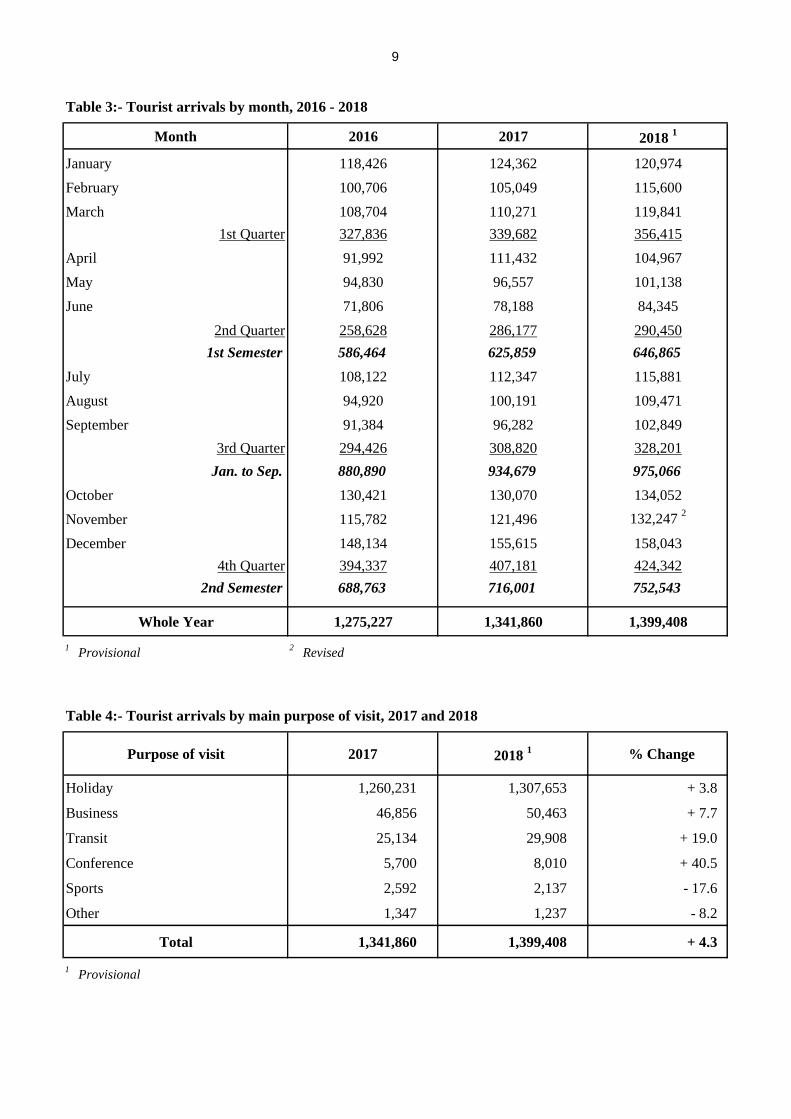
9
Month 2016 2017 2018 1
January 118,426 124,362 120,974
February 100,706 105,049 115,600
March 108,704 110,271 119,841
1st Quarter 327,836 339,682 356,415
April 91,992 111,432 104,967
May 94,830 96,557 101,138
June 71,806 78,188 84,345
2nd Quarter 258,628 286,177 290,450
1st Semester 586,464 625,859 646,865
July 108,122 112,347 115,881
August 94,920 100,191 109,471
September 91,384 96,282 102,849
3rd Quarter 294,426 308,820 328,201
Jan. to Sep. 880,890 934,679 975,066
October 130,421 130,070 134,052
November 115,782 121,496 132,247 2
December 148,134 155,615 158,043
4th Quarter 394,337 407,181 424,342
2nd Semester 688,763 716,001 752,543
Whole Year 1,275,227 1,341,860 1,399,408
1 Provisional
2 Revised
Purpose of visit 2017 2018 1 % Change
Holiday 1,260,231 1,307,653 + 3.8
Business 46,856 50,463 + 7.7
Transit 25,134 29,908 + 19.0
Conference 5,700 8,010 + 40.5
Sports 2,592 2,137 - 17.6
Other 1,347 1,237 - 8.2
Total 1,341,860 1,399,408 + 4.3
1 Provisional
Table 4:- Tourist arrivals by main purpose of visit, 2017 and 2018
Table 3:- Tourist arrivals by month, 2016 - 2018
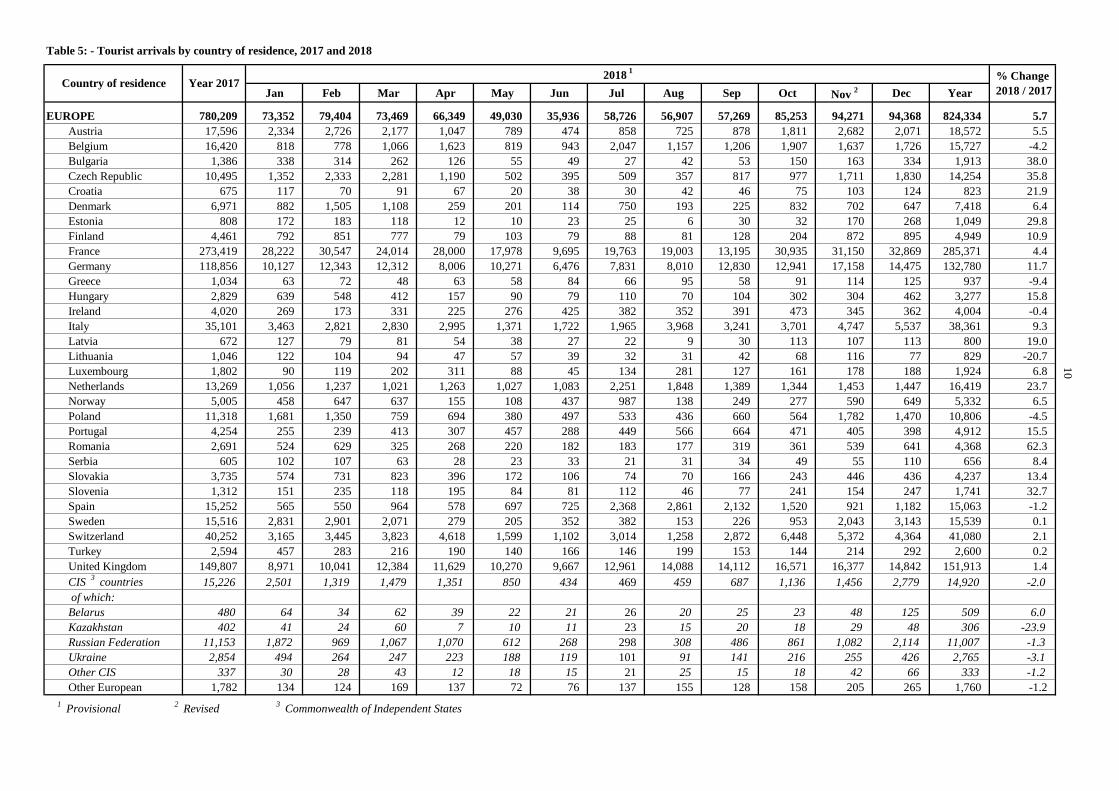
Table 5: - Tourist arrivals by country of residence, 2017 and 2018
Jan Feb Mar Apr May Jun Jul Aug Sep Oct Nov 2 Dec Year
EUROPE 780,209 73,352 79,404 73,469 66,349 49,030 35,936 58,726 56,907 57,269 85,253 94,271 94,368 824,334 5.7
Austria 17,596 2,334 2,726 2,177 1,047 789 474 858 725 878 1,811 2,682 2,071 18,572 5.5
Belgium 16,420 818 778 1,066 1,623 819 943 2,047 1,157 1,206 1,907 1,637 1,726 15,727 -4.2
Bulgaria 1,386 338 314 262 126 55 49 27 42 53 150 163 334 1,913 38.0
Czech Republic 10,495 1,352 2,333 2,281 1,190 502 395 509 357 817 977 1,711 1,830 14,254 35.8
Croatia 675 117 70 91 67 20 38 30 42 46 75 103 124 823 21.9
Denmark 6,971 882 1,505 1,108 259 201 114 750 193 225 832 702 647 7,418 6.4
Estonia 808 172 183 118 12 10 23 25 6 30 32 170 268 1,049 29.8
Finland 4,461 792 851 777 79 103 79 88 81 128 204 872 895 4,949 10.9
France 273,419 28,222 30,547 24,014 28,000 17,978 9,695 19,763 19,003 13,195 30,935 31,150 32,869 285,371 4.4
Germany 118,856 10,127 12,343 12,312 8,006 10,271 6,476 7,831 8,010 12,830 12,941 17,158 14,475 132,780 11.7
Greece 1,034 63 72 48 63 58 84 66 95 58 91 114 125 937 -9.4
Hungary 2,829 639 548 412 157 90 79 110 70 104 302 304 462 3,277 15.8
Ireland 4,020 269 173 331 225 276 425 382 352 391 473 345 362 4,004 -0.4
Italy 35,101 3,463 2,821 2,830 2,995 1,371 1,722 1,965 3,968 3,241 3,701 4,747 5,537 38,361 9.3
Latvia 672 127 79 81 54 38 27 22 9 30 113 107 113 800 19.0
Lithuania 1,046 122 104 94 47 57 39 32 31 42 68 116 77 829 -20.7
Luxembourg 1,802 90 119 202 311 88 45 134 281 127 161 178 188 1,924 6.8
Netherlands 13,269 1,056 1,237 1,021 1,263 1,027 1,083 2,251 1,848 1,389 1,344 1,453 1,447 16,419 23.7
Norway 5,005 458 647 637 155 108 437 987 138 249 277 590 649 5,332 6.5
Poland 11,318 1,681 1,350 759 694 380 497 533 436 660 564 1,782 1,470 10,806 -4.5
Portugal 4,254 255 239 413 307 457 288 449 566 664 471 405 398 4,912 15.5
Romania 2,691 524 629 325 268 220 182 183 177 319 361 539 641 4,368 62.3
Serbia 605 102 107 63 28 23 33 21 31 34 49 55 110 656 8.4
Slovakia 3,735 574 731 823 396 172 106 74 70 166 243 446 436 4,237 13.4
Slovenia 1,312 151 235 118 195 84 81 112 46 77 241 154 247 1,741 32.7
Spain 15,252 565 550 964 578 697 725 2,368 2,861 2,132 1,520 921 1,182 15,063 -1.2
Sweden 15,516 2,831 2,901 2,071 279 205 352 382 153 226 953 2,043 3,143 15,539 0.1
Switzerland 40,252 3,165 3,445 3,823 4,618 1,599 1,102 3,014 1,258 2,872 6,448 5,372 4,364 41,080 2.1
Turkey 2,594 457 283 216 190 140 166 146 199 153 144 214 292 2,600 0.2
United Kingdom 149,807 8,971 10,041 12,384 11,629 10,270 9,667 12,961 14,088 14,112 16,571 16,377 14,842 151,913 1.4
CIS 3
countries 15,226 2,501 1,319 1,479 1,351 850 434 469 459 687 1,136 1,456 2,779 14,920 -2.0
of which:
Belarus 480 64 34 62 39 22 21 26 20 25 23 48 125 509 6.0
Kazakhstan 402 41 24 60 7 10 11 23 15 20 18 29 48 306 -23.9
Russian Federation 11,153 1,872 969 1,067 1,070 612 268 298 308 486 861 1,082 2,114 11,007 -1.3
Ukraine 2,854 494 264 247 223 188 119 101 91 141 216 255 426 2,765 -3.1
Other CIS 337 30 28 43 12 18 15 21 25 15 18 42 66 333 -1.2
Other European 1,782 134 124 169 137 72 76 137 155 128 158 205 265 1,760 -1.2
1 Provisional
2 Revised
3 Commonwealth of Independent States
10
Country of residence Year 20172018
1% Change
2018 / 2017
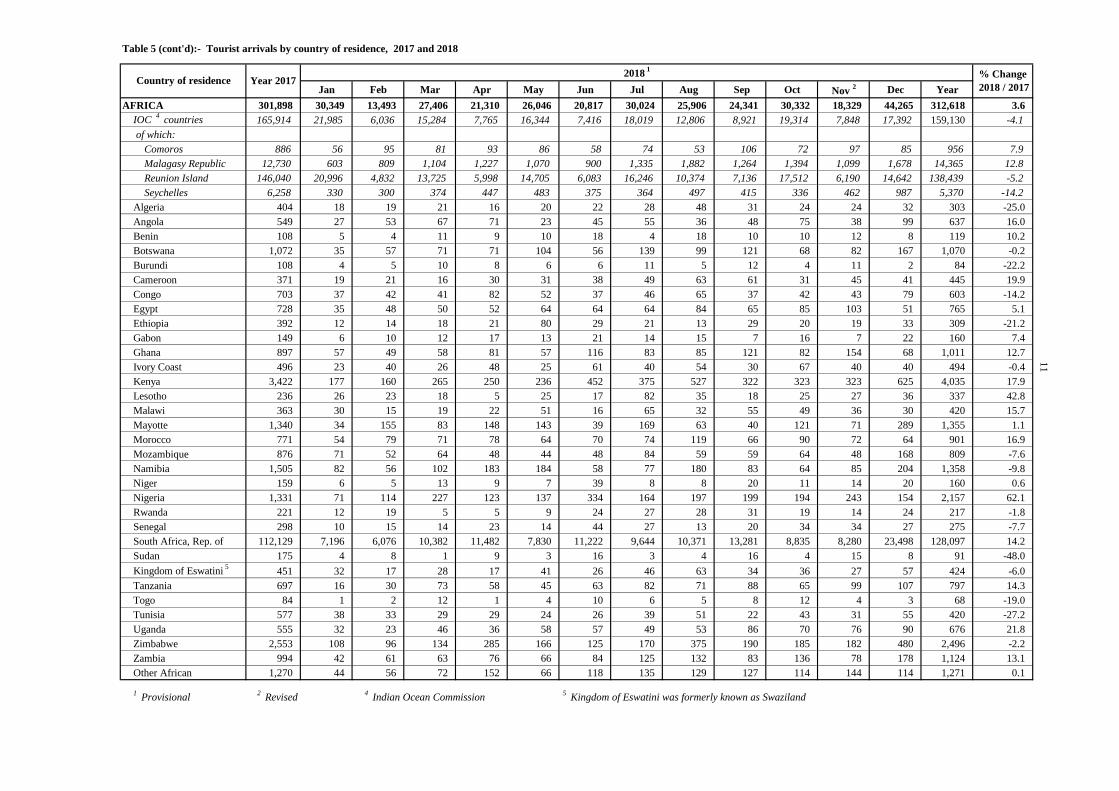
Table 5 (cont'd):- Tourist arrivals by country of residence, 2017 and 2018
Jan Feb Mar Apr May Jun Jul Aug Sep Oct Nov 2 Dec Year
AFRICA 301,898 30,349 13,493 27,406 21,310 26,046 20,817 30,024 25,906 24,341 30,332 18,329 44,265 312,618 3.6
IOC 4 countries 165,914 21,985 6,036 15,284 7,765 16,344 7,416 18,019 12,806 8,921 19,314 7,848 17,392 159,130 -4.1
of which:
Comoros 886 56 95 81 93 86 58 74 53 106 72 97 85 956 7.9
Malagasy Republic 12,730 603 809 1,104 1,227 1,070 900 1,335 1,882 1,264 1,394 1,099 1,678 14,365 12.8
Reunion Island 146,040 20,996 4,832 13,725 5,998 14,705 6,083 16,246 10,374 7,136 17,512 6,190 14,642 138,439 -5.2
Seychelles 6,258 330 300 374 447 483 375 364 497 415 336 462 987 5,370 -14.2
Algeria 404 18 19 21 16 20 22 28 48 31 24 24 32 303 -25.0
Angola 549 27 53 67 71 23 45 55 36 48 75 38 99 637 16.0
Benin 108 5 4 11 9 10 18 4 18 10 10 12 8 119 10.2
Botswana 1,072 35 57 71 71 104 56 139 99 121 68 82 167 1,070 -0.2
Burundi 108 4 5 10 8 6 6 11 5 12 4 11 2 84 -22.2
Cameroon 371 19 21 16 30 31 38 49 63 61 31 45 41 445 19.9
Congo 703 37 42 41 82 52 37 46 65 37 42 43 79 603 -14.2
Egypt 728 35 48 50 52 64 64 64 84 65 85 103 51 765 5.1
Ethiopia 392 12 14 18 21 80 29 21 13 29 20 19 33 309 -21.2
Gabon 149 6 10 12 17 13 21 14 15 7 16 7 22 160 7.4
Ghana 897 57 49 58 81 57 116 83 85 121 82 154 68 1,011 12.7
Ivory Coast 496 23 40 26 48 25 61 40 54 30 67 40 40 494 -0.4
Kenya 3,422 177 160 265 250 236 452 375 527 322 323 323 625 4,035 17.9
Lesotho 236 26 23 18 5 25 17 82 35 18 25 27 36 337 42.8
Malawi 363 30 15 19 22 51 16 65 32 55 49 36 30 420 15.7
Mayotte 1,340 34 155 83 148 143 39 169 63 40 121 71 289 1,355 1.1
Morocco 771 54 79 71 78 64 70 74 119 66 90 72 64 901 16.9
Mozambique 876 71 52 64 48 44 48 84 59 59 64 48 168 809 -7.6
Namibia 1,505 82 56 102 183 184 58 77 180 83 64 85 204 1,358 -9.8
Niger 159 6 5 13 9 7 39 8 8 20 11 14 20 160 0.6
Nigeria 1,331 71 114 227 123 137 334 164 197 199 194 243 154 2,157 62.1
Rwanda 221 12 19 5 5 9 24 27 28 31 19 14 24 217 -1.8
Senegal 298 10 15 14 23 14 44 27 13 20 34 34 27 275 -7.7
South Africa, Rep. of 112,129 7,196 6,076 10,382 11,482 7,830 11,222 9,644 10,371 13,281 8,835 8,280 23,498 128,097 14.2
Sudan 175 4 8 1 9 3 16 3 4 16 4 15 8 91 -48.0
Kingdom of Eswatini 5
451 32 17 28 17 41 26 46 63 34 36 27 57 424 -6.0
Tanzania 697 16 30 73 58 45 63 82 71 88 65 99 107 797 14.3
Togo 84 1 2 12 1 4 10 6 5 8 12 4 3 68 -19.0
Tunisia 577 38 33 29 29 24 26 39 51 22 43 31 55 420 -27.2
Uganda 555 32 23 46 36 58 57 49 53 86 70 76 90 676 21.8
Zimbabwe 2,553 108 96 134 285 166 125 170 375 190 185 182 480 2,496 -2.2
Zambia 994 42 61 63 76 66 84 125 132 83 136 78 178 1,124 13.1
Other African 1,270 44 56 72 152 66 118 135 129 127 114 144 114 1,271 0.1
1 Provisional
2 Revised
4 Indian Ocean Commission
5 Kingdom of Eswatini was formerly known as Swaziland
11
Country of residence Year 20172018
1% Change
2018 / 2017
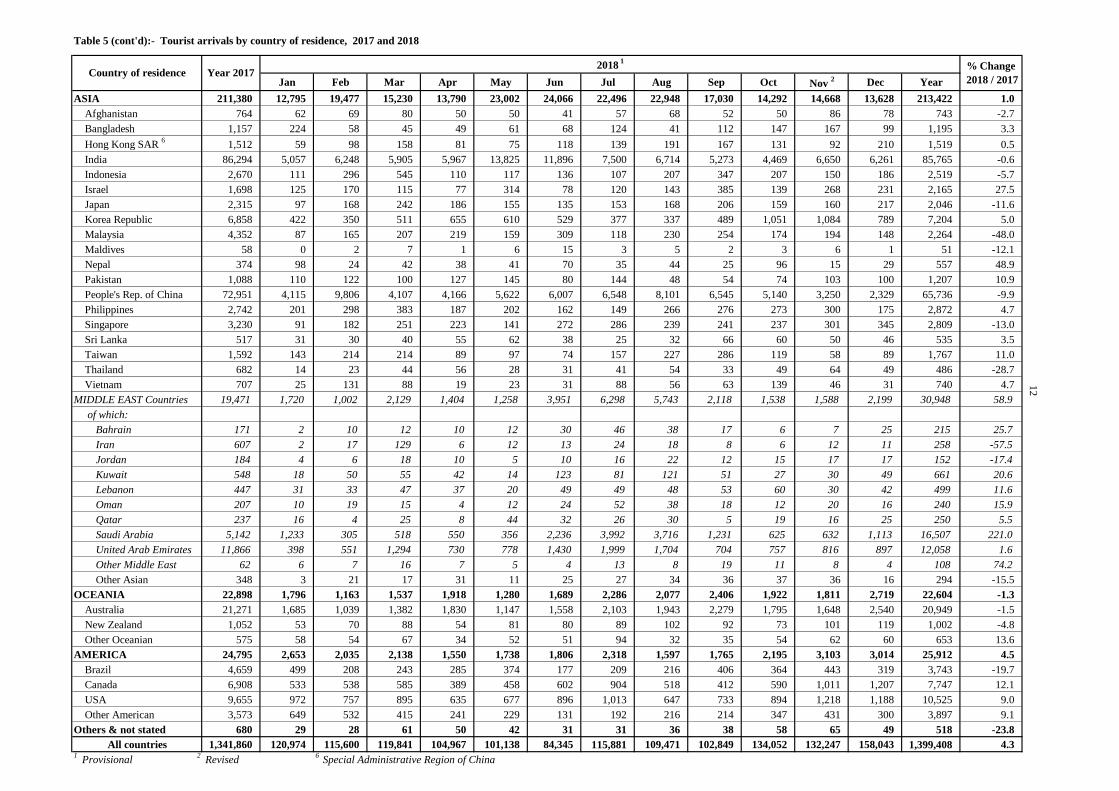
Table 5 (cont'd):- Tourist arrivals by country of residence, 2017 and 2018
Jan Feb Mar Apr May Jun Jul Aug Sep Oct Nov 2 Dec Year
ASIA 211,380 12,795 19,477 15,230 13,790 23,002 24,066 22,496 22,948 17,030 14,292 14,668 13,628 213,422 1.0
Afghanistan 764 62 69 80 50 50 41 57 68 52 50 86 78 743 -2.7
Bangladesh 1,157 224 58 45 49 61 68 124 41 112 147 167 99 1,195 3.3
Hong Kong SAR 6
1,512 59 98 158 81 75 118 139 191 167 131 92 210 1,519 0.5
India 86,294 5,057 6,248 5,905 5,967 13,825 11,896 7,500 6,714 5,273 4,469 6,650 6,261 85,765 -0.6
Indonesia 2,670 111 296 545 110 117 136 107 207 347 207 150 186 2,519 -5.7
Israel 1,698 125 170 115 77 314 78 120 143 385 139 268 231 2,165 27.5
Japan 2,315 97 168 242 186 155 135 153 168 206 159 160 217 2,046 -11.6
Korea Republic 6,858 422 350 511 655 610 529 377 337 489 1,051 1,084 789 7,204 5.0
Malaysia 4,352 87 165 207 219 159 309 118 230 254 174 194 148 2,264 -48.0
Maldives 58 0 2 7 1 6 15 3 5 2 3 6 1 51 -12.1
Nepal 374 98 24 42 38 41 70 35 44 25 96 15 29 557 48.9
Pakistan 1,088 110 122 100 127 145 80 144 48 54 74 103 100 1,207 10.9
People's Rep. of China 72,951 4,115 9,806 4,107 4,166 5,622 6,007 6,548 8,101 6,545 5,140 3,250 2,329 65,736 -9.9
Philippines 2,742 201 298 383 187 202 162 149 266 276 273 300 175 2,872 4.7
Singapore 3,230 91 182 251 223 141 272 286 239 241 237 301 345 2,809 -13.0
Sri Lanka 517 31 30 40 55 62 38 25 32 66 60 50 46 535 3.5
Taiwan 1,592 143 214 214 89 97 74 157 227 286 119 58 89 1,767 11.0
Thailand 682 14 23 44 56 28 31 41 54 33 49 64 49 486 -28.7
Vietnam 707 25 131 88 19 23 31 88 56 63 139 46 31 740 4.7
MIDDLE EAST Countries 19,471 1,720 1,002 2,129 1,404 1,258 3,951 6,298 5,743 2,118 1,538 1,588 2,199 30,948 58.9
of which:
Bahrain 171 2 10 12 10 12 30 46 38 17 6 7 25 215 25.7
Iran 607 2 17 129 6 12 13 24 18 8 6 12 11 258 -57.5
Jordan 184 4 6 18 10 5 10 16 22 12 15 17 17 152 -17.4
Kuwait 548 18 50 55 42 14 123 81 121 51 27 30 49 661 20.6
Lebanon 447 31 33 47 37 20 49 49 48 53 60 30 42 499 11.6
Oman 207 10 19 15 4 12 24 52 38 18 12 20 16 240 15.9
Qatar 237 16 4 25 8 44 32 26 30 5 19 16 25 250 5.5
Saudi Arabia 5,142 1,233 305 518 550 356 2,236 3,992 3,716 1,231 625 632 1,113 16,507 221.0
United Arab Emirates 11,866 398 551 1,294 730 778 1,430 1,999 1,704 704 757 816 897 12,058 1.6
Other Middle East 62 6 7 16 7 5 4 13 8 19 11 8 4 108 74.2
Other Asian 348 3 21 17 31 11 25 27 34 36 37 36 16 294 -15.5
OCEANIA 22,898 1,796 1,163 1,537 1,918 1,280 1,689 2,286 2,077 2,406 1,922 1,811 2,719 22,604 -1.3
Australia 21,271 1,685 1,039 1,382 1,830 1,147 1,558 2,103 1,943 2,279 1,795 1,648 2,540 20,949 -1.5
New Zealand 1,052 53 70 88 54 81 80 89 102 92 73 101 119 1,002 -4.8
Other Oceanian 575 58 54 67 34 52 51 94 32 35 54 62 60 653 13.6
AMERICA 24,795 2,653 2,035 2,138 1,550 1,738 1,806 2,318 1,597 1,765 2,195 3,103 3,014 25,912 4.5
Brazil 4,659 499 208 243 285 374 177 209 216 406 364 443 319 3,743 -19.7
Canada 6,908 533 538 585 389 458 602 904 518 412 590 1,011 1,207 7,747 12.1
USA 9,655 972 757 895 635 677 896 1,013 647 733 894 1,218 1,188 10,525 9.0
Other American 3,573 649 532 415 241 229 131 192 216 214 347 431 300 3,897 9.1
Others & not stated 680 29 28 61 50 42 31 31 36 38 58 65 49 518 -23.8
All countries 1,341,860 120,974 115,600 119,841 104,967 101,138 84,345 115,881 109,471 102,849 134,052 132,247 158,043 1,399,408 4.3 1
Provisional 2
Revised 6
Special Administrative Region of China
12
Country of residence Year 20172018
1% Change
2018 / 2017
13
Table 6(i):- Tourist arrivals by age and gender, 2017 and 2018
Male Female Total Male Female Total Male Female Total
Under 5 24,996 24,763 49,759 26,718 26,198 52,916 6.9 5.8 6.3
5 - 9 28,618 28,163 56,781 30,301 29,706 60,007 5.9 5.5 5.7
10 - 14 27,455 27,729 55,184 29,239 28,907 58,146 6.5 4.2 5.4
15 - 19 21,015 24,225 45,240 21,887 25,333 47,220 4.1 4.6 4.4
20 - 24 23,491 36,960 60,451 24,161 37,525 61,686 2.9 1.5 2.0
25 - 29 68,416 84,388 152,804 67,827 84,805 152,632 -0.9 0.5 -0.1
30 - 34 74,593 72,614 147,207 78,343 75,788 154,131 5.0 4.4 4.7
35 - 39 63,308 58,661 121,969 67,097 61,812 128,909 6.0 5.4 5.7
40 - 44 57,837 53,592 111,429 59,786 55,116 114,902 3.4 2.8 3.1
45 - 49 60,566 58,213 118,779 61,501 59,156 120,657 1.5 1.6 1.6
50 - 54 62,320 60,335 122,655 62,862 61,657 124,519 0.9 2.2 1.5
55 - 59 51,698 49,534 101,232 54,662 52,941 107,603 5.7 6.9 6.3
60 - 64 40,917 38,975 79,892 43,630 41,802 85,432 6.6 7.3 6.9
65 - 69 30,108 27,798 57,906 32,210 30,257 62,467 7.0 8.8 7.9
70 & over 32,329 28,243 60,572 36,469 31,712 68,181 12.8 12.3 12.6
Total 667,667 674,193 1,341,860 696,693 702,715 1,399,408 4.3 4.2 4.3
1 Provisional
Table6(ii):- Tourist arrivals by broad age group and mode of arrival, 2017 and 2018
Air Sea Total Air Sea Total Air Sea Total
Under 15 160,498 1,226 161,724 169,635 1,434 171,069 5.7 17.0 5.8
15 - 59 967,835 13,931 981,766 994,506 17,753 1,012,259 2.8 27.4 3.1
60 & over 183,962 14,408 198,370 195,547 20,533 216,080 6.3 42.5 8.9
Total 1,312,295 29,565 1,341,860 1,359,688 39,720 1,399,408 3.6 34.3 4.3
1 Provisional
% Change
% ChangeAge group
(years)
2017 2018 1
2018 1
Age group
(years)
2017
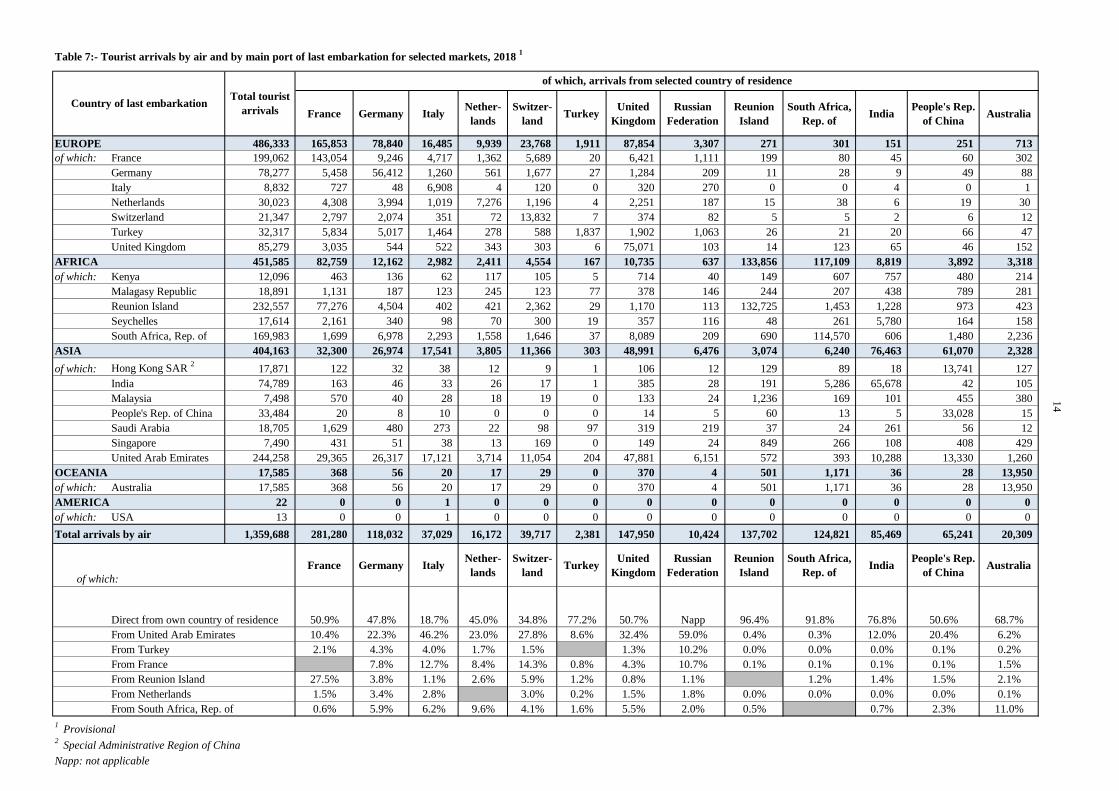
Table 7:- Tourist arrivals by air and by main port of last embarkation for selected markets, 2018 1
France Germany ItalyNether-
lands
Switzer-
landTurkey
United
Kingdom
Russian
Federation
Reunion
Island
South Africa,
Rep. ofIndia
People's Rep.
of ChinaAustralia
EUROPE 486,333 165,853 78,840 16,485 9,939 23,768 1,911 87,854 3,307 271 301 151 251 713
of which: France 199,062 143,054 9,246 4,717 1,362 5,689 20 6,421 1,111 199 80 45 60 302
Germany 78,277 5,458 56,412 1,260 561 1,677 27 1,284 209 11 28 9 49 88
Italy 8,832 727 48 6,908 4 120 0 320 270 0 0 4 0 1
Netherlands 30,023 4,308 3,994 1,019 7,276 1,196 4 2,251 187 15 38 6 19 30
Switzerland 21,347 2,797 2,074 351 72 13,832 7 374 82 5 5 2 6 12
Turkey 32,317 5,834 5,017 1,464 278 588 1,837 1,902 1,063 26 21 20 66 47
United Kingdom 85,279 3,035 544 522 343 303 6 75,071 103 14 123 65 46 152
AFRICA 451,585 82,759 12,162 2,982 2,411 4,554 167 10,735 637 133,856 117,109 8,819 3,892 3,318
of which: Kenya 12,096 463 136 62 117 105 5 714 40 149 607 757 480 214
Malagasy Republic 18,891 1,131 187 123 245 123 77 378 146 244 207 438 789 281
Reunion Island 232,557 77,276 4,504 402 421 2,362 29 1,170 113 132,725 1,453 1,228 973 423
Seychelles 17,614 2,161 340 98 70 300 19 357 116 48 261 5,780 164 158
South Africa, Rep. of 169,983 1,699 6,978 2,293 1,558 1,646 37 8,089 209 690 114,570 606 1,480 2,236
ASIA 404,163 32,300 26,974 17,541 3,805 11,366 303 48,991 6,476 3,074 6,240 76,463 61,070 2,328
of which: Hong Kong SAR 2
17,871 122 32 38 12 9 1 106 12 129 89 18 13,741 127
India 74,789 163 46 33 26 17 1 385 28 191 5,286 65,678 42 105
Malaysia 7,498 570 40 28 18 19 0 133 24 1,236 169 101 455 380
People's Rep. of China 33,484 20 8 10 0 0 0 14 5 60 13 5 33,028 15
Saudi Arabia 18,705 1,629 480 273 22 98 97 319 219 37 24 261 56 12
Singapore 7,490 431 51 38 13 169 0 149 24 849 266 108 408 429
United Arab Emirates 244,258 29,365 26,317 17,121 3,714 11,054 204 47,881 6,151 572 393 10,288 13,330 1,260
OCEANIA 17,585 368 56 20 17 29 0 370 4 501 1,171 36 28 13,950
of which: Australia 17,585 368 56 20 17 29 0 370 4 501 1,171 36 28 13,950
AMERICA 22 0 0 1 0 0 0 0 0 0 0 0 0 0
of which: USA 13 0 0 1 0 0 0 0 0 0 0 0 0 0
Total arrivals by air 1,359,688 281,280 118,032 37,029 16,172 39,717 2,381 147,950 10,424 137,702 124,821 85,469 65,241 20,309
of which:
France Germany ItalyNether-
lands
Switzer-
landTurkey
United
Kingdom
Russian
Federation
Reunion
Island
South Africa,
Rep. ofIndia
People's Rep.
of ChinaAustralia
Direct from own country of residence 50.9% 47.8% 18.7% 45.0% 34.8% 77.2% 50.7% Napp 96.4% 91.8% 76.8% 50.6% 68.7%
From United Arab Emirates 10.4% 22.3% 46.2% 23.0% 27.8% 8.6% 32.4% 59.0% 0.4% 0.3% 12.0% 20.4% 6.2%
From Turkey 2.1% 4.3% 4.0% 1.7% 1.5% 1.3% 10.2% 0.0% 0.0% 0.0% 0.1% 0.2%
From France 7.8% 12.7% 8.4% 14.3% 0.8% 4.3% 10.7% 0.1% 0.1% 0.1% 0.1% 1.5%
From Reunion Island 27.5% 3.8% 1.1% 2.6% 5.9% 1.2% 0.8% 1.1% 1.2% 1.4% 1.5% 2.1%
From Netherlands 1.5% 3.4% 2.8% 3.0% 0.2% 1.5% 1.8% 0.0% 0.0% 0.0% 0.0% 0.1%
From South Africa, Rep. of 0.6% 5.9% 6.2% 9.6% 4.1% 1.6% 5.5% 2.0% 0.5% 0.7% 2.3% 11.0%
1 Provisional
2 Special Administrative Region of China
Napp: not applicable
Country of last embarkationTotal tourist
arrivals
of which, arrivals from selected country of residence
14
15
Table 8:- Tourist arrivals, tourist departures, tourist nights, average length of stay
and tourism earnings, 2015 - 2018
Tourist
arrivals
(Number)
Tourist
departures
(Number)
Tourist
Nights 1
Average
Length of
stay
Tourism
earnings 2
(Rs Mn)
2015 1st Semester 533,781 564,957 5,990,276 10.6 24,240
2nd
Semester 617,471 576,704 6,059,625 10.5 25,951
Year 1,151,252 1,141,661 12,049,901 10.6 50,191 5
2016 1st Semester 586,464 618,615 6,491,532 10.5 27,188
2nd
Semester 688,763 641,510 6,626,375 10.3 28,679
Year 1,275,227 1,260,125 13,117,907 10.4 55,867
2017 1st Semester 625,859 659,243 6,853,948 10.4 29,319
2nd
Semester 716,001 661,897 6,786,803 10.3 30,943
Year 1,341,860 1,321,140 13,640,751 10.3 60,262
2018 3
1st Quarter 356,415 380,086 4,127,448 10.9 18,483
2nd
Quarter 290,450 301,773 2,995,925 9.9 14,977
3rd
Quarter 328,201 321,555 3,481,916 10.8 12,797
4th
Quarter 424,342 4
373,564 3,690,985 9.9 17,781
Year 1,399,408 1,376,978 14,296,274 10.4 64,037
1 Tourist nights for a reference period refer to nights spent by tourists departing in that reference period
2 Source: Bank of Mauritius
3 Provisional
4 Revised
5 As from 2015, BoM is also including data culled from Money changers and Foreign exchange dealers.
Hotels Rooms Bedplaces Hotels Rooms Bedplaces
2015 1st Qr. 114 13,100 26,776 55 9,906 20,378
2nd
Qr. 107 12,264 25,085 51 9,267 19,020
3rd
Qr. 112 12,944 26,618 53 9,769 20,254
4th
Qr. 115 13,617 28,732 55 10,378 22,096
2016 1st Qr. 116 13,710 28,940 56 10,454 22,247
2nd
Qr. 111 13,092 27,523 54 9,963 21,105
3rd
Qr. 111 13,330 28,650 55 10,267 22,370
4th
Qr. 111 13,547 29,139 56 10,480 22,839
2017 1st Qr. 106 13,293 28,667 55 10,327 22,554
2nd
Qr. 98 12,308 26,850 52 9,637 21,235
3rd
Qr. 108 12,875 28,252 54 9,983 22,251
4th
Qr. 111 13,511 29,650 57 10,570 23,579
2018 2
1st Qr. 113 13,588 29,656 57 10,573 23,413
2nd
Qr. 107 12,850 28,414 55 10,075 22,638
3rd Qr. 108 12,867 28,481 55 10,075 22,676
4th Qr. 113 3 13,523 30,296 56 10,469 23,942
1 Refers to hotels in the island of Mauritius which were operational
2 Provisional
3 Excluding one hotel not operational because of renovation works
Year
Table 9:- Hotels 1, rooms and bedplaces, 2015 - 2018
Year All Hotels
Number as at end of period
"Large" Hotels
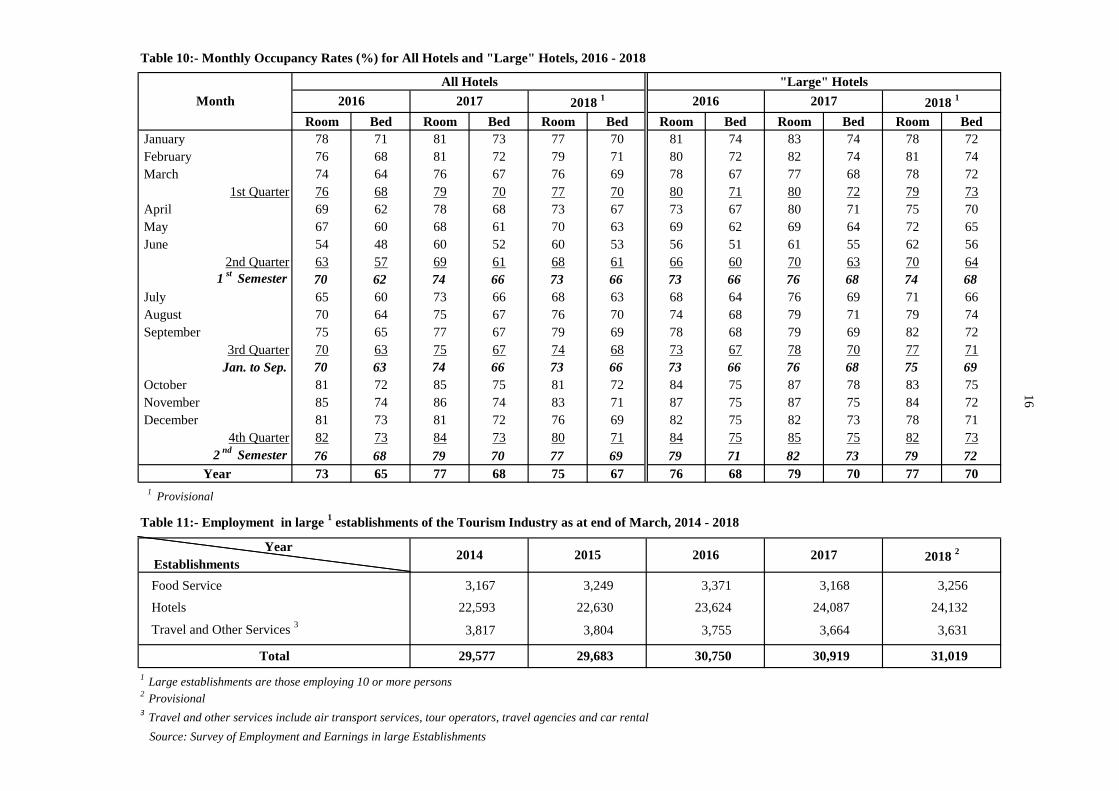
Table 10:- Monthly Occupancy Rates (%) for All Hotels and "Large" Hotels, 2016 - 2018
All Hotels "Large" Hotels
Room Bed Room Bed Room Bed Room Bed Room Bed Room Bed
January 78 71 81 73 77 70 81 74 83 74 78 72
February 76 68 81 72 79 71 80 72 82 74 81 74
March 74 64 76 67 76 69 78 67 77 68 78 72
1st Quarter 76 68 79 70 77 70 80 71 80 72 79 73
April 69 62 78 68 73 67 73 67 80 71 75 70
May 67 60 68 61 70 63 69 62 69 64 72 65
June 54 48 60 52 60 53 56 51 61 55 62 56
2nd Quarter 63 57 69 61 68 61 66 60 70 63 70 64
1st
Semester 70 62 74 66 73 66 73 66 76 68 74 68
July 65 60 73 66 68 63 68 64 76 69 71 66
August 70 64 75 67 76 70 74 68 79 71 79 74
September 75 65 77 67 79 69 78 68 79 69 82 72
3rd Quarter 70 63 75 67 74 68 73 67 78 70 77 71
Jan. to Sep. 70 63 74 66 73 66 73 66 76 68 75 69
October 81 72 85 75 81 72 84 75 87 78 83 75
November 85 74 86 74 83 71 87 75 87 75 84 72
December 81 73 81 72 76 69 82 75 82 73 78 71
4th Quarter 82 73 84 73 80 71 84 75 85 75 82 73
2nd
Semester 76 68 79 70 77 69 79 71 82 73 79 72
Year 73 65 77 68 75 67 76 68 79 70 77 70
1
Provisional
Table 11:- Employment in large 1 establishments of the Tourism Industry as at end of March, 2014 - 2018
Year
Establishments
Food Service
Hotels
Travel and Other Services 3
1 Large establishments are those employing 10 or more persons
2 Provisional
3 Travel and other services include air transport services, tour operators, travel agencies and car rental
Source: Survey of Employment and Earnings in large Establishments
31,019
2018 2
3,256
24,132
3,631
30,919 Total 29,577 29,683 30,750
24,087
3,664
22,630 23,624
3,167 3,249 3,371
3,817 3,804 3,755
2018 1
22,593
16
2017
Month
2014 2015 2016
20172016 2018 1 20172016
3,168
ANNEX I
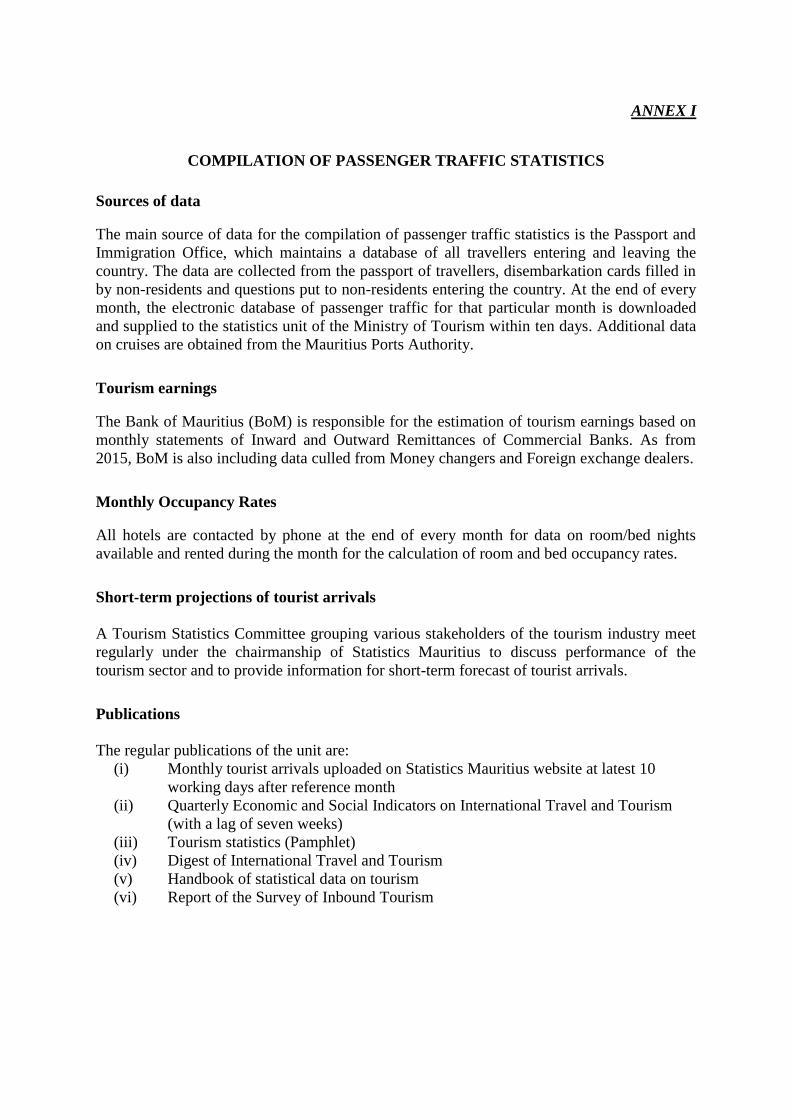
COMPILATION OF PASSENGER TRAFFIC STATISTICS
Sources of data
The main source of data for the compilation of passenger traffic statistics is the Passport and
Immigration Office, which maintains a database of all travellers entering and leaving the
country. The data are collected from the passport of travellers, disembarkation cards filled in
by non-residents and questions put to non-residents entering the country. At the end of every
month, the electronic database of passenger traffic for that particular month is downloaded
and supplied to the statistics unit of the Ministry of Tourism within ten days. Additional data
on cruises are obtained from the Mauritius Ports Authority.
Tourism earnings
The Bank of Mauritius (BoM) is responsible for the estimation of tourism earnings based on
monthly statements of Inward and Outward Remittances of Commercial Banks. As from
2015, BoM is also including data culled from Money changers and Foreign exchange dealers.
Monthly Occupancy Rates
All hotels are contacted by phone at the end of every month for data on room/bed nights
available and rented during the month for the calculation of room and bed occupancy rates.
Short-term projections of tourist arrivals
A Tourism Statistics Committee grouping various stakeholders of the tourism industry meet
regularly under the chairmanship of Statistics Mauritius to discuss performance of the
tourism sector and to provide information for short-term forecast of tourist arrivals.
Publications
The regular publications of the unit are:
(i) Monthly tourist arrivals uploaded on Statistics Mauritius website at latest 10
working days after reference month
(ii) Quarterly Economic and Social Indicators on International Travel and Tourism
(with a lag of seven weeks)
(iii) Tourism statistics (Pamphlet)
(iv) Digest of International Travel and Tourism
(v) Handbook of statistical data on tourism
(vi) Report of the Survey of Inbound Tourism
ANNEX II
GLOSSARY OF TERMS
1. Tourist
A tourist is defined as a non-resident staying overnight but less than a year, and who
has no employer-employee relationship with a resident.
2. Transit
A transit passenger is one who stops over in the country for flight connections to other
destinations. There are two types of transit passengers:
Type I: Passengers who do not leave the transit area of the airport or the harbour.
Type II: Passengers who do leave the airport or harbour and stay in the country
overnight but only for flight connection purposes.
Only Type II transit passengers, as defined above, are included in the definition of
“Tourists”.
3. Excursionist or Same-day Visitor
Excursionists are non-resident visitors, other than those who do not leave the airport,
who depart on the same day they arrived.
4. Tourist Nights
"Tourist nights" for year Y refer to nights spent by tourists who departed in year Y.
5. Large Hotels
Large hotels are well established beach hotels with more than 80 rooms.
6. Occupancy rate
The room/bed occupancy rate is the ratio of room/bed nights rented to the total
number of room/bed nights available.
= Total number of room/bed nights rented x 100
Total number of room/bed nights available