Embed Size (px)
Citation preview
ISSN 1561081-0
9 7 7 1 5 6 1 0 8 1 0 0 5
WORKING PAPER SER IESNO 731 / FEBRUARY 2007
INTERNATIONAL TRADE, TECHNOLOGICAL SHOCKS AND SPILLOVERS IN THE LABOUR MARKET
A GVAR ANALYSIS OF THE US MANUFACTURING SECTOR
by Paul Hiebert and Isabel Vansteenkiste
In 2007 all ECB publications
feature a motif taken from the €20 banknote.
WORK ING PAPER SER IE SNO 731 / F EBRUARY 2007
This paper can be downloaded without charge from http://www.ecb.int or from the Social Science Research Network
electronic library at http://ssrn.com/abstract_id=963068.
1 The views expressed in this paper are those of the authors and do not necessarily reflect those of the European Central Bank (ECB). The authors would like to thank Matteo Cicarelli, Stéphane Dées, Frank Smets, Warwick McKibbin, the staff of the External Developments Division of the ECB, the participants at the 2006 European Trade Study Group (ETSG) Conference, along with an
anonymous referee, for helpful discussions and comments. Any remaining errors are the sole responsibility of the authors.2 Contact info: Isabel Vansteenkiste, European Central Bank. Kaiserstrasse 29, 60311 Germany. Tel: (+49) (0)69 1344 8446.
E-mail: [email protected] and Paul Hiebert, European Central Bank, Kaiserstrasse 29, 60311 Germany; Tel: (+49) (0)69 1344 6473. E-mail: [email protected].
INTERNATIONAL TRADE, TECHNOLOGICAL SHOCKS AND SPILLOVERS IN THE
LABOUR MARKET
A GVAR ANALYSIS OF THE US MANUFACTURING
SECTOR 1
by Paul Hiebert 2 and Isabel Vansteenkiste 2

© European Central Bank, 2007
AddressKaiserstrasse 2960311 Frankfurt am Main, Germany
Postal addressPostfach 16 03 1960066 Frankfurt am Main, Germany
Telephone +49 69 1344 0
Internethttp://www.ecb.int
Fax +49 69 1344 6000
Telex411 144 ecb d
All rights reserved.
Any reproduction, publication and reprint in the form of a different publication, whether printed or produced electronically, in whole or in part, is permitted only with the explicit written authorisation of the ECB or the author(s).
The views expressed in this paper do not necessarily reflect those of the European Central Bank.
The statement of purpose for the ECB Working Paper Series is available from the ECB website, http://www.ecb.int.
ISSN 1561-0810 (print)ISSN 1725-2806 (online)
3ECB
Working Paper Series No 731February 2007
CONTENTS
Abstract 4
Non-technical summary 5
1 Introduction 7
2 The impact of trade and technological change on the US labour market: a brief review of the literature 8
3 Empirical setup 10 3.1 The GVAR application 10 3.2 The data 11 properties 11
4 Results 12 4.1 Generalised impulse responses 12 4.1.1 Shock to US manufacturing sector trade openness 13 4.1.2 Shock to US manufacturing sector research and development spending 14 4.1.3 Shock to the oil price 15 4.1.4 Sectoral employment spillovers 16 4.2 Contemporaneous effects of starred variables on their sector specific counterparts 16
5 Concluding remarks 17
References 19
Appendices 21
Annex of charts 23
European Central Bank Working Paper Series 33
3.3 Specification issues and integration
Abstract
We empirically analyse the response of US manufacturing labour market variables to vari-ous shocks, notably to trade openness and technology. The econometric approach involves anapplication of the recently developed global VAR (GVAR) methodology of Dees, DiMauro, Pe-saran, and Smith (2005) to 12 manufacturing industries over the period 1977-2003. This frame-work allows for an assessment of both shocks to weakly exogenous variables and intra-industryspillovers. In this vein, beyond a standard set of labour-market related variables (employment,real compensation, productivity and capital stock) and exogenous factors (a sector-specific mea-sure of trade openness, along with common technology and oil price shocks), specific measuresof manufacturing-wide variables are included for each sector. Generalised impulse responsesindicate that increased trade openness negatively affects real compensation, has negligible em-ployment effects and leads to higher labour productivity. These impacts, however, are relativelyweaker those induced by technology shocks, with the latter positively and significantly affectingboth real compensation and employment. There is also evidence of positive spillovers acrossindustries from sector-specific employment and productivity shocks. Impact elasticities suggeststrong intra-sectoral linkages for employment and capital stock formation, contrasting with weaklinkages for what concerns real compensation and productivity.
JEL classification: F16, J01, O33.Keywords: trade, technological change, labour market, global VAR (GVAR), impulse responses.
4ECB Working Paper Series No 731 February 2007
Non-technical summary
There has been sizeable interest in recent years concerning the economic impacts of increasing tradeintegration and skill-biased technological change on the global economy. Given the reallocations ofresources within and across economies implied by associated changes in trade patterns, technologyand tastes, considerable effort has been devoted to gauging the impacts of trade openness andtechnology on the labour markets, in particular for developed economies. Much of the focus hasbeen on the manufacturing sector of these economies, with two main arguments advanced to accountfor relative weakness in labour market developments within this sector vis-a-vis the overall economy.The first argument involves the attrition of low-skilled and/or low-wage jobs in certain sectors todeveloping countries. The second argument involves the role of skill-biased technological change,whereby an autonomous surge in technical progress has generated sectoral reallocation of productionbiased against primarily low-skilled workers in developed economies. These two factors are notmutually exclusive, given that trade is a channel for technology diffusion and adoption.
Theoretical arguments do not provide unequivocal predictions concerning the impacts of in-creased trade openness on labour market outcomes. Widely cited theories linking trade to labourmarket outcomes, such as Heckscher-Ohlin-Samuelson, would yield the prediction that, as tradeliberalisation facilitates international specialisation in production, it should result in higher realaggregate incomes and welfare. Frictions and stickiness may imply some general deviation fromthese predictions in the short run –beyond any distributional issues– as the detachment of work-ers and capital from their original sectors may be slowed by frictional unemployment and policiesimpeding the efficient mobility of labour across industries. Various approaches have been followedin the empirical validation of theoretical predictions, though considerable heterogeneity in suchresearch to date remains, and accordingly there still do not exist any definitive estimates of theeffects of trade liberalisation and technological progress on labour market outcomes. That said,three broad findings within the existing empirical literature on the empirical effects of trade onlabour market outcomes can be drawn. First, enhanced trade between developed and developingcountries places some downward pressure on the relative returns to unskilled, low-wage workersin developed countries. Second, the direction of causality between trade and employment is notalways easy to establish – though several studies report a negative relationship. Third, domesticfactors are typically found to be the principal determinant of employment changes.
In this paper, we seek to quantify the extent to which relative weakness in US manufacturinglabour market outcomes has derived from trade openness and technology based on a panel of12 sectors of US manufacturing over the period 1977–2003. We examine the role of changes toindustry trade openness, along with common shocks to technology and the oil price, on sectorallabour market outcomes. We also assess the role of spillovers from selected idiosyncratic shocksto individual subsectors of manufacturing. The empirical methodology is a variant of the recentlydeveloped approach of Dees, DiMauro, Pesaran, and Smith (2005), which is system approach ina panel setting allowing for the assessment of shocks to weakly exogenous factors along with ananalysis of intra-sectoral spillovers. The analysis assesses the impacts of shocks to industry tradeopenness (proxied by the sum of exports and imports by sector), technology (proxied by research anddevelopment spending) and the oil price on a system comprised of four sector-specific endogenousvariables (employment, real compensation per employee, productivity and capital stock), along withsector-specific weighted averages of other sectors of manufacturing. Such a system structure allowsfor interaction between productivity and labour market variables, consistent with the increasinglyaccepted role of international trade in shaping productivity developments.
5ECB
Working Paper Series No 731February 2007
dynamics in response to shocks indicates that, whilst there is some heterogeneity in industry-specificimpacts to sectoral trade openness and a common technology shock, trade openness on averagenegatively affects real compensation and has a negligible effect on employment, whilst technologyappears to positively and significantly affect both real compensation and employment. In thissense, it would suggest that higher import competition for manufacturing industries has tended tomanifest itself through real wage adjustment, an effect which appears to be growing through time.Increased trade openness is also found to be associated with higher domestic productivity in the USmanufacturing sector. Concerning the relationship between manufacturing industries, strong intra-sectoral linkages appear to be present for employment and capital formation, contrasting with weaklinkages for what concerns real compensation and productivity. Indeed, an analysis of dynamicspoints to some evidence of positive employment spillovers from shocks to textile sector employmentand productivity in the “other transport” sector.
6ECB Working Paper Series No 731 February 2007
The results indicate that shocks to trade openness and technology have significant labour marketimpacts for many manufacturing subsectors, with some degree of heterogeneity in impacts, alongwith a role for intra-industry spillovers in the propagation of industry-specific shocks. An analysisof the dynamics of the system yields the finding that technology shocks have a more importantlabour market impact in the manufacturing sector over the period considered than do shocks totrade openness, in keeping with the broad thrust of existing literature. An analysis of the system
1 Introduction
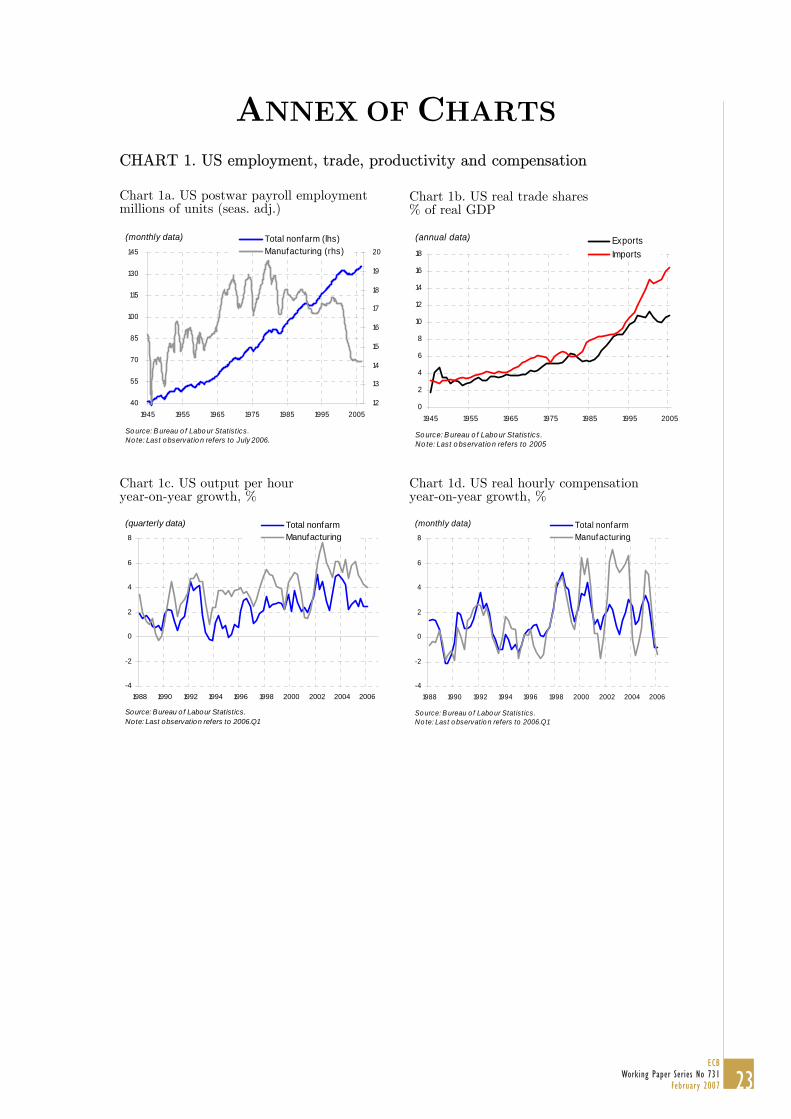
In recent years, increasing trade integration of emerging markets has intensified a long-standingdebate on the effects of international trade on employment and wages in industrialised countries.At the same time, accelerating technological progress in recent years has likely been exerting someinfluence on labour market outcomes. For the US, employment in the manufacturing sector has beenrelatively weak in recent years, whilst more generally being in a position of relative secular declinewhen assessed against overall nonfarm employment since the mid-1970s. The relative sluggishnessof manufacturing sector employment when compared with aggregate employment since the mid-1990s (see Chart 1a) has been correlated with a sizeable expansion in the trade deficit in goods andservices (Chart 1b) along with strong productivity gains (Chart 1c). At the same time, relativelystrong productivity gains in the manufacturing sector compared with the overall economy haveonly been partly reflected in real compensation per hour in that sector (Chart 1d).
[INSERT CHART 1]
Two main arguments for structural weakness in industrialised countries’ manufacturing sectorlabour market outcomes have been advanced. The first argument involves the attrition of low-skilled and/ or low-wage jobs in certain sectors to developing countries. Specifically, growingimports of labour-intensive manufactured goods from developing countries have been accompaniedby considerable global corporate restructuring involving more intense use of global subsidiariesand outside contractors in the context of a greater mobility of production factors. The secondargument involves the role of skill-biased technological change, whereby an autonomous surge intechnical progress has generated sectoral reallocation of production biased against primarily low-skilled workers in developed economies.1 A strict dichotomy between trade and technology, however,is difficult given that the two phenomena have become progressively intertwined. As noted inHoekman and Winters (2005), it is increasingly recognised in recent literature that trade is achannel for technology diffusion and adoption, both directly (through imports of capital goods)and indirectly (through pressure on firms exposed to trade to innovate). Research to date hasoffered no conclusive estimates of the effects of trade liberalisation and technological progress onlabour market outcomes.
In this paper, we seek to quantify the extent to which relative weakness in US manufacturinglabour market outcomes has derived from shocks to weakly exogenous factors and intra-sectoralspillovers on the basis of the recently developed global VAR (GVAR) methodology of Dees, Di-Mauro, Pesaran, and Smith (2005) – henceforth DdPS. The analysis is based on a panel of 12 sec-tors of US manufacturing applied to a system comprised of four sector-specific endogenous variables(employment, real compensation per employee, productivity and capital stock) along with severalweakly exogenous variables, including industry-specific trade openness (proxied by the sum ofexports and imports by sector) along with common technology (proxied by research and develop-ment, or R&D, spending) and oil shocks; while for each sector, manufacturing-wide variables areconstructed as weighted average of other sectors.2 Using such a framework we analyse the impactsof trade openness and technological shocks on labour market outcomes as well as the employmentspillovers of idiosyncratic shocks emanating from sectoral variables. Moreover, the system structureof the adopted methodology allows for interaction between productivity and labour market vari-
1Separate arguments unrelated to trade or technology not analysed here include (1) there may have been amore general reduction in the share of manufactured goods in consumption through time in favour of services givendemographic changes in advanced economies, such as the consumption of more medical care and the outsourcing ofhousehold tasks to various service providers (see CongressionalBudgetOffice (2004)); and (2) there may be a statisticaleffect of a “splintering” or “fragmentation” of services from manufacturing, whereby part of the manufacturing valueadded is contracted out to a separate firm and re-classified as a service (see Bhagwati, Panagariya, and Srinivasan(2004)).
2In this sense, whilst the ‘GVAR’ nomenclature is retained, the term ‘global’ applies to manufacturing sector asa whole –and not other countries/ regions– in contrast to the DdPS global model application.
7ECB
Working Paper Series No 731February 2007
ables, consistent with an increasingly accepted role of international trade in shaping productivitydevelopments.
The paper is organised as follows. We preface the analysis with a brief overview of the relevantliterature in Section 2. Next, we proceed to outline the econometric estimation in Section 3. We thenpresent the results of the econometric analysis, both in the form of generalised impulse responsesand impact elasticities, in Section 4. Some concluding remarks are then drawn in Section 5.
2 The impact of trade and technological change on the US labourmarket: a brief review of the literature
Widely cited theories linking trade to labour market outcomes include those of Heckscher-Ohlin-Samuelson and Stolper-Samuelson along with Ricardian models. In the first two theories, compara-tive advantage is due to different factor intensities, whereby countries export goods that intensivelyutilise the factors of production with which they are relatively abundantly endowed, and importgoods that use intensively factors that are relatively scarce at home. In the third theory, compara-tive advantage is due to relative technology differences. Despite underlying differences, all theorieswould argue that, as trade liberalisation facilitates international specialisation in production, itshould result in higher real aggregate incomes and welfare (OECD (2005)). That said, higher tradeopenness may imply distributional and occupational shifts.3
Frictions and stickiness may alter the predictions of these theories, which are assumed to op-erate over a time period that is long enough to allow complete detachment of workers and capitalfrom their original sectors. Indeed, in the long run trade (along with associated technologicalgains) would be expected to benefit the population of both emerging and developed economiesthrough more efficient resource allocation, lower prices, more product choice and pecuniary gainsfrom deepening specialisation and, ultimately, higher living standards. In the short run, however,some adjustment costs could result in particular related to distributional effects associated withsectoral reallocation of labour. Such adjustment costs may arise from, inter alia, frictional unem-ployment associated with sectoral reallocation of displaced workers and any associated need forretraining,4 and policies that impede the mobility of labour by slowing down the transfer of re-sources from declining to expanding activities (see Kongsrud and Wanner (2005) for an overviewof such policies).5
Various approaches have been followed in the empirical validation of the above theories. A firststrand of the literature has involved factor content calculations, whereby trade flows are analysed tocompute the labour content of imports relative that of exports to evaluate the net impact of tradeon labour markets – such as Baily and Lawrence (2004), Sachs and Shatz (1994), Wood (1995)and Wood (1998). A second strand has involved econometric analysis, such as Revenga (1992) andGrossman (1987), whereby it is empirically tested whether increasing import competition can be amajor factor behind declining employment and sluggish real compensation growth in industrialisedeconomies. A third strand has been more eclectic, involving inter alia general equilibrium modelsof trade, analysis of input mixes at the industry level given input mix changes in production astrade is liberalised, and the role of prices (e.g. the evolution of commodity prices over time).
Available empirical evidence has been mixed for what concerns the labour market impacts of3In this vein, while the Stolper-Samuelson theory posits that when import-competing goods are relatively labor-
intensive, protection unambiguously raises real wages (see Neary (2004)), such a prediction depends importantly onwhether the trade prices of labour intensive goods rise or fall in response to an openness shock, reflecting the interplayof a “lift all boats” effect versus a “redistributive” effect – see Bhagwati (1998).
4It could be argued that such costs are higher in the manufacturing sector than elsewhere as job-specific or industry-specific skills are likely more important in manufacturing firms than in service industries where skills transfer acrossfirms and industries more easily.
5Terfous (2006) contrast a temporary adjustment effect on developed economies’ labour markets (given frictionsin related adjustment) with lasting effects (through changing skill-composition of the demand for labour and trade-induced technical progress).
8ECB Working Paper Series No 731 February 2007
increasing trade openness. Three main conclusions can be drawn from the extensive review ofavailable literature within OECD (2005) and Molnar, Pain, and Taglioni (2006). First, enhancedtrade between developed and developing countries places some downward pressure on the relativereturns to unskilled, low-wage workers in developed countries.6 Second, the direction of causalitybetween trade and employment is not always easy to establish (though several studies report anegative relationship). Third, domestic factors are typically found to be the principal determinantof employment changes.
Whilst several studies have found evidence that the demand for labour in developed economies –particularly unskilled– may have become more elastic as a result of enhanced international openness,the literature has pointed to only a limited direct impact of trade on wages and/or employmentin developed economies. Such findings, however, must be tempered by the fact that trade andtechnological progress may be inextricably linked, thereby introducing an indirect effect of tradeon labour market outcomes. As pointed out in several papers, notably Wood (1994), Wood (1995),Wood (1998), Anderton and Oscarsson (2002), and Thoenig and Verdier (2003), internationalcompetition may lead firms in advanced economies to raise productivity by pursuing “defensiveinnovation”, including pressure to innovate and/or alter the skill-intensity of production in responseto a higher degree of trade openness. Moreover, trade may constitute a form of “technologytransfer”, i.e. convergence in technical efficiency within individual countries over time, particularlyfor trade among developed economies.7 Accounting for productivity impacts of increased tradeopenness, a trade-induced technology shock can either negatively or positively affect labour marketoutcomes, as trade may induce firms to successfully introduce productivity-enhancing technologieswhich do not have a definite positive or negative ex-ante labour market impact. On one hand,as noted in Amiti and Weil (2005), a positive technology shock may result in higher demand forlabour due to scale effects, whilst higher productivity can lead to lower prices, generating furtherdemand for output and labour given associated competitiveness gains. On the other hand, higherproductivity can translate into job losses as the same amount of output can be produced withfewer inputs, whilst lower prices of imported inputs could lead to substitution away from domesticlabour. Complicating matters further, trade does not have a clear causal effect on productivity.Whilst frictions associated with the adjustment to trade shocks may imply short-term labour marketimpacts which correlate with productivity,8 the causality may go in the other direction due to acomposition effect, whereby more productive firms become better exporters.9
Ultimately, a lack of clear theoretical or empirical findings showing a definite impact of tradeand technology on labour market outcomes motivates further empirical work on the issue. Con-sidering the interrelations between not only key labour market variables –i.e. compensation andemployment– but also trade and technology, a systems analysis also analysing dynamics inducedby shocks is warranted.
6Further complicating matters, wage adjustment may be more complex in the case of increasingly fragmentedproduction –or “task-trading”– in contrast to the production and exchange of complete goods examined in traditionaltrade theory. In this context Grossman and Rossi-Hansberg (2006) argue that when considering the real wage impactsof offshoring, productivity effects should be considered along with relative price and labour supply effects.
7In terms of recent studies, Cameron, Proudman, and Redding (2005) provide an empirical investigation of sucheffects between the US and the UK, with the finding that international trade raises rates of UK productivity growththrough technology transfer but not innovation, whilst Keller and Yeaple (2005) find for the case of the US thatFDI spillovers have a significant role in boosting productivity growth in the manufacturing sector though the casefor import-related technology transfers is less clear.
8In particular, domestic companies subject to foreign competition may pursue internal restructuring involving lay-offs and firm closures – though if such restructuring does not keep up with the decline in sales, which is plausible givenadjustment costs in intensity of employment along with hiring and firing costs, this may imply falling productivityon the aggregate. Bernard, Jensen, and Schott (2006) find that plant survival and growth are negatively associatedwith industry exposure to low-wage country imports.
9That said, the recent studies of Bernard and Jensen (2001) and Bernard and Jensen (1999) find no evidence fora positive impact of exports on productivity for the US.
9ECB
Working Paper Series No 731February 2007
3 Empirical setup
In this section present the empirical framework used to generate results in Section 4 in three steps.We first explain the general properties of the empirical framework. Second, we outline the dataused in the empirical analysis. Third, we present information on specification issues and integrationproperties of the data.
3.1 The GVAR application
The GVAR framework of DdPS and Pesaran, Schuermann, and Weiner (2004) –henceforth PSW– isadapted to an analysis of labour market developments in the US manufacturing sector. This modelexplicitly allows for interdependencies that exist between sectoral and manufacturing-wide factors,allowing for an analysis of the industry effects of exogenous common or sector-specific shocks aswell as an assessment of spillovers from industry-specific shocks to endogenous variables within thesystem.
In line with DdPS, we assume we have N + 1 states, indexed by i = 0, 1, 2, ..., N . For eachindustry, we thus assume that industry-specific variables x are related to corresponding industry-specific weighted averages of the other industry’s variables x∗ plus deterministic variables, such asa time trend (t), industry-wide (weakly) exogenous variables and an industry-specific exogenousvariable. For simplicity, we confine our exposition here to a first-order dynamic specification as inPSW. In this case we can relate the ki×1 industry-specific variables, xit = (pit, yit), to x∗it = (p∗it, y
∗it),
the industry-wide (weakly) exogenous variables dt and an industry-specific exogenous variable mt
and write:
xit = aio + ai1t + Φixi,t−1 + Λi0x∗i,t + Λi1x
∗i,t−1 + ψi0dt + ψi1dt−1 + µi0mt + µi1mt−1 + εit
where Φi is a ki×ki matrix of lagged coefficients, Λi0 and Λi1 are ki×k∗i matrices of coefficients as-sociated with the industry-specific variables, ψi0 and ψi1 are ki×s matrices of coefficients associatedwith the common industry-wide variables, µi0and µi1 are kix1 matrices of coefficients associatedwith the industry-specific exogenous variable and εit is a ki × 1 vector of idiosyncratic industry-specific shocks. We assume in this model that the idiosyncratic shocks, εit, are serially uncorrelatedwith mean zero and a nonsingular covariance matrix, Σii = (σii,ls) where σii,ls = cov(εilt, εist), orwritten more compactly, εit ∼ iid(0, Σii). The assumption that the industry-specific variance-covariance matrices are time invariant can be relaxed, but for the analysis of annual observations,this time invariant assumption may not be overly restrictive. This industry-specific model can nowbe consistently estimated separately, treating dt and x∗it as weakly exogenous I(1) with respect tothe parameters of this model.
The weak exogeneity assumption in the context of cointegrating models implies no long-runfeedbacks from xit to x∗it, without necessarily ruling out lagged short-run feedbacks between thetwo sets of variables. In this case xit is said to be long run forcing x∗it, and implies that the errorcorrection terms of the individual industry VECMs do not enter in the marginal model of x∗it (seeDdPS). The weak exogeneity of these variables can then be tested in the context of each of theindustry-specific models. Once the individual industry models are estimated all the endogenousvariables need to be solved for simultaneously.
All industry-specific models together with the relations linking the (weakly) exogenous variablesof the industry-specific models to the variables in the rest of the model provide a complete system.However, due to data limitations for even moderate values of N , a full system estimation of themodel may not be feasible. To sidestep this difficulty, we follow PSW and estimate the parameters ofthe cross-section-specific models separately, treating the foreign industry-specific variables as weaklyexogenous on the grounds that industries are small relative to the size of the overall manufacturingsector.
10ECB Working Paper Series No 731 February 2007

be given by:Gxt = ao + a1t + Hxi,t−1 + ψ0dt + ψ1dt−1 + µ0mt + µ1mt−1 + εt
where ao, a1, ψ0, ψ1, µ0, µ1, G, H, and εt can be defined as: (j = 0 or 1)
aj =
a0j
a1j
...aNj
εt =
ε0t
ε1t
...εNt
ψ/µj =
ψ/µ0j
ψ/µ1j
...ψ/µNj
G =
A0W0
A1W1
...ANWN
H =
B0W0
B1W1
...BNWN
whereby Wi is a (ki×k∗i )×k matrix of fixed constants defined in terms of the state-specific weights.Wi can be viewed as the link matrix that allows the state–specific models to be written in termsof the global variable vector xt.
In general, such a GVAR model allows for interactions among the different industries throughthree separate but interrelated channels. First, there is a contemporaneous dependence of xit
on x∗it and on its lagged values. Second, there is a dependence of the state-specific variables oncommon exogenous variables, such as oil and technology. Third, there is a nonzero contemporaneousdependence of shocks in industry i on the shocks in industry j, measured via the cross-industrycovariances, Σij .
3.2 The data
We analyse 12 US manufacturing sectors classified according to the “International Standard Indus-trial Classification” (ISIC) revision 3.10 The frequency is annual, and spans the period 1977–2003(i.e. a T dimension of 25 and an N dimension of 12). The endogenous sector-specific variables,xit, included in the model are real compensation per employee (COMP ), productivity (PROD),full-time equivalent employment (EMPL) and the capital stock (CAP ). For each sector we assumethat the sector-specific variables are related to an exogenous sector-specific variables (namely tradeopenness, OPEN11) and manufacturing-wide variables (measured as a sector-specific weighted av-erage of the other sectors – henceforth star variables, x∗it). A set of deterministic variables, suchas time trends (t), is also included, along with common manufacturing-wide (weakly) exogenousvariables (dt), consisting of R&D expenditure per employee (R&D), and the oil price (OIL). Thesources and the construction of the data are discussed in more detail within Appendix B.
3.3 Specification issues and integration properties
For all industries, the sector-specific models therefore contain the four endogenous variables, theirstarred counterparts, trade openness as a sector-specific weakly exogenous variable, along with R&Dand the real oil price as global, weakly exogenous variables. For each sector, we then estimate thecorresponding cointegrating VAR model and determine the rank of the cointegration space. Dueto data limitations, we select the lag order of the sectoral and starred variables and set both equalto one.
Our working assumption in this modelling exercise is that the country-specific star variables areweakly exogenous I(1) variables, and that the parameters of the individual models are stable overtime. These long-run forcing assumptions allow us to estimate and test the long run properties of
10A 13th sector under the ISIC Classification, “Coke, refined petroleum products and nuclear fuel”, is excludedgiven that factors autonomous from those affecting other industries likely drive its evolution relative to the othersectors.
11Trade openness is measured as the sum of exports and imports of goods by sector. Whilst alternative measures,such as tariffs, may also capture openness, industry-specific measures are not available for the full timespan of thedataset within the paper, but for the period in which there is overlap, appear to be highly correlated with the industryequivalents of the adopted measure of openness. Specifically, the average correlation coefficient between the sectoralopenness variable and tariffs data (the most favoured nation definition) excluding the food sector is 73% and includingthe food sector 62%.
11ECB
Working Paper Series No 731February 2007
Overall, the manufacturing-wide model, associated with the industry-specific models can now
the different country specific models separately and consistently. Both assumptions are needed foran initial implementation of the GVAR model (see DdPS). While the GVAR methodology can beapplied to integrated variables, this assumption allows us to distinguish between short- and long-run relations and interpret the long-run relations as cointegrated. Formal unit root tests suggestthat all variables analysed can be considered as I(1), once accounting for possible structural breaksand other possible one-off factors. Augmented Dickey Fuller tests suggest that the hypothesis of aunit root cannot be rejected for most variables for most individual industries – as well as for thepanel as a whole.
Given this set-up the rank of the cointegrating space for each sector is computed using Jo-hansen’s trace and maximal eigenvalue statistics as set out in Pesaran, Shin, and Smith (2000)for models with weakly exogenous I(1) regressors, in the case where unrestricted constants andrestricted trend coefficients are included in the individual country error correction models. In mostcases, we find one cointegrating relationship except in the case of the textile sector where we findtwo. The cointegration results are based on the trace statistic (at the 95% critical value level) whichis known to yield better small sample power results compared to the maximal eigenvalue statistic.Ultimately, results from the impulse response analysis in Section 4 along with an analysis of theGVAR’s eigenvalues indicate stability of the system for all shocks considered.
4 Results
Below we present the results of the model in two steps. First, we analyse generalised impulseresponses to several exogenous shocks along with spillovers from shocks to sector-specific endogenousvariables of the system. Specifically, we present the impulse responses from shocks to (i) tradeopenness, (ii) R&D spending, and (iii) the oil price, and (iv) illustrate the strength of spillovers viashocks to employment in the textile sector along with productivity in the other transport sector.Second, we present contemporaneous effects of starred variables on their sector specific counterpartson the basis of impact elasticities.
4.1 Generalised impulse responses
In this section we make use of the Generalized Impulse Response Function (GIRF), as proposed byKoop, Pesaran, and Potter (1996) for non-linear models and developed further in Persaran and Shin(1998) for vector error-correcting models.12 In the absence of strong a priori beliefs on orderingof the variables and/or sectors in the GVAR model, the GIRFs provide useful information withrespect to changes in trade openness, R&D and employment. Although the approach is silent as tothe specific structural factors behind the changes, the GIRFs can be quite informative about thedynamics of the transmission of shocks.
To study the dynamic responses of the GVAR variables to exogenous shocks along with spilloversfrom idiosyncratic sector-specific shocks, we investigate the implications of the following innova-tions:
• The employment, real compensation and productivity impacts of a one standard error positiveshock to trade openness in each of the US manufacturing sector industries;
• The employment and real compensation impacts of a one standard error positive shock toR&D spending in the US manufacturing sector;
12The GIRF is an alternative to the Orthongonalised Impulse Responses (OIR) of Sims (1980). The OIR approachrequires the impulse responses to be computed with respect to a set of orthogonalised shocks, whilst the GIR approachconsiders shocks to individual errors and integrates out the effects of the other shocks using the observed distributionof all the shocks without any orthogonalisation. Unlike the OIR, the GIRF is invariant to the ordering of the variablesand the countries in the GVAR model, which is clearly an important consideration given various possible alternativeorderings. Even if a suitable ordering of the variables in a given country model can be arrived at from economictheory or general a priori reasoning, it is not clear how to order sectors in the application of the OIR to the GVARmodel.
12ECB Working Paper Series No 731 February 2007
• The employment and real compensation impacts of a one standard error positive shock to theoil price; and
• The employment spillovers emanating from two industry shocks, namely a a one standarderror negative shock to employment in the textile sector along with a one standard error shockto productivity in the “other transport” sector.
Impulse responses are presented for twenty years following the imposition of a shock. Charts 2to 5 display the bootstrap estimates of the GIRFs obtained using the sieve bootstrap procedure asreported in DdPS.
4.1.1 Shock to US manufacturing sector trade openness
Charts 2a and 2b present the GIRFs of a positive one standard error shock to trade openness withinthat sector on employment and real compensation in US manufacturing industries. A one standarderror positive shock results in a one percentage point increase in US manufacturing trade openness.
Concerning employment, an increase in sector trade openness has a mild negative or neutralimpact on employment in the corresponding sector in most cases, though it is insignificant inseveral instances (Chart 2a). The average industry response is initially negative and small –ataround 1
20%– followed by a gradual neutralisation which brings the impact to near zero withina decade. In general, standard error bands indicate for a majority of sectors that the long-runemployment impacts of such a shock is essentially absent. The dispersion of industry responses isrelatively high, though heavily influenced by one clear outlier (other transport), where a positiveemployment impact reaching a maximum of around 1
6% predominates. In the latter case, it isconceivable that openness has lowered the costs (e.g. via tariffs or regulatory barriers) or transport,thereby increasing its use. One key factor undepinning this development may be the evolution ofthe airline industry (representing the bulk of other transport) which appears to have benefitedconsiderably from trade and is highly trade open. In general, whilst splitting production intostages (i.e. primary, secondary and tertiary production) cannot be achieved cleanly within the ISICframework, it would appear that zero short- and longer-term impacts of openness are present forFTE employment within primary industries. The dynamics of system, whereby the initial impactsare generally highest and the effect of the shock decays through time, could be consistent withseveral factors, including adjustment costs in reallocating labour, frictions in varying the intensityof labour workforce in particular sectors, and a gradual loss of market share when faced withcompetition. Moreover, capital-labour substitution, particularly given with technology transferassociated with trade, may impart some equilibrium shifts as well as persistence in adjustmentdynamics of employment to changes in openness.
Concerning real compensation, an openness shock appears to negatively impact all sectorsconsidered with the only exception of machinery and equipment, where the impact is positive(Chart 2b). The average industry response is initially negative, with a fall in real wages of justover 1% in absolute terms, followed initially by some amplification of the response prior to a verygradual neutralisation which brings the impact to near zero within two decades. In general, stan-dard error bands indicate significant negative impacts of trade openness on compensation, with theonly exception of paper (where the impact at all horizons is effectively insignificant). In the longrun, confidence intervals obtained from the standard error bands indicate the effects of openness oncompensation are neutralized for all sectors except for basic metals and other transport (where it isnegative), along with machinery and equipment (where it is positive). The dispersion of industryresponses is relatively low, with a response of similar initial fall in wages of around one percentagepoint in 8 of the 12 industries. An examination of the dynamics of system indicates that, somewhatin contrast to the GIRFs for employment, a U-shaped profile in response of wages to the shock inseveral industries, possibly corresponding to some wage rigidity.
Analysing these results in the context of the literature in Section 2, the finding of a very limitedemployment response to an openness shock corroborates the basic thrust of the literature that the
13ECB
Working Paper Series No 731February 2007
import competition effect is not the main driving force of manufacturing employment adjustments.At the same time, it does show that higher import competition appears to manifest itself throughreal wage adjustment.13 Such a finding, whilst consistent with low real wage growth through themid-1990s, would also be consistent with the predictions of the Stolper-Samuelson theory. Asnoted in Neary (2004), improved communications may have allowed large firms to fragment theiroperations, moving more unskilled-labor-intensive stages of production to countries where unskilledwages are low, so lowering unskilled wages in developed countries while simultaneously raisingskilled wages in developing countries. Moreover, growing openness may be having an increasinglyimportant effect on the wage formation process in the sectors analysed. This is confirmed bycomparing the outcome of the GVAR over the sample period 1977-1999 with that of 1977-2003whereby in the latter case the impulse responses to a one standard deviation shock in the USmanufacturing trade openness appear to indicate a larger effect on real compensation.
Concerning the impacts of this shock on the other endogenous variables of the GVAR, tradeopenness appears to exert a positive pressure on productivity, positively impacting on all sectorsconsidered (Chart 2c). The average industry response indicates a rapid impact of increased opennesson productivity, with an initially strong impact of 0.2%, rising further to a peak of around 0.3%in the first two years after the shock.14 Standard error bands indicate mainly significant positiveimpacts of trade openness on productivity, with the only exceptions of wood, non-metallic mineralproducts and machinery after over a decade. The dispersion of industry responses in terms of signis minimal, though smaller responses appear to be generally present in primary industries such asrubber, food services and non-metallic mineral products. In general, the impulse responses supportthe view that trade competition induces firms to successfully introduce productivity-enhancingtechnologies. The finding of a positive productivity impact of increased trade openness is consistentwith Lawrence (2000). The latter study finds that import competition has a positive impacton US total factor productivity, mainly in skill-intensive sectors and industries competing withdeveloping countries. This may derive from defensive innovation or also reflect firm composition,whereby in response to greater foreign competition, profit margins fall as markups decline andaverage productivity rises as marginal firms exit the industry (see Chen, Imbs, and Scott (2004)).Concerning the GVAR findings for the sectoral capital stock, trade openness appears to exert apositive effect as with the productivity shock, potentially lending some support for the notion ofinternational technology transfer or defensive innovation on the part of import-competing firms.
[INSERT CHARTS 2a, 2b and 2c]
4.1.2 Shock to US manufacturing sector research and development spending
Charts 3a and 3b present the GIRFs of a one standard error negative shock to US manufacturingsector R&D. This shock is equivalent to an increase of around 5% in US manufacturing R&Dspending per annum.
Concerning employment, an R&D shock unambiguously leads to increases in all sectors con-sidered (Chart 3a). The average response of all industries increases quite steadily from a zeroresponse to a 11
4% positive impact after a decade. An analysis of standard error bands indicatesthat the impacts of the technology shock are significant for 8 of the 12 sectors considered; zeroimpacts are only present for wood, paper products, machinery and motor. The dispersion of theresults within the cases where the shock produces significant positive impacts is rather low, with an
13The finding of an initial negative impact on labour compensation is consistent with the findings reported in OECD(2005), where it is reported that large wage losses on the post-displacement job are a particularly important sourceof post-displacement earnings losses in the United States in contrast to Europe, where long-term unemployment andlabour force withdrawal constitute a bigger source of earnings losses.
14This is somewhat stronger than the estimated impacts in Helbling, Jaumotte, and Sommer (2006) who, examininga panel of manufacturing industries in developed economies, find that a 1% increase in relative trade openness increasesrelative productivity by 0.12%.
14ECB Working Paper Series No 731 February 2007
impact in the vicinity of the above average impact for six industries, and with relatively strongerimpacts on fabricated metals and other transport. An examination of the dynamics induced bythe technological shock indicates that, with the exception of paper, after a small initial impact theeffect gradually increases through time but generally takes less than a decade to reach its maximumimpact. Such a finding could relate to adjustment costs, including the need for related investmentin intangible capital, along with costs associated with rigidities in reallocating labour associatedwith the exploitation of new technologies.
Concerning real compensation, in contrast to the trade openness shock, an increase in R&Dleads to an increase for all sectors except other transport, where it is near zero (Chart 3b). Thisgeneral rise in real compensation following a period of technological progress is in line with theoryas such a technology shock would be expected to increase skill premia embodied within in wages,with some frictions possibly implying sluggishness in adjustment. The average industry responseis fairly high, moving from 21
2% to a peak of just over 3% after only two years. An analysis ofstandard error bands indicates a significant response to the shock for all industries except food andother transport. The dispersion of the results is rather high, with a weak impact of technology onwages for the two latter industries contrasting with a very strong positive impact for four industries(textiles, non-metallic mineral products, basic metals and motor) of well over 5%. Such a findingmay possibly relate to differing skill content within the affected industries, notably heterogeneity inthe adoption of new technologies or differing wage rigidities across affected industries. An analysis ofthe dynamics across all industries indicates a fairly rapid adjustment of compensation to technologyshocks.
Concerning the impacts of this shock on the other endogenous variables of the GVAR, an R&Dshock is, as in the case of the trade openness shock, also accompanied by an increase in productivityand capital stock.
[INSERT CHART 3a and 3b]
4.1.3 Shock to the oil price
Charts 4a and 4b present the GIRFs of a one standard error positive shock to the oil price. Thisshock is equivalent to an increase of around 20% the oil price in one year.
Concerning employment, an increase in the oil price initially depresses employment in all indus-tries, with the exception of those with possible links to the oil price (chemical and other commoditiessuch as basic metals and rubber), with a fairly heterogeneous long-term impact on industry employ-ment. The average response of all industries is an initial employment loss of around 0.4%, fallingin absolute terms to zero after just over a decade. An analysis of standard error bands impliesinsignificant longer-run employment impacts of an oil shock for just over half of the industries. Thedispersion of results is fairly low for most industries, where a negative impact predominates. Anexamination of the dynamics of the responses shows strong initial impacts for all industries excepttextiles; nonzero for all but four sectors.15
Concerning real compensation, an increase in the oil price depresses real compensation for allindustries except the chemicals sector. The average response of all industries is a fall in real wages ofaround 2%, similar in impact in both the short- and long-term. An analysis of standard error bandsimplies insignificant impacts in the long run for textiles, chemical, non-metallic mineral productsand motor industries. The dispersion of responses is rather limited when excluding the positiveimpact within the chemical industry. The dynamics of the responses are quite varied, whilst theonly non-contemporaneous impact is found in the paper industry.
Concerning the impacts of this shock on the other endogenous variables of the GVAR, the oilshock has a negative impact on productivity (on average a 20% shock lower productivity by 0.7%)
15Davis and Haltiwanger (2001) find using plant level data that oil price shocks triggered considerable job reallo-cation and net employment adjustments for U.S. manufacturing jobs from 1972 to 1988.
15ECB
Working Paper Series No 731February 2007
and also on the capital stock (the same shock lowers the capital stock by about 1.2%).
[INSERT CHART 4a and 4b]
4.1.4 Sectoral employment spillovers
In this subsection, we present sectoral employment spillovers resulting from two illustrative industry-specific shocks. First, we shock employment in the US textile sector, given a relatively high labourintensity within this sector along with its relatively elevated exposure to competitive pressures fromemerging markets. Second, we shock productivity in the other transport sector, given its ratherhigh capital content.
The GIRF results for employment of the negative shock to US textile employment is displayedin Chart 5. Overall, a one standard error shock to US textile sector employment, which amounts toa 21
2% fall in the textile sector employment in the long run, reduces employment in all other sectors,with a fairly homogeneous long-term impact on industry employment. The average response of allindustries is an initial employment loss of around 2
3% followed by a maximum impact in absoluteterms of nearly 1% after 5 years. An inspection of the standard error bands, however, indicatesthat an insignificant impact cannot be ruled out in virtually all cases. Such a finding is hardlysurprising against the backdrop of possibly limited linkages of the textile sector to other industriesthrough the production chain, though capital transfer and other such channels may be at play. Thedispersion of results is declines steadily through time.
[INSERT CHART 5]
The GIRF results for employment of the positive unit shock to productivity in the “othertransport” sector is displayed in Chart 6. Overall, a one standard error shock, with a maximumimpact of 13
4% on employment in that sector, reduces employment in all other sectors. The averageresponse of all industries is an initial employment gain of around 3
4% which decays steadily to settleat 1
2% over the first decade. An inspection of the standard error bands indicates significant resultsare present in all cases aside from non-metallic mineral products where a zero impact following adecade cannot be ruled out. A rather stable dispersion of results indicates that the employmentspillovers are positively correlated with a productivity shock in one sector.
[INSERT CHART 6]
4.2 Contemporaneous effects of starred variables on their sector specific coun-terparts
Table 4 presents the contemporaneous effects of the starred variables on the employment of theirsectoral counterparts with robust t-ratios, computed using White’s heteroscedasticity-consistentvariance estimator. These values can be interpreted as impact elasticities of starred variables ontheir industry counterparts‘ employment, or spillovers. Most of them are significant and have apositive sign. They are particularly informative as regards the linkages across sectors.
• Concerning employment, the elasticities vary across sectors by between 0.16 in other transportto 0.95% in fabricated metals. Focusing on the textile sector, representing approximately theaverage impact within this range, we can see that a 1% change in employment in the rest ofthe manufacturing sector, weighted by the importance of these sectors in the textile’s sectoroutput, leads to an increase of 0.5% in employment in the textile sector within the same year.
16ECB Working Paper Series No 731 February 2007
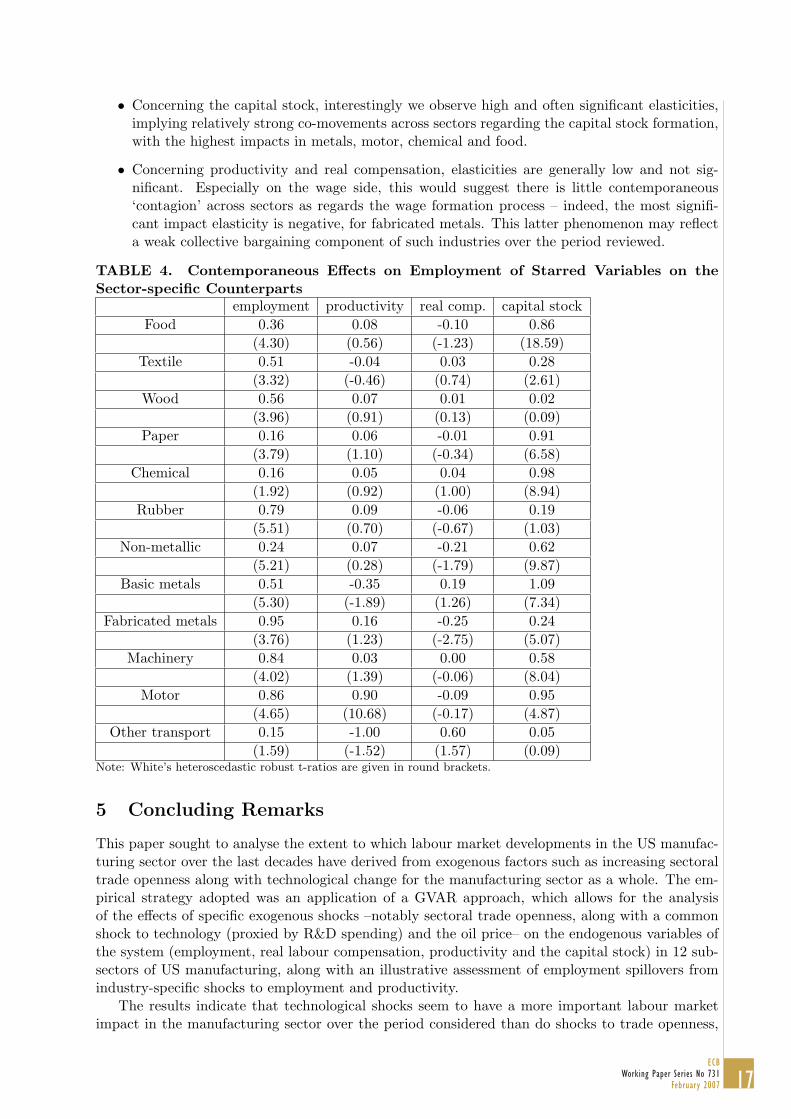
• Concerning the capital stock, interestingly we observe high and often significant elasticities,implying relatively strong co-movements across sectors regarding the capital stock formation,with the highest impacts in metals, motor, chemical and food.
• Concerning productivity and real compensation, elasticities are generally low and not sig-nificant. Especially on the wage side, this would suggest there is little contemporaneous‘contagion’ across sectors as regards the wage formation process – indeed, the most signifi-cant impact elasticity is negative, for fabricated metals. This latter phenomenon may reflecta weak collective bargaining component of such industries over the period reviewed.
TABLE 4. Contemporaneous Effects on Employment of Starred Variables on theSector-specific Counterparts
employment productivity real comp. capital stockFood 0.36 0.08 -0.10 0.86
(4.30) (0.56) (-1.23) (18.59)Textile 0.51 -0.04 0.03 0.28
(3.32) (-0.46) (0.74) (2.61)Wood 0.56 0.07 0.01 0.02
(3.96) (0.91) (0.13) (0.09)Paper 0.16 0.06 -0.01 0.91
(3.79) (1.10) (-0.34) (6.58)Chemical 0.16 0.05 0.04 0.98
(1.92) (0.92) (1.00) (8.94)Rubber 0.79 0.09 -0.06 0.19
(5.51) (0.70) (-0.67) (1.03)Non-metallic 0.24 0.07 -0.21 0.62
(5.21) (0.28) (-1.79) (9.87)Basic metals 0.51 -0.35 0.19 1.09
(5.30) (-1.89) (1.26) (7.34)Fabricated metals 0.95 0.16 -0.25 0.24
(3.76) (1.23) (-2.75) (5.07)Machinery 0.84 0.03 0.00 0.58
(4.02) (1.39) (-0.06) (8.04)Motor 0.86 0.90 -0.09 0.95
(4.65) (10.68) (-0.17) (4.87)Other transport 0.15 -1.00 0.60 0.05
(1.59) (-1.52) (1.57) (0.09)Note: White’s heteroscedastic robust t-ratios are given in round brackets.
5 Concluding Remarks
This paper sought to analyse the extent to which labour market developments in the US manufac-turing sector over the last decades have derived from exogenous factors such as increasing sectoraltrade openness along with technological change for the manufacturing sector as a whole. The em-pirical strategy adopted was an application of a GVAR approach, which allows for the analysisof the effects of specific exogenous shocks –notably sectoral trade openness, along with a commonshock to technology (proxied by R&D spending) and the oil price– on the endogenous variables ofthe system (employment, real labour compensation, productivity and the capital stock) in 12 sub-sectors of US manufacturing, along with an illustrative assessment of employment spillovers fromindustry-specific shocks to employment and productivity.
The results indicate that technological shocks seem to have a more important labour marketimpact in the manufacturing sector over the period considered than do shocks to trade openness,
17ECB
Working Paper Series No 731February 2007
in keeping with the broad thrust of existing literature. An analysis of generalised impulse re-sponses indicate that, whilst there is some heterogeneity in industry-specific impacts to sectoraltrade openness and a common technology shock, trade openness on average negatively affects realcompensation and has a negligible effect on employment, whilst technology appears to positivelyand significantly affect both real compensation and employment. In this sense, it would suggestthat higher import competition for manufacturing industries has tended to manifest itself throughreal wage adjustment, an effect which appears to be growing through time. Increased trade open-ness is found to be associated with higher domestic productivity in the US manufacturing sector.Moreover, there is some evidence of positive employment spillovers from shocks to textile sectoremployment and productivity in the “other transport” sector. Impact elasticities indicate strongintra-sectoral linkages for employment and capital stock formation, contrasting with weak linkagesfor what concerns real compensation and productivity.
Several notable avenues for further research remain. First, an enhancement of the understand-ing of developments in recent years, involving inter alia a split of trade by partner countries so asto allow for a dichotomy of the likely differing effects of trade amongst developed economies ver-sus between developed and emerging economies. Second, adding more economic structure to theapproach may help to disentangle the direct and indirect (via productivity) labour market effectsof trade. Third, the chosen approach could be applied to issue of technology shocks and spilloversacross regions. Lastly, research could be broadened to consider employment dynamics in othersectors in developed economies affected by trade, notably those sectors which have seen growth inemployment resulting from increased openness.
18ECB Working Paper Series No 731 February 2007
References
Amiti, M., and S.-J. Weil (2005): “Service Offshoring, Productivity, and Employment: Evidencefrom the United States,” IMF Working Paper, December 2005.
Anderton, R., and S. Oscarsson (2002): “Inequality, trade and defensive innovation in theUSA,” University of Nottingham, GEP Research Centre, Research Paper no. 2002/28.
Baily, M., and R. Lawrence (2004): “What happened to the great US job machine? The roleof trade and electronic offshoring,” Brookings Papers on Economic Activity, 2:2004.
Bernard, A., and J. Jensen (1999): “Exceptional exporter performance: cause, effect or both?,”Journal of International Economics.
(2001): “Exporting and Productivity,” NBER Working Paper Series No. 7135.
Bernard, A. B., J. B. Jensen, and P. K. Schott (2006): “Survival of the best fit: Expo-sure to low-wage countries and the (uneven) growth of U.S. manufacturing plants,” Journal ofInternational Economics, 68.
Bhagwati, J. (1998): “Play it again, Sam: A new look at trade and wages,” Mimeo (March).
Bhagwati, J., A. Panagariya, and T. N. Srinivasan (2004): “The Muddles over Outsourcing,”Journal of Economic Perspectives, Fall, 18(4).
Cameron, G., J. Proudman, and S. Redding (2005): “Technological convergence, R&D, tradeand productivity growth,” European Economic Review, 49.
Chen, N., J. Imbs, and A. Scott (2004): “Competition, Globalization and the Decline ofInflation,” Centre for Economic Policy Research Discussion Paper No. 4695.
CongressionalBudgetOffice (2004): “What Accounts for the Decline in Manufacturing Em-ployment?,” Economic and budget issues brief, February.
Davis, S., and J. Haltiwanger (2001): “Sectoral Job Creation and Destruction Responses toOil Price Changes,” Journal of Monetary Economics, 48.
Dees, S., F. DiMauro, H. Pesaran, and V. Smith (2005): “Exploring the international linkagesof the euro area: a global VAR analysis,” ECB Working Paper No. 568.
Grossman, G. M. (1987): “The Employment and Wage Effects of Import Competition in theUnited States,” Journal of International Economic Integration, Spring.
Grossman, G. M., and E. Rossi-Hansberg (2006): “The Rise of Offshoring: It’s Not Wine forCloth Anymore,” Mimeo, July.
Helbling, T., F. Jaumotte, and M. Sommer (2006): “How Has Globalization Affected Infla-tion?,” IMF World Economic Outlook, April.
Hoekman, B., and L. A. Winters (2005): “Trade and employment: Stylized facts and researchfindings,” Mimeo (Development Research Group, World Bank), March.
Keller, W., and S. Yeaple (2005): “Multinational enterprises international trade, and produc-tivity growth: Firm-level evidence from the United States,” Deutsche Bundesbank DiscussionPaper Series 1: Economic Studies, 07.
Kongsrud, P. M., and I. Wanner (2005): “The Impact of Structural Policies on Trade-relatedAdjustment and the Shift to Services,” OECD Economics Department Working Papers No. 427.
19ECB
Working Paper Series No 731February 2007
Koop, G., H. Pesaran, and S. Potter (1996): “Impulse Response Analysis in NonlinearMultivariate Models,” Journal of Econometrics, 74.
Lawrence, R. (2000): “Does a kick in the pants get you going or does it just hurt? The impactof international competition on technological change in US manufacturing,” in The Impact ofInternational Trade on Wages (Ed.) R. C. Feenstra.
Molnar, M., N. Pain, and D. Taglioni (2006): “The Internationalisation of Production, In-ternational Outsourcing and OECD Labour Markets,” OECD Document ECO/GEN(2006)2.
Neary, J. P. (2004): “The Stolper-Samuelson Theorem,” Prepared for Encyclopedia of WorldTrade Since 1450, ed. J.J. McCusker et al., New York: Macmillan Reference.
OECD (2005): “Trade-adjustment Costs in OECD Labour Markets: A Mountain or a Molehill?,”in OECD Employment Outlook, pp. 23–72. OECD, Paris.
Persaran, H., and Y. Shin (1998): “Generalized Impulse Response Analysis in Linear Multi-variate Models,” Economic Letters, 58.
Pesaran, H., T. Schuermann, and S. Weiner (2004): “Modelling Regional InterdependenciesUsing a Global Error-Correcting Macroeconomic Mdoe.,” Journal of Business and EconomicStatistics.
Pesaran, H., Y. Shin, and R. Smith (2000): “Structural Analysis of Vector Error CorrectionModels with Exogenous I(1) Variables,” Journal of Econometrics, 97.
Revenga, A. (1992): “Exporting Jobs? The impact of import competition on employment andwages in U.S. manufacturing,” The Quarterly Journal of Economics, February.
Sachs, J. D., and H. Shatz (1994): “Trade and Jobs in U.S. Manufacturing,” Brookings Paperson Economic Activity, 0.
Sims, C. (1980): “Macroeconomics and Reality,” Econometrica, 48.
Terfous, N. (2006): “Globalization and the labour market in the developed countries,” Diagnos-tics Prvisions et Analyses conomiques, 96 (January).
Thoenig, M., and T. Verdier (2003): “A Theory of Defensive Skill-Biased Innovation andGlobalization,” The American Economic Review, 93.
Wood, A. (1994): “North-South Trade, Employment and Inequality: Changing Fortunes in aSkill-Driven World,” Oxford University Press.
(1995): “How trade hurt unskilled workers,” Journal of Economic Perspectives, 9.
(1998): “Globalization and the rise in labour market inequalities,” The Economic Journal,108.
20ECB Working Paper Series No 731 February 2007
Appendices
A Sectors covered
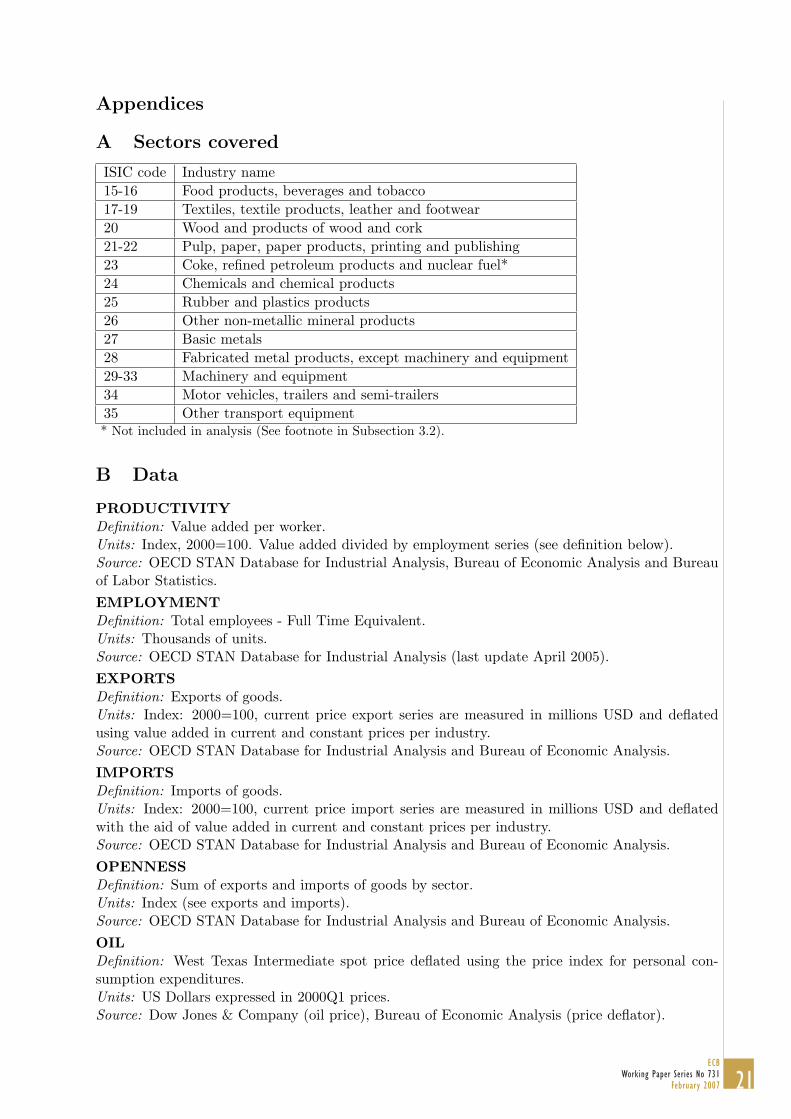
ISIC code Industry name15-16 Food products, beverages and tobacco17-19 Textiles, textile products, leather and footwear20 Wood and products of wood and cork21-22 Pulp, paper, paper products, printing and publishing23 Coke, refined petroleum products and nuclear fuel*24 Chemicals and chemical products25 Rubber and plastics products26 Other non-metallic mineral products27 Basic metals28 Fabricated metal products, except machinery and equipment29-33 Machinery and equipment34 Motor vehicles, trailers and semi-trailers35 Other transport equipment* Not included in analysis (See footnote in Subsection 3.2).
B Data
PRODUCTIVITYDefinition: Value added per worker.Units: Index, 2000=100. Value added divided by employment series (see definition below).Source: OECD STAN Database for Industrial Analysis, Bureau of Economic Analysis and Bureauof Labor Statistics.EMPLOYMENTDefinition: Total employees - Full Time Equivalent.Units: Thousands of units.Source: OECD STAN Database for Industrial Analysis (last update April 2005).EXPORTSDefinition: Exports of goods.Units: Index: 2000=100, current price export series are measured in millions USD and deflatedusing value added in current and constant prices per industry.Source: OECD STAN Database for Industrial Analysis and Bureau of Economic Analysis.IMPORTSDefinition: Imports of goods.Units: Index: 2000=100, current price import series are measured in millions USD and deflatedwith the aid of value added in current and constant prices per industry.Source: OECD STAN Database for Industrial Analysis and Bureau of Economic Analysis.OPENNESSDefinition: Sum of exports and imports of goods by sector.Units: Index (see exports and imports).Source: OECD STAN Database for Industrial Analysis and Bureau of Economic Analysis.OILDefinition: West Texas Intermediate spot price deflated using the price index for personal con-sumption expenditures.Units: US Dollars expressed in 2000Q1 prices.Source: Dow Jones & Company (oil price), Bureau of Economic Analysis (price deflator).
21ECB
Working Paper Series No 731February 2007
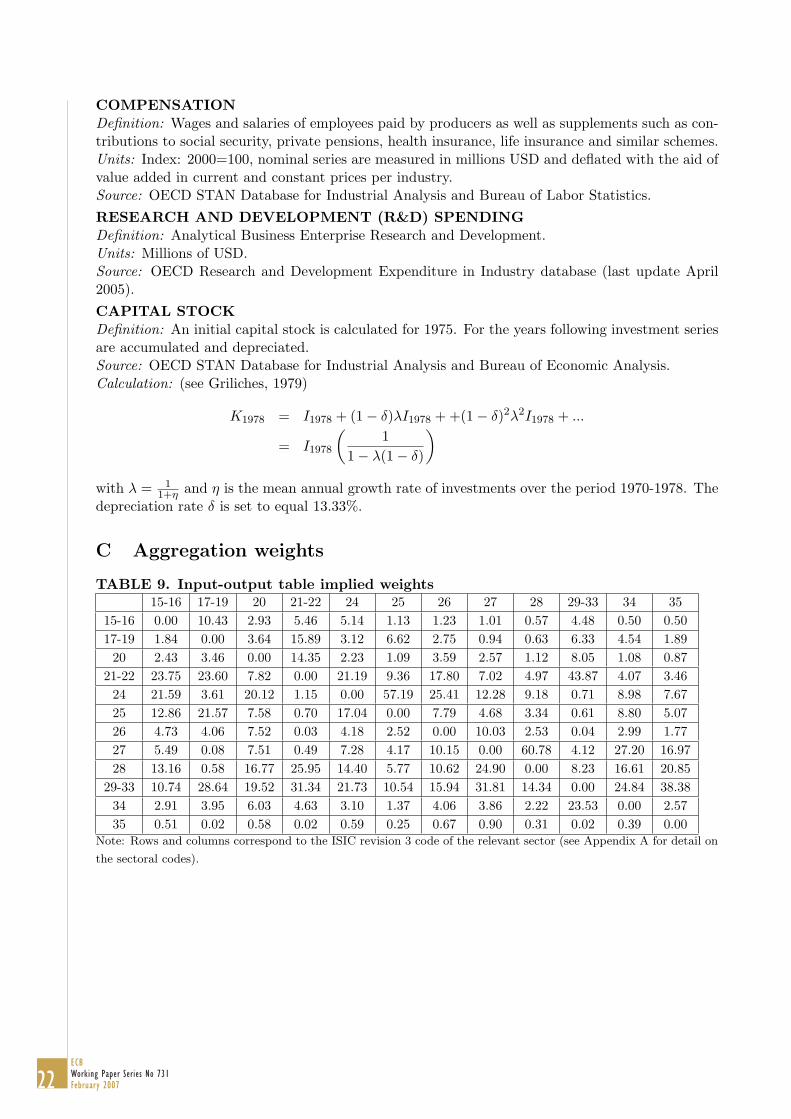
COMPENSATIONDefinition: Wages and salaries of employees paid by producers as well as supplements such as con-tributions to social security, private pensions, health insurance, life insurance and similar schemes.Units: Index: 2000=100, nominal series are measured in millions USD and deflated with the aid ofvalue added in current and constant prices per industry.Source: OECD STAN Database for Industrial Analysis and Bureau of Labor Statistics.RESEARCH AND DEVELOPMENT (R&D) SPENDINGDefinition: Analytical Business Enterprise Research and Development.Units: Millions of USD.Source: OECD Research and Development Expenditure in Industry database (last update April2005).CAPITAL STOCKDefinition: An initial capital stock is calculated for 1975. For the years following investment seriesare accumulated and depreciated.Source: OECD STAN Database for Industrial Analysis and Bureau of Economic Analysis.Calculation: (see Griliches, 1979)
K1978 = I1978 + (1− δ)λI1978 + +(1− δ)2λ2I1978 + ...
= I1978
(1
1− λ(1− δ)
)
with λ = 11+η and η is the mean annual growth rate of investments over the period 1970-1978. The
depreciation rate δ is set to equal 13.33%.
C Aggregation weights
TABLE 9. Input-output table implied weights15-16 17-19 20 21-22 24 25 26 27 28 29-33 34 35
15-16 0.00 10.43 2.93 5.46 5.14 1.13 1.23 1.01 0.57 4.48 0.50 0.5017-19 1.84 0.00 3.64 15.89 3.12 6.62 2.75 0.94 0.63 6.33 4.54 1.89
20 2.43 3.46 0.00 14.35 2.23 1.09 3.59 2.57 1.12 8.05 1.08 0.8721-22 23.75 23.60 7.82 0.00 21.19 9.36 17.80 7.02 4.97 43.87 4.07 3.46
24 21.59 3.61 20.12 1.15 0.00 57.19 25.41 12.28 9.18 0.71 8.98 7.6725 12.86 21.57 7.58 0.70 17.04 0.00 7.79 4.68 3.34 0.61 8.80 5.0726 4.73 4.06 7.52 0.03 4.18 2.52 0.00 10.03 2.53 0.04 2.99 1.7727 5.49 0.08 7.51 0.49 7.28 4.17 10.15 0.00 60.78 4.12 27.20 16.9728 13.16 0.58 16.77 25.95 14.40 5.77 10.62 24.90 0.00 8.23 16.61 20.85
29-33 10.74 28.64 19.52 31.34 21.73 10.54 15.94 31.81 14.34 0.00 24.84 38.3834 2.91 3.95 6.03 4.63 3.10 1.37 4.06 3.86 2.22 23.53 0.00 2.5735 0.51 0.02 0.58 0.02 0.59 0.25 0.67 0.90 0.31 0.02 0.39 0.00
Note: Rows and columns correspond to the ISIC revision 3 code of the relevant sector (see Appendix A for detail on
the sectoral codes).
22ECB Working Paper Series No 731 February 2007
ANNEX OF CHARTS�
CHART 1. US employment, trade, productivity and compensation
Chart 1a. US postwar payroll employment millions of units (seas. adj.)
Chart 1b. US real trade shares % of real GDP
(monthly data)
40
55
70
85
100
115
130
145
1945 1955 1965 1975 1985 1995 2005
So urce: B ureau o f Labo ur Statistics.No te: Last o bservatio n refers to July 2006.
12
13
14
15
16
17
18
19
20
Total nonfarm (lhs)Manufacturing (rhs)
(annual data)
0
2
4
6
8
10
12
14
16
18
1945 1955 1965 1975 1985 1995 2005
So urce: B ureau o f Labo ur Statistics.No te: Last o bservatio n refers to 2005
ExportsImports
Chart 1c. US output per hour year-on-year growth, %
Chart 1d. US real hourly compensation year-on-year growth, %
(quarterly data)
-4
-2
0
2
4
6
8
1988 1990 1992 1994 1996 1998 2000 2002 2004 2006
Source: Bureau o f Labour Statistics.Note: Last observation refers to 2006.Q1
Total nonfarmManufacturing
(monthly data)
-4
-2
0
2
4
6
8
1988 1990 1992 1994 1996 1998 2000 2002 2004 2006
So urce: B ureau o f Labo ur Statistics.No te: Last o bservatio n refers to 2006.Q1
Total nonfarmManufacturing
23ECB
Working Paper Series No 731February 2007
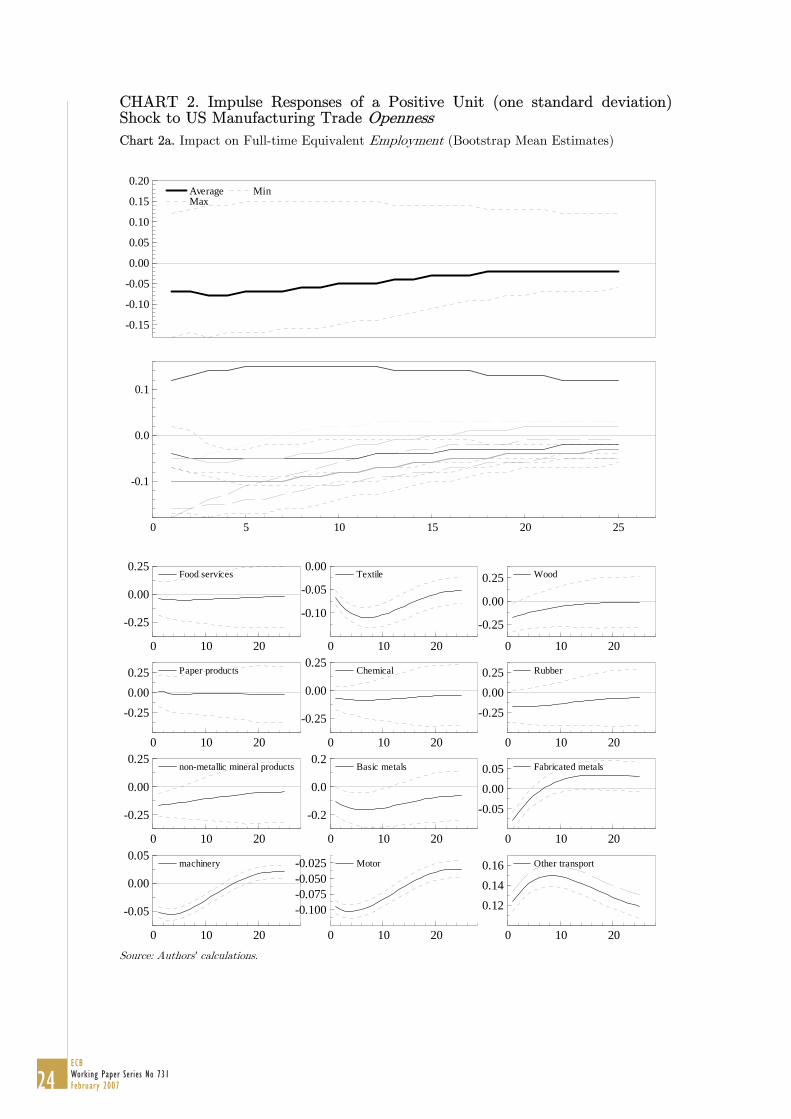
CHART 2. Impulse Responses of a Positive Unit (one standard deviation) Shock to US Manufacturing Trade Openness
Chart 2a. Impact on Full-time Equivalent Employment (Bootstrap Mean Estimates)
-0.15
-0.10
-0.05
0.00
0.05
0.10
0.15
0.20Average Max
Min
0 5 10 15 20 25
-0.1
0.0
0.1
0 10 20
-0.25
0.00
0.25Food services
0 10 20
-0.10
-0.05
0.00Textile
0 10 20
-0.25
0.00
0.25 Wood
0 10 20
-0.250.000.25 Paper products
0 10 20
-0.25
0.00
0.25Chemical
0 10 20
-0.250.000.25 Rubber
0 10 20
-0.25
0.00
0.25non-metallic mineral products
0 10 20
-0.2
0.0
0.2Basic metals
0 10 20
-0.050.000.05 Fabricated metals
0 10 20
-0.05
0.00
0.05machinery
0 10 20
-0.100-0.075-0.050-0.025 Motor
0 10 20
0.120.140.16 Other transport
Source: Authors’ calculations.
24ECB Working Paper Series No 731 February 2007
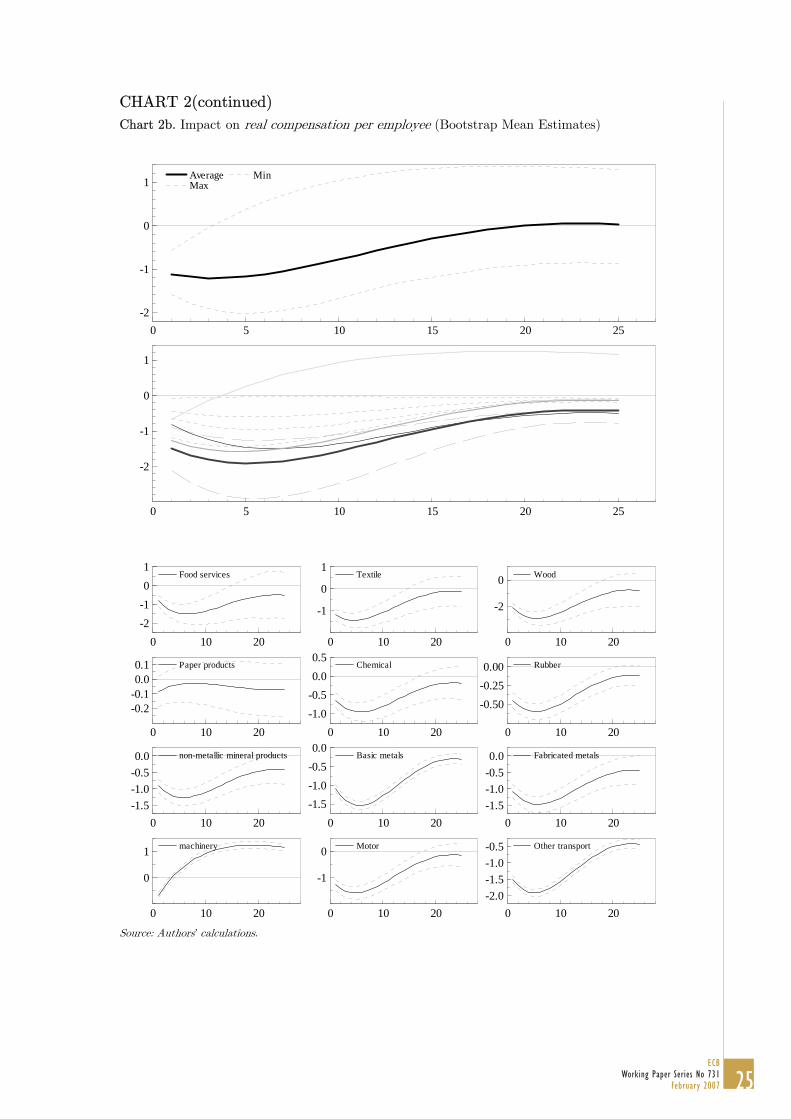
CHART 2(continued)
Chart 2b. Impact on real compensation per employee (Bootstrap Mean Estimates)
0 5 10 15 20 25-2
-1
0
1Average Max
Min
0 5 10 15 20 25
-2
-1
0
1
0 10 20-2-101
Food services
0 10 20
-1
0
1Textile
0 10 20
-2
0 Wood
0 10 20
-0.2-0.10.00.1 Paper products
0 10 20-1.0-0.50.00.5
Chemical
0 10 20
-0.50-0.250.00 Rubber
0 10 20-1.5-1.0-0.50.0 non-metallic mineral products
0 10 20-1.5-1.0-0.50.0
Basic metals
0 10 20-1.5-1.0-0.50.0 Fabricated metals
0 10 20
0
1 machinery
0 10 20
-1
0 Motor
0 10 20-2.0-1.5-1.0-0.5 Other transport
Source: Authors’ calculations.
25ECB
Working Paper Series No 731February 2007
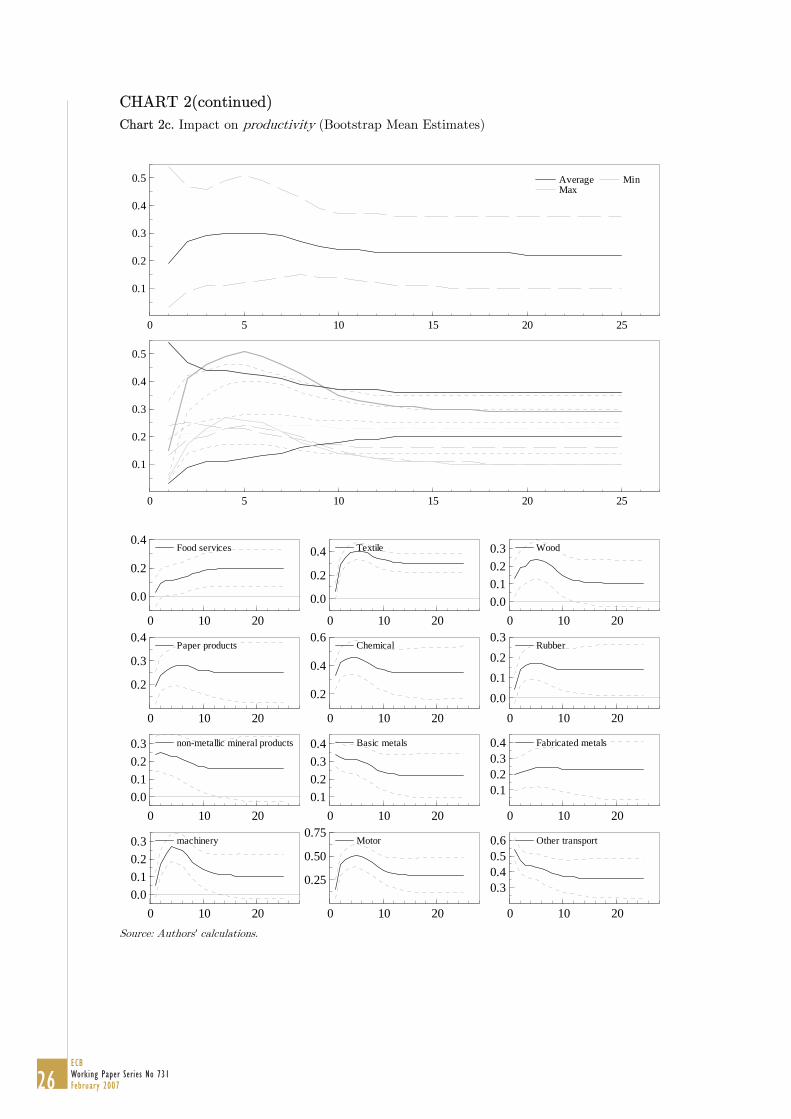
CHART 2(continued)
Chart 2c. Impact on productivity (Bootstrap Mean Estimates)
0 5 10 15 20 25
0.1
0.2
0.3
0.4
0.5 Average Max
Min
0 5 10 15 20 25
0.1
0.2
0.3
0.4
0.5
0 10 20
0.0
0.2
0.4Food services
0 10 20
0.0
0.2
0.4 Textile
0 10 200.00.10.20.3 Wood
0 10 20
0.2
0.3
0.4Paper products
0 10 20
0.2
0.4
0.6Chemical
0 10 200.00.10.20.3
Rubber
0 10 200.00.10.20.3 non-metallic mineral products
0 10 200.10.20.30.4 Basic metals
0 10 20
0.10.20.30.4 Fabricated metals
0 10 200.00.10.20.3 machinery
0 10 20
0.25
0.50
0.75Motor
0 10 20
0.30.40.50.6 Other transport
Source: Authors’ calculations.
26ECB Working Paper Series No 731 February 2007
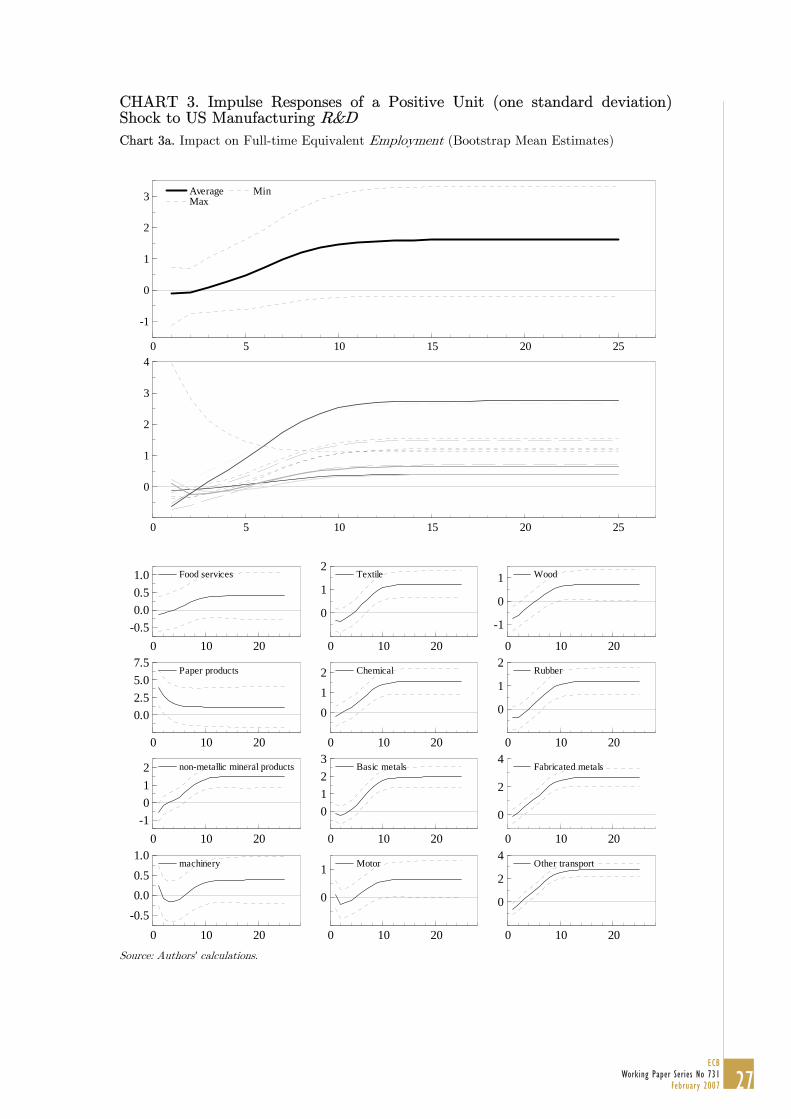
CHART 3. Impulse Responses of a Positive Unit (one standard deviation) Shock to US Manufacturing R&D
Chart 3a. Impact on Full-time Equivalent Employment (Bootstrap Mean Estimates)
0 5 10 15 20 25
-1
0
1
2
3 Average Max
Min
0 5 10 15 20 25
0
1
2
3
4
0 10 20-0.50.00.51.0 Food services
0 10 20
0
1
2Textile
0 10 20
-1
0
1 Wood
0 10 20
0.02.55.07.5
Paper products
0 10 20
012 Chemical
0 10 20
0
1
2Rubber
0 10 20-1012 non-metallic mineral products
0 10 20
0123
Basic metals
0 10 20
0
2
4Fabricated metals
0 10 20-0.50.00.51.0
machinery
0 10 20
0
1 Motor
0 10 20
0
2
4Other transport
Source: Authors’ calculations.
27ECB
Working Paper Series No 731February 2007
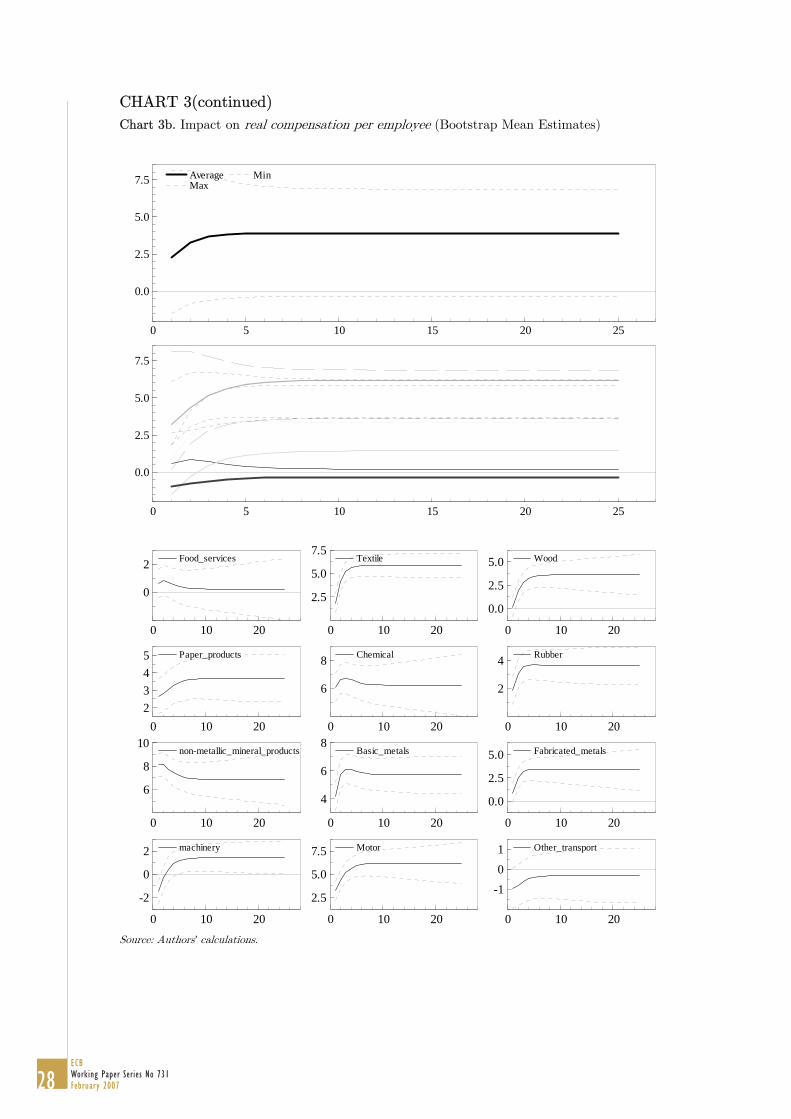
CHART 3(continued)
Chart 3b. Impact on real compensation per employee (Bootstrap Mean Estimates)
0 5 10 15 20 25
0.0
2.5
5.0
7.5 Average Max
Min
0 5 10 15 20 25
0.0
2.5
5.0
7.5
0 10 20
0
2 Food_services
0 10 20
2.5
5.0
7.5Textile
0 10 20
0.0
2.5
5.0 Wood
0 10 202345 Paper_products
0 10 20
6
8 Chemical
0 10 20
2
4 Rubber
0 10 20
6
8
10non-metallic_mineral_products
0 10 20
4
6
8Basic_metals
0 10 20
0.0
2.5
5.0 Fabricated_metals
0 10 20
-2
0
2 machinery
0 10 20
2.5
5.0
7.5 Motor
0 10 20
-101 Other_transport
Source: Authors’ calculations.
28ECB Working Paper Series No 731 February 2007
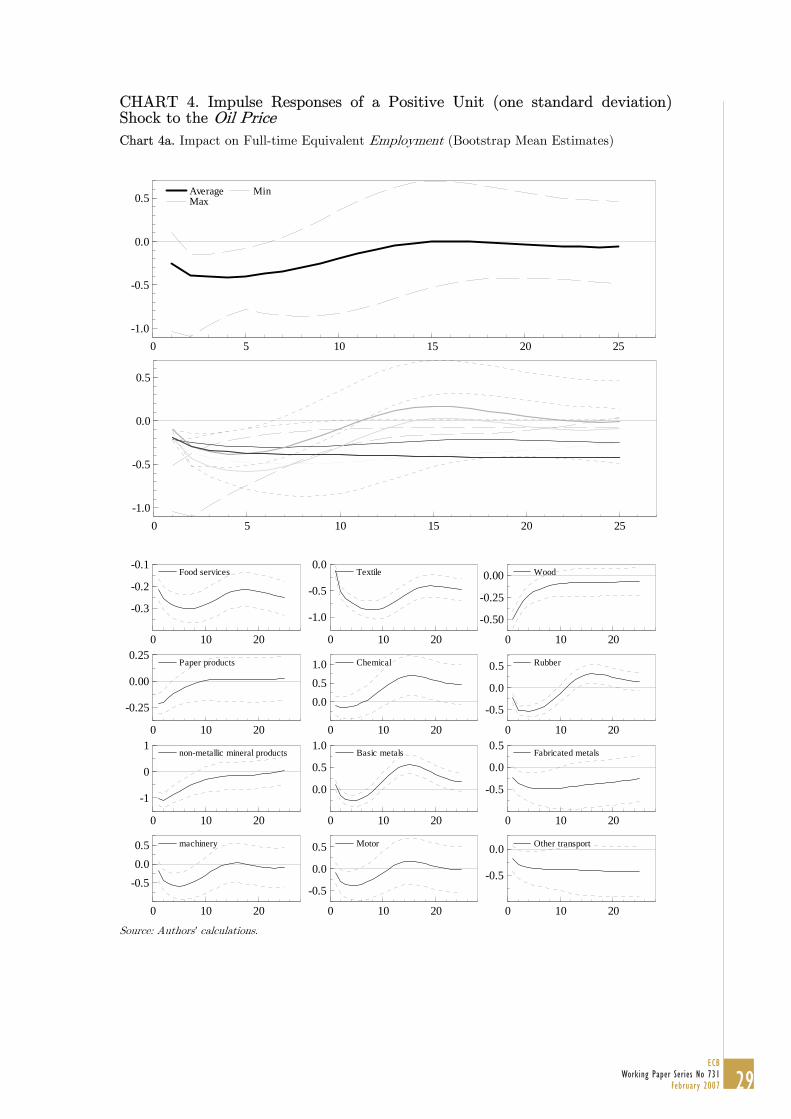
CHART 4. Impulse Responses of a Positive Unit (one standard deviation) Shock to the Oil Price
Chart 4a. Impact on Full-time Equivalent Employment (Bootstrap Mean Estimates)
0 5 10 15 20 25-1.0
-0.5
0.0
0.5 Average Max
Min
0 5 10 15 20 25-1.0
-0.5
0.0
0.5
0 10 20
-0.3
-0.2
-0.1Food services
0 10 20
-1.0
-0.5
0.0Textile
0 10 20
-0.50
-0.25
0.00 Wood
0 10 20
-0.25
0.00
0.25Paper products
0 10 20
0.00.51.0 Chemical
0 10 20
-0.5
0.0
0.5 Rubber
0 10 20
-1
0
1non-metallic mineral products
0 10 20
0.0
0.5
1.0Basic metals
0 10 20
-0.5
0.0
0.5Fabricated metals
0 10 20
-0.50.00.5 machinery
0 10 20
-0.5
0.0
0.5 Motor
0 10 20
-0.5
0.0 Other transport
Source: Authors’ calculations.
29ECB
Working Paper Series No 731February 2007
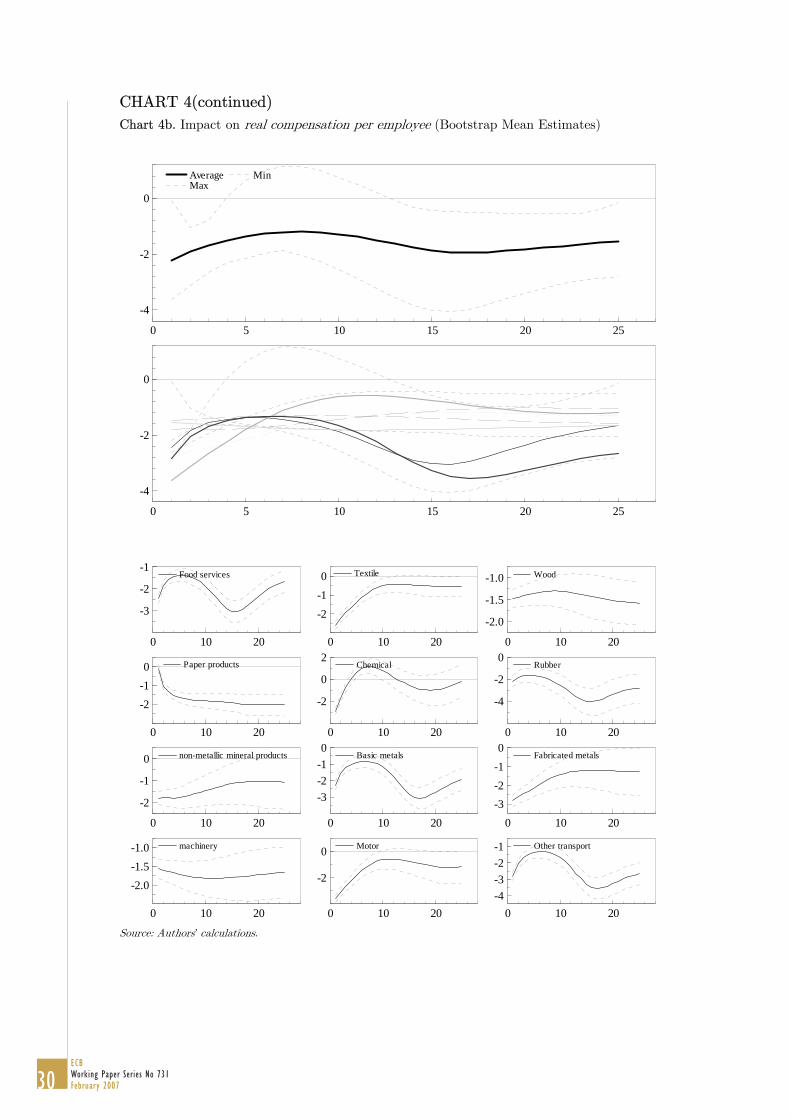
CHART 4(continued)
Chart 4b. Impact on real compensation per employee (Bootstrap Mean Estimates)
0 5 10 15 20 25
-4
-2
0
Average Max
Min
0 5 10 15 20 25
-4
-2
0
0 10 20
-3
-2
-1Food services
0 10 20
-2-10 Textile
0 10 20
-2.0
-1.5
-1.0 Wood
0 10 20
-2-10 Paper products
0 10 20
-2
0
2Chemical
0 10 20
-4
-2
0Rubber
0 10 20
-2
-1
0 non-metallic mineral products
0 10 20
-3-2-10
Basic metals
0 10 20-3-2-10
Fabricated metals
0 10 20
-2.0-1.5-1.0 machinery
0 10 20
-2
0 Motor
0 10 20-4-3-2-1 Other transport
Source: Authors’ calculations.
30ECB Working Paper Series No 731 February 2007
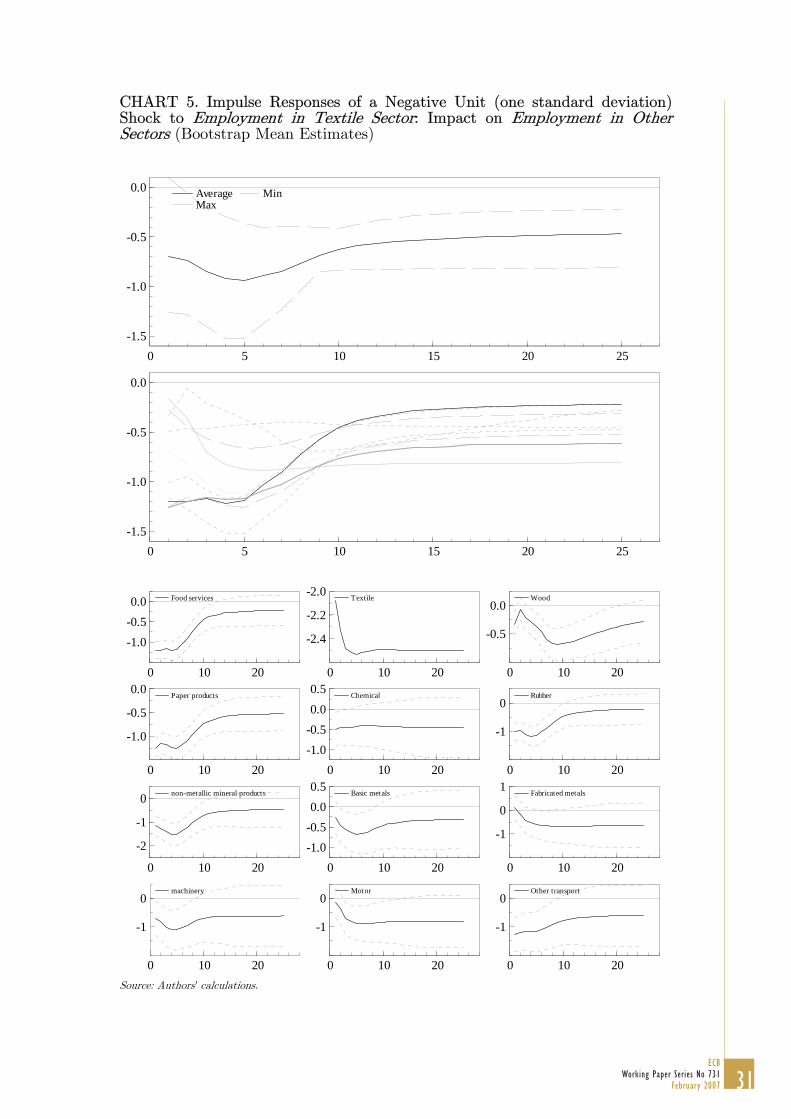
CHART 5. Impulse Responses of a Negative Unit (one standard deviation) Shock to Employment in Textile Sector: Impact on Employment in Other Sectors (Bootstrap Mean Estimates)
0 5 10 15 20 25-1.5
-1.0
-0.5
0.0 Average Max
Min
0 5 10 15 20 25-1.5
-1.0
-0.5
0.0
0 10 20
-1.0-0.50.0 Food services
0 10 20
-2.4
-2.2
-2.0 Textile
0 10 20
-0.5
0.0Wood
0 10 20
-1.0
-0.5
0.0 Paper products
0 10 20-1.0-0.50.00.5 Chemical
0 10 20
-1
0Rubber
0 10 20
-2
-1
0 non-metallic mineral products
0 10 20-1.0-0.50.00.5 Basic metals
0 10 20
-1
0
1 Fabricated metals
0 10 20
-1
0machinery
0 10 20
-1
0Motor
0 10 20
-1
0Other transport
Source: Authors’ calculations.
31ECB
Working Paper Series No 731February 2007
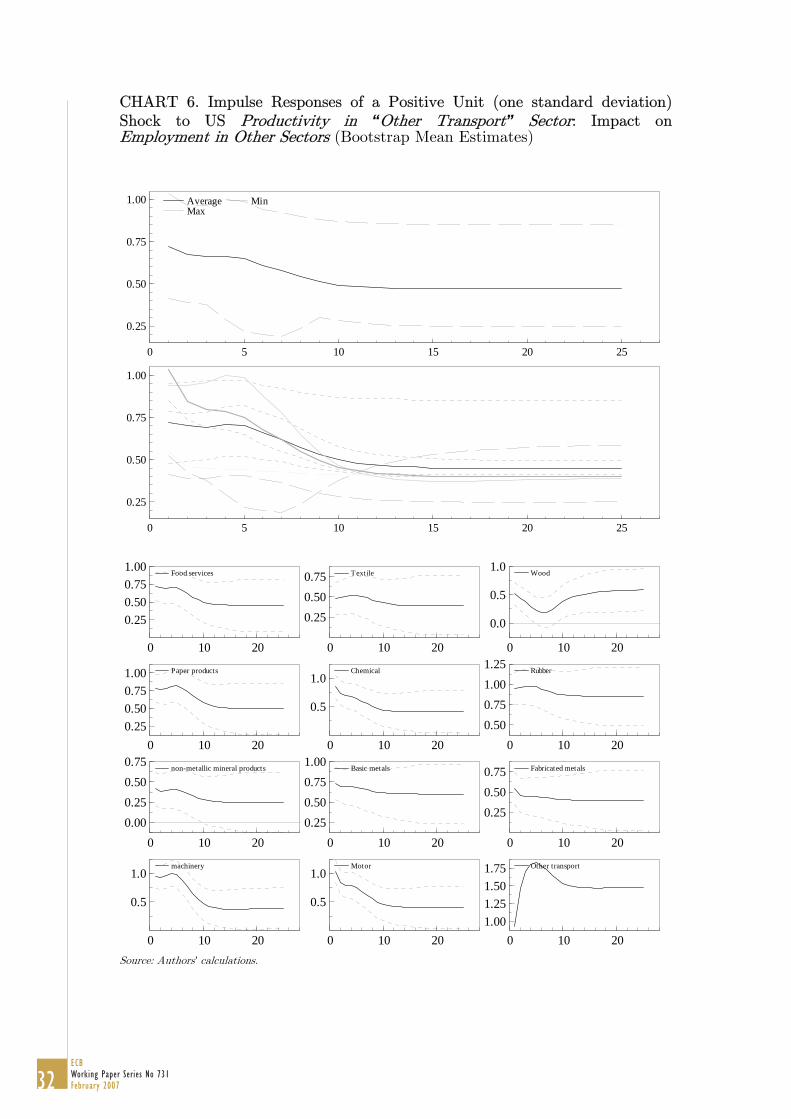
CHART 6. Impulse Responses of a Positive Unit (one standard deviation) Shock to US Productivity in “Other Transport” Sector: Impact on Employment in Other Sectors (Bootstrap Mean Estimates)
0 5 10 15 20 25
0.25
0.50
0.75
1.00 Average Max
Min
0 5 10 15 20 25
0.25
0.50
0.75
1.00
0 10 20
0.250.500.751.00 Food services
0 10 20
0.250.500.75 Textile
0 10 20
0.0
0.5
1.0 Wood
0 10 200.250.500.751.00 Paper products
0 10 20
0.5
1.0Chemical
0 10 200.500.751.001.25 Rubber
0 10 200.000.250.500.75 non-metallic mineral products
0 10 200.250.500.751.00 Basic metals
0 10 20
0.250.500.75 Fabricated metals
0 10 20
0.5
1.0machinery
0 10 20
0.5
1.0Motor
0 10 201.001.251.501.75 Other transport
Source: Authors’ calculations.
32ECB Working Paper Series No 731 February 2007
33ECB
Working Paper Series No 731February 2007
European Central Bank Working Paper Series
For a complete list of Working Papers published by the ECB, please visit the ECB’s website(http://www.ecb.int)
691 “The yield curve as a predictor and emerging economies” by A. Mehl, November 2006.
692 “Bayesian inference in cointegrated VAR models: with applications to the demand for euro area M3” by A. Warne, November 2006.
693 “Evaluating China’s integration in world trade with a gravity model based benchmark” by M. Bussière and B. Schnatz, November 2006.
694 “Optimal currency shares in international reserves: the impact of the euro and the prospects for the dollar” by E. Papaioannou, R. Portes and G. Siourounis, November 2006.
695 “Geography or skills: What explains Fed watchers’ forecast accuracy of US monetary policy?” by H. Berger, M. Ehrmann and M. Fratzscher, November 2006.
696 “What is global excess liquidity, and does it matter?” by R. Rüffer and L. Stracca, November 2006.
697 “How wages change: micro evidence from the International Wage Flexibility Project” by W. T. Dickens, L. Götte, E. L. Groshen, S. Holden, J. Messina, M. E. Schweitzer, J. Turunen, and M. E. Ward, November 2006.
698 “Optimal monetary policy rules with labor market frictions” by E. Faia, November 2006.
699 “The behaviour of producer prices: some evidence from the French PPI micro data” by E. Gautier, December 2006.
700 “Forecasting using a large number of predictors: Is Bayesian regression a valid alternative toprincipal components?” by C. De Mol, D. Giannone and L. Reichlin, December 2006.
701 “Is there a single frontier in a single European banking market?” by J. W. B. Bos and H. Schmiedel, December 2006.
702 “Comparing financial systems: a structural analysis” by S. Champonnois, December 2006.
703 “Comovements in volatility in the euro money market” by N. Cassola and C. Morana, December 2006.
704 “Are money and consumption additively separable in the euro area? A non-parametric approach” by B. E. Jones and L. Stracca, December 2006.
705 “What does a technology shock do? A VAR analysis with model-based sign restrictions” by L. Dedola and S. Neri, December 2006.
706 “What drives investors’ behaviour in different FX market segments? A VAR-based returndecomposition analysis” by O. Castrén, C. Osbat and M. Sydow, December 2006.
707 “Ramsey monetary policy with labour market frictions” by E. Faia, January 2007.
708 “Regional housing market spillovers in the US: lessons from regional divergences in a common monetary policy setting” by I. Vansteenkiste, January 2007.
709 “Quantifying and sustaining welfare gains from monetary commitment” by P. Levine, P. McAdam and J. Pearlman, January 2007.
34ECB Working Paper Series No 731 February 2007
710 “Pricing of settlement link services and mergers of central securities depositories” by J. Tapking, January 2007.
711 “What “hides” behind sovereign debt ratings?” by A. Afonso, P. Gomes and P. Rother, January 2007.
712 “Opening the black box: structural factor models with large cross-sections” by M. Forni, D. Giannone, M. Lippi and L. Reichlin, January 2007.
713 “Balance of payment crises in emerging markets: How early were the “early” warning signals?” by M. Bussière, January 2007.
714 “The dynamics of bank spreads and financial structure” by R. Gropp, C. Kok Sørensen and J.-D. Lichtenberger, January 2007.
715 “Emerging Asia’s growth and integration: How autonomous are business cycles?” by R. Rüffer, M. Sánchez and J.-G. Shen, January 2007.
716 “Adjusting to the euro” by G. Fagan and V. Gaspar, January 2007.
717 “Discretion rather than rules? When is discretionary policy-making better than the timeless perspective?” by S. Sauer, January 2007.
718 “Drift and breaks in labor productivity” by L. Benati, January 2007.
719 “US imbalances: the role of technology and policy” by R. Bems, L. Dedola and F. Smets, January 2007.
720 “Real price wage rigidities in a model with matching frictions” by K. Kuester, February 2007.
721 “Are survey-based inflation expectations in the euro area informative?” by R. Mestre, February 2007.
722 “Shocks and frictions in US business cycles: a Bayesian DSGE approach” by F. Smets and R. Wouters, February 2007.
723 “Asset allocation by penalized least squares” by S. Manganelli, February 2007.
724 “The transmission of emerging market shocks to global equity markets” by L. Cuadro Sáez, M. Fratzscher and C. Thimann, February 2007.
725 ”Inflation forecasts, monetary policy and unemployment dynamics: evidence from the US and the euro area”by C. Altavilla and M. Ciccarelli, February 2007.
726 “Using intraday data to gauge financial market responses to Fed and ECB monetary policy decisions” by M. Andersson, February 2007.
727 “Price setting in the euro area: some stylised facts from individual producer price data”, by P. Vermeulen, D. Dias, M. Dossche, E. Gautier, I. Hernando, R. Sabbatini and H. Stahl, February 2007.
728 “Price changes in finland: some evidence from micro cpi data”, by S. Kurri, February 2007.
729 “Fast micro and slow macro: can aggregation explain the persistence of inflation? ”, by F. Altissimo, B. Mojon and P. Zaffaroni, February 2007.
730 “What drives business cycles and international trade in emerging market economies?”, by Marcelo Sánchez , February 2007.
731 “International trade, technological shocks and spillovers in the labour market: A GVAR analysis of the US manufacturing sector”, by P. Hiebert and I. Vansteenkiste, February 2007.

ISSN 1561081-0
9 7 7 1 5 6 1 0 8 1 0 0 5