Embed Size (px)
Citation preview

International Trade and its Regional Impact
Dr. David J. Molina
University of North Texas

International Trade and its Regional Impact
Late House Speaker Tip O’Neill was known to say “All politics is local”
Well it is not difficult to make the argument that all international trade activity is local (and in particular exports and inflow of FDI)
Wheat Trade Embargo under President Cater Lockheed’s contracts with Saudi Arabia are very
important to Ft Worth, Texas
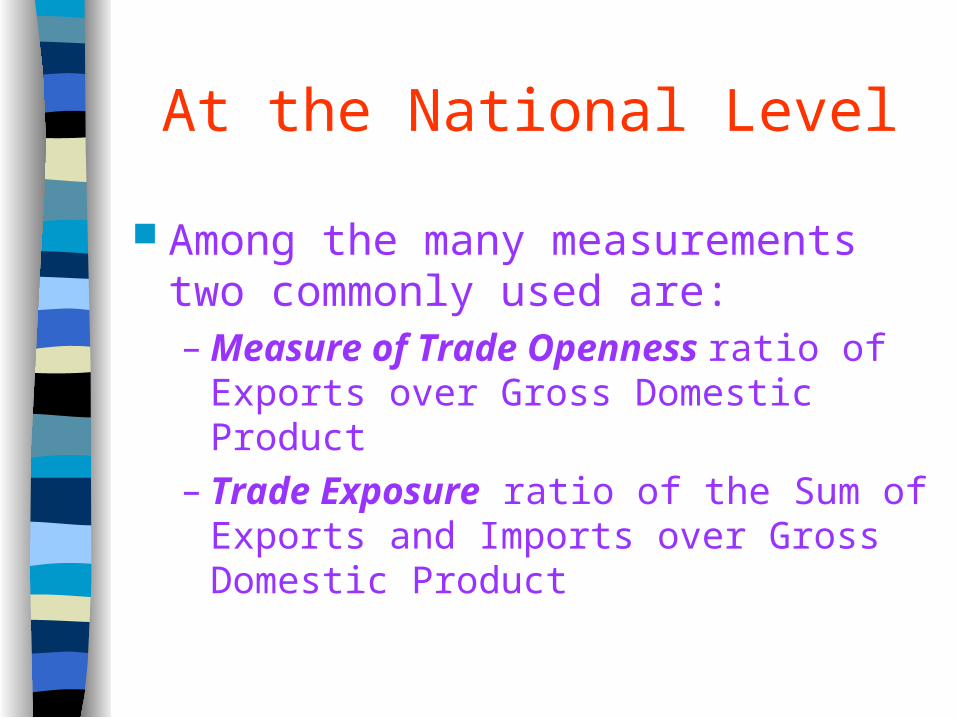
At the National Level
Among the many measurements two commonly used are:– Measure of Trade Openness ratio of
Exports over Gross Domestic Product– Trade Exposure ratio of the Sum of
Exports and Imports over Gross Domestic Product
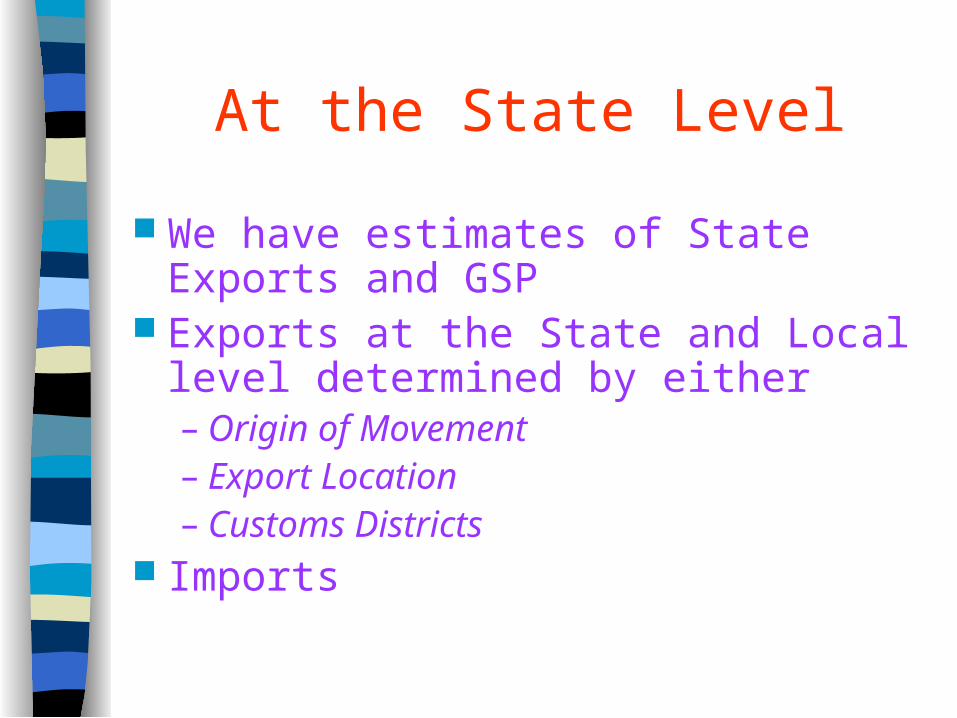
At the State Level
We have estimates of State Exports and GSP
Exports at the State and Local level determined by either– Origin of Movement– Export Location – Customs Districts
Imports

Measure of Trade Openness State
Ratio of Exports to GSP Export data from International Trade
Administration GSP – BEA Total Exports
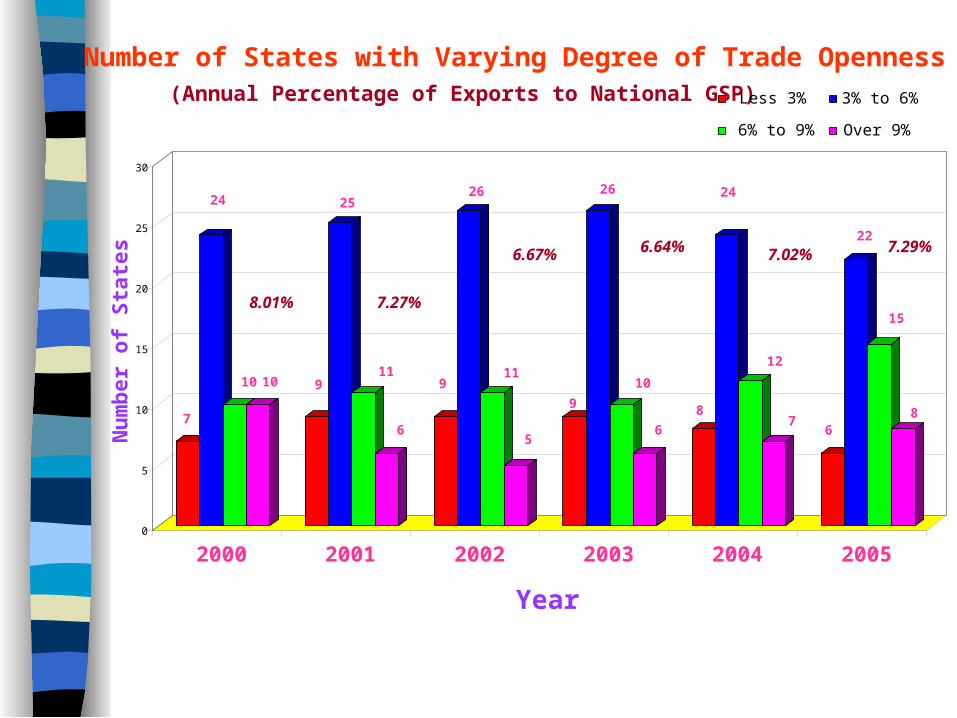
7
24
10 10 9
25
11
6
9
26
11
5
9
26
10
6
8
24
12
76
22
15
8
0
5
10
15
20
25
30
Nu
mb
er o
f S
tate
s
2000 2001 2002 2003 2004 2005
Year
Number of States with Varying Degree of Trade Openness
(Annual Percentage of Exports to National GSP) Less 3% 3% to 6%
6% to 9% Over 9%
8.01% 7.27%
6.67% 6.64% 7.02% 7.29%
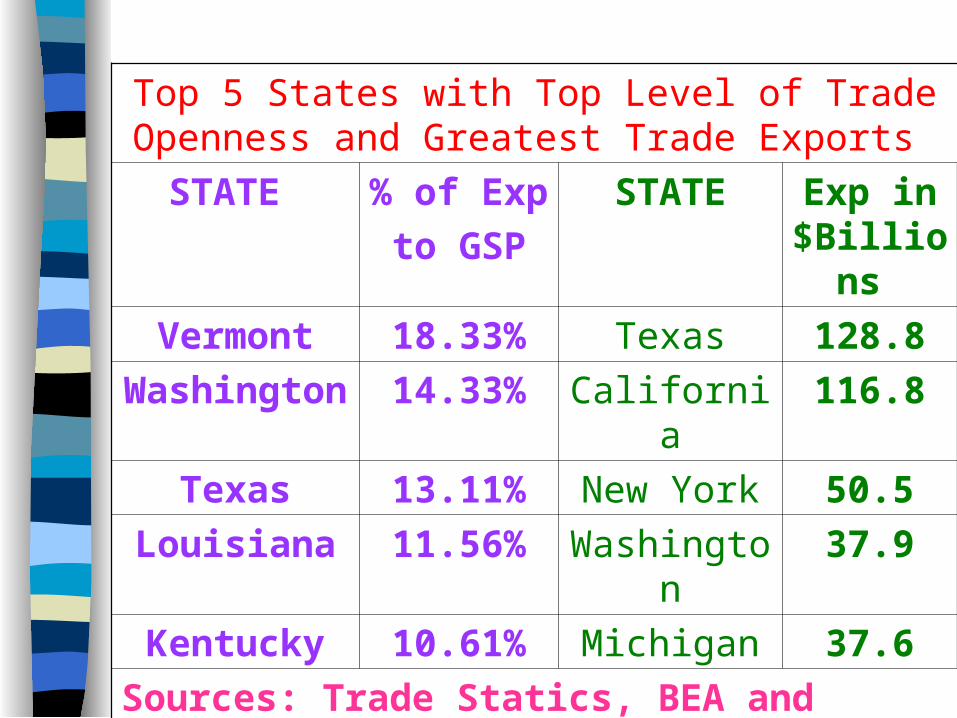
Top 5 States with Top Level of Trade Openness and Greatest Trade Exports
STATE % of Exp
to GSP
STATE Exp in $Billions
Vermont 18.33% Texas 128.8
Washington 14.33% California 116.8
Texas 13.11% New York 50.5
Louisiana 11.56% Washington 37.9
Kentucky 10.61% Michigan 37.6
Sources: Trade Statics, BEA and computations by author
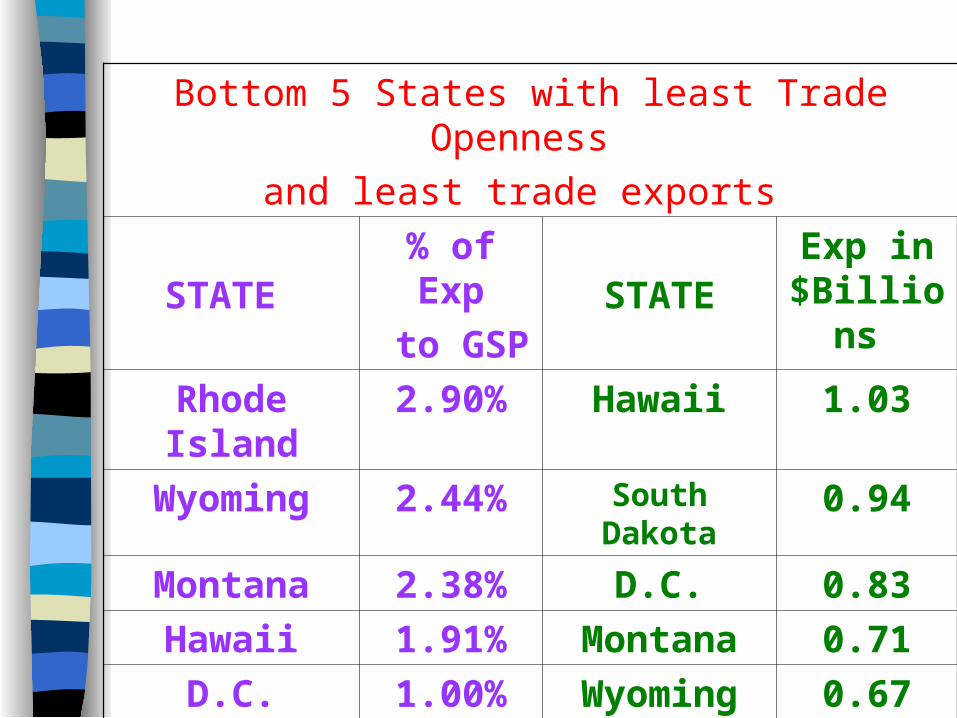
Bottom 5 States with least Trade Openness
and least trade exports
STATE % of Exp
to GSP STATE
Exp in $Billions
Rhode Island 2.90% Hawaii 1.03
Wyoming 2.44% South Dakota 0.94
Montana 2.38% D.C. 0.83
Hawaii 1.91% Montana 0.71
D.C. 1.00% Wyoming 0.67
Sources: Trade Statics, BEA and computations by author

New EnglandConnecticutMaineMassachusettsNew HampshireRhode IslandVermont
MideastDelawareDistrict of ColumbiaMarylandNew JerseyNew YorkPennsylvania
Geat LakesIllinoisIndianaMichiganOhioWisconsin
PlainsIowaKansasMinnesotaMissouriNebraskaNorth DakotaSouth Dakota
South EastAlabamaArkansasFloridaGeorgiaKentuckyLouisianaMississippiNorth CarolinaSouth CarolinaTennesseeVirginiaWest Virginia
South WestArizonaNew MexicoOklahomaTexas
Rocky MountainColoradoIdahoMontanaUtahWyoming
Far WestAlaskaCaliforniaHawaiiNevadaOregonWashington
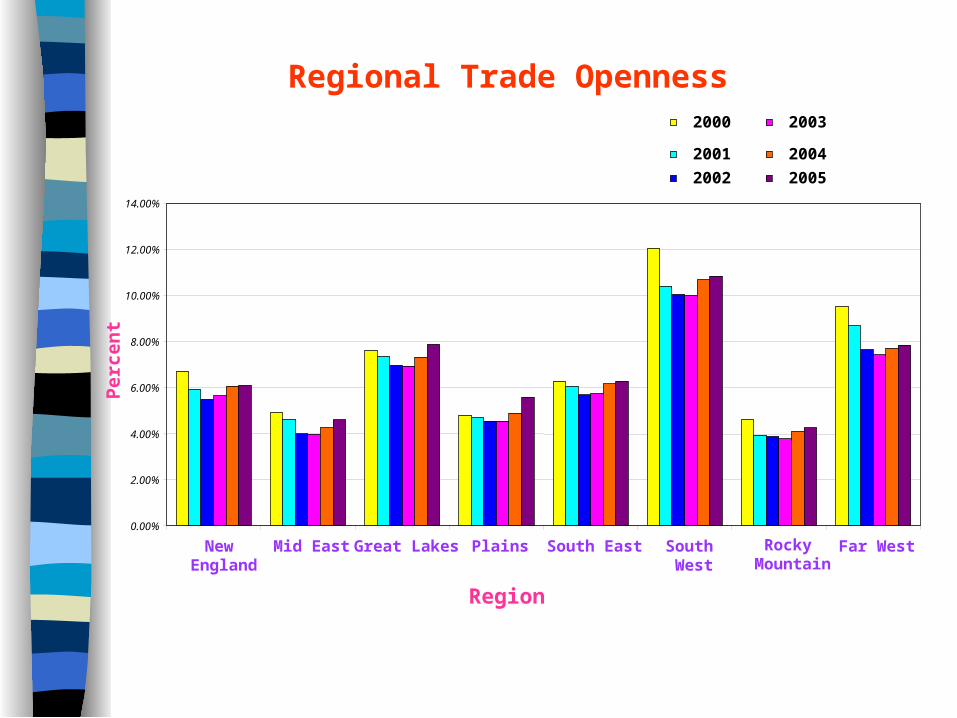
Regional Trade Openness
0.00%
2.00%
4.00%
6.00%
8.00%
10.00%
12.00%
14.00%
New England
Mid East Great Lakes Plains South East South West
Rocky Mountain
Far West
Region
Per
cen
t2000
2001
2002
2003
2004
2005

Trade Openness in the South West
0.00%
2.00%
4.00%
6.00%
8.00%
10.00%
12.00%
14.00%
16.00%
Arizona New Mexico Oklahoma Texas
State
Per
cen
t
2000
2001
2002
2003
2004
2005
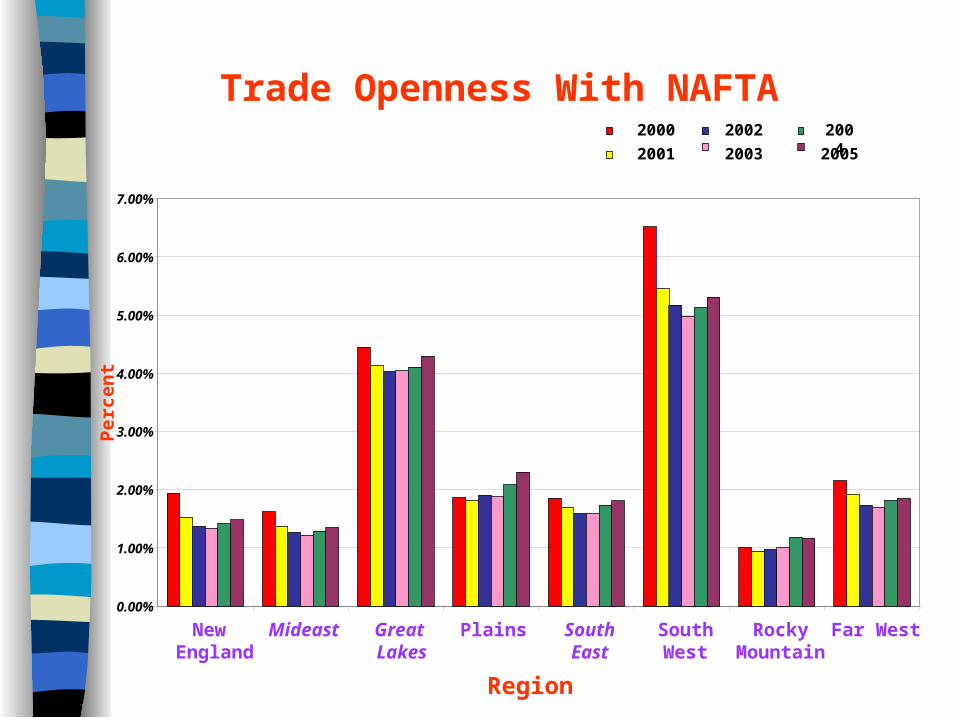
Trade Openness With NAFTA
0.00%
1.00%
2.00%
3.00%
4.00%
5.00%
6.00%
7.00%
New England
Mideast Great Lakes
Plains SouthEast
SouthWest
RockyMountain
Far West
Region
Per
cen
t2000
2001
2002
2003
20042005
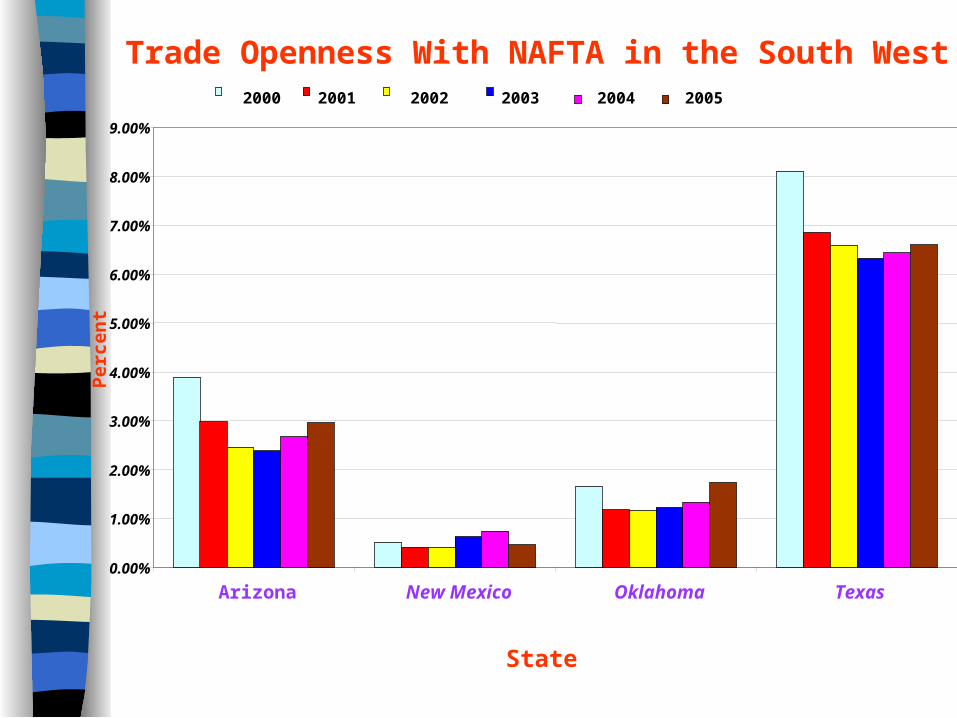
Trade Openness With NAFTA in the South West
0.00%
1.00%
2.00%
3.00%
4.00%
5.00%
6.00%
7.00%
8.00%
9.00%
Arizona New Mexico Oklahoma Texas
Per
cen
t2000 2001 2002 2003 2004 2005
State

New EnglandConnecticutMaineMassachusettsNew HampshireRhode IslandVermont
MidAtlanticNew JerseyNew YorkPennsylvania
Geat LakesIllinoisIndianaMichiganOhioWisconsin
PlainsIowaKansasMinnesotaMissouriNebraskaNorth DakotaSouth Dakota
South AtlanticDelawareDistrict of ColumbiaFloridaGeorgiaMarylandNorth CarolinaSouth CarolinaVirginiaWest Virginia
East South CentralAlabamaKentuckyMississippiTennessee

West South CentralArkansasLouisianaOklahoma
MountainColoradoIdahoMontanaNevadaUtahWyoming
PacificAlaskaHawaiiOregonWashington Border
ArizonaCaliforniaNew MexicoTexas
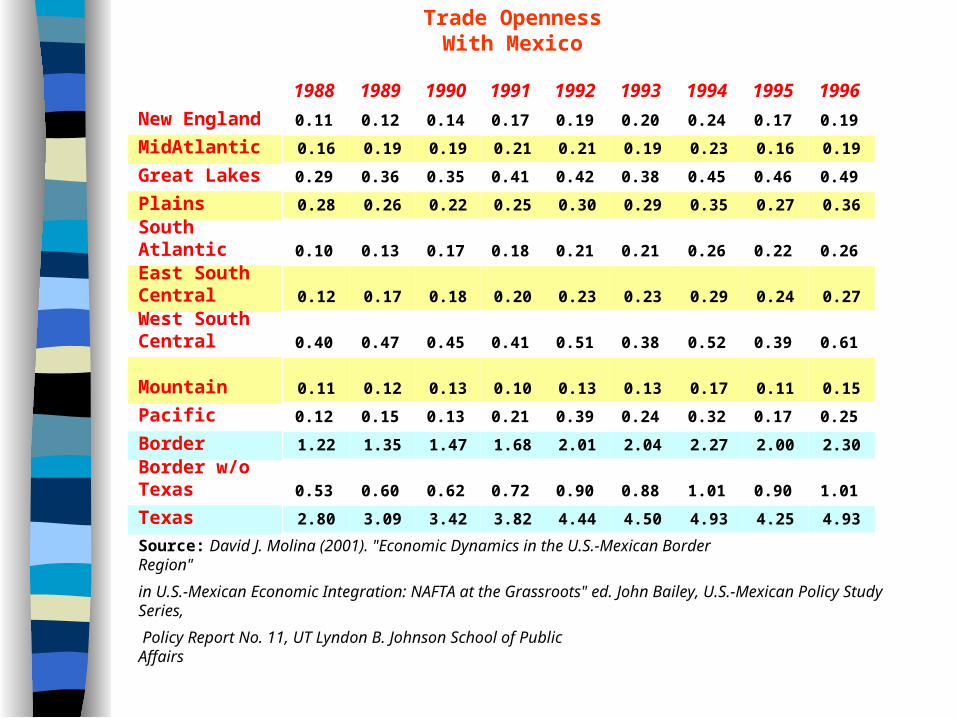
Trade Openness With Mexico
1988 1989 1990 1991 1992 1993 1994 1995 1996
New England 0.11 0.12 0.14 0.17 0.19 0.20 0.24 0.17 0.19
MidAtlantic 0.16 0.19 0.19 0.21 0.21 0.19 0.23 0.16 0.19
Great Lakes 0.29 0.36 0.35 0.41 0.42 0.38 0.45 0.46 0.49
Plains 0.28 0.26 0.22 0.25 0.30 0.29 0.35 0.27 0.36
South Atlantic 0.10 0.13 0.17 0.18 0.21 0.21 0.26 0.22 0.26
East South Central 0.12 0.17 0.18 0.20 0.23 0.23 0.29 0.24 0.27
West South Central 0.40 0.47 0.45 0.41 0.51 0.38 0.52 0.39 0.61
Mountain 0.11 0.12 0.13 0.10 0.13 0.13 0.17 0.11 0.15
Pacific 0.12 0.15 0.13 0.21 0.39 0.24 0.32 0.17 0.25
Border 1.22 1.35 1.47 1.68 2.01 2.04 2.27 2.00 2.30
Border w/o Texas 0.53 0.60 0.62 0.72 0.90 0.88 1.01 0.90 1.01
Texas 2.80 3.09 3.42 3.82 4.44 4.50 4.93 4.25 4.93
Source: David J. Molina (2001). "Economic Dynamics in the U.S.-Mexican Border Region"
in U.S.-Mexican Economic Integration: NAFTA at the Grassroots" ed. John Bailey, U.S.-Mexican Policy Study Series,
Policy Report No. 11, UT Lyndon B. Johnson School of Public Affairs
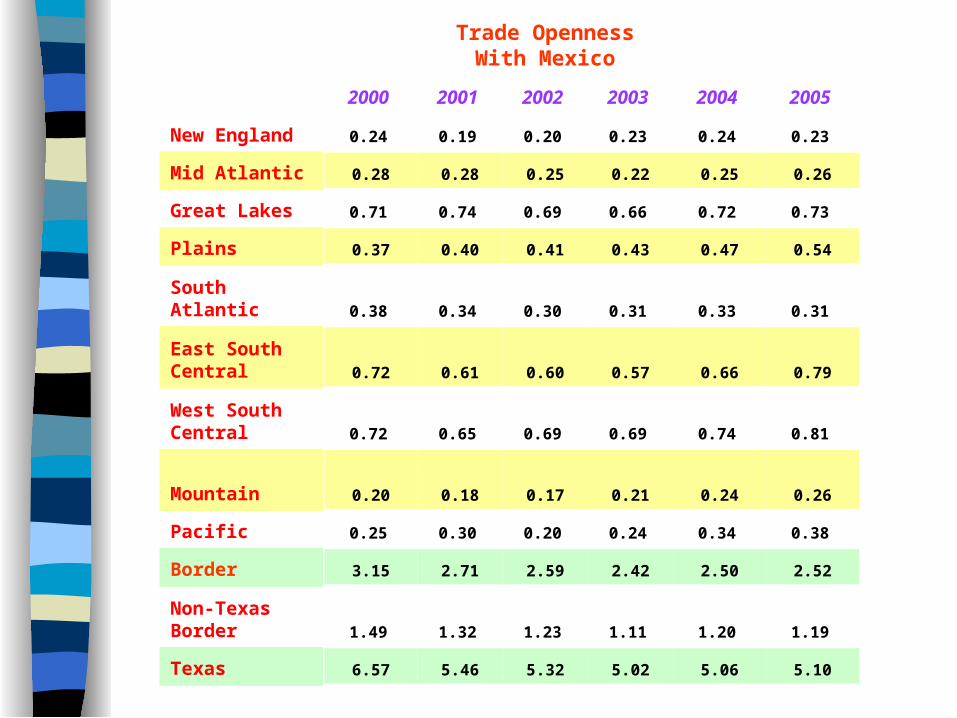
Trade Openness With Mexico
2000 2001 2002 2003 2004 2005
New England 0.24 0.19 0.20 0.23 0.24 0.23
Mid Atlantic 0.28 0.28 0.25 0.22 0.25 0.26
Great Lakes 0.71 0.74 0.69 0.66 0.72 0.73
Plains 0.37 0.40 0.41 0.43 0.47 0.54
South Atlantic 0.38 0.34 0.30 0.31 0.33 0.31
East South Central 0.72 0.61 0.60 0.57 0.66 0.79
West South Central 0.72 0.65 0.69 0.69 0.74 0.81
Mountain 0.20 0.18 0.17 0.21 0.24 0.26
Pacific 0.25 0.30 0.20 0.24 0.34 0.38
Border 3.15 2.71 2.59 2.42 2.50 2.52
Non-Texas Border 1.49 1.32 1.23 1.11 1.20 1.19
Texas 6.57 5.46 5.32 5.02 5.06 5.10

Trade Openness With Mexico
1988-1996 2000-2005Percentage
Change
New England 0.17 0.22 30.05
MidAtlantic 0.19 0.26 33.24
Geat Lakes 0.40 0.71 76.56
Plains 0.29 0.43 51.52
South Atlantic 0.19 0.33 71.01
East South Central 0.21 0.66 206.33
West South Central 0.46 0.71 55.25
Mountain 0.13 0.21 63.67
Pacific 0.22 0.29 29.93
Border 1.82 2.65 45.85
Border w/o Texas 0.80 1.26 57.78
Texas 4.02 5.42 34.86
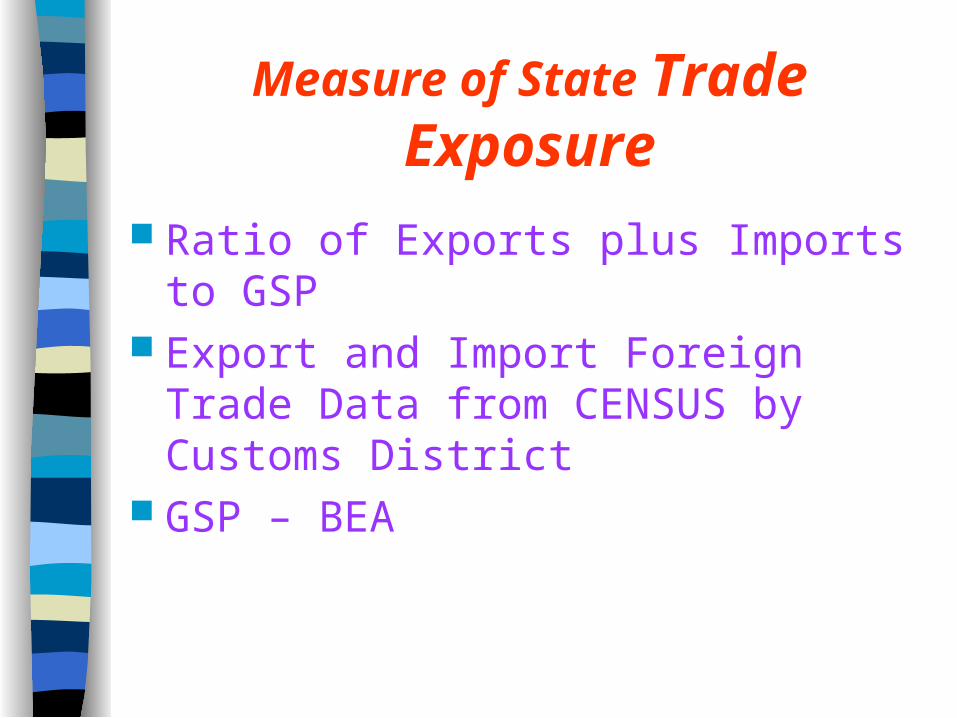
Measure of State Trade Exposure
Ratio of Exports plus Imports to GSP Export and Import Foreign Trade Data
from CENSUS by Customs District GSP – BEA
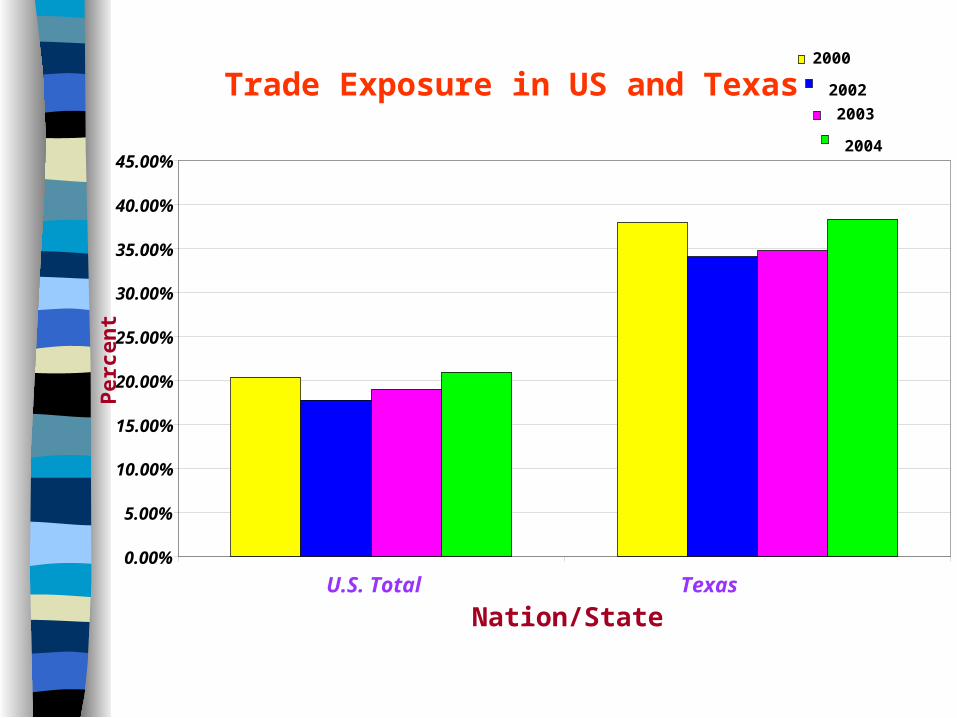
Trade Exposure in US and Texas
0.00%
5.00%
10.00%
15.00%
20.00%
25.00%
30.00%
35.00%
40.00%
45.00%
U.S. Total Texas
Nation/State
Per
cen
t
2000
2002
2003
2004

Issues with the construction of The measurement of Trade Openness at the
State Level National GSP is not equal to GDP
– DIFFERENCE:• EXCLUDES: compensation of Federal civilian and
military personnel stationed abroad and government consumption of fixed capital for military structures located abroad and for military equipment except domestically located office equipment
• GSP and GDP often have different revision schedules.
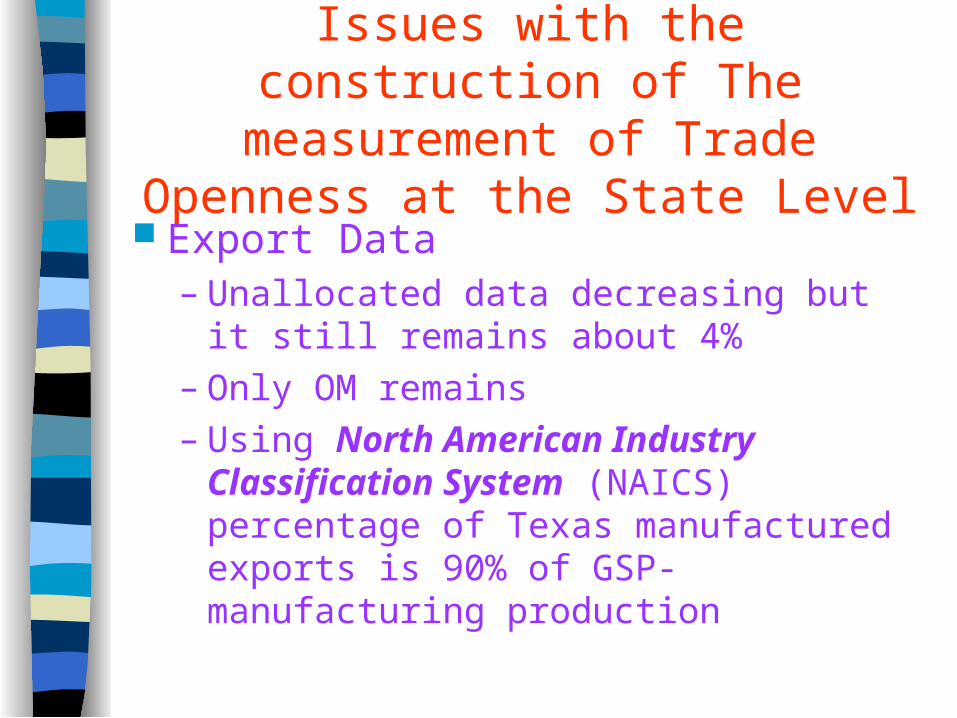
Issues with the construction of The measurement of Trade Openness at the
State Level Export Data
– Unallocated data decreasing but it still remains about 4%
– Only OM remains– Using North American Industry
Classification System (NAICS) percentage of Texas manufactured exports is 90% of GSP-manufacturing production