Embed Size (px)
Citation preview

International Technical Support Organization
LAN Problem Determination and MonitoringUsing DatagLANce
December 1995
SG24-4546-00


International Technical Support Organization
LAN Problem Determination and MonitoringUsing DatagLANce
December 1995
SG24-4546-00
IBML

Take Note!
Before using this information and the product it supports, be sure to read the general information under“Special Notices” on page xi.
First Edition (December 1995)
This edition applies to Version 1, Release 3 of DatagLANce Network Analyzer for Ethernet and Token-Ring, for usewith the Operating System/2 Version 2.0 or higher.
Order publications through your IBM representative or the IBM branch office serving your locality. Publicationsare not stocked at the address given below.
An ITSO Technical Bulletin Evaluation Form for reader′s feedback appears facing Chapter 1. If the form has beenremoved, comments may be addressed to:
IBM Corporation, International Technical Support OrganizationDept. HZ8 Building 657P.O. Box 12195Research Triangle Park, NC 27709-2195
When you send information to IBM, you grant IBM a non-exclusive right to use or distribute the information in anyway it believes appropriate without incurring any obligation to you.
Copyright International Business Machines Corporation 1995. All rights reserved.Note to U.S. Government Users — Documentation related to restricted rights — Use, duplication or disclosure issubject to restrictions set forth in GSA ADP Schedule Contract with IBM Corp.

Abstract
This document is a how-to guide for LAN monitoring and problem determination.It focuses on using DatagLANce Network Analyzer to perform these tasks. Italso provides information on how DatagLANce can integrate with other IBMsoftware products.
This document was written for those responsible for providing network support ina LAN environment. Some knowledge of protocols is assumed. Whenintegrating DatagLANce with another tool this document assumes youunderstand how to use that tool.
(144 pages)
Copyright IBM Corp. 1995 iii

iv DatagLANce - Problem Determination and Monitoring

Contents
Abstract . . . . . . . . . . . . . . . . . . . . . . . . . . . . . . . . . . . . . . . . . . i i i
Special Notices . . . . . . . . . . . . . . . . . . . . . . . . . . . . . . . . . . . . . . xi
Preface . . . . . . . . . . . . . . . . . . . . . . . . . . . . . . . . . . . . . . . . . xii iHow This Document Is Organized . . . . . . . . . . . . . . . . . . . . . . . . . xiiiRelated Publications . . . . . . . . . . . . . . . . . . . . . . . . . . . . . . . . . xii iInternational Technical Support Organization Publications . . . . . . . . . . . xivITSO Redbooks on the World Wide Web (WWW) . . . . . . . . . . . . . . . . . xivAcknowledgments . . . . . . . . . . . . . . . . . . . . . . . . . . . . . . . . . . . . xv
Chapter 1. Introduction . . . . . . . . . . . . . . . . . . . . . . . . . . . . . . . . . 11.1 The LAN Environment . . . . . . . . . . . . . . . . . . . . . . . . . . . . . . . 11.2 Introduction to DatagLANce . . . . . . . . . . . . . . . . . . . . . . . . . . . . 11.3 Other IBM Monitoring/Problem Determination Products . . . . . . . . . . . 2
Chapter 2. DatagLANce Planning and Installation . . . . . . . . . . . . . . . . . 52.1 Prerequisites . . . . . . . . . . . . . . . . . . . . . . . . . . . . . . . . . . . . 5
2.1.1 Network Adapters . . . . . . . . . . . . . . . . . . . . . . . . . . . . . . . 52.2 Installation . . . . . . . . . . . . . . . . . . . . . . . . . . . . . . . . . . . . . . 6
2.2.1 LAN Adapters . . . . . . . . . . . . . . . . . . . . . . . . . . . . . . . . . 62.3 Installation Examples . . . . . . . . . . . . . . . . . . . . . . . . . . . . . . . 8
2.3.1 MCA Type 8573 . . . . . . . . . . . . . . . . . . . . . . . . . . . . . . . . 82.3.2 ISA . . . . . . . . . . . . . . . . . . . . . . . . . . . . . . . . . . . . . . . . 92.3.3 ThinkPad . . . . . . . . . . . . . . . . . . . . . . . . . . . . . . . . . . . . 122.3.4 Installation Panels . . . . . . . . . . . . . . . . . . . . . . . . . . . . . . . 14
2.4 Navigating Through the Icons . . . . . . . . . . . . . . . . . . . . . . . . . . 192.4.1 The DatagLANce Icon . . . . . . . . . . . . . . . . . . . . . . . . . . . . 202.4.2 DatagLANce Information Icon . . . . . . . . . . . . . . . . . . . . . . . . 212.4.3 Token-Ring DatagLANce Icon . . . . . . . . . . . . . . . . . . . . . . . . 212.4.4 Ethernet DatagLANce Icon . . . . . . . . . . . . . . . . . . . . . . . . . . 44
Chapter 3. Problem Determination Using DatagLANce . . . . . . . . . . . . . . 453.1 Get an Overall View of the Situation . . . . . . . . . . . . . . . . . . . . . . 45
3.1.1 The Problem Description . . . . . . . . . . . . . . . . . . . . . . . . . . . 453.1.2 Start with a Broad Perspective, Narrow Your Search Later . . . . . . 453.1.3 Identify the Failing Component . . . . . . . . . . . . . . . . . . . . . . . 463.1.4 LAN Doctor Services . . . . . . . . . . . . . . . . . . . . . . . . . . . . . 46
3.2 DatagLANce and Problem Determination - Case Study . . . . . . . . . . . 473.2.1 Inconsistent Performance . . . . . . . . . . . . . . . . . . . . . . . . . . 473.2.2 SNA Session Disconnect . . . . . . . . . . . . . . . . . . . . . . . . . . . 603.2.3 LAN Server Logon . . . . . . . . . . . . . . . . . . . . . . . . . . . . . . 663.2.4 Locating Physical Layer Problems . . . . . . . . . . . . . . . . . . . . . 72
Chapter 4. Using DatagLANce to Monitor the LAN Environment . . . . . . . . 754.1 What is Monitoring? . . . . . . . . . . . . . . . . . . . . . . . . . . . . . . . . 754.2 Considerations for Monitoring . . . . . . . . . . . . . . . . . . . . . . . . . . 754.3 What′s in a Frame? . . . . . . . . . . . . . . . . . . . . . . . . . . . . . . . . . 76
4.3.1 Analyzing an Token-Ring Frame . . . . . . . . . . . . . . . . . . . . . . 774.3.2 Analyzing an Ethernet Frame . . . . . . . . . . . . . . . . . . . . . . . . 80
4.4 When Do You Monitor? . . . . . . . . . . . . . . . . . . . . . . . . . . . . . . 82
Copyright IBM Corp. 1995 v

4.4.1 Learning Names . . . . . . . . . . . . . . . . . . . . . . . . . . . . . . . . 834.4.2 Setting the Baseline . . . . . . . . . . . . . . . . . . . . . . . . . . . . . 854.4.3 Reporting your Findings . . . . . . . . . . . . . . . . . . . . . . . . . . . 874.4.4 Monitoring for Modelling . . . . . . . . . . . . . . . . . . . . . . . . . . . 884.4.5 Monitoring to Ensure Service Levels . . . . . . . . . . . . . . . . . . . 944.4.6 Monitoring for Change and Problem Management . . . . . . . . . . . 96
Chapter 5. Turning DatagLANce Data into Information . . . . . . . . . . . . . . 975.1 Using DB2 for OS/2 (DB2/2) . . . . . . . . . . . . . . . . . . . . . . . . . . . . 97
Chapter 6. DatagLANce Positioning and Other Network ManagementProducts . . . . . . . . . . . . . . . . . . . . . . . . . . . . . . . . . . . . . . . . 105
6.1 LAN Network Manager for OS/2 . . . . . . . . . . . . . . . . . . . . . . . . 1056.1.1 System Management . . . . . . . . . . . . . . . . . . . . . . . . . . . . 1056.1.2 Configuration Table . . . . . . . . . . . . . . . . . . . . . . . . . . . . . 1056.1.3 Alert Filtering . . . . . . . . . . . . . . . . . . . . . . . . . . . . . . . . 1056.1.4 High Availability . . . . . . . . . . . . . . . . . . . . . . . . . . . . . . . 1056.1.5 NetView Support . . . . . . . . . . . . . . . . . . . . . . . . . . . . . . . 1066.1.6 Access Control . . . . . . . . . . . . . . . . . . . . . . . . . . . . . . . . 106
6.2 NetView for AIX . . . . . . . . . . . . . . . . . . . . . . . . . . . . . . . . . . 1066.3 DatagLANce . . . . . . . . . . . . . . . . . . . . . . . . . . . . . . . . . . . . 1076.4 Integration of DatagLANce with NetView for AIX . . . . . . . . . . . . . . 107
6.4.1 Sending Alerts from DatagLANce . . . . . . . . . . . . . . . . . . . . 1086.4.2 Loading the DatagLANce MIB to Use with NetView for AIX . . . . . 111
6.5 Remote Network Monitor Using the Command Line Interface . . . . . . 1146.5.1 Command Syntax of DatagLANce Utilities . . . . . . . . . . . . . . . 1146.5.2 Example Scenario: Collecting Statistic Files . . . . . . . . . . . . . . 115
Appendix A. Reports Produced by DatagLANce Protocol Matrix . . . . . . . 123
Appendix B. MIB Definition File . . . . . . . . . . . . . . . . . . . . . . . . . . 125
Appendix C. SAP Reference Table . . . . . . . . . . . . . . . . . . . . . . . . . 131
Appendix D. Print Report Options . . . . . . . . . . . . . . . . . . . . . . . . . 133
Appendix E. DatagLANce .CMD File for Producing Daily Analysis Reports . 135
List of Abbreviations . . . . . . . . . . . . . . . . . . . . . . . . . . . . . . . . . 137
Index . . . . . . . . . . . . . . . . . . . . . . . . . . . . . . . . . . . . . . . . . . . 139
vi DatagLANce - Problem Determination and Monitoring

Figures
1. ThinkPad CONFIG.SYS File Example Using DatagLANce . . . . . . . . . 12 2. ThinkPad PROTOCOL.INI Entry Example Using DatagLANce . . . . . . . 12 3. ThinkPad CONFIG.SYS Entry Example for Ethernet II . . . . . . . . . . . . 13 4. DatagLANce Installation - Media Selection . . . . . . . . . . . . . . . . . . 14 5. DatagLANce Installation - Software Option . . . . . . . . . . . . . . . . . . 15 6. DatagLANce Installation - Token-Ring Configuration Options . . . . . . . 16 7. DatagLANce Installation - Timestamp Option . . . . . . . . . . . . . . . . 17 8. DatagLANce Installation - Buffer Size . . . . . . . . . . . . . . . . . . . . . 18 9. DatagLANce Installation - Adapter Definition . . . . . . . . . . . . . . . . 1910. DatagLANce Icon View . . . . . . . . . . . . . . . . . . . . . . . . . . . . . . 2011. Token-Ring DatagLANce Icon View . . . . . . . . . . . . . . . . . . . . . . 2112. Token-Ring DatagLANce Network Analyzer Menu Bar . . . . . . . . . . . 2213. DatagLANce Token-Ring Network Analyzer: Network Statistics . . . . . 2214. Token-Ring Frame Summary . . . . . . . . . . . . . . . . . . . . . . . . . . 2315. Edit Symbolic Names Panel . . . . . . . . . . . . . . . . . . . . . . . . . . . 2516. List of Address Level and Symbolic Names . . . . . . . . . . . . . . . . . 2517. Frame Summary Showing Symbolic Names . . . . . . . . . . . . . . . . . 2618. Setting Up an Address Pair Filter . . . . . . . . . . . . . . . . . . . . . . . 2719. Frame Summary Filtered Addresses . . . . . . . . . . . . . . . . . . . . . 2720. Multiple Event Detectors . . . . . . . . . . . . . . . . . . . . . . . . . . . . . 2821. Frame Detail and Hexdump . . . . . . . . . . . . . . . . . . . . . . . . . . . 2922. Monitor Ring Map . . . . . . . . . . . . . . . . . . . . . . . . . . . . . . . . . 3123. Source Routing Type Distribution . . . . . . . . . . . . . . . . . . . . . . . 3224. Frame Size Distribution . . . . . . . . . . . . . . . . . . . . . . . . . . . . . 3325. SAP Distribution . . . . . . . . . . . . . . . . . . . . . . . . . . . . . . . . . . 3426. Distribution of Ethertypes . . . . . . . . . . . . . . . . . . . . . . . . . . . . 3527. TCP/IP Frame Distribution . . . . . . . . . . . . . . . . . . . . . . . . . . . . 3628. Hop Count Distribution . . . . . . . . . . . . . . . . . . . . . . . . . . . . . . 3729. Source-Routed Traffic Analysis . . . . . . . . . . . . . . . . . . . . . . . . . 3830. Protocol Traffic Analysis . . . . . . . . . . . . . . . . . . . . . . . . . . . . . 3931. Soft Error Traffic Analysis . . . . . . . . . . . . . . . . . . . . . . . . . . . . 4032. Network Station Traffic Analysis . . . . . . . . . . . . . . . . . . . . . . . . 4133. DLC Station Traffic Analysis Window . . . . . . . . . . . . . . . . . . . . . 4234. Protocol Matrix Window . . . . . . . . . . . . . . . . . . . . . . . . . . . . . 4335. DLC Traffic Matrix Window . . . . . . . . . . . . . . . . . . . . . . . . . . . 4436. Network Layout Oil Company . . . . . . . . . . . . . . . . . . . . . . . . . . 4737. Network Statistics By Playing Back a Capture File . . . . . . . . . . . . . 4838. Network Statistics on the Remote Ethernet . . . . . . . . . . . . . . . . . . 4939. Network Errors on Remote Ethernet . . . . . . . . . . . . . . . . . . . . . . 5040. Frame Summary at Backbone Ethernet . . . . . . . . . . . . . . . . . . . . 5141. User Preferences . . . . . . . . . . . . . . . . . . . . . . . . . . . . . . . . . 5242. Frame Summary with Symbolic Names . . . . . . . . . . . . . . . . . . . . 5343. Defining Event Detectors . . . . . . . . . . . . . . . . . . . . . . . . . . . . . 5444. Search on DLC Address Pairs . . . . . . . . . . . . . . . . . . . . . . . . . 5545. Some Formats and Protocols That Can Be Filtered Out . . . . . . . . . . 5646. DLC Address Pairs . . . . . . . . . . . . . . . . . . . . . . . . . . . . . . . . 5747. Combining Event Detectors . . . . . . . . . . . . . . . . . . . . . . . . . . . 5848. Filtered Frame Summary . . . . . . . . . . . . . . . . . . . . . . . . . . . . 5949. SNA Session Disconnect . . . . . . . . . . . . . . . . . . . . . . . . . . . . . 6050. Network Statistics on Segment 60 . . . . . . . . . . . . . . . . . . . . . . . 6151. Network Errors on Segment 60 . . . . . . . . . . . . . . . . . . . . . . . . . 62
Copyright IBM Corp. 1995 vii

52. Filter for MAC Protocols . . . . . . . . . . . . . . . . . . . . . . . . . . . . . 6353. Frame Summary Segment 60 . . . . . . . . . . . . . . . . . . . . . . . . . . 6454. Frame Summary Segment 62 . . . . . . . . . . . . . . . . . . . . . . . . . . 6555. Session Setup Between Domain Controller and Client . . . . . . . . . . . 6656. End of Successful Logon . . . . . . . . . . . . . . . . . . . . . . . . . . . . . 6757. Sliding Search for Frames Containing NetBIOS Name CAY02809 . . . . 6858. Identifying the Backup Domain Controller . . . . . . . . . . . . . . . . . . 6959. Logon Process Backup Domain Controller . . . . . . . . . . . . . . . . . . 6960. Find Text Window for Transact2 Statement . . . . . . . . . . . . . . . . . . 7061. Logon Process Backup Domain . . . . . . . . . . . . . . . . . . . . . . . . 7162. Event Detector for Line Errors . . . . . . . . . . . . . . . . . . . . . . . . . 7263. Event Detector for Frames Sent to the Ring Error Monitor . . . . . . . . 7364. Logon Process Backup . . . . . . . . . . . . . . . . . . . . . . . . . . . . . . 7465. Sample Data Link Control Header . . . . . . . . . . . . . . . . . . . . . . . 7666. Sample Frame Check Sequence . . . . . . . . . . . . . . . . . . . . . . . . 7667. Sample Frame Status from a Frame Before It Reaches Its Destination . 7768. Sample Frame Status from a Frame After It Reaches Its Destination . . 7769. Sample Routing Information Field and Logical Link Control Header . . . 7870. Sample NetBIOS and SMB from a Token-Ring Environment . . . . . . . 7971. Sample SNA Frame from a Token-Ring Environment . . . . . . . . . . . . 8072. Sample Frame from an Ethernet Environment . . . . . . . . . . . . . . . 8273. Token-Ring DatagLANce Network Analyzer, Configuration: ipname
Window . . . . . . . . . . . . . . . . . . . . . . . . . . . . . . . . . . . . . . . 8374. Token-Ring Frame Summary: ipnames.dgc Using Resolved Symbolic
Names . . . . . . . . . . . . . . . . . . . . . . . . . . . . . . . . . . . . . . . 8475. Edit Symbolic Names Window . . . . . . . . . . . . . . . . . . . . . . . . . 8576. History Statistics Options from Protocol Matrix . . . . . . . . . . . . . . . 8677. Traffic Analysis Options from Protocol Matrix . . . . . . . . . . . . . . . . 8778. Print Window from Traffic Statistics - Protocol Matrix Analysis Window 8879. Print Report Window from Token-Ring DatagLANce Network Analyzer,
Configuration: promatrx . . . . . . . . . . . . . . . . . . . . . . . . . . . . . 8880. Traffic Analysis Options Window . . . . . . . . . . . . . . . . . . . . . . . . 8981. Token-Ring Adapter Options Window . . . . . . . . . . . . . . . . . . . . . 9182. Traffic Statistics - Protocol Matrix Analysis . . . . . . . . . . . . . . . . . . 9383. Alarm Options . . . . . . . . . . . . . . . . . . . . . . . . . . . . . . . . . . . 9484. Sample CMD File to Import a .CSV File from DatagLANce in DB2 for
OS/2 . . . . . . . . . . . . . . . . . . . . . . . . . . . . . . . . . . . . . . . . . 9885. Sample Query Built with Query Manager . . . . . . . . . . . . . . . . . . 10186. Sample Form From Query Manager . . . . . . . . . . . . . . . . . . . . . 10187. Sample Report from Query Manager . . . . . . . . . . . . . . . . . . . . 10288. Sample Query with a Second Table and Column Added . . . . . . . . . 10289. Sample Report from Query Manager . . . . . . . . . . . . . . . . . . . . 10390. Defining an Alert for the Function of Ring Utilization . . . . . . . . . . . 10991. Alarm Log Screen . . . . . . . . . . . . . . . . . . . . . . . . . . . . . . . 10992. Configuring an IP Address . . . . . . . . . . . . . . . . . . . . . . . . . . 11093. Load Window from NetView for AIX . . . . . . . . . . . . . . . . . . . . . 11194. Add Trap Window from NetView for AIX . . . . . . . . . . . . . . . . . . 11295. Alert Pop-Up on NetView for AIX Screen . . . . . . . . . . . . . . . . . . 11396. Enabling DatagLANce for Traffic Analysis . . . . . . . . . . . . . . . . . 11697. Configuring TCP/IP Autostart Option . . . . . . . . . . . . . . . . . . . . 11798. Configuring Security for Telnet and FTP . . . . . . . . . . . . . . . . . . 11799. Shell to Collect DatagLANce files . . . . . . . . . . . . . . . . . . . . . . 119100. Cron Entry for DatagLANce . . . . . . . . . . . . . . . . . . . . . . . . . . 119101. DatagLANce Report as Copied to the RS/6000 . . . . . . . . . . . . . . 120
viii DatagLANce - Problem Determination and Monitoring

Tables
1. MCA Type 8573 Configuration . . . . . . . . . . . . . . . . . . . . . . . . . 8 2. Address Formats . . . . . . . . . . . . . . . . . . . . . . . . . . . . . . . . . 24 3. SAP Table . . . . . . . . . . . . . . . . . . . . . . . . . . . . . . . . . . . . 131
Copyright IBM Corp. 1995 ix

x DatagLANce - Problem Determination and Monitoring

Special Notices
This publication is intended to help people in a LAN support role install and useDatagLANce for LAN monitoring and problem determination. The information inthis publication is not intended as the specification of any programminginterfaces that are provided by DatagLANce Network Analyzer and NetView forAIX. See the PUBLICATIONS section of the IBM Programming Announcement forDatagLANce Network Analyzer and NetView for AIX for more information aboutwhat publications are considered to be product documentation.
References in this publication to IBM products, programs or services do notimply that IBM intends to make these available in all countries in which IBMoperates. Any reference to an IBM product, program, or service is not intendedto state or imply that only IBM′s product, program, or service may be used. Anyfunctionally equivalent program that does not infringe any of IBM′s intellectualproperty rights may be used instead of the IBM product, program or service.
Information in this book was developed in conjunction with use of the equipmentspecified, and is limited in application to those specific hardware and softwareproducts and levels.
IBM may have patents or pending patent applications covering subject matter inthis document. The furnishing of this document does not give you any license tothese patents. You can send license inquiries, in writing, to the IBM Director ofLicensing, IBM Corporation, 500 Columbus Avenue, Thornwood, NY 10594 USA.
The information contained in this document has not been submitted to anyformal IBM test and is distributed AS IS. The information about non-IBM(VENDOR) products in this manual has been supplied by the vendor and IBMassumes no responsibility for its accuracy or completeness. The use of thisinformation or the implementation of any of these techniques is a customerresponsibility and depends on the customer′s ability to evaluate and integratethem into the customer′s operational environment. While each item may havebeen reviewed by IBM for accuracy in a specific situation, there is no guaranteethat the same or similar results will be obtained elsewhere. Customersattempting to adapt these techniques to their own environments do so at theirown risk.
Reference to PTF numbers that have not been released through the normaldistribution process does not imply general availability. The purpose ofincluding these reference numbers is to alert IBM customers to specificinformation relative to the implementation of the PTF when it becomes availableto each customer according to the normal IBM PTF distribution process.
The following terms are trademarks of the International Business MachinesCorporation in the United States and/or other countries:
The following terms are trademarks of other companies:
AIX AS/400DatagLANce DB2/2IBM Micro ChannelNetView Operating System/2Personal System/2 PS/2ThinkPad
Copyright IBM Corp. 1995 xi

Windows is a trademark of Microsoft Corporation.
PC Direct is a trademark of Ziff Communications Company and isused by IBM Corporation under license.
UNIX is a registered trademark in the United States and othercountries licensed exclusively through X/Open Company Limited.
C-bus is a trademark of Corollary, Inc.
Other trademarks are trademarks of their respective companies.
1-2-3, Lotus, Freelance, FreelanceGraphics
Lotus Development Corporation
IPX Novell, IncorporatedLANalyzer Novell, IncorporatedLotus 1-2-3 Lotus Development CorporationNetWare Novell, IncorporatedNovell Novell, IncorporatedPCMCIA Personal Computer Memory Card
International AssociationSniffer Network General CorporationSniffer Network Analyzer Network General CorporationStacker Stac Electronics486 Intel Corporation
xii DatagLANce - Problem Determination and Monitoring
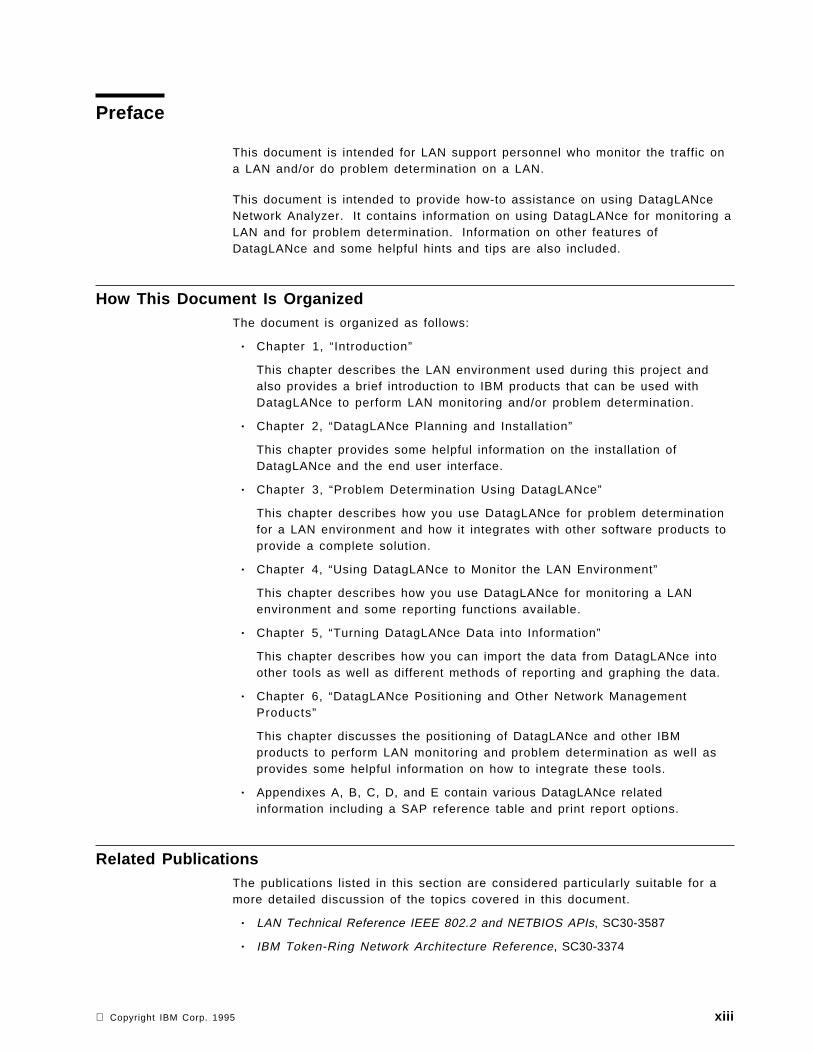
Preface
This document is intended for LAN support personnel who monitor the traffic ona LAN and/or do problem determination on a LAN.
This document is intended to provide how-to assistance on using DatagLANceNetwork Analyzer. It contains information on using DatagLANce for monitoring aLAN and for problem determination. Information on other features ofDatagLANce and some helpful hints and tips are also included.
How This Document Is OrganizedThe document is organized as follows:
• Chapter 1, “Introduction”
This chapter describes the LAN environment used during this project andalso provides a brief introduction to IBM products that can be used withDatagLANce to perform LAN monitoring and/or problem determination.
• Chapter 2, “DatagLANce Planning and Installation”
This chapter provides some helpful information on the installation ofDatagLANce and the end user interface.
• Chapter 3, “Problem Determination Using DatagLANce”
This chapter describes how you use DatagLANce for problem determinationfor a LAN environment and how it integrates with other software products toprovide a complete solution.
• Chapter 4, “Using DatagLANce to Monitor the LAN Environment”
This chapter describes how you use DatagLANce for monitoring a LANenvironment and some reporting functions available.
• Chapter 5, “Turning DatagLANce Data into Information”
This chapter describes how you can import the data from DatagLANce intoother tools as well as different methods of reporting and graphing the data.
• Chapter 6, “DatagLANce Positioning and Other Network ManagementProducts”
This chapter discusses the positioning of DatagLANce and other IBMproducts to perform LAN monitoring and problem determination as well asprovides some helpful information on how to integrate these tools.
• Appendixes A, B, C, D, and E contain various DatagLANce relatedinformation including a SAP reference table and print report options.
Related PublicationsThe publications listed in this section are considered particularly suitable for amore detailed discussion of the topics covered in this document.
• LAN Technical Reference IEEE 802.2 and NETBIOS APIs, SC30-3587
• IBM Token-Ring Network Architecture Reference, SC30-3374
Copyright IBM Corp. 1995 xiii
• DatagLANce Network Analyzer for Ethernet and Token-Ring User′s GuideV1.2, SC31-8084
• Using IBM LAN Network Manager for OS/2, SC31-7105
• NetView for AIX Administrator′s Guide, SC31-8168 (available only onCD-ROM, order number SK2T-9116)
• Using NetView for Windows V2.0, SC31-8195
International Technical Support Organization Publications• LAN Server Performance Tuning, GG24-4430
A complete list of International Technical Support Organization publications,known as redbooks, with a brief description of each, may be found in:
International Technical Support Organization Bibliography of Redbooks,GG24-3070.
To get a catalog of ITSO redbooks, VNET users may type:
TOOLS SENDTO WTSCPOK TOOLS REDBOOKS GET REDBOOKS CATALOG
A listing of all redbooks, sorted by category, may also be found on MKTTOOLSas ITSOCAT TXT. This package is updated monthly.
How to Order ITSO Redbooks
IBM employees in the USA may order ITSO books and CD-ROMs usingPUBORDER. Customers in the USA may order by calling 1-800-879-2755 or byfaxing 1-800-445-9269. Most major credit cards are accepted. Outside theUSA, customers should contact their local IBM office. Guidance may beobtained by sending a PROFS note to BOOKSHOP at DKIBMVM1 or E-mail [email protected].
Customers may order hardcopy ITSO books individually or in customizedsets, called BOFs, which relate to specific functions of interest. IBMemployees and customers may also order ITSO books in online format onCD-ROM collections, which contain redbooks on a variety of products.
ITSO Redbooks on the World Wide Web (WWW)Internet users may find information about redbooks on the ITSO World Wide Webhome page. To access the ITSO Web pages, point your Web browser to thefollowing URL:
http://www.redbooks.ibm.com/redbooks
IBM employees may access LIST3820s of redbooks as well. Point your webbrowser to the IBM Redbooks home page at the following URL:
http://w3.itsc.pok.ibm.com/redbooks/redbooks.html
xiv DatagLANce - Problem Determination and Monitoring

AcknowledgmentsThis project was designed and managed by:
Aroldo Yuji YaiInternational Technical Support Organization, Raleigh Center
The authors of this document are:
Robert Van HeesIBM Belgium
Debbie ShawIBM Canada
This publication is the result of a residency conducted at the InternationalTechnical Support Organization, Raleigh Center.
Thanks to the following people for the invaluable advice and guidance providedin the production of this document:
Kathryn CasamentoGail WojtonInternational Technical Support Organization, Raleigh Center
Ron HarrodIBM USA
Mark HoughtlinIBM USA
Mark ArslanIBM USA
Preface xv

xvi DatagLANce - Problem Determination and Monitoring

Chapter 1. Introduction
This chapter describes the LAN environment and tools that we used during thisproject. Our focus is on DatagLANce Network Analyzer (DatagLANce). We haveused other products to complement DatagLANce, and this chapter provides abrief description of these products with specific focus on the features that relateto DatagLANce.
As this subject could be complex and environment depent, it is not possible tocover everything, but we hope be able to give you enough information thatcombined with your experience will show you how useful these tools can be forLAN problem determination and monitoring.
1.1 The LAN EnvironmentWe have tried to make use of the different hardware and software available to usto make the environment as real to life as possible.
Connections were made with both token-ring and Ethernet cabling and adapters.8228s, 8229s, and 8230s were all part of the network. The token-ring portion ofthe network was running at 4MB.
There were various models of PS/2 workstations, but mostly 8580s and 8595s.There were also a number of RS/6000s of various models. An AS/400 andnetwork connections to the outside world rounded out our physical environment.
The protocol suites being used included token-ring, Ethernet, IBM, and NovellNetWare.
The operating systems we came in contact with included OS/2 2.11, OS/2 Warp,AIX, and Windows. Some workstations on the network were running differentoperating systems. Other than using the network traffic they generated, we hadno direct contact with them.
DatagLANce was the tool we focused on, but other tools used in variousscenarios were LAN Network Manager for OS/2, NetView for AIX, NetView forWindows, and NetFinity.
We had two workstations set up for DatagLANce: a P75 that had both Ethernetand token-ring adapters, 16MB of memory and a 400MB hard disk, and a 755Cwith a token-ring DatagLANce card, 36MB of memory and a 540MB hard disk.The P75 was running OS/2 Warp Connect and the 755C was running OS/2 Warpwith WINOS2. We used DatagLANce V1.3.
1.2 Introduction to DatagLANceDatagLANce is an IBM software program that you install on a PC running OS/2.It requires an Ethernet or token-ring card to connect to a network and ahardware key provided with the software (for details, see Chapter 2,“DatagLANce Planning and Installation” on page 5).
DatagLANce is powerful tool that can be used in the monitoring and analysis ofnetwork traffic on a LAN. On its own, it can be used to monitor the utilization of
Copyright IBM Corp. 1995 1

the LAN network, identify the protocols being used, identify the active networkaddresses, capture frames for playback, capture frames for analysis, and more.
The following facilities are available:
Data Capture Uses event detectors to select only the data you want to capturefrom your network.
Data Analysis Decodes and interprets information from the multiple networkingprotocols that appear on the LAN.
Statistical HistoryStores historical views of utilization, frame rate, data rate, anderror rate statistics in real-time graphs or saves them to a file.
Alarms Monitors rates of statistical information to determine whenthresholds are reached.
Traffic StatisticsShows the stations that are operating on the LAN and thenumber of bytes and frames that each has sent during the timethat traffic statistics have been tracked.
Network GlanceTakes a real-time look at frames traveling on the LAN withoutthe need to capture the frames.
Network Matrix Captures all the data that flows in the LAN and records a .CSVfile with protocol information, network addresses, number offrames and number of bytes.
Combined with other products, DatagLANce can be used remotely. It has acommand line interface that enables some creative uses. It can also send alertstying it in with other network management tools.
In short, it is a tool that a LAN support person cannot do without.
1.3 Other IBM Monitoring/Problem Determination ProductsIn the complex environments that exist today, it is likely that you will need to usemore than one tool to do some tasks. Some of the products we will beintegrating with are:
• LAN Network Manager for OS/2 (LNM) is a tool that displays your token-ringnetwork graphically for you. Once installed it will discover the resourcesthat reside on the segment where it has inserted. By defining the bridges inthe network, you can watch the display of your network grow. LNM onlyconcerns itself at the physical level. If the adapter for a workstation isinserted into the ring and working, LNM is happy. This is our interest in LNMfor this redbook.
• NetView for AIX (NetView) is a powerful tool used to monitor and manage anetwork. Using PING, it will go out and discover the resources on yournetwork including the routers and hubs and beyond. This discovery processshould be used with caution as it may take a lot of resources and time in alarge network. The discovery can also be limited by using a SEED file thatcontains the addresses of the various network components you need tomanage. Once discovered, NetView will display these resources graphicallyand continue to monitor them. DatagLANce can be used to send alerts toNetView for AIX and it is this function that we will be reviewing.
2 DatagLANce - Problem Determination and Monitoring

• NetView for Windows is much like NetView for AIX. It too uses PING todiscover what resources are on the network. One limitation, though, is thatyou cannot create a SEED file for NetView for Windows, so if you use thediscovery function, you could tie up your workstation for a long time.
• NetFinity Manager for OS/2 is part of the NetFinity family of distributedapplications. When the NetFinity products are used together they provide aset of tools for systems management for workstations in a LAN network.These tools are used for the physical side of systems management such asconfiguration management, disk usage, disk I/O, etc... NetFinity Manager forOS/2 can receive alerts. These alerts can then be used to initiate otherevents such as sending a page, sending a message to a support person, orstarting a program.
Chapter 1. Introduction 3

4 DatagLANce - Problem Determination and Monitoring

Chapter 2. DatagLANce Planning and Installation
Installation is rather straightforward. In most cases, the information in the user′sguide will be sufficient. In this chapter we have drawn your attention to a fewpotential problem areas. Installing a second LAN adapter in your PC for sendingSNMP traps to NetView can become quite difficult if you are not familiar withinstalling hardware. Reading our findings could save you time.
2.1 PrerequisitesOnce installed, DatagLANce runs with OS/2 and has no other softwareprerequisites. The following hardware is necessary.
Minimum configurations for DatagLANce are listed in the user′s guide, butDatagLANce may perform poorly on a minimum configuration. We recommendthat you use at least the following:
• A 486 33 MHz processor
• 16 MB of memory
• At least 110 MB of disk space
In case extra disk space is needed, do not try to use Stacker for OS/2. Stackerwill use too much processing power and it will also slow down the disk writes.
2.1.1 Network AdaptersDatagLANce needs a promiscuous network adapter, which means that theadapter is able to copy frames from the network.
For .token-ring. networks, specific DatagLANce adapters exist for ISA, MCA andPCMCIA. You can use the token-ring network 16/4 Trace and Performanceadapters (TAP) or OEM adapters, such as the Network General 16/4 token-ringSniffer* Analyzer adapter.
.Ethernet adapters are the standard IBM Ethernet adapters. All Ethernetadapters are promiscuous. They are listed in the user′s guide.
For PCMCIA adapters, if you are not sure whether you have a DatagLANcetoken-ring adapter, you can run the diagnostics on the adapter. It should reportan EC level for the microcode of 000300 OF1CA3 or 000700 OF1EA7. CC_RTAP isformerly supported internal tool that can be used to upgrade a normal PCMCIAtoken-ring card to the right level of microcode.
For Dual-Media DatagLANce analysis, two DatagLANce adapters are required.This could be, for instance, one DatagLANce token-ring adapter and one Ethernetadapter, or two token-ring adapters, or two Ethernet adapters.
2.1.1.1 Simultaneous Network AccessAlthough the DatagLANce token-ring adapters can be used for normalnetworking functions, they cannot be used simultaneously for normal networkingfunctions and monitoring/capturing. For that purpose you need to install asecond LAN adapter into your system or two system configurations.
Copyright IBM Corp. 1995 5

2.1.1.2 Keyless OperationDatagLANce comes with a special key that has to be connected to the parallelport. This key must be installed, not only for capturing, but also for analysis. Itpermits you to load DatagLANce software on multiple systems without violatingyour license agreement.
The user has the option to do a DatagLANce ″keyless″ installation. He can do itjust by typing keyless from an OS/2 full-screen prompt, in the DGNA directory.At that time, the use of DatagLANce will be linked to the specific networkadapter in the computer and the key will be disabled. It is important to note thatonce this option is taken, it will be impossible to migrate from, for example, anISA bus configuration to an MCA configuration without buying a new DatagLANcepackage. The ″keyless″ operation is irreversible indeed.
When you have a dual-media DatagLANce and you want to operate ″keyless″, forinstance, using a ThinkPad, you will have to decide which adapter is yourprimary adapter for DatagLANce. This means that you will decide to link theDatagLANce package to either the Ethernet or the Token-Ring adapter. Thesecondary media DatagLANce adapter will only function if this primary mediaadapter is installed and operating. In other words, if you decide that theDatagLANce adapter for token-ring is your primary adapter for ″keyless″operation, you link the functioning of DatagLANce to this token-ring adapter.Even if you want to monitor an Ethernet segment, you will have to have thetoken-ring adapter for DatagLANce installed and its device driver loaded.
2.2 InstallationA menu system will guide you through the installation process. Options to betaken are:
• The disk on which to install the product
• The type of the adapter
• DatagLANce adapter as primary or alternate
• The size of the capture buffer
• The size of the traffic analysis buffer
2.2.1 LAN AdaptersAs mentioned earlier, DatagLANce cannot use a LAN adapter once theMPTS/LAPS drivers have ″captured″ it. For token-ring, if DatagLANce is to usethe primary adapter, make sure that MPTS (LAPS) is using the alternate. ForEthernet the I/O base or socket number (for Ethernet CC adapters) will selectwhich adapter that is being used.
DatagLANce adapters are ″hot-pluggable″ to the LAN. This means that there willbe no local lobe test at the IPL of the machine. You could take a ThinkPad to aspecific segment, connect to the access unit, and start the DatagLANce software.However, if you take the card out of the machine, you will have to IPL it again.
Interrupt levels and RAM addresses of the different adapters must not conflict.
When working on a ThinkPad, make sure that the PCMCIA card services areinstalled. These are two files (PCMCIA.SYS and VPCMCIA.SYS) that could beleft out in a selective install. You also need a statement for socket services in
6 DatagLANce - Problem Determination and Monitoring

the CONFIG.SYS file (IBM2SS01.SYS) and a Resource Map Utility driver(ICRMU01.SYS).
During our installation on a ThinkPad using OS/2 Warp, the system warned usthat socket services were not installed on the system, or that we had socketservices from a different manufacturer. Since the right statements were in theCONFIG.SYS file, we ignored the message and the installation was successful.
2.2.1.1 Sequence of DriversAt the end of the installation, the following device drivers should be in theCONFIG.SYS file in the following order:
1. DatagLANce high-resolution time driver (if used)
2. PCMCIA drivers when working on a laptop
3. DatagLANce drivers
4. Other network drivers
5. Socket services and Resource Utility Drivers at the very end
2.2.1.2 CONFIG.SYS StatementsWhen installing DatagLANce for token-ring and Ethernet, the installationprocedure puts three statements in the CONFIG.SYS file:
• DEVICE=C:\DGNA\DGHRT$.SYS
• DEVICE=C:\DGNA\PCMCIA\DGTR0$.SYS INTERFACE=0 BUFSIZE=2M TRAFFIFO=2MMMIOBASE=CC000 SHAREDBASE=DA000 IRQ=5
• DEVICE=C:\DGNA\PCMCIA\DGEN0$.SYS INTERFACE=0 BUFSIZE=2M TRAFFIFO=2MSHAREDBASE=D0000 IRQ=3 IOBASE=300
The following a brief description of some parameters used in the CONFIG.SYSfile:
DGHRT$.SYS This is the high-resolution time stamp option. Dependingon how busy your network is, the time stamp of a framemight not be precise enough to give the relative arrivaltime of frames. The high-resolution time stamp does notguarantee a precise arrival time, but it can be used toorder frames following their arrival time.
Network Drivers DGTR0$.SYS is the driver for token-ring capturing andanalysis. DGEN0$.SYS is the driver for Ethernet. Whenusing DatagLANce in a dual media environment, bothstatements have to be in the CONFIG.SYS file.
Bufsize This defines the size of the memory that will be used forstoring captured frames. The value must be defined inmultiples of 64KB.
Traffifo This defines the size of the memory that will be used fortraffic analysis. The value must be defined in multiples of64KB.
Bufsize and Traffifo values are chosen at installation time and can be changed inthe CONFIG.SYS file afterwards. Increasing these values gives betterperformance. However, the memory used for DatagLANce buffers is notavailable for system use. If you have a system with 16 MB of memory and youput 4 MB aside for buffers both for Ethernet and token-ring, you will be left with
Chapter 2. DatagLANce Planning and Installation 7

only 12 MB for OS/2 and the DatagLANce application. For this reason, wecustomarily comment out (rem) the Ethernet statement while working on atoken-ring LAN and vice versa.
When working with OS/2 WARP, you could prepare a CONFIG.EN and aCONFIG.TR and choose from the startup menu which environment you want towork in. The setup for this approach is explained in the OS/2 WARP basicdocumentation.
2.3 Installation ExamplesThe following section gives more detail of our installation of DatagLANce onMCA, ISA, and ThinkPad machines and also the DatagLANce panels during theinstallation process.
2.3.1 MCA Type 8573For MCA machines we have the following procedures:
2.3.1.1 Reference DisketteUsing the PS/2 reference diskette, we defined the following hardware setup forthe two adapters we were using:
Table 1. MCA Type 8573 Configuration
Parameter Slot 2: IBM Token-Ringadapter for DatagLANce
Slot 5: IBM Token-Ring 16/4Adapter/A
Primary or Alternate Adapter Primary Alternate
Adapter Date Rate 4 Mbps 4 Mbps
ROM Address Range CE000-CFFFF CC000-CDFFF
RAM Size and Address Range 16KB / C4000-C7FFF 16KB / C0000-C3FFF
Interrupt Level Interrupt 2 Interrupt 3
Note: When choosing address ranges for ROM and RAM, an asterisk willappear when you have chosen conflicting address ranges.
2.3.1.2 LAPSWhen using LAPS for the MCA machine, the resulting PROTOCOL.INI file was asfollows;
[PROT_MAN]
DRIVERNAME = PROTMAN$
[IBMLXCFG]
tcpip_nif = tcpip.nifIBMTOK_nif = ibmtok.nif
[tcpip_nif]
DriverName = TCPIP$Bindings = IBMTOK_nif
8 DatagLANce - Problem Determination and Monitoring

[IBMTOK_nif]
DriverName = IBMTOK$Adapter = ″Alternate″MAXTRANSMITS = 6RECVBUFS = 2RECVBUFSIZE = 256XMITBUFS = 1
Note: We defined the token-ring adapter as Alternate, and loaded TCP/IPdrivers on it.
2.3.1.3 CONFIG.SYSThe following lines were added to the top of the CONFIG.SYS file. Rememberthat you want to remark out either the Ethernet or the token-ring line if you workonly in one environment. Memory set aside for the buffers is not available forsystem use.
DEVICE=D:DGNADGHRT$.SYSDEVICE=D:\DGNA\DGTR0$.SYS INTERFACE=0 BUFSIZE=2M TRAFFIFO=2MDEVICE=D:\DGNA\SONIC\DGEN0$.SYS INTERFACE=0 BUFSIZE=2M TRAFFIFO=1MDEVICE=C:\IBMCOM\MACS\IBMTOK.OS2
2.3.2 ISAOn the ISA machine we had to disable a block of 64KB for system use duringhardware setup. This adapter memory is mapped to computer memory so thesoftware being used can access the RAM on the adapter 16 KB at the time. Wechoose the following blocks to be set aside:
• CC000-CFFFF
• D0000-D3FFF
• D4000-D7FFF
• D8000-DBFFF
Note: It is necessary to power off the computer for these changes to becomeeffective.
The first two address ranges were used for the 16/4 auto token-ring adapter, andthe two following were used for the DatagLANce adapter.
We used the LANAID diskette packaged with the adapter and selected a fullscreen DOS prompt to customize the auto 16/4 TR card:
RAM address Range 0D0000-0D3FFF
ROM Address Range CC000-CDFFF
I/O address A24-A27 Secondary
During this setup the software also warned us when there were conflictingdefinitions. We powered off the machine for the changes to become effective.
Chapter 2. DatagLANce Planning and Installation 9

2.3.2.1 LAPSUsing LAPS for the ISA machine, the resulting PROTOCOL.INI file was as follows;
[PROT_MAN]
DRIVERNAME = PROTMAN$
[IBMLXCFG]
landd_nif = landd.nifnetbeui_nif = netbeui.niftcpip_nif = tcpip.nifIBMTOK_nif = IBMTOK.NIF
[landd_nif]
DriverName = LANDD$Bindings = IBMTOK_nifNETADDRESS = ″T400052005132″ETHERAND_TYPE = ″D″SYSTEM_KEY = 0x0OPEN_OPTIONS = 0x2000TRACE = 0x0LINKS = 16MAX_SAPS = 10MAX_G_SAPS = 0USERS = 5TI_TICK_G1 = 255T1_TICK_G1 = 15T2_TICK_G1 = 3TI_TICK_G2 = 255T1_TICK_G2 = 25T2_TICK_G2 = 10IPACKETS = 250UIPACKETS = 100MAXTRANSMITS = 6MINTRANSMITS = 2TCBS = 64GDTS = 30ELEMENTS = 800
[netbeui_nif]
DriverName = netbeui$Bindings = IBMTOK_nifETHERAND_TYPE = ″D″USEADDRREV = ″YES″OS2TRACEMASK = 0x0SESSIONS = 64NCBS = 128NAMES = 32SELECTORS = 5USEMAXDATAGRAM = ″NO″ADAPTRATE = 1000WINDOWERRORS = 0MAXDATARCV = 4168TI = 30000T1 = 500T2 = 400
10 DatagLANce - Problem Determination and Monitoring
MAXIN = 1MAXOUT = 1NETBIOSTIMEOUT = 500NETBIOSRETRIES = 4NAMECACHE = 0PIGGYBACKACKS = 1DATAGRAMPACKETS = 2PACKETS = 350LOOPPACKETS = 1PIPELINE = 5MAXTRANSMITS = 6MINTRANSMITS = 2DLCRETRIES = 5FCPRIORITY = 5NETFLAGS = 0x0
[tcpip_nif]
DriverName = TCPIP$Bindings = IBMTOK_nif
[IBMTOK_nif]
DriverName = IBMTOK$ADAPTER = ″ALTERNATE″RAM = 0xD000MAXTRANSMITS = 12RECVBUFS = 20RECVBUFSIZE = 2040XMITBUFS = 2XMITBUFSIZE = 4096
Note: We defined the token-ring adapter as Alternate, and loaded TCP/IPdrivers on it. Notice that the RAM address of D0000 is noted 0xD000. Wedid not have to put this address in LAPS; it was there since the setup withLANAID.
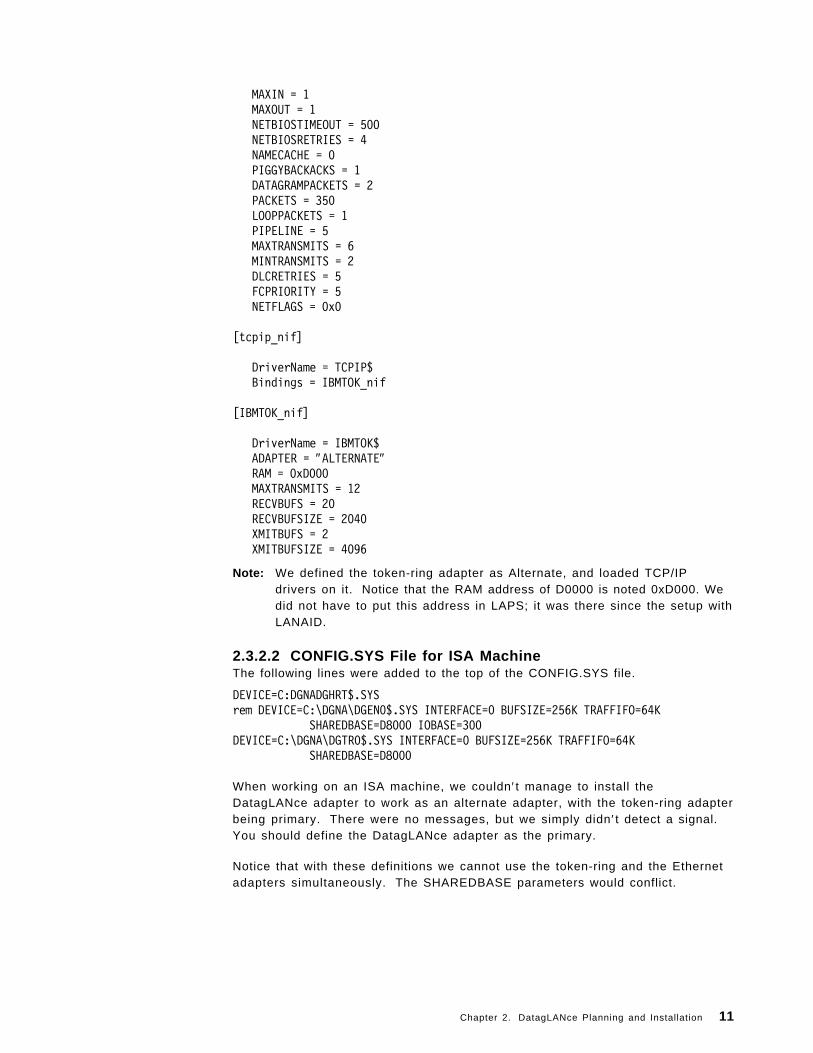
2.3.2.2 CONFIG.SYS File for ISA MachineThe following lines were added to the top of the CONFIG.SYS file.
DEVICE=C:DGNADGHRT$.SYSrem DEVICE=C:\DGNA\DGEN0$.SYS INTERFACE=0 BUFSIZE=256K TRAFFIFO=64K
SHAREDBASE=D8000 IOBASE=300DEVICE=C:\DGNA\DGTR0$.SYS INTERFACE=0 BUFSIZE=256K TRAFFIFO=64K
SHAREDBASE=D8000
When working on an ISA machine, we couldn′ t manage to install theDatagLANce adapter to work as an alternate adapter, with the token-ring adapterbeing primary. There were no messages, but we simply didn′ t detect a signal.You should define the DatagLANce adapter as the primary.
Notice that with these definitions we cannot use the token-ring and the Ethernetadapters simultaneously. The SHAREDBASE parameters would conflict.
Chapter 2. DatagLANce Planning and Installation 11

2.3.3 ThinkPadWhile working on a ThinkPad, we had a few problems that took us time toresolve. The first one was to have a DatagLANce token-ring adapter workingsimultaneously with a normal token-ring adapter in order to use the secondadapter to send alerts to NetView. The second problem came with the PCMCIAEthernet II adapter installation. The solution for the problems are describedbelow.
2.3.3.1 Use Two Adapters on a ThinkPadThe following is shown the configuration files (CONFIG.SYS and PROTOCOL.INI)that worked on our ThinkPad. This configuration worked only when theDatagLANce adapter was in the second socket of our ThinkPad.
rem ******************DEVICE=D:DGNADGHRT$.SYSDEVICE=D:DGNAPCMCIADGTR0$.SYS INTERFACE=0 BUFSIZE=64KTRAFFIFO=64K MMIOBASE=CC000 SHAREDBASE=D8000 IRQ=5
REM DEVICE=D:DGNAPCMCIADGEN0$.SYS INTERFACE=0 BUFSIZE=2MTRAFFIFO=2M SHAREDBASE=D0000 IRQ=3 IOBASE=300
Figure 1. ThinkPad CONFIG.SYS File Example Using DatagLANce
The following statements were coded in the PROTOCOL.INI [IBMTOKCS_nif] :
DriverName = IBMTOK$ADAPTER = ″ALTERNATE″NETADDRESS = ″400052005295″MAXTRANSMITS = 12RECVBUFS = 2RECVBUFSIZE = 256XMITBUFS = 1XMITBUFSIZE = 4144PCMCIARINGSPEED = 4
Figure 2. ThinkPad PROTOCOL.INI Entry Example Using DatagLANce
2.3.3.2 The PCMCIA Ethernet II adapterWe had a DatagLANce package installed under WARP on a ThinkPad 755CS.The token-ring DatagLANce worked fine with the PCMCIA DatagLANce adapterfor token-ring. This led us to believe that PCMCIA support and socket serviceswas correctly installed, but we ran into trouble when tried to work with aEthernet II adapter.
The Ethernet II adapter would not catch any network signals. When clicking onthe Plug and Play for PCMCIA icon, the Ethernet adapter was recognized but thecard status was ″not ready″. Interrupts and address ranges did not conflict.
The problem was that we had installed the PCMCIA support from the WARPinstall program. Corresponding PCMCIA support exists on the ″ThinkPad
12 DatagLANce - Problem Determination and Monitoring
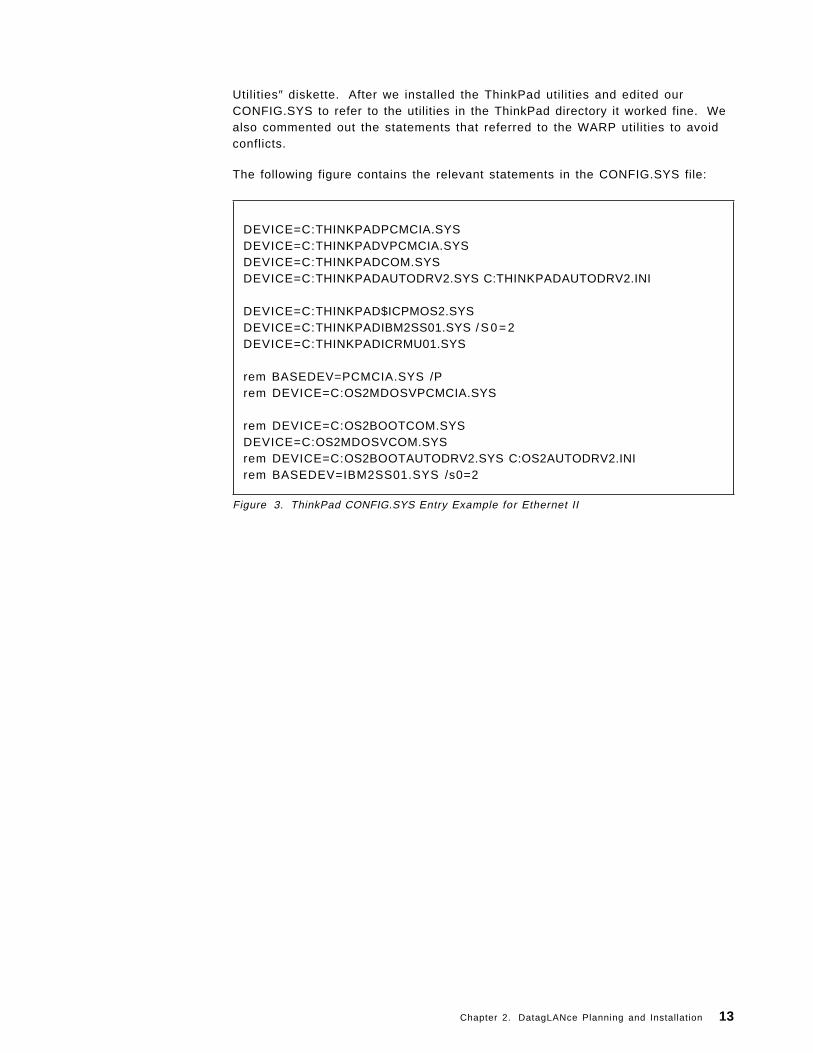
Utilities″ diskette. After we installed the ThinkPad utilities and edited ourCONFIG.SYS to refer to the utilities in the ThinkPad directory it worked fine. Wealso commented out the statements that referred to the WARP utilities to avoidconflicts.
The following figure contains the relevant statements in the CONFIG.SYS file:
DEVICE=C:THINKPADPCMCIA.SYSDEVICE=C:THINKPADVPCMCIA.SYSDEVICE=C:THINKPADCOM.SYSDEVICE=C:THINKPADAUTODRV2.SYS C:THINKPADAUTODRV2.INI
DEVICE=C:THINKPAD$ICPMOS2.SYSDEVICE=C:THINKPADIBM2SS01.SYS / S 0 = 2DEVICE=C:THINKPADICRMU01.SYS
rem BASEDEV=PCMCIA.SYS /Prem DEVICE=C:OS2MDOSVPCMCIA.SYS
rem DEVICE=C:OS2BOOTCOM.SYSDEVICE=C:OS2MDOSVCOM.SYSrem DEVICE=C:OS2BOOTAUTODRV2.SYS C:OS2AUTODRV2.INIrem BASEDEV=IBM2SS01.SYS /s0=2
Figure 3. ThinkPad CONFIG.SYS Entry Example for Ethernet II
Chapter 2. DatagLANce Planning and Installation 13

2.3.4 Installation PanelsThe following panels document the DatagLANce installation process.
Figure 4. DatagLANce Installation - Media Selection
Figure 4 allows you to decide the environment in which you want to useDatagLANce.
14 DatagLANce - Problem Determination and Monitoring

Figure 5. DatagLANce Installation - Software Option
Figure 5 lists the software options that can be installed. If your disk space islimited, you could leave out some packages.
Chapter 2. DatagLANce Planning and Installation 15

Figure 6. DatagLANce Installation - Token-Ring Configuration Options
Figure 6 allows you to configure the high resolution timestamp, capture buffersize, traffic statistics FIFO, alternative adapter and the shared RAM base addressfor the token-ring 16/4 ISA adapter. A different panel will be displayed if you areusing the MC adapter.
16 DatagLANce - Problem Determination and Monitoring

Figure 7. DatagLANce Installation - Timestamp Option
Figure 7 allows you to select the high resolution time stamp option. Duringanalysis the relative time in which frames arrived could be useful. If yournetwork is very busy, the absolute time stamp of a frame may becomeimprecise.
Chapter 2. DatagLANce Planning and Installation 17

Figure 8. DatagLANce Installation - Buffer Size
Figure 8 allows you to define the capture buffer size to be used by DatagLANce.Remember that you can manually adapt the buffer space in the CONFIG.SYSstatements for Ethernet or token-ring after installation. Beware that whenmemory is set aside for buffer space it is not available for system use. If you donot work in both environments at the same time, you may want to prepare twoCONFIG.SYS files: one with the DatagLANce statement for Ethernet and one withthe DatagLANce statement for token-ring.
18 DatagLANce - Problem Determination and Monitoring
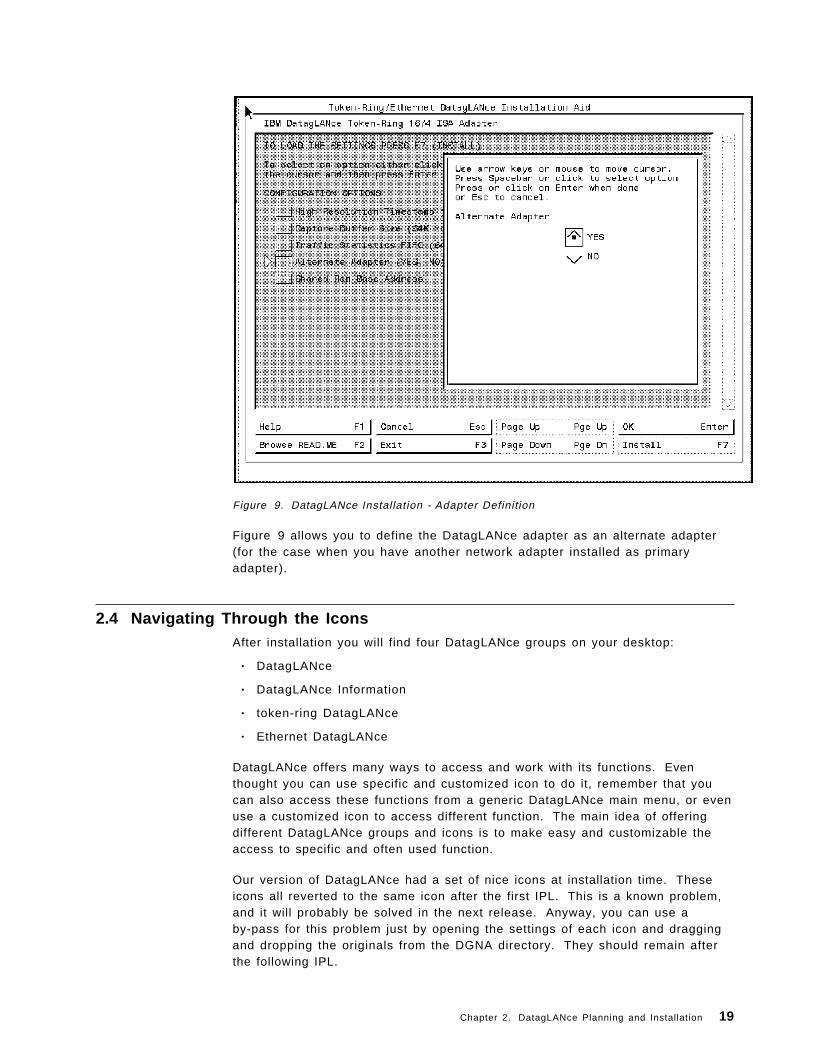
Figure 9. DatagLANce Installation - Adapter Definit ion
Figure 9 allows you to define the DatagLANce adapter as an alternate adapter(for the case when you have another network adapter installed as primaryadapter).
2.4 Navigating Through the IconsAfter installation you will find four DatagLANce groups on your desktop:
• DatagLANce
• DatagLANce Information
• token-ring DatagLANce
• Ethernet DatagLANce
DatagLANce offers many ways to access and work with its functions. Eventhought you can use specific and customized icon to do it, remember that youcan also access these functions from a generic DatagLANce main menu, or evenuse a customized icon to access different function. The main idea of offeringdifferent DatagLANce groups and icons is to make easy and customizable theaccess to specific and often used function.
Our version of DatagLANce had a set of nice icons at installation time. Theseicons all reverted to the same icon after the first IPL. This is a known problem,and it will probably be solved in the next release. Anyway, you can use aby-pass for this problem just by opening the settings of each icon and draggingand dropping the originals from the DGNA directory. They should remain afterthe following IPL.
Chapter 2. DatagLANce Planning and Installation 19

2.4.1 The DatagLANce IconThis window contains four icons that do not open a window, but they areparticularly useful:
• 4 Mbps Default token-ring Speed
• 16 Mbps Default token-ring Speed
• COLOR Video Support
• MONO Video Support
Figure 10. DatagLANce Icon View
2.4.1.1 Token-Ring SpeedWhen you are starting DatagLANce functions that need DatagLANce to beinserted into the token-ring, a pop-up window will warn you of the speed atwhich DatagLANce will enter the ring. Rather than verifying each time from theMonitor pull-down menu, you can set the right speed for all these functions byclicking on the 4Mbps or 16Mbps Default Token-Ring Speed icon. After doingthis selection you will get a panel on your screen listing all the files that arebeing updated with the selected speed.
2.4.1.2 Video SupportThe COLOR Video Support or MONO Video Support icons work similarly to thetoken-ring speed icons updating the related files.
When working with color video support on a monochrome video, some of thecontrasts will not be very clear because different colors revert to very much thesame gray tone. The gray scale will be corrected when mono video support isselected.
20 DatagLANce - Problem Determination and Monitoring

2.4.1.3 Tutorial and Specific IconsSeveral tutorial icons will guide you through Token-Ring Network Analyzer,Ethernet Network Analyzer, and Protocol Analysis.
You will find all the information available through these icons in the user′s guide,but going through the tutorial is another way of finding out different functions inan interactive way.
2.4.2 DatagLANce Information IconThis window contains various icons that will give you a DatagLANce hands-ontutorial. It is an online documentation and also an interactive way to get startedwith DatagLANce.
Different icons in this window refer to different chapters in the user′s guide.
2.4.3 Token-Ring DatagLANce IconDatagLANce can be used either for problem determination or for monitoring. Forproblem determination, you will most likely capture the traffic in a capture fileand do all sorts of analysis later on this file. If you merely monitor, you willactivate a number of statistical functions and capture statistical information in afile that could be introduced into a database or a spreadsheet. Examples are aLotus file or DB2/2.
2.4.3.1 Capturing FramesAn important function in this window is the Capture Frames Icon. Figure 11shows the token-ring DatagLANce icon view. You will start from here for most ofyour problem determination work.
Figure 11. Token-Ring DatagLANce Icon View
Chapter 2. DatagLANce Planning and Installation 21

Click on the Capture Frames icon. Name the capture file from the Capturepull-down menu. If you use DatagLANce for monitoring you might not beinterested in keeping a capture file, but you will set it up to log certain eventsand key statistics or to send alerts to a NetView machine. The capturing functionwill start after you click on the Go! option in the menu bar.
Figure 12 shows the DatagLANce menu bar ready to start the specificconfiguration capture.
Figure 12. Token-Ring DatagLANce Network Analyzer Menu Bar
A number of predefined screens are available that can help you to get an overallimpression of what is going on while you capture. Each screen contains severalwindows with information. Depending on the nature of your problem you willusually select from the following screen options:
• Network Statistics
• Network History
• Network Errors
• Alarm Log
Take a look at the Network Statistics screen shown in Figure 13.
Figure 13. DatagLANce Token-Ring Network Analyzer: Network Statistics
From the menu bar, you can select Screen and then Define option to set up yourown screens with a different combination of windows.
22 DatagLANce - Problem Determination and Monitoring

To stop the capturing function, you can just click on the Stop! option on themenu bar when you feel the appropriate information is already captured in thefile. This will be as soon as you encounter the problems you are trying to solve.It could be a session disconnect, slow response time, beaconing, and so on.
From this screen you can start the analysis of your captured file by clicking onAnalysis option on the menu bar.
If you just stopped capturing, DatagLANce will assume that you want to analyzethe file you captured. In other cases, or if you started Protocol Analysis from theDatagLANce group, you will have to choose from the captured files that are onyour system. Figure 14 shows an example of using Analysis option.
Figure 14. Token-Ring Frame Summary
As you start working on the analysis of your capture file, you will realize howpowerful DatagLANce is.
When you start looking for a problem in a file containing several thousands offrames, you will need some help. DatagLANce gives you plenty of tools that helpyou to filter out these frames that contain the information you want. The betteryou master the different tools that are available, the easier you will find what youare looking for. So take your time to discover how you can trim the raw materialuntil you only have the relevant information on your screen.
A number of facilities are there that will help you in your search through thecaptured file. For instance, from the Display menu choice (see Figure 14) try thedifferent address levels that are available. If you work in a TCP/IP environment,you will easier find the Network Addresses of your stations. Most customers willbe able to give you the DLC addresses of your cards. Try it out! The followingfeatures will be discussed in more detail:
Chapter 2. DatagLANce Planning and Installation 23

• Address Formats
This allows you to display addresses in canonical or LSB form.
• Symbolic Names
This allows you to replace network addresses by names of your choice.
• Filters
Several combinations of filters can be applied so that only specific eventsare shown on the screen.
• Frame Detail and Hexdump
This displays a specific protocol detail and optionally, a hexadecimalrepresentation of the frame that is being analyzed.
Address Formats: This is essential before going further. You must be awarethat in most Ethernet environments addresses are written in canonical form(least significant bit first) while in a token-ring environment the MSB format(most significant bit first) is commonly used. Look at the following examples tosee what this means:
In both formats, bytes come in the same order, but bits within the byte arereversed. Look at the last byte of the lower address to see what this means. Inthe MSB address D is the hexadecimal representation of 13, 13 being thedecimal representation of binary 1101. The same way 9 is 1001 in binary.Turning the bites around gives us 1001 and 1011 which would be 9 and 11 indecimal or 9 and B in Hex.
To handle the MSB and canonical format, just click on the File and thenPreferences options (see Figure 14 on page 23). Try both address formats andcompare with the MAC addresses that your customer gave you.
Symbolic Names: Rather than working with MAC addresses or TCP/IPaddresses, you will find it useful to replace some of these by a symbolic namesuch as LAN Server, AS/400 or 3745.
To access this feature, just click on the File and then Edit Symbolic Namesoption (see Figure 14 on page 23). You will get the Edit Symbolic Names panelas shown below.
Table 2. Address Formats
MSB format Canonical format
10:00:5A:11:22:33 08-00-5A-88-44-CC
00:00:55:8B:1F:D9 00-00-AA-D1-F8-9B
24 DatagLANce - Problem Determination and Monitoring
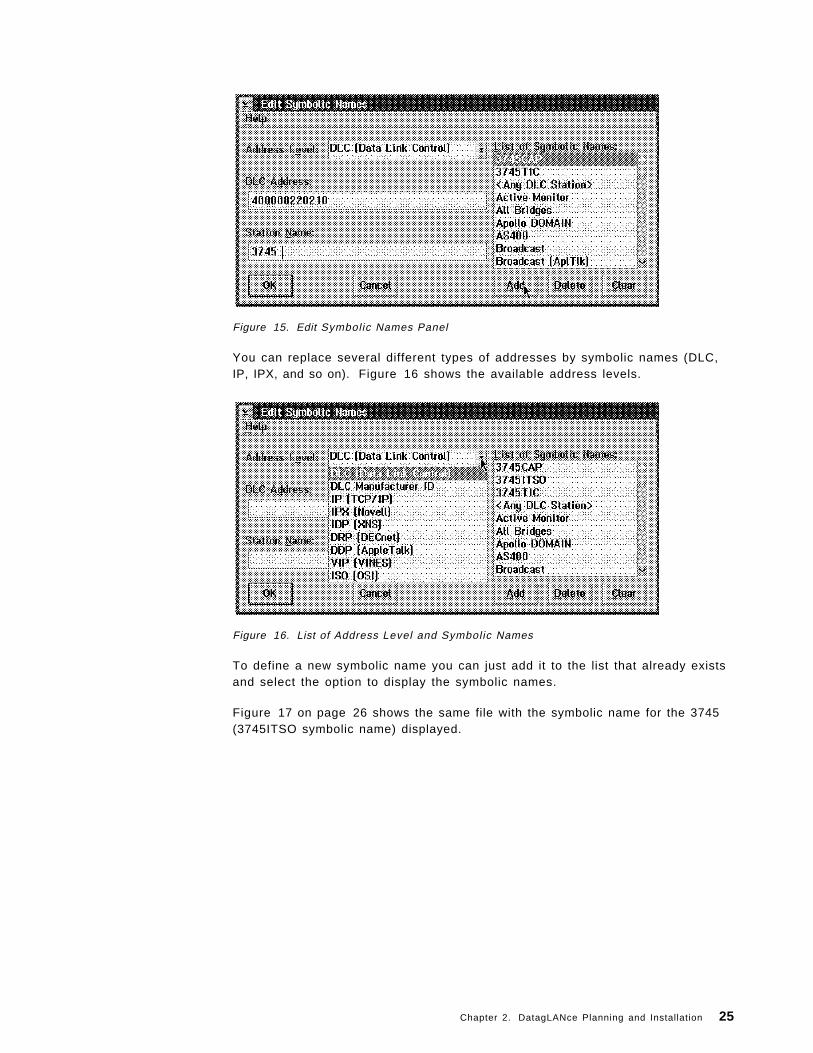
Figure 15. Edit Symbolic Names Panel
You can replace several different types of addresses by symbolic names (DLC,IP, IPX, and so on). Figure 16 shows the available address levels.
Figure 16. List of Address Level and Symbolic Names
To define a new symbolic name you can just add it to the list that already existsand select the option to display the symbolic names.
Figure 17 on page 26 shows the same file with the symbolic name for the 3745(3745ITSO symbolic name) displayed.
Chapter 2. DatagLANce Planning and Installation 25

Figure 17. Frame Summary Showing Symbolic Names
Filters: As you can see in Figure 17, we still have a lot of information on ourscreen to deal with, therefore an easy way to get specific information is to usefilters.
If we wanted to know what was going on between a specific workstation and a3745, we could filter out the frames between the two of them, forgetting about allthe rest. To use the filter capability, you can just click on the Search option andthen Quick Filter.
On this panel, select 3745ITSO from your symbolic names list and define it to bethe destination address. In a similar way, select Workstation to be the sourceaddress. Click on Add to have the first address pair in the list. Then click onSwitch and then Add to add the second address pair, in order to filter all framesbetween your 3745 and the workstation. Figure 18 on page 27 shows thisconfiguration.
26 DatagLANce - Problem Determination and Monitoring
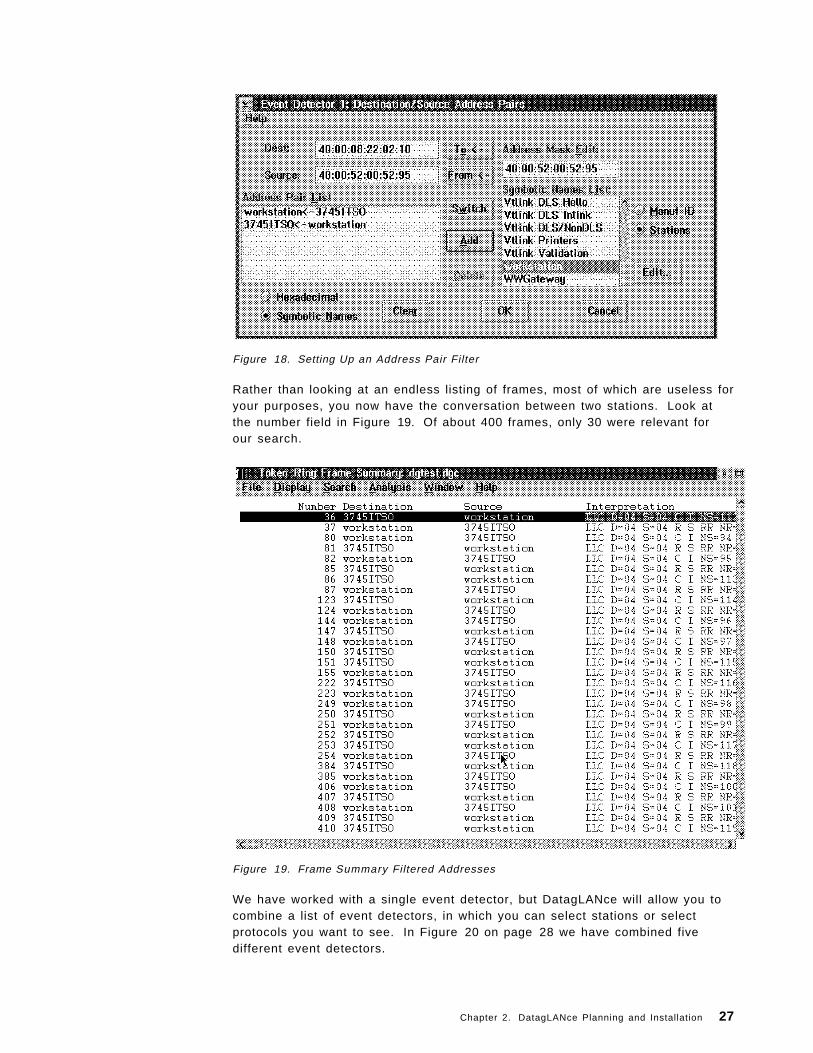
Figure 18. Setting Up an Address Pair Filter
Rather than looking at an endless listing of frames, most of which are useless foryour purposes, you now have the conversation between two stations. Look atthe number field in Figure 19. Of about 400 frames, only 30 were relevant forour search.
Figure 19. Frame Summary Filtered Addresses
We have worked with a single event detector, but DatagLANce will allow you tocombine a list of event detectors, in which you can select stations or selectprotocols you want to see. In Figure 20 on page 28 we have combined fivedifferent event detectors.
Chapter 2. DatagLANce Planning and Installation 27

Figure 20. Multiple Event Detectors
Frame Detail and Hexdump: To get more details about the frame, from thepanel shown in Figure 19 on page 27, click on one of the frames and you will getall the header details at different layers, for instance:
• DLC information
• Routing information
• LLC data
• SNA headers
Figure 21 on page 29 shows an example of this frame detail display. Theinformation in each layer is also presented in a different color.
Double clicking on the Frame Detail window will open a second window thatcontains the hexdump of the frame with an EBCDIC or ASCII translation of itscontents.
28 DatagLANce - Problem Determination and Monitoring

Figure 21. Frame Detail and Hexdump
With the Display option you can select the different fields of information you wantto see. For some, analysis time stamps can be really important, in other casesyou want to see relative time. Try it out!
From the Search and Analysis menu options, you have several options to definea reference frame or a bookmark. For instance, while searching in a big file, youcan get back to the reference frame with one click of the mouse rather thanpaging endlessly through the file to find the frame from which you started.
2.4.3.2 Templates IconsYou have available several windows to help you create templates icons withdifferent configurations to easily get access to DatagLANce configuration.
DatagLANce provides the following icons that can selectively be used todefine/customize your own icon:
• Template
• Distribution Template
• File Server Template
• Default Configuration
The Template icon displays the configuration description file yourconfighere.wde.The Distribution Template provides a collection of not configured eventdistribution s that can be used to create your own configurations. To specifythe events for which you would like a distribution, select Custom Events from theMonitor menu. From this panel you can edit the custom event equation for theevents that you want to display.
Chapter 2. DatagLANce Planning and Installation 29

The File Server Template provides for you a sample setup to monitor a particularfile server on the network, in addition to regular monitoring functions. To selectthe file server to be monitored, select Custom Events from the Monitor menu andthen select Custom Event 3 to the drop-down combination box. To monitor a fileserver with a network address, you can setup a frame data pattern (specified inhexadecimal) for the network address.
The Default Configuration is a collection of default alarms and events to bemonitored.
2.4.3.3 Network NamesYou have available several functions to help you discover network names(stations names) on the LAN.
DatagLANce provides the following icons that you can selectively use to learnthese addresses:
• Apple Talk Names
• DEC Names
• IPX Names
• TCP/IP Names
• NetBIOS Names
These icons allow DatagLANce to learn workstations names from the network.To do it, just select the icon and use the following procedure:
1. Select the Go! option on the menu bar to start monitoring and capturing.Select Yes to overwrite the existing capture file.
2. After the capture stops (or after you click STOP! on the captureStatus/Control window), click on the Analysis button on the CaptureStatus/Control Window.
3. Wait for a Protocol Analysis session to start. When the Frame Summarywindow appears, select Look for Symbolic Names from the File menu.
2.4.3.4 The Monitor Ring Map FunctionAn interesting DatagLANce function is the Monitor Ring Map function.
When trying to locate a station or a part of cabling that causes trouble it will beuseful, not only to know the station′s address, but also its Nearest ActiveUpstream Neighbor (NAUN) address. The Monitor Ring Map function willproduce the list of station addresses in the order they occur in the ring.
When activating this function, first disable the capture function from the Capturemenu option. From the Monitor option, click on the Ring Map choice, and thenthe Go! option. After that, choose the Ring Map from the Screen menu option.Figure 22 on page 31 shows the addresses of stations in our segment withDatagLANce as last station in the ring.
30 DatagLANce - Problem Determination and Monitoring

Figure 22. Monitor Ring Map
The Ring Map list can be refreshed at different intervals. You can acknowledgenew stations as they enter into the token-ring and clear stations when they leavethe ring.
Chapter 2. DatagLANce Planning and Installation 31

2.4.3.5 Monitor Routing TypesThe Monitor Routing Types icon allows you to monitor different types ofsource-routed traffic on your network by displaying a routing type distribution.Figure 23 shows an example of source routing monitoring.
You can activate this function by clicking on its icon (see Figure 11 on page 21)and from the Screen menu, choosing the Source Routing Type Distributionoption.
Figure 23. Source Routing Type Distribution
32 DatagLANce - Problem Determination and Monitoring

2.4.3.6 Monitor Frame SizesWhen you click on the Monitor Frame Sizes icon (Figure 11 on page 21) you willsee the distribution of frame sizes in your network at that particular time.Figure 24 shows how the result is presented to you.
Figure 24. Frame Size Distribution
Chapter 2. DatagLANce Planning and Installation 33
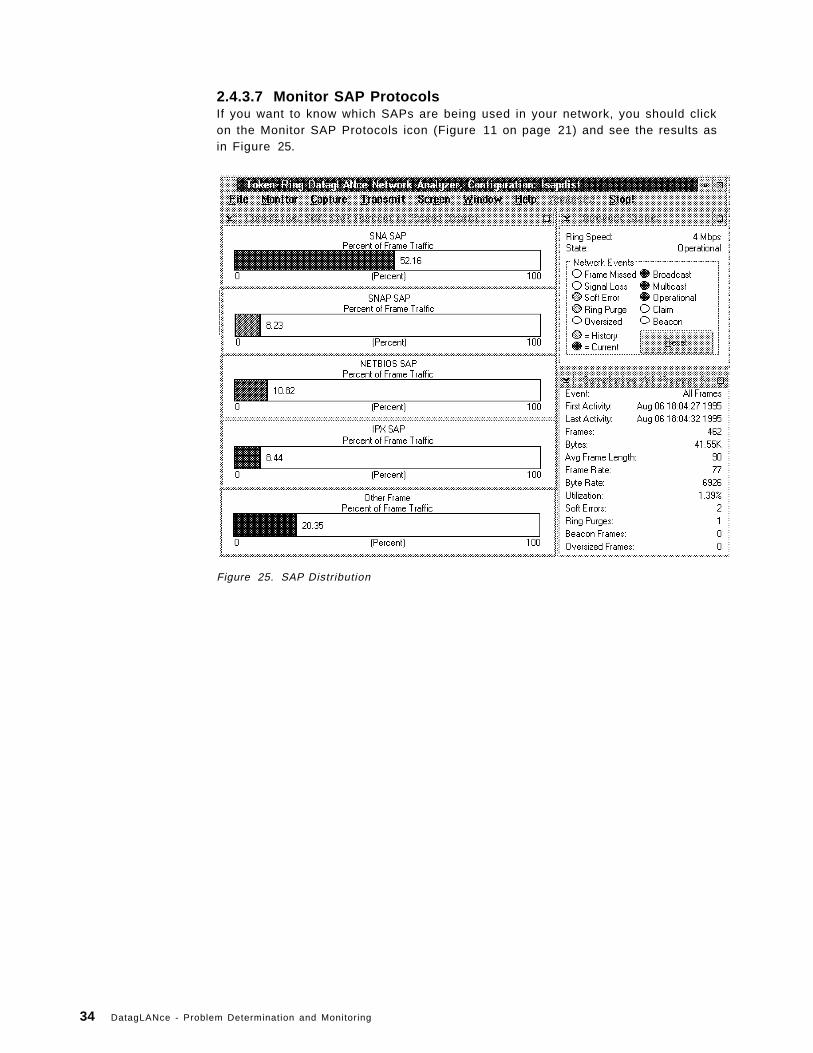
2.4.3.7 Monitor SAP ProtocolsIf you want to know which SAPs are being used in your network, you should clickon the Monitor SAP Protocols icon (Figure 11 on page 21) and see the results asin Figure 25.
Figure 25. SAP Distribution
34 DatagLANce - Problem Determination and Monitoring

2.4.3.8 Monitor Ethertype ProtocolsThe Monitor Ethertype Protocols function will display the distribution of Ethernetprotocols in your network. In Figure 26 you notice that almost seventy percentof the frames are other than Ethernet. This is not surprising since in thisparticular case we were connected to a token-ring segment.
To access this function just click on the Monitor Ethertype Protocols icon(Figure 11 on page 21).
Figure 26. Distribution of Ethertypes
Chapter 2. DatagLANce Planning and Installation 35

2.4.3.9 Monitor IP ProtocolsThe Monitor IP Protocols function shows you how selected IP protocols in yournetwork are distributed. As you can see in Figure 27, more than 84% of thetraffic in this network is other then TCP/IP traffic.
To access this function just click on the Monitor IP Protocols icon (Figure 11 onpage 21).
Figure 27. TCP/IP Frame Distribution
2.4.3.10 Monitor Routing HopsThis configuration monitors the source-routed traffic on your network bydisplaying a routing hop distribution. This distribution is displayed in eventwindows. These windows are displayed on the Source Routing Hop DistributionScreen (selected from the Screen menu).
Each Event window can be customized into a pop-up menu that lets you selectwhat to display on the window (using the right mouse button). The Event menulets you select which event to display in the window. The Format menu lets youselect the format in which to display statistics for the event. The Display menulets you select which statistics to display for the event.
Figure 28 on page 37 shows an example of this feature.
36 DatagLANce - Problem Determination and Monitoring

Figure 28. Hop Count Distribution
2.4.3.11 Monitor Protocol SuitesThis icon allows you to monitor the protocols of the traffic on your network bydisplaying a protocol suite distribution, for example IBM protocols, NetWare/XNSprotocols, TCP/IP protocols, DEC protocols, Apple Talk protocols. The protocolsuites to be monitored are configured by selecting Custom Events from theMonitor menu.
Chapter 2. DatagLANce Planning and Installation 37

2.4.3.12 Source-Routed Traffic AnalysisA number of Analysis Options will give you the distribution of traffic according tospecific criteria.
The Source-Routed Traffic Analysis icon utilizes the traffic analysis function ofthe DatagLANce to analyze source-routed frames. The traffic analysis option isconfigured by selecting Traffic Analysis option from the Monitor menu. TheTraffic Statistics window (see Figure 29) shows the results of the Traffic Analysisbeing done. This window tells you how much traffic is distributed between thedifferent segments.
Figure 29. Source-Routed Traffic Analysis
2.4.3.13 Protocol Traffic AnalysisThis configuration, shown in Figure 30 on page 39, utilizes the traffic analysisfunction of the DatagLANce to dynamically learn which protocols are being usedon the network.
The Traffic Statistics window shows the results of the traffic analysis being done.The protocol statistics for each protocol in use on the network are displayed inthis window. With this function you find out which are the major protocols inyour network, for instance, in our network nearly 40% of the frames were SNA,but they only represent 21% of the Bytes.
38 DatagLANce - Problem Determination and Monitoring

Figure 30. Protocol Traffic Analysis
2.4.3.14 Soft Error Traffic AnalysisThis configuration utilizes the Traffic Analysis function to monitor and classifysoft errors on the token-ring network.
This function will give you for each address the number of errors for each errortype selected using the Display option. Figure 31 on page 40 shows an exampleof this window. The following soft errors can be selected:
• Errors
• Ring Purges
• Beacons
• Line Errors
• Internal Errors
• Burst Errors
• A/C Errors
• Lost Frame Errors
• Receiver Congestion
• Frame Copied Errors
• Frequency Errors
• Token Errors
Chapter 2. DatagLANce Planning and Installation 39
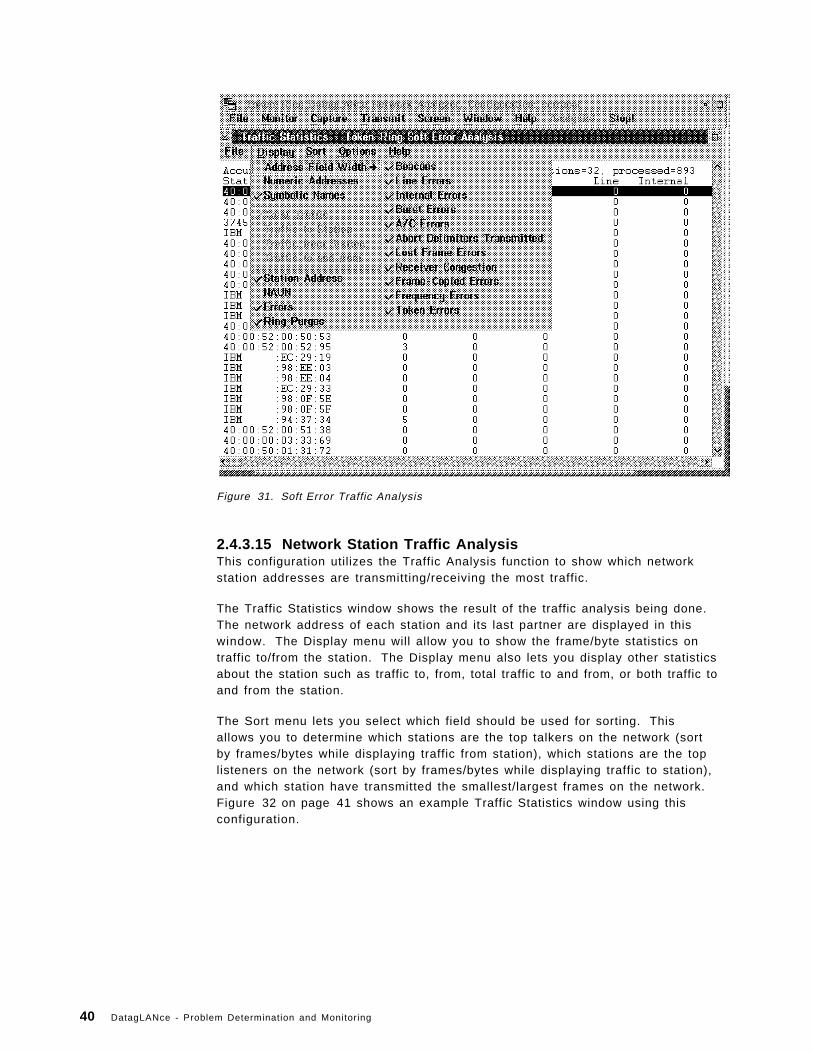
Figure 31. Soft Error Traffic Analysis
2.4.3.15 Network Station Traffic AnalysisThis configuration utilizes the Traffic Analysis function to show which networkstation addresses are transmitting/receiving the most traffic.
The Traffic Statistics window shows the result of the traffic analysis being done.The network address of each station and its last partner are displayed in thiswindow. The Display menu will allow you to show the frame/byte statistics ontraffic to/from the station. The Display menu also lets you display other statisticsabout the station such as traffic to, from, total traffic to and from, or both traffic toand from the station.
The Sort menu lets you select which field should be used for sorting. Thisallows you to determine which stations are the top talkers on the network (sortby frames/bytes while displaying traffic from station), which stations are the toplisteners on the network (sort by frames/bytes while displaying traffic to station),and which station have transmitted the smallest/largest frames on the network.Figure 32 on page 41 shows an example Traffic Statistics window using thisconfiguration.
40 DatagLANce - Problem Determination and Monitoring

Figure 32. Network Station Traffic Analysis
2.4.3.16 DLC Station Traffic AnalysisThis configuration utilizes the traffic analysis function of the DatagLANce to showwhich DLC station addresses are transmitting/receiving the most traffic. TheTraffic Statistics window (see Figure 33 on page 42) shows the results of thetraffic analysis being done. The DLC address of each station and its last partnerare displayed in this window.
The Display menu will allow you to show the frame/byte statistics on trafficto/from the station. This configuration differs from Network Station TrafficAnalysis by showing network addresses rather than DLC addresses for toptalkers, top listeners, and so on.
Chapter 2. DatagLANce Planning and Installation 41

Figure 33. DLC Station Traffic Analysis Window
2.4.3.17 Protocol MatrixThis configuration utilizes the traffic analysis function of the DatagLANce to showwhich protocols are being used on the LAN and which network addresses arecommunicating the most.
The Traffic Statistics window (see Figure 34 on page 43) shows the results of thetraffic analysis being done. The network address of each station and its partnerare displayed in this window. The Display menu allows you to show the majorprotocols (for instance, TCP/IP) and minor protocols (for instance, SNMP) beingused. Since multiple protocols may be used between two stations, there may bemultiple table entries in the protocol matrix table for each pair of networkaddresses.
The Display menu also lets you display other statistics about the communicatingstations, such as traffic to, from, both, or total traffic between stations. Frameand byte statistics are also available for display from this menu.
The Sort menu lets you select which field should be used for sorting. Thisallows you to determine which two stations are sending the most frames/bytesbetween themselves using a particular major protocol on the network (sort byframes/bytes), which protocols are being spoken on the network (sort bymajor/minor protocol), and which stations a specific station is speaking with (sortby station/partner network address).
42 DatagLANce - Problem Determination and Monitoring
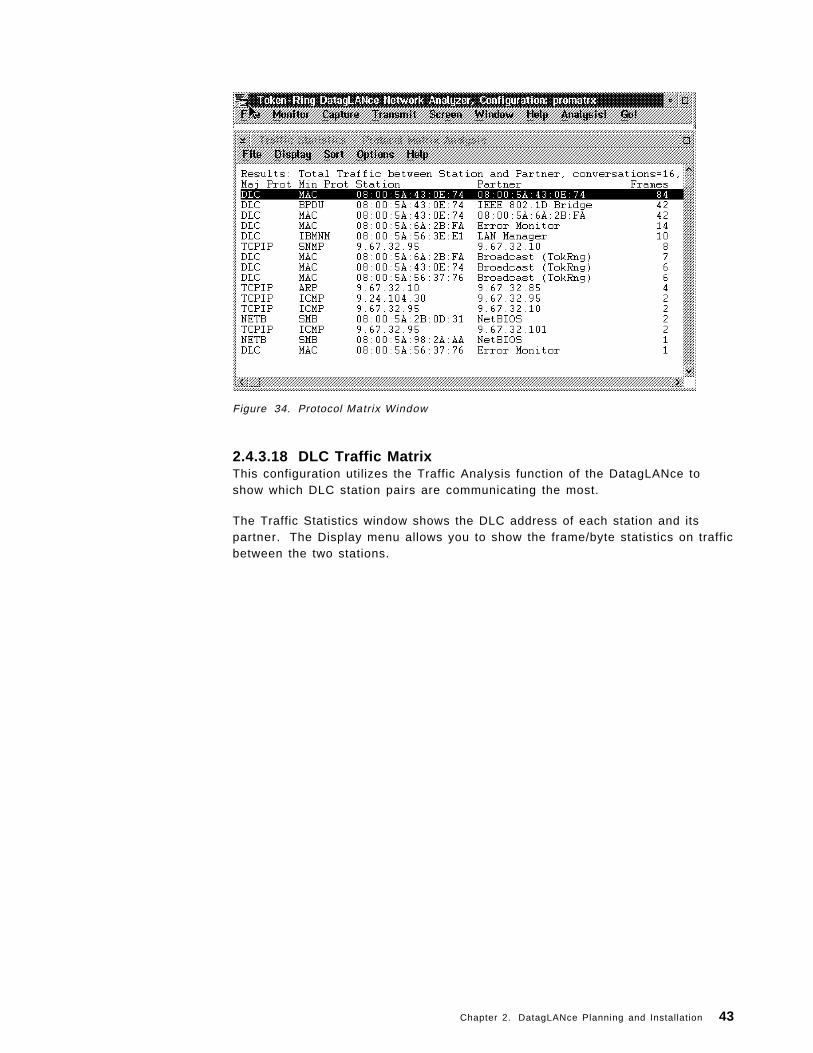
Figure 34. Protocol Matrix Window
2.4.3.18 DLC Traffic MatrixThis configuration utilizes the Traffic Analysis function of the DatagLANce toshow which DLC station pairs are communicating the most.
The Traffic Statistics window shows the DLC address of each station and itspartner. The Display menu allows you to show the frame/byte statistics on trafficbetween the two stations.
Chapter 2. DatagLANce Planning and Installation 43

Figure 35. DLC Traffic Matrix Window
2.4.4 Ethernet DatagLANce IconMost of the icons in this window are the same as those in the token-ringDatagLANce window. Obviously there is no ring map in Ethernet.
44 DatagLANce - Problem Determination and Monitoring

Chapter 3. Problem Determination Using DatagLANce
Even though LAN problem determination is based on experience, knowledge ofdifferent products and protocols, and common sense, this chapter will providesome basic guidelines that can be used in several problem determination cases.This approach will be described in order to use DatagLANce efficiently whendoing problem determination.
This chapter will also provide a few sample cases of doing problemdetermination using DatagLANce.
3.1 Get an Overall View of the SituationDatagLANce can be used in problem determination in different ways, forinstance:
• Identifying operational failures
• Assessing the health of the network, current design and implementation
• Detecting performance bottlenecks
• Determining sources of LAN problems
• Analyzing traffic patterns and characteristics
When confronted with a problem at a customer site, try to get an overall view ofhow the network is organized. Get a topology drawing of the network or createone. You also will need to know the addresses of servers, gateways andbridges.
3.1.1 The Problem DescriptionYou should understand what is the customer interpretation of the problem, butbe aware that an interpretation of a problem is a working hypothesis until thereis a confirmation of it. Therefore, do not apply filters to your capturing from thebeginning of your investigation. You could miss crucial information.
There is a performance aspect if applying filters when capturing: DatagLANceneeds a powerful machine. Capturing frames and simultaneously applyingseveral filters to your capture will slow down the machine, and you could misssome frames. Valuable information could be lost because of this.
3.1.2 Start with a Broad Perspective, Narrow Your Search LaterIt is useful to somewhat broaden the information that you received at thebeginning of your search. Some of the analysis and monitor functions canprobably help with this. Before going into details, try to get answers to thefollowing questions:
• What are peak hours?
• What are the protocols being used?
• What is the load on the network?
• Which stations generate most traffic?
• What is the average hop-count?
Copyright IBM Corp. 1995 45

• Who are the top talkers?
3.1.3 Identify the Failing ComponentNetworks are built with many different components coming from differentmanufacturers. It is unlikely that one person or even a team could gatherenough information on every single component or protocol and be able toidentify errors in customization or function. If you randomly start tinkering withdifferent elements at the same time, this will soon become a trial-and-errorapproach with only very accidental success. Don′ t waste valuable time. UsingDatagLANce to analyze the situation is more productive. Once you have learnedto use DatagLANce, you will soon be able to locate the component that causesthe trouble. You can then call in the specialist for that particular part.
Several approaches are possible. You could start looking at errors on thephysical layer first, and if that layer is clear, move up to find errors in the MAC,DLC layer. Look at the network layer afterwards, application layer moving upthe stack.
3.1.4 LAN Doctor ServicesIf your business relies on the availability and performance of your network, thenetwork should be considered as a global system and all the aspects of systemsmanagement should be in place.
Often procedures exist for mainframes but they tend to be forgotten for the LAN,yet an unplanned outage of the network will cause as much harm in thecompany as an outage of the good old CPU.
Often your own staff is very busy with new implementations or fire fighting andhas no time to set up an operational analysis of your network. However this isthe basic information to predict the impact of changes or new implementationson your network.
LAN Doctor Services can provide help in different fields:
• LAN Problem Source Identification
• LAN Traffic Analysis
• Bridge/Router Performance Analysis
• NetWare Server Inventory and Traffic Analysis
• OS/2 LAN Server Domain Inventory
IBM provides these services through certified LAN Doctor specialists. The localLAN Doctor will consult with LAN Analysis experts from the LAN Services Teamin Raleigh, North Carolina who will provide a comprehensive analysis of yournetwork. Going through this exercise, your own staff will enhance their skillsthrough a better understanding of the operational characteristics of your networkand will also acquire a methodology for solving problems.
46 DatagLANce - Problem Determination and Monitoring

3.2 DatagLANce and Problem Determination - Case StudyOn the following pages we documented a few sample cases, that begin withcustomer situations. Using DatagLANce, we presented how we came to aconclusion on what the problem was.
A simple step-by-step procedure is shown how to analyze the problem.
3.2.1 Inconsistent PerformanceIn this sample case the customer has a backbone Ethernet with two NetWareservers, W and X. There is also a client station on this backbone and a CiscoRouter. Via a Vitalink Bridge, the backbone is linked to a remote Ethernet,containing servers Y and Z.
Figure 36. Network Layout Oil Company
Transferring a specific file from W to X takes 6 seconds; transferring the samefile from Y to X takes 140 seconds; and from Y to Z the transfer takes 282seconds. The customer has no explanation for these differences, and is worriedabout possible future performance degradation. We will go through the differentDatagLANce screens and demonstrate how we could find an explanation tothese differences in response time.
The customer gave us the addresses of the following stations:
client 0000C07E212B
serverW 00001B151344
serverX 00001B151346
serverY 00001B1511D4
serverZ 00001B161414
Chapter 3. Problem Determination Using DatagLANce 47
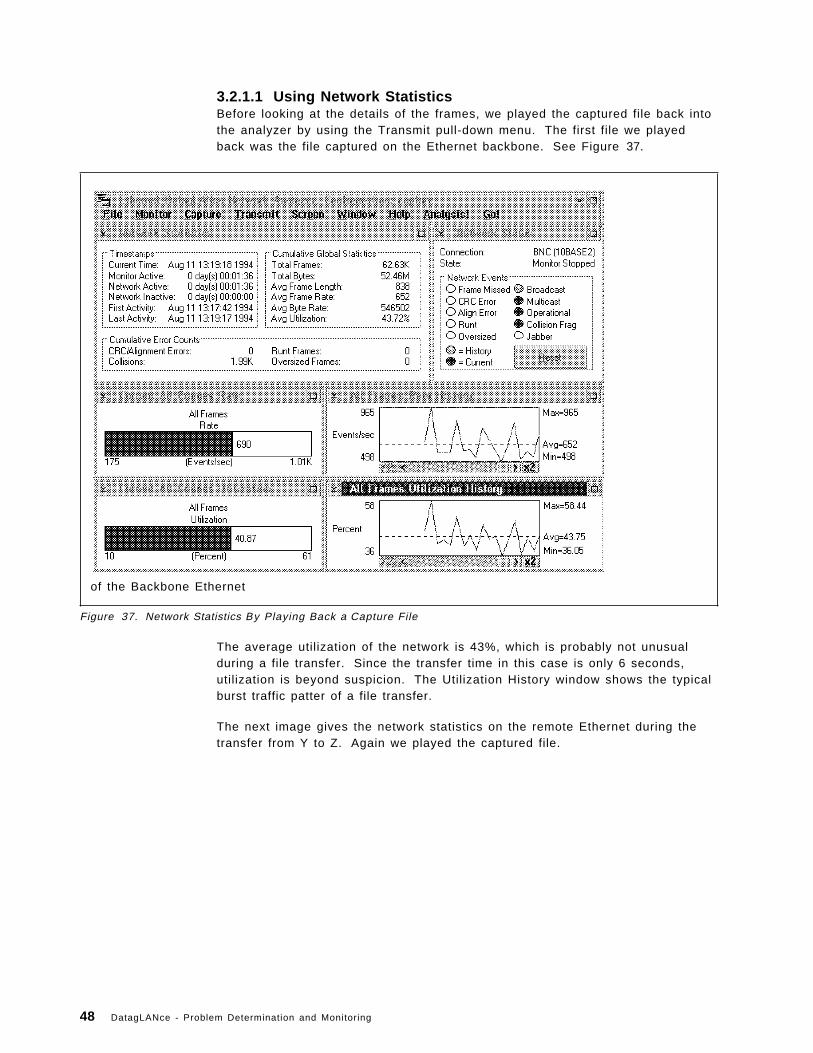
3.2.1.1 Using Network StatisticsBefore looking at the details of the frames, we played the captured file back intothe analyzer by using the Transmit pull-down menu. The first file we playedback was the file captured on the Ethernet backbone. See Figure 37.
of the Backbone Ethernet
Figure 37. Network Statistics By Playing Back a Capture File
The average utilization of the network is 43%, which is probably not unusualduring a file transfer. Since the transfer time in this case is only 6 seconds,utilization is beyond suspicion. The Utilization History window shows the typicalburst traffic patter of a file transfer.
The next image gives the network statistics on the remote Ethernet during thetransfer from Y to Z. Again we played the captured file.
48 DatagLANce - Problem Determination and Monitoring

Figure 38. Network Statistics on the Remote Ethernet
Although the transfer in this case takes a 286 seconds for the same file, theaverage utilization of the segment is only 0.35%, so there has to be anotherexplanation for the slow transfer times.
One possible explanation for poor transfer times could be the quality of theEthernet segments, so we displayed this screen to find out.
From the Screen pull-down menu, we looked at Network Errors. As you can seein Figure 39 on page 50 there are no errors of any kind. The explanation for thedelay must be somewhere else.
Chapter 3. Problem Determination Using DatagLANce 49

Figure 39. Network Errors on Remote Ethernet
3.2.1.2 Captured File AnalysisOne other option is to look at the captured files of the local Ethernet backboneand the remote Ethernet. Figure 40 on page 51 shows the Frame Analysiswindow for the local Ethernet backbone.
50 DatagLANce - Problem Determination and Monitoring

Figure 40. Frame Summary at Backbone Ethernet
The way this information is presented on the screen, there is little usefulinformation that you can get out of it. Remember that the file was captured in anEthernet environment and that the addresses are noted in canonical form. Tochange this address format display, just click on Preferences from the File menuoption and choose the Canonical format. Figure 41 on page 52 shows thescreen to define the address format.
Chapter 3. Problem Determination Using DatagLANce 51

Figure 41. User Preferences
3.2.1.3 Using Symbolic NamesYou will recognize some of the addresses now, but we can make our analysis alittle bit easier using the symbolic name facility.
From the same File menu option, click on Edit Symbolic Names. You can nowadd names for relevant stations in the network rather than working withaddresses. From the Display menu option, click on Display Symbolic Names andthe information on your screen becomes more comprehensive. Look at theresult in Figure 42 on page 53.
52 DatagLANce - Problem Determination and Monitoring

Figure 42. Frame Summary with Symbolic Names
3.2.1.4 Using FiltersSince load on the remote Ethernet segment is not the cause of our trouble, theframes from other machines on the network are irrelevant for our search at thispoint.
To display data just between the workstations that we want to monitor can bedone by clicking on the Search menu option and then Display Filter. At this pointnone of the filter equations should be in use. They would be marked by an IF,AND, or AND NOT flag, when used. Figure 43 on page 54 shows an example ofthis screen.
Chapter 3. Problem Determination Using DatagLANce 53

Figure 43. Defining Event Detectors
To set up a filter you can click on the first Event Detector. Our search will bebased on DLC Address pairs, because that is the information we have. Thepull-down option on the event field gives you the possibility to define differentfilters using, for example:
• Specific Protocols
• Frame Data Patterns
• Source Routing Indicators
• Ethernet Frames
• 802.3 Frames
Figure 44 on page 55 shows an example of how to use the event detector.
54 DatagLANce - Problem Determination and Monitoring

Figure 44. Search on DLC Address Pairs
Figure 45 on page 56 shows an example of the specific frame formats screenthat can be used.
Chapter 3. Problem Determination Using DatagLANce 55

Figure 45. Some Formats and Protocols That Can Be Filtered Out
To configure an Event Detector using Destination/Source Address Pairs, you canuse the following procedure:
1. Click on Configure for the Label field. 2. Clear the Address Pair List that could be left in there from a previous
definition. 3. Put the client in the Source field by clicking on the From push button. 4. In the same way, put Any DLC Station in the Dest field. 5. Clicking on Add wil l put this first address pair in the event detector list. 6. Switching this address pair around (clicking on Switch button), and adding it
too, we have defined an event detector that shows us all traffic, from and tothe client.
Figure 46 on page 57 shows an example screen to configure Destination/SourceAddress Pair.
Other event detectors will be documented in further examples.
56 DatagLANce - Problem Determination and Monitoring

Figure 46. DLC Address Pairs
Seeing the traffic to and from the client station gives us only part of theinformation. In this case you could also want to add the traffic to and from thedifferent servers.
To perform this filtering, in our example we edited the second and third eventdetector to enable the traffic to and from server W and server X.
To combine these three event detectors into a filter we used the followingprocedure:
• Enable the first Event Detector with an IF statement
• Click the OK button
• Find the OR push button on the Display Filter Equation window.
• Click on this OR push button and select a second or third event detector byputting an IF in front of it.
• Click on OK and check the Enable check-box in the Display Filter Equationwindow as shown in Figure 47 on page 58.
Chapter 3. Problem Determination Using DatagLANce 57

Figure 47. Combining Event Detectors
After performing this filtering, you can scroll down the Frame Summary screenand easily find where the session was set up between the client and the serverW. Displaying the size of the frames and relative time, you can see that oncethe session is set up, a file transfer is going on with 1082 byte frames fromserver W to the client with acknowledgement frames of 68 bytes. From theFrame Detail Window in Figure 48 on page 59 we can see the name of the filebeing opened.
58 DatagLANce - Problem Determination and Monitoring
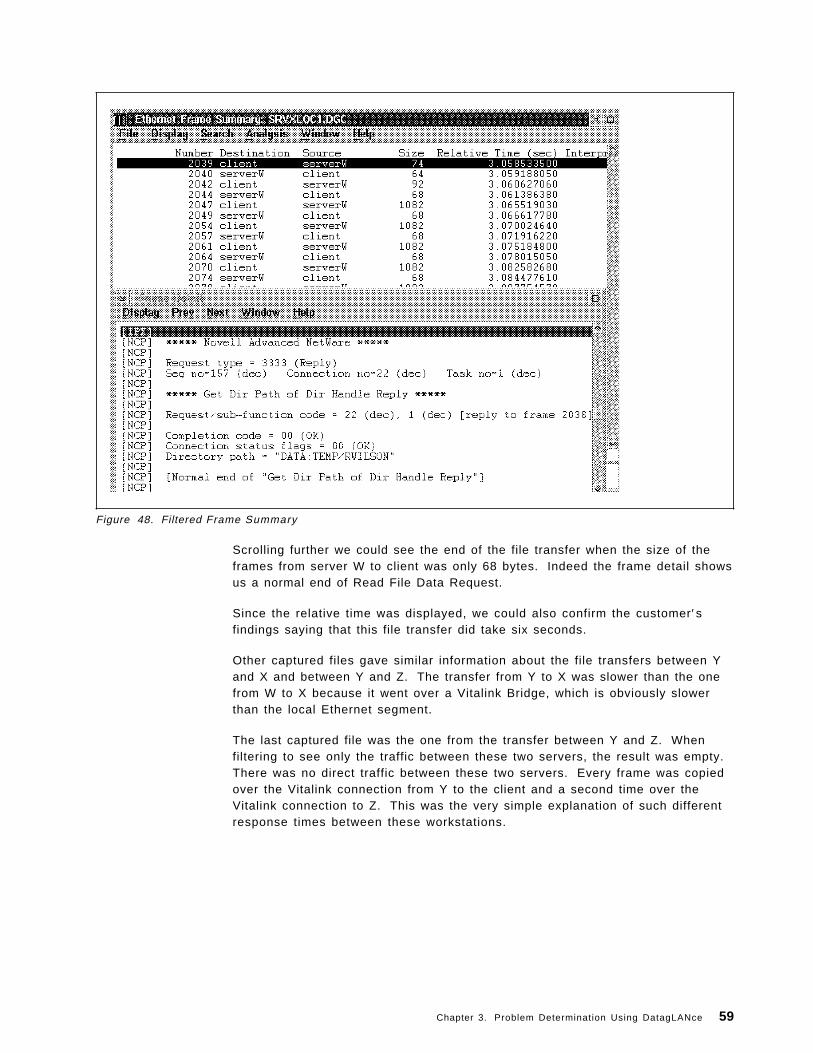
Figure 48. Filtered Frame Summary
Scrolling further we could see the end of the file transfer when the size of theframes from server W to client was only 68 bytes. Indeed the frame detail showsus a normal end of Read File Data Request.
Since the relative time was displayed, we could also confirm the customer′sfindings saying that this file transfer did take six seconds.
Other captured files gave similar information about the file transfers between Yand X and between Y and Z. The transfer from Y to X was slower than the onefrom W to X because it went over a Vitalink Bridge, which is obviously slowerthan the local Ethernet segment.
The last captured file was the one from the transfer between Y and Z. Whenfiltering to see only the traffic between these two servers, the result was empty.There was no direct traffic between these two servers. Every frame was copiedover the Vitalink connection from Y to the client and a second time over theVitalink connection to Z. This was the very simple explanation of such differentresponse times between these workstations.
Chapter 3. Problem Determination Using DatagLANce 59

3.2.2 SNA Session DisconnectA second example is in a token-ring environment with several segments. Wehave a 3745 connected to segment 62 and a workstation connected to segment60. A Cisco router is source-routing the two segments via a virtual segment 63.Figure 49 shows this configuration.
Figure 49. SNA Session Disconnect
The customer is experiencing session disconnections on a number ofworkstations. He provided captured files that were taken on both segments. Wealso have the addresses of the 3745 and the workstation.
3745 400001026054
Workstation 400012000000
60 DatagLANce - Problem Determination and Monitoring

3.2.2.1 Network StatisticsIn order to get an overall view of what was happening, we played back thecaptured files (segment 62 and 60) into DatagLANce by clicking on the PlaybackInto Analyzer option from the Transmit menu option.
On segment 62 we had an average utilization of less than 1%. The NetworkErrors panel showed no errors of any kind.
The Network Statistics panel for segment 60 in Figure 50 shows an averageutilization of 82%.
Figure 50. Network Statistics on Segment 60
3.2.2.2 Network ErrorsDuring this playback, we noticed that the red lights for Ring Purge and SoftErrors went on a little too often. Therefore, displaying the Network Errorsscreen, we had the errors recorded as shown in Figure 51 on page 62. softerrors and ring purges were continuously reported.
Chapter 3. Problem Determination Using DatagLANce 61

Figure 51. Network Errors on Segment 60
3.2.2.3 Using FiltersGoing back to the segment 62, we then started setting up some filters to displayjust the conversation between the workstation and the 3745. A second EventDetector was also added for MAC Frame using the Or button on the FilterEquation window. The SMP (Standby Monitor Present frames) were not useful inthis analysis and was left out. The MAC filter definition used in this example isshown in Figure 52 on page 63.
62 DatagLANce - Problem Determination and Monitoring

Figure 52. Filter for MAC Protocols
To proceed in our analysis, we used a normal SNA session flow as an example.Figure 53 on page 64 shows the captured file with a normal SNA session.
DatagLANce differentiates the LLC frames from the data frames by giving themdistinct colors on your screen. In this figure you can also see the NR valueincreasing for each frame being sent between the partners.
Chapter 3. Problem Determination Using DatagLANce 63

Figure 53. Frame Summary Segment 60
We looked now at the frame summary for segment 62.
Comparing the two situations, when it was applied the same filters in both framesummary analysis, the LLC information for the second case showed repeatedrequest for the frames number 13 and 14.
Where we expected a data frame after the polling frames, we did see a ringpurge, and the MAC information reported a soft error. The detail of this errorshows that a frame is lost. Look at the Frame Detail window in Figure 54 onpage 65 for more details.
64 DatagLANce - Problem Determination and Monitoring

Figure 54. Frame Summary Segment 62
Scrolling further down the file we see the same error several times.
There are no line errors and there is no beaconing on segment 62. Ourconclusion here is that we have to take a closer look at the Cisco router. Sincering utilization is higher than 60%, threshold values for Cisco may have beenexceeded.
Chapter 3. Problem Determination Using DatagLANce 65
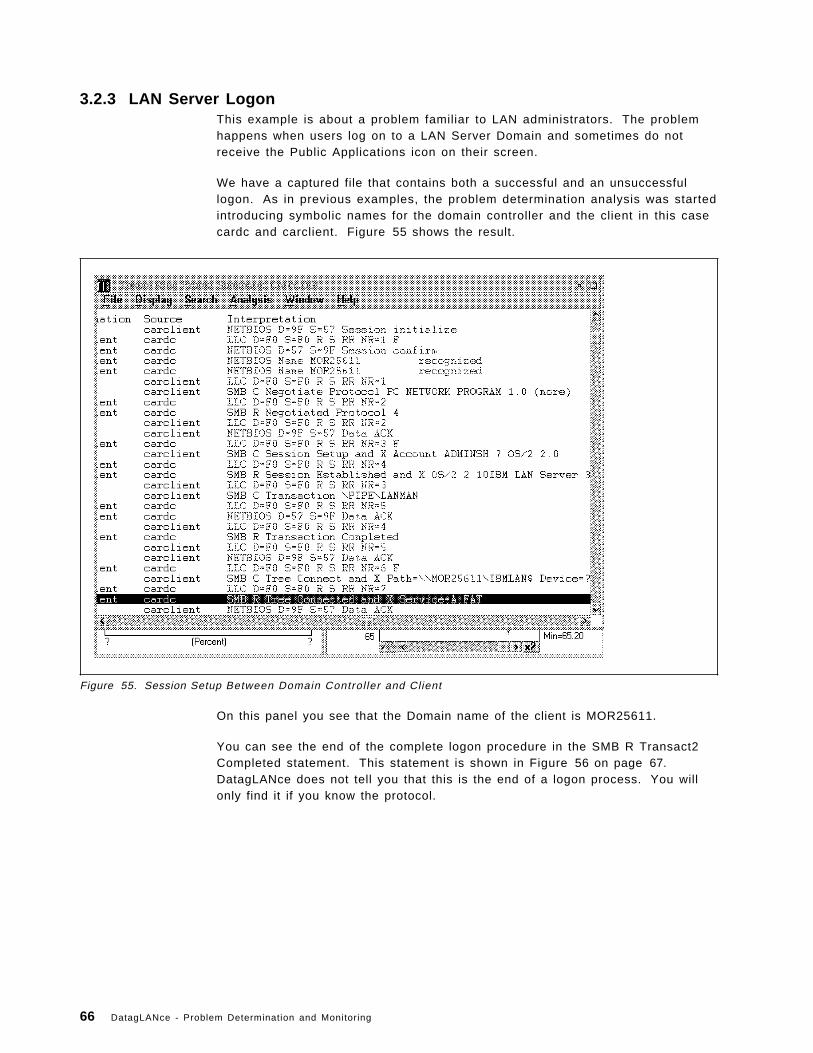
3.2.3 LAN Server LogonThis example is about a problem familiar to LAN administrators. The problemhappens when users log on to a LAN Server Domain and sometimes do notreceive the Public Applications icon on their screen.
We have a captured file that contains both a successful and an unsuccessfullogon. As in previous examples, the problem determination analysis was startedintroducing symbolic names for the domain controller and the client in this casecardc and carclient. Figure 55 shows the result.
Figure 55. Session Setup Between Domain Control ler and Client
On this panel you see that the Domain name of the client is MOR25611.
You can see the end of the complete logon procedure in the SMB R Transact2Completed statement. This statement is shown in Figure 56 on page 67.DatagLANce does not tell you that this is the end of a logon process. You willonly find it if you know the protocol.
66 DatagLANce - Problem Determination and Monitoring

Figure 56. End of Successful Logon
We found the second session setup close to the bottom of the captured file. Thedifference was that we didn′ t see the SMB R Transact 2 Completed statement.
Remember that we had filtered the frames between the domain controller andthe client. An experienced LAN Administrator knows that a logon can also behandled by a backup domain controller, but at this time we didn′ t have the DLCaddress of the backup domain controller. Our customer did not give us theinformation.
In the following figures we will show you how we got the information in this case.
Figure 57 on page 68 shows how to define a filter to discover frames related tothe NetBIOS name of the client (CAY02809). The NetBIOS name of the client wasfound using the NetBIOS details of the frame that says NetBIOS Namerecognized (see Figure 55 on page 66). When you double-click on that frame,just go to the lines that are green and find the NetBIOS names of the domaincontroller and the client.
Chapter 3. Problem Determination Using DatagLANce 67
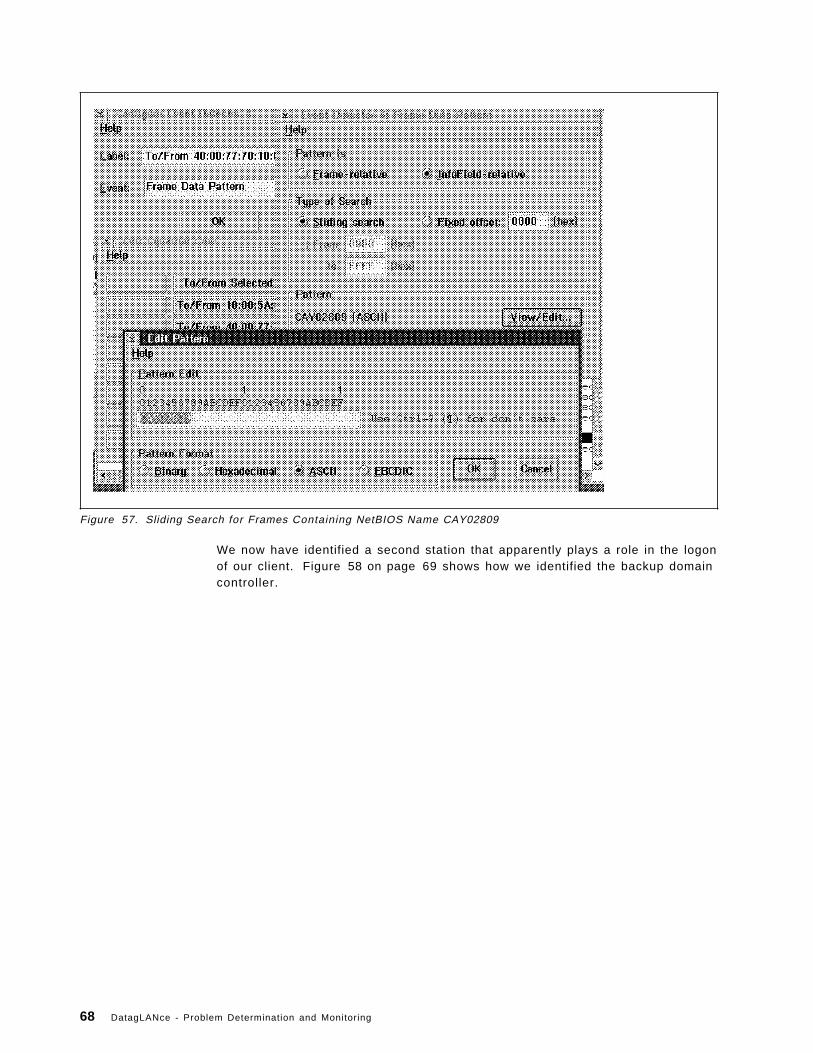
Figure 57. Sliding Search for Frames Containing NetBIOS Name CAY02809
We now have identified a second station that apparently plays a role in the logonof our client. Figure 58 on page 69 shows how we identified the backup domaincontroller.
68 DatagLANce - Problem Determination and Monitoring

Figure 58. Identifying the Backup Domain Control ler
To complete our search, we had to add a third event to our filter looking for alltraffic between this station and our client.
We added a filter equation to the previous one by an OR statement. Looking atthe frames, we now see how the backup domain controller with NetBIOS NameMOR25613 and DLC address 400009661003 takes care of the logon process.Figure 59.
Figure 59. Logon Process Backup Domain Control ler
Chapter 3. Problem Determination Using DatagLANce 69

The next step is to know the result of this logon process and to find it we defineda search for the text string Transact2 as in Figure 60.
Figure 60. Find Text Window for Transact2 Statement
Note: Make sure that you search also the frames that did not pass the filter byde-selecting the Filtered Frames Only push button.
In Figure 61 on page 71 you see that the Transact2 failed, and the Frame Detailswindow gives you the specific return code.
70 DatagLANce - Problem Determination and Monitoring

Figure 61. Logon Process Backup Domain
3.2.3.1 ConclusionIn several steps we have found that the failing logon was between the client andthe backup domain controller. This is where the analysis with DatagLANce willstop. We can now contact the LAN administrator and ask him to verify the setupand definitions of the backup domain controller.
Chapter 3. Problem Determination Using DatagLANce 71

3.2.4 Locating Physical Layer ProblemsThe Token-Ring Network Architecture Reference describes the Ring StatusSubvector in great detail. When this 2-byte subvector has a value of zero, thismeans that there are no hard-error conditions on the token-ring. Non-zerovalues refer to temporary or permanent beaconing conditions.
With this knowledge and using DatagLANce, you can find out whether there areany problems with cabling or other hardware. One of the captured files we wereworking on had line errors which we tried to isolate. We applied two eventdetectors to find all the line errors that were reported in this captured file. Thefirst passes all the frames that do not have a hexadecimal value of 00 in positionhex 14 of the frame. This is shown in Figure 62.
Figure 62. Event Detector for Line Errors
With the second we combined a second event detector with the first one,isolating all the frames being sent to the Ring Error Monitor. The Ring ErrorMonitor is the destination address for every Soft Error frame. You can see thisin Figure 63 on page 73.
72 DatagLANce - Problem Determination and Monitoring

Figure 63. Event Detector for Frames Sent to the Ring Error Monitor
When this event detector is applied in combination with the first one, we get allthe line errors that have been reported. Checking the frame details and usingthe Ring Map information it is then possible to know which part of the cabling orthe hardware needs to be reviewed in more detail.
In our case every frame pointed to the same NAUN which is IBM:E8:67:CB, asshown on the Frame Detail window in Figure 64 on page 74.
Chapter 3. Problem Determination Using DatagLANce 73

Figure 64. Logon Process Backup
74 DatagLANce - Problem Determination and Monitoring

Chapter 4. Using DatagLANce to Monitor the LAN Environment
In this chapter we will discuss monitoring a LAN environment using DatagLANce.We will discuss why you would monitor, what you will see, and give somemonitoring examples.
4.1 What is Monitoring?When monitoring a LAN environment, you are watching the activity on thenetwork with a specific purpose. That purpose could be a service levelagreement for the availability of the network to add a new functions orresources, a problem you are trying to isolate, or you may just want to knowwhat is happening on the network.
To be most effective, it is best to have a starting point or baseline. How busy isthe LAN normally? What protocols are used? Who are the top users? Theanswer to these questions can help when monitoring because you can use themto set thresholds and identify changes that could take place.
4.2 Considerations for MonitoringRemember to keep a system view in mind when monitoring. Drawing a simplediagram or looking at a network diagram can help to keep things in perspective.There are many components and they all need to be working together. If younarrow your view too much you may miss data that is relevant.
Some questions you may want to ask yourself as you draw your diagram are:
• Is there more than one segment?• How are the segments connected (bridge, router, gateway)?• What is connected to the network?• What topology is used?• What traffic should I be seeing?• What protocols should I be seeing?
When you are monitoring a LAN using DatagLANce, you want to capture asmuch of the information as possible from the network. Using filters should beavoided whenever possible. If you are monitoring and keeping only thestatistics, the amount of disk space required is modest.
Also keep in mind where you are inserting your DatagLANce machine into thenetwork. You may need to monitor from more than one location, especiallywhen multiple segments are involved. If you need to monitor from more thanone location, ideally you should have multiple machines or connections. Whenusing multiple monitors, ensure they are synchronized, either with the timestamp or a specific event.
Copyright IBM Corp. 1995 75
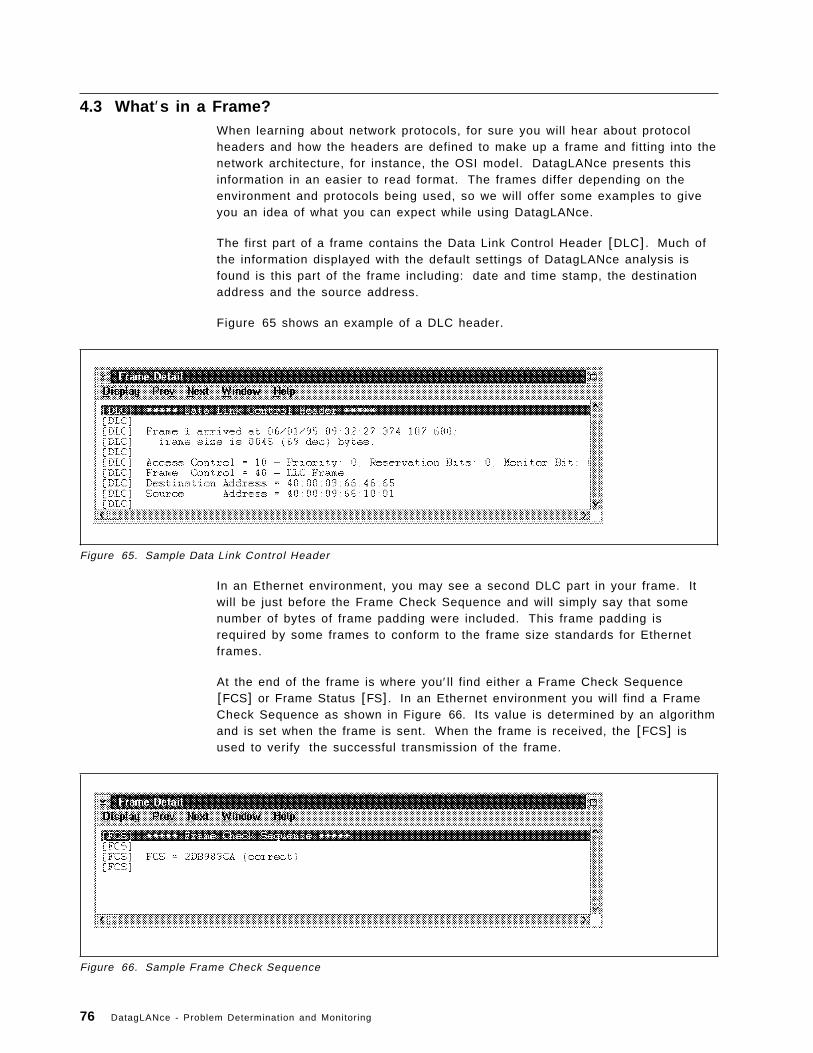
4.3 What ′s in a Frame?When learning about network protocols, for sure you will hear about protocolheaders and how the headers are defined to make up a frame and fitting into thenetwork architecture, for instance, the OSI model. DatagLANce presents thisinformation in an easier to read format. The frames differ depending on theenvironment and protocols being used, so we will offer some examples to giveyou an idea of what you can expect while using DatagLANce.
The first part of a frame contains the Data Link Control Header [DLC]. Much ofthe information displayed with the default settings of DatagLANce analysis isfound is this part of the frame including: date and time stamp, the destinationaddress and the source address.
Figure 65 shows an example of a DLC header.
Figure 65. Sample Data Link Control Header
In an Ethernet environment, you may see a second DLC part in your frame. Itwill be just before the Frame Check Sequence and will simply say that somenumber of bytes of frame padding were included. This frame padding isrequired by some frames to conform to the frame size standards for Ethernetframes.
At the end of the frame is where you′ ll find either a Frame Check Sequence[FCS] or Frame Status [FS]. In an Ethernet environment you will find a FrameCheck Sequence as shown in Figure 66. Its value is determined by an algorithmand is set when the frame is sent. When the frame is received, the [FCS] isused to verify the successful transmission of the frame.
Figure 66. Sample Frame Check Sequence
76 DatagLANce - Problem Determination and Monitoring
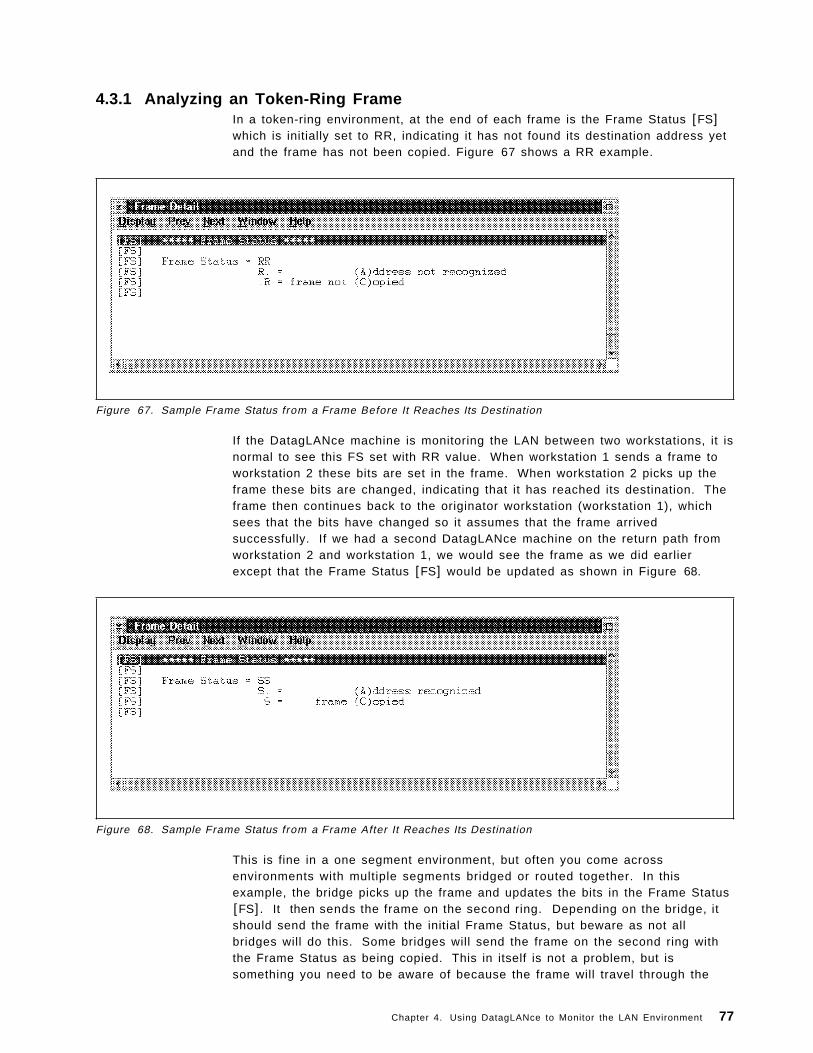
4.3.1 Analyzing an Token-Ring FrameIn a token-ring environment, at the end of each frame is the Frame Status [FS]which is initially set to RR, indicating it has not found its destination address yetand the frame has not been copied. Figure 67 shows a RR example.
Figure 67. Sample Frame Status from a Frame Before It Reaches Its Destination
If the DatagLANce machine is monitoring the LAN between two workstations, it isnormal to see this FS set with RR value. When workstation 1 sends a frame toworkstation 2 these bits are set in the frame. When workstation 2 picks up theframe these bits are changed, indicating that it has reached its destination. Theframe then continues back to the originator workstation (workstation 1), whichsees that the bits have changed so it assumes that the frame arrivedsuccessfully. If we had a second DatagLANce machine on the return path fromworkstation 2 and workstation 1, we would see the frame as we did earlierexcept that the Frame Status [FS] would be updated as shown in Figure 68.
Figure 68. Sample Frame Status from a Frame After It Reaches Its Destination
This is fine in a one segment environment, but often you come acrossenvironments with multiple segments bridged or routed together. In thisexample, the bridge picks up the frame and updates the bits in the Frame Status[FS]. It then sends the frame on the second ring. Depending on the bridge, itshould send the frame with the initial Frame Status, but beware as not allbridges will do this. Some bridges will send the frame on the second ring withthe Frame Status as being copied. This in itself is not a problem, but issomething you need to be aware of because the frame will travel through the
Chapter 4. Using DatagLANce to Monitor the LAN Environment 77

network in this fashion until it reaches its real destination. When placing yourDatagLANce machine on the network realize that you could get this FS field setas frame copied, but it isn′ t yet (depending of how the bridge works).
What comes between the Data Link Control Header and the Frame CheckSequence or Frame Status can vary considerably. In this first example shown inFigure 69 we have a NetBIOS frame used during a logon sequence. The firstpart of the frame is not shown, but contains the [DLC] information as shownearlier. Here we start with the Routing Information field [RI]. It is here that youwill see the direction the frame is going and the path it is taking.
If you are unsure of what LAN segments connect to your DatagLANce machine,and how the workstations are connected, you can start getting a good picturefrom this panel. In the Logical Link Control Header [LLC ] you can see that thisis a NetBIOS frame.
Figure 69. Sample Routing Information Field and Logical Link Control Header
After the NetBIOS section comes the SMB Negotiate Protocol Command section.It is there that the server and workstation decide the protocol to be used forcommunication between the two machines.
78 DatagLANce - Problem Determination and Monitoring

Figure 70. Sample NetBIOS and SMB from a Token-Ring Environment
This data will then be followed by the frame Status [FS] as you saw before,ending the frame.
Chapter 4. Using DatagLANce to Monitor the LAN Environment 79

Figure 71 shows a frame from an SNA session over a token-ring network. Youcan see in the [LLC ] that it is using the SNA protocol at this time. This isfollowed by the SNA Transmission Header and SNA Response Headerinformation, and, as with the other, the frame ends with the Frame Status.
Figure 71. Sample SNA Frame from a Token-Ring Environment
Now let′s take a look at a frame in an Ethernet environment.
4.3.2 Analyzing an Ethernet FrameFigure 72 on page 82 shows an example of an Ethernet frame being used.When looking at a frame from an Ethernet trace, remember that there could betwo types of frames: those that conform to the 802.3 standard and those thatconform to the Ethernet II standard. DatagLANce lets you know which Ethernetframe format is being used.
80 DatagLANce - Problem Determination and Monitoring

In the [DLC] section of the frame, there is a statement that tells you which typeof Ethernet frame you are looking at, so if you are unsure, DatagLANce makes itquite simple. In the sample frame, we are looking at a frame which conforms tothe 802.3 standard.
It is possible to have both formats present on the same network, however,machines using different standards will not be able to communicate with eachother.
The frame shown in Figure 72 on page 82 is taken from a trace on a LANrunning Novell NetWare. The format is different than what we saw in thetoken-ring frames in Figure 70 on page 79. The [RI] information is contained inthe IPX header. Although the frame keeps track of the number of hops it hastaken, we don′ t see the path as we did in the token-ring frame. In the [NCP]section we can see that a NetWare read file request is being issued. The framefinishes with a Frame Check Sequence as described earlier.
Chapter 4. Using DatagLANce to Monitor the LAN Environment 81

Figure 72. Sample Frame from an Ethernet Environment
As we saw, the sequence of frames as provided by the summary window oftenwill have as much information as you need to analyze each frame.
Remember to keep a global system view in mind.
4.4 When Do You Monitor?As mentioned earlier, it is important to establish a baseline for the LAN. Thebaseline is needed to get an understanding of what′s happening on the networkand is used in comparisons. You need to know what is normal, how much trafficis flowing over the network, what protocols are being used, the size of framesbeing transmitted, and so on. It is also helpful to know what a successful logonto the network looks, how it looks to get a successful host session connected, orwhat other common activities are occurring with their protocols format and flow.
82 DatagLANce - Problem Determination and Monitoring

The more familiar you are with your network, the easier it will be to spot achange or a problem.
4.4.1 Learning NamesThere are a group of icons in DatagLANce (for instance, under the token-ringDatagLANce group), that have been customized to monitor the network and lookfor the names being used by the different machines. These icons include:
• Learn Apple Talk Names• Learn DEC Names• Learn IPX Names• Learn TCP/IP Names• Learn IBM NetBIOS Names
The function of these programs is to listen to the traffic and maintain a list ofnames associated with the various addresses. These names can then be usedto replace the addresses in the traces. This can make the trace files easier toread when you are analyzing a problem. It is important to note however, whenyou create a .CSV file, the addresses will be in the file, not the names thatDatagLANce has discovered.
To use these functions, double- click on the icon for the type of names you wishto use. In Figure 73 we have selected the Learn TCP/IP Names icon. Byclicking on Go!, DatagLANce inserts itself into the network and starts monitoringthe frames.
Figure 73. Token-Ring DatagLANce Network Analyzer, Configuration: ipname Window
Chapter 4. Using DatagLANce to Monitor the LAN Environment 83

As DatagLANce works away, you will notice that the activity in the Current AllFrames Rate window and Current Captured Frames Rate window will bedifferent. This is because DatagLANce is filtering the frames that contain theinformation needed to learn the TCP/IP names.
In the Capture Status/Control window in the bottom right of Figure 73 onpage 83, you can see how many frames DatagLANce has been captured andhow full the buffer is. After giving DatagLANce some time to collect frames, clickon Stop! on the menu bar.
To set DatagLANce to interpret the names found from frames that have beencollected, click on Analysis from the menu bar. From the Token-Ring FrameSummary: ipnames.dgc window, click on the File option on the menu bar andselect Look for Symbolic Names. A verification window will pop up indicatingthat DatagLANce will insert the new names that were found. It will then searchthrough the frames and let you know how many new names it has found andthen update the window to reflect the symbolic names. Figure 74 shows thewindow using the symbolic names.
Figure 74. Token-Ring Frame Summary: ipnames.dgc Using Resolved Symbolic Names
These names have been saved by DatagLANce and will be used to makereading the trace files easier.
As you can imagine, these tables can become very large if you are using theDatagLANce machine in different networks. Also, there may be times when youare looking at a trace and entering your own symbolic names.
To update the list of symbolic names, you can click on the File pull-down optionon the token-ring Frame Summary window and select Edit Symbolic Names....Following this procedure you will get the Edit Symbolic Names window as shownin Figure 75 on page 85, where you can add, delete, or edit symbolic names.
84 DatagLANce - Problem Determination and Monitoring

Figure 75. Edit Symbolic Names Window
You can define symbolic names even after you have captured your trace file andyou are in the process of analyzing it.
4.4.2 Setting the BaselineTo establish a baseline, the Protocol Matrix icon supplied with DatagLANce is agood place to start. Using this function you can see what protocols are mostused, who are the top users, and the LAN utilization. p.The Monitor option fromthe menu bar contains two items we should look at:
• In the History Statistics option, as shown in Figure 76 on page 86, weindicate that we want to collect historical data. We can choose the frequencythat the data is collected, how many samples we want to collect, the name ofthe file, and the statistics we are interested in.
Chapter 4. Using DatagLANce to Monitor the LAN Environment 85

Figure 76. History Statistics Options from Protocol Matrix
• From the Traffic Analysis option, as shown in Figure 76, we can define thenumber of entries we want to collect to limit the size of the file. From thiswindow we can set a start and end time for the collection of data and thetype of analysis. We can also indicate if we want to have the informationrecorded and the name of the file.
86 DatagLANce - Problem Determination and Monitoring

Figure 77. Traffic Analysis Options from Protocol Matrix
When we click on Go! from the pull-down menu, DatagLANce will start using thedefined parameters. In our sample, we have chosen to start collecting dataimmediately, therefore DatagLANce will continue to collect data until we click onStop! from the pull-down, which will replace the Go! option when DatagLANce isstarted.
4.4.3 Reporting your FindingsAs you saw in Figure 76 on page 86 and Figure 77, there are two types of files(.HTX and .CSV) that can be recorded. When the contents of these files aredelimited, the files can easily be imported into a spreadsheet or database andbecome available to be used for the tools of your choice to get graphs andreports.
In the History Statistics Options window, if the Delimited Fields is not selected,the output in the file will be laid out like a table with spaces between thecolumns.
If you have started the Protocol Matrix and have not set the variables to collectthe data, once you choose Stop! you still can print the data. The limitation isthat you will only get the data that is currently in the buffer. To print the datayou have two options:
• You can choose File - Print from the Traffic Statistics Protocol MatrixAnalysis window, as shown in Figure 78 on page 88, and receive a printoutas the data is displayed. You can also choose to save the data in a file. Asa file you will get the file content delimited, therefore you can still import itinto another tool.
Chapter 4. Using DatagLANce to Monitor the LAN Environment 87

Figure 78. Print Window from Traffic Statistics - Protocol Matrix Analysis Window
• The other choice is to select File - Print Report from the menu bar. Fromthere you can choose different reports that you can print either to disk orprinter. These are summary reports and they cover a variety of topicsincluding network statistics, top talkers and the busiest stations. This isshown in Figure 79. For a complete list of the reports, please refer to theAppendix A, “Reports Produced by DatagLANce Protocol Matrix” onpage 123.
Figure 79. Print Report Window from Token-Ring DatagLANce Network Analyzer, Configuration: promatrx
4.4.4 Monitoring for ModellingWhen you are collecting data for a modelling exercise, there are two categoriesof information you need:
1. The first category is to understand the configuration of the network: thetopology, segments, types of machines, and protocols.
2. The second category is to get information about the traffic: knowing the typeof traffic, the routes it is taking, the load, and the major and minor protocols.
By taking traces with DatagLANce you can gather the data you need to get theinformation you require for your model. The example that follows can be used toconfigure DatagLANce appropriately to get the right data.
If you are looking at adding a new application to an existing network, you couldset up the application on certain machines and only monitor those addresses. Inthis case it would be best to have a script with the activities being performed
88 DatagLANce - Problem Determination and Monitoring

and the times so that you can relate the traffic to specific events. With this data,you can figure out the impact the new application will have on the network as itis made available to more users.
So, to collect the data to use in a modelling exercise you could use the followingprocedure:
1. Choose the Traffic Analysis Options from Monitor pull-down on the menu bar.The menu in Figure 80 appears where you can set important options to buildthe matrix.
The following is a brief description of the fields on this window.
Figure 80. Traffic Analysis Options Window
• The Enable Traffic Analysis Processing check box at the top of the TrafficAnalysis Options window enables the traffic analysis function.
• The only for event check box, also at the top of this window allows you tochoose one of the custom events (as configured in the Custom Eventspull-down) that will be used to filter the traffic.
• The Table Entries field specifies the maximum number of table entriescreated whenever you have a conversation between a pair of stations inthe network. As you know, you might have many frames flowing fromstation A to station B and vice versa.
The value in the Table Entries field depends on very much on your traffic.You can set from 509 entries up to 65533 entries in that table. We did atest where we placed 509 table entries in a very busy token-ring networkand we started the measurement. When the number of conversationscame to 408, DatagLANce warned that 80% of the table was full. Whenthis number reached 509, DatagLANce warned the table was full, but didnot stop updating the number of frames and bytes for these 509
Chapter 4. Using DatagLANce to Monitor the LAN Environment 89

conversations. Also, DatagLANce stopped creating new entries in thistable (as it was supposed to do). Because of that, some frames weredropped.
• The Notify if table filled or frames dropped check box will setDatagLANce to notify when the table becomes full or frames aredropped.
• The Sample Interval box represents the amount of time that DatagLANceaccumulates data before it records the traffic statistics. The value UntilStopped indicates that DatagLANce accumulates and then writesstatistics to disk when the monitor is stopped.
For instance, you can set this interval to 10 minutes, and allowDatagLANce to run for 8 hours (total of 48 intervals). With thisspecification you can see how traffic distribution is during the day andthen find the peak hour by checking the number of frames at the headersof each interval in the .CSV file.
Remember that setting long intervals creates a .CSV file with flatnumbers where you will not be able to find specific information of whathappened during a short period of time.
• The Reset table at the end of the interval check box causes all statisticsin the table to be cleared at the end of the interval.
• The Start options specify when you want to start traffic statisticsprocessing. The When the monitor is started button indicates thatprocessing should begin when Go! is chosen on the DatagLANceNetwork Analyzer window. The Time options specify the time that trafficstatistics processing should begin.
• The Stop options specify when you want to stop traffic statisticsprocessing. The When the monitor is stopped button indicates thatprocessing should stop when Stop! is chosen on the menu bar. TheTime options specify the time that traffic statistics processing shouldstop.
The Process Priority option indicates the priority that should be assignedto traffic statistics processing. Time-Critical is the highest priority andNormal is the lowest priority. If a lower priority is used, DatagLANce ismore likely to drop frames if too many frames are queued for processing.The best traffic processing performance is gained by selectingTime-Critical as the priority if other applications are running.
• The Analysis Type option lets you choose the type of analysis to beperformed. Protocol Matrix is the option to get the matrix .CSV fileincluding number of frames, number of bytes, network addresses, andmajor and minor protocols being used in conversations between pairs ofstations on the network. With the other options, you can do the normalanalysis with DatagLANce, but not create a .CSV file.
• The Record Statistics check box must be checked to have the statisticsrecorded in a file on the interval specified by the Sample Interval box.
• The Device or Pathname field is used to define the file name where thedata will be recorded. The file extension is .CSV.
• The Append if Exists check box selects whether to overwrite the file, if itexists, or append to it.
90 DatagLANce - Problem Determination and Monitoring

Update the options to your convenience, and click the OK push button. TheTraffic Statistics Options are updated and the window disappears.
2. Choose the Adapter Options from the Monitor pull-down of the menu bar andanother menu will appear.
Figure 81. Token-Ring Adapter Options Window
The following is a brief description of this window.
• At the top of the Adapter Options window in Figure 81 is shown the typeof adapter being used and the universally administered DLC (MAC)address of the adapter.
• The Adapter Mode group box allows you to select between Promiscuousor Normal mode. Promiscuous mode causes all frames on the networkto be processed and monitored. Normal mode causes only frames to thebroadcast address or the DLC address of the adapter to be monitored.
• The Process Options group box allows you to select whether full framesor the beginning of the frames should be processed. Since for largeframes a considerable amount of memory may be used for processingthe frame, this option allows you to limit the bytes of each frame beingexamined by the DatagLANce analyzer at the adapter level. Note thatthis is not the same as slicing a frame when capturing (application level).
In token-ring, the protocol header is at a variable length from thebeginning of the frame, because the RIF length depends on how manybridges the frame has traversed. Depending on the size of the network(number of bridges that a frame can possibly traverse) and the protocol,the first 86 bytes that the adapter will forward, may or may not beenough to decode the frame. In general, you should start the capture bynot slicing at the adapter level, and only resort to that option if thenumber of frames discarded is high.
Chapter 4. Using DatagLANce to Monitor the LAN Environment 91

• The Adapter Filter Options are adapter specific filtering options. Theseoptions limit the frames being processed to a subset of the networktraffic.
• The Enable Congestion Handling option enables DatagLANce to discardframes if the adapter becomes congested. This option preventsDatagLANce from locking up under extreme network load conditions.
Update the fields to your convenience and click the OK push button.
3. Click on the Capture option from the pull-down menu. The Capture menu isdisplayed and you have two main options:
• Disabled• Frames
With Disabled, no capturing is performed. When selected, this option allowscertain other monitoring functions to be performed. With the option Frames,frame capturing is performed, and you can do a protocol analysis of theframes.
Disabled is the default for the Protocol Matrix configuration, and from theperspective of performance, it is the option you should check.
4. Choose the Screen option in the DatagLANce window menu bar to get theScreen menu and select the Traffic Statistics (if it is not already selected) todisplay windows with statistics about stations operating on your network.These statistics appear whenever you click on the Go! choice to start thetraffic statistics processing.
Since DatagLANce has a wide variety of windows displaying many kinds ofstatistics, the number of windows opened on the screen at one time canbecome overwhelming. DatagLANce allows you to define arrangements ofthese windows, called Screens, which allow you to display a few windows ofyour choice at a time.
5. Choose the Window option in the DatagLANce window menu bar to get theWindow menu. Using this Window menu you can display different statisticsand information about your network. For now don′ t click on anything on thismenu.
6. Click on Go! to start DatagLANce and to create the .CSV file with thestatistical information from your network.
7. A verification box comes up saying DatagLANce will enter the token-ringNetwork at 4 Mbps. Click on the Yes button if your token-ring is at 4 Mbps.
8. Another verification box appears if you accumulated traffic statistics in aprevious session.
Click on Yes and you have started Traffic Matrix processing. You can seethe Stop! option instead of the Go! menu option.
9. Now click on the Window option. The Window menu is displayed.
10. Choose the Traffic Statistics option on the Window menu. After a shortdelay, some entries will begin appearing on the Traffic Statistics display.
11. As you can see in Figure 82 on page 93, the Traffic Statistics windowcontains information about the following fields:
• Major Protocol• Minor Protocol• Station
92 DatagLANce - Problem Determination and Monitoring
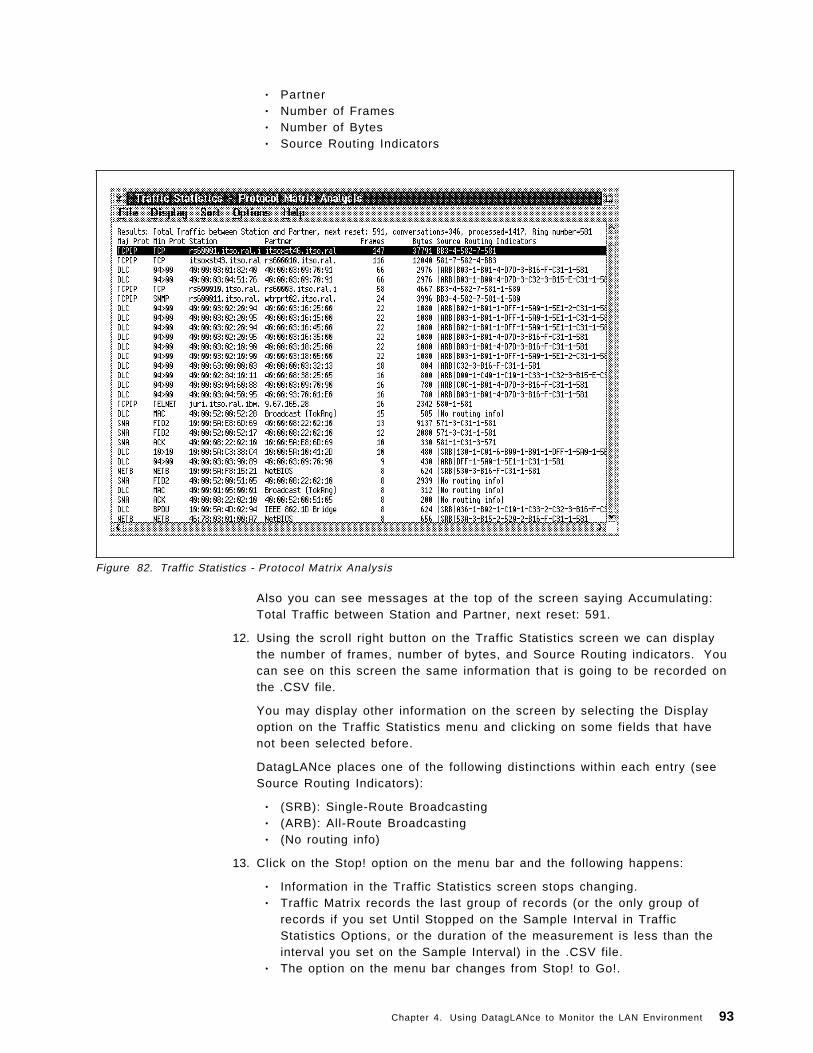
• Partner• Number of Frames• Number of Bytes• Source Routing Indicators
Figure 82. Traffic Statistics - Protocol Matrix Analysis
Also you can see messages at the top of the screen saying Accumulating:Total Traffic between Station and Partner, next reset: 591.
12. Using the scroll right button on the Traffic Statistics screen we can displaythe number of frames, number of bytes, and Source Routing indicators. Youcan see on this screen the same information that is going to be recorded onthe .CSV file.
You may display other information on the screen by selecting the Displayoption on the Traffic Statistics menu and clicking on some fields that havenot been selected before.
DatagLANce places one of the following distinctions within each entry (seeSource Routing Indicators):
• (SRB): Single-Route Broadcasting• (ARB): All-Route Broadcasting• (No routing info)
13. Click on the Stop! option on the menu bar and the following happens:
• Information in the Traffic Statistics screen stops changing.• Traffic Matrix records the last group of records (or the only group of
records if you set Until Stopped on the Sample Interval in TrafficStatistics Options, or the duration of the measurement is less than theinterval you set on the Sample Interval) in the .CSV file.
• The option on the menu bar changes from Stop! to Go!.
Chapter 4. Using DatagLANce to Monitor the LAN Environment 93

With DatagLANce you can gather the information. You can now import the datainto a spreadsheet, database, or other application that can be used to do yourmodelling.
4.4.5 Monitoring to Ensure Service LevelsOnce you have modelled your network, you have an expectation of what you willsee on the network if you were to monitor it. You also know what the networkcan support in increased traffic. If you have gathered data for a baseline, youhave an idea of what is happening on the network, but may not know what thenetwork can handle.
To ensure the service level, monitor the network on a regular or random basis toensure that your expectations are being met, and keep a history of this activity tohelp you see trends in the network usage. By importing the statistics gatheredwith DatagLANce into a spreadsheet or database, you can produce reports andcharts to help display trends in the traffic. With regular monitoring of trends youcan foresee problems such as an abnormal increase in the number of errors orexcessive amounts of traffic.
After going through the modelling exercise, you can determine what thresholdsshould be acceptable for your network. You can then configure these inDatagLANce and let DatagLANce monitor the network and inform you whenthere is a condition that requires your attention.
The screen below shows the options you have available for setting alarms(alerts) to help the DatagLANce set up to perform the automatic monitoringfunction.
Figure 83. Alarm Options
The following is a brief description of the Alarm Options window.
94 DatagLANce - Problem Determination and Monitoring
• The Alarm Events lets you select the event for which you want this alarm toapply. There are some pre-configured events as well as events that couldbe customized for your environment (in the Custom Event option from theMonitor pull-down).
• The Interval box sets the interval after which DatagLANce will check if thecondition exists and take the appropriate action.
• In the Alarm Condition Exists When box you can disable a specific alarm orselect the response to complete the statement as appropriate for your event.
• The Options box is selected if you want to have an audible alarm when thecondition exists. You can also select to have the alarm activated only onceduring the monitor period. If this is not checked, the alarm will be processedeach time the condition exists.
• The Alarm Thresholds is where you enter the values of the thresholds. Youcan enter both minimum and maximum values for different priorities as itapplies. Different actions can be taken based on the priority of the thresholdthat was violated. The actions that can be taken include:
Log Indicates you want DatagLANce to record the violation. Itwill display the violation in the Monitoring window andoptionally in a log file.
Stop If capturing is enabled, DatagLANce will stop the capture,otherwise no action will be taken.
Trap This option will send a SNMP trap to the defined networkmanagement workstation via TCP/IP. This option requires asecond adapter installed in the DatagLANce workstation andTCP/IP installed. An example of this is shown in the 6.4,“Integration of DatagLANce with NetView for AIX” onpage 107.
Page This option will send a beep to your pager and requires amodem installed on the DatagLANce machine. DatagLANcewill only send a maximum of one page every 10 minutes.
Run... Allows you to customize your own action to be taken whenthe alarm condition exists. A window will be displayedwhere you can enter the name of the program andparameters to be executed.
By selecting an action for When alarm threshold violation ceases: you canhave an action take place when activity on the network returns to normal.
• The Log Alarms To... push button displays a window where you can select ifyou want alarms recorded into file and the name of that file.
• With Send Traps To... push button a window is displayed so you can enterthe address of the network management workstation that is to receive anytraps.
• By selecting the Pager Setup push button, you see a window where you cancustomize the options for sending a page.
• The OK push button tells DatagLANce you are done configuring alarms andto close the window. Any changes made will be saved.
• The Cancel push button will also cause the Alarm Options window to close,but any changes made will be discarded.
Chapter 4. Using DatagLANce to Monitor the LAN Environment 95

4.4.6 Monitoring for Change and Problem ManagementOften when changes are made something isn′ t quite right afterwards, and time isspent trying to figure out why. It is a good practice to monitor the network bothbefore and after a change, then if something seems odd, you have a comparisonyou can make.
It is important to remember to keep a system view in mind. By changing arouter, bridge or gateway, you can lower the limit for the hop count but someframes may then not be able to reach their destination. Similarly filters could beput in place to improve performance, but end end up preventing certain criticalprotocols from passing through. Changes in line or token-ring speed, the addingof additional workstations to a segment, and the upgrade of a server, are allexamples of changes that could affect the network. Some may seem quiteharmless. Those are often the ones we overlook when a problem arises.
96 DatagLANce - Problem Determination and Monitoring

Chapter 5. Turning DatagLANce Data into Information
In this chapter we will discuss ways to use the data that you will receive fromDatagLANce to create meaningful reports and charts. The tools that you haveavailable may vary from those we have used, but the process should be muchthe same.
5.1 Using DB2 for OS/2 (DB2/2)Placing the data in a database, puts it in a format that is usable by manyreporting tools. It also makes it accessible by other users, so the data can beshared.
Someone may be working on a problem and be interested in viewing certainrecords, while another person may be looking to see a summary of the trafficover a period in time as they look for trends. Having the data in the databaseeach user can display the information they need.
The various delimited files we have created using DatagLANce are capable ofbeing imported into DB2/2. The definitions for the table need to be entered firstbefore the data is imported. These definitions will be slightly different to reflectthe different data in the file.
Earlier we collected data in a .CSV file. For details on how we collected thisinformation see 4.4.4, “Monitoring for Modelling” on page 88 It is this file that wewill use as our example for importing the data into DB2 for OS/2.
Figure 84 on page 98 shows a sample .CMD file with commands that need to beexecuted for the task of importing the data into DB2/2.
Copyright IBM Corp. 1995 97

/* Sample REXX program to create a DGNA database and table and import*//* data from DatagLANce for analysis. *//* Some changes you may want to make before using the file are: *//* *//* ITEM DEFAULT USED LINE(S) *//* Name of database DGNA 16, 20, 46 *//* Drive for database D 16 *//* Name of table DAY1 25, 46 *//* Import function INSERT 46 *//* Name of CSV file D:\DGNA\TRAFFIC.CSV 46 */
/* Create a database named DGNA on the D drive for use with DGNA data*/
CALL DBM ′ CREATE DATABASE DGNA ON D WITH ″Data from DGNA .CSV files″ ′
/* Connect to the DGNA database so that the tables will be placed *//* there. */
CALL DBM CONNECT TO DGNA
/* Define a table named DAY1 to import the data from the DGNA *//* protocol matrix CSV file. This table is based on the default *//* output of this file. */
A1 = ′ CREATE TABLE DAY1 (SUITE VARCHAR(8) NOT NULL,′A2 = ′ PROTOCOL VARCHAR(10) NOT NULL,′A3 = ′ NETADDRA VARCHAR(22) NOT NULL,′A4 = ′ NETADDRB VARCHAR(22) NOT NULL,′A5 = ′ MACADDRA VARCHAR(18) NOT NULL,′A6 = ′ MACADDRB VARCHAR(18) NOT NULL,′A7 = ′ BYTESAB INTEGER NOT NULL,′A8 = ′ BYTESBA INTEGER NOT NULL,′A9 = ′ FRAMESAB INTEGER NOT NULL,′A10 = ′ FRAMESBA INTEGER NOT NULL,′A11= ′ MINAB INTEGER NOT NULL,′A12 = ′ MINBA INTEGER NOT NULL,′A13 = ′ MAXAB INTEGER NOT NULL,′A14 = ′ MAXBA INTEGER NOT NULL,′A15 = ′ RIF LONG VARCHAR)′
Call DBM A1||A2||A3||A4||A5||A6||A7||A8||A9||A10||A11||A12||A13||A14||A15
/* Next we import the data from the CSV file into the table we just created. */
CALL DBM ′ IMPORT TO DGNA FROM D:\DGNA\TRAFFIC.CSV OF DEL INSERT INTODAY1 MESSAGES D:\DGNADB.MSG′
/* If you want to import multiple files into the same table, repeat *//* the above command for each file. If you only want to replace *//* the data in the table use REPLACE instead of INSERT in the IMPORT*//* command (line 46). You can also enter CON instead of the name of*//* a file and the messages will be written to it case of errors. *//* And we′ re done! */
Figure 84. Sample CMD File to Import a .CSV File from DatagLANce in DB2 for OS/2
98 DatagLANce - Problem Determination and Monitoring

In the comments at the beginning of the file, we list default values we have used.These may be different for you, or you could define variables that could bepassed as arguments to the .CMD file.
To keep things neat, the .CMD file starts creating a database. You may alreadyhave one defined, but keeping the data separated in different databases can helpkeep things organized when working on multiple projects.
The first statement will create a database called DGNA on the D drive for thecurrent workstation and will have Data from DGNA .CSV files as its description.
Note: If you have not logged on to the network or database, you will beprompted to log on. If you have not used User Profile Management to add alocal userid, the default userid and password are USERID and PASSWORD.
With the database created, you can now add tables to hold the data from thefiles you have collected from DatagLANce. First we need to connect to thedatabase so the tables we create will be placed there.
The command to define the table can be long. In this case we have fifteencolumns to define within our table. We set variables to all the different parts ofthe command to make it easier to read. In our example, A1 is the first part ofthe command to create a table named DAY1 with the first column for majorprotocol. Each variable through A15 is another column in the table. We thenissue the DBM command and concatenate all the variables.
If you were to enter the command from the DB2/2 Command Line Processor, itwould exceed the 255 character limit of the command line. To enter it on thecommand line you would need to enter the command to the seventh column andplace a backslash () after the comma. This is the continuation character for theDB2/2 command line processor. You′ ll then receive a prompt where you canenter the remainder of the command to define the table.
Now that the table is defined, we can import the data from DatagLANce into thetable. The table we created is called DAY1 in the DGNA database. The data filefrom DatagLANce is TRAFFIC.CSV. The first few lines of the .CSV file can bedeleted as they contain information about when the file was created and thecolumn headings.
When importing the file, we should tell DB2/2 which database the table is located(DGNA), the name of the file to be imported, and the format of the file (DEL is fordelimited) in order to insert the data into the DAY1 table and to write any errormessages to the file D:DGNADB.MSG.
If any error occurs, a message will be displayed suggesting you look at theD:DGNADB.MSG file to see the error description.
Using Query Manager, we can now do queries on the data we have imported oruse Query Manager to generate reports.
The first screen displayed by Query Manager displays a list of the databases thathave been created. On this screen we can choose the DGNA database bydouble-clicking on it with the mouse.
We then see a window labelled Query Manager for DGNA which contains amenu called Main Selection for DGNA. From this menu we have some optionsas shown below:
Chapter 5. Turning DatagLANce Data into Information 99

Tables and Views Lets you work with the tables and edit the data in the tables
Queries Used to get data from the tables and display reports
Forms Lets you define the layout of reports
Procedures Used to customize command sequences
Panels Used to define a fill-in screens
Menus Lets you customize selection screens
Profiles Sets default values for Query Manager
Selecting the Queries push button displays the Query menu. By double clickingon ---NEW--, we can begin to create our own query as shown in the followingprocedure:
1. A window is opened prompting us to enter the name of the table to use forthis query. You can either type DAY1, or select the List push button todisplay a list of the tables in the current database and choose DAY1 from thelist. With DAY1 entered, select the Enter push button.
2. A new window prompt is displayed labelled Specify. Here we chooseColumns and press Enter. A window is displayed listing the columns in thetable we selected. Select PROTOCOL and press Enter.
3. From the Specify window, select again Columns and press Enter. This timeselect Summary functions and press Enter. To create an expression, do thefollowing:
• Select Sum of (SUM)... and press Enter.• Select Expression (A+B, etc)... and press Enter.• Select the List push button.• Select BYTESAB and press Enter.• Type + .• Select the List push button.• Select BYTESBA and press Enter.• Select the Enter push button to end the creation of the expression.
4. Once again we return to the Specify window, at this t ime select Sort andpress Enter. A window with the sort options is displayed.
• For the Order, select Descending.• In the Sort by Columns box, select SUM(BYTESAB+BYTESBA).• Select the Enter push button.
5. This time when you see Specify window, select the Cancel push button.
In Figure 85 on page 101, you now see the query as it has been built.
100 DatagLANce - Problem Determination and Monitoring

Figure 85. Sample Query Buil t with Query Manager
6. From the menu bar, select Display.
7. From the Display pull-down, select Form.
8. To make the report more meaningful, change SUITE to Protocol Suite,EXPRESSION 2 to Day 1, and the width for the first column to 14 as shown inFigure 86.
Figure 86. Sample Form From Query Manager
9. From the menu bar, select Display.
10. From the Display pull-down, select Query.
11. From the menu bar, select Action.
12. From the Action pull-down, select Run. A summary report is produced listingthe major protocol suites and the number of bytes for each protocol similarto the one shown in Figure 87 on page 102.
Chapter 5. Turning DatagLANce Data into Information 101

Figure 87. Sample Report f rom Query Manager
This is a simple report. With a few changes we can add another column withdata from another table and start to see trends from one time period to anotheror one segment to another. In the query shown in Figure 88, we have addedanother table (DAY2) and collected the same data from it.
Figure 88. Sample Query with a Second Table and Column Added
Making the same type of changes to the form, we can now run the query anddisplay the report. Now we can compare the results displayed in Figure 89 onpage 103 for the two days and over longer time periods look for trends.
102 DatagLANce - Problem Determination and Monitoring

Figure 89. Sample Report f rom Query Manager
With the report window displayed, selecting the Actions pull-down gives youoptions to save the report, print the report, and graph the data that is displayed.
As you leave Query Manager, you are asked if you want to save the form andthe query that have been built. If you choose to save them, you will be promptedto give a name and description for them. The next time you use Query Manager,the forms and queries that you have saved will be listed as options to selectrather than building a new one each time.
Chapter 5. Turning DatagLANce Data into Information 103

104 DatagLANce - Problem Determination and Monitoring

Chapter 6. DatagLANce Positioning and Other Network ManagementProducts
IBM has a number of products available for Problem Determination and NetworkManagement. In this chapter we will try to position DatagLANce with LANNetwork Manager for OS/2 (LNM) and NetView for AIX so that it becomes clearerwhich tool or combination of tools are most appropriate for your purpose and foryour specific environment. This chapter also contains an example that showshow you can integrate DatagLANce with NetView for AIX. In this exampleDatagLANce is used to gather statistics that are then picked up by the RS/6000.A second function of DatagLANce shown in this chapter is to send alerts toNetView for AIX when ring utilization exceeds certain thresholds.
6.1 LAN Network Manager for OS/2LAN Network Manager for OS/2 is a specific tool to manage the physical layer oftoken-ring as well as broadband and baseband PC networks. This means thatyou can, for example add, delete, query, list and set parameters forLAN-attached devices. It is used together with DB2/2 to discover the LANconfiguration and build a table. It also keeps an event log and gathers bridgeperformance statistics. LAN Network Manager for OS/2 provides a graphicaldisplay of the LAN to enhance user productivity.
6.1.1 System ManagementLAN Network Manager for OS/2 creates and maintains an event log and aconfiguration database. You can write your own applications for analysis of datacollected and maintained by LNM for OS/2.
6.1.2 Configuration TableWorking with LAN Station Manager (LSM), LNM for OS/2 allows the building of aconfiguration table of adapters in the network together with a set of stationidentifying information. This table can combine information on LAN adapters inthe PCs with user information like room number or telephone number. The IBM8230 can provide its identifying information such as Controlled Access Unit (CAU)identifier, attachment module identifier and lobe identifier. This table alsoprovides information on which stations are active or inactive. Bridgeperformance statistics are stored in it as well.
6.1.3 Alert FilteringLNM for OS/2 can forward SNMP alerts to NetView for AIX. Alerts that are notconsidered critical can be filtered out. The filters can be set from the LNM forOS/2.
6.1.4 High AvailabilityIf the cable between two CAUs breaks, the CAU provides an automatic wraparound the failure and LNM for OS/2 can identifies the fault domain. LNM forOS/2 can also issue wrap/unwrap commands to the CAU for reconfiguration ortroubleshooting purposes.
Copyright IBM Corp. 1995 105

6.1.5 NetView SupportLNM for OS/2 can communicate with LNM for AIX as an SNMP proxy agent,and/or with NetView/390 as an SNA service point.
When communicating with NetView for AIX, LNM for OS/2 implements an SNMPproxy agent, receiving commands from, and sending responses (and alerts) tothe LNM for AIX. The alerts are sent in the form of traps.
When communicating with NetView/390, LNM for OS/2 forwards alerts (LANalerts or alerts generated by application programs on the network) and receivescommands from the host. With NetView/390 you can use NetView MultiSystemManager (MSM) and NetView Graphic Monitor Facility (NGMF) to display andcontrol LNM managed resources through a single NGMF workstation.
6.1.6 Access ControlIn conjunction with the 8230 token-ring Network Controlled Access Unit, LNM forOS/2 can control access to the network based on adapter address, CAUidentifier, attachment module identifier, time of day or days of the week.
6.2 NetView for AIXThe NetView for AIX program is a comprehensive management tool forheterogeneous, multivendor devices on TCP/IP networks.
It provides configuration, fault, and performance management functions, alongwith many features. It provides an open network management platform thatenables the integration of SNMP and Common Management Information Protocol(CMIP) applications. For cooperative management of TCP/IP networks, NetViewfor AIX uses the AIX NetView Service Point program to communicate with yourhost.
The NetView for AIX program is a network and system management tool thatprovides distributed or central management for your network. It uses the TCP/IPand SNMP capabilities to communicate with DatagLANce and get files/sendcommands to the DatagLANce machine.
NetView for AIX can provide you with many capabilities, for instance:
• Management of heterogeneous, multivendor networks• Network configuration, fault, and performance management• Dynamic device discovery• Easy-to-use graphical interface• Integration with a relational database• Support of many third-party applications• Distributed management• IP monitoring and SNMP management• Enablement of multiprotocol monitoring and management• Management Information Base (MIB) management tools• Application Programming Interfaces (APIs)• Easy installation and maintenance• Host connectivity• Online information
NetView for AIX provides services for devices that have an SNMP agent. It usessome daemons to support these services, for instance:
106 DatagLANce - Problem Determination and Monitoring

• The trapd daemon receives traps and forwards them to all connecteddaemons. The trapd daemon also logs events to a file.
• The tralert daemon is used to convert the traps that are received from trapdto an SNA alert and sends them to NetView/390.
• The spappld daemon provides a command interface between NetView/390and NetView for AIX in an environment running SNA and TCP/IP protocols.
• The trapgend daemon converts AIX errors to SNMP traps.
• The netmon daemon polls agents initially to discover the network topologyand afterwards to detect topology or status changes. Based on thediscovered information, netmon generates the topology map.
6.3 DatagLANceLAN Network Manager for OS/2 and NetView for AIX are products that havethree basic functions:
• Find out the stations on the network
• Send out commands to these stations
• Send alerts to the console or another NetView agent
DatagLANce has some overlap in functionality with the mentioned products,since it also can make a Ring Map and can send alerts to NetView for AIX(SNMP alerts). DatagLANce does not build a complete database of stations onthe network, and it cannot send commands to other stations.
Where the LAN Network Manager for OS/2 product focuses mainly on the MAClayer (stations in the network), DatagLANce interprets the full seven-layerprotocol of sessions between these stations.
The functionality of DatagLANce can be summarized in three main areas:
• Statistics
DatagLANce is able to measure traffic rates, frame sizes, and error statistics.It can also rank the top talkers and/or the top receivers in your network.
• Capture Frames
DatagLANce captures frames to a buffer or to a capture file on disk.
• Analyze Frames
Captured frames can be played back into the analyzer to run specificstatistics on them. There are almost unlimited filtering possibilities tonarrow down a search to a specific frame. Once you are looking at theframes you need, DatagLANce can interpret and decode more than hundreddifferent protocols.
6.4 Integration of DatagLANce with NetView for AIXIn this scenario we have a token-ring network with both NetView for AIX andDatagLANce attached. We used the command file in Appendix E, “DatagLANce.CMD File for Producing Daily Analysis Reports” on page 135 to gather statisticson ring utilization, the top talkers and network errors. These reports are writtento a file at the end of each day and collected by the RS/6000 via TCP/IP.
Chapter 6. DatagLANce Positioning and Other Network Management Products 107

We also have defined events that we consider critical to our network. Whenthese events occur, we send a trap to NetView for AIX.
6.4.1 Sending Alerts from DatagLANceDatagLANce has limited SNMP capabilities. It cannot be managed by theNetView products, but it has some Management Information Base (MIB)definitions that enable it to send traps to a NetView station. DatagLANce cansend traps for different events. On a token-ring network, DatagLANce canforesee specific traps for:
• Network Inactive Time
• All Frames Utilization
• All Frame Counts
• Soft Errors
• Ring Purges
• Beacon Frames
• Oversized Frames
• Custom Event 1
• Custom Event 2
• Custom Event 3
• Custom Event 4
• Custom Event 5
The custom events can be defined in the Custom Events. option from theMonitor menu option. An event being any frame that matches specific criteria.This means that you can define an alert to be sent to NetView for AIX whenframes match with a specific Destination Address, Frame Pattern, MACinformation, and so on. You will need to make sure that on the NetView sidecorresponding definitions are made.
DatagLANce offers the possibility to send alerts to a monitoring station on anyevent as defined by the DatagLANce administrator. This will normally be whenevents occur that impact the users on your network.
In Figure 90 on page 109 we configured DatagLANce to monitor the networkevery 5 seconds for All Frames Utilization. Once the utilization is more than70% it will log that event. When ring utilization exceeds 80%, it will produce anaudible alarm and send an alert to NetView for AIX. The values configured onthis panel are arbitrary. Since there is no definition of ″normal″ ring utilization,experience and previous measures will tell you which level you can accept inyour network, and where you should have special attention. The TCP/IP addressof the NetView machine is 9.24.104.109.
108 DatagLANce - Problem Determination and Monitoring

Figure 90. Defining an Alert for the Function of Ring Utilization
Figure 91 shows how these events appear in the log file. You can acknowledgean alert and set the audible alarm from the Options menu option.
Figure 91. Alarm Log Screen
Chapter 6. DatagLANce Positioning and Other Network Management Products 109
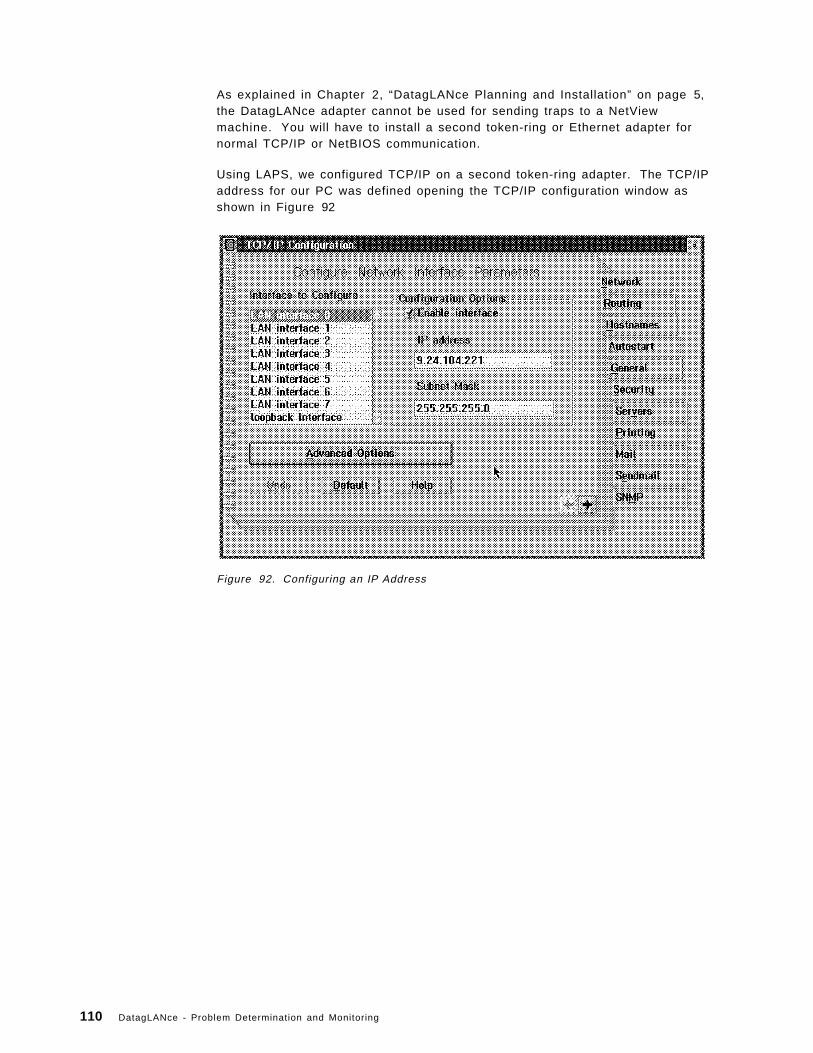
As explained in Chapter 2, “DatagLANce Planning and Installation” on page 5,the DatagLANce adapter cannot be used for sending traps to a NetViewmachine. You will have to install a second token-ring or Ethernet adapter fornormal TCP/IP or NetBIOS communication.
Using LAPS, we configured TCP/IP on a second token-ring adapter. The TCP/IPaddress for our PC was defined opening the TCP/IP configuration window asshown in Figure 92
Figure 92. Configuring an IP Address
110 DatagLANce - Problem Determination and Monitoring

6.4.2 Loading the DatagLANce MIB to Use with NetView for AIXIn order to have the alerts from DatagLANce properly recognized by NetView forAIX, you need to define them in NetView for AIX. Without this definition, themessages that will be displayed using NetView will just be generic messagesand not very meaningful.
The first thing you need is a copy of the MIB definition from DatagLANce. It isnot available as a file, but rather in the online DatagLANce Network AnalyzerUser′s Guide. In order to get a copy of this file, you can use the Copy to Fileoption under the Services pull-down and just delete the first two lines of text. Acopy of the MIB definition is included in Appendix B, “MIB Definition File” onpage 125 for your reference.
Next you need to load the MIB definition. For instance, from NetView for AIX,you go to the Options pull-down, then to the Load/Unload MIBs option, andfinally to the Load option. In Figure 93 is shown the Load MIB window where weentered the path and name of the file that contains the DatagLANce MIBdefinition and selected OK.
Figure 93. Load Window from NetView for AIX
Chapter 6. DatagLANce Positioning and Other Network Management Products 111
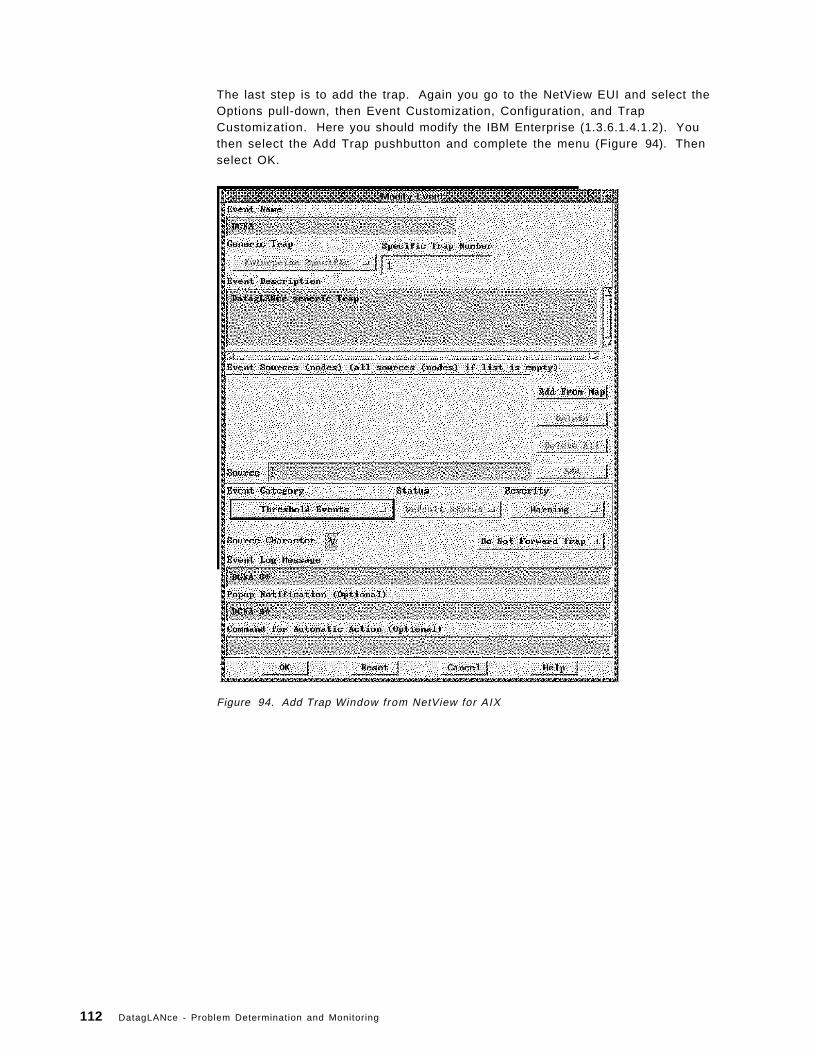
The last step is to add the trap. Again you go to the NetView EUI and select theOptions pull-down, then Event Customization, Configuration, and TrapCustomization. Here you should modify the IBM Enterprise (1.3.6.1.4.1.2). Youthen select the Add Trap pushbutton and complete the menu (Figure 94). Thenselect OK.
Figure 94. Add Trap Window from NetView for AIX
112 DatagLANce - Problem Determination and Monitoring

After this set up, the way the alert pops up on the NetView for AIX screen showsthat we are having a ring utilization problem. Figure 95 shows an example ofthis screen. For the purpose of this demonstration, we had to lower the upperlimit for the alert because there was not enough traffic on our segment.
Figure 95. Alert Pop-Up on NetView for AIX Screen
Chapter 6. DatagLANce Positioning and Other Network Management Products 113

6.5 Remote Network Monitor Using the Command Line InterfaceWhen you have DatagLANce at your disposal, you not only use it when you havetrouble on your network, but you can also set it up to keep you informed of whatis going on in your network. For instance:
• What is the average usage of your network?
• Is there a trend in network utilization?
• Is the error rate increasing as compared to last month?
• Is the distribution of protocols as you expected?
Since the availability of your network is as important as the availability ofsystems that it connects, you want to keep your finger on it on a regular basis.This can be done with DatagLANce not only on a local network but also usingremote access.
For remote monitoring you could use Distributed Console Access Facility (DCAF)program to connect to the remote DatagLANce machine and used it as if it werelocal. This option is a valid alternative when both the DatagLANce machine andthe DCAF controlling station are on the same LAN. When connecting over aWAN using DCAF, the GUI of DatagLANce might show a little slow if you do nothave adequate line speeds.
For this reason and the popularity of TCP/IP, we decided to use another scenariowith TCP/IP in our example.
We used the DatagLANce Command Line Interface. With this interface we wereable to start several DatagLANce functions via a Telnet session and collect theanalysis files via FTP to a RS/6000.
By the way, this RS/6000 was the same workstation that was running NetView forAIX from the previous scenario to receive DatagLANce alerts when certainthresholds were exceeded.
6.5.1 Command Syntax of DatagLANce UtilitiesThe DatagLANce Command Line Interface, is not described on the hardcopy ofthe user′s guide, but you will find some information when searching in the onlinedocumentation. Use command or utilities as the search argument.
Utilities are available for the following functions:
DGCFGMOD modification of configurations
DGCFGCPY conversion of configurations
DGCMD start and stop the DatagLANce applications from a Telnetsession or a command file
The following examples help to explain their functions:
• DGCFGMOD TRMON STARTUP RINGSPEED:16 ADDRESSES:MSB
This command will set the ringspeed to 16 Mbit and show addresses with themost significant bit first for a configuration that was saved as startup.
• DGCFGCPY TRMON CAPTURE ENMON
114 DatagLANce - Problem Determination and Monitoring

This command copies a configuration named Capture for token-ringenvironments to an Ethernet configuration. Don′ t forget that some eventsare media-specific. Beaconing does not apply to Ethernet, and there are nocollisions in a token-ring. It is useful to verify the event detectors and alarmsafterwards.
• DGCMD TRMON LAUNCH MYCONFIG
If you do not specify a configuration, DatagLANce will load startup as thedefault.
Looking at this command in more detail, we have the following commandsyntax and parameters:
>DGCMD appname command options
Where:
appname TRMON for token-ring or ENMON for Ethernet orTRMON1/TRMON2 and ENMON1/ENMON2 when dual interfacesare installed
command You can use the following values:
− LAUNCH− START− STOP− PRINT REPORT reportcode outputfile− PRINT TRAFFIC #entries outputfile− SORT [TOTAL or TO or FROM or TOANDFROM or BOTH or
ASCENDING or DESCENDING or sortcode]− EXIT
options Different codes or file/configuration names for differentfunction/reports of interest. A complete list of the Print ReportOptions is available in Appendix D, “Print Report Options” onpage 133.
6.5.2 Example Scenario: Collecting Statistic FilesIn this example, we go through the steps needed to automate the generation ofDatagLANce data and send the collection of this data to an RS/6000.
6.5.2.1 Enabling DatagLANce for Traffic AnalysisIn order to be able to collect network statistics from the DatagLANce machine,you have to define and load a configuration that has enabled traffic analysis. Ifsuch a configuration exists, you can load it by clicking on the File menu optionand choosing Load Configuration. You can also launch it with the DGCMDcommand.
To create this configuration, you can click on the Monitor menu option and thenTraffic Analysis Options. On this screen you click on Enable Traffic AnalysisProcessing.
In Figure 96 on page 116, we have loaded the configuration called trafanal. Withthis configuration, we collected a sample of information every two minutes, andcould accumulate up to 8157 table entries. Statistics will also be recorded in afile called TRAFFIC.CSV.
Chapter 6. DatagLANce Positioning and Other Network Management Products 115

Figure 96. Enabling DatagLANce for Traffic Analysis
The reports you can generate depend on the type of analysis option you chooseduring monitoring. Refer to Appendix D, “Print Report Options” on page 133 fora complete list of report codes.
The TCP/IP connection cannot run on the same DatagLANce adapter. Refer toChapter 2, “DatagLANce Planning and Installation” on page 5 for details on howto set up a PC with two adapters.
To set up the TCP/IP configuration on the DatagLANce workstation you can usethe following examples:
1. Obtain from the network administrator the local IP address, subnet mask,and the IP host-name; and configure the TCP/IP network interfaceparameters using these values. Figure 92 on page 110 shows an exampleof this configuration panel.
2. Define inetd, Telnet and FTP services using the Autostart entry. Figure 97 onpage 117 shows this configuration panel.
116 DatagLANce - Problem Determination and Monitoring

Figure 97. Configuring TCP/IP Autostart Option
3. To enable the RS/6000 to log on to the DatagLANce machine also define apassword for Telnet and a userid and password for FTP. Click on theSecurity flag of the TCP/IP configuration screen and fill out the necessaryfield (See Figure 98).
Figure 98. Configuring Security for Telnet and FTP
Chapter 6. DatagLANce Positioning and Other Network Management Products 117

Note: we used read only access for the FTP userid and only to a specificFTP directory. Indeed there is no security in FTP and some of theDatagLANce files in the DGNA directory could contain non-encryptedpasswords. Therefore we limit the access to only one directory wherewe have a copy of the print files.
To automate the DatagLANce monitoring function, we used the command file asdescribed in Appendix E, “DatagLANce .CMD File for Producing Daily AnalysisReports” on page 135.
Note: This command file did not run on a machine with only 16 MB installed. Itneeded 36 MB to run ok.
The command file in the DatagLANce directory produced a set of PRN files daily.To complete the scenario we also had created an RS/6000 command file to pickup these files every day. Of course several variations on this scenario can beworked out, for instance:
• Work on a LAN and copy the PRN files to a file server, or
• FTP the analysis files to a central DatagLANce machine and produce PRNfiles there, or
• Import the files into DB/2
6.5.2.2 Getting DatagLANce Data Files into RS/6000To automate the procedure to get DatagLANce data files, you can run at theRS/6000 a set command periodically from the cron command. An example of acommand file that can be started is shown in Figure 99 on page 119. Whenexecuted, this command will automatically connect to a configured DatagLANcesystem and collect all the files with a PRN extension. These files will then beplaced in a storage directory with the Julian day number and DatagLANce hostname appended.
For example the HISTORY.PRN file collected on 18th of January from host ritawill be renamed history.prn.018.rita. This allows history data to be collectedfrom multiple hosts for up to one year.
118 DatagLANce - Problem Determination and Monitoring

#! /bin/ksh
dgnahost=r i tadgnauser=DGNAdgnapasswd=DGNAdgnastoredi r=/ tmp/dgna
d a y = date + % jcd $dgnastoredir
print machine $dgnahost login $dgnauser password $dgnapasswd > $HOME/.netrcprint ″macdef init″ > > $HOME/.netrcprint ″prompt″ > > $HOME/.netrcprint ″mget *.prn″ > > $HOME/.netrcprint ″quit″ > > $HOME/.netrcpr in t >> $HOME/.netrc
chmod 600 $HOME/.netrc
FTP $dgnahost
rm -f $HOME/.netrc
for i in *.prndo
move $i $i.$day.$dgnahostdone
Figure 99. Shell to Collect DatagLANce files
The following cron entry will start the dgnacolrita script at 03:01 each day.
01 3 * * * /usr/share/dgnacolrita
Figure 100. Cron Entry for DatagLANce
In Figure 101 on page 120 there is an extracted file that we were able to see atthe RS/6000.
Chapter 6. DatagLANce Positioning and Other Network Management Products 119

Token-Ring DatagLANce Network Analyzer ReportPrinted: Thu Aug 24 13:45:22 1995
All Frames History
History statistics for Thu Aug 24 12:33:42 1995 to Thu Aug 24 13:45:12 1995.History statistics interval is 30 second(s), 144 total samples taken.
For Frame Statistics:
Peak was 9140 (304 frame/sec) at Thu Aug 24 12:59:42 1995Min was 5288 (176 frame/sec) at Thu Aug 24 12:52:42 1995
For Byte/Network Util ization Statistics:
Peak was 2641137 (17.61% util) at Thu Aug 24 12:59:42 1995Min was 432449 (2.88% util) at Thu Aug 24 12:52:42 1995
History Statistics:
Time Frames %Ut i l 0 10 20 30 40 50 60 70 80 90 100------------ ------ ------ --------------------------------------------------Thu 12:33:42 7288 9.08 XXXXThu 12:34:12 7192 9.12 XXXXThu 12:34:42 7894 9.18 XXXXThu 12:35:12 7940 10.05 XXXXXThu 12:35:42 7706 11.18 XXXXXThu 12:36:12 7833 11.15 XXXXXThu 12:36:42 6740 10.97 XXXXXThu 12:37:12 6937 10.43 XXXXXThu 12:37:42 6003 5.55 XXThu 12:38:12 6650 3.73 X
Token-Ring DatagLANce Network Analyzer ReportPrinted: Thu Aug 24 13:45:22 1995
Cumulative Network Statistics
This report displays cumulative network statistics for the network
Timestamps:
Monitor Active : 0 day(s) 01:12:10Network Active : 0 day(s) 01:12:10Network Inactive : 0 day(s) 00:00:00Network Up : 0 day(s) 01:12:10Network Down : 0 day(s) 00:00:00
Figure 101 (Part 1 of 2). DatagLANce Report as Copied to the RS/6000
120 DatagLANce - Problem Determination and Monitoring

Cumulative Global Statistics:
Total Frames : 968810Total Bytes : 105908894Avg Frame Length : 109Avg Frame Rate : 224Avg Byte Rate : 24459Avg Util ization : 4.89%
Cumulative Error Counts:
Soft Errors : 7966Ring Purges : 50Beacon Frames : 0Oversized Frames : 0
Token-Ring DatagLANce Network Analyzer ReportPrinted: Thu Aug 24 13:45:22 1995
Top 10 Errors
This report provides statistics for the 10 DLC addresses which havereported the most soft errors.
Traffic analysis started: 08/24/95 13:48:12Traffic analysis ended : 08/24/95 13:45:26Elapsed analysis time : 49710 day(s) 06:25:30Frames processed : 2926
Station Errors Frames Bytes % B y t e sIBM :EC:52:45 22 7 353 0.065 %IEEE 802.1D Bridges 0 0 0 0.000 %DEC Lvl 1 Routers (TokRn 0 0 0 0.000 %Unknown Address 0 0 0 0.000 %40:22:06:00:00:00 0 0 0 0.000 %3174ITSO 0 101 7554 1.397 %40:00:03:18:05:00 0 0 0 0.000 %40:00:00:00:00:00 0 0 0 0.000 %All Br idges 0 0 0 0.000 %40:00:01:05:00:00 0 4 134 0.025 %
Figure 101 (Part 2 of 2). DatagLANce Report as Copied to the RS/6000
6.5.2.3 Collecting Statistic Files SetupBefore the example can be used, a number of setup steps must be performed.
1. Individual scripts wil l be required for each DatagLANce host to be contacted.
2. The variables dgnahost, dgnauser, dgnapasswd and dgnastoredir must beset to the appropriate values for each script.
3. A cron entry must be created for each script. An example cron entry can beseen in Figure 100 on page 119. For more information on cron contact yourAIX system administrator.
Chapter 6. DatagLANce Positioning and Other Network Management Products 121

122 DatagLANce - Problem Determination and Monitoring

Appendix A. Reports Produced by DatagLANce Protocol Matrix
The following is a list of the pre-defined reports that are available through theDatagLANce Network Analyzer product and can be reached through the ProtocolMatrix icon:
Standard Reports from Protocol Matrix
• Cumulative Network Statistics• Cumulative Event Statistics• Event Distribution (% of Frames)• Event Distribution (% of Bytes)• Event Distribution (% Utilization)• Event Distribution (All)• All Frames History (Peaks Only)• All Frames History• Captured Frames History• Custom Event 1 History: Broadcast Frame• Custom Event 2 History: Monitor Contention• Custom Event 3 History: Undefined Event• Custom Event 4 History: Undefined Event• Custom Event 5 History: Undefined Event
Note: The Custom Events are in Monitor - Custom Events.
The following list contains reports that are also included in the Protocol Matrixapplication, but only a few of these will be listed in the options, depending on thetype of analysis selected in the Traffic Analysis Options.
Extra Reports from Protocol Matrix
• Top 10 Errors• Station List (DLC Addresses)• Top 10 Protocol Pairs (Frames)• Top 10 Protocol Pairs (Bytes)• Top 10 Talkers (DLC Addresses)• Top 10 Listeners (DLC Addresses)• Top 10 Protocols (Frames)• Top 10 Protocols (Bytes)• Busiest 10 Stations (DLC Addresses)• Frame Length Distribution• Major Protocol Distribution (Frames)• Major Protocol Distribution (Bytes)• All Protocols (Frames)• All Protocols (Bytes)• Top 10 Routes (Frames)• Top 10 Routes (Bytes)• All Routes (Frames)• All Routes (Bytes)• Source Routing Length Distribution• Source Routing Type Distribution• Top 10 Soft Errors (Breakdown)• All Soft Errors (Breakdown)
Copyright IBM Corp. 1995 123

124 DatagLANce - Problem Determination and Monitoring

Appendix B. MIB Definition File
The following shows the SNMP MIB variables that the DatagLANce NetworkAnalyzer will send as traps to a network management station.
DATAGLANCE-MIB DEFINITIONS ::= BEGIN
IMPORTSenterprises FROM RFC1155-SMICounter FROM RFC1155-SMI ;
-- IBM MIB
ibm OBJECT IDENTIFIER ::= { enterprises 2 }
-- IBM Products MIB
ibmProd OBJECT IDENTIFIER ::= { ibm 6 }
-- DatagLANce Network Analyzer MIB
datagLANce OBJECT IDENTIFIER ::= { ibmProd 56 }
-- Ethernet DatagLANce Traps Group
traps OBJECT IDENTIFIER ::= { datagLANce 1 }
-- Ethernet DatagLANce Network Analyzer Traps
-- The following traps can be issued by a Ethernet DatagLANce-- Network Analyzer
ethernetTraps OBJECT IDENTIFIER ::= { traps 1 }
customEvent1Counts OBJECT-TYPESYNTAX CounterACCESS not-accessibleSTATUS mandatoryDESCRIPTION
″DatagLANce custom event 1 counts″::= { ethernetTraps 1 }
customEvent2Counts OBJECT-TYPESYNTAX CounterACCESS not-accessibleSTATUS mandatoryDESCRIPTION
″DatagLANce custom event 2 counts″::= { ethernetTraps 2 }
customEvent3Counts OBJECT-TYPESYNTAX CounterACCESS not-accessibleSTATUS mandatoryDESCRIPTION
″DatagLANce custom event 3 counts″::= { ethernetTraps 3 }
Copyright IBM Corp. 1995 125

customEvent4Counts OBJECT-TYPESYNTAX CounterACCESS not-accessibleSTATUS mandatoryDESCRIPTION
″DatagLANce custom event 4 counts″::= { ethernetTraps 4 }
customEvent5Counts OBJECT-TYPESYNTAX CounterACCESS not-accessibleSTATUS mandatoryDESCRIPTION
″DatagLANce custom event 5 counts″::= { ethernetTraps 5 }
networkInactiveTime OBJECT-TYPESYNTAX CounterACCESS not-accessibleSTATUS mandatoryDESCRIPTION
″network inactive time in seconds″::= { ethernetTraps 6 }
allFramesUtilization OBJECT-TYPESYNTAX INTEGER (0 .. 100)ACCESS not-accessibleSTATUS mandatoryDESCRIPTION
″all frames utilization (percent)″::= { ethernetTraps 7 }
allFramesCounts OBJECT-TYPESYNTAX CounterACCESS not-accessibleSTATUS mandatoryDESCRIPTION
″all frames counts″::= { ethernetTraps 8 }
crcAlignmentErrors OBJECT-TYPESYNTAX CounterACCESS not-accessibleSTATUS mandatoryDESCRIPTION
″count of CRC/Alignment errors″::= { ethernetTraps 9 }
collisions OBJECT-TYPESYNTAX CounterACCESS not-accessibleSTATUS mandatoryDESCRIPTION
″count of collisions, wherecollisions = collision fragments + jabbers″
::= { ethernetTraps 10 }
runtFrames OBJECT-TYPESYNTAX Counter
126 DatagLANce - Problem Determination and Monitoring

ACCESS not-accessibleSTATUS mandatoryDESCRIPTION
″count of runt frames″::= { ethernetTraps 11 }
oversizedFrames OBJECT-TYPESYNTAX CounterACCESS not-accessibleSTATUS mandatoryDESCRIPTION
″count of oversized frames″::= { ethernetTraps 12 }
-- Token-Ring DatagLANce Network Analyzer Traps
-- The following traps can be issued by a Token-Ring DatagLANce-- Network Analyzer
tokenRingTraps OBJECT IDENTIFIER ::= { traps 2 }
customEvent1Counts OBJECT-TYPESYNTAX CounterACCESS not-accessibleSTATUS mandatoryDESCRIPTION
″DatagLANce custom event 1 counts″::= { tokenRingTraps 1 }
customEvent2Counts OBJECT-TYPESYNTAX CounterACCESS not-accessibleSTATUS mandatoryDESCRIPTION
″DatagLANce custom event 2 counts″::= { tokenRingTraps 2 }
customEvent3Counts OBJECT-TYPESYNTAX CounterACCESS not-accessibleSTATUS mandatoryDESCRIPTION
″DatagLANce custom event 3 counts″::= { tokenRingTraps 3 }
customEvent4Counts OBJECT-TYPESYNTAX CounterACCESS not-accessibleSTATUS mandatoryDESCRIPTION
″DatagLANce custom event 4 counts″::= { tokenRingTraps 4 }
customEvent5Counts OBJECT-TYPESYNTAX CounterACCESS not-accessibleSTATUS mandatoryDESCRIPTION
″DatagLANce custom event 5 counts″
Appendix B. MIB Definit ion File 127

::= { tokenRingTraps 5 }
networkDownTime OBJECT-TYPESYNTAX CounterACCESS not-accessibleSTATUS mandatoryDESCRIPTION
″network down time in seconds″::= { tokenRingTraps 6 }
networkInactiveTime OBJECT-TYPESYNTAX CounterACCESS not-accessibleSTATUS mandatoryDESCRIPTION
″network inactive time in seconds″::= { tokenRingTraps 7 }
allFramesUtilization OBJECT-TYPESYNTAX CounterACCESS not-accessibleSTATUS mandatoryDESCRIPTION
″all frames utilization (percent)″::= { tokenRingTraps 8 }
allFramesCounts OBJECT-TYPESYNTAX CounterACCESS not-accessibleSTATUS mandatoryDESCRIPTION
″all frames counts″::= { tokenRingTraps 9 }
softErrors OBJECT-TYPESYNTAX CounterACCESS not-accessibleSTATUS mandatoryDESCRIPTION
″count of soft errors″::= { tokenRingTraps 10 }
ringPurges OBJECT-TYPESYNTAX CounterACCESS not-accessibleSTATUS mandatoryDESCRIPTION
″count of ring purges″::= { tokenRingTraps 11 }
beaconFrames OBJECT-TYPESYNTAX CounterACCESS not-accessibleSTATUS mandatoryDESCRIPTION
″count of beacon frames″::= { tokenRingTraps 12 }
oversizedFrames OBJECT-TYPE
128 DatagLANce - Problem Determination and Monitoring

SYNTAX CounterACCESS not-accessibleSTATUS mandatoryDESCRIPTION
″count of oversized frames″::= { tokenRingTraps 13 }
END
Appendix B. MIB Definit ion File 129

130 DatagLANce - Problem Determination and Monitoring

Appendix C. SAP Reference Table
The following shows a list of common SAPs that you may come across whenlooking into the frames in a DatagLANce trace.
Table 3. SAP Table
SAP Description of SAP
00 Null SAP (for XID and TEST frames)
02 LLC sub-layer management individual (IEEE)
04 SNA Path Control Individual
05 SNA Path Control group (for broadcasts)
06 DoD Internet Protocol (IEEE)
08 SNA
0C SNA
10 4033 printer server
12 4033 printer server
42 Bridge Spanning Tree Protocol
80 XNS
84 OS/2 Database Manager (Remote Data Services)
90 LMU/2 Fault Manager
AA SNAP SAP (for protocols using SNAP protocol discriminator, ie. TCPIP)
BC SAP for VINES on Token Ring
D4 LAN Station Manager Resource Management
DC 8230 LAN Station Manager Register
E0 IPX SAP (Frame Types: ETHERNET_802.2 and TOKEN_RING)
E1 IPX SAP (Frame Type: TOKEN_RING) Note: Have never seen this one
F0 NetBIOS
F2 LNM Managing Process
F4 LAN Management individual
F5 LAN Management group (for broadcasts)
F8 Remote Program Load (RPL)
FC Remote Program Load (RPL)
FE ISO Network Layer (IEEE)
FF Global (IEEE, for broadcasts)
Note:
x2 (where x =/ 0) - Network Management Function SAPs.Reserved for future use by IEEE.
x6 (where x =/ 0) - National Standards Bodies SAPs.Reserved for future use by national standards bodies
8x through 9C (where x =/ B′ . . 1 . ′ )User defined SAPs. To prevent interoperabilityproblems with standard-defined protocols.
Fx (where x =/ B′ . . 1 . ′ )Reserved by IBM for future use
Copyright IBM Corp. 1995 131

132 DatagLANce - Problem Determination and Monitoring

Appendix D. Print Report Options
The following is a complete list of the Print Report Options that you can use withthe command line interface to automate the generation of reports.
>PRINT REPORT reportcode [outputfile [/CSV]]
/CSV can be used to output comma-separated variables to the file specified.
reportcode can be one of the following:
0 Cumulative Network Statistics1 Cumulative Event Statistics2 Event Distribution (% of Frames)3 Event Distribution (% of Bytes)4 Event Distribution (% of Utilization)5 Event Distribution (All)6 All Frames History (Peaks Only)7 All Frames History8 Captured Frames History9 Custom Event 1 History10 Custom Event 2 History11 Custom Event 3 History12 Custom Event 4 History13 Custom Event 5 History
If traffic analysis is enabled, the following reportcodes print the reports below(depending on which traffic analysis was performed):
DLC Station Analysis:128 Top 10 Talkers (DLC Addresses)129 Top 10 Listeners (DLC Addresses)130 Busiest 10 Stations (DLC Addresses)131 Top 10 Errors132 Station List (DLC Addresses)
DLC Traffic Matrix Analysis:128 Top 10 DLC Station Pairs (Frames)129 Top 10 DLC Station Pairs (Bytes)
Network Station Analysis:128 Top 10 Talkers (Network Addresses)129 Top 10 Listeners (Network Addresses)130 Busiest 10 Stations (Network Addresses)131 Station List (Network Addresses)
Protocol Matrix Analysis:128 Top 10 Protocol Pairs (Frames)129 Top 10 Protocol Pairs (Bytes)
Dynamic Protocol Distribution Analysis:128 Frame Length Distribution129 Top 10 Protocols (Frames)130 Top 10 Protocols (Bytes)131 Major Protocol Distribution (Frames)132 Major Protocol Distribution (Bytes)133 All Protocols (Frames)134 All Protocols (Bytes)
Copyright IBM Corp. 1995 133
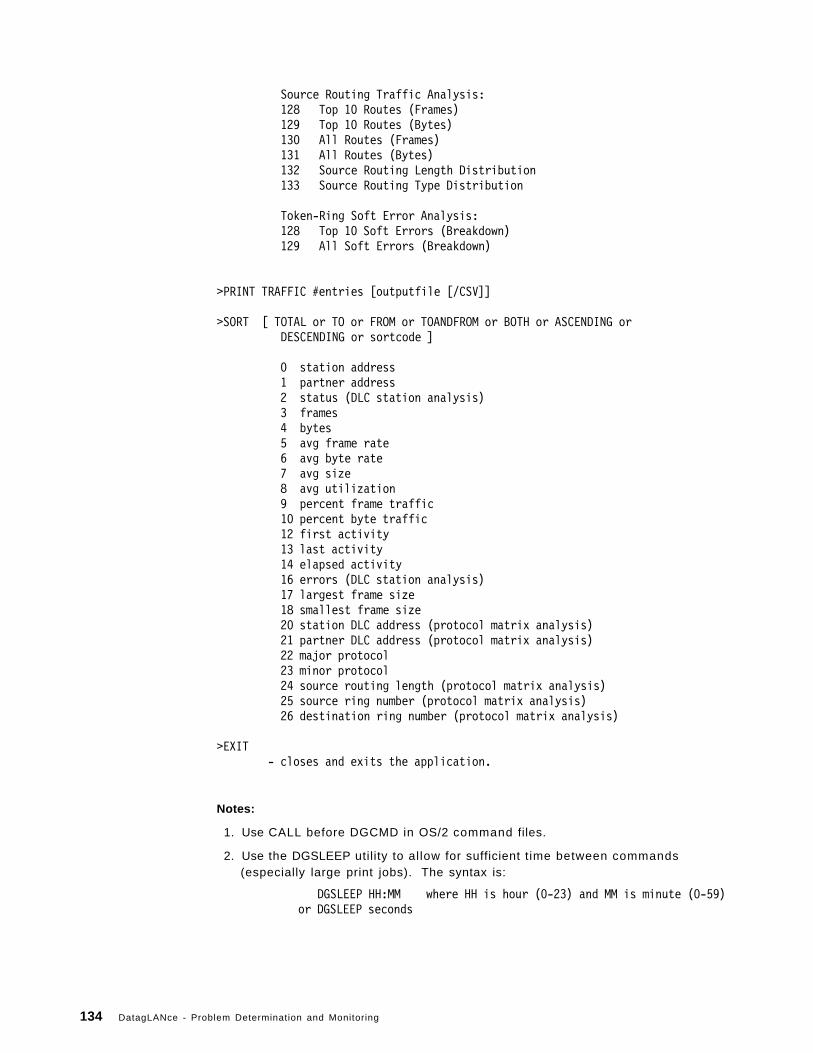
Source Routing Traffic Analysis:128 Top 10 Routes (Frames)129 Top 10 Routes (Bytes)130 All Routes (Frames)131 All Routes (Bytes)132 Source Routing Length Distribution133 Source Routing Type Distribution
Token-Ring Soft Error Analysis:128 Top 10 Soft Errors (Breakdown)129 All Soft Errors (Breakdown)
>PRINT TRAFFIC #entries [outputfile [/CSV]]
>SORT [ TOTAL or TO or FROM or TOANDFROM or BOTH or ASCENDING orDESCENDING or sortcode ]
0 station address1 partner address2 status (DLC station analysis)3 frames4 bytes5 avg frame rate6 avg byte rate7 avg size8 avg utilization9 percent frame traffic10 percent byte traffic12 first activity13 last activity14 elapsed activity16 errors (DLC station analysis)17 largest frame size18 smallest frame size20 station DLC address (protocol matrix analysis)21 partner DLC address (protocol matrix analysis)22 major protocol23 minor protocol24 source routing length (protocol matrix analysis)25 source ring number (protocol matrix analysis)26 destination ring number (protocol matrix analysis)
>EXIT- closes and exits the application.
Notes:
1. Use CALL before DGCMD in OS/2 command files.
2. Use the DGSLEEP utility to allow for sufficient time between commands(especially large print jobs). The syntax is:
DGSLEEP HH:MM where HH is hour (0-23) and MM is minute (0-59)or DGSLEEP seconds
134 DatagLANce - Problem Determination and Monitoring

Appendix E. DatagLANce .CMD File for Producing Daily AnalysisReports
The following is a sample .CMD file that can be used to automate the process ofusing DatagLANce to monitor a LAN.
In this example, DatagLANce will start up and monitor the network with apredefined configuration (MONITOR) during a period of time (stopping at 23:45).We then generate some predefined reports and place them in separate directory.When the reports are generated, the .CMD file loops back to the beginning andstarts the collection for the next day. For this example was created a token-ringDatagLANce configuration MONITOR with DLC Station Traffic Analysis enabled.
rem Change to the DatagLANce directoryD:CD \DGNA
rem Make sure the ring speed is set correctlyCALL DGCFGMOD TRMON MONITOR RINGSPEED:4
rem Load MONITOR configuration (customized by user)CALL DGCMD TRMON LAUNCH MONITOR
rem This label will cause us to loop foreverrem (when we go to it later):LOOP
rem Start monitoring the networkCALL DGCMD TRMON START
rem Go to sleep until 11:45 PM at night using DGSLEEP utilityDGSLEEP 23:45
rem When we wake up, let′ s stop the monitorCALL DGCMD TRMON STOP
rem Print desired reportsCALL DGCMD TRMON PRINT REPORT 0 NETSTAT.PRNDGSLEEP 30CALL DGCMD TRMON PRINT REPORT 7 HISTORY.PRNDGSLEEP 30CALL DGCMD TRMON PRINT REPORT 131 TOPERRS.PRNDGSLEEP 30
rem Print desired traffic statistics (top 100 talkers,rem listeners, sort by framesCALL DGCMD TRMON SORT 0DGSLEEP 30rem sort by top talkersCALL DGCMD TRMON SORT FROMDGSLEEP 30rem print top 100 talkersCALL DGCMD TRMON PRINT TRAFFIC 100 TALKERS.PRNDGSLEEP 30rem sort by top listenersCALL DGCMD TRMON SORT TO
Copyright IBM Corp. 1995 135

DGSLEEP 30rem print top 100 listenersCALL DGCMD PRINT TRAFFIC 100 LISTENRS.PRNDGSLEEP 30
rem Backup reports in this DatagLANce′ s directoryrem These commands make sure only last 10 days reportsare savedIF EXIST D:\DGNA\FTP\*.10 DEL D:\DGNA\FTP\*.10IF EXIST D:\DGNA\FTP\*.9 RENAME D:\DGNA\FTP\*.9 *.10IF EXIST D:\DGNA\FTP\*.8 RENAME D:\DGNA\FTP\*.8 *.9IF EXIST D:\DGNA\FTP\*.7 RENAME D:\DGNA\FTP\*.7 *.8IF EXIST D:\DGNA\FTP\*.6 RENAME D:\DGNA\FTP\*.6 *.7IF EXIST D:\DGNA\FTP\*.5 RENAME D:\DGNA\FTP\*.5 *.6IF EXIST D:\DGNA\FTP\*.4 RENAME D:\DGNA\FTP\*.4 *.5IF EXIST D:\DGNA\FTP\*.3 RENAME D:\DGNA\FTP\*.3 *.4IF EXIST D:\DGNA\FTP\*.2 RENAME D:\DGNA\FTP\*.2 *.3IF EXIST D:\DGNA\FTP\*.1 RENAME D:\DGNA\FTP\*.1 *.2IF EXIST D:\DGNA\FTP\*.PRN RENAME D:\DGNA\FTP\*.PRN *.1
rem Now copy the reports to the appropriate directoryCOPY *.PRN D:\DGNA\FTP-*.PRN
GOTO LOOP
136 DatagLANce - Problem Determination and Monitoring
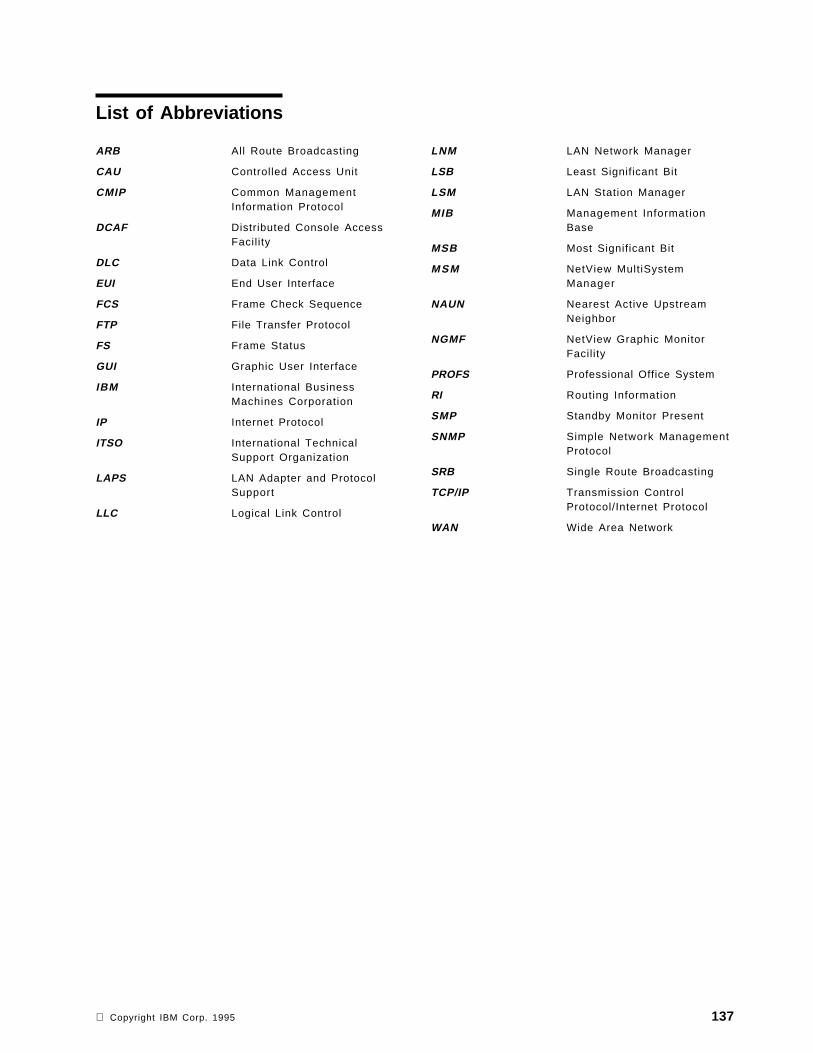
List of Abbreviations
ARB All Route Broadcasting
CAU Controlled Access Unit
CMIP Common ManagementInformation Protocol
DCAF Distributed Console AccessFacility
DLC Data Link Control
EUI End User Interface
FCS Frame Check Sequence
FTP File Transfer Protocol
FS Frame Status
GUI Graphic User Interface
IBM International BusinessMachines Corporation
IP Internet Protocol
ITSO International TechnicalSupport Organization
LAPS LAN Adapter and ProtocolSupport
LLC Logical Link Control
LNM LAN Network Manager
LSB Least Significant Bit
LSM LAN Station Manager
MIB Management InformationBase
MSB Most Significant Bit
MSM NetView MultiSystemManager
NAUN Nearest Active UpstreamNeighbor
NGMF NetView Graphic MonitorFacility
PROFS Professional Office System
RI Routing Information
SMP Standby Monitor Present
SNMP Simple Network ManagementProtocol
SRB Single Route Broadcasting
TCP/IP Transmission ControlProtocol/Internet Protocol
WAN Wide Area Network
Copyright IBM Corp. 1995 137

138 DatagLANce - Problem Determination and Monitoring

Index
Numerics3745 60755C 1802.3 80802.3 Frames 548573, MCA 8
AA/C Errors 39abbreviations 137absolute time stamp 17acknowledgement frames 58acronyms 137Adapter
address 106alternate 11DatagLANce 110ISA 5LAN 6MCA 5mode 91options 91PCMCIA 5PCMCIA Ethernet II 12Promiscuous 5, 91Second LAN 5
address format 24address level 23address pair 56address range 8alarm options 94Alarms 2alert f i l tering 105algori thm 76all frames util ization 108All-Route Broadcasting 93alternate 11analysis 2, 23analysis option 38analysis type 90Analysis, data 2analysis, traffic 7analyze frames 107Apple Talk Names 30application, new 88ARB 93ascending, sort 115ASCII 28audible alarm 95, 108automate 115automate, CMD file 135automatic monitoring function 94
automatic wrap 105average uti l ization 48
Bbackbone 50backup domain controller 67baseband 105baseline 82beaconing 72, 115Beacons 39bookmark 29bridge 77broad 45broadband 105broadcast address 91buffer space 18buffers 7bufsize 7Burst Errors 39by-pass 19byte statistics 40
Ccabling 72canonical 24, 51capture 21capture buffer size 18capture frames 107Capture, data 2Capturing Frames 21case study 47CAU 105CC_TRAP 5Cisco 60client 47CMD file, automate 135collect data 87color video 20combine event detectors 27combine fi lters 57command line interface 2, 114command, DBM 99command, wrap/unwrap 105common SAPs 131component 46Config.sys
ISA 11MCA 9statements 7ThinkPad 12
configuration 88, 115continuation character 99
Copyright IBM Corp. 1995 139

cron 118CSV 2, 83, 87custom events 37, 108
Ddaemon 106Data Capture 2data collection 87Data Link Control 76data pattern 30database 21, 87, 97DB2 for OS/2 97DB2/2 Command Line Processor 99DBM command 99DCAF 114DEC Names 30decode 2decode a frame 91default token-ring speed 20delimited fi le 97descending, sort 115destination address 26, 108destination/source address pairs 56DGCFGCPY 114DGCFGMOD 114DGCMD 114DGEN0$.SYS 7DGHRT$.SYS 7DGNA 6, 19, 99DGTR0$.SYS 7diagram 75Disabled 92discover 106disk 6disk space 75disk usage 3diskette, LANAID 9diskettes, ThinkPad utilities 13display 23, 29, 36Distribution Template 29DLC 76DLC address 23DLC Address pairs 54DLC station 41documentation, on-line 21documentation, online 114domain controller 67dos 9dragging and dropping 19Drivers
Resource Util i ty 7TCP/IP 9
dual interface 115Dual media DatagLANce 5
EEBCDIC 28EC level 5Enable traffic analysis 89encrypted 117end time 86ENMON 115Enterprise 112Environment 1equation, fi lter 62error 39error rate 2Ethernet 47Ethernet II 80Ethernet segments 49EUI 112event 36event detector 54Event Detectors 2event log 105event windows 36events 22, 29exit 115expression 100
Ffacil it ies 2fault 106fault domain 105FCS 76File Server Template 29file, MIB 125files, statistic 115files, type of 87fi l ter 26, 45filter equation 53fi lters 53format 36Format, address 24Forms 100Frame 23
acknowledgement 58analyze 107capture 107captured 7detail 28, 65Ethernet 76, 80LLC 63padding 76pattern 108poll ing 64reference 29slicing 91smallest 40soft error 73token-ring 77
140 DatagLANce - Problem Determination and Monitoring

f rame analysis 50Frame Check Sequence 76Frame Copied Errors 39frame size 33frame statistics 40Frame Status 76Frequency Errors 39FS 76FTP 114, 117
Ggeneric messages 111get started documentation 21Go 22GUI 114
Hhard-error 72hardware 8, 72hardware key 1headers 76hexadecimal 30hexdump 28high availabil i ty 105high resolution time stamp 7, 17history statistics 85hop 36hop count 96hops 81host-name, IP 116hot-pluggable 6HTX 87hubs 2
II/O address 9IBM2SS01.SYS 7Icon
Capture Frames 21DatagLANce 20DLC Station Traffic Analysis 41DLC Traffic Matrix 43Ethernet DatagLANce 44Monitor Ethertype Protocols 35Monitor Frame Sizes 33Monitor IP Protocols 36Monitor Protocol Suites 37Monitor Routing Types 32Monitor SAP Protocols 34navigating 19Network Station Traffic Analysis 40Protocol Matrix 42, 85Protocol Traffic Analysis 38public applications 66Soft Error Traffic Analysis 39Source-Routed Traffic Analysis 38
Icon (continued)Templates 29token-ring DatagLANce 21tutorial 21
ICRMU01.SYS 7if statement 57import 87inconsistent performance 47installation 5installation panels 14interact ive way 21interface, command line 2Internal Errors 39interrupt level 6interval box 95IP address 116IPL 6, 19IPX header 81IPX Names 30ISA 8, 9
Jjulian day 118
Kkey 22key, hardware 1keyless 6
LLAN configuration 105LAN Doctor Services 46LAN server logon 66LAN Station Manager 105LAN util ization 85LANAID 9LAPS 110
ISA 10MCA 8
largest frame 40launch 115layer 46, 107learn 30, 38learning names 83level, interrupt 6Line Errors 39, 72line speed 114LLC data 28LLC frames 63LNM for OS/2 1, 2, 105lobe 6log 22, 95log file 109logon sequence 78logon, LAN server 66
Index 141

logs event 106Lost Frame Errors 39LSB form 24LSM 105
MMAC 24, 107map, ring 73MCA 8media 6media-specific 115memory 7, 9, 18Menus 100messages, generic 111MIB 108, 111MIB definition file 125microcode 5migrate 6minor protocol 90modelling exercise 88modem 95Monitor 29monitor, remote 114mono video 20most traffic 40MPTS/LAPS 6MSM 106multiple segments 77
Nnarrow 45NAUN 30, 73navigating 19NetBIOS 66, 78NetBIOS Names 30NetFinity Manager for OS/2 3NetView for AIX 1, 2, 106, 111NetView for Windows 2NetView/390 106NetWare Server Inventory 46NetWare servers 47Network
Access 5addresses 2architecture 76Drivers 7errors 49, 61Glance 2Matr ix 2names 30signals 12Statistics 22, 88traffic 1
NGMF 106not ready 12notify if table filled 90
Novell NetWare 81number of bytes 2
Oon-line documentation 21online DatagLANce user′s guide 111only for event 89Operating System 1options, software 15OS/2 Warp Connect 1
PP75 1packages 15page 3pager 95Panels 100panels, installation 14parallel port 6parameters 115partner 40password 99, 117path 81Patterns, Frame Data 54PCMCIA 7PCMCIA Ethernet II 12peak hour 90performance analysis 46performance degradation 47performance service 106Performance, inconsistent 47physical 3physical layer problems 72ping 2playback 2, 61plug and play 12polling frames 64polls 106port,parallel 6power off 9preferences 24, 51pr imary 6, 11print 87print report 115Print Report Options list 133print traffic 115problem 19problem determination 45Procedures 100process priority 90Profiles 100promiscuous 5Protocol
Apple Talk 37DEC 37Ethernet 35header 76
142 DatagLANce - Problem Determination and Monitoring

Protocol (continued)IBM 37major 38major protocol suites 101minor 90network 76Protocol Matrix 42, 85, 123Suite 1
protocol.ini 8, 10protocol.ini, ThinkPad 12
QQueries 100query manager 99quick filter 26
RRAM 9RAM address Range 9RAM addresses 6Rate
data 2error 2frame 2
read file data request 59Receiver Congestion 39receiving 40reference diskette 8relat ive t ime 58rem 8remote access 114remote Ethernet 48report 102reports 87reports, pre-defined 123resource map uti l i ty driver 7response header, SNA 80RI 78ring error monitor 72ring map 107ring purge 61Ring Purges 39ring status subvector 72ring uti l ization 108ROM Address Range 9routers 2Routing Information field 78RR 77RS/6000 107
Ssample interval 90SAP Reference Table 131screen 22scripts 121
search 53search option 26secondary 6security 117seed 2segment 6send alert 108Sequence of drivers 7service level 75, 94service point 106session 58setting alarms 94setup 9SHAREDBASE 11signal. 11single-route broadcast 93size 6slicing a frame 91smallest frame 40SMB 78SMP 62SNA headers 28SNA session 63, 80Sniffer 5SNMP 42, 95, 105, 125snmp alerts 107SNMP traps 5socket 12socket services 7soft error frame 73soft errors 61software options 15sort 100, 115sorts 21Source Routing Hop Distribution Screen 36Source Routing Indicators 54, 93source-routed traffic 36speed, token-ring 20spreadsheet 21, 87SRB 93Stacker for OS/2 5start 115start t ime 86stations 27statistical 21Statistical History 2statistics 36, 85, 107stop 115subnet mask 116subvector, ring status 72symbolic names 24, 30, 52, 84syntax 115system management 105
Ttable entries pair of stations 89Tables and Views 100
Index 143

TAP 5TCP/IP 9, 23, 42, 95TCP/IP Names 30Telnet 114, 117ThinkPad 6, 12thresholds 2thresholds, alarm 95time stamp 7, 29time stamp option 17time-crit ical 90time, relative 58Token Errors 39token-ring 1Tool 1top listeners 40top talkers 40topology 45topology map 106Traffic 69, 88traffic analysis 7, 86traffic analysis function 38traffic distribution 90traffic rates 107Traffic Statistics 2, 38traffifo 7transfer t ime 48transmission header, SNA 80transmitt ing 40Trap 95, 112traps 106TRMON 115troubleshooting 105tutorial 21Type 8573, MCA 8
Uuniversally administered DLC 91User Profile Management 99user ′s guide, DatagLANce online 111userid 99uti l i t ies 114utilities, ThinkPad 13uti l ization 1util ization history 48util ization, all frames 108
Vvariables 99video support 20Vitalink Bridge 47, 59VPCMCIA.SYS 7
WWAN 114windows 22
wrap/unwrap command 105
144 DatagLANce - Problem Determination and Monitoring

ITSO Technical Bulletin Evaluation RED000
International Technical Support OrganizationLAN Problem Determination and MonitoringUsing DatagLANceDecember 1995
Publication No. SG24-4546-00
Your feedback is very important to help us maintain the quality of ITSO Bulletins. Please fill out thisquestionnaire and return it using one of the following methods:
• Mail it to the address on the back (postage paid in U.S. only)• Give it to an IBM marketing representative for mailing• Fax it to: Your International Access Code + 1 914 432 8246• Send a note to [email protected]
Please rate on a scale of 1 to 5 the subjects below.(1 = very good, 2 = good, 3 = average, 4 = poor, 5 = very poor)
Overall Satisfaction ____
Organization of the bookAccuracy of the informationRelevance of the informationCompleteness of the informationValue of illustrations
____________________
Grammar/punctuation/spell ingEase of reading and understandingEase of finding informationLevel of technical detailPrint quality
____________________
Please answer the following questions:
a) If you are an employee of IBM or its subsidiaries:
Do you provide billable services for 20% or more of your time? Yes____ No____
Are you in a Services Organization? Yes____ No____
b) Are you working in the USA? Yes____ No____
c) Was the Bulletin published in time for your needs? Yes____ No____
d) Did this Bulletin meet your needs? Yes____ No____
If no, please explain:
What other topics would you like to see in this Bulletin?
What other Technical Bulletins would you like to see published?
Comments/Suggestions: ( THANK YOU FOR YOUR FEEDBACK! )
Name Address
Company or Organizat ion
Phone No.
Cut or FoldAlong Line
Cut or FoldAlong Line
ITSO Technical Bulletin Evaluation RED000SG24-4546-00 IBML
Fold and Tape Please do not staple Fold and Tape
NO POSTAGENECESSARYIF MAILED IN THEUNITED STATES
BUSINESS REPLY MAILFIRST-CLASS MAIL PERMIT NO. 40 ARMONK, NEW YORK
POSTAGE WILL BE PAID BY ADDRESSEE
IBM International Technical Support OrganizationDepartment HZ8, Building 678P.O. BOX 12195RESEARCH TRIANGLE PARK NCUSA 27709-2195
Fold and Tape Please do not staple Fold and Tape
SG24-4546-00


IBML
Printed in U.S.A.
SG24-4546-00