Embed Size (px)
Citation preview
3rd
International Symposium on Electrical Engineering and Energy Converters September 24-25, 2009, Suceava
219
Abstract—In this paper some results regarding the
experimentation, the modelling and simulation of the motor
vehicle suspension of Logan type are presented. The
experimental testing of the performances of this damper is
made with Spider8 device. Then, a mathematical model is
adopted to estimate the behaviour and the performances of the
Logan damper, experimental tested in MATLAB/Simulink.
The model coefficients are established from the experimental
data of the Logan damper. The simulation results are
compared with the experimental data. This comparison
validates the model and the Logan damper parameters
measured in experimental testing phase.
Index Terms—Logan damper, modelling, parameters
estimation, simulation, testing.
I. INTRODUCTION
With a view to establish the suspension and damper
dynamic response, the suspension of Logan motor vehicle
was equipped with the dumper gifted with tensmetric marks
and was made the experimental base structure of the Logan
damper. The estimation of the mathematical model
parameters is realized based on the damper experimental
data. The results of the simulation in MATLAB/SIMULINK
(based on the obtained model) are compared with the
experimental data. This comparison validates the model and
the parameters measured in the phase of Logan damper
experimentation. For the simulation of the Logan damper
behaviour must be developed a model which reproduces him
as much as minute. An experimental testing mechanism is
assembled for determining the functional properties of the
Logan damper and also to obtain the dynamical data
necessary for the estimation of the model parameters. Logan
damper is fixed into an automatized Testing Mechanism,
Spider8.
II. LOGAN DAMPER EXPERIMENTATION.
ESTABLISH OF STATIC RESPONSE
II.1. Spider8 - System for numerical measuring of
mechanical values
Spider8 is an electronic system for numerical measuring
of the analogical data, specialized for numerical acquisition
of the mechanical values such as: strains, mechanical
voltages, pressures, accelerations, velocities, movements,
temperatures. The device is scheduled with the possibility to
measure the voltage analogical signals.
Spider8 is connected by USB or by a parallel port RS232
at the computer. The acquisition system contains the
specialized modules for measuring some mechanical values.
Each measure channel has its own A/D
(analogical/digital) converter, which can be setted at
sampling frequency of 0,1 … 9600 samples/second. The
converters work in parallel, being synchronised by the
measuring system, having the possibility of simultaneous
acquisition on the 8 channels.
II.2. Damper with tensmetric marks
To establish the strain characteristic, the variant of
directly determination of the strain developed in the damper
cane is chosen. An assembly with four tensmetric marks of
LY5mm/120 Ohm type, applied on the driven cane at about
5mm of the upper shoulder was realized.
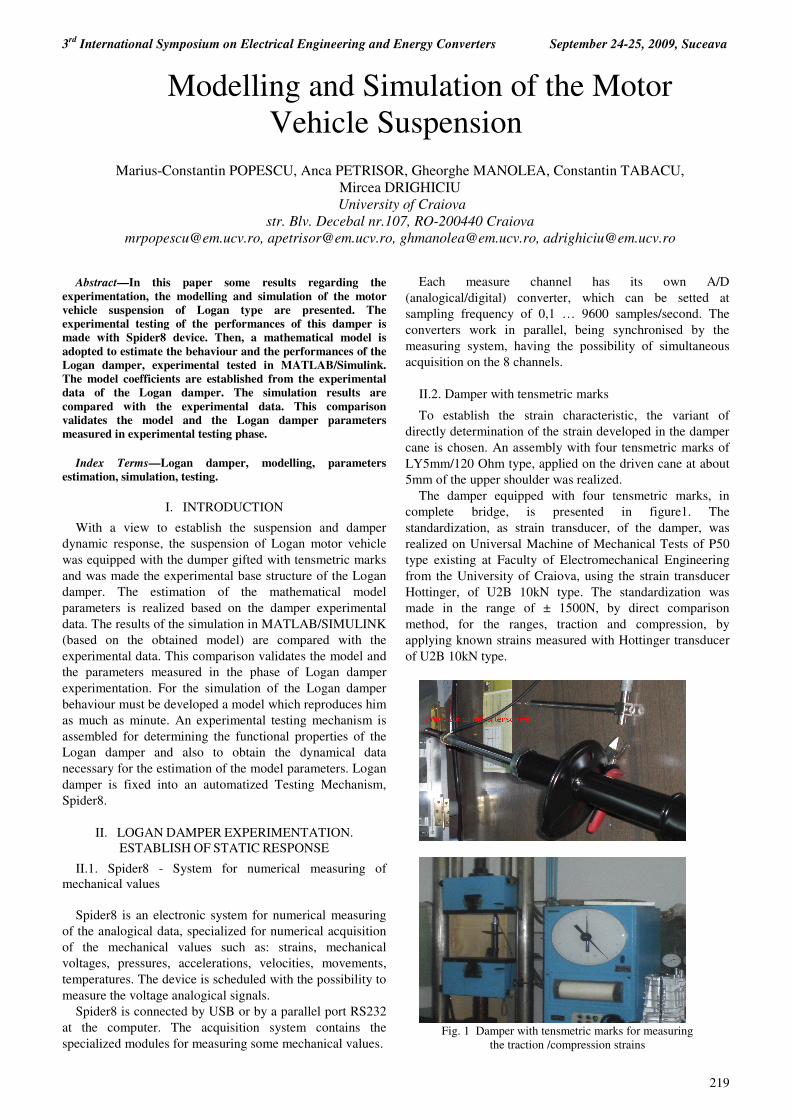
The damper equipped with four tensmetric marks, in
complete bridge, is presented in figure1. The
standardization, as strain transducer, of the damper, was
realized on Universal Machine of Mechanical Tests of P50
type existing at Faculty of Electromechanical Engineering
from the University of Craiova, using the strain transducer
Hottinger, of U2B 10kN type. The standardization was
made in the range of ± 1500N, by direct comparison
method, for the ranges, traction and compression, by
applying known strains measured with Hottinger transducer
of U2B 10kN type.
Fig. 1 Damper with tensmetric marks for measuring
the traction /compression strains
Modelling and Simulation of the Motor
Vehicle Suspension
Marius-Constantin POPESCU, Anca PETRISOR, Gheorghe MANOLEA, Constantin TABACU,
Mircea DRIGHICIU
University of Craiova
str. Blv. Decebal nr.107, RO-200440 Craiova
[email protected], [email protected], [email protected], [email protected]

220
III. ESTIMATION OF THE DYNAMIC RESPONSE OF
LOGAN MOTOR VEHICLE SUSPENSION
III.1. Tests preparation and processing
The measure equipment and the used transducers are:
Spider 8 acquisition system, NEXUS 2692-A-0I4 signal
conditional, Bruel & Kjaer accelerometer of 4391 type (3
pieces), W50 inductive transducer of linear drive, damper
with tensmetric marks and IBM ThinkPad R51 notebook.
The tests were made at SC REDAC SRL Craiova, on tests
stall for ITP of MB6000 Beissbarth – Germany type,
having: oscillating platform, display panel, reels for brake
space verification.
The position of the measuring transducers was chosen
taking into account the optimal measuring of the following
characteristic parameters for the motor vehicle suspension:
-developed strain in the damper cane;
-damper drive (W50 transducer was used, parallel
positioned with the cane damper, inside the suspension arc)
- acceleration on the vertical direction of front bridge
(AccV accelerometer positioned on the damper frame, on
the vertical direction, was used)
- horizontal - longitudinal acceleration of front suspension
bridge (AccOL accelerometer positioned on the damper
frame, on the horizontal-longitudinal direction, was used)
- acceleration on the vertical direction of the oscillating
platform.
In figure 3 is represented the positioning of the measuring
transducers on front suspension.
In figure 4 is represented a detail regarding front
suspension of Logan motor vehicle and the positioning of
the measuring transducers.
Fig. 3 The positioning of measuring transducers – detail
Fig. 4 Detail regarding the suspension, the positioning of the
transducers and of front wheel on the oscillating platform
The measurements were made in conditions of oscillating
movement generated by the left oscillating platform. The
estimation of the dynamic response was made on left wheel
equipped with measuring transducers.
The sampling rate of the Spider8 data acquisition system
was of 2400 samples/second.
The following parameters were recorded: the damper
drive (Crs (mm)), the strain inside the damper (F(N)),
acceleration on the vertical direction, at damper level
(AccV(m/s2)), acceleration on - horizontal – longitudinal
direction, at damper level (AccOL(m/s2)), acceleration on
the vertical direction, at oscillating platform level
(AccVP(m/s2)).
After each test, the acquisitioned data were viewed and
stocked in data files of ASCII type, for future processing.
III.2. Experimental data processing
A „PrelVib.tst” program to establish the damper and
Logan motor vehicle suspension frequency characteristics
was realized using TestPoint programming environment.
(Fig.5).

3rd
International Symposium on Electrical Engineering and Energy Converters September 24-25, 2009, Suceava
221
Fig. 5 Main panel of „PrelVib.tst” program
III.3. Time domain analysis
Three pulses of oscillator movement generated by the
oscillating platform were recorded.
In Fig. 7 are presented the recorded characteristics and in
Fig. 8 is represented the first pulse of the recorded
characteristics.
Fig. 6 Original recording for excitement front left wheel
Fig. 7 Zoom recording first impulse
There been determined the efficient values (RMS) of the
measured parameters, for two interest areas: constant
frequency and acceleration area of oscillating platform and
decreasing area for frequency and acceleration of oscillating
platform, of maximum amplification of the oscillating
response of the suspension system.
Fig. 8 Original recording AccV/AccVP
Fig. 9 Original recording F/Crs (first impulse)

222
Fig. 10 Original recording Crs/AccV
Fig. 11 Original recording AccOL /AccVP–zoom first impulse
In Fig. 8-11 are presented the pairs of charactersitics
which manage to establish the response functions in
frequency field. The characteristics presents a zoom at first
oscillation pulse.
III.4. Frequency domain analysis
Frequency analysis of the established parameters was
done. For a recording effectuated with the sampling
frequency of 2400 Hz/channel and a period of 64.37 s, a
resolution in frequency of 9,1mHz corresponds. In Fig.13
are represented the spectral characteristics of the measured
parameters. From these characteristics the interest areas can
be observed. The two cursors are positioned in respective
areas.
Calculus of the response functions in frequency
In Fig. 14a is represented the response function in
frequency of the suspension. The cursors are positioned in
the two marked areas.
By comparing the data and the graphical representations
of FFT (Fig.12) and ISP (Fig.13a), can be observed a very
well correlation of the analyses made in time and frequency
domain.
In Fig. 14 and 15 are presented the response function in
frequency of the damper. The cursors are positioned in the
two marked areas previous mentioned. Similar with the
response analysis in frequency of the suspension, by
comparing the data and the graphical representations of FFT
(Fig.12) and ISP (Fig.13b), can be observed a very well
correlation of the analyses made in time and frequency
domain. .
Fig. 12 Spectral characteristics of measured parameters

3rd
International Symposium on Electrical Engineering and Energy Converters September 24-25, 2009, Suceava
223
a)
b) Fig. 13 Frequency response function of the suspension
a)AccV(m/s2) /AccVP(m/s2); b) F(N)/Crs (mm).
IV. MATHEMATICAL MODELLING OF THE
SUSPENSION
IV.1. The mathematical model
The damper model must be continuous in all its
components. The structural schema is presented in Fig.14.
The force applied to this dynamic system depends on time
variable t and is noted with F(t). In the absence of the
mobile mass and, therefore, of the inertia forces, this force F
is equilibrated by three components described by functions
in which the independent variable is the displacement x(t) or
the speed v(t)=dx/dt. To simplifying the writing, in the
following is omissible the time variable, but its presence
must be connotation. The two components which equilibrate
the force F are: the linear elastic component fe(x)
determined by the spring characterised by the rigidity
coefficient k0; the linear viscous component fv(x)
characterised by the viscous coefficient c0. The hysteresis
component, hz(x)= α z, is characterised by the hysteresis
coefficient α and by the nonlinear function of hysteresis
z(x).
Fig. 14 Vehicles suspension: structural schema
Fig. 15 Simulink model for vehicles suspension
When the mobile mass is zero, the inertia forces
disappear and the equilibrium equation of the forces,
expressed throw the three components, F=fe+fv+hz is
explicated by:
0 0F c x k x z= + + α& (1)
In relation (2) the histeresis function z(x) is obtained as a
solution of the following equation:
xazxbzzxyzn1n
&&&& +−−=−
(2)
IV.2. Simulink model
Transcription in Simulink of the linear part L from the
figure 15 requires only few calculus blocks: a derivative
block with amplifier c0 which has the input x and the output
c0dx/dt; an amplifier block k0 which has the input x and the
output k0x; a sum block which totals F, k0x, c0dx/dt and az.
Fig. 16 Structural schema of the vehicles suspension
Simulink model of the nonlinear equation offers the
damper specific loop and is described by the differential
equation (2) from which results that the output z(x), for n=2
and y=z, is calculated by the relation: 22
z [ x | z | z bx z ax]dt= − + −∫ & & & (3)
The input signal of the nonlinear block N is the
displacement x (which represents the output of the entire
model) and is received from the output of the linear block
L. The speed x& from the equation (3) is obtained by
derivation the input x of the nonlinear block N, that is
v(t)=dx/dt.= x& .
The relation (3) is the basis of the SIMULINK model of
the nonlinear component N. The connections between
Simulink blocks of the entire system, realised accordance
with (1) and (3) are presented in Fig. 17. Two signal
generators are used for simulation the time variation of the
model input force F(t).

224
Fig. 17 Suspension model in Simulink
Fig. 18 Model simulation results
V. CONCLUSION
Suspension simulation results (Fig.18) were compared
with the responses obtained in damping experimental testing
phase (Fig.8-11). A good concordance between
experimental data and those given by simulation schema
from Fig 17 is resulted. This manage to the conclusion that
the model (on which is based the Simulink implementation
from Fig. 17) can be accepted for computer simulation,
generally of the motor vehicle suspension and particularly of
motor vehicle of Logan type.
REFERENCES
[1] M. Gavrilă, M.C. Popescu. Maşini şi instalaţii hidropneumatice.
Curs, Tipografia Universităţii din Craiova,1994.
[2] M.C. Popescu, O. Olaru. Conducerea optimala a proceselor-Proiectare
asistata de calculator in Matlab si Simulink. Editura Academiei
Tehnice Militare, Bucuresti, 2009.
[3] M.C. Popescu. Modelarea şi simularea proceselor. Editura
Universitaria Craiova, 2008.
[4] M.C. Popescu. Utilisation des ordinateurs. Editura Universitaria,
Craiova, 2004.
[5] M.C. Popescu, “Modelage mathématique d'une servovalve
électrohydraulique“, International Symposium on Systems Theory,
SINTES 8, 6-7 iunie, pp. 221-228, Craiova, 1996.